material handling equipment manufacturing. hal vandiver january 2015 4 introduction to material...
TRANSCRIPT
Material Handling IndustryEconomic BriefJanuary 2015
Material HandlingEquipment Manufacturing
Segment Brief
F. Hal Vandiver

F. Hal VandiverJanuary 2015
2
Material Handling Industry provides this Economic Brief to its members, industry participants and interested members of thepublic (any of whom is herein referred to as a “User”) with the sole intent of offering information of interest to parties engagedin the manufacture of material handling equipment. This Economic Brief is advisory only and should be regarded only as aguide that the user may or may not choose to adopt, modify, or reject. This Economic Brief should not be used as a basis foror relied on to make any financial or investment decisions. The Economic Brief does not constitute a comprehensive orcomplete analysis and should not be relied upon as such.
User must retain all copyright, trademark, and other proprietary notices contained in the Economic Brief or copies of theEconomic Brief. In addition, User may not copy, reproduce, transfer, enter in a database, publish, publicly display, license,sell or offer for sale, create derivative works, make available or otherwise distribute the Economic Brief or use it in any wayfor any public or commercial purpose other than User’s own personal or internal purposes. User shall use his or her bestefforts to stop any such copying or distribution immediately after such use becomes known.
Any use of the Economic Brief, in whole or in part, on any Web site or networked computer environment (including anypersonal network or e-mail distribution) is strictly prohibited. Any unauthorized use of this Economic Brief may violatecopyright, trademark, and other laws.
The Economic Brief may contain information provided by third-party parties. Material Handling Industry is not responsible orliable for the truth, accuracy, applicability or reliability of any such information provided by third parties.
THIS ECONOMIC BRIEF AND THE INFORMATION THEREIN IS PROVIDED “AS IS.” MATERIAL HANDLING INDUSTRYMAKES NO REPRESENTATIONS OR WARRANTIES, EXPRESSED OR IMPLIED, AND SPECIFICALLY DISCLAIMS ALLIMPLIED WARRANTIES OF MERCHANTABILITY OR FITNESS FOR A PARTICULAR PURPOSE. MATERIAL HANDLINGINDUSTRY MAKES NO WARRANTIES REGARDING THE COMPLETENESS, ACCURACY, RELIABILITY, APPLICABILITYOR AVAILABILITY OF INFORMATION. IN NO EVENT SHALL MATERIAL HANDLING INDUSTRY, ITS OFFICERS,AGENTS, EMPLOYEES, AND MEMBERS BE LIABLE FOR ANY DAMAGES, INCLUDING WITHOUT LIMITATION,DIRECT, INDIRECT, SPECIAL, EXEMPLARY OR CONSEQUENTIAL DAMAGES, INCLUDING LOST PROFITS, ARISINGUNDER THE USE OF OR RELIANCE ON THE ECONOMIC BRIEF OR THE INFORMATION PRESENTED THEREINBASED IN CONTRACT, NEGLIGENCE, STRICT LIABILITY OR OTHERWISE, WHETHER OR NOT THEY OR IT HAD ANYKNOWLEDGE, ACTUAL OR CONSTRUCTIVE, THAT SUCH DAMAGES MIGHT BE INCURRED.
The User agrees to defend, protect, indemnify, and hold Material Handling Industry and its officers, agents, employees, andmembers harmless from, and against, all claims, losses, expenses, damages, and liabilities, direct, incidental, orconsequential, arising from acceptance or use or alleged use of this Economic Brief and the information contained therein,including loss of profits and any attorneys' fees which may arise out of the acceptance or use or alleged use of this standard.The intent of this provision and of the User is to absolve and Material Handling Industry and its officers, agents, employees,and members from any and all loss or liability relating in any way to this Economic Brief and the information containedtherein, including those losses and liability resulting from the User's own negligence.
Disclaimer
F. Hal VandiverJanuary 2015
3
4 Introduction
6 Market Overview
9 Economic Cycles Industrial Sectors
10 MHEM and Economic Cycles
12 Updates and Forecast
Contents
Material HandlingEquipment Manufacturing (MHEM)
F. Hal VandiverJanuary 2015
4
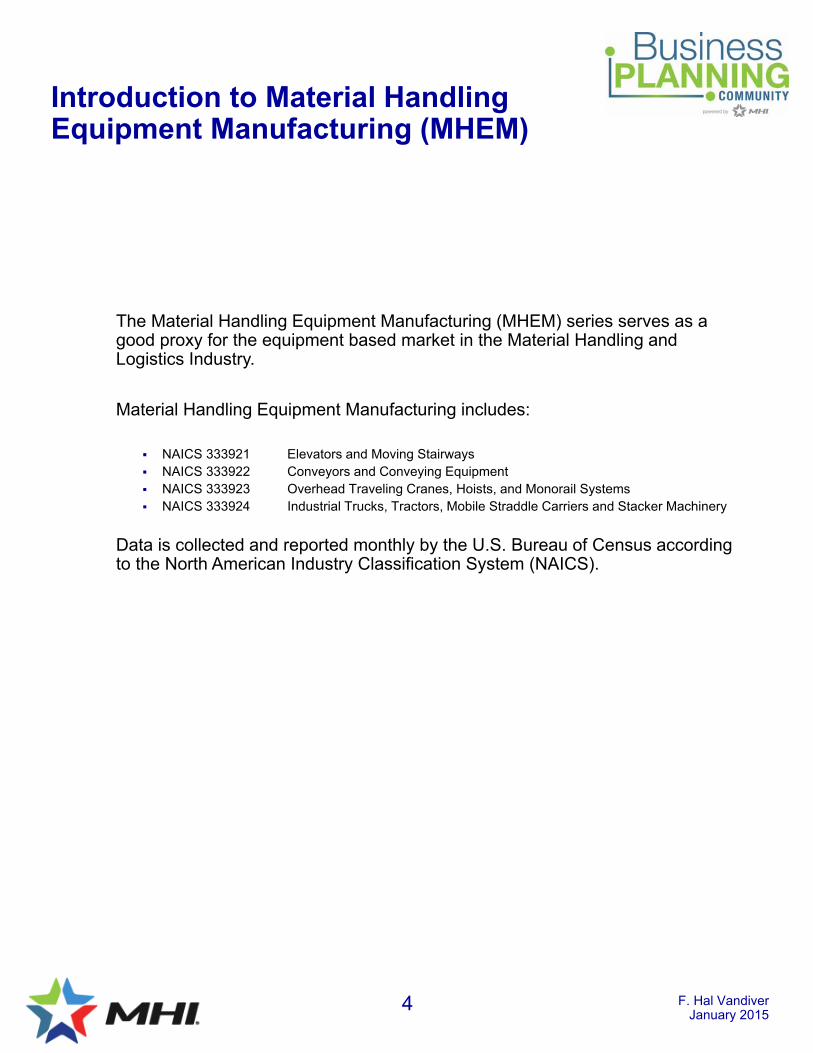
Introduction to Material Handling Equipment Manufacturing (MHEM)
The Material Handling Equipment Manufacturing (MHEM) series serves as a good proxy for the equipment based market in the Material Handling and Logistics Industry.
Material Handling Equipment Manufacturing includes:
NAICS 333921 Elevators and Moving Stairways NAICS 333922 Conveyors and Conveying Equipment NAICS 333923 Overhead Traveling Cranes, Hoists, and Monorail Systems NAICS 333924 Industrial Trucks, Tractors, Mobile Straddle Carriers and Stacker Machinery
Data is collected and reported monthly by the U.S. Bureau of Census according to the North American Industry Classification System (NAICS).
F. Hal VandiverJanuary 2015
5
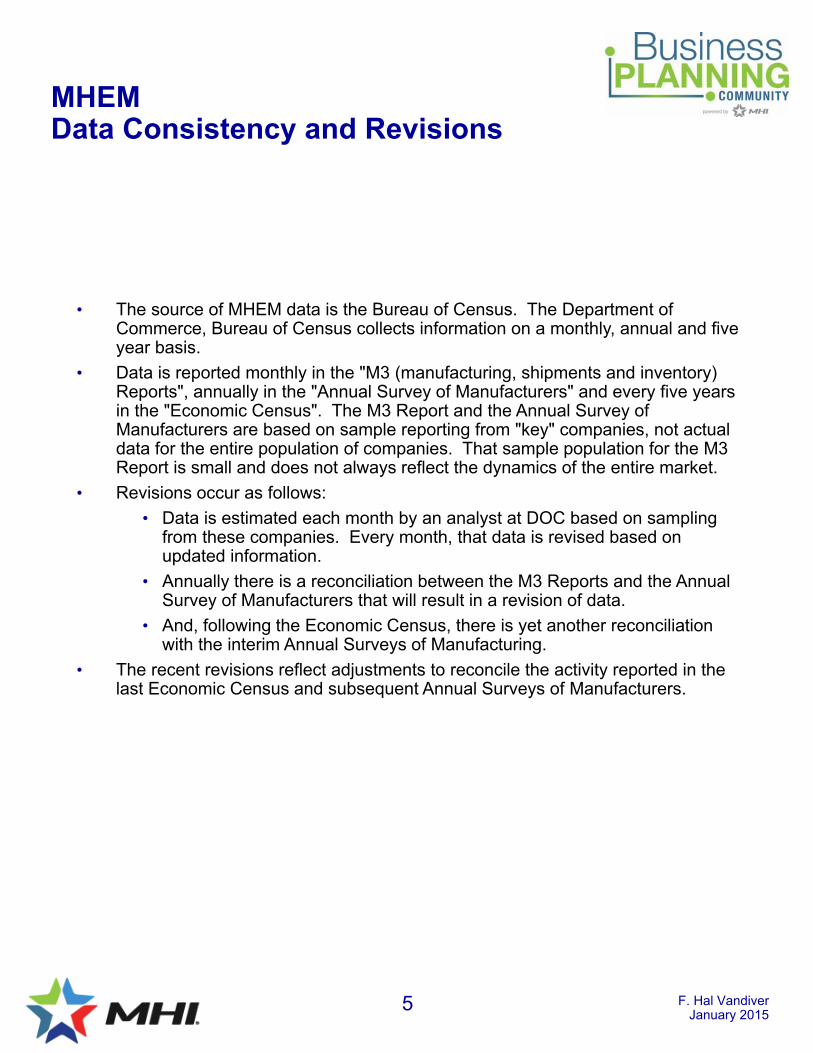
MHEMData Consistency and Revisions
• The source of MHEM data is the Bureau of Census. The Department of Commerce, Bureau of Census collects information on a monthly, annual and five year basis.
• Data is reported monthly in the "M3 (manufacturing, shipments and inventory) Reports", annually in the "Annual Survey of Manufacturers" and every five years in the "Economic Census". The M3 Report and the Annual Survey of Manufacturers are based on sample reporting from "key" companies, not actual data for the entire population of companies. That sample population for the M3 Report is small and does not always reflect the dynamics of the entire market.
• Revisions occur as follows:
• Data is estimated each month by an analyst at DOC based on sampling from these companies. Every month, that data is revised based on updated information.
• Annually there is a reconciliation between the M3 Reports and the Annual Survey of Manufacturers that will result in a revision of data.
• And, following the Economic Census, there is yet another reconciliation with the interim Annual Surveys of Manufacturing.
• The recent revisions reflect adjustments to reconcile the activity reported in the last Economic Census and subsequent Annual Surveys of Manufacturers.
F. Hal VandiverJanuary 2015
6
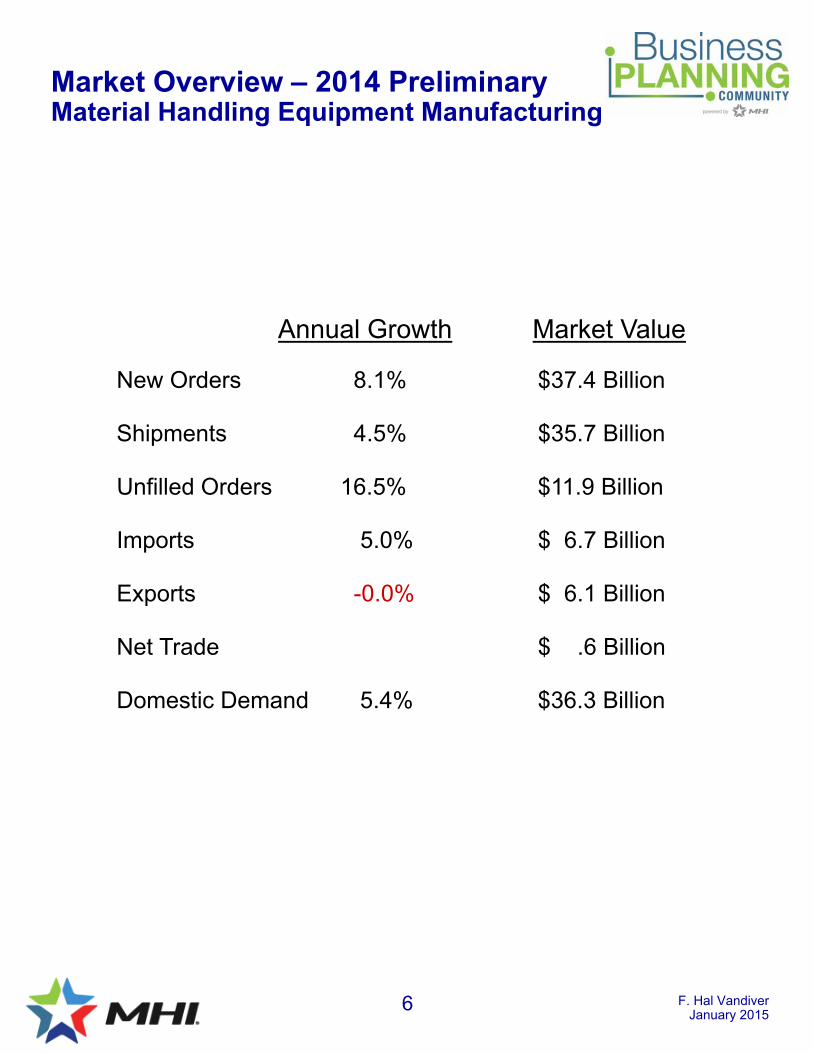
Market Overview – 2014 PreliminaryMaterial Handling Equipment Manufacturing
Annual Growth Market Value
New Orders 8.1% $37.4 Billion
Shipments 4.5% $35.7 Billion
Unfilled Orders 16.5% $11.9 Billion
Imports 5.0% $ 6.7 Billion
Exports -0.0% $ 6.1 Billion
Net Trade $ .6 Billion
Domestic Demand 5.4% $36.3 Billion
F. Hal VandiverJanuary 2015
7
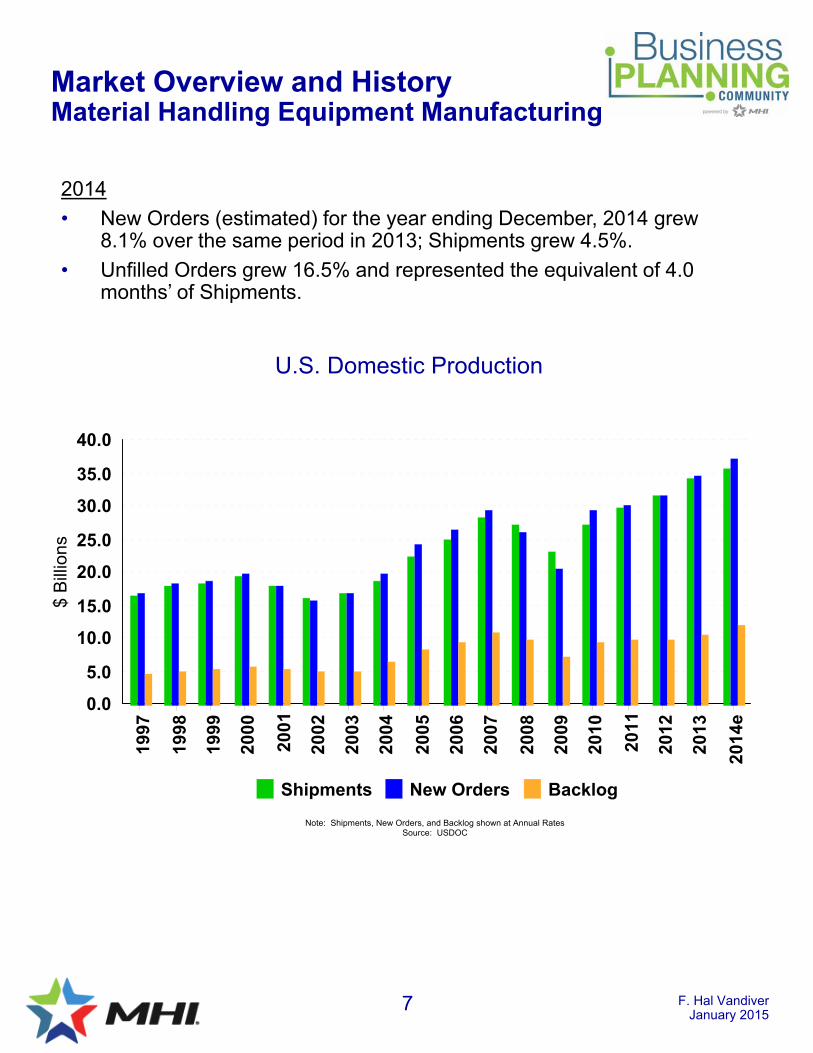
Market Overview and HistoryMaterial Handling Equipment Manufacturing
2014
• New Orders (estimated) for the year ending December, 2014 grew 8.1% over the same period in 2013; Shipments grew 4.5%.
• Unfilled Orders grew 16.5% and represented the equivalent of 4.0 months’ of Shipments.
U.S. Domestic Production
1997
1998
1999
2000
2001
2002
2003
2004
2005
2006
2007
2008
2009
2010
2011
2012
2013
2014
e
0.0
5.0
10.0
15.0
20.0
25.0
30.0
35.0
40.0
$ B
illio
ns
Shipments New Orders Backlog
Note: Shipments, New Orders, and Backlog shown at Annual RatesSource: USDOC
F. Hal VandiverJanuary 2015
8
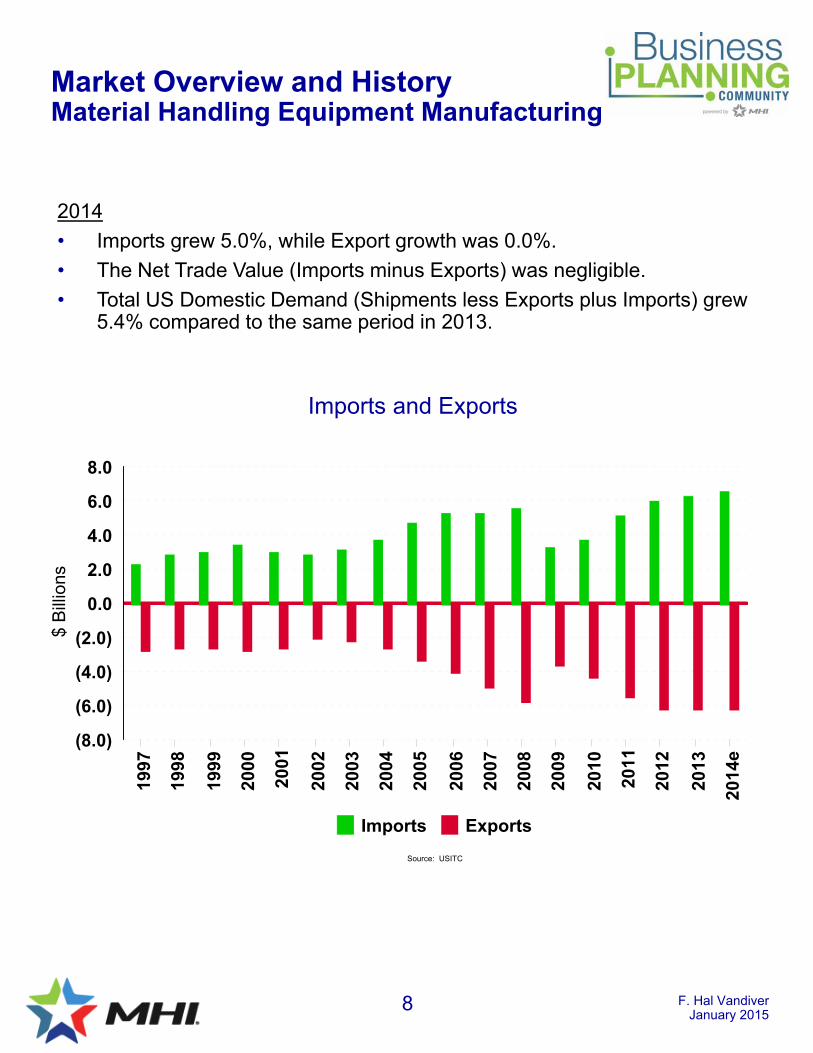
2014
• Imports grew 5.0%, while Export growth was 0.0%.
• The Net Trade Value (Imports minus Exports) was negligible.
• Total US Domestic Demand (Shipments less Exports plus Imports) grew 5.4% compared to the same period in 2013.
Imports and Exports
1997
1998
1999
2000
2001
2002
2003
2004
2005
2006
2007
2008
2009
2010
2011
2012
2013
2014
e(8.0)
(6.0)
(4.0)
(2.0)
0.0
2.0
4.0
6.0
8.0
$ B
illio
ns
Imports Exports
Source: USITC
Market Overview and HistoryMaterial Handling Equipment Manufacturing
F. Hal VandiverJanuary 2015
9
Economic CyclesIndustrial Sectors
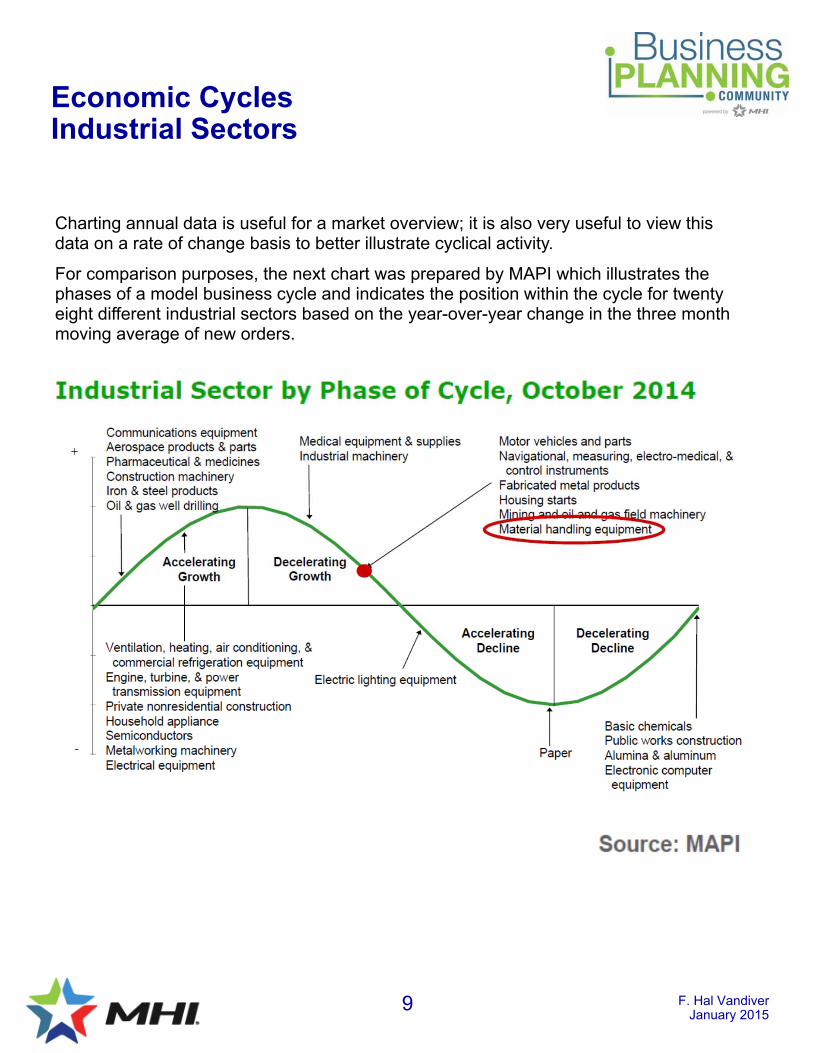
Charting annual data is useful for a market overview; it is also very useful to view this data on a rate of change basis to better illustrate cyclical activity.
For comparison purposes, the next chart was prepared by MAPI which illustrates the phases of a model business cycle and indicates the position within the cycle for twenty eight different industrial sectors based on the year-over-year change in the three month moving average of new orders.
F. Hal VandiverJanuary 2015
10
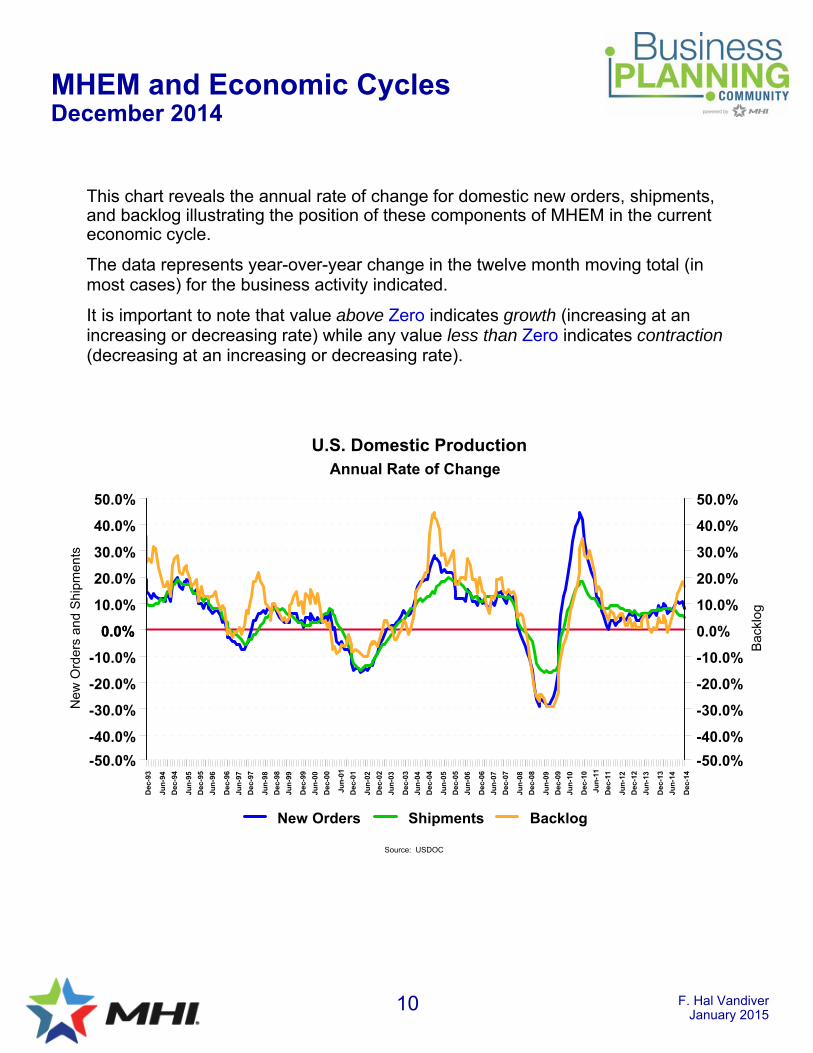
This chart reveals the annual rate of change for domestic new orders, shipments, and backlog illustrating the position of these components of MHEM in the current economic cycle.
The data represents year-over-year change in the twelve month moving total (in most cases) for the business activity indicated.
It is important to note that value above Zero indicates growth (increasing at an increasing or decreasing rate) while any value less than Zero indicates contraction(decreasing at an increasing or decreasing rate).
U.S. Domestic Production
MHEM and Economic CyclesDecember 2014
Dec
-93
Jun
-94
Dec
-94
Jun
-95
Dec
-95
Jun
-96
Dec
-96
Jun
-97
Dec
-97
Jun
-98
Dec
-98
Jun
-99
Dec
-99
Jun
-00
Dec
-00
Jun
-01
Dec
-01
Jun
-02
Dec
-02
Jun
-03
Dec
-03
Jun
-04
Dec
-04
Jun
-05
Dec
-05
Jun
-06
Dec
-06
Jun
-07
Dec
-07
Jun
-08
Dec
-08
Jun
-09
Dec
-09
Jun
-10
Dec
-10
Jun
-11
Dec
-11
Jun
-12
Dec
-12
Jun
-13
Dec
-13
Jun
-14
Dec
-14
-50.0%
-40.0%
-30.0%
-20.0%
-10.0%
0.0%
10.0%
20.0%
30.0%
40.0%
50.0%
0.0%
New
Ord
ers
and
Shi
pmen
ts
-50.0%
-40.0%
-30.0%
-20.0%
-10.0%
0.0%
10.0%
20.0%
30.0%
40.0%
50.0%
Bac
klog
New Orders Shipments Backlog
Source: USDOC
Annual Rate of Change
F. Hal VandiverJanuary 2015
11
MHEM and Economic CyclesDecember 2014
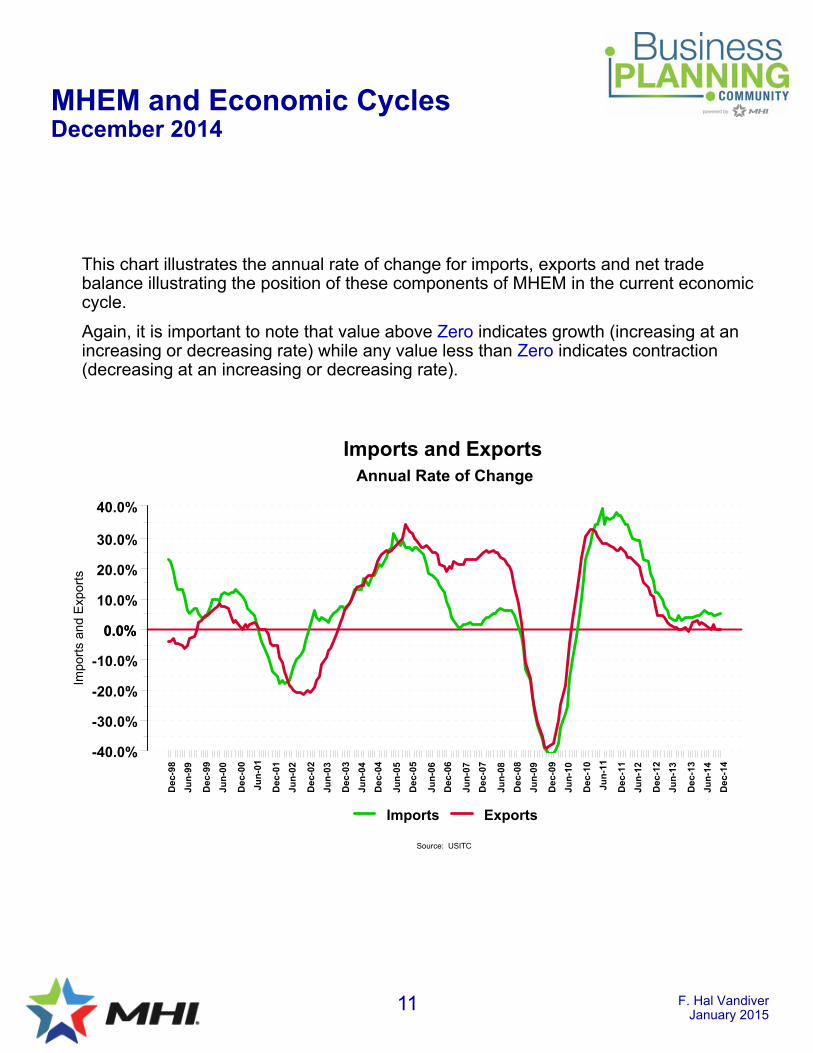
This chart illustrates the annual rate of change for imports, exports and net trade balance illustrating the position of these components of MHEM in the current economic cycle.
Again, it is important to note that value above Zero indicates growth (increasing at an increasing or decreasing rate) while any value less than Zero indicates contraction (decreasing at an increasing or decreasing rate).
Imports and Exports
Dec
-98
Jun
-99
Dec
-99
Jun
-00
Dec
-00
Jun
-01
Dec
-01
Jun
-02
Dec
-02
Jun
-03
Dec
-03
Jun
-04
Dec
-04
Jun
-05
Dec
-05
Jun
-06
Dec
-06
Jun
-07
Dec
-07
Jun
-08
Dec
-08
Jun
-09
Dec
-09
Jun
-10
Dec
-10
Jun
-11
Dec
-11
Jun
-12
Dec
-12
Jun
-13
Dec
-13
Jun
-14
Dec
-14
-40.0%
-30.0%
-20.0%
-10.0%
0.0%
10.0%
20.0%
30.0%
40.0%
0.0%
Impo
rts
and
Exp
orts
Imports Exports
Source: USITC
Annual Rate of Change
F. Hal VandiverJanuary 2015
12
MHEM Updates and Forecast
Additional Resources
MHI provides detailed historical time series data for all series included in the MHEM at http://www.mhi.org/forecast under Market Analysis.
MHEM Forecasts
MHI also releases a comprehensive forecast of Material Handling Equipment Manufacturing each quarter that looks 18 to 24 months forward to anticipate changes in the Material Handling and Logistics marketplace.
The 50+ page forecast includes the content presented in this Brief, plus the following:
• MHEM Segment History Detail (Annually)
• Economic Cycle Analysis
• Leading Indicator Analysis
• IHS Global Insight Economic Forecast
• Capital Spending Summary
• Economic Commentary and Forecasts
• MHEM Forecast – Domestic, Imports, Exports, Consumption
The MHEM Forecast is available to Members of MHI for no charge and to Non-members for $250.00 by placing an order at http://www.mhi.org/forecast.