matching problem of civil service stanford gsb · assignment mechanisms in the u.s. senate from a...
TRANSCRIPT
MATCHING PROBLEM OF CIVIL SERVICE
ASHUTOSH THAKUR
Stanford GSBApril 2, 2019
Abstract. Using a matching theory perspective, we analyze the extent to which exist-ing and alternative Indian Civil Service state assignment mechanisms can yield balanceacross three dimensions of interest: quality, embeddedness, and quota. We find that arecent change in the matching mechanism in 2008 has systematically skewed assignmentsby assigning relatively poor quality, outsider bureaucrats to bad state cadres: regions withexternal foreign conflict, states with internal political strife, and newly-formed states. Thispaper i) analyzes the causes of these imbalances, ii) assesses the impact of this mechanismchange on state capacity, development outcomes, and bureaucratic performance, and iii)highlights trade-offs in implementing alternate mechanisms. By exploiting the exogenouschange in mechanisms, we quantify the decrease in tax revenue for the bad cadres caused bythe new mechanism and estimate the impact of exam rank on tax collection, allowing wel-fare analysis for counterfactual policies and mechanisms. Global balance in quality acrossstate cadres is a unique constraint which arises when applying matching to political econ-omy settings, as the mechanism designer is a paternalistic central planner. Thus, less isleft to the market compared to most canonical matching applications. On the other hand,the use of matching in political economy is also novel, and careful understanding of howdifferent matching mechanisms address underlying correlations in the data has far-reachingconsequences for bureaucratic performance and development outcomes.
1. Introduction
The Indian Administrative Service (IAS), often referred to as the “Steel Frame of India,” isthe topmost tier of the central government civil service which administers and oversees a vastarray of government operations at the state and federal levels from revenue administration,policy formulation, and public works to maintaining law and order, supervising expenditureof public funds, and implementing education and development initiatives. This paper ana-lyzes the mechanisms used for the lifelong assignment of IAS officers to state cadres1 at thevery start of their careers. Motivated by the desire of the Indian Administrative Service to
Email address: [email protected] special thanks to Dinsha Mistree, Vatsalya Srivastava, Al Roth, Fuhito Kojima, Paulo Somaini, SteveCallander, Carlos Varjao, Ilya Morozov, Ignacio Rios, Saumitra Jha, Marcos Salgado, Ken Shotts, DavidBaron and participants and discussants at the Stanford Market Design Seminar, Quality of GovernanceConference, Institutional and Organizational Economics Academy, and Indira Gandhi Institute for Devel-opment Research for their guidance and comments, and to Sharique Hasan and JP Ferguson for sharingtheir data from Ferguson and Hasan (2013). Thanks to IAS officers Surendrakumar Bagde, Vijay Kumar,Alka Upadhyaya, Mandeep Bhandari, Abhishek Chandra, M. Saravanan, and Ashish More for their insights.I would also like to thank the Ronald I. McKinnon Memorial Fellowship (Center for Global Poverty andDevelopment) and the Center for South Asia Summer Research Fellowship for their generous support.1We use the terms “state cadre” and “cadre” interchangeably to refer to a state or a group of states whichforms an administrative unit as defined in the allocation process.
1

2 ASHUTOSH THAKUR
live up to its All-India mandate and promise well-balanced development across all of India’sstate cadres, we analyze the extent to which different IAS cadre assignment mechanisms canbe successful in yielding balance across three dimensions of interest: quality, embeddedness,and quota. With the novel approach of analyzing this political economy problem using amatching theory framework, we i) underscore a new class of constraints in matching whicharise in political economy: constraint for global balance in quality, ii) assess the imbalancescaused by different IAS cadre assignment mechanisms, iii) empirically evaluate the effectof a recent mechanism change on state capacity, development outcomes, and bureaucraticperformance, and iv) highlight welfare counterfactuals and trade-offs of alternate matchingmechanisms and policies.
Every year, the Union Public Service Commission (UPSC) holds a competitive Civil Ser-vices Examination2 to select candidates for these prestigious civil service positions, andmakes lifelong appointments assigning many new recruits to different state cadres: a many-to-one matching problem. In this allocation process, only the preferences of candidates havebeen taken into account, making this a one-sided market. In addition, the government seeksto impose balance constraints across overlapping dimensions of embeddedness and quota,along with a global balance constraint of uniformly distributing talent across states. Sucha constrained allocation problem arises in civil services and government personnel assign-ment problems across many countries. Thus the use of a matching theory framework in thispolitical economy application has broad applicability in theoretically understanding the con-sequences of various matching mechanisms, empirically evaluating the effects on outcomes,and in an engineering sense, helping design and implement better mechanisms.
The IAS cadre allocation process is transparent, algorithmic, and void of subjective in-ternal evaluations or arbitrary political influence seen in subsequent transfer or promotionprocesses. From the biographical information it has on each of the candidates, the UPSC in-corporates the home state of origin, the quota category, and the exam rank of each candidatein the mechanism. The central government tries to avoid lopsided allocations on these threedimensions. First, it seeks to limit too many candidates being allocated to their own homestate of origin, what we refer to as the “embeddedness dimension.” The central governmenthopes the bureaucracy will benefit from having some locally embedded insiders who are per-haps more willing and better able to serve the regions with which they are familiar. However,the government is also naturally wary of insiders being too familiar and falling prey to localelite capture. Hence, the UPSC has targeted a 1:2 ratio between “insiders” and “outsiders”in each cadre. Second, the affirmative action policy in India mandates that seats be reservedfor backwards classes: 15% for Scheduled Castes (SC), 7.5% for Scheduled Tribes (ST), and27% for Other Backward Class (OBC). Hence, the UPSC sets different exam score cutoffsfor each of these groups and the mechanism tries to ensure each cadre has a similar quotarepresentation. We refer to this as the “quota dimension.” Lastly, the central governmentseeks balance across cadres over the exam rank of assigned candidates. Since exam rankis the only standardized proxy for quality the UPSC has at the time of initial assignment,it is only natural to uniformly distribute bureaucratic quality across the cadres. We referto this as the “quality dimension.” Hence, the assignment of IAS officers to state cadres
2See Appendix E for details on the Civil Services Examination. Note that this paper focuses on these “directrecruits,” who enter through the Civil Services Exam and take part in the cadre assignment mechanisms.Another way to enter the IAS is to be promoted from state civil services; however, such promotees do notenter cadre allocation mechanism. See Appendix D for more.

MATCHING PROBLEM OF CIVIL SERVICE 3
is a structured allocation problem with well-defined constraints, apt for applying matchingtheory techniques.
Matching theory was developed as a counterpart to standard economic theory where pricesand willingness to pay determine allocations. In the canonical applications of matchingtheory, prices are either non-existent (i.e., school choice, residency matching) or illegal (i.e.,kidney exchange). This paper highlights an example of how matching theory can be appliedto political economy. In a similar spirit, Thakur (2017) looks at the party-specific committeeassignment mechanisms in the U.S. Senate from a matching theory perspective. The cruxof that paper is the existing tenants problem, the difference in strategyproofness betweenmechanisms used by the two political parties, and the empirically testable predictions thisimplies. Instead of focusing on the strategic incentives induced by the matching mechanism,this paper highlights how matching, when applied to political economy, produces a uniqueset of balance constraints which tend not to arise in the canonical matching applications.
In this case, the mechanism designer is the central government which seeks to promoteuniform growth and development across all Indian cadres. This implies a set of constraintswith a paternalistic flavor. Apart from balance constraints over quota and embeddedness,which are similar to standard affirmative action constraints in classic matching applicationslike school choice, the global constraint to have balance over quality across cadres is unique.In standard matching applications, more is left to the market: the relative quality of stu-dents across schools and residents across hospitals for example, are left to market forces andunderlying preferences, rather than being manipulated by the mechanism designer. Thereis no attempt to correct lopsided outcomes such as the best students/residents being allo-cated to highly ranked, prestigious programs/hospitals. Furthermore, in our setting, such aglobal constraint for uniform quality requires the mechanism designer to identify and correctfor many of the underlying correlations in the data amongst preferences, age, exam rank,reservation, etc, which most matching applications simply take as given. If the mechanismfails to address the underlying correlations, as we show for the recent mechanism, then al-locations can cause a divergence in development outcomes, economic growth, bureaucraticperformance, social welfare, and politician-bureaucracy relations across India.
In this paper, we analyze the IAS cadre assignment procedure from all aspects of match-ing theory: theoretical lens, empirical analysis, and engineering design. First, from theassignment data as well as from matching theory modeling, we show that the new matchingmechanism used from 2008 onwards, skews assignments by systematically assigning relativelypoor quality, outsider candidates to bad state cadres : regions which are newly formed, faceexternal foreign conflict, and have internal political strife. These imbalances arise becausethe new assignment mechanism is more responsive to correlation in candidates’ preferencesover state cadres and because of consistent patterns of disproportionate regional representa-tion amongst exam toppers3. Compared to the older mechanism used in 1984-2007, regionalhomophily has noticeably increased, with Northerners staying in Northern states, Southern-ers in South and IAS officers being assigned state cadres much closer to their home state.Hence the intentions of the IAS promoting national unity and integration, as envisioned byearly proponents of the IAS like Sardar Patel, have been undermined. Second, we show that
3We use the terms “exam toppers,” “toppers,” and candidates interchangeably to refer to those who qualifiedby successfully clearing the Civil Service Exam cutoffs and are to be allotted cadres through the assignmentmechanisms.

4 ASHUTOSH THAKUR
imbalances in the assignment process also translate into imbalances in bureaucratic perfor-mance and developmental outcomes. By exploiting the exogenous change in mechanisms,we estimate the decrease in tax revenue collection for bad cadres caused by the New Mecha-nism. Furthermore, using the change in mechanism as an IV allows us to quantify the effectof bureaucratic quality (as proxied by exam rank) on tax collection; this allows welfare anal-ysis for counterfactual matching mechanism designs and policies. Moreover, we find otherimbalances caused by the change in mechanism, on characteristics that correlate with bu-reaucratic performance, as shown by results from the existing empirical literature. We showthat bad state cadres tend to get candidates who are older and hence have less perceivedbureaucratic effectiveness, candidates who are not amongst the highest scoring exam toppersand hence less likely to specialize and more susceptible to politicized transfers, and a higherpercentage of outsider candidates who are less effective in public good provision. Finally,these imbalances motivate our study of how alternative mechanisms—two-sided matching,nudging preferences via incentives, and grouping cadres—can be designed to overcome suchperverse, lopsided outcomes.
After a brief introduction of the IAS (Section 2), we review the empirical literature on theIAS and the theoretical literature on matching with constraints (Section 3). Then we analyzethe performance of the two most recent mechanisms: the Old Mechanism used from 1984to 2007 and the New Mechanism used since 2008 onwards (Section 4). We analyze how andwhy these mechanisms cause imbalances in bureaucratic quality and national integration,and who benefits from the change in mechanism. In Section 5, we show that these qualityimbalances translate to imbalances in state capacity, bureaucratic performance, and devel-opmental outcomes. We suggest various avenues to help overcome the imbalances caused bythe underlying correlations in the data by changing certain mechanism features, groupingcadres, and nudging preferences (Section 6). In Section 7, we introduce two-sided matchingwith soft constraints motivated by cadres’ tendency to have preferences over candidates’ ed-ucation, skills, and local language proficiency. Finally, we highlight the broader applicabilityof the matching framework to other civil services and motivate other matching applications,outside of bureaucracies, which call for incorporating quality constraints (Section 8).
2. The Indian Administrative Service
The IAS, along with other elite civil services like the Indian Foreign Services and IndianPolice Services, evolved from the Indian Civil Service, which was used by the British empireto administer the Indian colony (1893-1946). Under the British rule, many governmentfunctions like revenue collection, law and order, and general administration were streamlinedunder the management of very few ICS officers. Even today, the strength of the IAS isjust roughly 5000 officers managing the administration of a country with a population of1.3 billion. After Independence, it was this “Steel Frame” of Indian administration whichproponents of the civil service system, most notably India’s Deputy Prime Minister SardarPatel, sought to maintain. Some opposed its continuation, viewing the IAS as a remnant ofthe imperial administration acting against the interests of sovereign India. However, Pateland others maintained that the All-India services would preserve unity and integration overthe diverse country which included a conglomeration of princely states at that time.
IAS officers are central government civil servants who are given lifelong assignments to acertain state cadre. Although IAS officers can be temporarily deputed to a different cadre orpromoted to the Centre, these events are rare, and a vast majority of an IAS officer’s career

MATCHING PROBLEM OF CIVIL SERVICE 5
is spent in his assigned state. Even the early-career positions given to younger IAS officerssuch as District Magistrates or District Collectors carry a lot of power and responsibility:managing revenue collection, supervising law and order, serving as custodian to governmentland, and implementing government policies. Over the years, IAS officers are transferredacross districts and promoted to higher positions of Joint Secretary of Ministries or CabinetSecretary based on seniority, internal performance evaluation, and political influence due toministerial involvement. Thus, more senior posts involve policy implementation and advisingor even drafting legislation alongside elected officials. Some IAS officers choose to pursuehigher education. The skills and expertise acquired by experience, training, and furthereducation can help in getting better positions, promotions up the hierarchy, or empanel-ment4 to the Centre. Hence, working with state civil servants, state and federal politicians,IAS officers serve in the highest-tier administrative positions from overseeing agriculturalpolicy, land revenue and district administration, to working with NGOs to administer ruraldevelopment projects or setting higher education policy.
3. Literature Review
Instead of providing an overarching review of the theoretical and empirical literature onbureaucracies5, we choose to contextualize this paper amongst two strands of literature: first,the empirical literature on the IAS and second, the theoretical literature on matching withconstraints.
Iyer and Mani (2012) and Nath (2015) focus on the interaction between career bureau-crats and their politician counterparts. Although IAS officers are career civil servants withlifetime appointments and job security meant to insulate the bureaucracy from the whimsof political instability, Iyer and Mani (2012) emphasize the vast discretion over transfersand promotions which lies in the hands of the state ministers. This “Transfer Raj” createsincentive problems. The probability of an IAS officer being transferred increases by around10% when a new minister is elected. Furthermore, high-skilled officers (top 20 exam rank)are transferred less frequently compared to the rest of the IAS officers. Thus, Iyer and Maniposit that IAS career success can be brought about via two substitutable avenues: enhancingone’s skills or exhibiting political loyalty. Politicized transfers cause underinvestment in skillacquisition and can have lasting detrimental consequences for economic development. Nath(2015) measures bureaucratic performance by the time it takes for IAS officers at the districtcollector level to sanction projects proposed by Members of Parliament and funded with dis-cretionary funds. When incumbents are barred from being re-elected (reasonably exogenousshock as this occurs when the Member of Parliament seat comes under an affirmative action
4Empanelment refers to the selection process of civil servants to be appointed to top bureaucratic positionsof joint secretary and higher in the Central Government of India. The selection under the Central StaffingScheme relied on performance evaluations, systems which have changed over time: Annual ConfidentialReports (until 2007), Annual Performance Appraisal Reports (2008-2015), and 360 Degree Appraisals (2015onwards).5Theoretical models of delegation and political oversight include McCubbins, Noll, Weingast (1987, 1989),Moe (1989, 1995, 2005, 2012), Epstein and O’Halloran (1999), Bendor and Meirowitz (2004), Huber andMcCarty (2004), Huber and Shipan (2011), and Gailmard and Patty (2012), and empirical work testingtheories of delegation includes Gulzar and Pasquale (2017). For a review of survey analysis related tobureaucracies and civil services see Rogger (2017). For a review of field experiments in personnel economics,see Finan et. al (2017). For a review of work on state capacity and its impact on development, see Bandieraet. al (2014).
6 ASHUTOSH THAKUR
reservation quota), the time to sanction a project increases by 13%. Moreover, when theseat is a party stronghold and the incumbent politician is likely to be re-elected, projectsare approved 11% faster. Finally, when the district collectors are eligible for promotion,the quality of implementation improves. Together, these papers show how politicians canimpose control over IAS officers via their career trajectory; however, this only applies lateron in their careers. Our paper deals with the initial cadre assignments at time of entry intothe IAS, which is governed by a well-specified matching algorithm. Hence, we do not haveto worry about political influence.
The other strand of empirical literature on IAS studies the different characteristics thatpredict effective bureaucratic performance and improved developmental outcomes. Fergusonand Hasan (2013) find that investment in specialization of skills through education andtraining benefits IAS officers throughout their careers. Early on in their career, investmentin specialization acts as a signal of general ability and increases the chances of gettingpromoted to the Centre. However, their posting in New Delhi does not necessarily matchtheir skills or area of expertise. On the other hand, later in their careers, when up forEmpanelment, IAS officers who specialize are rewarded for their skill acquisition as theirposting reflects their area of expertise. Bertrand et al. (2015) form their own measure ofperceived bureaucratic effectiveness by surveying local “societal stakeholders” such as NGOs,businesses, politicians, and other civil servants. They find that higher exam score, bettertraining performance, and younger age predicts higher perceived bureaucratic effectiveness.Furthermore, perceived bureaucratic effectiveness score is associated with faster growth,higher non-tax revenue, and more development expenditures— all government functionsIAS officers oversee. Hjort et al. (2015) use a value-added estimation framework, and findthat education, local language proficiency, and direct recruitment predict higher value-addedofficers. Moreover, high value-added bureaucrats predict better project outcomes, higherluminosity (measures of nighttime lights), and increased likelihood of future empanelment.Finally, Bhavnani and Lee (2015) find that locally embedded insiders increase public goodsprovision (as measured by percentage of villages in district with schools), but only whendistricts have a high level of accountability, as proxied by high literacy and strong newspapercirculation.
We use all of these empirical findings in Section 5.3 to access the impact of the assignmentmechanisms on developmental outcomes and bureaucratic performance.
The literature on constraints in matching theory has revolved largely around the canonicalapplications in matching: regional caps and Rural Hospital problem in residency matching,and affirmative action in school choice.
The residency matching market, whether it is the National Resident Matching Programin the US (NRMP) or Japan (JRMP), tends to be an imbalanced market with more hos-pital vacancies than domestic candidates. Furthermore, candidates tend to have correlatedpreferences with a bias in favor of urban placements over rural placements. Hence, the earlymatching mechanisms used in these settings (candidate-proposing Deferred Acceptance) suf-fered from urban areas being over-served while inner-city and rural areas were under-served6.Roth (1984, 1986) establishes the seminal Rural Hospital Theorem, proving that when can-didates have strict preferences, any hospital that fails to fill its vacancies at some stablematching, will not only fill the same number of candidates, but will also be filled by the
6See Roth (1984, 1986) for NRMP and Kamada and Kojima (2014) for JRMP.

MATCHING PROBLEM OF CIVIL SERVICE 7
same set of candidates, in any stable matching. This general result meant that the attrac-tive notion of stability in two-sided markets has to be compromised in order to alleviate suchmaldistribution of candidates. Recently, Kamada and Kojima (2014, 2017) have theoreti-cally analyzed how to incorporate distributional constraints in the form of regional caps intwo-sided matching7. The JRMP imposed regional caps where multiple hospitals belongedto the same region and set upper bounds on the number of vacancies which could be filledacross the region. Kamada and Kojima (2014, 2017) showed that the JRMP mechanism ofdoctor-proposing Deferred Acceptance with hospital-specific caps (which added up to theregional cap) was both inefficient and unstable. Instead, their Flexible Deferred AcceptanceMechanism—combining hospital-specific artificial caps with hospitals taking turns in a pre-defined order to fill vacancies to meet regional caps— is constrained pareto optimal and“strongly stable.” The notion of strong stability ignores unjustified envy for blocking pairswhich are infeasible due to the constraints. Kamada and Kojima (2017) characterize whenthe constraints guarantee the existence of strongly stable matchings. In our paper, sincethe market is balanced8 and preferences cannot be truncated (i.e., there are no unacceptablematches from the perspective of either the candidate or the cadre), the concerns of un-filled vacancies, rural hospital theorem, and regional caps do not apply to the IAS matchingproblem.
In school choice and many other applications, affirmative action and legally mandated quo-tas/reservations for gender, race, or socio-economically under-privileged students are quitecommon constraints which must be accommodated9. This literature highlights two impor-tant considerations for incorporating such constraints in two-sided matching. First, thesepapers collectively highlight the differences in using hard bounds (i.e., explicit quota-reservedseats) versus soft bounds (i.e., priorities for quota candidates). Second, it is imperative toweaken the notion of stability to justified envy: blocking pairs which are not feasible due tothe priorities and quota restrictions are ignored.
The literature on controlled school choice was initiated by Abdulkadiroglu and Sonmez(2003) who showed that Deferred Acceptance and Top Trading Cycles mechanisms couldbe modified to allow for affirmative action on a single dimension with type-specific quotas.However, Kojima (2012) showed that even when there are just two student types (minorityand majority), such upper-bound quotas for majority students can hurt minority studentsbecause majority candidates who are turned down when the upper-bound quota is bindingcause increased competition with minority at other schools. Instead of imposing hard upper-bounds with majority quotas, Hafalir et al. (2013) suggested soft lower-bounds with minoritystudent reserves. Under such a scheme, if the minority reserve set by a school is not met,then any minority candidate is preferred to any majority candidate at that school. However,
7See Kamada and Kojima (2014) for a discussion on other examples of similar regional caps and distributionalconstraints which arise in UK medical match, Scottish Teacher allocation, college admission in Hungary andUkraine where there are state-financed and privately-financed seats, and Chinese graduate school admissionswhere there are professional and academic programs.8The UPSC chooses exactly the correct number of IAS candidates from the examination as there are vacan-cies.9See Abdulkadiroglu and Sonmez (2003), Abdulkadiroglu (2005), Ergin and Sonmez (2006), Dur et al. (2016),Abdulkadiroglu et al. (2009), Kojima (2012), Echenique and Yenmez (2015), Westkamp (2013), Hafalir et al.(2013), and Ehlers et al. (2014) for affirmative action and quotas in school/college choice. For affirmativeaction and quota constraints in other applications see Sonmez (2013), Sonmez and Switzer (2013), andDelacretaz et al. (2016).

8 ASHUTOSH THAKUR
if there aren’t enough minority candidates to fill the reserve, then majority candidates can fillthe remaining vacancies. Hence, their Deferred Acceptance algorithm with minority reservespareto dominates the Deferred Acceptance algorithm with majority quotas. Ehlers et al.(2014) further generalize the notion of soft constraints to an arbitrary number of studenttypes where schools have both ceilings and floors for each student type. Their generalizationis substantial, because unlike Hafalir et al. (2013), the mechanism designer cannot simplysplit the school into clones with one prioritizing minority students and other with the numberof vacancies lowered by the minority reserve. Instead, they propose to control the soft ceilingsand floors dynamically to achieve fair and non-wasteful allocations.
Our paper differs from canonical school choice literature because when we introduce two-sided matching, it is with the intention of incorporating cadres’ preferences over candidateson the basis of local language proficiency, education and skills. Public schools on the otherhand legally cannot have preferences over students. In practice, this global indifference isbroken first by “priorities” (i.e., sibling also goes to school, distance of school, house onschool bus route) and then by random lotteries. Hence, the affirmative action restrictionsare also often incorporated through priorities in these applications. Abdulkadiroglu (2005)examines college choice with affirmative actions where colleges have preferences over sub-sets of students, and describes two properties college preferences must satisfy for DeferredAcceptance to maintain its desirable properties. This would be interesting to incorporatewhen we introduce two-sided matching; however, to keep the assumptions behind the sim-ulations at a minimum, in this paper we assume cadres have preferences over individualcandidates, and not groups of candidates. Furthermore, in our setting, the IAS constraintsare across overlapping dimensions of exam rank, embeddedness, and quota. Kurata et al.(2017) is the closest paper which deals with overlapping types. They show that applying thesame notion of stability as the model with disjoint types can lead to non-existence of stablematching. Instead, they propose Deferred Acceptance for Overlapping Types which guaran-tees stable matching, is strategyproof, and obtains the student optimal matching. However,our two-sided matching is motivated by the desire to accommodate cadres’ preferences overcandidates and moreover, the global constraint of uniform quality across cadres is a novelconstraint in this setting.
We further discuss and implement the results from this literature on matching with con-straints in Section 7, when we introduce two-sided matching with reservations for insidersand quota candidates.
4. Evaluating the 1984 & 2008 Cadre Allocation Mechanisms
The UPSC which is the central government agency in charge of recruitment has experi-mented with many matching mechanisms for the initial assignment of IAS recruits (and othercivil services) to states. The two most recent systems are the 1984-2007 system (Section 4.1)and the 2008-present system (Section 4.2). We will show that the New Mechanism causesimbalances in quality, systematically hurts certain certain states because it takes preferencesof candidates ‘too seriously,’ and leads to greater homophily (Section 4.3). Furthermore, weidentify which groups benefit/lose from the change in mechanism (Section 4.4).

MATCHIN
GPROBLEM
OF
CIV
ILSERVIC
E9
Figure 1. Flowchart of the Old Mechanism (1984-2007) and New Mechanism (2008 onwards)

10 ASHUTOSH THAKUR
4.1. The 1984 “Old Mechanism.”The Old Mechanism was in place from 1984 to 200710.
(1) The 24 cadres are split into 4 alphabetically ordered groups11:• Group I: Andra Pradesh, Assam-Meghalaya, Bihar, Chhattisgarh, Gujarat• Group II: Haryana, Himachal Pradesh, Jammu & Kashmir, Jharkhand, Kar-
nataka, Kerala, Madhya Pradesh• Group III: Maharashtra, Manipur-Tripura, Nagaland, Orissa, Punjab, Rajasthan,
Sikkim• Group IV: Tamil Nadu, AGMUT, Uttarakhand, Uttar Pradesh, West Bengal
(2) Each year, the order of the 4 groups is rotated by moving the first group to be thelast. This forms a permutation of the 24 states. The algorithm goes through thisordered list again and again in a cyclical fashion as we explain below, hence we callthis a “1:24 cycle.” For example, the 2007 rotation was 1) Group IV, 2) Group I, 3)Group II, and 4) Group III. Hence, Bihar which is the 3rd state in Group I becomesthe 8th state in the 1:24 cycle in this rotation.
(3) Each cadre creates a list of vacancies across 6 groups: insider and outsider vacanciesseparated by the 3 quota categories (General, OBC, SC/ST)12.
(4) Candidates are arranged by exam score and each candidate is asked whether or nothe would like to be considered for an insider position13.
(5) First, in order of exam rank, all those who answered “Yes” to being an insider, areallotted to their state if there is a corresponding vacancy in their quota category.
(6) Next, if there are insider vacancies with no matching candidates who are willing tobe insiders, check for swaps (in order of exam rank):• If there is no General insider candidate to fill a General insider vacancy, first
check if there is an SC/ST insider candidate, SC/ST insider vacancy, and SC/SToutsider vacancy which can be exchanged: SC/ST insider vacancy is deleted, anSC/ST outsider vacancy switches to General outsider vacancy, and the candidateis allotted to the cadre. If no SC/ST insider candidate or no SC/ST outsidervacancy, attempt for similar swap with OBC category. Similarly, if no OBCinsider vacancy is filled, check for swaps first with SC/ST category and thenwith General category. And then, if no SC/ST insider vacancy is filled, checkfor swaps first with OBC category and then with General category14.
(7) If an insider vacancy remains even after swaps, convert it to an outsider vacancy.
10The official assignment process rules are clearly delineated by the UPSC and are available online athttp://persmin.gov.in/AIS1/Docs/OldCadreAllocProcedure.pdf.11This mechanism is used for all simulations of the Old Mechanism in this paper. To stick with this originalordering, we avoid running counterfactual Old Mechanisms for years 2014 onwards because Telangana wasformed and Manipur-Tripura were split. We also avoid running this Mechanism for years before 2001, becausein 2000 the new states Jharkhand, Chhattisgarh, and Uttarakhand were formed.12Because the Old Mechanism vacancies reports SC and ST vacancies combined as one group, to allowfor the coarsest vacancy reporting so that we can run comparable counterfactual New Mechanisms, in thesimulations, we always combine SC and ST vacancies for years 2008 onwards.13We do not have the answer to this willingness to be an insider question by candidate, hence in oursimulations we make the assumption that everyone wants to be an insider. This is close to reality in thatalmost everyone answered “Yes” to this question as this mechanism otherwise gave a seemingly randomallocation from the perspective of the candidate.14During the swaps, insider disabled candidates are given highest priority, however, we omit this from thesimulations.

MATCHING PROBLEM OF CIVIL SERVICE 11
(8) Insiders in each state are allocated into subsequent 1:24 cycles. Then in the remain-ing subsequent cycles, introduce any existing outsider vacancies by each state. Forexample, if Maharashtra gets 4 insiders, they are allotted to cycles 1, 2, 3, and 4respectively, and Maharashtra’s remaining vacancies for outsiders will be allotted tocycles 5, 6,...
(9) Arrange all remaining candidates in order of exam rank and go through the 1:24cycles to fill remaining outsider vacancies by order of exam rank. However, rotategroups every cycle when allotting insiders (i.e., group 1 of this year’s rotation is firstin 1st cycle, group 2 is first in 2nd cycle, etc).
4.2. The 2008 “New Mechanism.”The New Mechanism has been in place from 2008 onwards15. Now, the groups and 1:24
cycles from the Old Mechanism are not used.
(1) Each candidate is asked to report their strict preferences over cadres16 17. Those whorank their home state as their top choice are considered for insider positions.
(2) Each cadre creates a list of vacancies across 8 groups: insider and outsider vacanciesseparated by the 4 quota categories (General, OBC, SC, and ST)18.
(3) First, go through candidates by exam rank and allot those who want to be insidersto cadres if a matching vacancy in their category exists.
(4) Next, if insiders don’t have matching vacancy in their quota category, check for swaps:• When no candidate is available against an insider SC Vacancy, check for swaps by
exam rank first with ST insider candidate, then OBC insider, and then Generalinsider by shifting the SC vacancy to the cadre which the incoming officer wouldhave otherwise been allocated to as an outsider19 (if this doesn’t work, swap withthe next cadre in alphabetical order in which outsider vacancy is available).Similarly, insider ST Vacancy checked for swaps by exam rank first with SC,OBC, and then General insiders. Insider OBC vacancy checked for swaps byexam rank first with ST, SC, and then General insiders. Insider General vacancychecked for swaps by exam rank first with SC, ST, and then OBC insiders.
(5) Convert all remaining vacancies to outsider vacancies.
15The official assignment process rules are clearly delineated by the UPSC and are available online athttp://persmin.gov.in/AIS1/Docs/NewCadreAllocPolicy.pdf.16Since we don’t have the candidates’ preference ranks, for our simulations, we make various assumptionsand randomly simulate preferences: (1) “Block:” want to be insider, followed by random within block ofgood cadres, followed by random with block of bad cadres. (2) “Uncorr:” want to be insider, followed byuncorrelated preferences over remaining cadres. (3) “Close:” cadres in order of closest distance from HomeState’s capital city. (4) “Res3:” same as Block, but force every 3rd choice to be from bad cadre group.17Caveat if truncate preferences: “If a candidate does not give any preference for any of the cadres, presumehe has no preference. Accordingly, if he is not allotted to any one of the cadres for which he has indicatedpreference, he shall be allotted along with other such candidates in the order of rank to any of the remainingcadres, arranged in alphabetical order, in which there are vacancies in his category after allocation of allthe candidates who can be allotted to cadres in accordance with their preference.” Hence, there are nounacceptable cadres by the rules.18Because the Old Mechanism vacancies reports SC and ST vacancies combined as one group, to allowfor the coarsest vacancy reporting so that we can run comparable counterfactual New Mechanisms, in thesimulations, we always combine SC and ST vacancies for years 2008 onwards.19In reality, the counterfactual is run using the preferences indicated, however, in our simulations, as anapproximation, we run the counterfactual with a random preference we generate by assumption because wedon’t have the actual preference orders of the candidates.

12 ASHUTOSH THAKUR
(6) In order of exam rank, run through each candidate’s preference order and allocate ifvacancy exists20 21.
4.3. Distributional Asymmetries and Their Causes.
4.3.1. Systematic Imbalances due to the Mechanisms.A common feature of both the Old and the New Mechanisms is the priority given to insider
candidates. The Old Mechanism goes through candidates in order of exam ranks, and if acandidate is willing to be an insider and there is a relevant vacancy, the seat is allocated.Next, in the order of exam rank, those willing to be insiders are given yet another chanceto be allocated to their home state if vacancies across categories can be swapped. Finally,each insider candidate is placed in subsequent cycles of 1:24, and the outsiders allocatedto the state only come from cycles after the initial cycles which insiders occupy. Thismeans that insiders will tend to be of a higher quality than outsiders, and the more insidervacancies a state is able to fill, the worse exam rank their outsider officers will be. The NewMechanism works similarly, except for the 1:24 cycles. After insiders are allotted and swapsare incorporated, the mechanism goes in order of exam rank in remaining candidates andgoes on matching preference rank orders with vacancies. We see from Figure 4, that acrossboth mechanisms and across each quota category, there is a large discrepancy in the examranks of insiders versus outsiders. These differences have grown with the New Mechanismfor two reasons. First, correlated preferences in the New Mechanism (outsiders are no longerallocated in 1:24 alphabetical order, but instead the mechanism goes through preferencesof candidates in order of exam rank). Second, the number of direct recruits has steadilyincreased from 87 in 2005 to 180 in 2015. Thus, the lower ranked toppers who qualifyamongst the final list of candidates have lower exam rank.
The systematic imbalances across state cadres arise in the New Mechanism when wecompare the average exam rank of candidates assigned to each cadre (Figure 5). First,the difference between the highest average quality state and lowest quality state increasesfrom 38.4 to 144 in 2005-07 to 95 to 543. Moreover, for years in the New Mechanism (2008onwards), the lowest quality states are consistently the same: Manipur, Tripura, Nagaland,Sikkim, Assam-Meghalaya, Chhattisgarh,... This systemic asymmetry in average quality ofassigned candidates by cadres along with certain states consistently getting relative lowerquality candidates arises within all quota categories: General, OBC, SC, and ST (Figure 7).
Moreover, the variance across cadres of average exam ranks of assigned candidates jumpsby about 5-fold in the New Mechanism compared to the Old Mechanism years (Figure 6).Hence inequality across cadres as to the quality of incoming IAS officers has grown. Infact, the variance increased even further from 2013 to 2014 when Telangana separated fromAndhra Pradesh and the joint cadre Manipur-Tripura split.
The ratio for insiders to outsiders is targeted at 1:2, and cadres’ posted vacancies eachyear are adjusted to reflect this balance. Figure 8 documents the average percentage of
20Caveat if no vacancies other than home state remain, swap candidate with first candidate above him (byexam rank) who has been allocated as an outsider. We omit this in the simulations because we alwaysassume a candidates’ first choice is to be an insider.21It is not specified what assumption is made if the vacancy quota doesn’t match. For example, it is unclearwhat happens to say an excess SC candidate when there are no SC vacancies left as well as the case whenthere are SC vacancies left, but no SC candidates. Such details are omitted in the official procedure write-up.Hence, in our simulations, for the outsider stage, we combine vacancies across all quota categories for eachcadre and allocate accordingly.

MATCHING PROBLEM OF CIVIL SERVICE 13
insider requests (Left) and insider assignments (Right). We see that percentage of requestsfor insiders lie across all states in the narrow range of 25% to 40%. Assignments on the otherhand, are capped at around 33%, while in the New Mechanism years, states like Nagaland,Sikkim, West Bengal, Chhattisgarh, Assam-Meghalaya all get less than 20% insiders. Asimilar asymmetry existed even in the Old Mechanism years, because many of these statesare able to place relatively few candidates in the toppers list (Figures 15 and 16). Given thedifference in average rank between insiders and outsiders we highlighted above, this partiallyexplains why these states get lower average exam rank overall.
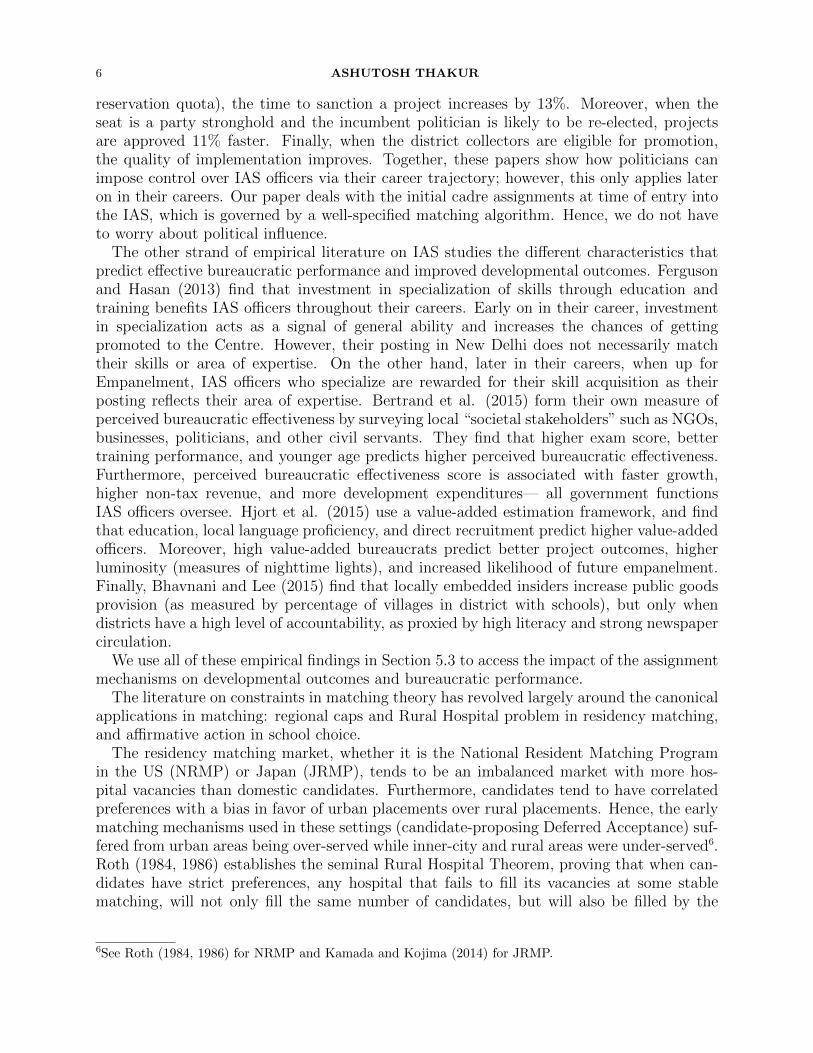
Overall, we identify certain states which are systematically and disproportionately harmedby the New Mechanism’s allocations, and from now on, refer to them as “bad cadres :”
(1) Nagaland(2) Assam-Meghalaya(3) Manipur(4) Tripura(5) Sikkim(6) Jammu and Kashmir(7) West Bengal(8) Chhattisgarh
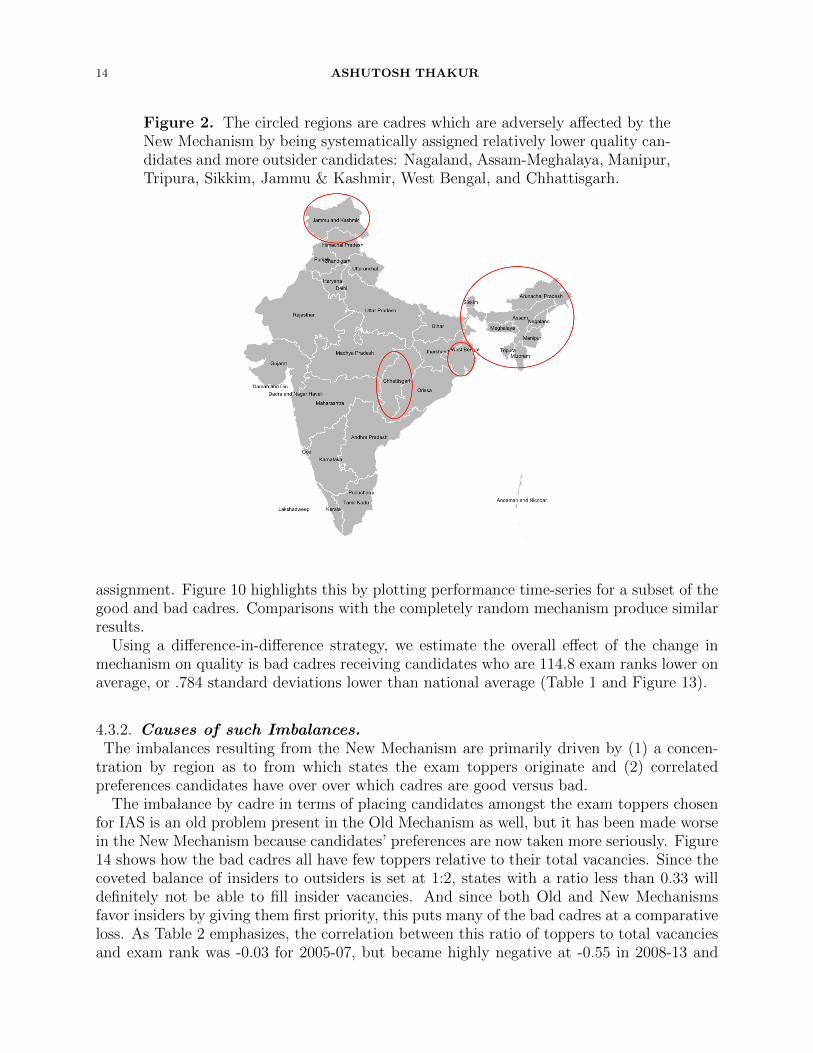
As shown in Figure 2, these states are concentrated in the north and northeast, and havevery unique political climates. First, Nagaland, Assam-Meghalaya, Manipur, Tripura, andSikkim all are part of the Northeastern Bloc, where there is external foreign conflict, disputedterritory with China, many indigenous tribes leading to internal political strife and heavymilitary presence. Second, Jammu and Kashmir borders Pakistan and historically has hadwars and struggles with Pakistan over disputed territory along with a long history of war,military presence, and violence. Third, West Bengal is an eastern state with many Naxalitecommunist factions and internal political strife and violence. Finally, Chhattisgarh is arelatively new state carved out from Madhya Pradesh in 2000. Hence, this list of bad cadresis characterized by a) external foreign conflict, b) internal political strife, and c) new states.
To further highlight the systematic under-performance of the bad cadres, we simulate twomechanisms: completely random assignments and random assignments within quota22. InFigure 9, we note that if we compare the percent of times that the actual mechanism leadsto a lower mean of average exam rank across cadres (Left) and lower variance of averageexam rank across cadres (Right), the Old Mechanism vastly outperforms the random andrandom with quota mechanisms where as the New Mechanism vastly under-performs relativeto the random mechanisms. In Figure 11, we calculate for each cadre, the percentage oftime its actual average exam rank is above the average exam rank produced by Randomwithin Quotas mechanism simulations. Hence, the orange line at 50% implies the stateis assigned an average quality similar to random. Above 50% means the state has under-performed relative to random assignments while below 50% implies the state over-performs.We see from years 2005-2007 during the Old Mechanism, that cadres tend to switch aroundacross years from under-performing to over-performing. The rotation of groups across yearscauses this equalizing effect across time. However, starting from 2008 onwards, with theNew Mechanism, the bad cadres consistently tend to under-perform relative to random
22The random within quota mechanism first takes quota seats and randomly fills them with quota candidates.Then pools the leftover quota candidates with non-quota candidates and randomly assigns them to remainingvacancies.
14 ASHUTOSH THAKUR
Figure 2. The circled regions are cadres which are adversely affected by theNew Mechanism by being systematically assigned relatively lower quality can-didates and more outsider candidates: Nagaland, Assam-Meghalaya, Manipur,Tripura, Sikkim, Jammu & Kashmir, West Bengal, and Chhattisgarh.
assignment. Figure 10 highlights this by plotting performance time-series for a subset of thegood and bad cadres. Comparisons with the completely random mechanism produce similarresults.
Using a difference-in-difference strategy, we estimate the overall effect of the change inmechanism on quality is bad cadres receiving candidates who are 114.8 exam ranks lower onaverage, or .784 standard deviations lower than national average (Table 1 and Figure 13).
4.3.2. Causes of such Imbalances.The imbalances resulting from the New Mechanism are primarily driven by (1) a concen-
tration by region as to from which states the exam toppers originate and (2) correlatedpreferences candidates have over over which cadres are good versus bad.
The imbalance by cadre in terms of placing candidates amongst the exam toppers chosenfor IAS is an old problem present in the Old Mechanism as well, but it has been made worsein the New Mechanism because candidates’ preferences are now taken more seriously. Figure14 shows how the bad cadres all have few toppers relative to their total vacancies. Since thecoveted balance of insiders to outsiders is set at 1:2, states with a ratio less than 0.33 willdefinitely not be able to fill insider vacancies. And since both Old and New Mechanismsfavor insiders by giving them first priority, this puts many of the bad cadres at a comparativeloss. As Table 2 emphasizes, the correlation between this ratio of toppers to total vacanciesand exam rank was -0.03 for 2005-07, but became highly negative at -0.55 in 2008-13 and
MATCHING PROBLEM OF CIVIL SERVICE 15
-0.35 in 2014-15 under the New Mechanism. Bad cadres tend to place fewer toppers, andmoreover, lower quality toppers within all quota categories (Figures 15 and 16).
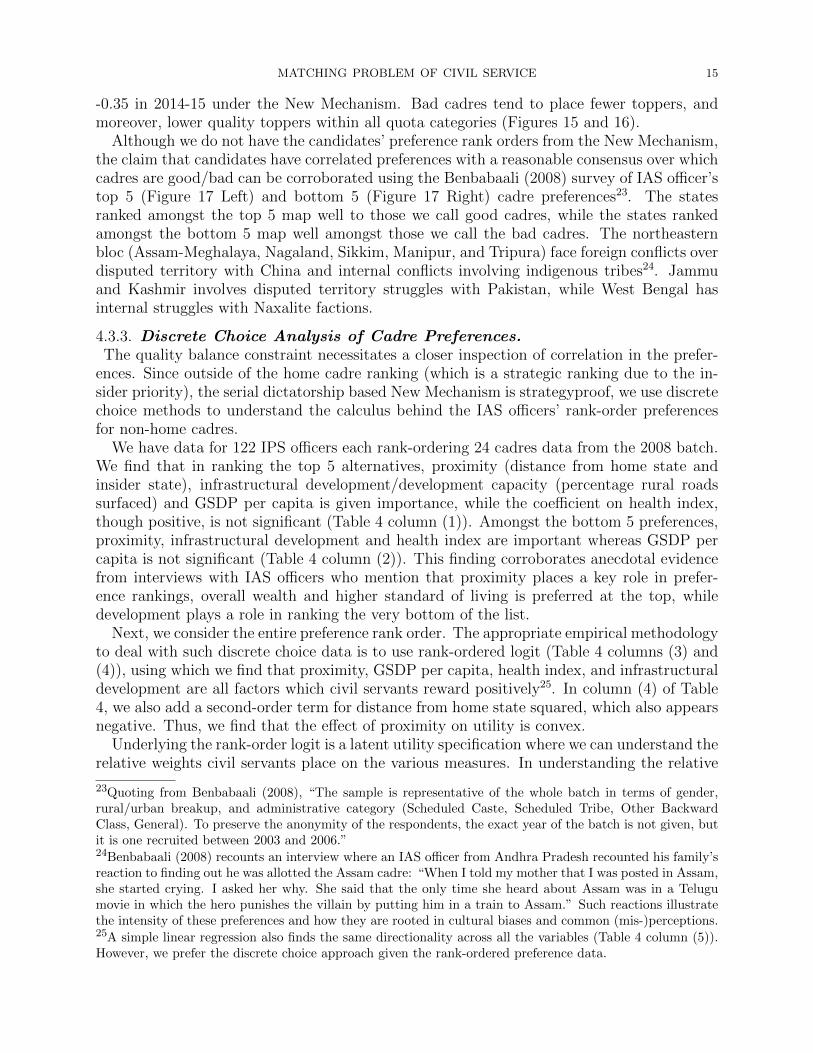
Although we do not have the candidates’ preference rank orders from the New Mechanism,the claim that candidates have correlated preferences with a reasonable consensus over whichcadres are good/bad can be corroborated using the Benbabaali (2008) survey of IAS officer’stop 5 (Figure 17 Left) and bottom 5 (Figure 17 Right) cadre preferences23. The statesranked amongst the top 5 map well to those we call good cadres, while the states rankedamongst the bottom 5 map well amongst those we call the bad cadres. The northeasternbloc (Assam-Meghalaya, Nagaland, Sikkim, Manipur, and Tripura) face foreign conflicts overdisputed territory with China and internal conflicts involving indigenous tribes24. Jammuand Kashmir involves disputed territory struggles with Pakistan, while West Bengal hasinternal struggles with Naxalite factions.
4.3.3. Discrete Choice Analysis of Cadre Preferences.The quality balance constraint necessitates a closer inspection of correlation in the prefer-
ences. Since outside of the home cadre ranking (which is a strategic ranking due to the in-sider priority), the serial dictatorship based New Mechanism is strategyproof, we use discretechoice methods to understand the calculus behind the IAS officers’ rank-order preferencesfor non-home cadres.
We have data for 122 IPS officers each rank-ordering 24 cadres data from the 2008 batch.We find that in ranking the top 5 alternatives, proximity (distance from home state andinsider state), infrastructural development/development capacity (percentage rural roadssurfaced) and GSDP per capita is given importance, while the coefficient on health index,though positive, is not significant (Table 4 column (1)). Amongst the bottom 5 preferences,proximity, infrastructural development and health index are important whereas GSDP percapita is not significant (Table 4 column (2)). This finding corroborates anecdotal evidencefrom interviews with IAS officers who mention that proximity places a key role in prefer-ence rankings, overall wealth and higher standard of living is preferred at the top, whiledevelopment plays a role in ranking the very bottom of the list.
Next, we consider the entire preference rank order. The appropriate empirical methodologyto deal with such discrete choice data is to use rank-ordered logit (Table 4 columns (3) and(4)), using which we find that proximity, GSDP per capita, health index, and infrastructuraldevelopment are all factors which civil servants reward positively25. In column (4) of Table4, we also add a second-order term for distance from home state squared, which also appearsnegative. Thus, we find that the effect of proximity on utility is convex.
Underlying the rank-order logit is a latent utility specification where we can understand therelative weights civil servants place on the various measures. In understanding the relative
23Quoting from Benbabaali (2008), “The sample is representative of the whole batch in terms of gender,rural/urban breakup, and administrative category (Scheduled Caste, Scheduled Tribe, Other BackwardClass, General). To preserve the anonymity of the respondents, the exact year of the batch is not given, butit is one recruited between 2003 and 2006.”24Benbabaali (2008) recounts an interview where an IAS officer from Andhra Pradesh recounted his family’sreaction to finding out he was allotted the Assam cadre: “When I told my mother that I was posted in Assam,she started crying. I asked her why. She said that the only time she heard about Assam was in a Telugumovie in which the hero punishes the villain by putting him in a train to Assam.” Such reactions illustratethe intensity of these preferences and how they are rooted in cultural biases and common (mis-)perceptions.25A simple linear regression also finds the same directionality across all the variables (Table 4 column (5)).However, we prefer the discrete choice approach given the rank-ordered preference data.

16 ASHUTOSH THAKUR
importance of these different dimensions it is imperative to consider the relative variabilityin the data, so we measure in terms of 1 standard deviation effects. Relative to 1 standarddeviation increase in Distance from Home State, are 1.48 standard deviations of percentagerural roads surfaced, 3.67 standard deviations in health index, and 4.74 standard deviationsin per capita GSDP (Table 3 (3)). This suggests that proximity (particular effects frombeing an insider in the state) is by far most important, followed by development, and lastly,standard of living. When we compare the magnitudes from the conditional logit for thetop 5 (Table 3 (1)) and bottom 5 (Table 3 (2)) we see how the effect of health index andGSDP per capita, respectively lose importance, given the extremely high ratio of 1 standarddeviation effects relative to distance.
We interpret the percentage rural roads surfaced as a measure of infrastructural develop-ment or state capacity, so it is interesting how this measure is rewarded in the preferencerank orders of the civil servants. Perhaps their effectiveness or efforts can be rewarded inlocations where they are able to deliver services.
All of this analysis corroborates anecdotal interviews with IAS officers, who say that thetop of the ranking involves ranking amongst neighboring states (proximity considerations),amongst which differentiation may be based on culture, language, and wealth or standardof living. However, after that, the lower ranking is done on the basis of proximity anddevelopment26
We can also do the exercise of comparing the average distance candidates are willing totravel to get a certain cadre relative to the average cadre. For this calculation, we calculatethe latent utility for each candidate for each cadre. Then we compute the average utilityfor each candidate across all cadres, and take the difference in latent utilities as a factor ofthe coefficient on distance. This gives us for each candidate, the amount of miles he wouldbe willing to travel for any cadre relative to average cadre. We take the average acrosscandidates for each state cadre and report in Table 7.
4.3.4. Discrete Choice Analysis for Exam Topper Production by Cadre.Since there is a quality balance constraint and an imbalance in the production of exam
toppers by cadre, it is imperative to understand where exam toppers originate from, sinceinsiders are given priority in the mechanisms. Analysis using Poisson regression to handledata on counts of exam toppers from different cadres, finds that although health index,population, and per capita income are positively correlated with number of exam toppers,literacy appears significant but with negative coefficient (Table 8 column (1)). Even if wesplit by rural and urban literacy, both coefficients are negative and replacing literacy withthe education index used in calculating HDI, we find a negative coefficient (Table 8 columns(2) and (3)). From the data we see that some of the highest topper producing cadres haveamongst the lowest literacy rates (Bihar, Uttar Pradesh, Rajasthan). In these places, despitelower literacy rates, there is a culture of valuing civil service positions. We should not behasty in determining that the civil service exam doesn’t capture literacy, but instead, weshould note that literacy alone does not produce the effects. In fact, in India, comparatively,literacy rates are pretty high in the Northeast, from where there are very few successfultoppers. And even the highest literacy cadre—Kerala—produces many toppers, but notnearly as many as Uttar Pradesh, Rajasthan, and Bihar.
26It is anecdotal findings and this empirical analysis which motivates using Block Preferences for our simu-lations.

MATCHING PROBLEM OF CIVIL SERVICE 17
The vast imbalance across cadres as to their ability to produce exam toppers is apparentfrom our estimated probability distribution functions shown in Figure 12.
4.3.5. Impact of Imbalances on National Unity and Integration.In India’s Deputy Prime Minister Sardar Patel’s famous speech to the Constituent Assembly
in October 1949, where he advocated for establishing the Indian Administrative Serviceswhich was the “steel frame” of Indian administration, he said “You will not have a unitedIndia if you do not have a good All-India Service which has independence to speak out itsmind.” Sardar Patel had advocated for the All-India service specifically designed to promoteunity and integration. The structure of being allotted to a state cadre and then after a fewyears of service, be promoted or empaneled to the Centre, was so that these bureaucratscould experience the situation and progress of different states and report to the Centre as totheir experiences.
By giving weight to the correlated preferences, the New Mechanism has not only caused aasymmetric distribution of talent, but has also led to an increase in homophily and regionalgrouping. As seen in Figure 18, percentage of homophily has jumped relative to continuingwith the Old Mechanism (dotted line). When separated into homophily just amongst South-erners (Figure 19 Left) and amongst Northerners (Figure 19 Right), we see that both havejumped with the advent of the New Mechanism relative to the Old Mechanism counterfac-tual (dotted line), but homophily amongst Southerners has particularly sky-rocketed. Theregional divide between northern and southern states is embedded in cultural similaritieswithin the two groups and also because Hindi is widely spoken and understood throughoutmost northern states, whereas it is not so common in the southern states. The average dis-tance of the assigned cadre from the home cadre has also dramatically dropped with the NewMechanism (Figure 20 Left) and the variance (Figure 20 Right) of these distances across in-dividuals has also fallen relative to the Old Mechanism counterfactual (dotted lines)27. Thesepatterns motivate one of our preference assumptions we use for simulations in future sections:“Close” models candidates ranking preferences over cadres by the distance from their homecadre.
4.4. Who benefits and who loses?We already showed above that the New Mechanism adversely affects the bad cadres. By
the zero-sum nature of the problem, the New Mechanism thus also systematically benefitsthe good cadres. Good cadres are able to produce a healthy supply of exam toppers (i.e.,insiders) each year and these states also benefit from correlated preferences where they areranked decently high and thus tend to attract higher scoring candidates competing for theirvacancies in the New Mechanism.
How well do the candidates fare from the change in mechanism? Does the ability toexpress their full preference rank orders in the New Mechanism weakly benefit all candidatesacross exam ranks? The answer to these questions depend on the degree of correlation inpreferences. Given the high correlation in preferences we observe and the tendency to prefercadres which are closer to home, our simulations suggest that the top three quartiles interms of exam ranks are better off with the New Mechanism, at the expense of the bottomquartile (Figure 21 top row). However, if there is sufficiently low correlation in preferences,all quartiles of candidates could be better off with the New Mechanism (Figure 21 bottomrow). The Old Mechanism’s policy of not incorporating complete preference rank orders and
27Distance between cadres is measured by distance in miles between capital cities.

18 ASHUTOSH THAKUR
imposing group rotations allowed both top scorers to be assigned to less preferred cadresand low scorers to be assigned highly popular cadres. Under the New Mechanism however,correlated preferences produce competition for popular, highly sought after cadres, and henceexam toppers fill up these vacancies, leaving bottom quartile candidates worse off28. Hence,the brunt of the change in mechanisms falls on the bottom quartile, which has mostly SCand ST candidates.
5. Consequences for State Capacity, Development, & BureaucraticPerformance
So far, our analysis has focused on variables that constitute the same information theUPSC and the central government have at the time of assignment. In this section, we at-tempt to evaluate whether these systematic imbalances documented above have detrimentalconsequences for state capacity, developmental outcomes and bureaucratic performance. InSection 5.1, we use an empirical strategy exploiting the exogenous change in assignmentmechanisms to assess the impact on tax collection and quantify the effect of exam rank onperformance. We are then able to use our estimates to evaluate counterfactuals such al-ternative affirmative action policies and matching mechanisms. In Section 5.3, we considerother imbalances caused by the change in mechanism, on characteristics that correlate withbureaucratic performance, corroborated by results from the existing empirical literature.
5.1. Impact on State Capacity: Tax Revenues.The change of cadre allocation mechanisms in 2008 gives us a clean, exogenous shock to
the assignment of IAS officers to state cadres. Since later assignments to districts, transfers,and promotions are not formulaic and involve ministerial involvement29, and career trajec-tories and specializations within the IAS are vastly different by individuals30, empiricallyquantifying the long-term effect on development outcomes and bureaucratic performance isdifficult. However, the first entry-position of IAS officers across all state cadres is that ofAssistant District Collector/Magistrate31. Hence all IAS officers start their careers with thesame primary job responsibility: revenue administration32. District Collectors/Magistratesare in charge of collecting various categories of own-tax revenue (income tax, agriculturalincome tax, irrigation dues, sales tax, excise duties, etc.), maintaining land records, andhearing appeals in revenue cases in their capacity as District Magistrates. Thus given theinstitutional details of the IAS, we measure the impact of the change in mechanism on statecapacity using tax revenue data. This uses the cleanest exogenous variation we have at thestate level due to the change in mechanism and focuses on a measure that captures all IASofficers’ commonly shared, initial job responsibility of tax collection.
28Understanding these heterogeneous effects can also highlight which coalitions might have stood for/againstthe endogenous change in the mechanism. Such analysis speaks to economics and organizational behaviorliterature which posits theories of endogenous change in institutions (for example, Knott and Miller (1987)).29Iyer and Mani (2015).30Ferguson and Hasan (2013).31Early career postings in revenue management include Assistant District Collector, Additional DistrictCollector, Assistant District Magistrate, Additional District Magistrate, Sub-Divisional District Officer, andSub-Divisional Magistrate.32Later on in their careers, some IAS officers may be transferred or promoted within revenue administrationto higher posts like District Collector/Magistrate, while most are assigned to posts with responsibilities otherthan revenue administration.

MATCHING PROBLEM OF CIVIL SERVICE 19
We use state-level revenue data from 12th and 13th Finance Commission Reports coveringfiscal years 2005 to 2015. The IAS batch that qualifies under say the 2008 cycle, goes throughmandatory training for one year (2009-10), and begins to work in 2010. Thus, the entrantsfrom the New Mechanism start work in 2010 and start affecting revenue collection from fiscalyear 2010-2011 onwards. Because of the skew in quality of assigned IAS officers under theNew Mechanism, we expect the good and bad cadres to diverge in tax collection performancefrom fiscal year 2010-11 onwards. The zero-sum nature of the assignment procedure meansthat the divergence represents the joint effect of lower quality bureaucrats going to bad cadresand higher quality bureaucrats going to good cadres. Moreover, we expect this divergenceto grow over time as a larger fraction of the stock of existing bureaucrats is replaced by newentrants from the New Mechanism. Own tax revenues (including income tax, excise duties,and land revenue, which fall under District Collector/District Magistrate’s jurisdiction) andtotal tax revenues (defined as own tax revenue + non-tax revenue) seem to move in line withour expectations (Figure 22 top left and bottom). Non-tax revenues (such as interest receiptsand revenue from public sector companies and public services), which is a placebo variablethe IAS officers do not control, should not show such a divergence (Figure 22 top right)33.Since good and bad cadres have different pre-trends, instead of using difference-in-difference,we estimate the impact of the New Mechanism using a structural break empirical strategy.Table 9 shows that the change in linear time trends due to the New Mechanism is Rs. 1336.6crore ($206 million) higher in good cadres relative to bad cadres, with standard error Rs.280.6 crore. The effect on the placebo non-tax revenues, is not significant34. Alternatively,in similar spirit, we can de-trend each cadre by its Old Mechanism years linear trend, andrun a difference-in-difference on the de-trended revenues (see Figure 24)35. This gives uscomparable estimates of Rs. 5330.9 crore ($820 million) lower own tax revenue36 for badcadres relative to good cadres, and insignificant effect on the placebo non-tax revenues (seeTable 11)37.
Furthermore, using the change in mechanism as an instrument for the average quality ofassigned IAS officers to a cadre38, we find that 1 lower exam rank corresponds to Rs. 85.11crore ($13 million) lower own tax revenue (Table 10 second column). Since we exploit theexogenous change in cadre allocation mechanism in this IV approach, our empirical strategyalleviates the simultaneity problem which arises when trying to estimate the effect of examrank on outcome variables.
33The jump in Figure 22 appears because of Maharashtra and Haryana. See Figure 23 for robustnessexcluding these cadres.34See Table 12 for robustness checks excluding Haryana and Maharashtra. All results for non-tax revenueshow up as insignificant regardless of whether you include or exclude either or both states.35The jump in Figure 24 appears because of Maharashtra and Haryana. See Figure 25 for robustnessexcluding these cadres.36The structural break strategy gave a difference in linear trends of Rs 1336.6 crore, which translates toNew Mechanism treatment effect of 1336.6*(1+2+3+4+5)/5= Rs. 4009.8 crore due to 5 (“post-treatment”)years under the New Mechanism.37See Table 12 for robustness checks excluding Haryana and Maharashtra. All results for non-tax revenueshow up as insignificant regardless of whether you include or exclude either or both states.38The first stage is the difference-in-difference in average exam rank across good and bad cadres due to thechange in mechanism we estimate in Table 1.
20 ASHUTOSH THAKUR
Thus, exam rank appears to be indicative of bureaucratic performance39. Our estimateshelp quantify and legitimize the quality dimension as a potentially important dimension totarget global balance across state cadres. Moreover, using this estimate, we can now runback-of-the-envelope calculations for revenues under counterfactual mechanisms and differentaffirmative action policies. For example, from Table 13 we see that the forgone own taxrevenue due to reservation policies in 2015 was around Rs. 9,250 crore ($1.4 billion)40. Toput this in perspective, the total own tax revenue for all these states in 2015 was $118 billion,using exchange rate 65 INR
USD. Similarly, we can quantify the yearly forgone own tax revenue
due to each quota category41: for example in 2015, Rs. 2,290 crore ($352 million) due to STreservation, Rs. 5,128 crore ($789 million) due to SC reservation, and Rs. 1,891 crore ($291million) due to OBC reservation (Tables 14, 15, and 16).
5.2. Impact on Development: Human Development Index. The general responsi-bilities of IAS officers across their many postings, roles, and seniority ranks are threefold:i) maintaining law and order (district magistrate role), ii) revenue administration (districtcollector role), and iii) implement development policy (chief development officer role). InSection 5.1, we emphasized role ii), which is a shared responsibility for all at early stagesin IAS career. Here, we analyze role iii) which was emphasized during the transition fromIndian Civil Services under British rule, to the Indian Administrative Service under inde-pendent India. IAS officers are the implementation arm of the government for many policiessuch Mahatma Gandhi National Rural Employment Guarantee Act (MNREGA), educationpolicies, infrastructure projects, etc. However, development roles are specialized across differ-ent posts and each IAS officer has given different jurisdictions, specializations, and spheresof influence. Hence, although we exploit the same state-level variation as a result of themechanism change in this section, we believe the micro-foundations and causal path for taxrevenue effects found above are better identified. We find that as a result of the new mech-anism, bad cadres have a 0.0488 lower HDI compared to good cadres (Table 17). Since HDIis not calculated on a very regular basis, although the difference and difference specificationseems motivated by convincing parallel trends in Figure 26, we treat this finding with someimportant precaution.
5.3. Impact on Development Outcomes & Bureaucratic Performance using Ex-isting Literature.Bertrand et al. (2015) circumvent incentive problems in internal evaluations by using their
own surveys of local media, businesses, NGOs, politicians and other civil servants to formtheir own measure of perceived bureaucratic effectiveness. They find that exam scores pre-dict perceived bureaucratic effectiveness, so the skewed distribution in entrance exam scoresby cadre resulting from the New Mechanism is troubling in and of itself. Furthermore, theyfind that officers who are older and enter with a large cohort within the assigned state exhibitlower perceived bureaucratic effectiveness. They argue that this is because older candidates
39Existing literature has also established a positive effect of exam rank/score on perceived bureaucraticeffectiveness (Bertrand et al. (2015)) and decreased likelihood of politicized transfers (Iyer and Mani (2012)).40This counterfactual calculation averages exam rank across all candidates, and assumes all N candidatesare filled by the N highest exam scorers rather than by lower affirmative action exam cutoffs for OBC, SC,and ST.41The counterfactual calculation averages exam rank across all candidates, and replaces all Nq candidatesfor each quota category q, with the Nq highest exam scorers who did not qualify due to affirmative actionpolicies.

MATCHING PROBLEM OF CIVIL SERVICE 21
face longer delays for promotions when they are in larger cohorts and given the fixed re-tirement age, might anticipate lower chances of career advancement and exert less effort.We find that with the New Mechanism, bad cadres on average get candidates who are .47years older than those assigned to good cadres (Table 18 column 1)42. This is driven bythe positive correlation between age and exam rank (i.e., older candidates tend to performworse on the entrance exam). Since the New Mechanism assigns lower exam rank candidatesto bad cadres, the externality of assigning older candidates follows indirectly. Moreover, itmust also be noted that the IAS cohort size has consistently increased from 87 vacancies in2005 to 180 vacancies in 2015, so cohort sizes have grown consistently in the recent years.Furthermore, the upper age limits and maximum number of attempts at the UPSC examhave also consistently been relaxed in recent years43. Hence, bad cadres will tend to haveIAS officers with lower perceived bureaucratic effectiveness scores, adversely affecting eco-nomic performance, development outcomes, and local perceptions of bureaucracy by media,business, and politicians.
Iyer and Mani (2015) find that high ability officers (top 20 by exam rank) are transferred2.2 percentage points less frequently after the election of a new chief minister. Given thatthe average increase in the likelihood of transfer following an election turnover is 4.9%, thisis a significant decrease by around 47%44. Figure 27 shows that while the Old Mechanism(in blue 2005-2007) was allocating between 25-30% of top 20 scorers to bad cadres45, theNew Mechanism (in blue 2008-2015) has dropped drastically to near 0%. By simulatingthe counterfactual if the Old Mechanism was continued in years 2008-2013 maintaining theassumption that everyone wants to be an Insider (red line), we see that a much higherpercentage of the 20 highest exam scorers would have been allotted to bad cadres. Hence,the Old Mechanism would lead to a more equitable posting of high ability officers acrosscadres and hence a more equitable distribution (across cadres) of politicized transfers. Onthe other hand, in light of Iyer and Mani (2015), the bad cadres will have IAS officers facingincreased posting variability in a response to political changes.
Bhavnani and Lee (2015) suggest that an increase in the proportion of insiders from themean by one standard deviation (0.27) leads to a 4.6% increase in proportion of villages withhigh schools (i.e., public good provision). Embeddedness has no effect on high schools indistricts where there is low literacy (47% of districts in India have less than 20% literacy)or where there is low newspaper circulation (66% of districts have high enough circulation),hence the capacity for accountability is lacking. For the district with the median number ofvillages, this translates to 1 additional school per year (for mean district would translate toadding 4 schools per year). Moreover, Hjort et al. (2015) find that local language proficiencypredicts higher value-added IAS officers, and local language proficiency correlates positivelywith being an insider. From Figure 28, which shows the difference between insiders requestedand insiders assigned as a percentage of total requests, we see that because the bad cadres
42We use Column 1 estimates which drop the state of Sikkim from the sample, as with just one vacancy peryear, this is a high variance state. Particularly in 2011, Sikkim is allotted a 25-year old which makes it thestate with the lowest average age across all states.43Current eligibility criteria limits ages 21-32 for General Category with a maximum of 6 attempts, ages21-35 with a maximum of 9 attempts for OBC Category, and ages 21-37 with unlimited attempts for SC/STCategory and candidates from Jammu and Kashmir.44To put into perspective, Iyer and Mani (2015) find that the baseline transfer probability for an IAS officerin any given year is 53%.45Around 30% would be natural as 7 out of 24 cadres we have identified as the under-performing bad cadres.

22 ASHUTOSH THAKUR
tend to produce fewer exam toppers, they face a shortage of insiders. Hence, bad cadres mighthave lower public good provision and relatively lower value-added bureaucrats as measuredby worse project outcomes, lower luminosity, and decreased chance of future empanelment.
Ferguson and Hasan (2013) find that training, education, and specialization has careerbenefits both in the short run (promotions to Centre) and the long run (empanelment). The2008 and 2009 batches have weak but negative correlations of -.14 and -.37 between beinga bad cadre and the average number of trainings completed. This might suggest that badcadres are assigned less capable candidates with a lower likelihood for promotion. Or asMani and Iyer (2015) suggest, bad cadres may be assigned candidates who choose to focuson political loyalty rather than skill acquisition for career advancements.
Finally, we see that bad cadres historically (2001-2007) tended to rely more heavily onpromoted state civil servants compared to good cadres: 7.5% more promotees comparedto direct recruits, 8.2% more promotees relative to authorized strength, and 15.6% fewerdirect recruits relative to authorized strength (see Table 19)46. However, in recent yearssince the change in the mechanism, the bad cadres are shifting towards relying more heavilyon direct recruits compared to the good cadres. Across 2008 to 2017, bad cadres use only5.1% fewer direct recruits relative to their authorized strength compared to good cadres andonly 4.9% more promotees. Hjort et al. (2015) find that on average, direct recruits predicthigher value-added, however, a more in-depth analysis must be conducted to compare therelevant tradeoff between using direct and indirect recruits for bad cadres, given that theyare allotted below-average quality direct recruits. Nevertheless, it is imperative that theimbalances caused by the New Mechanism be addressed.
6. Alternative One-Sided Cadre Allocation Mechanisms
6.1. An Approximate Ranking of One-Sided Cadre Allocation Mechanisms.Despite the complicated underlying correlations in the data and the fact that vacancies and
exam toppers change year by year, we can form an approximate ranking of one-sided mech-anisms by analyzing the extent to which they address the correlations in the data (Figure3). The underlying correlations which mechanisms should address are 1) the asymmetric re-gional representation amongst exam toppers, 2) the correlation in preferences of candidates,3) the tendency of quota candidates to have lower exam ranks, and 4) the ability of themechanism to equalize quality over time.
Let us start with the Old Mechanism which addressed many of the correlations in thedata. First, the only input from the candidates is whether or not they were willing to bean insider, hence the correlated preferences across the entire rank order of preferences areavoided. Second, balance in assigned quality across time is guided by the rotating groups andthe 1:24 cycles. Finally, the asymmetry caused by the origin of toppers being concentrated incertain states and quota candidates having lower exam rank causes some imbalance becauseof the priority given to insiders and quota candidates, but this is alleviated by the 1:24 cycles.
If we keep the structure of the Old System but ignore insider-outsider distinctions andquota constraints, we would break even the asymmetries arising from origin of toppers andlower exam rank amongst quota candidates in the Old Mechanism. This portrays howtargeting balance across the embeddedness and quota dimensions is a constraint in thissetting.
46This data is from Appendix I of the 2001-2017 Civil Lists.

MATCHING PROBLEM OF CIVIL SERVICE 23
Figure 3. An approximate ranking of one-sided mechanisms and the extent towhich they address the correlations in the data: origins of toppers, correlatedpreferences, quota candidates having lower exam ranks, and equalizing qualityover time.
On the other hand, if we consider the Old Mechanism without rotating groups acrossyears, the mechanism would not attempt to equalize quality across cadres over time. Therotation of group orders alternates the comparative advantage of being given higher priorityin the 1:24 cycle across 4 years.
Next, if the 1:24 cycles were eliminated, and randomly allocate candidates within quotas(i.e., randomly assign quota candidates to their respective quota seats and then pool remain-ing candidates with non-quota candidates and randomly assign to remaining vacancies). The1:24 cycle imposed structure to prevent bunching on quality in certain cadres. The Randomwithin Quota mechanism allows for such bunching and introduces the possibility of multi-ple lower quality candidates randomly assigned to one cadre, hence the performance on thequota-exam-rank dimension is slightly worse.
Subsequently, if we assign candidates randomly, we can end up with the low ranked quotacandidates being bunched together in certain cadres by chance. In the Random withinQuota mechanism, the low ranked quota candidates were atleast being distributed basedon the roster of vacancies, but now even this leveling control is removed, leading to highervariability amongst average exam rank across cadres.
Now if we go through candidates by exam rank, first assign insiders when there is a corre-sponding insider vacancy in their category, then implement swaps as per the New Mechanism,and finally randomly assign all remaining candidates as outsiders, the mechanism introducesthe correlation coming from the origin of toppers because insiders are given preferential treat-ment and this isn’t compensated for in the mechanism. For example, in the Old Mechanism,when an insider who tended to have high exam rank was allotted to a cadre, the outsiderwould be allotted from the next 1:24 cycle and hence would tend to have a lower examrank. Such a balancing effect is absent from this mechanism. Furthermore, the correlatedpreferences problem could be made worse depending on whether we assume candidates frombad cadres would rather prefer a random outsider assignment relative to a insider positionor not. For simplicity, we have made the conservative assumption in our simulations thatall candidates have their home cadre as their first choice. This is a strong assumption that

24 ASHUTOSH THAKUR
works against the claims we make in this approximate comparison. Finally, random outsiderassignment still allows for bunching of poor exam rank candidates as we had above.
Further tweaking the mechanism to first go through insiders and swaps, and then go byexam rank through preferences of outsiders, we get the New Mechanism. This further intro-duces correlated preferences in the outsiders which we were previously assigning randomly.Moreover, the origin of toppers (and hence their preferences) further skews the distributionbecause assuming preferences are similar geographically, if we have more toppers from thesame cadres at the top, their preferences will be even more correlated.
Finally, we can construct a mechanism where all candidates are simply ranked by examscore and allowed to choose based on their ranked preferences (i.e., serial dictatorship whereorder is exam rank). This makes the correlated preferences problem even worse because nowwe introduce correlated preferences amongst even those who would have opted for insiderpositions in the previous mechanism.
This approximate ranking is reflected in the t-statistic comparisons47 between these sim-ulated alternative mechanisms and the actual assignment data in Figure 29. Moreover, inFigure 30, we see that this approximate ranking is also reflected when we compare per-centage of lower means (Left), lower variances (Right), and both lower mean and variance(Bottom) with alternative mechanisms as compared to actual assignments48. It is impor-tant to note that our maintained assumption when simulating preferences that candidatesrank their home state first causes the All Preference mechanism to perform similarly tothe New Mechanism which prioritizes insiders. Relaxing this strong assumption will furtherexacerbate the performance of the All Preference mechanism.
Although the Old Mechanism with rotation (black with star line) rotates across differentgroup orders of the Old Mechanism without rotations (yellow curves), the gain from the ro-tations becomes evident when we consider the average exam rank of the allotted candidatesfor each cadres across years in our simulations. Across 2007-2013, with rotation the aver-age exam rank across cadres is distributed with mean 95.9 and variance 1419.4. Withoutrotation, the distribution is mean 95.8 and variance 3313.9. Furthermore, if we take theOld Mechanism without insider-outsider or quota restrictions (red with star line), we getdistribution with mean 94.2 and variance 1389.1. Hence, as expected, the rotations in theOld Mechanism work to equalize average exam rank across cadres over time by prioritizingdifferent states in the 1:24 cycles across time.
Lastly, we discuss some general properties of these matching mechanisms. Since the mech-anisms are one-sided, they will generically violate stability to the extent cadres have pref-erences over candidates. So we focus instead on Pareto optimality. We also consider strat-egyproofness of the mechanism to understand if candidates are incentivized to truthfullyreveal their preferences.
Only the All Preferences mechanism is pareto optimal since it is a serial dictatorshipwith order being exam rank. All other mechanisms described above have some random orarbitrary features which could admit pareto improvements given some candidate preferences.
47The t-statistic is defined by t = µactual−µsimulated√σ2actual
24 +σ2simulated
24
, where µactual, µsimulated are the across-cadre aver-
ages of average exam rank of assigned candidates by cadre, and the σ2actual, σ
2simulated are the across-cadre
variances of average exam rank of assigned candidates by cadre.48Note that despite the variance being higher with the Old Mechanism without insider-outsider and quotaconstraints (red with star line), this mechanism causes a drastic improvement in the mean the extent towhich isn’t captured by these figures (see t-statistic comparison in Figure 29 instead).

MATCHING PROBLEM OF CIVIL SERVICE 25
For example, the mechanisms which prioritize insiders first, can lead to pareto-improvingswaps between insiders and outsiders. Or, if there is a surplus of insider candidates relativeto vacancies in a certain quota category, then there might be pareto improving swaps wherethe insider who got the seat swaps with the outsider’s seat. Such pareto improving swapsbetween insider and outsider seats can occur if candidate’s true preferences are such thatthey prefer the insider seat to a random lottery over an outsider seat, but do not rank theirhome state as their first choice. This leads them to report “Yes” when asked whether theywant to be considered for insider seat, despite their home state not being their top choice.
As for strategyproofness, the mechanisms that don’t incorporate preferences of candidatesare trivially strategyproof. The Old Mechanism with or without rotation would theoreticallynot be strategyproof because with perfect information, the candidate would evaluate what hewould get with and without reporting “Yes” on the insider question. However, practically,this requires knowing a lot of information which seems unreasonable. In our preferencesimulations, we assume for simplicity that all candidates’ true first choice is their home statewhich makes the mechanisms strategyproof. In casual conversations with IAS officers, wefind that they often consider the insider question asked in the Old Mechanism as a choicebetween saying “Yes” and potentially getting an insider seat in a state you know beforehandversus saying “No,” which is associated with basically a random assignment given the burdenof information required to know the counterfactual. Hence, a vast majority of candidatesused to respond with “Yes.” The All Preference mechanism is strategyproof as it is a serialdictatorship with order being exam rank. However, the New Mechanism is not strategyproofbecause similar to the Boston Mechanism, there is scope to be strategic by placing yourhome state at the top and being prioritized for an insider position despite your true firstchoice being for another more popular state, because you might not get this popular stateand then have be allotted to a cadre which is must lower in your preference rank. It isimportant to note that restricted to the subset of non-home state cadres, preference orderranking is strategyproof under the New Mechanism, as it is based on a serial dictatorshipby exam rank.
Rather than advocating for a certain mechanism to be implemented, the purpose of thisapproximate ranking is to show incrementally how to get from the Old Mechanism to the NewMechanism, and highlight how certain features of the mechanisms address (or fail to address)the underlying correlations in the data. Moreover, this approximate ranking highlights someimportant trade-offs for the mechanism designer. First, given that preferences are correlated,the market designer must decide how much weight to give to candidates’ preferences. Themore weight the mechanism assigns, the more lopsided allocations will tend to be. Forexample, the Old Mechanism pays minimal heed to candidates’ preferences while the NewSystem takes preferences very seriously. Second, given the concentration of exam toppersfrom certain states, the designer must consider the priority given to insider positions in lightof the fact that certain states, like the bad cadres, will not be able to fill insider vacancies.The comparison between Completely Random mechanism and the Insiders 1st, OutsidersRandom Mechanism shows this difference most starkly. Just by allocating insiders first beforerandomly assigning outsiders, there is a drop in the performance of assigning uniform quality.Finally, given that quota candidates tend to have lower exam rank, the designer must balancethe distribution of quota candidates. As we see with the Random with Quota and CompletelyRandom mechanisms, the cadre’s vacancies for quotas can actually beneficial in discipliningthe mechanism to uniformly distribute quota candidates. Nevertheless, when comparing the

26 ASHUTOSH THAKUR
Old Mechanism with the Old Mechanism without insider and quota constraints, we see thatthe performance can sometimes be improved by relaxing quota priorities.
6.2. Grouped Cadres.The choice of certain states to be represented as a unified group (“joint cadre”) provides
some interesting case studies. In most instances, the grouping (or the lack thereof) seemsarbitrary, yet it is a result of complex legislation arising from intricate political compromises:
(1) The Northeastern Areas Reorganization Act of 1972 created three separate statesin the northeast: Meghalaya, Manipur, and Tripura. Manipur and Tripura werecombined to form a joint cadre, which lasted until 2014, after which each state hasbeen represented individually as a distinct cadre.
(2) Meghalaya was carved out of the existing state of Assam in 1972, but the two statesare represented as the joint cadre Assam-Meghalaya.
(3) The Northeastern Areas Reorganization Act of 1972 also added Arunachal Pradeshand Mizoram to the AGMUT cadre, which also consisted of seven other Union terri-tories (Delhi, Chandigarh, Andaman and Nicobar Island, Lakshadweep, Goa, Damanand Diu, and Dadra and Haveli). Hence, the AGMUT cadre is a strange conglom-erate composed of some (but not all) states from the northeastern bloc, the capitalcity, an ex-Portuguese colony, and some coastal towns and islands. Each of theseterritories was liberated and had obtained statehood at different times.
(4) On the other hand, recently formed new states are individually represented as distinctcadres. In 2000, in an attempt to break large states in central India, Chhattisgarhwas carved out of Madhya Pradesh, Jharkhand from Bihar, and Uttarakhand fromUttar Pradesh. Furthermore, in 2014, Telangana separated from Andhra Pradeshdue to internal movements calling for separation.
From the matching theory perspective, these groupings produce certain asymmetries andcross subsidizations:
Firstly, we see in Figure 32 how the exam toppers tend to originate predominantly fromcertain states/territories in each of these joint cadres. From 2005-2015, 74% of AGMUTtoppers were from Delhi, 73% of Assam-Meghalaya toppers were from Assam, and 87% ofManipur-Tripura toppers were from Manipur. On the flip side, in Figure 33, we see therelatively large asymmetries in toppers from the new states (Uttarakhand, Jharkhand, andChhattisgarh) relative to their counterparts (Uttar Pradesh, Bihar, and Madhya Pradesh).It turns out that the ratio of toppers (i.e., potential insiders) relative to vacancies for agiven cadre is an important determinant of average exam rank (due to the preference forbeing an insider). The low ratio in Chhattisgarh (22%) might partly explain why thatnew state does particularly worse compared to other new states like Jharkhand (71%) andUttarakhand (52%) (Table 20). Given the 2:1 targeted ratio of outsiders to insiders, 33% isa conservative benchmark below which the cadre will most certainly not be capable of fillinginsider vacancies.
Secondly, there are cross-subsidizations in quality as well, where candidates from motherstates have lower average exam ranks than new states (Figure 33). Similarly, patterns arisewith Delhi and Chandigarh in AGMUT and Assam in Assam-Meghalaya (Figure 34).
Finally, we see the impact of the splitting joint cadres with the Manipur-Tripura break-down and the separation of Telangana from Andhra Pradesh in 2014 (Figure 5). It isimportant for the grouped cadres to have poorly performing state(s) to be bolstered via
MATCHING PROBLEM OF CIVIL SERVICE 27
cross-subsidization by a relatively high performing state. Manipur and Tripura are bothrelatively poor performing states and hence their grouping into a joint cadre doesn’t pro-vide much gain. On the other hand, Andhra Pradesh is a high performing state and theTelangana region lost drastically in terms of quality of bureaucrats when it separated.
Thus as a policy recommendation, it can be beneficial from a central planner’s perspec-tive, to group poor performing states (i.e., bad cadre) with high performing states (i.e., goodcadres) and have the poor performing states benefit from cross-subsidization with more in-siders of a higher quality. However, grouping multiple poor performers together is oftentimes not beneficial for any of the states. From both a social welfare and matching perspec-tive, there may be certain natural groupings like the combining new states with their motherstates; however, whether or not certain groupings would be politically viable is beyond thescope of this paper. Finally, it is imperative that such decisions of creating joint cadresbe made after careful statistical simulations, because grouping cadres and expanding theirpool of insider candidates can adversely impact other cadres who now have a small pool ofoutsiders.
6.3. Nudging Candidates’ Preferences.As we have shown above, many global imbalances arise due to candidates having correlated
preferences over cadres and a seemingly shared consensus over which cadres are good andwhich are bad. Should the government deem it fit, these preferences can be nudged eitherexplicitly or implicitly.
The government can explicitly mandate restrictions over how candidates are allowed toorder their preferences over state cadres. For example, if candidates are forced to includeat least 1 of the bad cadres in every 3 choices, this correlation can be broken. We show inFigure 31 how such reservations can help improve uniformity in exam ranks. The reserve-3green curve represents running a mechanism where candidates state their preferences and themechanism runs through candidates in order of exam ranks and matches based on availablevacancies. We see that such a preference restriction policy—though not as good in terms ofbalance as the simulated Old Mechanism or mechanism assuming uncorrelated preference—is a significant improvement over simulations assuming block preferences (randomly orderedblock of good cadres followed by randomly ordered block of bad cadres), close-distancepreferences (distance from home state), and the New Mechanism49.
On the other hand, implicit nudges can be structured in various ways. Firstly, IAS officersworking in distressed areas can be compensated with an income bonus, better facilities, andincreased perks50. This will not only attract insiders from bad cadres to stay in their homestate, but also attract outsiders to rank distressed cadres higher in their preference lists.Secondly, the attractiveness of bad cadres can be uplifted by enhancing career opportunities.For example, the center can allow a higher proportion of officers to be eligible for deputation,or seniority restrictions for promotions and empanelment can be relaxed relative to goodcadres so that career advancement is quicker in bad cadres. Lastly, to address the paucity oftoppers from bad cadres, the government can establish civil service training centers, reserved
49In all these simulations we assume that the candidates rank their home state (insider state) as their toppreference, and the rest of the preferences are adjusted accordingly.50See Dal Bo, et al. (2012) for the effects of increasing wages for bureaucrats in Mexico on quality ofapplicants. See Agarwal (2017) for estimating effects of wage increases at rural hospitals on willingness tomatch to rural hospitals, resident quality, and unfilled rural hospital vacancies.
28 ASHUTOSH THAKUR
seats51, or relaxed qualification requirements for candidates from bad cadres52. It is debatablewhether such moves are politically feasible, but our purpose is simply to illustrate variouspoints of attack to alleviate the distributional asymmetries prevalent in the system.
7. Two-Sided Cadre Allocation Mechanisms
Duties of the IAS include a) maintaining law and order (serving as the executive magis-trate), b) revenue administration (collection of revenue, acting as courts in revenue matters,and supervising expenditure of public funds), and c) general administration (serving devel-opment officers, implementing policies, and formulating policies). Their positions can rangefrom being in charge of animal husbandry and agricultural policy (where scientific and tech-nical understanding might be useful), managing land revenue and district administration(where commerce or finance degrees might come in handy), working with NGOs and gov-ernment programs to administer rural development projects (where policy or governmentschool degrees can be beneficial), working closely with tribal areas (where history, politics,and cultural knowledge might be imperative), to setting higher education policy and humanresource management (where science and engineering degrees might be useful). In fact, thegovernment labels different posts by their specializations such as Youth Affairs and Sports,Land Revenue Administration and District Management, Finance, Transport, Tribal Wel-fare, Social Justice and Empowerment, to name a few. Clearly, increasing specialization inthese areas of management and administration suggests that matching IAS officers to postsbased on their education, work experience, and technical training might be useful.
The IAS was based on the British system of Indian Civil Services from the colonial era.This system was based on a generalist philosophy: an IAS officer is a bureaucrat who regard-less of his educational background, work experience, and skills, should be able to effectivelythrive in any post. However, the empirical literature on bureaucratic performance says oth-erwise. Ferguson and Hasan (2013) show that specialization and skill acquisition is beneficialfor IAS officer’s career trajectory throughout his or her career. Early on in the career, spe-cialization signals general ability and helps promotion to the Centre posting, and later onin the career, specialization boosts likelihood of empanelment where the posting is likely tomatch the field of specialization. Hjort et al. (2015) find that education and local languageproficiency predict high value-added officers. Hence, education, specialization, and beingable to speak the local language seem to predict bureaucratic success both in terms of higherlikelihood of promotion and better outcome performance.
IAS officers have diverse education backgrounds ranging from medical doctors and MBAsto engineers and economics PhDs. Thus, it seems like there is value added from having cadresexpress preferences over candidates based on the skills their vacancies require. Furthermore,there are many languages spoken across India, but often concentrated within states. In fact,state boundaries in India were defined by the prevalent language spoken in the region. Hencecadres might have preferences over candidates based on their mother tongues and languagesspoken. By incorporating cadre preferences over candidates, the matching becomes two-sided.
51For example, in the Pakistan Administrative Service, recruitment via civil service examination is doneusing provincial quotas to ensure regional representation balance in the civil service.52For example currently, candidates from Jammu and Kashmir have a relaxed age limit of 37 (same as SC/STcategory candidates) and are allowed unlimited attempts at the Civil Services Examination.

MATCHING PROBLEM OF CIVIL SERVICE 29
Although we believe that matching based on education, skill, and specialization is a firstorder concern, to minimize our set of assumptions in our two-sided matching simulationexercise, we focus here on local language proficiency. We use the 2001 Census data asreported in the 50th Report of Commission for Linguistic Minorities in India (2013), whichdocuments the most commonly spoken languages by state. We assume cadre preferencesover candidates are lexicographic with first dimension being mother tongue matching locallanguage spoken (in order of popularity) and second dimension being exam rank. In reality,we expect that cadre preferences will be weighting many variables: exam rank, education,age, local language proficiency, and work experience. Our simulated preferences are meantto be a crude algorithmic approximation of the cadre’s preferences over candidates, focusingjust on the language dimension.
In Figure 35, we run the Gale-Shapley Deferred Acceptance mechanisms with candidatesproposing (Right) and cadres proposing (Left) without paying heed to quota or insider-outsider constraints. We vary the simulation assumptions on candidate’s preferences: (1)“Block:” want to be insider, followed by random within block of good cadres, followed byrandom with block of bad cadres. (2) “Res3:” same as Block, but force every 3rd choiceto be from bad cadre group. (3) “Uncorr:” want to be insider, followed by uncorrelatedpreferences over remaining cadres. (4) “Close:” cadres in order of closest distance fromhome state’s capital city. The t-statistic comparisons indicate that such two-sided matchingproduces outcomes that lie mostly between the Old and New Mechanisms in terms of qualitydistribution imbalances. Moreover, the cadre-proposing mechanism produces a narrowerrange of t-statistics across the various assumptions for candidate preferences. On the otherhand, with candidate-proposing mechanism, the Uncorr and Res 3 preferences for the mostpart dominate the Block and Close preferences as for quality distribution imbalance.
These allocations possess the usual Deferred Acceptance properties: candidate-proposingis the candidate-optimal stable matching and is strategyproof for candidates, while cadre-proposing side is the cadre-optimal stable matching and strategyproof for cadres. Despitetruncation of preferences (i.e., a cadre declaring that a candidate is unacceptable or a can-didate declaring that a cadre is unacceptable) being prohibited by design53, the candidate-proposing mechanism is non-strategyproof for cadres and cadre-proposing mechanism is non-strategyproof for candidates. We see in Figure 36 that which side proposes affects the per-formance in terms of average rank in preference of allotted match. However, this distinctionis larger for candidates than for cadres as candidates have more correlated preferences.
Although these stylized simulations are based on algorithmic assumptions over cadre pref-erences, they serve as a benchmark to suggest that introducing two-sided matching overdimensions like language performs better than the New Mechanism (but slightly worse thanthe Old Mechanism) in terms of quality uniformity. Importantly, the upside from matchingmore bureaucrats with local language proficiency can be large.
7.1. Implementation of Reservations via Soft Constraints.The two-sided simulations so far have ignored all constraints. In the IAS setting, we never
have unfilled vacancies by design because the market is balanced (i.e., UPSC sets examrank cutoffs to ensure there are exactly as many candidates as there are vacancies) andbecause there are no matches which candidates or cadres can deem to be unacceptable (i.e.,truncation of preferences is ruled out). Hence, we can ignore concerns such as regional
53Truncated preferences are assumed to indicate indifference over unranked cadres. Hence, no match can bedeclared unacceptable.

30 ASHUTOSH THAKUR
balance constraints and Rural Hospital problem. Instead, we are faced with incorporatingthe reservations for quota candidates and insider candidates. Incorporating affirmative actionpolicies in matching markets is an active area of research (see Section 3). Since candidatesbelonging to SC, ST, and OBC categories can qualify under the General merit cutoff iftheir exam rank is high enough, each quota category has weakly more candidates thanvacancies. In our data from 2005-2014, there are always strictly more OBC candidatesthan OBC vacancies, weakly more SC/ST than SC/ST vacancies, and hence strictly lessGeneral candidates than vacancies. However, because there is concentration and asymmetricrepresentation in which states produce exam toppers, across all years, there are fewer insidersallotted compared to insider vacancies.
This structure on the inputs—initial rosters of vacancies and candidates — implies thatimplementation with hard constraints will necessarily be wasteful. Moreover, Kojima (2012)shows how hard constraints such as upper-bounds on non-affirmative action seats suggestedby Abdulkadiroglu and Sonmez (2003), can make affirmative action candidates worse off.Thus, instead of using hard constraints, we use the literature initiated by Hafalir et al.(2013) on implementing quotas with soft constraints: setting reserves for quota candidates,where until the reserve is filled in each state, quota candidates are given priority over non-quota candidates.
We implement our reservation policies using Deferred Acceptance with soft constraints.Each cadre’s preference is assumed to be lexicographic in language by popularity and examrank and the cadre’s preference is cloned to represent each vacancy in the cadre. Then,as per the count specified in roster of vacancies, certain seats are deemed priority seats forwhich the cadre preferences are updated to reflect the priority: all candidates who meetthe reservation category are moved to the top of the list while maintaining the order of thecadre’s preferences. This implements the soft constraint: the reserve for reservation seats isreflected in the priority seats, and the soft constraint is implied by these seats first givingpriority to reservation candidates at the top of their artificial preferences, followed by theirpreferences over the remaining non-reservation candidates. Hence, no candidate is deemedunacceptable for reservation reasons and this ensures a non-wasteful match.
First we allow reservation only for insiders (Figures 37 and 38), then we allow reservationonly for quotas SC/ST category and OBC category (Figures 39 and 40), and finally we allowreservation by quota x insider (Figures 41 and 42). The candidate’s preferences over clonedvacancies of cadres, which were arbitrarily ordered previously as it did not affect the alloca-tion, can now be used to further promote reservation categories54. By making all candidatesapply first to the non-reserved seats and then to the reserved seats, we allow for the possi-bility that some reservation candidates qualify for non-reservation seats, leading to weaklyless competition for the remaining reservation candidates for their reservation category’s pri-ority seats. Hence, when imposing reservations for insiders, we make all candidates prefernon-priority seats before insider-priority seats. When imposing reservations for SC/ST andOBC, we make all candidates prefer non-priority seats, followed by OBC priority seats, andthen SC/ST priority seats. Similarly, when imposing quota x insider reservations, all candi-dates prefer outsider seats to insider seats, and within each group, prefer General, OBC, andthen SC/ST. The effect of this can be seen in Figures 40 and 42, where SC candidates tendto get more preferred cadres, OBC candidates perform slightly worse, and comparatively,
54We thank Ignacio Rios for sharing this insight from his work in progress.

MATCHING PROBLEM OF CIVIL SERVICE 31
General candidates perform the worst on average. This ordering of priorities is an importantmechanism feature for the designer to target which groups to make relatively better off.
These matchings will be stable under justified envy: no blocking pairs once candidatesand cadres take into account the ordering of priorities set for the reservation seats by themechanism designer. We need to weaken the standard notion of stability to accommodatetwo-sided matching with constraints, and because we have overlapping dimensions in ourreservation dimensions, we need the roster of vacancies to specify vacancies for each particulargroup: (embeddedness x quota). Justified envy is imperative to ignore envy for vacancies inwhich the candidate has a lower priority. The roster of vacancies by embeddedness x quotais crucial for stability, otherwise, candidates who qualify for multiple reservation types (forexample, insider and OBC), can be allotted to priority seat in one dimension (say insider),but be envious of priority seat in the other dimension (OBC priority seat).
7.2. Impact of Correlation in Candidate’s Preferences.We observe some patterns when we consider the average preference rank for the match
from the perspective of the candidates and the cadres (Figures 36, 38, 40, and 42)55. Firstly,similar to simulations in Celik (2014), the more correlated candidate’s preferences are, theworse off they are, particularly when they propose, as increased competition amongst candi-dates for highly sought-after positions leads to a lot of rejections56. Secondly, relative to thecandidates, cadres are less responsive to both which side proposes in Deferred Acceptanceand how correlated candidates’ preferences are because cadre preferences are relatively lesscorrelated57. One source of correlation in cadre’s preferences over candidates arises becausemany states, especially in the north, rank Hindi amongst the most commonly spoken lan-guages. Thus candidates who speak Hindi as their mother tongue, tend to be higher up inmany states’ rank order preferences. We expect that if we consider preferences by expertise,cadre’s preferences over candidates might be even less correlated. However, if states care justabout exam ranks of the candidates, then cadre preferences are perfectly correlated with allstates having the same ranking over candidates.
The correlation in preferences is also consequential for the uniformity in average preferencerank for the match across cadres. In Figure 43, we see that when candidates have correlatedpreferences (block preferences in black and closeness preferences in red), the variance of aver-age preference rank for the match across cadres is higher than when candidates’ preferencesare less correlated (Uncorrelated in blue and Res3 in green). Furthermore, when candidates’preferences are correlated, the variance tends to be lower with candidates proposing (dashedred and black lines). On the other hand, when candidates’ preferences are relatively lesscorrelated, the variance tends to be lower with cadres proposing (solid blue and green lines).Thus, it seems that from the standpoint of promoting uniformity in welfare across cadres,which side should propose in the Deferred Acceptance mechanism should depend on therelative correlation of the preferences of the two sides. Based on our simulation results,we conjecture that it is better for the more correlated side to propose and have the less
55It is important to realize that in all these graphs, we take averages across cadres, hence sometimes it mayappear as though cadres are better off with candidates proposing, but this is only because of the averagingover varying intensities of improvements. Deferred Acceptance produces the optimal stable matching for theproposing side; we graph aggregates for simplicity.56See Knuth (1997) and Caldarelli and Copocci (2001) for comments and simulations regarding DeferredAcceptance with correlated preferences.57Such statements on welfare are made strictly from an ordinal (and not cardinal) utility standpoint.

32 ASHUTOSH THAKUR
correlated side break ties to prevent bunching and alleviate imbalance. Formalizing relativecorrelations across the sides of the market and why this probabilistically performs betterthan having the less correlated side propose and have the more correlated side break ties isan interesting question to pursue in future research58.
Such an emphasis on correlation of preferences arises in this political economy applica-tion, because the mechanism designer—the Indian central government—has global unifor-mity considerations across cadres. In most matching applications such as school choice, theunderlying preferences are taken as given and market-driven allocations aren’t restrainedwith cross-group equalizing constraints such as constraints on making the schools equallycontent with their allotted students or imposing that all schools be of a comparable studentquality.
7.3. Impact of Cadres Reporting Vacancies & UPSC Choosing Candidates.So far, we have taken two inputs as given: the list of vacancies formed by the cadres and
the list of candidates narrowed down by the UPSC for the IAS. In this section, we considerthe consequences of these input choices.
The UPSC rules target the 1:2 ratio of insiders to outsiders and Indian law on affirmativeaction mandates 15% seats reserved for SC, 7.5% for ST, and 27% for OBC. Within theseconstraints, how exactly state cadres form their final roster of vacancies is not clear, but maybe potentially consequential. In the Old and New Mechanisms, swaps ensure that shiftingvacancies amongst insider categories has no effect if the number of candidates willing to beinsiders are at most the total number of insider vacancies because swaps give all insiders achance. In the Old Mechanism, swaps also require outsider vacancy in the quota categorybeing swapped in to facilitate the exchange. If there are more candidates willing to be insidersthen there are insider vacancies overall, who is allocated to their home cadre depends onwhich quota category is given more vacancies. Similar effects occur in two-sided matchingwith soft constraints. For example, shifting vacancies from General insider to SC/ST insiderand OBC insider will lead to better performance on both the insider and the quota dimensionif the cadre has more General insider vacancies than it does candidates and it has moreOBC, SC, and ST insider candidates than it has vacancies59. However, to the extent SC,ST, and OBC candidates tend to have lower exam ranks, this will affect quality of assignedcandidates. Hence, by shifting vacancies within a state, the quality of assigned candidatesand the distribution of quality across cadres changes, and states can prioritize certain quotagroups in getting in by increasing the number of vacancies in that insider quota group.However, this power can be misused. For example, there have been allegations during the OldMechanism years (1984-2007)— when cadres reported their vacancies after seeing the final listof candidates— that vacancies were strategically tampered with to favor certain candidates.From 2008 onwards with the New Mechanism, cadre vacancies are made available prior tothe list of candidates, so this point of contention has become moot. Adjusting vacanciesex-post may be construed as unfair, but from a matching theory perspective, it is importantto bring to attention.
58The probabilistic claim in the extreme case of a market with one side having perfectly correlated preferences(such as all cadres having preferences over candidates in order of exam rank) and other side having completelyuncorrelated preferences is intuitive. We expect, this intuition generalizes to non-extreme cases of relativecorrelations.59In the Old Mechanism, swaps require corresponding outsider vacancies in the quota category.

MATCHING PROBLEM OF CIVIL SERVICE 33
In constructing the final list of qualified candidates to match the number of vacancies, theUPSC has chosen to prioritize exam rank and quota, and not embeddedness (i.e., insiders).From the overall list of exam toppers, those who opt for the IAS are separated out. Next,based on total vacancies by quota type, the UPSC determines exam rank cutoffs for ST,SC, OBC, and General categories60. There are always weakly more SC, ST, and OBCcandidates then there are vacancies, because quota candidates who qualify under the Generalcategory count against the General category and not the quota category. However, there isno attempt made to meet insider vacancies. Hence, the shortcoming faced by bad cadres inplacing insiders can be relaxed at the cost of lower exam ranks, if the UPSC goes furtherdown the exam rank of candidates to get toppers from home states which aren’t representedin the current lists. In light of Bhavnani and Lee (2016), Vaishnav and Khosla (2016)have suggested experimenting with increasing the proportion of insiders. If such policyrecommendations are to be taken seriously, the roster of candidates must be adjusted toovercome these asymmetries in how candidates from different cadres perform. In otherwords, the cost of making the insider constraints hard, is admitting candidates with lowerexam rank.
8. Extensions to Other Civil Services & Matching Applications
Our analysis can be immediately extended to the other two All-India Services—IndianPolice Service (IPS) and Indian Forest Service (IFoS)— which share the same mechanismswe analyzed above. Although data availability is scarce, we show in Appendix C thatanalogous imbalances on the quality dimension with the New Mechanism arise in the IPSand IFoS (see Figure 46). Moreover, for years 2008 for IPS and 2015 for IFoS, for which wehave preference rank order data, we highlight the correlation in preferences where bad cadresare consistently ranked very low by most civil servants (see Tables 21 and 23). This datafurther corroborates our assumptions of a near unanimous preference for being an insider(i.e., first choice as home cadre) and shows that a vast majority over 90% of candidates givecomplete rank order preferences (see Table 22).
The relevance of applying matching theory to study and design allocation of civil ser-vants and bureaucrats is more general than just the Indian problem analyzed in this paper.Mandarin bureaucracies where competitive examinations are used to rank and select top per-formers are prevalent globally in countries including the US, China, Brazil, and France, andthus the accompanying concerns of quality balance naturally arise. Furthermore, affirma-tive action policies and regional representation are also universal concerns in bureaucraciesaround the world. The various systems of recruiting and allocating civil servants used aroundthe world can be classified into four categories: 1) application to a particular service andpost (i.e., Chinese bureaucracy), 2) appointment to a particular service and post (i.e., USPresident appoints and Congress must approve senior civil servants for government agencies),3) centralized, synchronous assignment of many bureaucrats to posts (i.e., annual cadre al-location of IAS officers), and 4) centralized, dynamic assignment of civil servants (i.e., USForeign Service where transfers and promotions are made dynamically as openings arrive).The first two categories are more aligned with decentralized, labor market models involvingsearch. Matching theory, along the lines of school choice or residency matching, plays a keyrole in centralized, synchronous assignment as we see in this paper. Finally, matching theory
60There are also various other special considerations for disabled candidates which we omit in this proceduraloverview.
34 ASHUTOSH THAKUR
similar to the dynamic kidney exchange markets, can be used to address the fourth categoryof civil service allocation systems. This is a promising avenue for future research.
Lastly, the novel constraint for quality balance that we identify in this paper, is moregeneral than just the bureaucracy application. For example, matching problems in themilitary may require uniformity of talent across various battalions or divisions61, and inmatching public school teachers to schools, the government may want to make differentschools and school districts roughly comparable in teacher quality62. Understanding suchconstraints and designing mechanisms to address the underlying correlations in the data isalso a promising area for future work.
9. Conclusion
We believe that approaching certain assignment problems in political economy from amatching theory framework can be a productive enterprise. In this paper, we study theimpact of various matching mechanisms for the initial assignment of top-level Indian civilservants to state cadres. As a central planner and a mechanism designer with a social welfarefunction, the government often wants to impose constraints, such as uniformity of qualityacross state cadres along with balance on overlapping dimensions like quota and embedded-ness, the likes of which don’t necessarily arise in canonical, more market-driven matchingor market design applications. Such constraints can highlight the importance of underlyingcorrelations in preferences and hidden correlations amongst covariates (such as exam rank,state of origin, quota, education, age, and language proficiency) which are generally takenas given in most matching applications. However, systematic imbalances—such as thoseresulting from the New Mechanism—further exacerbated by these correlations in covariates,can be detrimental to outcomes, in this instance developmental outcomes and bureaucraticperformance. Particularly, we highlight how the change in mechanism has adversely affecteduniformity of state capacity by causing imbalances in tax revenue collection across states. Toillustrate how certain mechanism characteristics address (or fail to address) such imbalancesand correlations, we derive an approximate ranking of mechanisms and analyze policy inter-ventions, such as grouping cadres and nudging candidate preferences. Moreover, we suggestthat an increasing need for domain-specific knowledge and local language proficiency giventhat over 50 languages are spoken in India, might necessitate two-sided matching mecha-nisms where cadres’ preferences over candidates are also incorporated. In this paper, wehave highlighted the trade-offs associated with various mechanism features and policies inaddressing the imbalances and correlations in the data; but ultimately, it is up to the Indiancentral government to decide how to resolve these trade-offs and optimize given their desiredweights on the constraints and outcomes.
References
[1] Abdulkadiroglu, Atila. “College admissions with affirmative action.” International Journal of GameTheory 33.4 (2005): 535-549.
61For example, the Indian Army has explicit constraints in the Indian Army Choice of Arms Procedure,to ensure an equitable caliber spread (referring to merit rank), along with other balance constraints of ageprofile, type of entry, and regional distribution across the various arms and services.62For example, Sonmez (2013) studies the matching of cadets to various divisions of the military. Matchingmechanisms to assign teachers to schools have been used in countries like France (Terrier (2014)).
MATCHING PROBLEM OF CIVIL SERVICE 35
[2] Abdulkadiroglu, Atila, Parag A. Pathak, and Alvin E. Roth. “Strategy-proofness versus efficiency inmatching with indifferences: Redesigning the NYC high school match.” American Economic Review99.5 (2009): 1954-1978.
[3] Abdulkadiroglu, Atila, and Tayfun Snmez. “School choice: A mechanism design approach.” AmericanEconomic Review 93.3 (2003): 729-747.
[4] Agarwal, Nikhil. “Policy analysis in matching markets.” American Economic Review 107.5 (2017): 246-50.
[5] Bandiera, Oriana, and Florian Blum. “State effectiveness, growth, and development.” (2014).[6] Benbabaali, Dalal. “Questioning the role of the Indian administrative service in national integration.”
South Asia Multidisciplinary Academic Journal (2008).[7] Bendor, Jonathan, and Adam Meirowitz. “Spatial models of delegation.” American Political Science
Review 98.2 (2004): 293-310.[8] Bertrand, Marianne, Robin Burgess, Arunish Chawla, and Guo Xu. “Determinants and consequences
of bureaucrat effectiveness: Evidence from the indian administrative service. ” Working paper, 2015.[9] Bhavnani, Rikhil R. and Alexander Lee “Local Embeddedness and Bureaucratic Performance: Evidence
from India.” Journal of Politics (2016)[10] Caldarelli, Guido, and Andrea Capocci. “Beauty and distance in the stable marriage problem.” Physica
A: Statistical Mechanics and its Applications 300.1 (2001): 325-331.[11] Celik, Onur Burak. “Essays on Matching Markets with Correlated Preferences.” (2009).[12] Civil List, Indian Administrative Service (2001-2016) Department of Personnel and Training and Min-
istry of Personnel, Public Grievances, and Pensions (Government of India)[13] ”Civil List.” Indian Administrative Service Accessed August 1, 2017.
http://civillist.ias.nic.in/IndexCL.htm[14] ”CSE Candidates’ Information Central.” CSE Candidates’ Information Central. Accessed February 1,
2017. http://persmin.gov.in/AIS1/QryCA.asp.[15] Dal Bo, Ernesto, Frederico Finan, and Martin A. Rossi. “Strengthening state capabilities: The role of
financial incentives in the call to public service.” Quarterly Journal of Economics 128.3 (2013): 1169-1218.
[16] Delacretaz, David, Scott Duke Kominers, and Alexander Teytelboym. “Refugee resettlement.” WorkingPaper (2016).
[17] Dur, Umut, Parag A. Pathak, and Tayfun Snmez. “Explicit vs. Statistical Preferential Treatment inAffirmative Action: Theory and Evidence from Chicago’s Exam Schools.” No. w22109. National Bureauof Economic Research, 2016.
[18] Echenique, Federico, and M. Bumin Yenmez. “How to control controlled school choice.” AmericanEconomic Review 105.8 (2015): 2679-2694.
[19] Ehlers, Lars, et al. “School choice with controlled choice constraints: Hard bounds versus soft bounds.”Journal of Economic Theory 153 (2014): 648-683.
[20] Ergin, Haluk, and Tayfun Snmez. “Games of school choice under the Boston mechanism.” Journal ofPublic Economics 90.1 (2006): 215-237.
[21] Epstein, David, and Sharyn O’Halloran. “Delegating powers: A transaction cost politics approach topolicy making under separate powers.” Cambridge University Press, 1999.
[22] ”Executive Record Sheets of IAS.” Supremo: Single User Platform Related to Employees Online. Ac-cessed February 1, 2017. https://supremo.nic.in/knowyourofficerIAs.aspx
[23] Ferguson, John-Paul, and Sharique Hasan. IAS Executive Sheets 1984 - 2007 Data (2013)[24] Ferguson, John-Paul, and Sharique Hasan. “Specialization and career dynamics: Evidence from the
Indian Administrative Service.” Administrative Science Quarterly 58.2 (2013): 233-256.[25] Finan, F., B. A. Olken, and R. Pande. “The Personnel Economics of the Developing State.” Handbook
of Economic Field Experiments 2 (2017): 467-514.[26] Gailmard, Sean, and John W. Patty. “Formal models of bureaucracy.” Annual Review of Political
Science 15 (2012): 353-377.[27] Gulzar, Saad, and Benjamin J. Pasquale. “Politicians, bureaucrats, and development: Evidence from
India.” American Political Science Review 111.1 (2017): 162-183.[28] Hafalir, Isa E., M. Bumin Yenmez, and Muhammed A. Yildirim. “Effective affirmative action in school
choice.” Theoretical Economics 8.2 (2013): 325-363.

36 ASHUTOSH THAKUR
[29] Hjort, Jonas, Moya Chin, Gautam Rao, and Elizabeth Santorella. “Bureaucrat Value Added: The Effectof Individual Bureaucrats on Local Economic Outcomes in India.” Working Paper (2015)
[30] Huber, John D., and Charles R. Shipan. “Politics, Delegation, and Bureaucracy.” The Oxford Handbookof Political Science 4 (2011): 256.
[31] Huber, John D., and Nolan McCarty. “Bureaucratic capacity, delegation, and political reform.” Amer-ican Political Science Review 98.3 (2004): 481-494.
[32] Iyer, Lakshmi, and Anandi Mani. “Traveling agents: political change and bureaucratic turnover inIndia.” Review of Economics and Statistics 94.3 (2012): 723-739.
[33] Kamada, Yuichiro, and Fuhito Kojima. “Efficient matching under distributional constraints: Theoryand applications.” American Economic Review 105.1 (2014): 67-99.
[34] Kamada, Yuichiro, and Fuhito Kojima. ”Stability concepts in matching under distributional con-straints.” Journal of Economic Theory 168 (2017): 107-142.
[35] Knott, Jack H., and Gary J. Miller. ”Reforming bureaucracy: The politics of institutional choice.”Prentice Hall, 1987.
[36] Knuth, Donald Ervin. “Stable marriage and its relation to other combinatorial problems: An introduc-tion to the mathematical analysis of algorithms.” Vol. 10. American Mathematical Soc., 1997.
[37] Kojima, Fuhito. “School choice: Impossibilities for affirmative action.” Games and Economic Behavior75.2 (2012): 685-693.
[38] Kurata, R., Naoto Hamada, Atsushi Iwasaki, and Makoto Yokoo. “Controlled school choice with softbounds and overlapping types.” Journal of Artificial Intelligence Research 58 (2017): 153-184.
[39] McCubbins, Mathew D., Roger G. Noll, and Barry R. Weingast. “Administrative procedures as instru-ments of political control.” Journal of Law, Economics, and Organization 3.2 (1987): 243-277.
[40] McCubbins, Mathew D., Roger G. Noll, and Barry R. Weingast. “Structure and process, politics andpolicy: Administrative arrangements and the political control of agencies.” Virginia Law Review (1989):431-482.
[41] Moe, Terry M. “Delegation, control, and the study of public bureaucracy.” The Forum. Vol. 10. No. 2.2012.
[42] Moe, Terry M. “The new economics of organization.” American journal of political science (1984):739-777.
[43] Moe, Terry M. “The politics of bureaucratic structure.” Can the government govern 267 (1989): 271.[44] Moe, Terry M. “Toward a Theory of Public Bureaucracy.” Organization theory: From Chester Barnard
to the present and beyond (1995): 116.[45] Nath, Anusha. “Bureaucrats and Politicians: How Does Electoral Competition Affect Bureaucratic
Performance?” Institute for Economic Development (IED) Working Paper 269 (2015).[46] Rogger, Daniel. “Who serves the poor? surveying civil servants in the developing world.” (2017).[47] Roth, Alvin E. “A natural experiment in the organization of entry-level labor markets: regional markets
for new physicians and surgeons in the United Kingdom.” American Economic Review (1991): 415-440.[48] Roth, Alvin E. “On the allocation of residents to rural hospitals: a general property of two-sided
matching markets.” Econometrica (1986): 425-427.[49] Roth, Alvin E. “The evolution of the labor market for medical interns and residents: a case study in
game theory.” Journal of Political Economy 92.6 (1984): 991-1016.[50] Sonmez, Tayfun. “Bidding for army career specialties: Improving the ROTC branching mechanism.”
Journal of Political Economy 121.1 (2013): 186-219.[51] Sonmez, Tayfun, and Tobias B. Switzer. “Matching With (BranchofChoice) Contracts at the United
States Military Academy.” Econometrica 81.2 (2013): 451-488.[52] Srivastava, Vatsalya, and Ashutosh Thakur. “Yes Minister: The Problem of Monitoring the Bureau-
cracy.” Working paper (2017).[53] Terrier, C. “Matching Practices for Secondary Public School Teachers—France.” MiP Country Profile
20 (2014).[54] Thakur, Ashutosh. “Matching Politicians to Committees.” Working paper (2017).[55] Union Public Service Commission “Examination Notice No. 06/2017-CSP.”
www.upsc.gov.insitesdefaultfilesEngl CSP 2017.pdf.[56] Vaishnav, Milan, and Saksham Khosla. “The Indian Administrative Service Meets Big Data.” Carnegie
Endowment for International Peace (2016).
MATCHING PROBLEM OF CIVIL SERVICE 37
[57] Westkamp, Alexander. “An analysis of the German university admissions system.” Economic Theory53.3 (2013): 561-589.

38 ASHUTOSH THAKUR
Results shown in most Tables and Figures show analysis based on data primarilyfrom the following sources (otherwise, see figure/table caption for source):
• 2005-2015 assignments, vacancies, candidates, and exam ranks from Min-istry of Personnel, Public Grievances, and Pensions(http://persmin.gov.in/AIS1/QryCA.asp.)• Civil Lists 2001-2016 and 2017 Civil List (http://civillist.ias.nic.in/IndexCL.htm)• Executive sheets for IAS batches 1984 to 2007 from Ferguson and Hasan
(2013) which include language, training, posting history for each IAS of-ficer• Executive sheets for IAS batches 2005-2016 from Department of Person-
nel and Training and Ministry of Personnel, Public Grievances, and Pen-sions which include language, training, posting history for each IAS officer(https://supremo.nic.in/knowyourofficerIAs.aspx)
Table 1. Effect of New Mechanism on Average Exam Rank and NormalizedState Average Exam Rank, using data from 2005-2013.Y = α + β1BadCadre ∗ 1NewMechY ears ∗ t + ηs + τt for Average Exam Rankand Normalized State Average Exam Rank. Normalized State Average Rankis µc−µ
σwhere µs is state cadre c’s average exam rank of assigned candidates,
µ =mean(µc) is the average exam rank across states and σ=stddev(µc). We seethat from 2008 onwards, with the New Mechanism, the good and bad cadresdiverged in quality of assigned candidates. See Table 24 for year-by-year effectsand placebo tests.
(1) (2)StAvgExmRnk NormalizedStExmRnk
badcadrenewmech 114.8∗∗∗ 0.784∗∗∗
(24.56) (0.202)Constant 72.99∗∗∗ -0.153∗∗∗
(9.514) (0.0925)
Year FE X XState FE X XObservations 216 216Standard errors in parentheses are clustered at the state cadre level∗ p < 0.10, ∗∗ p < 0.05, ∗∗∗ p < 0.01

MATCHING PROBLEM OF CIVIL SERVICE 39
Table 2. Ratio of Toppers/Vacancies and Average Exam Rank.Correlation between a cadre’s ratio of toppers to total vacancies and averageexam rank of assigned IAS officers. There is a small negative correlation withthe Old Mechanism (2005-2007), but large negative correlations with the NewMechanism (2008 onwards).
Years Correlation
2005-07 -0.032008-13 -0.552014-15 -0.35
Table 3. Summary statistics for variables used in discrete choice analysis ofpreferences (in Tables 4 and 5).
Variable Mean Std Dev Min MaxDistanceFromHomeStMiles 697.0949 380.7953 0 1637GSDP Per Capita 28906.81 9726.827 8621 49385Health Index .5988333 .0999352 .417 .817PercentageRuralRoadsSurfaced .6694847 .2169275 .1226844 .989721

40
ASHUTOSH
THAKUR
Table 4. Discrete Choice Analysis of Cadre PreferencesColumns (1), (2) report conditional logits where the dependent variable is indicator variable for cadre being ranked amongst thetop 5, bottom 5 ranks respectively. Column (3) and (4) report rank-ordered logits (or exploded logits) for the cadre preferences.Column (5) uses linear regression specification similar to rank-ordered logit from column (3). Data: i) DistancefromHomeStMilesis the distance in miles between capital cities of the home cadre and ranked cadre. ii) GSDPPerCapita is the gross state domesticproduct per capita from year 2004-2005. iii) Health Index is the health index for 2008 computed in forming the HumanDevelopment Index from the India Human Development Report 2011. iv) PercentageRuralRoadsSurfaced is the percentage ofrural roads which are surfaced from data.gov.in. v)InsiderState is an indicator variable if the ranked cadre is the candidate’shome cadre. vi) Distance squared is the square of distance from home state in miles.
(1) (2) (3) (4) (5)Cond logit Cond logit Rk-ordered logit Rk-ordered logit Lin regression
PrefRank Top5 PrefRank Bottom5 PrefRank PrefRank PrefRank
DistancefromHomeStMiles -0.00409∗∗∗ 0.00194∗∗∗ -0.00131∗∗∗ -0.000673∗∗ -0.00649∗∗∗
(0.000354) (0.000246) (0.000125) (0.000270) (0.000313)GSDPPercapita04-05 0.0000320∗∗∗ -0.00000526 0.0000108∗∗∗ 0.0000107∗∗∗ 0.0000533∗∗∗
(0.0000122) (0.00000705) (0.00000370) (0.00000367) (0.0000194)HealthIndex08 1.316 -2.331∗∗∗ 1.359∗∗∗ 1.543∗∗∗ 7.188∗∗∗
(0.922) (0.813) (0.339) (0.355) (1.841)PercentageRuralRoadsSurfaced 1.771∗∗∗ -3.128∗∗∗ 1.555∗∗∗ 1.537∗∗∗ 9.425∗∗∗
(0.376) (0.253) (0.105) (0.106) (0.598)distancesquared -0.000000447∗∗
(0.000000179)Constant 4.897∗∗∗
(0.961)Observations 2783 2622 2806 2806 2806R2 0.277log likelihood -799.50 -982.087 -6020.5567 -6018.765log likelihood (intercept only) -1105.08 -1182.97Standard errors in parentheses are clustered at an individual level∗ p < 0.10, ∗∗ p < 0.05, ∗∗∗ p < 0.01
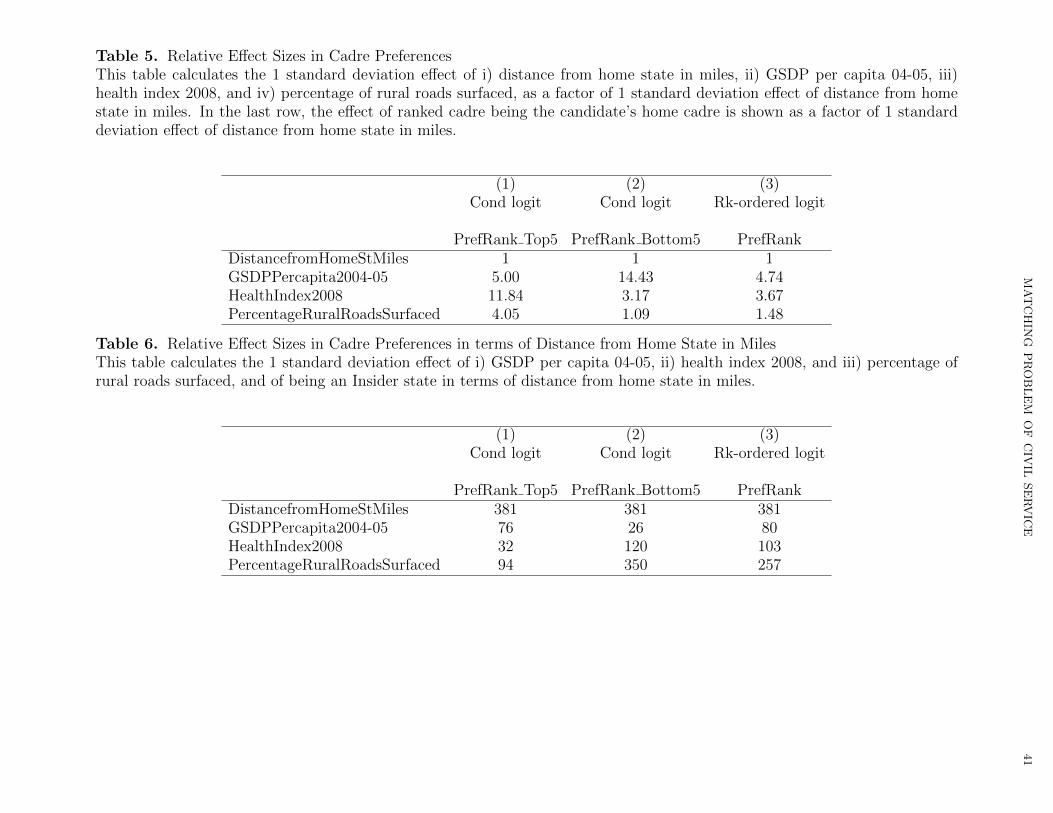
MATCHIN
GPROBLEM
OF
CIV
ILSERVIC
E41
Table 5. Relative Effect Sizes in Cadre PreferencesThis table calculates the 1 standard deviation effect of i) distance from home state in miles, ii) GSDP per capita 04-05, iii)health index 2008, and iv) percentage of rural roads surfaced, as a factor of 1 standard deviation effect of distance from homestate in miles. In the last row, the effect of ranked cadre being the candidate’s home cadre is shown as a factor of 1 standarddeviation effect of distance from home state in miles.
(1) (2) (3)Cond logit Cond logit Rk-ordered logit
PrefRank Top5 PrefRank Bottom5 PrefRankDistancefromHomeStMiles 1 1 1GSDPPercapita2004-05 5.00 14.43 4.74HealthIndex2008 11.84 3.17 3.67PercentageRuralRoadsSurfaced 4.05 1.09 1.48
Table 6. Relative Effect Sizes in Cadre Preferences in terms of Distance from Home State in MilesThis table calculates the 1 standard deviation effect of i) GSDP per capita 04-05, ii) health index 2008, and iii) percentage ofrural roads surfaced, and of being an Insider state in terms of distance from home state in miles.
(1) (2) (3)Cond logit Cond logit Rk-ordered logit
PrefRank Top5 PrefRank Bottom5 PrefRankDistancefromHomeStMiles 381 381 381GSDPPercapita2004-05 76 26 80HealthIndex2008 32 120 103PercentageRuralRoadsSurfaced 94 350 257
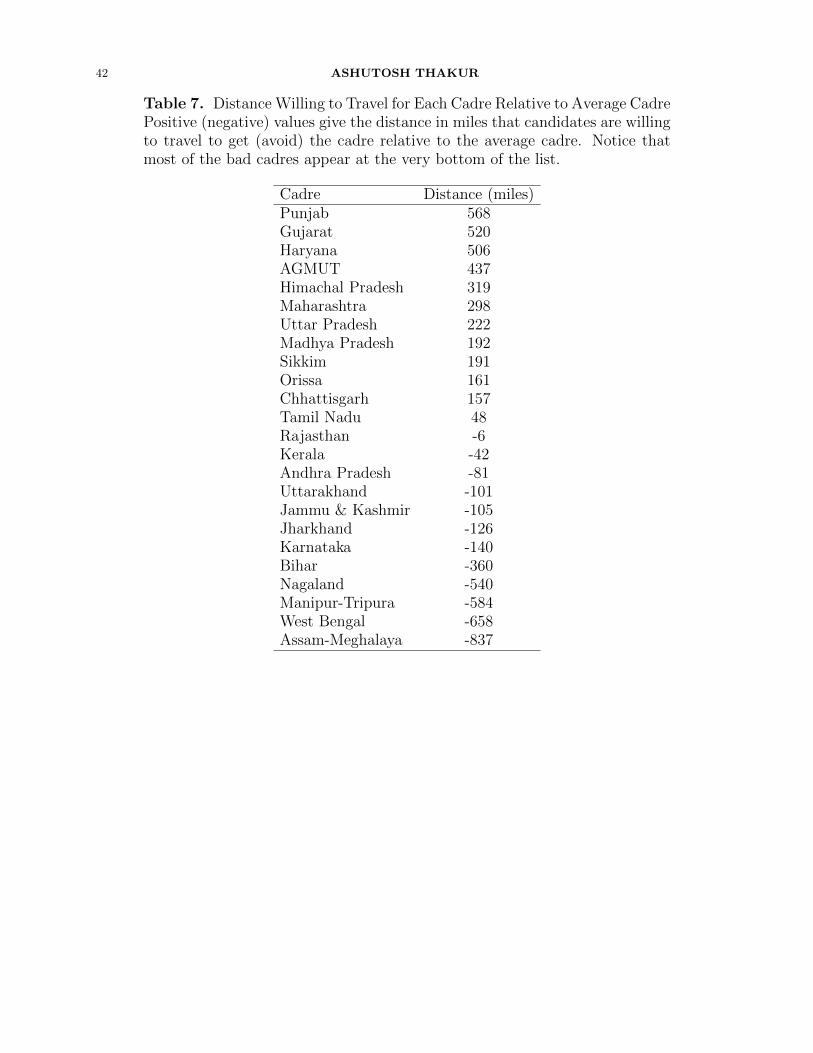
42 ASHUTOSH THAKUR
Table 7. Distance Willing to Travel for Each Cadre Relative to Average CadrePositive (negative) values give the distance in miles that candidates are willingto travel to get (avoid) the cadre relative to the average cadre. Notice thatmost of the bad cadres appear at the very bottom of the list.
Cadre Distance (miles)Punjab 568Gujarat 520Haryana 506AGMUT 437Himachal Pradesh 319Maharashtra 298Uttar Pradesh 222Madhya Pradesh 192Sikkim 191Orissa 161Chhattisgarh 157Tamil Nadu 48Rajasthan -6Kerala -42Andhra Pradesh -81Uttarakhand -101Jammu & Kashmir -105Jharkhand -126Karnataka -140Bihar -360Nagaland -540Manipur-Tripura -584West Bengal -658Assam-Meghalaya -837

MATCHING PROBLEM OF CIVIL SERVICE 43
Table 8. Exam Toppers from CadresPoisson regressions to deal with data of counts of exam toppers from eachcadre from 2005-2013. Data: 1) Health Index 2008 and 2) Education Index2008 from India Human Development Report 2011, 3) Per capita income 2011-12, 4) Population 2011 and 5) Literacy rate, 6) Literacy rate for rural areasand 7) Literacy rate for urban areas from 2011 Census.
(1) (2) (3)Poisson Reg Poisson Reg Poisson Reg
NumberToppers NumberToppers NumberToppersHealthIndex08 5.943∗∗∗ 4.773∗∗∗ 3.733∗∗∗
(0.823) (0.848) (0.905)PerCapitaIncome2011-12 0.00000977∗∗∗ 0.00000697∗∗∗ 0.00000576∗∗∗
(0.00000244) (0.00000229) (0.00000222)Population Census2011 1.52e-08∗∗∗ 1.76e-08∗∗∗ 1.38e-08∗∗∗
(6.80e-10) (1.08e-09) (7.03e-10)LiteracyRate2011Census -0.0875∗∗∗
(0.0125)LiteracyRateRural2011 -0.0363∗∗
(0.0163)LiteracyRateUrban2011 -0.0437∗∗
(0.0202)EducationIndex2008 -2.298∗∗
(0.922)Constant 2.610∗∗∗ 3.025∗∗∗ -0.881∗∗
(0.906) (1.096) (0.436)Year Fixed Effects X X XObservations 216 216 216Standard errors in parentheses∗ p < 0.10, ∗∗ p < 0.05, ∗∗∗ p < 0.01

44 ASHUTOSH THAKUR
Table 9. Structural Break: Effect of Mechanism change on Revenue.We use state-level revenue data from 12th and 13th Finance Commission Re-ports covering fiscal years 2005 to 2015 to estimate Y = α + ηs + γs ∗ t +β1BadCadre ∗ 1NewMechY ears ∗ t + τt + ε. Hence, β captures the difference inchange in linear trends across good and bad cadres due to the New Mecha-nism. The effect on non-tax revenues (Column (2)) is not significant, in linewith this being a placebo test for revenue categories outside the jurisdiction ofIAS officers. See Figure 22 difference-in-difference graphs, and for robustnesson non-tax revenue regressions see Figure 23 and Table 12.
(1) (2)Own Tax Revenue Non-Tax Revenue
badcadrenewmech × lineartrend -1336.6∗∗ -111.0(641.5) (100.6)
badcadrenewmech 5361.9 -352.6(4136.3) (356.4)
lineartrend 6779.3∗∗∗ 594.5∗∗∗
(19.94) (23.69)Constant 8246.3∗∗∗ 3122.7∗∗∗
(614.7) (215.9)Year FE X XState FE X XState Linear Time Trend X XObservations 280 280Standard errors in parentheses are clustered at the state cadre level∗ p < 0.10, ∗∗ p < 0.05, ∗∗∗ p < 0.01

MATCHING PROBLEM OF CIVIL SERVICE 45
Table 10. Effect of Exam Rank & Normalized Exam Rank on Own Tax Rev-enue.We use state-level revenue data from 12th and 13th Finance Commission Re-ports covering fiscal years 2008-2015 (IAS batches 2005-2013) to estimate re-duced form Y = α+βX + ηs + τt + ε for Average Exam Rank and NormalizedState Average Exam Rank. IV estimates instrument for X using first stageX̂ = α + β1BadCadre ∗ 1NewMechY ears ∗ t+ ηs + τt.
(1) (2) (3) (4)Reduced Form IV DiD Reduced Form IV DiD
StAvgExmRnk -20.11∗∗∗ -85.11∗∗∗
(7.158) (23.71)NormalizedStExmRnk -2492.8∗∗∗ -11909.6∗∗∗
(820.4) (3338.6)Constant 41759.0∗∗∗ 69129.0∗∗∗ 39934.6∗∗∗ 54332.8∗∗∗
(1651.8) (4917.0) (2037.8) (1798.8)Year FE X X X XState FE X X X XObservations 224 224 224 224Standard errors in parentheses are clustered at the state cadre level∗ p < 0.10, ∗∗ p < 0.05, ∗∗∗ p < 0.01

46
ASHUTOSH
THAKUR
Table 11. De-trended Own-tax and Non-tax Revenue Difference-in-Difference.We use state-level revenue data from 12th and 13th Finance Commission Reports covering fiscal years 2005 to 2015 (IAS batches2005-2013). We de-trend each state using its own Old Mechanism (2005-2010) trend, and then estimate difference-in-differenceon the de-trended data: Y = α + β1BadCadre ∗ 1NewMechY ears + ηs + τt + ε, in Columns (1) and (4). Columns (2) and (5)breakdown the New Mechanism effects into year-by-year effects for 2011-2015. Columns (3) and (6) add placebo treatmenteffects for years 2007-2010. We see that the placebo, although significant, are atleast an order of magnitude smaller than theNew Mechanism effects. The effect on non-tax revenues (Columns (4) -(6)) for New Mechanism years (2010-15) are all notsignificant, in line with this being a placebo test for revenue categories outside the jurisdiction of IAS officers. See Figure 24 fordifference-in-difference graphs, and for robustness on non-tax revenue regressions see Figure 25 and Table 12.
(1) (2) (3) (4) (5) (6)DetOwnTaxRev DetOwnTaxRev DetOwnTaxRev DetNonTaxRev DetNonTaxRev DetNonTaxRev
badcadrenewmech -5330.9∗∗∗ -1240.4(1632.9) (794.6)
bad15 -8365.9∗∗∗ -8194.1∗∗∗ -1509.4 -1481.6(2785.1) (2746.9) (984.8) (994.9)
bad14 -6472.8∗∗∗ -6301.0∗∗∗ -1279.4 -1251.7(2044.9) (2011.3) (889.9) (898.9)
bad13 -4984.9∗∗∗ -4813.1∗∗∗ -1234.3 -1206.5(1553.5) (1533.8) (796.2) (804.6)
bad12 -3822.9∗∗∗ -3651.1∗∗∗ -1169.0 -1141.3(1284.2) (1285.6) (714.2) (721.7)
bad11 -3007.9∗∗ -2836.1∗∗ -1009.7 -981.9(1171.8) (1192.5) (641.1) (647.4)
bad10 -9.654∗ -1.304(5.013) (1.607)
bad09 271.4∗∗ 43.09∗∗
(126.7) (17.68)bad08 345.3∗∗ 56.57∗∗∗
(162.9) (21.69)bad07 252.1∗∗ 40.48∗∗∗
(116.7) (15.17)Constant 26510.5∗∗∗ 26510.5∗∗∗ 26565.7∗∗∗ 2373.1∗∗∗ 2373.1∗∗∗ 2382.0∗∗∗
(743.2) (749.4) (740.3) (375.3) (378.5) (381.6)Year FE X X X X X XState FE X X X X X XObservations 280 280 280 280 280 280Standard errors in parentheses are clustered at the state cadre level∗ p < 0.10, ∗∗ p < 0.05, ∗∗∗ p < 0.01
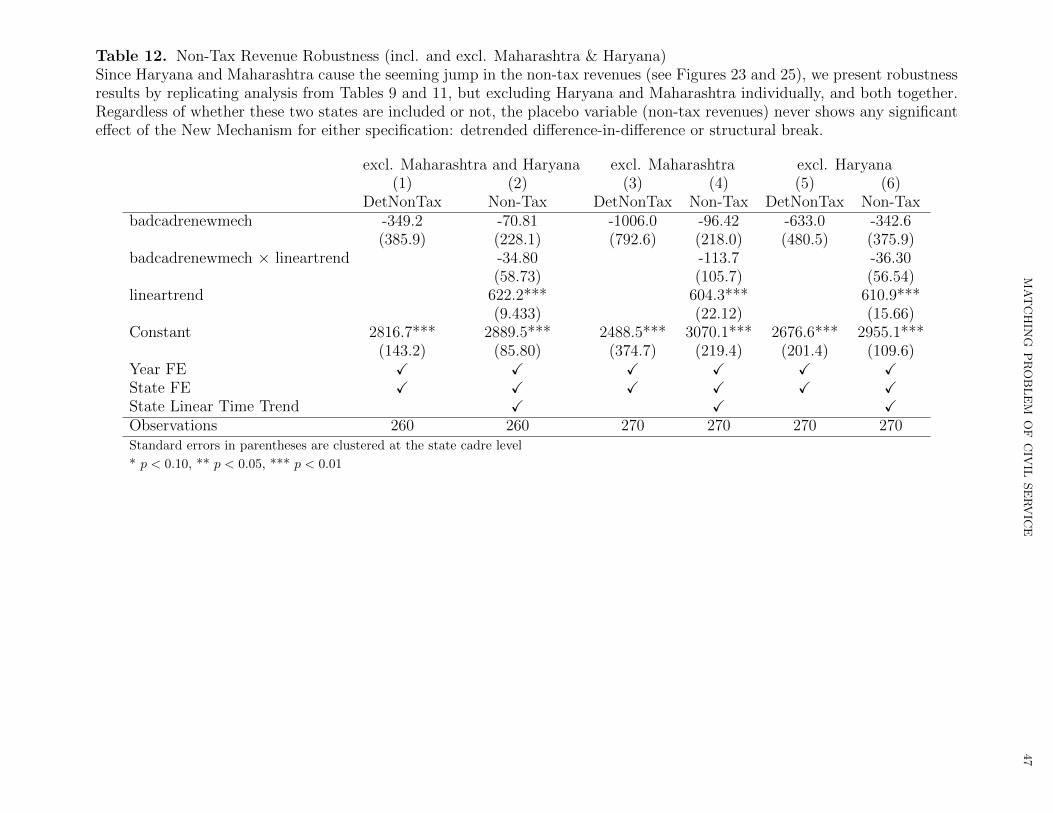
MATCHIN
GPROBLEM
OF
CIV
ILSERVIC
E47
Table 12. Non-Tax Revenue Robustness (incl. and excl. Maharashtra & Haryana)Since Haryana and Maharashtra cause the seeming jump in the non-tax revenues (see Figures 23 and 25), we present robustnessresults by replicating analysis from Tables 9 and 11, but excluding Haryana and Maharashtra individually, and both together.Regardless of whether these two states are included or not, the placebo variable (non-tax revenues) never shows any significanteffect of the New Mechanism for either specification: detrended difference-in-difference or structural break.
excl. Maharashtra and Haryana excl. Maharashtra excl. Haryana(1) (2) (3) (4) (5) (6)
DetNonTax Non-Tax DetNonTax Non-Tax DetNonTax Non-Taxbadcadrenewmech -349.2 -70.81 -1006.0 -96.42 -633.0 -342.6
(385.9) (228.1) (792.6) (218.0) (480.5) (375.9)badcadrenewmech × lineartrend -34.80 -113.7 -36.30
(58.73) (105.7) (56.54)lineartrend 622.2*** 604.3*** 610.9***
(9.433) (22.12) (15.66)Constant 2816.7*** 2889.5*** 2488.5*** 3070.1*** 2676.6*** 2955.1***
(143.2) (85.80) (374.7) (219.4) (201.4) (109.6)Year FE X X X X X XState FE X X X X X XState Linear Time Trend X X XObservations 260 260 270 270 270 270Standard errors in parentheses are clustered at the state cadre level
* p < 0.10, ** p < 0.05, *** p < 0.01

48 ASHUTOSH THAKUR
Table 13. Forgone Own Tax Revenue due to Reservation Policies (Counter-factual).This table shows the average exam rank across all candidates with reservationand without reservation. The counterfactual of without reservation considersthe highest nt exam ranks, where nt is the number of total vacancies for yeart. Exchange rate is assumed at 65 INR
USD.
Year AvgExmRnk w/out Res AvgExmRnk w/ Res Own Tax Rs. (crore) Own Tax $2015 90.5 199.2 -9250 -$1,423,155,5902014 90.5 227.1 -11622 -$1,788,037,4362013 90.5 191.0 -8556 -$1,316,295,2562012 89.5 167.1 -6604 -$1,016,023,6132011 85 139.5 -4635 -$713,033,5272010 75 140.6 -5582 -$858,833,2782009 66 117.4 -4378 -$673,583,4292008 60 107.1 -4007 -$616,401,0602007 56 89.7 -2868 -$441,298,0042006 45 83.2 -3254 -$500,655,7132005 44 89.4 -3864 -$594,490,716
Table 14. Forgone Own Tax Revenue due to ST Reservation Policies (Coun-terfactual).This table shows the average exam rank across all candidates with reservationand without ST reservation. The counterfactual of without ST reservationreplaces ST candidates with the highest non-qualifying candidates by examrank. Exchange rate is assumed at 65 INR
USD.
Year AvgExmRnk w/out ST Res AvgExmRnk w/ Res Own Tax Rs. (crore) Own Tax $2015 172.3 199.2 2289.9 $352,297,2052014 196.4 227.1 2612.9 $401,981,0772013 153.5 191.0 3194.5 $491,455,6922012 134.1 167.1 2806.8 $431,819,8442011 114.8 139.4 2099.9 $323,055,1432010 98.5 140.6 3580.9 $550,909,6632009 76.0 117.4 3529.6 $543,008,6862008 56.3 107.1 4317.2 $664,193,5992007 47.6 89.7 3585.2 $551,577,2862006 34.5 83.2 4148.4 $638,213,8412005 37.7 89.4 4399.0 $676,763,716
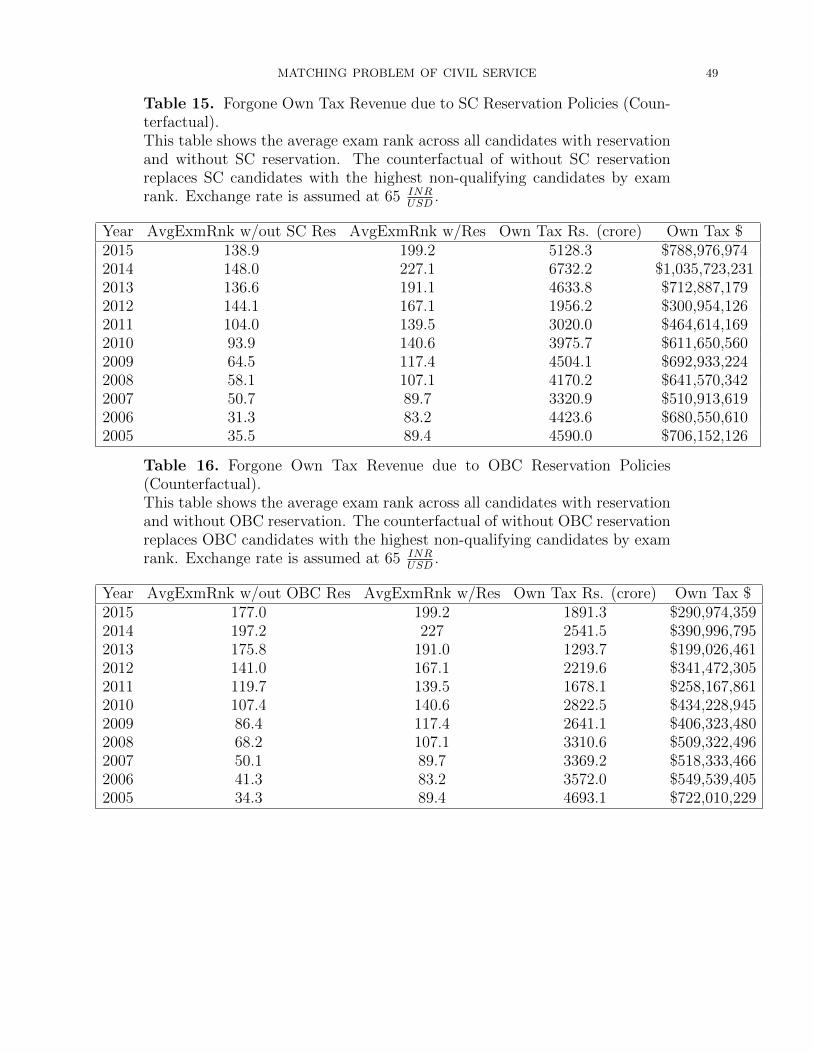
MATCHING PROBLEM OF CIVIL SERVICE 49
Table 15. Forgone Own Tax Revenue due to SC Reservation Policies (Coun-terfactual).This table shows the average exam rank across all candidates with reservationand without SC reservation. The counterfactual of without SC reservationreplaces SC candidates with the highest non-qualifying candidates by examrank. Exchange rate is assumed at 65 INR
USD.
Year AvgExmRnk w/out SC Res AvgExmRnk w/Res Own Tax Rs. (crore) Own Tax $2015 138.9 199.2 5128.3 $788,976,9742014 148.0 227.1 6732.2 $1,035,723,2312013 136.6 191.1 4633.8 $712,887,1792012 144.1 167.1 1956.2 $300,954,1262011 104.0 139.5 3020.0 $464,614,1692010 93.9 140.6 3975.7 $611,650,5602009 64.5 117.4 4504.1 $692,933,2242008 58.1 107.1 4170.2 $641,570,3422007 50.7 89.7 3320.9 $510,913,6192006 31.3 83.2 4423.6 $680,550,6102005 35.5 89.4 4590.0 $706,152,126
Table 16. Forgone Own Tax Revenue due to OBC Reservation Policies(Counterfactual).This table shows the average exam rank across all candidates with reservationand without OBC reservation. The counterfactual of without OBC reservationreplaces OBC candidates with the highest non-qualifying candidates by examrank. Exchange rate is assumed at 65 INR
USD.
Year AvgExmRnk w/out OBC Res AvgExmRnk w/Res Own Tax Rs. (crore) Own Tax $2015 177.0 199.2 1891.3 $290,974,3592014 197.2 227 2541.5 $390,996,7952013 175.8 191.0 1293.7 $199,026,4612012 141.0 167.1 2219.6 $341,472,3052011 119.7 139.5 1678.1 $258,167,8612010 107.4 140.6 2822.5 $434,228,9452009 86.4 117.4 2641.1 $406,323,4802008 68.2 107.1 3310.6 $509,322,4962007 50.1 89.7 3369.2 $518,333,4662006 41.3 83.2 3572.0 $549,539,4052005 34.3 89.4 4693.1 $722,010,229

50 ASHUTOSH THAKUR
Table 17. Difference in difference effect of New Mechanism on Human De-velopment Index (HDI). Data used is HDI for years 1983, 1988, 1993, 2000,2005, 2010, and 2012 constructed by Mukherjee et. al (2014).
(1)HDI
badcadrenewmech -.0488∗∗
(.0224 )Constant .2598∗∗∗
(.0143)
Year FE XState FE XObservations 196Standard errors in parentheses∗ p < 0.10, ∗∗ p < 0.05, ∗∗∗ p < 0.01
Table 18. Effect of New Mechanism on Age of Candidates.Regressing AverageAge = α+ β11BadCadre ∗ 1NewMechY ears + ηs + τt + ε. Sinceβ1 > 0, bad cadres get older candidates under the New Mechanism. The firstcolumn drops Sikkim which has 1 IAS officer allotted per year and hence causesa lot of variance. Particularly, Sikkim is allotted a 25 year-old candidate in2011, which makes it the lowest average age across all states for that year.The second column includes Sikkim. Data is from civil lists 1984-2013 (Years1984 to 2007 from Ferguson and Hasan (2013).
(1) (2)Age Age
1BadCadre ∗ 1NewMechY ears 0.466* 0.396(0.273) (0.269)
Constant 24.45*** 24.45***(0.348) (0.360)
Year FE X XState FE X XObservations 662 684Number of cadres 23 24
Standard errors in parentheses*** p<0.01, ** p<0.05, * p<0.1

MATCHING PROBLEM OF CIVIL SERVICE 51
Table 19. Recruitment practices under Old and New Mechanisms.Y = α+ β11BadCadre + β21NewMechY ears + β31BadCadre ∗ 1NewMechY ears + ε. Thedependent variables are Percentage of IAS officers who are promoted fromState Civil Service (Column 1 ), Percentage of IAS officers who are promotedfrom State Civil Service relative to authorized strength (Column 2 ), and Per-centage of IAS officers who are Direct Recruits relative to authorized strength(Column 3 ). This data is from Civil Lists 2001-2017.
(1) (2) (3)%PromotedActual %PromotedtoStrength %DirecttoStrength
1BadCadre 0.0746*** 0.0821*** -0.156***(0.00976) (0.0294) (0.0155)
1NewMechY ears 0.00884 -0.115*** -0.195***(0.00685) (0.0206) (0.0109)
1BadCadre ∗ 1NewMechY ears -0.0261** -0.0257 0.105***(0.0126) (0.0380) (0.0200)
Constant 0.247*** 0.775*** 1.014***(0.00527) (0.0159) (0.00837)
Observations 415 415 415R-squared 0.189 0.133 0.520
Standard errors in parentheses*** p<0.01, ** p<0.05, * p<0.1
Table 20. Ratio of Toppers relative to Vacancies for new states formed in2000.The low ratio of toppers relative to posted vacancies in Chhattisgarh comparedto Jharkhand and Uttarakhand might help explain why Chhattisgarh doespoorly in average exam ranks amongst the new states.
Candidates Vacancies Ratio
Jharkhand 42 59 0.71Uttarakhand 17 33 0.52Chhattisgarh 14 63 0.22

52 ASHUTOSH THAKUR
Figure 4. Average exam rank differences between assigned insiders and out-siders by category. Analysis separated into years 2005-07 (Old Mechanism),2008-13 (New Mechanism), and 2014-15 (New Mechanism with new states).

MATCHING PROBLEM OF CIVIL SERVICE 53
Figure 5. Average exam rank of assigned candidates by cadre. Highlightedentries show the impact of some cadres splitting up in 2014. Analysis separatedinto years 2005-07 (Old Mechanism), 2008-13 (New Mechanism), and 2014-15(New Mechanism with new states).

54 ASHUTOSH THAKUR
Figure 6. Variance of within-cadre average exam rank across all cadres. No-tice the increases in variance with the New Mechanism (2008 onwards) andwith the formation of new states in 2014.

MATCHING PROBLEM OF CIVIL SERVICE 55
Figure 7. Average exam rank of assigned candidates by reservation. Analysisseparated into years 2005-07 (Old Mechanism) and 2008-13 (New Mechanism).

56 ASHUTOSH THAKUR
Figure 8. Left : fraction of insider requests by cadre. Right : fraction ofinsiders allotted to each cadre. Notice that requests are around .33 given the1:2 target between insiders and outsiders; however, assignments which signifythe ability to meet this target vary vastly across states. Analysis separatedinto years 2005-07 (Old Mechanism) and 2008-13 (New Mechanism).

MATCHING PROBLEM OF CIVIL SERVICE 57
Figure 9. Percentage of means (Left) and variances (Right) of average examranks across cadres which are lower under random (orange) and random withquotas (blue) mechanisms than with actual assignments. Notice Old Mecha-nism years (2005-07) outperform random whereas New Mechanism years (2008onwards) underperform relative to random.

58 ASHUTOSH THAKUR
Figure 10. For a selected subset of cadres (Haryana, Andhra Pradesh, Ma-harashtra, Manipur-Tripura, Nagaland, and Assam Meghalaya), this figureshows the percentage of time a cadre’s actual average exam rank is higherthan the average exam rank produced by Random within Quotas mechanismsimulations. We see that with the New Mechanism (2008-2013), two groupsof cadres emerge: those that systematically under-perform (dashed) and thosethat systematically do better (solid) relative to random within quota. Figure11 shows all cadres for each year, while this plots the time-series for a subsetthe cadres to highlight the two groups that emerge with the New Mechanism.Note that with the Old Mechanism (2005-2007), performance for any givencadre also exhibits changes across years. This temporal balancing occurs dueto the 1:24 cycles and group rotations present in the Old Mechanism.
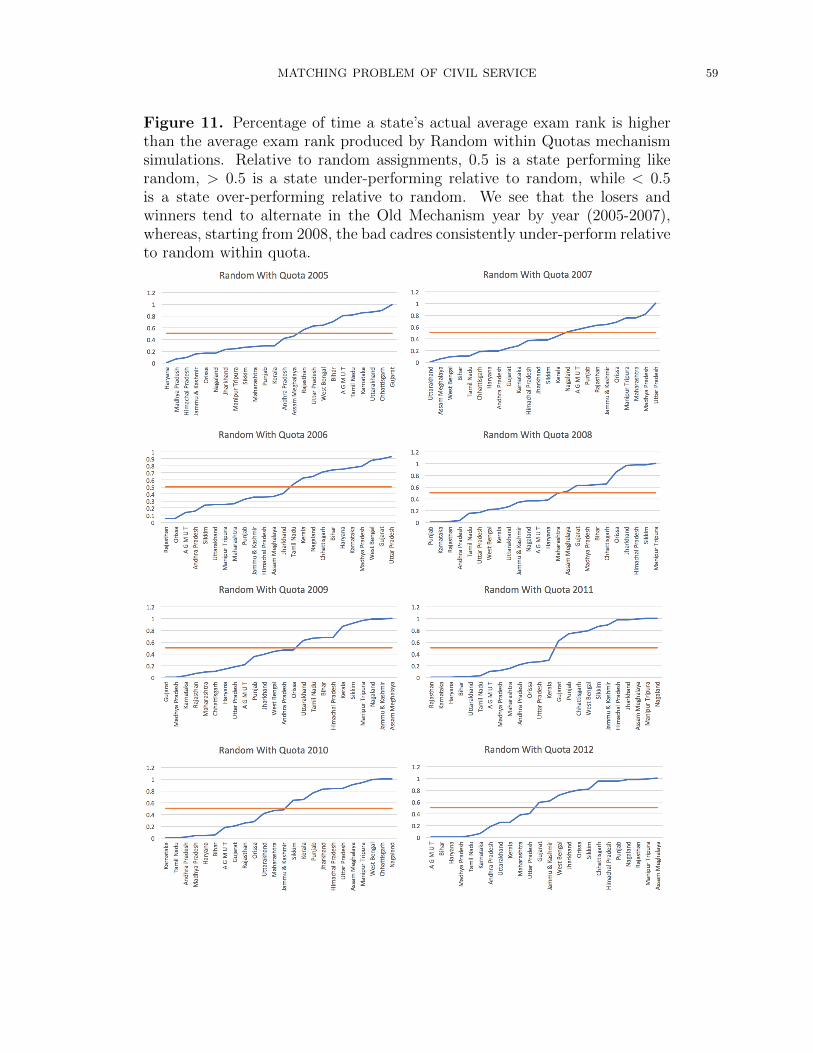
MATCHING PROBLEM OF CIVIL SERVICE 59
Figure 11. Percentage of time a state’s actual average exam rank is higherthan the average exam rank produced by Random within Quotas mechanismsimulations. Relative to random assignments, 0.5 is a state performing likerandom, > 0.5 is a state under-performing relative to random, while < 0.5is a state over-performing relative to random. We see that the losers andwinners tend to alternate in the Old Mechanism year by year (2005-2007),whereas, starting from 2008, the bad cadres consistently under-perform relativeto random within quota.

60 ASHUTOSH THAKUR
Figure 12. Estimated probability distribution function for exam toppers forselected cadres (using 2013 poisson regression coefficients for Uttar Pradesh
(λ̂ = 29.98), Maharashtra (λ̂ = 13.85), Gujarat (λ̂ = 6.95), Jammu and Kash-
mir (λ̂ = 3.29), and Manipur Tripura (λ̂ = 1.55). We see a large heterogeneityin ability to place exam toppers across various cadres.

MATCHING PROBLEM OF CIVIL SERVICE 61
Figure 13. Average of within-cadre average exam rank (left) and Average ofnormalized state average exam rank (right), for Good (blue) and Bad (red)Cadres from 2005 to 2013. Normalized State Average Rank is µc−µ
σwhere µs
is state cadre c’s average exam rank of assigned candidates, µ =mean(µc) isthe average exam rank across states, and σ=stddev(µc). We see that from2008 onwards, with the New Mechanism, the good and bad cadres diverged inquality of assigned candidates.
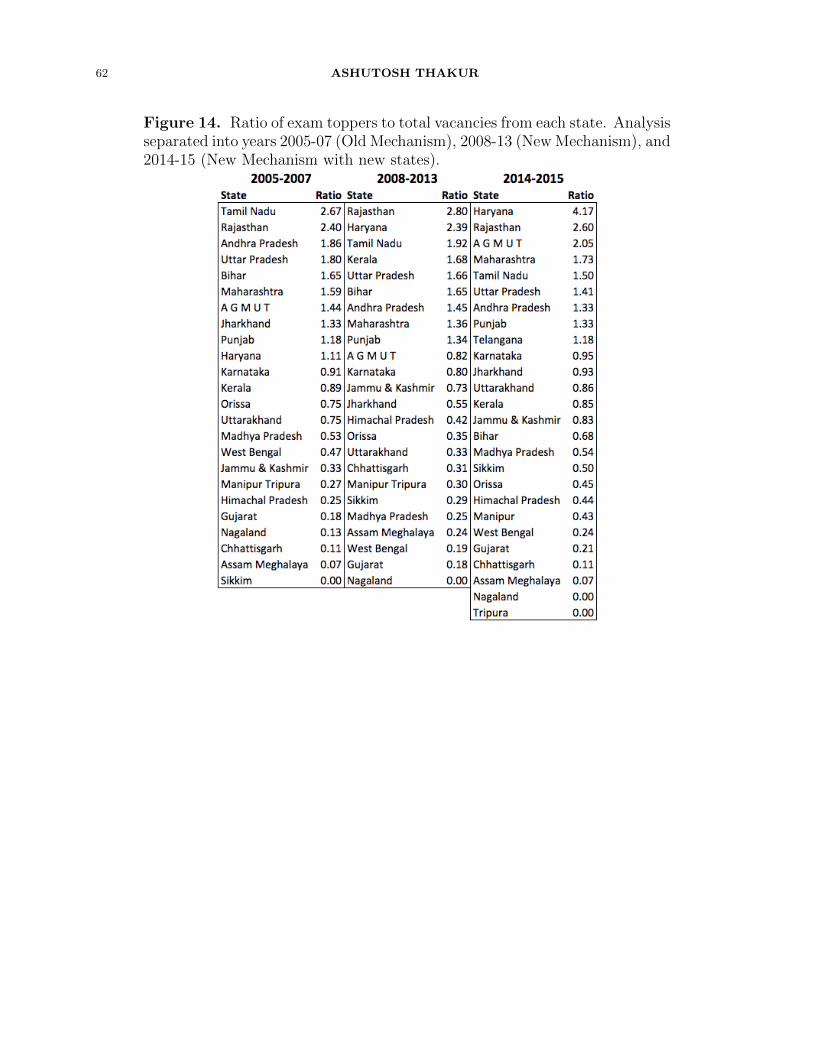
62 ASHUTOSH THAKUR
Figure 14. Ratio of exam toppers to total vacancies from each state. Analysisseparated into years 2005-07 (Old Mechanism), 2008-13 (New Mechanism), and2014-15 (New Mechanism with new states).

MATCHING PROBLEM OF CIVIL SERVICE 63
Figure 15. Average exam rank of candidates by Home State. Analysis sep-arated into years 2005-07 (Old Mechanism), 2008-13 (New Mechanism), and2014-15 (New Mechanism with new states).
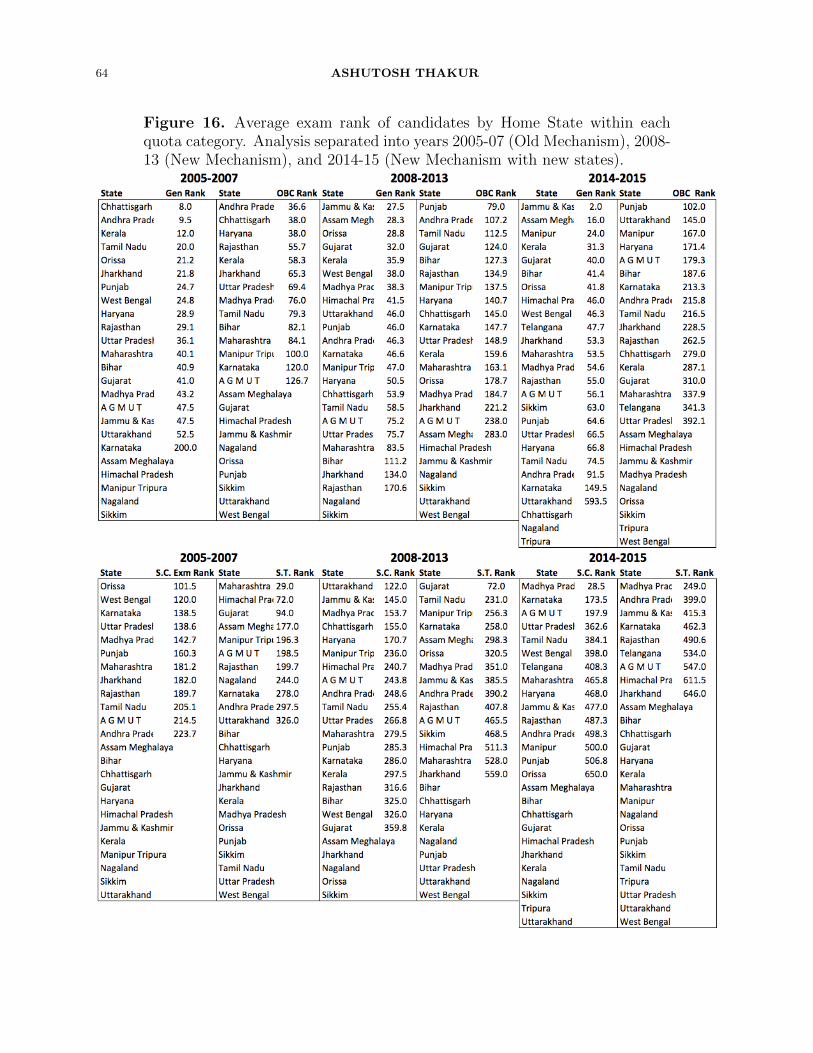
64 ASHUTOSH THAKUR
Figure 16. Average exam rank of candidates by Home State within eachquota category. Analysis separated into years 2005-07 (Old Mechanism), 2008-13 (New Mechanism), and 2014-15 (New Mechanism with new states).
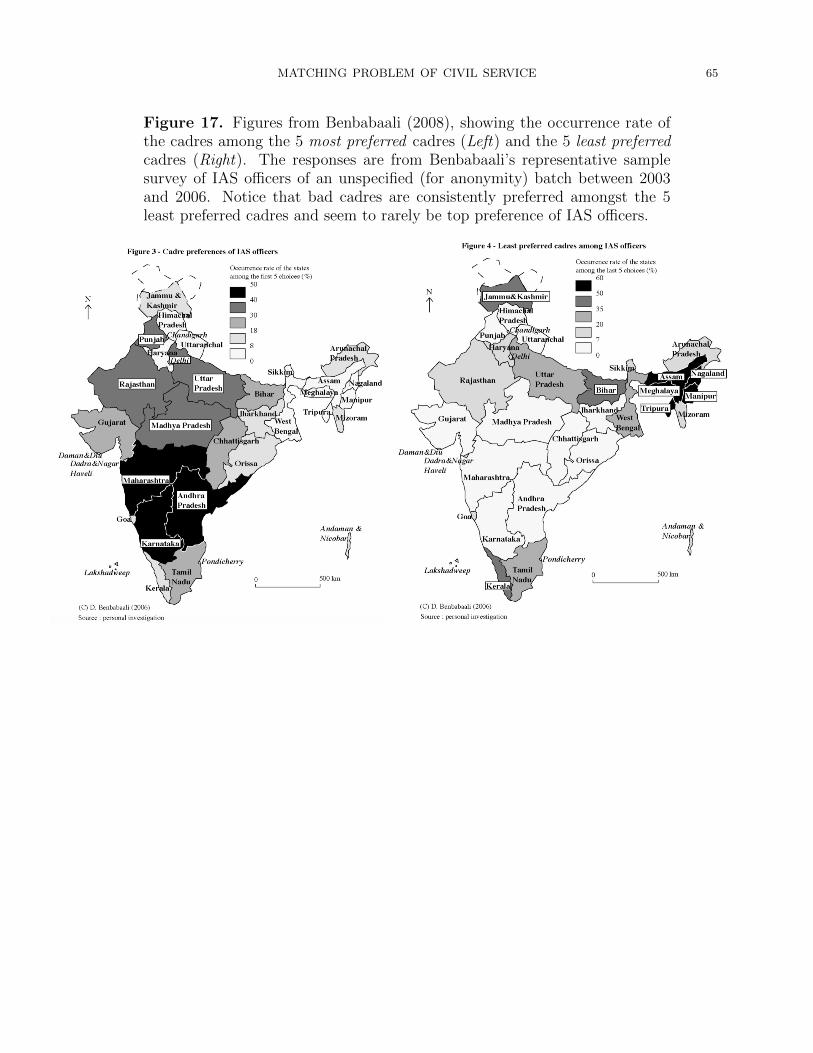
MATCHING PROBLEM OF CIVIL SERVICE 65
Figure 17. Figures from Benbabaali (2008), showing the occurrence rate ofthe cadres among the 5 most preferred cadres (Left) and the 5 least preferredcadres (Right). The responses are from Benbabaali’s representative samplesurvey of IAS officers of an unspecified (for anonymity) batch between 2003and 2006. Notice that bad cadres are consistently preferred amongst the 5least preferred cadres and seem to rarely be top preference of IAS officers.

66 ASHUTOSH THAKUR
Figure 18. Percentage of Homophily: Northerners assigned to NorthernCadres and Southerners assigned to Southern Cadres. The solid blue lineshows the actual assignment data, the dotted line is the simulated counter-factual using the Old Mechanism for years 2008 onwards, and the solid blacklines show trends for 1984-2007 and 2008 onwards. We notice an increase inregional homophily under the New Mechanism.
Figure 19. Left : Percentage of Southerners assigned to Southern Cadres.Right : Percentage of Northerners assigned to Northern Cadres. The solidblue line shows the actual assignment data, the dotted line is the simulatedcounterfactual using the Old Mechanism for years 2008 onwards, and the solidblack lines show trends for 1984-2007 and 2008 onwards. We notice an increasein regional homophily for both Southerners and Northerners with the NewMechanism.

MATCHING PROBLEM OF CIVIL SERVICE 67
Figure 20. Mean (Left) and variance (Right) of distance from assigned cadreto home cadre across candidates by year. Distances are measured by milesbetween capitals. The solid blue line shows the actual assignment data, thedotted line is the simulated counterfactual using the Old Mechanism for years2008 onwards, and the solid black lines show trends for 1984-2007 and 2008onwards. We notice that with the New Mechanism, candidates are assignedto cadres closer to their home state and variance of distance also falls.

68 ASHUTOSH THAKUR
Figure 21. Comparison of what average preference rank each exam quartilegets with the New and Old Mechanism. Top Left : block preferences, TopRight : preference by closeness in distance, Bottom Left : uncorrelated pref-erences, and Bottom Right : reserve 3 preferences. Notice that with minimalcorrelation (uncorrelated and reserve 3 preferences), all quartiles are better offwith the new mechanism. However, with sufficiently high correlation in prefer-ences (block and close preferences), the 4th quartile is worse off with the NewMechanism because highly sought after vacancies fill up early. Simulations runon data from years 2005 to 2013.

MATCHING PROBLEM OF CIVIL SERVICE 69
Figure 22. Own tax revenues (Top Left) and Non-tax revenues (Top Right),and Total revenues= own tax + non-tax (Bottom) amongst bad and goodcadres for fiscal years 2005-06 to 2014-15. Fiscal year 2010-11 onwards fallunder New Mechanism. We see a divergence between good and bad cadresfrom 2011 onwards fall under New Mechanism. Note that the jump in theOwn Non-Tax Revenue occurs due to Haryana and Maharashtra; see Figure23 for robustness.

70 ASHUTOSH THAKUR
Figure 23. Robustness: The non-tax revenue graph from Figure 22 appearsmisleading in that good cadres appear to have done better with a jump in year2010-11 and onwards, but this is attributed to jumps in non-tax revenue onlyin Haryana and Maharashtra. We show the graphs with all data (Top Left),excluding Maharashtra and Haryana (Top Right), excluding only Maharashtra(Bottom Left), and excluding only Haryana (Bottom Right). In Table 12, weshow the robustness of the results to these exclusions. All coefficients on non-tax revenues appear insignificant regardless whether we include or excludethese cadres.

MATCHING PROBLEM OF CIVIL SERVICE 71
Figure 24. Detrended Own Tax Revenue (Left) and Detrended Non-tax Rev-enue (Right) for years 2005-06 to 2014-15 (IAS batches 2005-2012). Fiscal year2010-11 onwards fall under New Mechanism. We see a divergence between goodand bad cadres from 2011 onwards fall under New Mechanism. Note that thejump in Own Non-Tax Revenue occurs due to Haryana and Maharashtra; seeFigure 25 for robustness.

72 ASHUTOSH THAKUR
Figure 25. Robustness: The detrended non-tax revenue graph from Figure 24appears misleading in that good cadres appear to have done better with a jumpin year 2010-11 and onwards, but this is attributed to jumps in non-tax revenueonly in Haryana and Maharashtra. We show the detrended graphs with alldata (Top Left), excluding Maharashtra and Haryana (Top Right), excludingonly Maharashtra (Bottom Left), and excluding only Haryana (Bottom Right).In Table 12, we show the robustness of the results to these exclusions. Allcoefficients on non-tax revenues appear insignificant regardless whether weinclude or exclude these cadres.

MATCHING PROBLEM OF CIVIL SERVICE 73
Figure 26. Plotting Human Development Index grouped by good and badcadres from 1983 to 2012. Data used is HDI for years 1983, 1988, 1993, 2000,2005, 2010, and 2012 constructed by Mukherjee et. al (2014). We observe adivergence in HDI across the good and bad cadres from 2010 onwards (data foryears 2010 and 2012) when the IAS officers from the post-2008 New Mechanismstart working.
Figure 27. The percentage of top 20 exam toppers being assigned to badcadres. The blue line is the actual assignment data and red line is the simulatedcounterfactual using the Old Mechanism for years 2008 onwards. Since 7 outof 24 cadres are bad, a uniform distribution of toppers would be around 30%.We see a big drop starting with the New Mechanism in 2008.
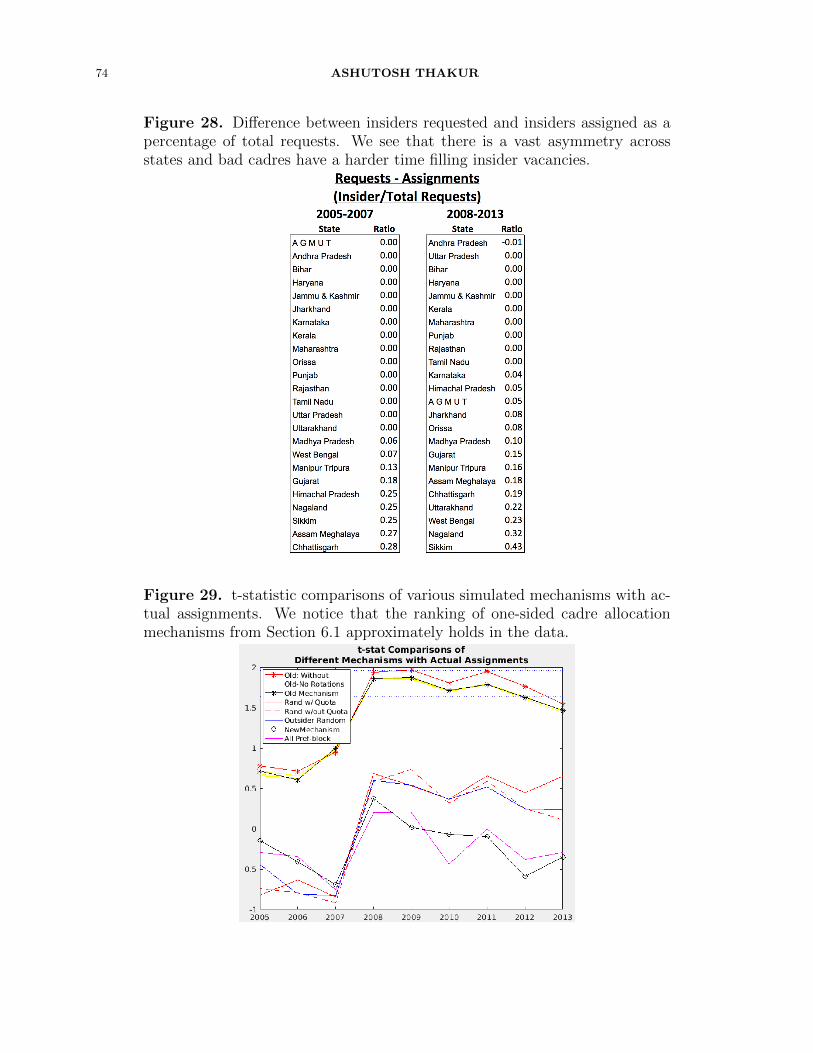
74 ASHUTOSH THAKUR
Figure 28. Difference between insiders requested and insiders assigned as apercentage of total requests. We see that there is a vast asymmetry acrossstates and bad cadres have a harder time filling insider vacancies.
Figure 29. t-statistic comparisons of various simulated mechanisms with ac-tual assignments. We notice that the ranking of one-sided cadre allocationmechanisms from Section 6.1 approximately holds in the data.

MATCHING PROBLEM OF CIVIL SERVICE 75
Figure 30. Top Left : percent of across-cadre mean of average exam rankby cadre which are lower in the simulated mechanism than in the actual as-signments. Top Right : percent of across-cadre variance of average exam rankby cadre which are lower in the simulated mechanism than in the actual as-signments. Bottom: percent of across-cadre mean and variance lower in thesimulated mechanism than in the actual assignments. We notice that the rank-ing of one-sided cadre allocation mechanisms from Section 6.1 approximatelyholds in the data.

76 ASHUTOSH THAKUR
Figure 31. t-statistic comparisons of various simulated mechanisms with ac-tual assignments. Simulations are serial dictatorship in order of exam rankgiven block (purple), reserve 3 (green), uncorrelated (turquoise), and closepreferences (turquoise with dots). Includes simulated Old and New Mecha-nisms for comparison.
Figure 32. Proportion of toppers coming from each state/territory in JointCadres (Manipur-Tripura and Assam-Meghalaya) and Grouped Cadre (AG-MUT).
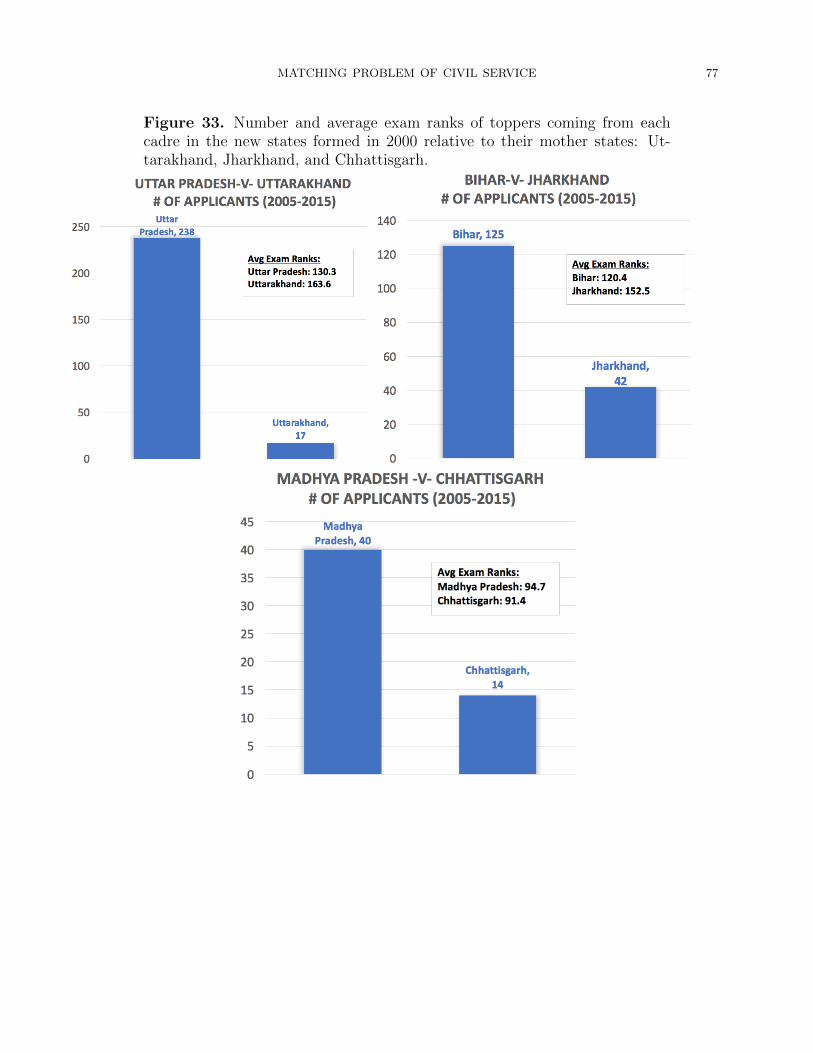
MATCHING PROBLEM OF CIVIL SERVICE 77
Figure 33. Number and average exam ranks of toppers coming from eachcadre in the new states formed in 2000 relative to their mother states: Ut-tarakhand, Jharkhand, and Chhattisgarh.

78 ASHUTOSH THAKUR
Figure 34. Number and average exam rank of toppers from Joint Cadres(Manipur-Tripura and Assam-Meghalaya) and Grouped Cadre (AGMUT).
Figure 35. t-statistic comparing candidate-proposing (Left) and cadre-proposing (Right) Deferred Acceptance using various simulated preferencesto Actual Assignments. Simulations for block (red), reserve 3 (blue), uncorre-lated (green), and close preferences (purple). Includes simulated Old and NewMechanisms for comparison.

MATCHING PROBLEM OF CIVIL SERVICE 79
Figure 36. Percentile of average preference rank of assignment for candidates(Left) and states (Right) with Deferred Acceptance. Simulations for block(black), reserve 3 (green), uncorrelated (blue), and close preferences (red).
Figure 37. t-statistic comparing candidate-proposing (Left) and cadre-proposing (Right) Deferred Acceptance with insider soft constraints and vari-ous simulated preferences to Actual Assignments. Simulations for block (red),reserve 3 (blue), uncorrelated (green), and close preferences (purple). Includessimulated Old and New Mechanisms for comparison.
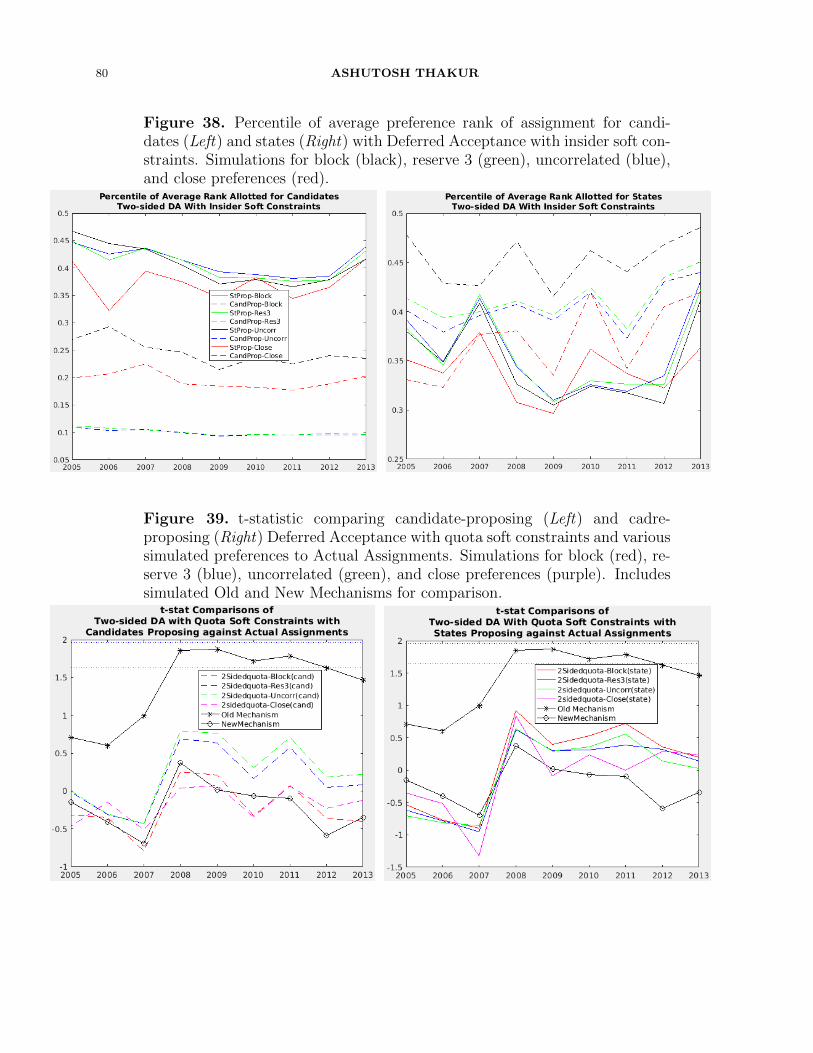
80 ASHUTOSH THAKUR
Figure 38. Percentile of average preference rank of assignment for candi-dates (Left) and states (Right) with Deferred Acceptance with insider soft con-straints. Simulations for block (black), reserve 3 (green), uncorrelated (blue),and close preferences (red).
Figure 39. t-statistic comparing candidate-proposing (Left) and cadre-proposing (Right) Deferred Acceptance with quota soft constraints and varioussimulated preferences to Actual Assignments. Simulations for block (red), re-serve 3 (blue), uncorrelated (green), and close preferences (purple). Includessimulated Old and New Mechanisms for comparison.

MATCHING PROBLEM OF CIVIL SERVICE 81
Figure 40. Percentile of average preference rank of assignment for candi-dates (Left) and states (Right) with Deferred Acceptance with quota softconstraints. Candidate performance is split by SC/ST category (Top), OBCcategory (Middle), and General category (Bottom). Solid (dashed) lines havestates (candidates) proposing. Simulations for block (black), reserve 3 (green),uncorrelated (blue), and close preferences (red).
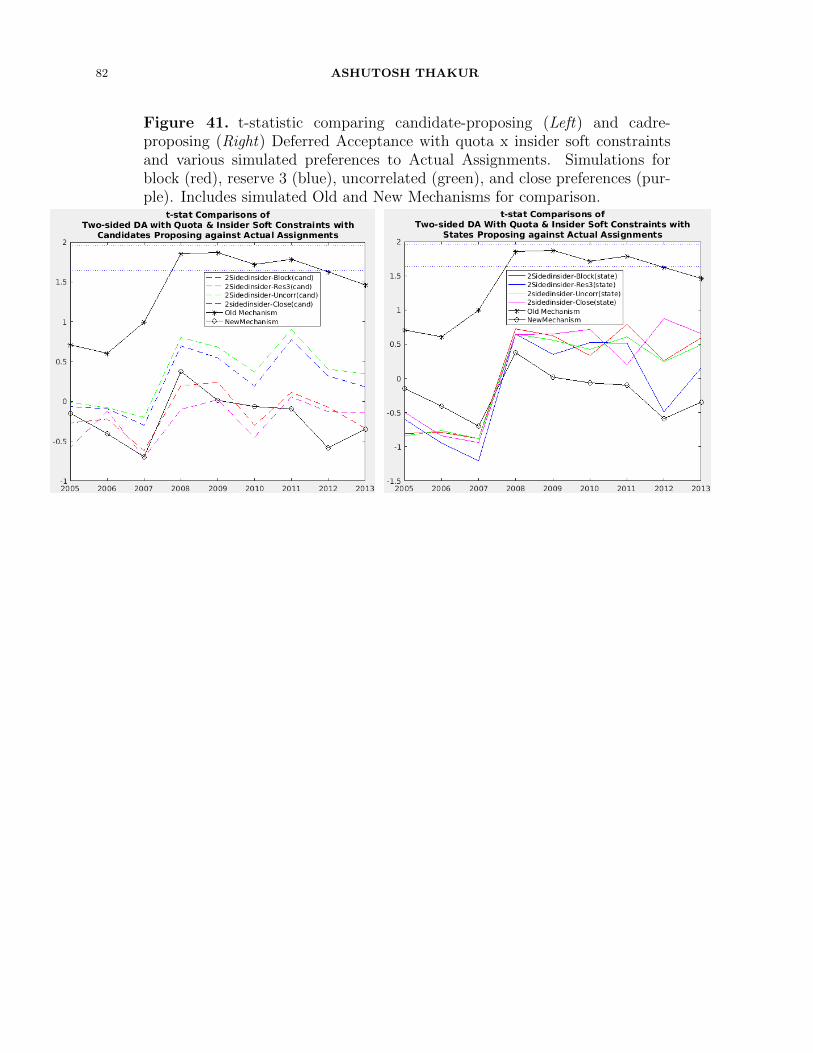
82 ASHUTOSH THAKUR
Figure 41. t-statistic comparing candidate-proposing (Left) and cadre-proposing (Right) Deferred Acceptance with quota x insider soft constraintsand various simulated preferences to Actual Assignments. Simulations forblock (red), reserve 3 (blue), uncorrelated (green), and close preferences (pur-ple). Includes simulated Old and New Mechanisms for comparison.

MATCHING PROBLEM OF CIVIL SERVICE 83
Figure 42. Percentile of average preference rank of assignment for candidates(Left) and states (Right) with Deferred Acceptance with quota x insider softconstraints. Candidate performance is split by SC/ST category (Top), OBCcategory (Middle), and General category (Bottom). Solid (dashed) lines havestates (candidates) proposing. Simulations for block (black), reserve 3 (green),uncorrelated (blue), and close preferences (red).

84 ASHUTOSH THAKUR
Figure 43. Variance of percentile average preference rank of assigned candi-dates across cadres for Deferred Acceptance with no reservations (Top Left),Deferred Acceptance with insider soft constraints (Top Right), Deferred Ac-ceptance with quota soft constraints (Bottom Left), and Deferred Acceptancewith quota x insider soft constraints (Bottom Right). Solid (dashed) lines havestates (candidates) proposing. Simulations for block (black), reserve 3 (green),uncorrelated (blue), and close preferences (red).

MATCHING PROBLEM OF CIVIL SERVICE 85
Appendix A. 2018 Cadre Allocation Policy & Strategyproofness
The UPSC announced on 5th September, 2017 a revised cadre allocation policy startingfor the 2018 batches onwards, which is the New Mechanism discussed at length in thispaper, but with an added preference order restriction for the civil servants when rankingthe cadres63. We discussed such a possibility in Section 6.3 prior to the announcement ofthis new policy. In this appendix, we describe the preference order restriction and show whysuch a restriction renders the system non-strategyproof.
The 2018 revised cadre allocation policy groups the cadres into 5 zones by region:
(1) Zone I: AGMUT, Jammu and Kashmir, Himachal Pradesh, Uttarakhand, Punjab,Rajasthan and Haryana
(2) Zone II: Uttar Pradesh, Bihar, Jharkhand and Odisha(3) Zone III: Gujarat, Maharashtra, Madhya Pradesh and Chhattisgarh(4) Zone IV: West Bengal, Sikkim, Assam-Meghalaya, Manipur, Tripura and Nagaland(5) Zone V: Telangana. Andhra Pradesh, Karnataka, Tamil Nadu and Kerala
Each candidate must first to rank the 5 zones in order of preference 1:5, and then, rank theirpreference amongst cadres within each zone separately. Then, the final preference order forthe candidate rotates first across the 5 zones in order of within zone preference: i.e.,
(1) 1st preferred cadre in 1st preferred Zone(2) 1st preferred cadre in 2nd preferred Zone(3) 1st preferred cadre in 3rd preferred Zone(4) 1st preferred cadre in 4th preferred Zone(5) 1st preferred cadre in 5th preferred Zone(6) 2nd preferred cadre in 1st preferred Zone(7) 2nd preferred cadre in 2nd preferred Zone(8) ...
Two other important caveats are important:
(1) To qualify for insider vacancy, candidate must rank Zone containing his home cadreas his 1st choice, and must rank his home cadre as the 1st choice within that Zone64.
(2) Not ranking cadres or zones is treated as indifference amongst unranked cadres orzones. 65
In Section 6, we discussed the strategyproofness of various mechanisms: the Old Mecha-nism is theoretically not strategyproof but very ‘hard’ to game and the New Mechanism isnot strategyproof because of the Insider priority. It is important to note that in the subset ofnon-home state cadres, ranking is strategyproof under the New Mechanism, as it is based on
63See https:easy.nic.incsePlusDocscadrepolicy2017.pdf for official 2018 policy.64“A candidate shall be allotted to his Home cadre, on the basis of his merit, preference and vacancy availableat his turn in his category. For allocation to Home cadre against an Insider vacancy, a candidate will berequired to express his first preference to the Zone in which his Home cadre falls as well as first preferenceto the Home cadre within that relevant Zone, otherwise he shall not be considered for his Home cadre at all.” (2018 Cadre Allocation Policy)65“If a candidate does not give any preference for any of the Zones/Cadres, it will be presumed that he hasno specific preference for those Zones/cadres. Accordingly, if he is not allocated to any one of the cadresfor which he has indicated the preference, he shall be allotted along with other such candidates in the orderof rank to any of the remaining cadres, arranged in an alphabetical order, in which there are vacancies inhis category after allocation of all the candidates who can be allotted to cadres in accordance with theirpreference. ” (2018 Cadre Allocation Policy)
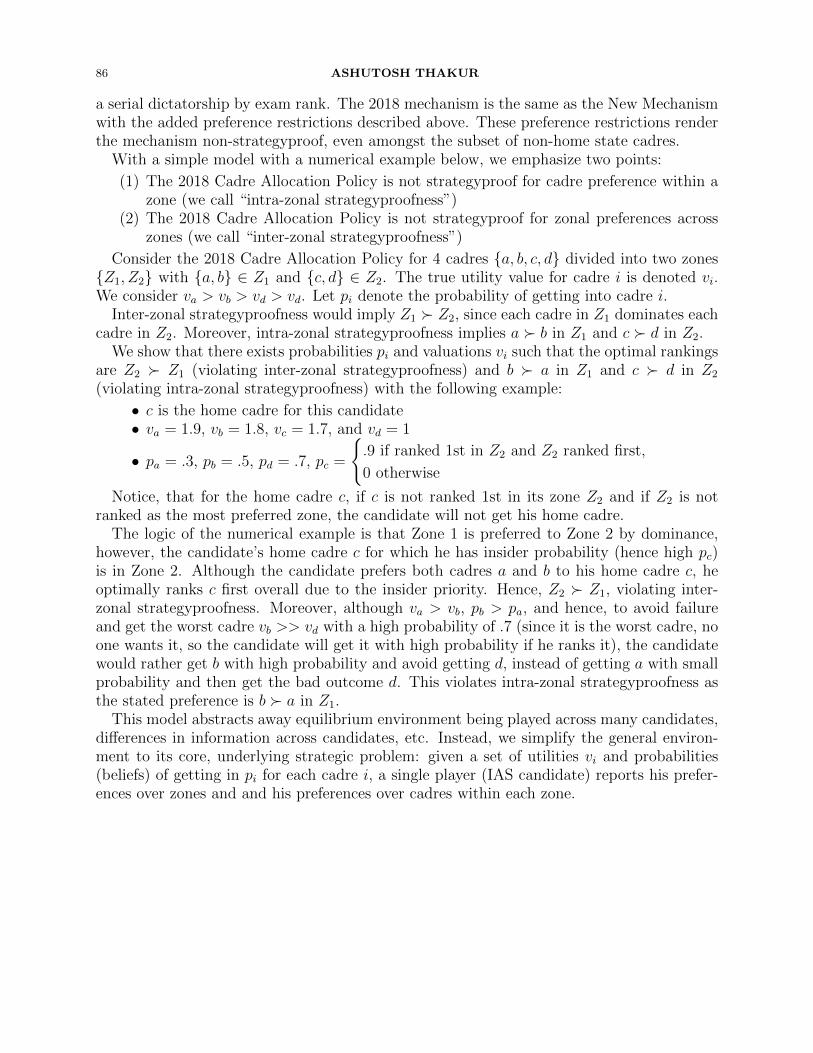
86 ASHUTOSH THAKUR
a serial dictatorship by exam rank. The 2018 mechanism is the same as the New Mechanismwith the added preference restrictions described above. These preference restrictions renderthe mechanism non-strategyproof, even amongst the subset of non-home state cadres.
With a simple model with a numerical example below, we emphasize two points:
(1) The 2018 Cadre Allocation Policy is not strategyproof for cadre preference within azone (we call “intra-zonal strategyproofness”)
(2) The 2018 Cadre Allocation Policy is not strategyproof for zonal preferences acrosszones (we call “inter-zonal strategyproofness”)
Consider the 2018 Cadre Allocation Policy for 4 cadres {a, b, c, d} divided into two zones{Z1, Z2} with {a, b} ∈ Z1 and {c, d} ∈ Z2. The true utility value for cadre i is denoted vi.We consider va > vb > vd > vd. Let pi denote the probability of getting into cadre i.
Inter-zonal strategyproofness would imply Z1 � Z2, since each cadre in Z1 dominates eachcadre in Z2. Moreover, intra-zonal strategyproofness implies a � b in Z1 and c � d in Z2.
We show that there exists probabilities pi and valuations vi such that the optimal rankingsare Z2 � Z1 (violating inter-zonal strategyproofness) and b � a in Z1 and c � d in Z2
(violating intra-zonal strategyproofness) with the following example:
• c is the home cadre for this candidate• va = 1.9, vb = 1.8, vc = 1.7, and vd = 1
• pa = .3, pb = .5, pd = .7, pc =
{.9 if ranked 1st in Z2 and Z2 ranked first,
0 otherwise
Notice, that for the home cadre c, if c is not ranked 1st in its zone Z2 and if Z2 is notranked as the most preferred zone, the candidate will not get his home cadre.
The logic of the numerical example is that Zone 1 is preferred to Zone 2 by dominance,however, the candidate’s home cadre c for which he has insider probability (hence high pc)is in Zone 2. Although the candidate prefers both cadres a and b to his home cadre c, heoptimally ranks c first overall due to the insider priority. Hence, Z2 � Z1, violating inter-zonal strategyproofness. Moreover, although va > vb, pb > pa, and hence, to avoid failureand get the worst cadre vb >> vd with a high probability of .7 (since it is the worst cadre, noone wants it, so the candidate will get it with high probability if he ranks it), the candidatewould rather get b with high probability and avoid getting d, instead of getting a with smallprobability and then get the bad outcome d. This violates intra-zonal strategyproofness asthe stated preference is b � a in Z1.
This model abstracts away equilibrium environment being played across many candidates,differences in information across candidates, etc. Instead, we simplify the general environ-ment to its core, underlying strategic problem: given a set of utilities vi and probabilities(beliefs) of getting in pi for each cadre i, a single player (IAS candidate) reports his prefer-ences over zones and and his preferences over cadres within each zone.

MATCHING PROBLEM OF CIVIL SERVICE 87
Appendix B. Nested Matching Mechanisms.
While this paper primarily focuses on the matching mechanism used to assign IAS officersto state cadres, it is important to realize that this matching mechanism is nested inside amechanism to allocate the exact service within the many civil services which take the CivilServices Exam.
The entire process is as follows: i) candidates take the preliminary exam, ii) those whoqualify to appear for the main exam report their service preferences66, iii) those who areselected from the main exam are assigned to service via Service Allocation Mechanism, andfinally, iv) each service then conducts its relevant training and within service allocation67.Note that unlike in IPS and IAS, other civil services do not necessarily have life-long assign-ments to cadres, and moreover, IFS assignments are often postings to foreign countries.
The Service Allocation mechanism is simply a serial dictatorship in order of exam rank.However, it is important to note that despite serial dictatorship being strategyproof mecha-nism by itself, since the service allocation mechanism is followed by within service allocation—such as the cadre allocations for the IPS and IAS—where relative rank matters, this systemis not strategyproof.
By backwards induction, even if the cadre allocation system were strategyproof, if itprioritizes in order of relative exam rank within those who are allotted to IAS, the serviceallocation mechanism is rendered to be non-strategyproof. For example, the strategizinginvolves figuring out what one’s relative rank would be after qualifying past the main exam,how toppers (if any) above you chose their services, and hence, what your relative rankingwould be for each of the different services. Relative ranking in the service would yield alottery over within-service assignment and hence a lottery over utilities for each post. Ifwithin service allocations, prioritize by exam rank, such as in the New Mechanism underIAS and IPS cadre allocation mechanisms, then, expected value from vs(i) ≥ vs(i+1) for anyrelative rank i within the service. Namely, within a service s, a higher rank provides weaklyhigher expected payoff. Note, that under the Old Mechanism which only prioritized examrank for the insider category, but not for outsider spots, the inequality does not necessarilyhold. For example, being 10th vs 11th might get you allocated to different cadres as anoutsider, and the candidate may prefer allocation when he’s 11th than when he’s 10th withinthe IAS.
66The services which follow under the common Civil Service Examination are i. Indian AdministrativeService (IAS), ii. Indian Foreign Service, iii. Indian Police Service, iv. Indian P&T Accounts & FinanceService, Group ’A’, v. Indian Audit & Accounts Service, Group ’A’, vi. Indian Customs & Central ExciseService, Group ’A’, vii. Indian Defence Accounts Service, Group ’A’, viii. Indian Revenue Service, Group’A’, ix. Indian Ordnance Factories Service, Group ’A’, x. Indian Postal Service, Group ’A’, xi. Indian CivilAccounts Service, Group ’A’, xii. Indian Railway Traffic Service, Group ’A’, xiii. Indian Railway AccountsService, Group ’A’, xiv. Indian Railway Personnel Service, Group ’A’, xv. Posts of Assistant SecurityCommissioner in Railway Protection Force, Group ’A’, xvi. Indian Defence Estates Service, Group ’A’, xvii.Indian Information Service, (Junior Grade), Group ’A’, xviii. Indian Trade Service, Group ’A’, xix. IndianCorporate Law Service, Group ’A’, xx. Armed Forces Headquarters Civil Service, Group ’B’, xxi. Delhi,Andaman & Nicobar Islands, Lakshadweep, D D & NH Civil Service, Group ’B’, xxii. Delhi, Andaman &Nicobar Islands, Lakshadweep, D D & NH Police Service, Group ’B’, xxiii. Pondicherry Civil Service, Group’B’, xxiv. Pondicherry Police Service, Group ’B67Both service and cadre preference rank orders are given before the main examination, after which theexamination and interview are held. Thus, candidates do not know their ranks while making the application.The total number of vacancies and service-wise breakdown is announced in the advertisement, but the numberof vacancies in each cadre/state is not known.

88 ASHUTOSH THAKUR
With the New Mechanism however, both in the IAS and the IPS, candidates would beweakly better off having a better rank within the service.
In the data, we see that most toppers opt for the IAS, followed by IFS and IPS, and thenfollowed by a mix of the other civil services. Figures 44 and 45 show that the lowest averageexam rank services are 1) IAS, 2) IPS, 3) IFS, 4) IRS, and then the rest of the services takingthe Civil Service Examination. It is possible that preferences of the toppers are such thatthey prefer every IAS cadre allocation to any IPS, IFS or other service position; however,suppose they prefer being in their home cadre relative to any other assignment, then it ispossible that a candidate who otherwise prefers IAS over IPS, would rank IPS higher in theservice preference, if say there is a big chance he gets an insider position in the IPS, but notthe IAS.
Figure 44. We plot the average exam rank in the Civil Service Examinationfor year 2013 across the various services. Notice that IAS, IFS, IPS, and IRShave the lowest average exam rank, consistent with being the most sought-afterservices.
We note that it is particularly difficult in this instance to strategize since service choice ismade before the candidate knows his final rank, and hence, it requires a lot of informationto effectively strategize.
Overall, the fact that the overall system involves nested matching mechanisms, even twoserial dictatorship in order of exam rank, which are strategyproof in isolation, when combinedin this nested manner, render the entire system non-strategyproof in the first step.

MATCHING PROBLEM OF CIVIL SERVICE 89
Figure 45. We plot the average exam rank in the Civil Service Examinationfor years 2005-2016 across various services. Notice that IAS, IFS, IPS, andIRS are always amongst the the lowest average exam rank services, consistentwith being the most sought-after services.

90 ASHUTOSH THAKUR
Appendix C. Other All-India Services: Indian Police Services & IndianForest Services
This appendix analyzes the analogous effects of the Old and New Mechanisms for theother two All-India Services: the Indian Police Service (IPS) and the Indian Forest Service(IFoS). We make do with considerably incomplete data availability for the IPS and IFoS,however, for years 2008 for IPS and 2015 for IFoS, we have preference rank orders of thecandidates, which allows for explicit analysis of correlation in rank order preferences.
Table 21. Preferences of 122 IPS officers admitted from the 2008 CivilService Examination. The left column shows the average rank (out of 24cadres) IPS officers assigned to each cadre, while the right column shows thestandard deviation of rank assigned to each cadre. Notice the bad cadres(bolded) are consistently ranked amongst the last in IPS officers’ rank orderpreferences. Data fromhttp://mha.nic.in/hindi/sites/upload files/mhahindi/files/pdf/CardAllokts2008.pdf
Cadre Average Cadre Std DevRajasthan 5.8 Nagaland 1.5Maharashtra 6.0 Manipur-Tripura 2.0Gujarat 6.8 Rajasthan 3.1Haryana 6.8 Gujarat 3.4Punjab 7.3 Maharashtra 3.4Madhya Pradesh 7.3 Sikkim 3.5Karnataka 7.7 Punjab 3.6Uttar Pradesh 8.5 Assam Meghalaya 3.7Uttarakhand 9.8 Orissa 3.9Andhra Pradesh 9.9 Madhya Pradesh 4.1Tamil Nadu 10.2 West Bengal 4.2AGMUT 10.4 Haryana 4.3Himachal Pradesh 10.6 Uttarakhand 4.3Bihar 12.7 Himachal Pradesh 4.4Kerala 12.9 Jammu & Kashmir 4.4Orissa 14.7 Chhattisgarh 4.5Jharkhand 15.3 Jharkhand 4.9West Bengal 15.4 Karnataka 5.1Chhattisgarh 15.6 Andhra Pradesh 5.7Sikkim 18.8 Uttar Pradesh 6.0Assam Meghalaya 19.1 Kerala 6.2Jammu & Kashmir 20.9 Bihar 6.3Manipur-Tripura 21.9 AGMUT 6.6Nagaland 22.9 Tamil Nadu 6.6

MATCHING PROBLEM OF CIVIL SERVICE 91
Figure 46. Top: average exam rank of assigned IPS candidates across goodand bad cadres. Bottom: variance of average exam rank of assigned IPScandidates across cadres. Notice the divergence in good and bad cadres and asizable increase in variance in average exam rank across cadres with the NewMechanism. Hence, IPS faces the same imbalance on the quality dimensionas IAS with the New Mechanism since All India Services use the same cadreassignment mechanisms. Data available for years 2006-07, 2010, 2012, and2013-15 from http://mha1.nic.in/ips/ips misc cse.htm and year 2008 fromhttp://mha.nic.in/hindi/sites/upload files/mhahindi/files/pdf/CardAllokts2008.pdf

92 ASHUTOSH THAKUR
Figure 47. The figures show the occurrence rate of the cadres among the5 most preferred cadres (Top Left) and the 5 least preferred cadres (Right).Notice that bad cadres are consistently preferred amongst the 5 least preferredcadres and seem to rarely be top preference of IPS officers.
Table 22. The number of cadres ranked by 122 IPS officers admitted fromthe 2008 Civil Service Examination. 93% of IPS officers gave completepreferences (with some indifference). 121 out of 122 indicated wanting tobe an insider (i.e., 1st choice was home cadre). Note that no cadre can bedeemed unacceptable, so incomplete preferences are treated as the candidatebeing indifferent over all unranked cadres. Data fromhttp://mha.nic.in/hindi/sites/upload files/mhahindi/files/pdf/CardAllokts2008.pdf
Fraction of Cadres Ranked # Officers24/24 1135/24 110/24 111/24 212/24 117/24 118/24 121/24 10/24 1

MATCHING PROBLEM OF CIVIL SERVICE 93
Table 23. Preference of 110 IFoS officers admitted from the 2015 and 2016Civil Service Examinations . The left columns show the average rank (out of26 cadres) IFoS officers assigned to each cadre, while the right columns showthe standard deviation of rank assigned to each cadre. Notice the bad cadres(bolded) are consistently ranked amongst the last in IFoS officers’ rank orderpreferences. Data from http://ifs.nic.in
Cadre Average Cadre Std DevMadhya Pradesh 4.9 Nagaland 3.0Maharashtra 6.3 Maharashtra 3.3Karnataka 7.3 Manipur 3.4Rajasthan 7.5 Tripura 3.6Gujarat 7.7 Gujarat 3.8Himachal Pradesh 9.0 Madhya Pradesh 3.9Uttarakhand 9.4 West Bengal 4.3Uttar Pradesh 9.7 Jammu Kashmir 4.5Andra Pradesh 10.3 Assam Meghalaya 4.7Telangana 11.4 Himachal Pradesh 5.0Haryana 12.3 Karnataka 5.1AGMUT 12.3 Orissa 5.1Tamil Nadu 12.9 Rajasthan 5.3Punjab 12.9 Sikkim 5.3Kerala 12.9 Punjab 5.6Chhattisgarh 13.7 Jharkhand 5.7Orissa 14.4 Andra Pradesh 6.0Jharkhand 14.9 Kerala 6.1Bihar 15.2 AGMUT 6.1West Bengal 17.2 Bihar 6.2Sikkim 17.8 Chhattisgarh 6.2Assam Meghalaya 18.7 Uttar Pradesh 6.3Jammu & Kashmir 21.8 Uttarakhand 6.3Tripura 22.7 Telangana 6.5Manipur 23.2 Haryana 6.5Nagaland 24.3 Tamil Nadu 7.1

94 ASHUTOSH THAKUR
Appendix D. Qualitative Description of other Market DesignConsiderations and Policies
In this appendix, we qualitatively describe four important discussions which arose duringinterviews with IAS officers, which are innately related to cadre allocation: i) marriagebetween civil servants, ii) inter-cadre deputation, iii) state civil service promotion, and iv)lateral entry. Without taking any normative or positive stance, we simply wish to describethe policies at hand, emphasize how they shape incentives, and provide references to relatedmarket design solutions used in other applications where possible. All of these issues werehighlighted in interviews and talks with various IAS officers.
D.1. Marriage amongst Civil Servants.Apart from extreme scenarios, essentially the only way an All-India Services officer can
get a permanent change in the cadre allocation which we describe in this paper, is throughmarriage with another civil servant assigned to another state cadre. This is becoming anincreasingly important concern over the years as marriages amongst All-India Services appearto be more frequent over the years68. Rules dictating possible cadre changes as a result oftwo All-India Services officers getting married have changed over the years69 and requestsare dealt with on a case-by-case basis by the Department of Personnel and Training.
Currently, there are a few considerations taking into account in this process. First, thecouple has four choices: i) choose cadre of spouse 1, ii) choose cadre of spouse 2, iii) chooseto jointly move to a 3rd cadre which neither spouse is originally assigned to, or iv) remainin two separate cadres. In requesting a move to a cadre where a spouse has been originallyassigned to, considerations for whether this cadre is under- or over-prescribed relative to itsneed and strength are considered. For example, moves to under-prescribed or deficient cadresare given priority. Moreover, if a spouse’s cadre is one’s home cadre, a move to that cadre isnot allowed due to insider rule considerations. Finally, some IAS officers choose to remain intwo separate cadres and take on temporary deputations to each other or contemporaneouslyto a shared third cadre. Which of the four option the couple opts for depends on what theDepartment of Personnel and Training approves, what the available moves are, and othercareer considerations of each spouse.
Although this topic in the Indian context relates to ex post (after initial assignment)switches due to marriage, the problem of married couples entering the initial matchingmechanism has been addressed in many mechanisms around the world, for example, theNational Resident Matching Program:
Some references:
• Kojima, Fuhito, Parag A. Pathak, and Alvin E. Roth. ”Matching with couples:Stability and incentives in large markets.” The Quarterly Journal of Economics 128.4(2013): 1585-1632.• Roth, Alvin E. ”The evolution of the labor market for medical interns and residents:
a case study in game theory.” Journal of Political Economy 92.6 (1984): 991-1016.
68See https://economictimes.indiatimes.com/news/politics-and-nation/33-ias-officers-seek-cadre-change-many-due-to-marriage/articleshow/47150661.cms for 2015 requests for cadre changes on basis of marriage.69See https://www.hindustantimes.com/india-news/pm-changes-rules-to-help-married-ias-ips-officers-work-at-one-place/story-SpzB04bWKvuNbXw6bJWWyJ.html for the most recent change in policy.

MATCHING PROBLEM OF CIVIL SERVICE 95
• Roth, Alvin E., and Elliott Peranson. ”The redesign of the matching market forAmerican physicians: Some engineering aspects of economic design.” American eco-nomic review 89.4 (1999): 748-780.
D.2. Inter-cadre Deputation.Other than marriage considerations as explained above, the cadre allocation is permanent.
However, IAS officers can be deputed temporarily to another cadre or to the Centre. Intercadre deputation is important to understand incentives; IAS officers believe that those inbad cadres are more likely to petition for temporary inter-cadre deputation to another cadre.Moreover, some All-India Services couples choose to remain in separate cadres after mar-riage, and seek temporary deputations to the spouse’s cadre or jointly to a different cadre.Petitions need to be made for inter-cadre deputation, the central government and both stategovernments must agree, and rules establish minimum requirements of tenure (usually 9years in assigned cadre) before being qualified to request inter-cadre deputation, maximumtenure on an inter-cadre deputation (3 years, increased to 5 years from 201670), and a life-long limit of 5 inter-cadre deputations over the course of a career for All-India Services. Forcadres where there is a shortage of All-India Service officers—Chhattisgarh, Sikkim, Naga-land, Uttarakhand, and Manipur-Tripura—9 year tenure requirements are relaxed to 3 yeartenure requirements in the assigned cadre.
Reference for complete set of rules for inter-cadre deputation:
• Department of Personnel and Training Circular:http://documents.doptcirculars.nic.in/D2/D02ser/13017 16 2003-AIS-I-D-08112004.pdf
D.3. State Civil Service Promotion.While we focus in this paper on the cadre allocation policies for direct recruits, another
method of entry into the All-India Services includes appointment by promotion from statecivil services. Before 2013, promotion of state civil servants used to be based on seniorityand performance evaluation based on annual confidential reports; however, from 2013 on-wards state civil service promotees have to take the UPSC exam and qualify. who enter byqualifying from the Civil Service Examination, another entry into the IAS is via promotionfrom the state civil service71.
There are a few considerations in this process worth noting. First, state service promoteeshad different (often times easier) entry exams and less competition compared to IAS officers.Second, state service promotees do not enter the Old or New Mechanism, but get promotedas insiders to their home cadre. Third, in the past, cadres where many state promotees werepromoted to insider IAS, posted fewer insider vacancies in the Cadre Allocation process weanalyze in this paper, since insider balance was crowded out by state promotees. Fourth, forseniority calculations, for every 2.5 years a state civil servant serves, he is awarded 1 year ofIAS seniority when promoted.
State Civil Service Promotion thus becomes an alternative path to enter the All-IndiaServices with less competition at start for qualifying for the service through exams andinterviews, guarantee of home cadre if get promoted, and seniority adjustment of 1 year/2.5
70See https://economictimes.indiatimes.com/news/politics-and-nation/centre-increases-inter-cadre-deputation-period-up-to-five-years/articleshow/51882169.cms71See https://timesofindia.indiatimes.com/india/Exams-for-state-civil-services-officers-for-promotion-to-IAS/articleshow/27861653.cms
96 ASHUTOSH THAKUR
years. Finally, promotion to All-India Services requires the approval of a minister, and hence,concerns of favoritism have also been raised.
References:
• See UPSC rules and regulations for appointment by promotion:http://www.upsc.gov.in/about-us/divisions/all-india-services-ais-branch/appendices/ias-
appointment-promotion-regulations-1955
D.4. Lateral Entry.Whether or not to allow lateral entry into the elite civil services has been a hotly debated
topic over the years. Regardless of the formal rules, appointees have made it to high, seniorpositions in government without having to climb the Civil Service hierarchy. At the heart ofthe debate, is the question of specialist versus generalist: whether certain administrative andpolicy-making jobs require specialist knowledge within the particular domain or whether ageneralist can manage just as well. The All-India Services, which evolved from the colonialIndian Civil Services, has maintained confidence in a generalist system, but lateral entryallows for specialists to be recruited laterally into the system as needed. The further questionremains: after a lateral appointment to a post in the government bureaucracy, can these folkscontinue in the civil services? If so, in which cadre and at what seniority in the bureaucratichierarchy?

MATCHING PROBLEM OF CIVIL SERVICE 97
Appendix E. Civil Service Examination & Interview Format
In the mandarin system of Indian civil service where selection into the bureaucracy isbased on candidates’ performance on the Civil Service Examination, the exam rank/scorerepresents the only standardized proxy for quality the government has at time of assignment.Exam rank plays a key role in the assignment processes and the government’s desire to im-plement a quality balance constraint as highlighted in this paper, making the Civil ServiceExamination an integral part of the selection/matching process. This section replicates se-lected sections from UPSC’s 2017 Examination Notice72. The syllabus and precise weightingchanges slightly across years73, but this provides an overall idea of the examination formatand syllabus so that we better understand the screening process.
Appendix I, Section I: Plan of Examination (p. 124).“The competitive examination comprises two successive stages:
(1) Civil Services (Preliminary) Examination (Objective type) for selection of candidatesfor Main Examination; and
(2) Civil Services (Main) Examination (Written and Interview) for selection of candidatesfor various Services and posts.
The Preliminary Examination will consist of two papers of Objective type (multiple choicequestions) and carry a maximum of 400 marks... This examination is meant to serve as ascreening test only; the marks obtained in the Preliminary Examination by the candidateswho are declared qualified or admission to the Main Examination will not be counted fordetermining their final order of merit. The number of candidates to be admitted to theMain Examination will be about twelve to thirteen times the total approximate number ofvacancies to be filled in the year through this examination.”
Appendix I, Section II: Scheme and subjects for the Preliminary and MainExamination (p. 125).
“A) Preliminary Examination:Examination shall comprise of two compulsory Papers of 200 marks each.
• Paper I General Studies:– “i) Current events of national and international importance, ii) history of In-
dia and Indian National Movement, iii) Indian and World Geography-Physical,Social, Economic, Geography of India and the World, iv) Indian Polity andGovernance- Constitution, Political System, Panchayati Raj, Public Policy, RightIssues, etc, v) Economic and Social Development- Sustainable Development,Poverty, Inclusion, Demographics, Social Sector Initiatives, etc, vi) General is-sues on Environmental ecology, Bio-diversity and climate change - that do notrequire subject specialization, vii) General Science” (p. 128)
• Paper II General Studies:
72http:www.upsc.gov.insitesdefaultfilesEngl CSP 2017.pdf. This official notice provides a more detailed syl-labus.73The largest change in exam format was across pre-2012 exams (2300 points consisting of Essay (200 pts),General Studies I (300) and II (300), Optional Ii (300) and Iii (300), Optional IIi(300) and IIii(300), andInterview (300), and post-2012 (2025 points) system explained in the text.

98 ASHUTOSH THAKUR
– “Comprehension, Interpersonal skills including communication skills, local rea-soning and analytical ability, decision making and problem solving, general men-tal ability, basic numeracy (Class X level)” (p. 128)
– The General Studies Paper-II of the Civil Services (Preliminary) Examinationwill be a qualifying paper with minimum qualifying marks fixed at 33%.
B) Main Examination:The written examination will consist of the following papers:Qualifying Papers:
• Paper-A: One of the Indian Language to be selected by the candidate (300 marks)– Language must be chosen from Assamese, Bengali, Gujarati, Hindi, Kannada,
Kashmiri, Konkani, Malayalam, Manipuri, Marathi, Nepali, Oriya, Punjabi,Sanskrit, Sindhi, Tamil, Telugu, Urdu, Bodo, Dogri, Maithilli, and Santhali(p. 126).
• Paper-B: English (300 marks)
Papers to be counted for merit:
• Paper-I: Essay (250 Marks)• Paper-II General Studies-I: Indian Heritage and Culture, History and Geography of
the World and Society (250 marks)• Paper III General Studies-II: Governance, Constitution, Polity, Social Justice and
International Relations (250 marks)• Paper IV General Studies-III: Technology, Economic Development, Bio-diversity, En-
vironment, Security and Disaster Management (250 marks)• Paper V General Studies-IV: Ethics, Integrity and Aptitude (250 marks)• Paper VI Optional Subject - Paper 1 (250 marks)• Paper VII Optional Subject - Paper 2 (250 marks)
– The list of optional subjects for Main Examinations: Agriculture, Animal Hus-bandry and Veterinary Science, Anthropology, Botany, Chemistry, Civil Engi-neering, Commerce and Accountancy, Economics, Electrical Engineering, Ge-ography, Geology, History, Law, Management, Mathematics, Mechanical En-gineering, Medical Science, Philosophy, Physics, Political Science and Interna-tional Relations, Psychology, Public Administration, Sociology, Statistics, Zool-ogy, Literature of any one of Indian languages (p. 126)
Sub Total: Written test (1750 marks)
Personality Test (275 marks)
“The candidate will be interviewed by a Board who will have before them a record of hiscareer. He will be asked question on matters of general interest. The object of the interviewis to assess the personal suitability of the candidate for a career in public service by a Boardof competent and unbiased observers. The test is intended to judge the mental caliber of acandidate. In broad terms this is really an assessment of not only his intellectual qualitiesbut also social traits and his interest in current affairs. Some of the qualities to be judgedare mental alertness, critical powers of assimilation, clear and logical exposition, balance ofjudgment, variety and depth of interest, ability for social cohesion and leadership and moral

MATCHING PROBLEM OF CIVIL SERVICE 99
integrity.” (p. 127)
Grand Total: 2025 marks”

100
ASHUTOSH
THAKUR
Appendix F. Additional Figures & Tables
Table 24. Effect of Mechanism on Exam Rank by State: Year-by-year Effects & Placebo testsThis table expands upon the difference-in-difference specifications for average exam ranks (col 1-3) and normalized state examranks (col 4-6) from Table 1, using data from 2005-13. The overall effect (col 1 and 4) is split apart into year-by-year effects (col2 and 5) and then placebo tests by including 2006 and 2007 as post-treatment years (col 3 and 6). As expected, the placebotests have insignificant effects on these Old Mechanisms years.
(1) (2) (3) (4) (5) (6)StAvgExmRnk StAvgExmRnk StAvgExmRnk NormalizedStExmRnk NormalizedStExmRnk NormalizedStExmRnk
badcadrenewmech 114.8∗∗∗ 0.784∗∗∗
(24.56) (0.202)bad08 46.58 52.27 0.396 0.456
(59.47) (62.89) (0.506) (0.546)bad09 153.6∗∗∗ 159.2∗∗∗ 1.136∗∗∗ 1.196∗∗∗
(49.01) (53.76) (0.383) (0.439)bad10 148.1∗∗∗ 153.8∗∗∗ 0.995∗∗∗ 1.056∗∗∗
(30.78) (33.20) (0.201) (0.246)bad11 110.3∗∗ 115.9∗ 0.862∗ 0.923∗
(56.03) (63.90) (0.444) (0.530)bad12 82.10∗ 87.79∗∗ 0.475∗ 0.536∗
(46.05) (44.66) (0.271) (0.278)bad13 148.2∗∗∗ 153.9∗∗∗ 0.838∗∗∗ 0.899∗∗∗
(44.32) (46.07) (0.236) (0.276)bad07 1.425 0.0163
(26.73) (0.283)bad06 15.64 0.166
(25.02) (0.265)Constant 72.99∗∗∗ 72.99∗∗∗ 74.65∗∗∗ -0.153∗ -0.153 -0.135
(9.514) (9.647) (11.18) (0.0925) (0.0938) (0.111)Year FE X X X X X XState FE X X X X X XObservations 216 216 216 216 216 216Standard errors in parentheses are clustered at the state cadre level
* p < 0.10, ** p < 0.05, *** p < 0.01