matching-to-sanple aerial visul shape problem
TRANSCRIPT
MD-l69 356 AERIAL VISUL SHAPE DISCRIINATION AND /MATCHING-TO-SANPLE PROBLEM SOLVINO.. (U) NAVAL OCEANSYSTEMS CENTER SAN DIEGO CA N K CHUN MAY 76
fUNCLASSIFIED NOSC/TR-236 F/G 5/10 NU.KJ mhhlhm)iMENhhhhhh

w7W77 -l<e 7Z
- L2
jJ~j .25 1&24.2
MlcprOCop' CWPRT
Z- Z

z1
63 o
zv
AERIL VIUAL HAP DISRIMIATIO ANMAC N=OSML RBE OVN BLT
OF ANALNI-OTLNS4OPI
AERIAL VISUA SHAPEM DICTRMNTO NOFAN O ALNTIC BOTLN1E5OLHI
(0~~~~ ~ Bisine Dprmn

NAVAL OCEAN SYSTEMS CENTER. SAN DIEGO. CA. 92152
AN ACTIVITY OF THE NAVAL MATERIAL COMMAND
RR GAVAZZI, CAPT. USN HOWARD L BLOOD, PhDCommander Technical Director
ADMINISTRATIVE INFORMATION'A
The research was conducted at the Naval Ocean Systems (enter. Hawaii Laboratory,.and sponsored by Naval Sea Systems Command, program element 63709N.
This report was reviewed for technical accuracy by Dr. Clifford F. Hammer. Jr..Dr. Paul F. Nachtigall, and Dr. Ross L. Pepper. Acknowledgement is given to )ebbieKersting, Augustine Reyes, John Tokunaga. Robert Floyd and Marc Morinaga forproviding capable technical assistance.
Released by Under authority of
R. R. SOULE, Head H. 0. PORTER. Ilead
Biosystems Division Biosciences )epartment
* ,.."!
:."
• , ,p . * ". ".," ,". "q," • ,. .. .. .. %, . 't ".,."j"." ,",'.. .,',-"
'" .. ,'1 % ... ' ' .',,,'.. '..• , , ., . .'.','.'. ,,' . , * , - .

WI-R 's 11"117. V i r'" W.Wv -
UNCLASSIFIEDSECURITY CLASSIFICATION OF T.IS PAGE i(Whet, 17.I. Fni..,d)
REPOT DCUMNTATON AGEREAD INSTRUCTIONSREPOT DCUMNTA~ON AGEBEFORE COMPLETING FORM
REPORT NUMBER o CESSI N&0 3_RQPETjAAO NUMBER
NOSC TR 236 'AE CTAO
4. TITLE (-d Stibliti.) wWa r - sTYPE OF REPORT & PERIOD COVERED
Aerial Visual Shape Discrimination and Matching-to-Sample Behavioral ResearchProblem Solving Ability of an Atlantic Bottlenose Dolphin January - October 1976
6 PERFORMING ORG. REPORT NL MBER
7. AUTISOR(s. 8 CONTRACT OR GRANT NUMBER(.)
Norman K. W. Chun
9 PERFORMING ORGANIZATION NAME AND ADDRESS I0 PROGRAM ELEMENT. PROJECT. TASK
Naval Ocean Systems Center ARE A & WORK U NIT NUMBERS
Hawaii Laboratory 63709 NP.O. Box 997, Kailua, Hawaii 96734 ___
I1. CONTROLLING OFFICE NAME AND ADDRESS 12 REPORT DATE
Naval Sea Systems Command May 19"8Washington, D. C. 20360 13 NUMEER GE PA3ES b
2414 MONITORING AGENCY NAME A ADD.ESSUII,If., I-~, (,.tr-II, Ofil-c) 1S. SECURITY CLASS. (of this report)
Naval Ocean Systems Center UcasfeSan Diego, CA 92152 Ucasfe
15. DECLASSIFICATION DOWNGRADINGSCHEDULE
* IA6 DISTRIBUTION STATEMENT (.Il Is, Repri,
Approved for public release; distribution unlimited.
- ~~~~17 DI5TRIBUTION STA'rEMENT 1.1 ih. --,i .iird. THI, 2o. It filtrn- I,, 1 epori)
18 SUPPLEMENTARY NOTES -
tA K EY WORDS fCionton-s n resetse side it neir, esiI d.,i~ hi , I II l,.
Atantic Bottlenose Dolphin (Tursiops truncatus); Conceptual learning; Correction procedure;P Discriminative stimuli; Geometric form parameters; Matching-to-Sample; Position bias, Probetrials; Problem-specific learning; Visual Shape Discrimination. "
lO'BST AC T CosIlnes i.,, side It -ser-, .. d hd,,rI l-~S k ,sIb-p
* ---44sing a simultaneous match ing-to-samplc paradigm, two-dimensional geometric shapes ofvarious configurations were presented to a bottlenose dolphin in an aerial visual discriminationtask. Large differences in perimeter lengths between any two types of shapes presented togethergenerally resulted in better discrimination performance. Alternatively, small differences in peri- '.meter lengths of any two shape types presented together generally resulted in poor discriminatiotperformance. The absence of a monotonic function between perimeter differences and perform-ance accuracy indicated that other form parameters may be contributing factors in thediscrimination process--
DD I jDR I 1473 EDI TION GE I NOV S55 OB01SOLEFT ..... NCLASSIIED -__
5E CURITYV C LASSI C ( ATION (I1 T.,S PAGE I., il ,,.'
. . . . . . . . . . . . . . . . . . . .. . . . . .. . . . . . - .-- .\

UNCLASSIFIED
'CU ITT CLASSIFICATION OF THIS PAGE(Wh- Dl~t Enterd)
ata were collected to determine if position biases influenced response behaviors. Theresults were negative. Stimulus preference was also shown to have little effect on choice-makingby the dolphin. ,"6.
Complete changes of the discriminanda were made to assess conceptual learning by thedolphin, and the results indicated that transfer did not occur between sets of stimuli whensubsequent sets of geometric shapes differed greatly from the previously learned set. Comparisonof baseline data with a reacquisition curve of the same problem presented 6 months later clearlyindicated a function typical of problem-specific rather than conceptual learning.
/~ZC
r.T
.'-
UNCLASSIFIED_SF COPIT I~ srCL ASSV AIO,. OF THIS P 4GF'I4h,, P-aa
A~.'J,,' %.

CONTENTS
1. INTRODUCTION I
A. Background I K~
IL. METHODS 2 *
A. Subject 2 NB. Apparatus 2C. Procedure 5
Il.COMPARISON OF RESULTS 7
A. Set 1 7B. Set 2 8C. Set 3 91). Set 4 10E. Set 5 10F. Set 6 11
IV. DISCUSSION 12
A. L-uminance 12B. Position Bias 12C. Form Parameters as Predictors of Discrimination Performance 131). Concept Learning 13F. Summary 15
REFERENCES 17 I
APPENDIX A: Performance Curves-Set 1 19 '
APPENDIX B: Performance ('urves-Set 2 20 -
IJ B
APPEN DIX C: Performance Curves-Set 3 21
APPENDIX D: Performance Curvs-Set 4 22 D1
APPEND)IX E: Performance Curves-Set 5 23 Av,~lii. L 'w~e
APPENDIX F: Performance C'urves-Set 0 24 Dist S p!-ff

1. INTRODUCTION
Ten years have elapsed since Kellogg and Rice's (1966) shape discrimination experi-ment was conducted, measuring visual discrimination and the problem solving ability ofthe bottlenose dolphin. The study paved the way for other investigators by engenderinginterest in the area of dolphin vision. Cetacean vision studies have been sparse in compari-son to the voluminous work compiled in the field of echolocation.
The present experiment was designed to test the ability of the Atlantic bottlenosedolphin (Tursiops truncatus) to visually discriminate between two-dimensional stimuli ofdiffering geometric patterns in a matching-to-sample paradigm. In addition to shape discri-
mination, its objective was to gain some insight into the conceptual learning ability of thedolphin by examining its ability to apply a learned concept (matching-to-sample) to differ-ent stimulus conditions. Investigation into the dynamics of visual discrimination used by -|
the dolphin is also discussed.
A. Background
There seems to be much disagreement about whether or not the dolphin possesses good 7
visual acuity. Some authors (Matthissen 1886, and Dawson, Birndorf, and Perez. 1972)indicated that tihe vision of the Atlantic bottlenose dolphin is extremely myopic in air. On .
the other hand. Slijper (1958). and Caldwell and Caldwell (1972), argued that the dolphinpossesses good vision both in water and in air. They are supported by the performances ofdolphins in various aquaria which demonstrate the ability to leap into the air to executebehaviors which require a high degree of visual proficiency.
Gross anatomy studies by Dawson. et al, (1972) indicated that the dolphin has bettervisual acuity under bright light conditions. Their explanation is based upon the idea thatconstriction of the double-slit pupil permits only a narrow beam of light to pass throughthe centermost portion of the lens. This process allows the light rays to converge closer tothe retinal surface than would otherwise be possible if the pupil were wider. Since dolphinsare capable of producing tightly constricted pupils and also possess an acute retinal light b.
sensitivity, the light rays are not refracted to a great extent. and a clearer image on theretina is thus produced.
A dolphin eye model, developed by Rivamonte (1976) showed that displacement of
about 31nm of the lens was necessary to compensate for the refractive power of the corneain air. The dolphin does not possess tile physiological mechanism to alter the shape of therigid lens. therefore pupillary constriction provides the retinal image quality necessary forin-air vision.
77'.1

In a test of visual acuity, Pepper and Simmons (1973) presented Ronchi rulings to abottlenose dolphin at a distance of 2.8 ni. The threshold value obtained was equal to 18minutes of arc, a minimum visual angle considerably poorer than that reported for pinnipedsiSchusterman, 1972).
Herman, Peacock. Yunker and Madsen (1975) collected aerial visual acuity data fromthe dolphin at two different distances ( 1.0 in and 2.5 in). Measurements were taken sepa-rately for each eye Imonocular vision), and aerial acuity, measured in minutes of visualangle, was found to be superior at the 2.5 m distance.
Using basic two-dimensional shapes (triangles, circles and squares), Milberg and Pepper1975), investigated the acquisition of matching-to-sample behavior to evaluate the visual
discrimination and learning capability of the bottlenose dolphin. In a continuation of thematching-to-sample experiment, the present study evaluated both the dolphin's perceptualcapacity and its ability to apply the concept of matching pairs to a number of differentstimulus conditions. The results of this report reflect data collected over a ten-monthperiod.
II. METHODS
A. Subject.
The subject was a 140 kg. 2.4 m female Atlan tic bottlenose dolphin ( Tursiops truncatus).approximately I I years old, which participated in the investigation of the acquisition ofvisual matching-to-sample. No visual anomalies were revealed by an ophthalmoscopicexamination of this animal prior to testing. The dolphin displayed good pupillary reflexand oculomotor rotation in tracking objects visually. Retinal vascularity appeared normaland the cornea and lens were perfectly clear.
The dolphin was maintained on a diet of Columbia River smet (Thaleichthys pacif cus)and mackeral (Scoinher scomber). Daily consumption varied from 6 to 9 kg. with more - "'than one-third of the daily intake earned during the experimental sessions. The subject was, pproximately 21 hours food-deprived prior to each session. Reinforcement during thetraining sessions consisted of smelt only.
B. Apparatus.
The dolphin was housed in a 6.0 in by 6.0 in floating pen with a 2.4 in draft (cf. Steele,1971 ). The training cubicle from which the operator conducted the experiment wasmounted on a floating platform and attached to one side of the pen. The operator couldvisually monitor the behavior routine of the animal through a small porthole in the frontof the cubicle.
I ocated below the porthole was a stimulus display board. 30 cm high and 2 15 cmacross. [he geometric shapes were presented on this display board. which was hidden fromthe dolphin's view between trials by a sliding panel.
-MAIM-
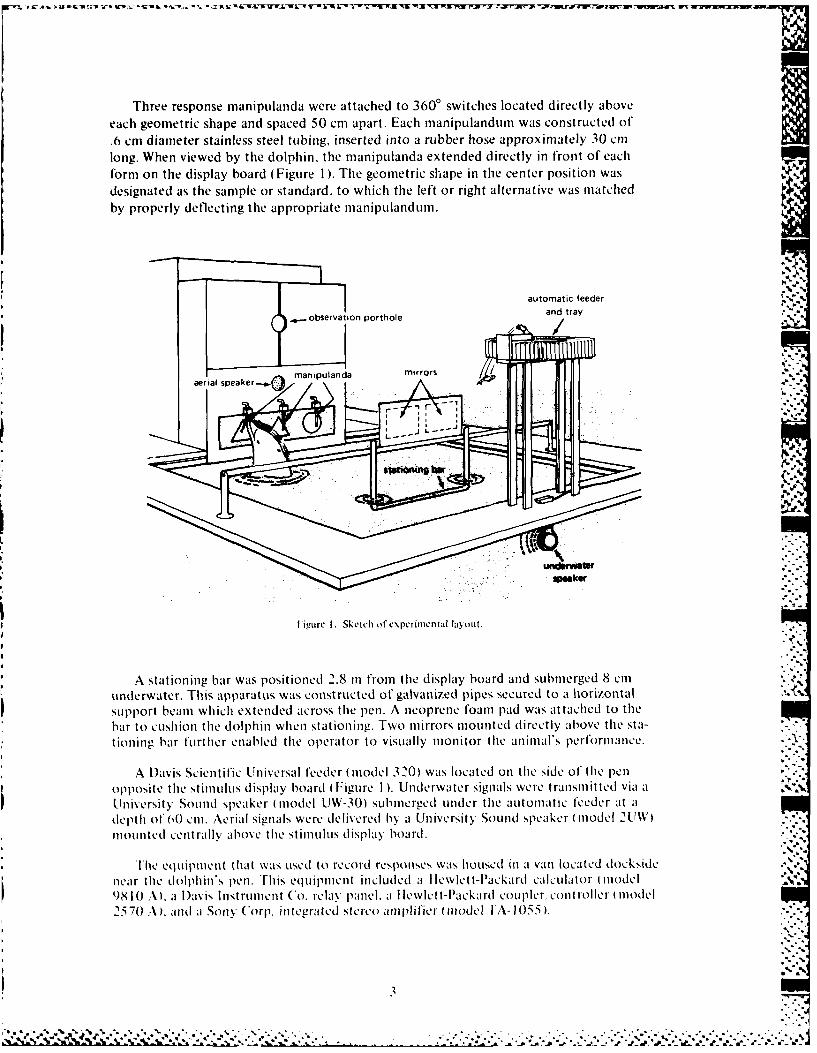
Three response manipulanda were attached to 3600 switches located directly aboveeach geometric shape and spaced 50 cm apart. Each manipulandunI was constructed of
.6 cm diameter stainless steel tubing, inserted into a rubber hose approximately 30 cmlong. When viewed by the dolphin, the manipulanda extended directly in front of eachform on the display board (Figure I ). The geometric shape in the center position was
designated as the sample or standard, to which the left or right alternative was matchedby properly deflecting the appropriate nianipulandul.
automatic feederand tray
E U observation porthole
aer a seakr-i, manipulanda mirrors
%Mk%
I- igure I. Sketch of c perimental layout.
A stationing bar was positioned 2.8 in from the display board and submerged 8 cmiunderwater. This apparatus was constructed of galvanized pipes secured to a horizontal -
support beani which extended across the pen. A neoprene foam pad was attached to thebar to cushion the dolphin when stationing. Two mirrors mounted directly above the sta-tioning bar t'urther enabled the operator to visually monitor the aniimal's perfornance.
A l)avis Scientific Universal feeder (model 320) was located on the side of the pen-opposite the stimulus display board ( l:igure I ). Underwater signals were transmitted via a ;,
University Sound speaker (model UW-30) submerged under the automatic feeder at adepth of 00 cni. Aerial signals were delivered hy a University Sound speaker (model 2 .U,
mouted centrally above the stimuls display board.
The equipment that was used to record responses was housed in a van located dockside .near the dolph iin's pen. Tliis equipment included a Ilewlett-Packard calculator model98 10 A). a )ais Instrument Co. relay panel. a Ilwlectt-Packard Coupler, controller (model2570 A). and a Sony Corp. in tegra ted stereo am plifier Inodel I A-I 055 ).
C2

The operational format was pre-programmed on magnetic cards. This program controlledall peripheral equipment. Selection of a specific session format, also programmed on mag- .netic cards, enabled the operator to choose any one of a number of trial sequences. Thecalculator recorded responses and latencies in addition to controlling the onset of the sta-tion (8-kHz) and reinforcement (1 2-kHz) tones. The release (10-kllz) tone was manuallycontrolled by the operator in the training cubicle by manipulation of a switch on a controlbox. This operation was not automated to assure that the dolphin was in proper positionto observe the visual stimuli before being required to respond. Each tone was deliveredsimultaneously by the aerial and underwater speakers.
A series of lights on the control box designated the operational stage of each trialsequence. The latencies were displayed on a digital clock and were measured from the onset 'of the release tone to the dolphin's response to either alternative manipulandum. J,
Six sets of geometric forms were used as the discriminative stimuli, with three types ofgeometric forms in each set (Figure 2). To control for the effects of differential brightness,all forms were painted white and were constructed with equal surface areas (323 cm 2 ). Thestimuli were presented on a black background to insure optimal visibility contrast. On anygiven trial, only two of the three types of geometric shapes in each set were presented-amatched pair and an incorrect alternative. Twelve different problem configurations wereconstructed by using different combinations of the geometric forms from an individual
3
F igu re 2. Se t o '~f l. it ic formis ticd.
4

set. The problem configurations in Set 1, for example, using triangles, circles, and squares,are shown in Figure 3, with the center form as the sample. Code numbers were assigned toeach of the twelve combinations and arranged randomly. Each code were presented fivetimes, totaling 60 reinforced trials per session.
AN 0
3- 9
-.9
Figure 3. Twelve problem combinationsand assigned code numbers (Set 1 ).
The population of geometric shapes used was categorized into three groups to investi-gate the possibility that a distinctive type of shape was inherently more discriminable thanothers. All of the shapes in this experiment, therefore. could be classified in one of threestimuLs-domains: triangular or pentagonal, smooth-edged or circular. and boxed orcross-like.
There was only one geometric form change made in Set 2. Sets 3. 4. and 5 were con-prised of completely novel discriminative stimuli to evaluate the ability of the dolphin totransfer the concept of match ing-to-sample in solving similar shape discrimination problems.Set 6 included discriminative stimuli which had been presented previously in Sets 3. 4. and
c. Procedure.
the dolphin was required to position her head on the stationing bar upon hearing tile8-kIlz station tone. When the proper position on tile stationing bar was assumd by thedolphin. the sliding panel was manually lifted by the operator. exposing the forms on thedisplay board for approximately 3 seconds. The 10-kIlz release tone was then initiated.instructiii the dolphin to swil 1t tile displa% board. depress the center mlanipulandum ,.
57-n

.1:1
and match the sample by properly deflecting the manipulandun which corresponded tothe correct alternative stimulus ( Figure 4a. b. c). Correct responses were followed by thedelivery of a single smelt and the onset of a simultaneous I 2-kHz tone which served as theconditioned reinforcer. [)etlection of either alternative manipulandum (correct or incorrect)ended the trial and was followed by a 30-second intertrial interval (ITI).
A correction procedure was implemented in which an incorrect response resulted inpresentation of the same problem until the dolphin made the correct response. Subsequentpresentations of an incorrect trial were considered as training trials and were recorded, butwere not used in the data analysis. The correction procedure proved to be invaluable, as itminimized the influence of position biases.
S.,
,, !
Figure 4a. Subject stationing.
ism1 ir-ure 41. S IIIC I1" .'" ¢ -rp"n "" iiic "'_ . " , ' " - " ,.. .
........................ . C C * 0

I ieU re 4c. SLIbjCC trip pin correc t atltern ativye tuarilpul and ut.
An additional response Contingency required the dolphin to respond to the alternativeIMan ipuLlanduItll witIi in 5.5 Seconids alter the onset of thle release tone. A response made aftert his period resu;Llted inl a "t inI-out" which was recorded and treated as an error.
I he dail\- performnance was recorded onl data sheets which corresponded to thle pro-, rall that was fed into thle calclator p~rior to eachI session. This gave the operator a quickI-creerence of thle preSentationI sCeece. lData sheets were prepared usinlg ten differentSequence". Which wv~re numbered and presented inl order. A large nu1.mber of different
seq uncswsUSed to elimiinate any sequten tial learningz variables.
Records of responses were also collected during each session from calculator print-outs.* In fornmat ion from thle calclator prIinlt-out was t ransferred to keypunch cards which were*thlen fed in to a coin pim Icr-. [BV usiI- ne aselected compu)Lter subplot routine. specific behavior
inftormat ion could be exti-icted from11 thle data andL plot ted onl graphs or tables.
I acll Sessionl inIcluded a lli i[iiLI 01' 0ii o 0 reCin for-ced trials. whiich ran from two to threeandl~ one-half1 hour11S, dIIeending~ upon01 the nuniher of' correct ion trials presented. The exper-mental1,1 sessionls wereC conduILcted fiVe dayINs a week.
Ill. COMPARISON OF RLSULTS
A. Set 1 (A*8)
Set I iticluded 70) sessions Ind t itlc ree ont Its of data c:ollect ion. [hle tables of' the* cottimposite scor es iil thItis se t ionl were deri\ ed frotilthle perforimance curve,. of, each set* .110%% 11 ill tilie AppenCld i:es. All of the probleiis itivolvi ne, tw\o oftilie samle shapes we re Coim-
pileId toge Ct her, diregardingL posit ion N~ aralsse I )iscussion I. [or exati lplc. to obtinil tilietriatic-c:irche coimposite scr.tilie avera-C scores of' Codes 2.4 () anld I 1 (seeC Fietr 3 )wecre tabulated. [hle 12 p~ossile ottiitation ls Of shapesI were_ arrandIW~ in tot 1IIC 0e grup 'oofI,, dilcrittiia k C 'It itIllli to 111Iah IC basic perceptual di TferiVilkes bet ween inId i% ida 1.,1e''ollietric-
7I

-~~~4 -04 o ) ,
forms. By comparing the composite scores with the discriminative stimuli, the level of dif-ficulty of discrimination between any two forms could be quantified. The groups ofdiscriminative stimuli and their corresponding composite scores are shown in Table 1.
Table 1. Composite scores (Set 1). ... . . . .. % " A1
Discriminative CompositeStimuli Score ,
ASl 87.2
A M 64.0
*E 72.9
In set 1. problems which required the dolphin to discriminate between triangle andcircle (regardless of which shape served as sample or alternative) contained a higher per-centage of correct performances than those problems which required the dolphin to discri-inmate between triangle and square or circle and square. The most perceptually difficultproblems for the dolphin to solve were those which required discriminations betweentriangle and square.
Learning did occur. and this was reflected by the ascending function in all of theperformance curves in the set (see Appendix A). However, the learning rate progressed veryslowly, with problems involving squares consistently the most difficult in this set.
B. Set2 Ae 1)
The square was replaced by a rectangle in the second set to examine corresponding O,changes in performance. This strategy effected a substantial increase in performance accu-racy attributed to both learning development and the relative ease of the new discriminationtask. In Set 2, problems which required the dolphin to discriminate between triangle andcircle once again contained a higher percentage of correct responses than those problemswhich required discriminations between triangle and rectangle or circle and rectangle. Thecomposite scores for the triangle-rectangle and the circle-rectangle performances increased20.t and 20.4 percent. respectively, over the triangle-square and the circle-square perform-ance in the first set (see Table 2).
Table 2. Composite scores (Set 2).
l)iscriminative CompositeStimuli Score
.. .... . .
. . . . . . . . . . . . . . . . .. . . .-.... *b
90'.8 "
84.o4.*1 9 +3.3,

c. Se **
Tests for conceptual transfer characteristically require altering more than one controlledaspect of the stimulus. In set 3, all of the discriminative stimuli were changed in order tocompare the effect of such a manipulation to that produced by changing only one discrimi-native stimulus as was done in Set 2. The objective of this test was to evaluate the abilityof the dolphin to transfer the previously learned concept of matching pairs to a totallynovel stimulus condition.
Transfer of the matching concept did not take place. The results of the first five sessionsrevealed chance-level performances (K = 5 7.6) which indicated that the dolphin was learningthe task on an intra-problern basis rather than by forming a concept or rule which could beused to solve a variety of match ing-to-sam ple problems.
Substantial increases in performance scores were noted in those problems in whichcrosses were presented with other shapes (see Appendix C). From essentially chance levelperformance. the dolphin demonstrated a remarkable capacity to learn these problems inonly nine sessions.
The most difficult problem for the dolphin to solve were those in which the pentagonand thle smooth-edged form were presented together as either standards or alternatives.A composite score of 52.4 percent indicated that thle dolphin was not able to acquire adiscrimination between the two stimuli. The performance curve for this problem containeda wide range of percentage scores (SD) = 11.9) with no ascending tendency: whereas theperformance scores of problems involving crosses were representative of typical learning *
curves.
Discrimination performance appeared to be largely affected by the differences inperimeter lengths of the stimuli. Geometric shapes which were closely matched in judgedcomplexity (nearly equal perimeter lengths) were generally more difficult for the dolphinto discriminate. On thle other hand. those shapes which had large differences in perimeter
shows the relationship of performance accuracy and perimeter length differences for this
Table 3. Composite scores in comparison to perimeter differences (Set 3).
Discriinmat ive Comnposite PerimeterStimuli Score Difference (cm.)
0552.4 12.7
0+85.4 27.9
5+82.o 15.2

D. Set 4 (4" )
Set 4 was designed to examine changes in the performance accuracy as a result ofmanipulating the perimeter length differences.
- 4 .The results are shown in Table 4. The five-sided form and the smooth-edged form.having only a difference of 3.8 cm. could not be discriminated visually by the dolphin. Theperformance curve was marked by a comparatively high degree of variability and remainednear chance even after 21 sessions (see Appendix D).
The five-sided form-cross (33.0 cm difference) and the smoothed-edged form-cross(34.3 cm difference) problems on the other hand were quite easily solved by the dolphin.Although the relationship between the composite scores and perimeter length differenceswas not a consistently linear one, supporting data suggest that gross differences in perimeterlength was associated with more efficient visual shape-resolution capability.
Table 4. Composite scores in comparison to perimeter differences (Set 4).
Discriminative Composite PerimeterStimuli Score Difference (cm.)
60.2 3.8
0 It 98.4 33.0
,2 95.7 34.3
.4-
E. Set 5 (.bO)
iThe continuing accuracy of performance by the dolphin in problems involving crosses.prompted an investigation to determine whether selections were indeed made on the basisof perimeter differences rather than due to some other perceptual cue, such as degree ofangularity, which effected better resolution performance. It perimeter length was the rele-vant perceptual cue used in the discrimination process, stimulus preference for crosseswould probably have very little influence on choice-making by the dolphin.
The stimuli in this set were therefore constructed so that the smallest difference in
perimeter length was between the cross and the five-sided form. and the largest differenceill perimeter length was between the five-sided form and the smooth-edged form. -.4.
10
.L.

'Y ~ ~ ~ ~ I% mi viA mrr r-' 2- 2 ?' Y FTIM. W " LWIWUVIUuuV ' ~ W LIT UICIMAMh M
Table 5. Composite scores in comparison to perimeter differences (Set 5). "
Discriminative Composite Perimeter
Stimuli Score Difference (cm.)
91.5 20.3
@4 79.7 5.1
*4 76.7 15.2
As expected, performance accuracy in problems involving crosses decreased, indicatingthat stimulus preference had a negligible effect in the visual discriminative process, andthat responses were more directly influenced by the perimeter differences between thegeometric shapes presented. Here again, problems which contained shapes which weregrossly unequal in perimeter lengths were perceptually the least difficult to discriminate.
F. Set 6 (*sV)
The results from Set 6 gave additional support to our hypothesis. but the non-linearrelationship between perimeter length differences and performance accuracy once again d,
indicated that other form parameters were involved in the discrimination process. Unfor-tunately, in shape discrimination experiments such as in this one, many variables interactsimultaneously, and a singular independent variable such as perimeter length cannot be '
isolated from the influence of other stimulus properties.
Table 6. Composite scores in comparison to perimeter differences (Set 6).
Discriminative Composite PerimeterStimuli Score Difference (cm.)
Ob 61.1 22.9
99.0 34.3
88.6 11.4
The number of sessions required to reach asymptote in each set declined steadily fromthe start of the experiment, with the exception of Set 2. in which only one discriminativestimulus was changed. The dolphin demonstrated an ability to adapt to changes in thestimulus conditions more readily after exposure to many different types of problems.Performance was facilitated by this exposure and is evidenced by the reduction in thenumber of sessions required to reach asymptote in each subsequent set. %
Set 6 was also used in conjunction with Set 2 in an experimental test of conceptuallearning which is discussed in Section IV.
~J;~pq i~.\ ~~ # j#J ~ ~.. .. ,. ***. ~ .'' ..~I]i..

IV. DISCUSSION .4
A. Luminance.
The brightness variables affecting the appearance and perception of the discriminativestimuli were not optimally controlled, as the experiment was conducted out of doors inambient sunlight. However, discriminations between the positive and negative stimuli withineach trial presented an equal level of difficulty for the dolphin. The effect of differentialbrightness on performance accuracy was not analyzed.
B. Position Bias.
In a simultaneous matching-to-sample experiment, Cumming and Berryman (1965)reported that some pigeons display an almost complete position habit in the initial learningof the shape disciimination. Herman and Arbeit (1973) examined the influence of positionbias in a dolphin tested on a successive auditory discrimination learning-set task. The error ,,rates of the left and right responses were compared under different sequences of the positivestimulus (S+ first and S+ last). No evidence of position responding was found, even thoughsubstantially higher error rates occurred when the positive stimulus was presented first inthe sequence.
As a test of position bias in this experiment, the percentage correct of left responsesand the percentage correct of right responses were compared (Figure 5). No systematicposition habit in the dolphin was revealed by these curves, and reasonably uncontaminatedresults could be expected in the composite scores.
100-
.4 90- 80- 5t 1 ̂-1
70-
0 .. .eu "
64-
30-
Set 1 Set 2 Set 3 Set 4 Set 5 Set 620-
10- -'
0 25 50 75 100 125 150 175 ..
session
Iigurc 5. ('omparison or pcrccntayc corrcCt lett and right.
12

, M , -
II
Unlike the matching-to-sample experiment with the pigeons, this experiment employed ', 1
a correction procedure in which errors resulted in the repetition of the trial until the correctI>response was made. Such a procedure extinguishes any position habit the subject maydevelop early in training (Cumming, et al., 1965). A prolonged correction procedure mayinduce an alternating second response in a two-choice discrimination task if the initialresponse is incorrect (White, Spong, Cameron, Bradford, 1971 ); however, this behavior wasextinguished prior to the start of the experiment.
C. Form Parameters as Predictors of Discrimination Performance.
The underlying prarameters which were common to the highly discriminable formswere examined in terms of the perceptual characteristics of the stimuli. The discriminativeaspects of the stimuli were initially examined in terms of differences in angularity, com-pactness, number of sides, and perceptual complexity - stimulus properties which areessentially non-quantitative. The problems of quantification were compounded because ofthe interactive effects of these parameters, and because of the inability to isolate one para-meter as the independent variable. Unlike discriminations based on size and brightness(transpositional parameters). form parameter (transitive) variables do not reduce well toquantification, and are governed by theories of Gestalt psychology.
In applying information theory to the measurement of form parameters. Attneave' (1951. 1954) and Attneave and Arnoult (1956) demonstrated that information about a
two-dimensional geometric form was concentrated at its contour. Perimeter length hasoften been used as an index in the scaling of perceived complexity and as a predictive varia-ble in the discriminative performance of geometric shapes. The relationship between theperimeter length and the perceptual complexity of stimuli was shown in Stenson's (1966)factor analysis of the dimensional characteristics of 20 random forms. Of the four para-meters which described physical complexity (Stenson's Factor "D") perimeter length wasgiven the highest factor loading.
The functional relationship of contour, stimulus complexity, and discriminationperformance was also examined by Polidora (1965) and by Polidora and Thompson( 1964. 1965) using metric patterns as visual stimuli in shape discrimination experimentswith rhesus monkeys. In an analysis of their experiments, Zusne (1970) commented:
"Although these studies suffer from a number of methodologicalproblems, they definitely show that discrimination improves withincreasing difference in complexity between the positive and negativestimuli. When random forms are used, difference in complexity isthe most readily utilized discriminative clue in all animal specieswith which complexity has been used as an independent variable.
1). Concept Learning.
Herman and Gordon (1974) reported on the ability of an Atlantic bottlenose dolphinto form a delayed matching learning set. A successive auditory discrimination task wasemployed as the experimental design using a playback procedure to minimize the influenceof sequential preferences. They found convincing evidence in support of conceptualtransfer by the bottlenose dolphin in the acoustic modality.
13q " p
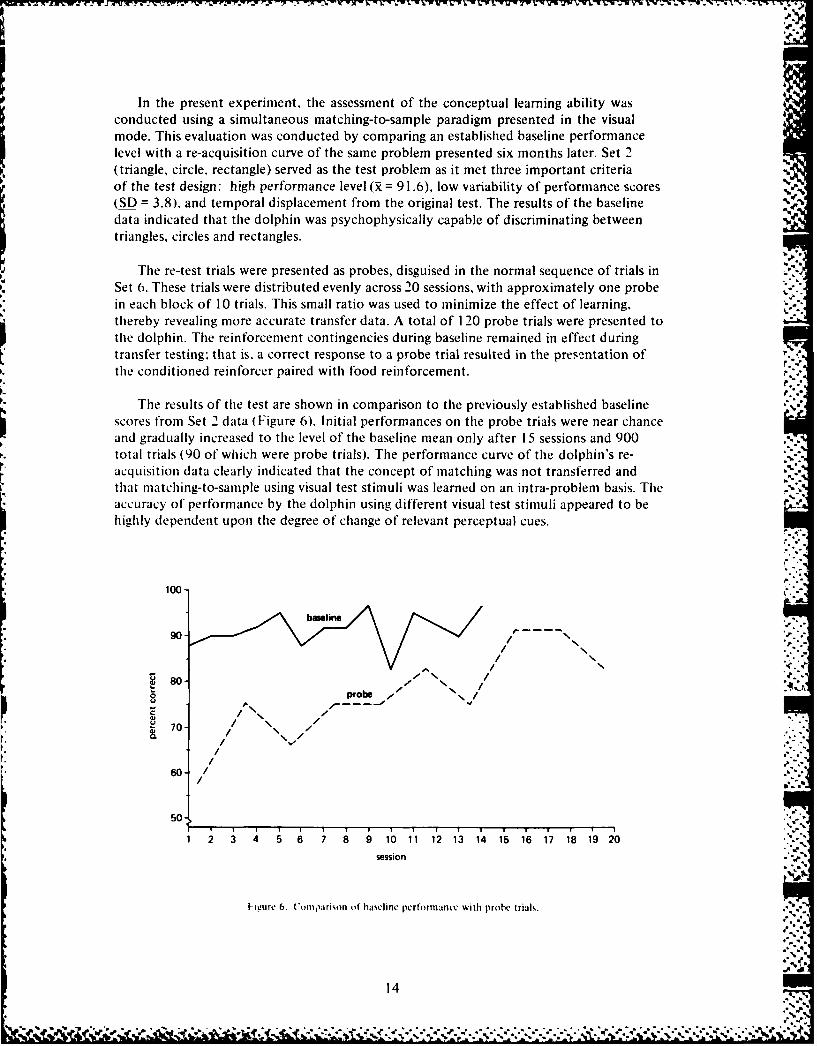
In the present experiment, the assessment of the conceptual learning ability wasconducted using a simultaneous matching-to-sample paradigm presented in the visualmode. This evaluation was conducted by comparing an established baseline performancelevel with a re-acquisition curve of the same problem presented six months later. Set 2(triangle, circle, rectangle) served as the test problem as it met three important criteriaof the test design: high performance level (R = 91.6), low variability of performance scores(SD = 3.8), and temporal displacement from the original test. The results of the baselinedata indicated that the dolphin was psychophysically capable of discriminating betweentriangles, circles and rectangles.
IWThe re-test trials were presented as probes, disguised in the normal sequence of trials in ,-Set 6. These trials were distributed evenly across 20 sessions, with approximately one probe
in each block of 10 trials. This small ratio was used to minimize the effect of learning,thereby revealing more accurate transfer data. A total of 120 probe trials were presented tothe dolphin. The reinforcement contingencies during baseline remained in effect duringtransfer testing' that is. a correct response to a probe trial resulted in the presentation oftie conditioned reinforcer paired with food reinforcement. '-
Tle results of the test are shown in comparison to the previously established baselinescores from Set 2 data (Figure 6). Initial performances on the probe trials were near chanceand gradually increased to the level of the baseline mean only after 15 sessions and 900total trials (90 of which were probe trials). The performance curve of the dolphin's re-acquisition data clearly indicated that the concept of matching was not transferred andthat matching-to-sample using visual test stimuli was learned on an intra-problem basis. Theaccuracy of performance by the dolphin using different visual test stimuli appeared to behighly dependent upon the degree of change of relevant perceptual cues.
100-
90 .. .'
80- /^ .•
70-i/v,
//
60 //
501
1 5 6 7 8 9 10 11 12 13 14 15 16 17 18 19 20
session
I itgure 6. C'omparison of baseline performance with probe trials.
14
'Lac %.-Lac,."
IIAI I
E. Summary. J
Aerial visual acuity of the dolphin by human standards is poor. It has been experi-
mentally tested and found inferior to pinniped vision. Large differences in perimeter
ential factor affecting discrimination performance within any set. Conversely, geometricpatterns which had equal or nearly equal perimeter lengths generally resulted in poorerdiscrimination performance. The absence of a monotonic function between perimeter
differences and performance accuracy indicated that other form parameters may be involvedin the discrimination process. Tests were conducted to determine if stimulus preferencebinfluenced choice selection. The results were negative.
By changing more than one shape in a discriminative set, a progressively larger decre-ment in performance can be expected. However, greater exposure to a large number ofstimulus conditions enabled the dolphin to adapt to change more readily and facilitatesperformance in subsequent tasks. ..
No systematic position preference was found in the dolphin, possibly resulting fromthe implementation of a correction procedure.
Completely novel sets of discriminative stimuli were presented to the dolphin to evaluateconceptual learning. Transfer did not occur between sets when geometric shapes differedgreatly from the previous set. Comparison of baseline data with a re-acquisition curve ofthe same problemn suggests a function typical of problem-specific rather than conceptuallearning.
15

REFERENCES
Attneave, F. "The Relative Importance of Parts of a Contour." US Human Resources Res.Center, Res. Note P&MS, No. 51-8, 1951.
Attneave. F. "Some Informational Aspects of Visual Perception." Psy_vhol. Rev.. 1954,61, 183-193.
Attneave, F. and Arnoult, M.D. "The Quantitative Study of Shape and Pattern Perception."Psychol. Bull. 1956, 53, 452-47 1.
Caldwell, D. K. and Caldwell, M.C. The World of the Bottlenosed Dolvihin, J.B. LippincottCompany, Philadelphia and New York, 1972.
Cumming, W.W. and Berryman, R. "The Complex Discriminated Operant: Studies ofMatching-to-Sample and Related Problems." in D. Mostofsky (Ed.). Stimulus Discrimination.Stanford: Stanford University Press, 1965.
Dawson. W. W., Birndorf. L.A., Perez, J.M. "Gross Anatomy and Optics of the DolphinEye (Tursiops truncatus)." Cetolog., 1972, 10, 1-12.
Herman. L. M. and Arbeit. W. R. "Stimulus Control and Auditory Discrimination LearningSets in the Bottlenose Dolphin." J Ex.Anal. Behav.. 1973, 19. 379-394.
Herman. L. M. and (;ordon, J. A. "Auditory Delayed Matching in the Bottlenose Dolphin."1. Exp. Anal. Behav.. 1974, 21. 19-26.
Herman. L.M.. Peacock. M.F.. Yunker. M. P.. Madsen, C. J. "Bottlenose Dolphin: Double-Slit Pupil Yields Equivalent Aerial and Underwater Diurnal Acuity." Science. 1975. 189,650-652.
Kellogg, W. N. and Rice, C. E. "'Visual Discrimination and Problem Solving in a BottlenoseDolphin." In K. Norris (Ed.). Whales, _DopPlinsand Porpoises, Los Angeles: University ofCalifornia Press. 1966. '"-
Matthiessen, L. "Ueber den physicka lisch - optischen Ban des anges der Cetacean and der
Fische." Pflugers ArchigesPhysiol.. 1886. As cited in A. 1). G. Dral. Aquatic and aerialvision in the bottlenosed dolphin. Netherlands J.Sea Res., 1972, 5. 5 10-5 13.
Milberg, L. and Pepper. R. L., "Acquisition of Aerial Matching-to-Sample Behavior in theBottlenose Dolphin." Presentation at the Annual American Psychological Associationmeetings of September 1975. Chicago. Ill.
Pepper, R. L. and Simmons. J.V. "In-air Visual Acuity of the Bottlenose Dolphin." Exper.Neurology. 1973.41. 271-276.
Polidora. V. J. "Stimulus Correlates of Visual Pattern l)iscrimination by Monkeys:Sidedness." Percept._Mot Skills, 1965. 20. 461-469.
S17

Polidora, V. J. and Thompson, W. J. "Stimulus Correlates of Visual Pattern Discriminationby Monkeys: Area and Contour." J.('. CmnP hysioL.Psychol.. 1964, 58, 264-269.
Polidora, V. J. and Thompson, W. J. "Stimnulus Correlates of Visual Pattern Discriminationby Monkeys: Pattern Complexity." Perc pt. Mot. Skills, 1965. 21, 71-79.
Rivamonte, L. A. "Eye Model to Account for Comparable Aerial and Underwater Acuitiesof the Bottlenose l)olphin." Netherlands J. Sea Res 1976, 10(4). 491-498.
Schusterman, R. "Visual Acuity in Pinnipeds." In H. Winn (Ed.). Behavior of MarineAnimals 1972. 2, New York: Plenum, 469-472.
Slijper, F. J. Walvissen. De Boer Jr. N.V.. Amsterdam 1958, 1-594. As cited in A. D. G.Dral, "Aquatic and Aerial Vision in the Bottlenosed Dolphin." Netherlands J. Sea Res.,1972, 514). 5 10-5 13.-.... .. ..- ' -!
Steele, J.W. "Marine-Environment Cetacean Holding and Training Enclosures." OceanSciences Department, Bio-Systems Division, Naval Undersea Center. Technical PublicationNo. 227, March. 1971. (NTIS AD 722400).
Stenson. H. H. "The Physical Factor Structure of' Random Forms and Their JudgedComplexity." Percept. & Ps choplhys., 1966, 1, 303-310.
White. [)., Cameron. N., Spong. P., Bradford, J. "Visual Acuity of the Killer Whale(Ornicus orca).- Experimental Neurology, 1971, 32. 230-236.
Zusne. L. Visual Form Perception. Academic Press, New York and London. 1970, p. 330.
18
II
-• 18i

APPENDIX A: Performance Curves - Set I
0
0
0.
0 5 D 10 ;5 20 25 i0 5 40 45 50 55 90 65session
00-
60-6
20..
0d
1009

APPENDIX B: Performance Curves - Set 2
100I'C
0-
V 20
% ** ~%VV .*:..-~.->h*01%-

r..r P. 7
* APPENDIX C: Performance Curves -Set 3
C.
60-
85 90 95A0 105 110
session
00-
800........... .......
0
0
40
0
0-859 510 0 1
session
1001

APPENDIX D: Performance Curves - Set 4
100
800%
0
10
80
0 660-
Z; 40-
00
110 115 120 125 130session
0
0)-
0
20
session
r-Le -7 ' -

APPENDIX E: Performance Curves - Set 5
100 (
80-
40o
2 0-
40
135 140 145 150session
100-
80-
0 60-
00
20-
0 -I135 140 145 150
session
100-.
00
13 14405 5
23

APPENDIX F: Performance Curves - Set 6
100-:
80-
60-O
o . 40o
00 20
I. I
155 160 165session
100.
80
0 60-
40-Seso
0
5''
15 6s e s s io n " -
80 :"-
040-
020-
155 160 165session
24
• . .+ +, IF + i .." ,+" ms- ++" - , + , +' , - + - • • . -" "i,"-+? • ."+ + - -t+. n -. "+- , p ++ • _a-

-.- "~- -v'y~-;.;- -. - 'I.,.-~
* *- ?~~-q~* *.%~ -~ --
I.
.5.
-.5
.5'.5-
-p.
-N
-. 5,,
4 4
S.
**5%* -. 5....
.5..
-S
* ,. -
L