mat lab national cooperative highway research program report...
TRANSCRIPT

MATERIALS ACT I NE
Research Sup
Frs is t €11
Srt
SiIs & AS3h Ox PpNlls
IT -
File -.
325 L L
b7 '7
JUNLi
04 199,
MAT LAB
NATIONAL COOPERATIVE HIGHWAY RESEARCH PROGRAM REPORT 325 LOW TEMPERATURE BEHAVIOR AND
ACCEPTANCE CRITERIA FOR ELASTOMERIC BRIDGE BEARINGS
TRANSPORTATION RESEARCH BOARD NATIONAL RESEARCH COUNCIL
TRANSPORTATION RESEARCH BOARD EXECUTIVE COMMITTEE 1989
Officers
Chairman
LOUIS J. GAMBACCINI; General Manager, Southeastern Pennsylvania Transportation Authority
Vice Chairman
WAYNE MURI, Chief Engineer. Missouri Highway & Transportation Department
Secretary
THOMAS B. DEEN, Executive Director, Transportation Research Board
Members
ADMIRAL JAMES B. BUSEY IV, Federal Aviation Administrator, US. Department of Transportation (ex officio) GILBERT E. CARMICHAEL, Federal Railroad Administrator, US. Department of Transportation, (ex officio) BRIAN W. CLYMER, Urban Moss Transportation Administrator, US. Department of Transportation (ex officio) JERRY R. CURRY, National Highway Traffic Safety Administrator, US. Department of Transportation (ex officio) FRANCIS B. FRANCOIS, Executive Director, American Association of State Highway and Transportation Officials (ex officio) JOHN GRAY, President, National Asphalt Pavement Association (ex officio)
THOMAS H. HANNA, President and Chief Executive Officer, Motor Vehicle Manufacturers Association of the United States, Inc. (ex officio) LT. GENERAL HENRY H. HATCH, Chief of Engineers and Commander, U.S. Army Corps of Engineers (ex officio) THOMAS D. LARSON, Federal Highway Administrator, US. Department of Transportation (ex officio) GEORGE H. WAY, JR., Vice President for Research and Test Departments, Association of American Railroads (ex officio) ROBERT J. AARONSON, President, Air Transport Association of America
ROBERT N. BOTHMAN, Director, Oregon Department of Transportation
J. RON BRINSON, President and Chief Executive Officer, Board of Commissioners of The Port of New Orleans L. GARY BYRD, Consultant Engineer, Alexandria Virginia
JOHN A. CLEMENTS, Vice President, Parsons Brinckerhoff Quade and Douglas. Inc. (Past Chairman, 1985)
SUSAN C. CRAMPTON, Secretary of Transportation, State of Vermont Agency of Transportation L. STANLEY CRANE, Retired, Former Chairman and Chief Executive Officer, Consolidated Rail Corporation, Philadelphia RANDY DOI, Director, IVHS Systems, Motorola Incorporated
EARL DOVE, Chairman of the Board. AAA Cooper Transportation
WILLIAM J. HARRIS, E.B. Snead Professor of Transportation & Distinguished Professor of Civil Engineering, Associate Director of Texas Transportation Institute LOWELL B. JACKSON, Vice President for Transportation, Greenhorne & OMara, Inc.
DENMAN K. McNEAR, Vice Chairman, Rio Gronde Industries
LENO MENGHINI, Superintendent and Chief Engineer, Wyoming Highway Department WILLIAM W. MILLAR, Executive Director, Port Authority of Allegheny County ROBERT E. PAASWELL, Professor, Urban Transportation Center, University of Illinois RAY D. PETHTEL, Commissioner, Virginia Department of Transportation
JAMES P. PITZ, Director, Michigan Department of Transportation HERBERT H. RICHARDSON, Deputy Chancellor and Dean of Engineering, Texas A&M University System (Past Chairman, 1988) JOE G. RIDEOUTFE, Executive Director, South Carolina Department of Highways and Public Transportation TED TEDESCO, Vice President, Corporate Affairs, American Airlines, Inc.. Dallas/Fort Worth Airport
CARMEN E. TURNER, General Manager, Washington Metropolitan Area Transit Authority C. MICHAEL WALTON, Bess Harris Jones Centennial Professor and Chairman, College of Engineering, The University of Texas FRANKLIN E. WHITE, Commissioner, New York State Department of Transportation JULIAN WOLPERT, Henry G. Bryant Professor of Geography, Public Affairs and Urban Planning, Woodrow Wilson School of Public and International Affairs, Princeton University
PAUL ZIA, Distinguished University Professor, Department of Civil Engineering, North Carolina State University
NATIONAL COOPERATIVE HIGHWAY RESEARCH PROGRAM Transportation Research Board Executive Committee Subcommittee for NCHRP FRANCIS B. FRANCOIS, American Association of State Highway and Transportation LOUIS J. GAMBACCINI, Southeastern Pennsylvania Transportation Authority Officials
(Chairman) THOMAS D. LARSON, US. Department of Transportation WAYNE MURI, Missouri Highway & Transportation Department L. GARY BYRD, Consulting Engineer
THOMAS B. DEEN, Transportation Research Board
Field of Materials and Construction Area of Spec(flcations, Procedures, and Practices Project Panel DIO-20
CHARLES W. PURKISS, California Department of Transportation (Chairman) BARRIE ATKINSON, Cosmec Inc.
MARTIN P. BURKE, JR. Burgess and Niple, Ltd. Engineers & Architects
GRANT W. COOKE, Consulting Engineer E. V. HOURIGAN, Consultant
FLOYD JACOBSEN, Illinois Department of Transportation DAVID G. MANNING, Ontario Ministry of Transportation
Program Staff
ROBERT J. REILLY, Director, Cooperative Research Programs LOUIS M. MAcGREGOR, Program Officer DANIEL W. DEARASAUGH, JR., Senior Program Officer IAN M. FRIEDLAND, Senior Program Officer
VASANT C. MISTRY, Federal Highway Administration ROBERT L. REED, Texas Department of Transportation KENNETH J. SMITH, State University of New York EDWARD P. WASSERMAN, Tennessee Department of Transportation JERRY A. WEIGEL, Washington State Department of Transportation JOHN O'FALLON, FHWA Liaison Representative GEORGE W. RING, III, TRB Liaison Representative
CRAWFORD F. JENCKS, Senior Program Officer FRANK N. LISLE, Senior Program Officer DAN A. ROSEN, Senior Program Officer HELEN MACK, Editor

NATIONAL COOPERATIVE HIGHWAY RESEARCH PROGRAM 325 REPORT
LOW TEMPERATURE BEHAVIOR AND ACCEPTANCE CRITERIA FOR ELASTOMERIC
BRIDGE BEARINGS
C. W. ROEDER, J. F. STANTON and T. FELLER
University of Washington Seattle, Washington
RESEARCH SPONSORED BY THE AMERICAN ASSOCIATION OF STATE HIGHWAY AND TRANSPORTATION OFFICIALS IN COOPERATION WITH THE FEDERAL HIGHWAY ADMINISTRATION
AREAS OF INTEREST
Structures Design and Performance
Construction
General Materials
(Highway Transportation, Public Transit, and Rail Transportation)
TRANSPORTATION RESEARCH BOARD NATIONAL RESEARCH COUNCIL WASHINGTON, D.C. DECEMBER1989

NATIONAL COOPERATIVE HIGHWAY RESEARCH PROGRAM
Sytematic, well-designed research provides the most effective approach to the solution of many problems facing highway administrators and engineers. Often, highway problems are of local interest and can best be studied by highway de-partments individually or in cooperation with their state universities and others. However, the accelerating growth of highway transportation develops increasingly complex prob-lems of wide interest to highway authorities. These prob-lems are best studied through a coordinated program of cooperative research.
In recognition of these needs, the highway administrators of the American Association of State Highway and Transpor-tation Officials initiated in 1962 an objective national high-way research program employing modern scientific tech-niques. This program is supported on a continuing basis by funds from participating member states of the Association and it receives the full cooperation and support of the Fed-eral Highway Administration, United States Department of Transportation.
The Transportation Research Board of the National Re-search Council was requested by the Association to admin-ister the research program because of the Board's recognized objectivity and understanding of modern research practices. The Board is uniquely suited for this purpose as: it maintains an extensive committee structure from which authorities on any highway transportation subject may be drawn; it possesses avenues of communications and cooper-ation with federal, state and local governmental agencies, universities, and industry; its relationship to the National Research Council is an insurance of objectivity; it maintains a full-time research correlation staff of specialists in high-way transportation matters to bring the findings of research directly to those who are in a position to use them.
The program is developed on the basis of research needs identified by chief administrators of the highway and trans-portation departments and by committees of AASHTO. Each year, specific areas of research needs to be included in the program are proposed to the National Research Council and the Board by the American Association of State High-way and Transportation Officials. Research projects to fulfill these needs are defined by the Board, and qualified research agencies are selected from those that have submitted pro-posals. Administration and surveillance of research contracts are the responsibilities of the National Research Council and the Transportation Research Board.
The needs for highway research are many, and the National Cooperative Highway Research Program can make signifi-cant contributions to the solution of highway transportation problems of mutual concern to many responsible groups. The program, however, is intended to complement rather than to substitute for or duplicate other highway research programs.
NCHRP REPORT 325
Project 10-20 FY '85
ISSN 0077-5614
ISBN 0-309-04622-X
L. C. Catalog Card No. 90-70028
Price $9.00
NOTICE The project that is the subject of this report was a part of the National Co-operative Highway Research Program conducted by the Transportation Re-search Board with the approval of the Governing Board of the National Research Council. Such approval reflects the Governing Board's judgment that the program concerned is of nationsl importance and appropriate with respect to both the purposes and resources of the National Research Council.
The members of the technical committee selected to monitor this project and to review this report were chosen for recognized scholarly competence and with due consideration for the balance of disciplines appropriate to the proj-ect. The opinions and conclusions expressed or implied are those of the re-search agency that performed the research, and, while they have been accepted as appropriate by the technical committee, they are not necessarily those of the Transportation Research Board, the National Research Council, the American Association of State Highway and Transportation officials, or the Federal Highway Administration, U.S. Department of Transportation.
Each report is reviewed and accepted for publication by the technical com-mittee according to procedures established and monitored by the Transpor-tation Research Board Executive Committee and the Governing Board of the National Research Council.
Special Notice The Transportation Research Board, the National Research Council, the Fed-eral Highway Administration, the American Association of State Highway and Transportation Officals, and the individual states participating in the Na-tional Cooperative Highway Research Program do not endorse products or manufacturers. Trade or manufacturers' names appear herein solely because they are considered essential to the object of this report.
Published reports of the
NATIONAL COOPERATIVE HIGHWAY RESEARCH PROGRAM
are available from:
Transportation Research Board National Research Council 2101 Constitution Avenue, N.W. Washington, D.C. 20418
Printed in the United States of America

FOREWORD This report contains the findings of a study that was performed to develop design requirements for low temperature behavior and acceptance test procedures for elas-
By Staff tomeric bridge bearings. In addition, the study evaluated manufacturing tolerances Transportation Research for such bearings leading to recommendations for minimum requirements. Existing
Board research results were examined and a number of laboratory tests were made to confirm previous results and to develop data and criteria where knowledge of low temperature behavior was limited. This report provides a comprehensive description of the research along with recommended revisions to the design and construction requirements for elastomeric bearings contained in the AASHTO Standard Specifications for Highway Bridges. The contents of this report will be of immediate interest and use to bridge engineers, specification writing bodies, researchers, and others concerned with the design, construction, and performance of elastomeric bridge bearings.
Elastomeric bearings have been used with increasing frequency in highway bridges during the last 20 to 30 years. These bearings, which are economical and require minimal maintenance, can support heavy gravity loads while accommodating large movement through deformation of the elastomer. The early use of elastomeric bearings was confined to unreinforced elastomeric pads. More recently, the trend has been toward the use of steel- and fiberglass-reinforced elastomeric pads for situations re-quiring higher bearing stresses and stiffnesses.
NCHRP Project 10-20, "Elastomeric Bearings Design, Construction, and Ma-terials," was initiated in 1981 to address the absence of detailed design requirements for the use of elastomeric bearings in the AASHTO Standard Specifications for High-way Bridges. The research focussed primarily on the provisions for reinforced bearings, and it entailed three distinct phases. Phase I concentrated on the development of improved specifications (Method A) for unconfined, plain and reinforced elastomeric bridge bearings based on existing data. The results of Phase I were reported in NCHRP Report 248, "Elastomeric Bearings Design, Construction, and Materials." The Phase I recommended specifications were adopted into the AASHTO Standard Specifications for Highway Bridges in 1985.
Phase II of NCHRP Project 10-20 was initiated in 1983 to improve on the Phase I specifications and to develop specifications for special applications (Method B). The second phase of work included laboratory testing of actual bridge bearings to correlate bearing performance and test data with the theories upon which the Method A specifications were based. The results from Phase II were reported in NCHRP Report 298, "Performance of Elastomeric Bearings," which included recommendations for a

more rational bearing specification that would allow bearing pressures as high as 1600 psi under some design conditions. One of the shortcomings of the Method B design specification, however, was that limited information existed on the low temperature behavior of elastomers typically used in bridge bearings.
The last phase of the Project 10-20 research concentrated primarily on the low temperature behavior of bridge-bearing elastomers. A secondary objective was to evaluate the effects of quality control during manufacturing on the performance of elastomeric bearings. The research entailed the collection of existing data and included laboratory tests of elastomer stiffening and crystallization at low temperatures. It was shown that elastomers may be many times stiffer at low temperatures than at room temperature, and this may result in forces in the bridge that are much larger than those anticipated from standard design procedures.
This report documents the work performed under Phase III of NCHRP Project 10-20. It provides improved recommendations for the Method B specifications pro-posed in NCHRP Report 298, along with recommendations for testing elastomers at low temperatures in order to ensure satisfactory performance in the field. In addition, the report summarizes the effects of quality control standards and tolerances on bearing performance, and provides recommendations for revisions to the AASHTO Standard Specifications for Highway Bridges, Division Il—Construction specifications. It is anticipated that AASHTO will consider the recommended design and construction specifications for adoption in 1990 or 1991.

CONTENTS
1 SUMMARY
3 CHAPTER ONE Introduction and Research Approach Background, 3 Phase III Research Objectives and Scope, 3 Research Approach, 4
5 CHAPTER TWO Low Temperature Test Methods Low Temperature Behavior, 5 Test Methods in Existing Specifications, 8 Other Existing Standard Test Procedures, 9 Test Apparatus Developed for this Study, 10 The Test Procedure, 14
16 CHAPTER THREE Low Temperature Test Results Materials Tested, 16 Low Temperature Stiffness Results, 18 Elastomer Hardness, 20 Relaxation of the Low Temperature Stiffness, 23 Thaw Tests and Time Required for Crystallization, 23 Simulation of Field Conditions, 26 Correlation with Other Test Results, 27 Tolerances and Acceptance Test Criteria, 28
34 CHAPTER FOUR Interpretation and Appraisal of Low Temperature Test Results and Design Recommendations
Significance of Low Temperature Behavior, 34 Evaluation of Actual Temperature Conditions, 35 Brittleness and Instantaneous Thermal Stiffness, 37 Low Temperature Crystallization Test, 37 Limits on Stiffness, 38 Zone and Grade Requirements, 40
40 CHAPTER FIVE Conclusions and Recommendations Conclusions, 40 Recommendations, 41
41 REFERENCES
42 APPENDIX A Recommended AASHTO Design Specification and Commentary
Section 14—Elastomeric Bearings, 42 Commentary—Section 14, 47
51 APPENDIX B Recommended AASHTO Construction Specification and Commentary
Section 25—Elastomeric Bearings, 51 Commentary—Section 25, 56
58 APPENDIX C Testing Equipment
61 APPENDIX D Design Examples Using Method B Specifications
/

ACKNOWLEDGMENTS
The research reported herein was performed under Phase III of NCHRP Project 10-20 by the University of Washington, Seattle, Wash-ington. The work was supervised and performed by the co-principal investigators, Charles W. Roeder, Professor of Civil Engineering, and John F. Stanton, Associate Professor of Civil Engineering. Mr. Troy Feller is a former graduate student Research Assistant at the University
of Washington and is a coauthor of this report. The authors would like to thank Mr. Kevin Smith, a former student at the University of Wash-ington, for his help on the project. The authors also are grateful for the assistance provided by Mr. J. Burpulis, Mr. D. Coe, Mr. D. Fish, Ms. D. Ophong, and Mr. J. Seay of Du Pont de Nemours and Company and Dr. T. Bethea of the Firestone Tire and Rubber Company.
LOW TEMPERATURE BEHAVIOR AND ACCEPTANCE CRITERIA FOR
ELASTOMERIC BRIDGE BEARINGS
SUMMARY Elastomeric bearings have been used in the United States for approximately 30 years and are now used with increasing frequency. They can support large gravity loads while accommodating large movement through deformation of the elastomer. In addition, they are economical and require minimal maintenance. The first AASHTO specification for elastomeric bearings was approved in 1961. This early specification was oriented toward unreinforced elastomeric bearing pads. Reinforced elastomeric bearings, for which the original specification is inappropriate, have been used much more frequently in recent years. As a result, NCHRP Project 10-20 was established in 1980 to develop an improved design specification. The first phase of the research was completed in 1982, and the results are included in NCHRP Report 248. That report contained a basic description of elastomeric bearing behavior and the funda-mental concepts required for design; it also included a draft specification which was adopted by AASHTO in 1985.
It was shown in NCHRP Report 248 that there were deficiencies in the under-standing of elastomeric bearing behavior. Different design specifications contained discrepancies and contradictions, and frequently offered no sound reasons for selecting one design approach over another. The research suggested that the then existing AASHTO Specification (in 1981) was frequently overly conservative in the design of reinforced elastomeric bearings and sometimes unconservative in the design of un-reinforced elastomeric pads. The report indicated a number of areas where design and construction of bearings could be substantially improved if additional research were performed. As a result, a second phase of the NCHRP Project 10-20 research program was instituted to examine these issues.
Phase II started in 1983, and the results of that phase of the research are described in NCHRP Report 298. The research examined the failure modes of elastomeric bearings and developed recommendations for a more refined method (Method B) for elastomeric bearing design. The research examined fatigue failure of elastomeric bear-ings, stability of bearings, failure of reinforcement, delamination or separation of the elastomer from the reinforcement, and the general strength and stiffness of the bearing under compression, shear, rotation and combined loading. The research included an analytical study of the low temperature stiffening of elastomer bearings. The analysis was based on the best available experimental information on the thermal stiffness effect, and it suggested that bearings with poor low temperature behavior could develop shear forces much larger than those calculated using the room temperature elastomer properties. Tentative recommendations for including this effect in the proposed Method B design specification were included, but they could not be directly used because there was no acceptable existing test procedure for evaluating the low temperature behavior of elastomeric bridge bearings. Further, the proposed design specification resulted in a significant increase in the allowable load capacity of some bridge bearings, and the research clearly indicated that the quality of the manufacturing of the bearings is important in the development of this increased load capacity. Thus, an additional phase of research concerning the low temperature stiffness and quality control in bearing manufacture was initiated.
Phase III was to be accomplished through the conduct of two major tasks, with each task having several major objectives. Task A was an experimental study into the low temperature stiffness of elastomeric bearings, and an evaluation of acceptance criteria and manufacturing tolerances for elastomeric bearings. The objective of the low temperature research was to establish acceptance test procedures and design requirements for low temperature behavior of elastomeric bridge bearings. Secondary objectives concerned the development of a better scientific understanding of low temperature behavior, evaluation of the range of behavior expected from practical bridge bearing elastomer compounds, and correlation of the observed or measured behavior to actual field conditions. The research related to manufacturing tolerances and acceptance criteria required a reexamination of existing knowledge and manu-facturing methods and the development of recommended provisions for the AASHTO Specification.
Task B comprised a state-of-the-art review, an analysis of the information obtained, and the development of general recommendations for research requirements and the need for a design specification for pot bearings and polytetrafluorethylene (PTFE) sliding surfaces. It did not require the development of a draft specification because of the breadth of the topic and the understanding that additional research was required before an acceptable specification could be developed. The Task B research was reported in NCHRF Research Results Digest 171, "Pot Bearings and PTFE Sliding Surfaces."
This report provides a comprehensive description of research related to low tem-perature stiffening of elastomers used in bridge bearings. The existing research is briefly summarized and correlated to bridge engineering practice. It is shown that elastomers may be many times stiffer at low temperatures than at room temperature, and this may result in forces in the bridge that are much larger than those anticipated in the design. The low temperature stiffening effect may be caused by crystallization or instantaneous thermal stiffening. Crystallization is dependent on time and tem-perature, and it is very sensitive to the elastomer compound. Instantaneous thermal stiffening occurs very quickly, normally at temperatures well below those that cause crystallization. Elastomers may also reach a brittle state known as the glass transition at very low temperatures. Existing test methods are examined in detail to determine if they are applicable to the low temperature phenomenon in bridge bearings. It is shown that existing AASHTO tests evaluate brittleness, but provide no guidance for the stiffening effect. Other standard ASTM test methods, such as the Clash Berg test, are suitable for the evaluation of instantaneous thermal stiffening. There were no suitable tests for low temperature crystallization and, thus, a test method specifically for bridge bearings was developed as part of this research and is described in this report. The test apparatus was designed and built and it was used to perform a wide range of low temperature tests on elastomeric bridge bearings. The tests clearly indicate that elastomeric bearings can develop extremely large forces at low temperatures, but these forces can be controlled. The research leads to relevant conclusions regarding the low temperature behavior. A service condition test was used to correlate these general scientific conclusions to the bridge engineering practice. The results of the tests are combined with an analytical study of temperature conditions in the United States and specific recommendations for the AASHTO Specification are derived. These detailed recommendations are included in Appendixes A and B. The research described in Chapters Two through Four of this report provides a better scientific understanding of the low temperature stiffening behavior of elastomers but, more importantly, it also provides practical guidelines for assuring satisfactory behavior in bridge engi-neering practice.

3
In addition, this report examines the quality control standards required for elas-
tomeric bearings. The manufacturing tolerances required by the AASHTO Specifi-
cation are examined and their effect on the bridge bearing performance is noted.
Several recommended changes are made in response to this study. The testing and
certification requirements are examined, and recommendations for revisions to the
AASHTO Division Il—Construction Specification are derived and presented. The
recommended specification includes the basic (Method A) design method that was
adopted in the 1985 AASHTO Specification. It also presents a new refined design
method (Method B) which may permit much larger loads and deformations on
elastomeric bearings. The refined method requires additional engineering calculations,
but it should permit much broader use of elastomeric bridge bearings in the United
States and prevent the occasional problems that occur in present practice.
CHAPTER ONE
INTRODUCTION AND RESEARCH APPROACH
BACKGROUND
Elastomeric bearings are now used with increasing frequency. They can support large gravity loads, while accommodating large movement through deformation of the elastomer and, above all, they are economical and require minimal maintenance. The current specifications for elastomeric bearings in the AASHTO Standard Specification for Highway Bridges (1) were first approved in 1961 and are based primarily on developmental work done by the DuPont Company (2). This early work and the resulting specifications were oriented toward unreinforced elastomeric bearing pads. Reinforced elastomeric bearings, for which the original specification is inappropriate, have been used much more frequently in recent years. NCHRP Project 10-20 was initiated in 1980 in response to the need to develop an improved design specification. The first phase of research was completed in 1982, and the results, including a basic description of elastomeric bearing behavior and the fundamental concepts required for design, are documented in NCHRP Report 248 (3). NCHRP Report 248 showed that there were severe deficiencies
in the existing understanding of elastomeric bearing behavior. Different design specifications contained wide discrepancies and contradictions, and frequently offered no sound reasons for se-lecting one design approach over another. The research sug-gested that the existing AASHTO Specification (in 1981) was frequently overly conservative in the design of reinforced elas-tomeric bearings and sometimes unconservative in the design of unreinforced elastomer pads. NCHRP Report 248 proposed a simplified, rational design specification, which was adopted with minor revisions in the AASHTO Specification in 1985. The report indicated a number of areas where design and con-struction of bearings could be substantially improved if addi-tional research were performed. As a result, a second phase of research was initiated to examine these issues.
The second phase of NCHRP Project 10-20 started in 1983
and was completed in 1987. The results are described in NCHRP Report 298 (4). The research documented in that report ex-amined the failure modes of elastomeric bearings and proposed a more refined method (Method B) for elastomeric bearing design. The simplified design procedure developed in Phase I of the research was retained as Method A in the Phase II research. The second phase research examined fatigue failure of elastomeric bearings, stability of bearings, failure of reinforce-ment, delamination or separation of the elastomer from the reinforcement, and the general strength and stiffness of the bearing under compression, shear, rotation, and combined load-ing. The research also included an analytical study of the low temperature stiffening of elastomeric bearings. The analysis was based on the best available experimental information on the thermal stiffness effect, and it suggested that bearings with poor low temperature behavior could develop• shear forces much larger than those calculated using the room temperature elas-tomer properties. Tentative recommendations for including this effect in the proposed Method B design specification were in-cluded, but they could not be directly used because there was no acceptable existing test procedure for evaluating the low temperature behavior of elastomeric bridge bearings. Further, the proposed design specification resulted in a significant in-crease in the allowable load capacity of some bridge bearings, and the research clearly indicated that the manufacturing quality of the bearings plays an important role in the development of this increased load capacity. Thus, a third phase of research was initiated in June 1986, focusing on low temperature stiffness behavior and quality control in bearing manufacture.
PHASE III RESEARCH OBJECTIVES AND SCOPE
The objectives of the third phase were to (1) resolve design procedures for special applications of unconfined elastomeric
bearings and (2) provide a critical state-of-the-art review of design and construction procedures for confined elastomeric (pot) bearings. These objectives were to be accomplished through the conduct of two major tasks (A and B).
Task A required an experimental program to study the stiff-ness of elastomeric bearings at low temperature and an analytical program to evaluate acceptance criteria and manufacturing tol-erances for elastomeric bearings. The low temperature research was to be primarily directed toward the development of ac-ceptance test procedures and design requirements for low tem-perature behavior of elastomeric bridge bearings. Its secondary objectives were directed toward the development of a better scientific understanding of low temperature behavior, evaluation of the range of behavior expected from practical bridge bearing elastomer compounds, and correlation of the observed or mea-sured behavior to actual field conditions. The research related to manufacturing tolerances and acceptance criteria required a reexamination of existing knowledge and manufacturing methods and the development of recommended design provi-sions.
Task B included a comprehensive state-of-the-art review, an analysis of the information obtained, and the development of general recommendations for research requirements and the need for a design specification for pot bearings and polytetra-fluorethylene (PTFE) sliding surfaces. It did not require the development of a draft specification because of the breadth of the topic and the understanding that additional research was required before a good specification could be written. The pot bearing and PTFE research has been previously reported in NCHRP Research Results Digest 171, "Pot Bearings and PTFE Sliding Surfaces," and will not be repeated here. This report will describe the general methods and approach used in the research of the third phase of NCHRP Project 10-20.
RESEARCH APPROACH
The elastomeric bearing research was composed of four major tasks and a presentation. This section briefly describes each of these tasks. More detailed discussion is given in Chapters Two through Four. Conclusions and recommendations are included in Chapter Five. Appendixes A and B, respectively, provide the proposed modifications and commentary to Sections 14 and 25 in the AASHTO Standard Spec Wcation for Highway Bridges. Details of the testing equipment are described in Appendix C. Appendix D closes the report with a presentation of design examples using the new refined Method B developed in Phase III.
Task A Effort
Task Al required the detailed experimental examination of low temperature behavior of elastomeric bearings. Previous re-search (3, 4) has shown that elastomeric bearings may stiffen dramatically at low temperatures, and this increased stiffness may result in forces larger than the bearing design force in the bearing and the structure. The bearing design force is defined as the calculated force induced in the bearing when the bridge superstructure undergoes its maximum design movement, using room temperature properties of the elastomer. A brief summary
of this earlier research is provided later in Chapter Two. Thus, this part of the research was directed toward the development of a rational test procedure for low temperatures, the perform-ance of tests to better understand and evaluate the low tem-perature behavior of elastomeric bridge bearings, and the correlation of the observed behavior to actual field conditions. A major objective of this part of the research was the design of a test apparatus and the development of a test procedure which could be used by state bridge engineers to certify that the elas-tomeric compound provided for bridge bearings is adequate for the climatic requirements of that region.
The first need was for a test apparatus and procedure for evaluating low temperature performance of elastomeric bearings. The test apparatus and test procedures required investigation of a number of unusual parameters. An in-depth discussion of this initial work is also included in Chapter Two of this report. After the initial design and development stage, an extensive series of tests were performed. These tests examined the vari-ability in the stiffness and behavior of practical elastomeric bridge bearing compounds at different times and temperatures. Field conditions were simulated in an additional series of ex-periments. These experiments were crucial in understanding how the low temperature performance of the elastomer affects bridge performance and how it should be accounted for in the bridge design. Some experiments were specifically directed toward eval-uation of a test method and its suitability for inclusion in the AASHTO Specification. Some preliminary research work was done, in conjunction with other laboratories, to evaluate new elastomer compounds that were designed to have good low temperature performance and alternative test methods. Discus-sion of this part of the research and the resulting design rec-ommendation are detailed in Chapters Three and Four, respectively, and specification recommendations are included in Appendixes A and B. Appendix A includes recommendations for the design of bearings, and these are presented as a proposal for the modification of Division I, Section 14 of Ref. 1. Appendix B includes recommendations for the manufacture, construction, acceptance, and installation of elastomeric bearings, and these are presented as a proposal for the modification of Division II, Section 25, of Ref. 1. Several design examples, which use these proposed provisions, are contained in Appendix D.
Task A2 was an evaluation of manufacturing tolerances and methods, and Task A3 was an evaluation of the certification test procedures for elastomeric bridge bearings. A Method B design specification was proposed in the second phase of the NCHRP 10-20 research project (4). This specification results in significant increases in the allowable load and deformation capacity of some bearings. The supporting research (4), how-ever, indicates that bearings are able to consistently attain these increased capacities only if they are manufactured to high quality standards. Thus, these two tasks are directed toward examining tolerances and quality control, and development of improved provisions for the proposed AASHTO specification. They do not include experimental or extensive analytical investigation. Instead, they contain a combination of experimental and the-oretical information obtained in earlier parts of the NCHRP 10-20 research project, discussion of the problems with manu-facturers, bridge engineers, and other practitioners, analysis of these factors, and development of recommended specification provisions. Details of this research and the resulting design recommendations are discussed in Chapter Three. These rec-
<J SHEAR FORCE
SHEAR STRAI N
b)
ROTATION OR APPLIED t'1EUT
STRAIN
c)
ommendations are primarily concerned with construction and acceptance. The recommendations are incorporated in the draft specification provided in Appendix B.
Task A4 was devoted mainly to the preparation of this report. Task A5 included the preparation of a presentation of these
research results and the final recommended provisions for the AASHTO Specification to the annual meeting of the AASHTO Subcommittee on Bridges and Structures. This presentation will be made in early 1990.
CHAPTER TWO
LOW TEMPERATURE TEST METHODS
LOW TEMPERATURE BEHAVIOR
C1PRESSIVE LOAD The behavior of elastomeric bridge bearings at low temper-
ature was one of the major research areas in this phase of NCHRP Project 10-20. Before describing the new research de-velopments, however, it is worth summarizing earlier research (3, 4) and the fundamentals of bearing behavior.
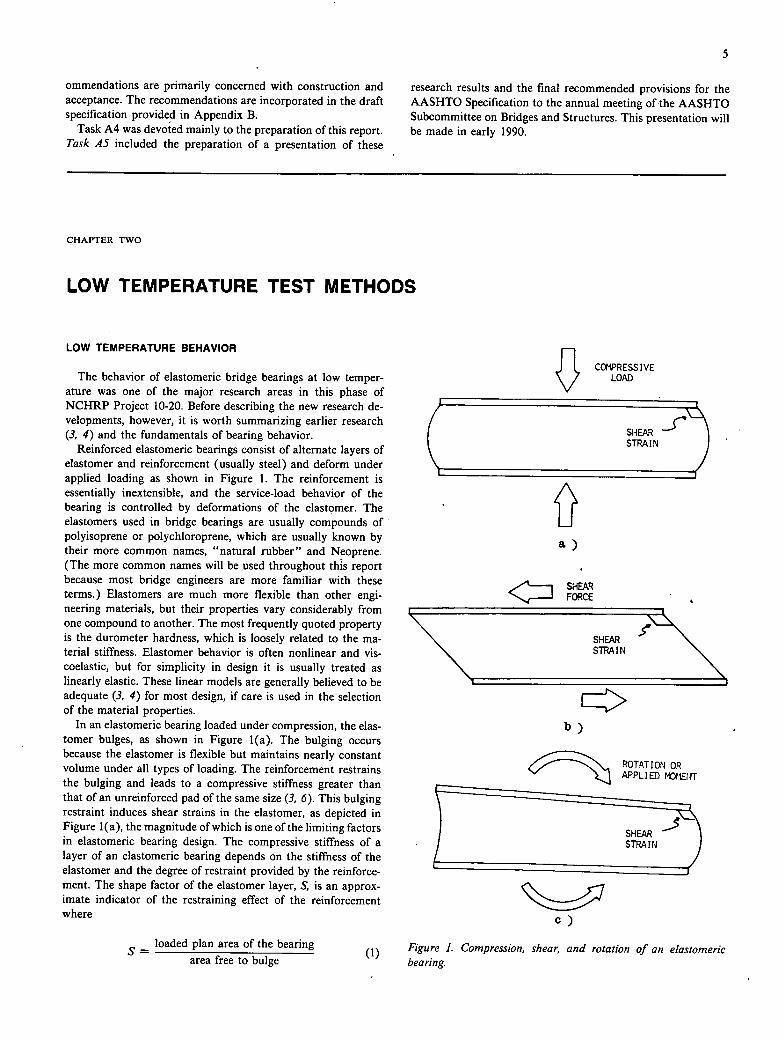
Reinforced elastomeric bearings consist of alternate layers of elastomer and reinforcement (usually steel) and deform under applied loading as shown in Figure 1. The reinforcement is essentially inextensible, and the service-load behavior of the bearing is controlled by deformations of the elastomer. The elastomers used in bridge bearings are usually compounds of polyisoprene or polychioroprene, which are usually known by their more common names, "natural rubber" and Neoprene. (The more common names will be used throughout this report because most bridge engineers are more familiar with these terms.) Elastomers are much more flexible than other engi-neering materials, but their properties vary considerably from one compound to another. The most frequently quoted property is the durometer hardness, which is loosely related to the ma-terial stiffness. Elastomer behavior is often nonlinear and vis-coelastic, but for simplicity in design it is usually treated as linearly elastic. These linear models are generally believed to be adequate (3, 4) for most design, if care is used in the selection of the material properties.
In an elastomeric bearing loaded under compression, the elas-tomer bulges, as shown in Figure 1(a). The bulging occurs because the elastomer is flexible but maintains nearly constant volume under all types of loading. The reinforcement restrains the bulging and leads to a compressive stiffness greater than that of an unreinforced pad of the same size (3, 6). This bulging restraint induces shear strains in the elastomer, as depicted in Figure 1(a), the magnitude of which is one of the limiting factors in elastomeric bearing design. The compressive stiffness of a layer of an elastomeric bearing depends on the stiffness of the elastomer and the degree of restraint provided by the reinforce-ment. The shape factor of the elastomer layer, S. is an approx-imate indicator of the restraining effect of the reinforcement where
SHEAR -5fl STRAIN
5= loaded plan area of the bearing
area free to bulge (1) Figure 1. Compression, shear, and rotation of an elastomeric
bearing.

Unreinforced bearings rely on friction to provide restraint against bulging. Friction is highly variable and unrealiable, but the beneficial effects of bulging restraint can still be measured in terms of the shape factor, provided an effective 5, smaller than the true one, is used. A bearing layer with a large shape factor and high elastomer stiffness has a larger compressive stiffness than one with a lower elastomer stiffness or small shape factor.
Thermal movements, creep or shrinkage of concrete, or move-ments induced by braking or acceleration forces of highway traffic are accommodated by shear deformation of the elastomer, as depicted in Figure 1(b). The shear strain, 'y, in the elastomer is given by the magnitude of the movement, A, times the shear modulus, G, of the elastomer and its plan area, A. This force is transmitted to the bridge substructure and superstructure and, as such, can be an important parameter in the design of the bridge and the bearing. An increase in the elastomer stiffness or the plan area of the bearing results in a direct increase in this force for a given movement. An increase in the height of the bearing or a decrease in the plan area or elastomer stiffness results in a decrease in this design force.
Initial camber of beams and girders, out-of-level seating sur-faces, and beam end rotations due to bridge loading or the daily temperature cycle may result in rotation of the bearing, as shown in Figure 1(c). This reduces the bulging on one side of the bearing and increases it on the other. However, the deformations shown in the figure are superimposed on those caused by compression, so most bearings under combined loading bulge outwards on both sides. Large shear strains may result in the elastomer due to rotation. The moment required to induce the rotation depends on the stiffness of the elastomer, the plan geometry of the bearing, and the relative thickness of the elas-tomer layers. The shape factor is an approximate measure of the latter. The bearing rotational stiffness and the magnitude of the rotational movement can be very important because the bridge substructure and superstructure must be able to resist the required moment and the elastomer must be able to with-stand the resulting shear strain.
This elementary description of bearing behavior leads to a basic understanding of elastomeric bearing design. The elasto-mer compound and geometry of the bearing must be chosen so that the bearing can accommodate the required shear and ro-tational movements, without developing excessive forces or mo-ments, and at the same time support large gravity loads without excessive deformation. It has long been recognized that elas-tomers stiffen at low temperatures, and this low temperature stiffness can have a dramatic effect on the movement capacity and the resulting forces in the bridge structure because the maximum bridge movement sometimes occurs during periods of very low temperature. It is known that some elastomer com-pounds can be several hundred times stiffer (3) at lower tem-peratures than at room temperature. This results in a corresponding increase in the incremental forces and moments for incremental shear and rotational deformations occurring at these low temperatures. While all elastomers stiffen at low tem-peratures, the magnitude of the stiffness increase at a given time and temperature varies dramatically with different elastomer compounds. AASHTO (1), the British Standard BS 5400 (13), and other design specifications (3, 4, 12) for the U.S. and other countries have long recognized the possibility of low temperature
stiffening by requiring that elastomer compounds used in elas-tomeric bridge bearings satisfy low temperature test require-ments such as hardness (7), compression set (8), and brittleness (9).
These existing tests have served adequately for many years, because elastomeric bearings have historically been designed to support relatively small loads with modest movement require-ments. Recent changes to the AASHTO specifications (Method A, Ref. 3) and proposed changes (Method B, Ref. 4) result in a significant increase in the allowable loading of some elasto-meric bearings, and more refined methods of evaluating low temperature behavior are required for these new conditions. Murray and Detenber (10) performed a basic experimental in-vestigation of low temperature behavior of elastomeric com-pounds. They based their behavior observations on hardness and compression set tests of the elastomer. They showed that two types of low temperature stiffening occur. Crystallization is a time and temperature dependent stiffening effect, which is sometimes known as the first order transition. It represents a phase change in the molecular structure of the elastomer. They indicated that polychloroprene (Neoprene) crystallizes more rapidly than natural rubber, but the rate of crystallization de-pends on both the type of Neoprene and the other additives used in the compound. Neoprene is used for a wide range of different applications, and many different types of raw polymer are produced under the trade name of Neoprene. Only a few of these types (Type W, Type G, and occasionally Type WRT) are used in bridge bearings. There is a difference in the cost of these types of Neoprene; however, each is best suited for a different application. Historically, the selection of the type of Neoprene has been made by the bearing manufacturer and is transparent to the bridge engineer, even though it may have considerable impact on the performance of the bearing. Type WRT Neoprene resulted in much slower rates of crystallization than Types G or W, and Neoprene with smaller quantities of plasticizer typically crystallizes more slowly than compounds with larger quantities. Plasticizers are usually required to aid the mixing of the elastomer compound. Murray and Detenber indicated that the most rapid rate of crystallization occurred at a temperature of approximately - 10°C (14°F) and that the rate of crystallization decreased significantly at temperatures higher or lower than this optimum value, as illustrated in Figure 2. It should be emphasized that these observations on the rate of crystallization are based on hardness rather than the stiffness of the elastomer. As will be shown later in this report, hardness is not a good indicator of low temperature stiffness.
Thermal stiffening is an instantaneous increase in the stiffness of the elastomer, which is sometimes associated with the second order transition, as depicted in Figure 3. Figure 3 shows that elastomers sustain a small increase in stiffness as the temperature drops, but a dramatic increase in stiffness occurs at the second order transition. Murray and Detenber (10) defined the second order transition temperature as that at which the stiffness reaches 10,000 psi and showed that it also varies with the type of elastomer and the elastomer compound. They indicated that natural rubber reached its second order transition at lower tem-peratures than most Neoprene compounds. They also noted a third low temperature effect known as glass transition. Small samples of elastomer may fracture in a brittle manner at the glass transition. All natural rubber and Neoprene compounds

II
ON U) N
:1
I
0 0.01. 0.1 1 10 100 1000
7
400
300
200
14
100
100000 WET NEOPRENE DATA
MURRAY AND DETENBER
10000
1000
1
WRT NEOPRENE
DATA FROM
MURRAY AND DETENBER
NEOPRENE W WITH
,) PETROLEuM OIL
W WITH
BUTYL OIL
30 20 10 0 —10 —20 —30 —40
TEMPERATURE (°C)
Figure 2. Time required to achieve half crystallization. (Source: Ref. 10)
exhibited a glass transition which was at least 5 centigrade degrees (9 fahrenheit degrees) below the second order transition temperature.
Stevenson (11) also performed an extensive series of low tem-perature tests on seven natural rubber and two Neoprene com-pounds. He performed tensile strength, elongation at break, aging resistance tests under normal conditions, and hardness, compression set, and elastomer tensile stiffness tests at - 10°C (+ 14°F) and - 25°C (— 13°F) over time periods up to 180 days. Figure 4 shows typical results from these tests. Stevenson did not distinguish between time-dependent crystallization in his experiments and instantaneous thermal stiffening. However, the
Figure 4. Typical time and temperature dependent experimental results. (Source: Ref. 11)
time scale is a log scale and the low temperature phenomena can be separated approximately as depicted in Figure 5 (4).
Stevenson's test data are generally consistent with the results provided by Murray and Detenber (10) in that some of the stiffening occurred instantaneously, while some were time-de-pendent as indicated in the idealization of Figure 5. The tests were performed at —10°C and —25°C (14°F and —13°F), well above the second order transition temperature and, as a result, relatively small amounts of instantaneous thermal stiffening were noted for all specimens. The time-dependent stiffening due to crystallization varied widely with different temperatures and elastomeric compounds. Some compounds stiffen more quickly than others, and some stiffen larger amounts. The hardness, stiffness, and compression set all appeared to stabilize at a given maximum value after a period of time, as depicted in Figure 5. However, the tests clearly indicated that hardness and compres-sion set are not good indicators of the tensile stiffness, and the maximum rate of crystallization stiffening based on tensile stiff-ness measurements typically did not occur at - 10°C (14°F) as suggested in Ref. 10. Thus, although there was good general correlation between the two separate studies, substantial differ-ences and contradictions existed on specific issues.
Time Dependent
iffening
Time Rred For
Thermal Equilibrium
- - Instantaneous Stiffening Due To
- Thermal Stiffening Crystallization
0.01 0.1 1 10 100 1000
100 —10 —20 —30 —40 - TEMPERATURE ( ' C)
Figure 3. Instantaneous thermal stiffening. (Source: Ref. 10)
TIME (Hours)
Figure 5. Approximate idealization of time and temperature de-pendent stiffness.
Recent studies (14) have suggested that cyclic dynamic load-ing caused by truck traffic and bridge movements caused by the daily temperature fluctuations may break down the crystalli-zation stiffening effect. If this is true, it would reduce the harmful effects of low temperature stiffening. (In this report, thermal stiffening will be used to describe the general increase in stiffness associated with low temperature. Crystallization will refer to the time-dependent stiffness increase that occurs after the elas-tomer has been exposed to low temperatures for a period of days or weeks. Instantaneous thermal stiffening will be used to describe the low temperature stiffness increase noted within a few hours or days. The reversal, or reheating, of the stiffening effects of cooling the elastomer will be referred to as thawing.)
The second phase of the NCHRP Project 10-20 (5) used empirical models of the existing low temperature research (10, 11) to estimate the temperature-dependent forces expected in an elastomeric bearing with various low temperature records. It was noted that air temperature is not necessarily a good indication of the temperature of an elastomeric bearing because of the poor conductivity of rubber, the large thermal mass of the bearing, and the resulting time delay which occurred. The elastomeric bearing typically did not experience the extreme low air temperature, and the difference tended to be larger when the low temperature was of short duration or the bearing was large or had thick cover layers. However, time delays in the order of several hours were typical for most practical-sized bearings. When these combined factors were considered, it was estimated that in climates as mild as Lubbock, Texas, elasto-meric compounds with relatively poor crystallization resistance could experience forces more than three times those calculated by ignoring low temperature stiffening. Relatively severe cli-mates such as Duluth, Minnesota, require good crystallization resistance to assure that the forces are within three times the design force limit. The calculations predicted that elastomers with both very good crystallization resistance and resistance to thermal stiffening are required to keep forces below this limit in extremely cold climates such as Fairbanks, Alaska.
The low temperature force calculations were approximate, but they were based on the best available information at the time. They show that very large low temperature forces may occur if the elastomer does not have low temperature properties that are appropriate for the environment, and these may cause damage to the structure. This potential for structural damage increases with newer bridge designs, in which conservatism is continuously decreasing due to economic constraints. This po-tential for damage, combined with the more liberal design pro-visions for elastomeric bearing design proposed in the Method B design procedure (4), illustrates the importance of having an adequate and appropriate low temperature test procedure for elastomeric bridge bearings.
TEST METHODS IN EXISTING SPECIFICATIONS
One of the major objectives of this research was the devel-opment of an appropriate low temperature test method. The AASHTO specification provides no guidance on a standard test for determining if a given elastomer compound is satisfactory for the local conditions. A test method is also required to obtain basic information to better understand the low temperature be-havior of elastomers and to correlate the results of standard
tests to actual environmental conditions. Accomplishing these objectives required an analysis of the effectiveness of low tem-perature tests presently employed in the AASHTO specifications (1), in existing proposals (3, 4) for modification of the AASHTO specifications, and in other related U.S. standards (12) and similar test methods applied in foreign design specifications such as BS 5400 (13).
The AASHTO specification (1) has historically required only a low temperature brittleness test. The ASTM D746 (9) test standard is required for this test procedure, although ASTM D2137 (15) is a very similar test method with nearly identical specimens. ASTM D746 requires that five specimens be cooled to equilibrium at —40°C (-40°F) and that none of the speci-mens fail when subjected to specified impact. The specimens are commonly cooled in a bath of boiling liquid nitrogen and are deemed to have failed when they crack visibly or pieces break off. They are inspected for cracks by bending at a 90 deg angle in the direction of impact after the specimen has returned to room temperature. The test can also be used to develop probability of failure data at different temperatures through ASTM D2 137. This low temperature brittleness test is a rational way of ensuring that the elastomer will not undergo glass tran-sition in service, because the test temperature of - 40°C (- 40°F) is well below the extreme low temperatures expected for most parts of the United States. The test may be quite conservative for the milder climates in the United States. However, it does not appear that the conservative nature of the test for these regions is a serious problem, because a number of economical elastomer compounds can meet these requirements. The test is unconservative for a few portions of the North American con-tinent, including the northern tier states, Alaska, Canada, and some mountainous regions where extreme low temperatures of —40°F or lower can be expected. It would appear that a lower test temperature is required for these regions.
The foregoing tests do not address the elastomer stiffness expected for time-dependent low-temperature crystallization or instantaneous thermal stiffening. This stiffness represents one of the major concerns in elastomeric bearing design because it relates directly to the temperature-dependent forces expected in the bridge and the substructure, and this deficiency in the AASHTO specifications has been recognized for a number of years. As a result, the ASTM D4014 Standard Specification for Elastomeric Bearings (12) requires the addition of low temper-ature hardness (7) and compression set (8) tests to help resolve this deficiency. The British Standard BS 5400 (13) requires similar tests. These test procedures were included in the rec-ommended provisions (3) for the Method A design specification in 1981, but they were not adopted in the 1985 AASHTO Specification (1). The low temperature hardness test requires that elastomer hardness not increase by more than 15 Shore A durometer hardness points when subjected to 22 hours at —10°C (14°F) for Grade 2 elastomer, 22 hours at —25°C (-13°F) for Grade 3 elastomer, and 22 hours at —40°C (-40°F) for Grade 5 elastomer. The elastomer grades are defined in ASTM D4104, but they were established to be consistent with general guidelines of ASTM D2000. Higher grade elastomers are thus required for colder climates, and guidelines for judging the grade required in different climatic regions are proposed in the recent Method B provisions (4) for inclusion in the AASHTO Specification. This provision is clearly an improvement on the existing AASHTO requirement, since it is generally believed that hard-

ness is an approximate indicator of elastomer stiffness (16). However, it is not a completely rational requirement for several reasons. First, the selected temperatures are in the normal range for crystallization, but the 22-hour time limit is not nearly long enough (10, 11) to assure that crystallization stiffening is com-plete. Second, the test temperatures and the duration of the temperatures are not rationally correlated to regional require-ments, because some research (10) has suggested that the max-imum crystallization rate may not occur at extreme low temperatures but at higher levels. Third, hardness is operator-dependent and has poor repeatability even at room temperature, and at low temperature is subject to extra difficulties. The hard-ness decreases rapidly due to the surface heating of the elastomer by the warm durometer after the instrument is applied to the specimen, so slight differences in the delay in reading the data after applying the durometer may cause very different results. The durometer reading is a surface measurement and the surface warms quickly after it is removed from the freezer, so slight differences in operator speed and style also can lead to dra-matically different measured results. Finally, research performed by Stevenson (11) indicates that low temperature hardness is at best only an approximate indicator of low temperature stiff-ness.
In the low temperature compression set test (ASTM D1229), a button-shaped specimen is compressed by 25 percent of its thickness, subjected to low temperature, and then released. The set is the proportion of the compressive deflection which remains after release. The low temperature exposure times depend on the elastomer grade. The proposed requirements for Section 22 of Division II of the Method A specification (3) required that the compression set be less than 65 percent after exposure to 22 hours at 0°C (32°F) for Grade 2, 7 days at - 10°C (14°F) for Grade 3, and 14 days at —25°C (-13°F) for Grade 5 elastomer. This test is somewhat rational, because it allows adequate time for some crystallization to occur, but it also suffers from substantial drawbacks. First, there is no fundamental rea-son to believe that low temperature crystallization stiffness is related to compression set, and Stevenson's test results (11) indicate that there is little relationship between the two low temperature measurements. Further, the test time and temper-ature are not specifically chosen to coincide with the critical values for the elastomer compound and the region.
OTHER EXISTING STANDARD TEST PROCEDURES
The existing tests used by AASHTO (1), BS5400 (13), and other recommended or proposed specification provisions (3, 4,
12) are only partly rational. It is clear that they do not provide a complete evaluation of the low temperature properties of the elastomer nor assure that the elastomer is appropriate for the given region. As a result, other existing test methods were ex-amined to determine if they would fill the needs.
ASTM D1043 (17) is a temperature-dependent torsion test that is sometimes known as the "Clash-Berg" test. The test is designed for use with plastics but has been frequently used for elastomers. The specimen is cooled to a given equilibrium tem-perature, and the temperature is maintained for 3 mm. The low temperature is actually achieved with dry ice in an environ-mental chamber. These environmental chambers are manufac-tured and sold by several standard test equipment
manufacturers, such as Material Testing Services (MTS), and Instron. A standard test specimen is then loaded with a known torsion, and the angle of twist in the specimen is measured directly. The test apparatus, shown in Figure 6, applies the torque to the specimen with a system of hanging weights and pulleys. The test procedure may be very suitable for evaluating instantaneous thermal stiffening and determining the second order transition, but it is inadequate for determining crystalli-zation behavior because the duration of the applied temperature is very short. Because the dry ice is added manually, maintaining the low temperature accurately over a period of days would be difficult, and so it is not practical to adapt this test to the long time periods required to evaluate low temperature crystalliza-tion. The stiffness measured by this test method is not directly comparable to the usual shear stiffness of the elastomer required for elastomeric bearing design. However, it would appear to be a good relative measure of instantaneous elastomer stiffness. The test set-up for this test procedure costs in the order of $7,000.
ASTM D1053 (18) describes another low temperature tor-sional stiffness test that is sometimes known as the "Gehmens" test. The test procedure connects a standard elastomer specimen in series with a torsion wire of known or measurable torsional stiffness. A fixed 180 deg rotation is applied to the combined apparatus, and the rotation within the elastomer specimen is directly measured. The test utilizes the knowledge that elements in series subject to a known total deformation distribute the deformation between elements in proportion to the inverse of their relative stiffness. Thus, this test gives a good relative com-parison of the temperature-dependent stiffness of the test spec-imen relative to the stiffness of the torsion wire. The test method requires a minimum rotation of the test specimen, and as a result the stiffness of the torsion wire may need to be adjusted for very stiff or flexible elastomer compounds. The test method requires a specific time delay to assure that the deformations have stabilized before the measurement is taken. The test pro-
Li
Torque - Pulley Scale Graduated,
0— 360°
in
Torque - Pulley
Stoi Pin Load Pulley
Load Hanger Support Rod
Specimen ClampTest Specimen tt1j.. I JrII Coolant Level
Dewar Plask
Figure 6. Clash-Berg test apparatus.

cedure has two basic methods, with Method A commonly used for elastomer specimens. The low temperature is developed again with dry ice in an environmental chamber or in a boiling liquid bath. The temperature is maintained for 5 min before the test is performed. A specific test apparatus is also required for this test, as shown in Figure 7. The test method may also be suitable for evaluation of instantaneous thermal stiffening and the second order transition, but the temperature is of such short duration that it provides no information on crystallization behavior. The stiffness is again relative, and is not directly comparable to the shear stiffness required for elastomeric bearing design. The test apparatus for this test would be slightly less expensive than the apparatus required for the Clash-Berg test, but the results are also less directly applicable.
The final test described in this section is the Dynamic Me-chanical Analyzer test contained in ASTM D4065 (19). It was developed primarily for plastics, but would appear to be quite useful for elastomers. It requires a sophisticated test apparatus, which is shown in Figure 8. The apparatus is a patented item that was developed by the DuPont Corporation (20), and it costs in the order of $30,000 to $40,000, depending on the options selected. The temperature, rate and type of loading, and the measured results can be computer controlled with this equip-ment. The low temperature history is developed with dry ice in a controlled chamber. The loading is a cyclic dynamic loading in shear or bending, and the load rate and temperature can be varied as required. This general test technique was used in conjunction with some of the other tests described later in this report. It appears to be a good indicator of instantaneous thermal stiffening and would appear to be capable of evaluating crys-tallization behavior, since the temperature could be computer controlled over a long duration. However, it appears to be of questionable economic wisdom to tie up an expensive test ap-paratus for the 2 to 3 weeks required to complete a crystallization test.
Torsion Head
Torsion Wire Sieve Pointer Movable Protractor Screw Connector Clamp Stud
Specimen Rack Top Clamp Test Specimen
Bottom Clamp
Supporting Stand
Figure 7 Geh man low temperature test apparatus.
Arm Locking Pins
LVDT .&djU8txflent Electromagnetic T LVDT /
/PIOXU.P5j Pivot
SUda Lk Sample Arm
Clamp
Length .A4Justmen/ ClampV
Lo
Screws
Set Sorew
Figure & Dynamic mechanical analyzer test apparatus.
TEST APPARATUS DEVELOPED FOR THIS STUDY
The foregoing tests are useful for detecting glass transition and measuring instantaneous thermal stiffening, but cannot eval-uate the longer term stiffening due to crystallization. Because crystallization is the dominant low temperature effect on bear-ings in the field, a test procedure was developed in this phase of the research which could measure the stiffness of bearing samples subject to low temperature for long periods. The test apparatus was developed to serve the following purposes: for a test procedure which could be used by bridge engineers to assure that the elastomeric bearing provided for a given bridge is suit-able for the local climate; for conducting tests to better under-stand the low temperature behavior of practical elastomeric bridge bearing compounds; and for correlating the measured low temperature behavior to actual field conditions. The first of these objectives requires a relatively economical test apparatus which provides consistent and repeatable experimental results. Should it be necessary to repeat these tests as part of state certification and acceptance processes, the apparatus had to be relatively easy to construct and make maximum use of com-ponents commonly found in major testing laboratories. The equipment to perform the test procedure for the other objectives had to be versatile and able to accommodate a wide range of time-dependent temperatures and loadings.
Time-dependent loading is important because recent research (14) has suggested that cyclic load and deformation of elasto-meric bearings may break down low temperature crystallization and reduce the stiffness and resulting force in the elastomeric bearing under low temperature conditions. Although these pa-pers (14) are not well documented, they are believed to be particularly relevant to Neoprene because Neoprene crystallizes more than natural rubber at low temperatures (3, 4, 10, 11). Thus, it is possible that cyclic compressive loads caused by truck

Is
traffic on the bridge and cyclic shear deformation due to the daily temperature cycle of the bridge superstructure may par-tially break down the crystallization and reduce the forces due to low temperature effects in the bearing. It was determined that a quad-shear test apparatus, as shown in Figure 9, was the best arrangement to test low temperature behavior of elastomeric bearings for several major reasons. First, the results of this test are directly applicable to bridge bearings because the compres-sive strain needed to clamp the bearings is typical of the com-pressive load encountered in practice and the shear strain is typical of the shear strain caused by thermal movement and creep and shrinkage of concrete. Second, the quad shear test uses symmetric loading and eliminates the stability concerns commonly noted with other combined shear and compression test arrangements. Third, the quad shear test has received in-creasing acceptance (3, 4, 12) as a tool for evaluating elastomeric bearing stiffness and behavior. Fourth, the quad shear test is quite versatile in that the specimens can be taken from an actual bridge bearing rather than specially manufactured specimens. This eliminates the possibility that the material in the bearing and the test specimen will be different. Other tests such as the Gehmans, Clash-Berg, and Dynamic Mechanical Analyzer test are indicators of relative stiffness of the elastomer, but the stiff-ness measured during these tests is not directly usable by the bridge engineer. As a result, there is greater risk that the results will be misunderstood or misinterpreted. Finally, the quad shear test allows the versatility of loading required for all the major test objectives. The standard certification test can be performed with the clamped rig, as shown in Figure 9, but tests that require variation in compressive loading may use a hydraulic load ac-tuator as shown in Figure 10.
The quad shear apparatus illustrated in Figures 9 and 10 was constructed and tested as part of this research. Details of the test system are given in Appendix C. The 4-in, bearing size was chosen to be large enough to have a modest shape factor and be easily handled, yet small enough to assure that the loads required to clamp the bearing in compression and deform the bearing in shear would be within acceptable limits even when the bearing is stiff at very low temperatures. It was felt that a 22-kip force capacity in shear and a 55-kip force capacity in compression would be adequate for this purpose. The bearing specimens were recessed into the plates to prevent slip under shear loading. The compressive load plates were thick aluminum plates that were chosen to minimize bending deformation and weight to allow handling without a mechanical hoist. Further, aluminum has a larger coefficient of thermal expansion than steel and, as a result, a snug fit of the bearing in the recess at room temperature assured a tight fit at low temperature when large loads were required.
KUMINUM CLAMPING PLATE CLAMPING BOLT
_________________________ BEARING
SHEAR LOAD -'--... LOAD
Figure 9. Quad shear rig in clamped configuration.
Oompnuiv. 1.0.4 Applied
by PB Kip AituMor
.0.4
ti Figure 10. Quad shear rig with compressive loading applied.
The quad shear rig must be housed in a low temperature environment where temperature can be controlled over a long period of time and where the necessary loads can be applied where required. A number of possible low temperature units were considered. Several visits were made to other experimental laboratories to evaluate those alternatives. Four basic alterna-tives were considered, which included:
Use of the Quaternary Research Center environmental chambers at the University of Washington.
Use of a boiling liquid bath. The boiling liquid is commonly freon combined by weight with another liquid, but nitrogen and other low temperature gases are sometimes used.
Purchase of a small environmental chamber such as com-monly used with Instron or MTS test equipment.
Purchase of low temperature freezer unit for controlling temperatures.
The University of Washington Quaternary Research Center has 4 rooms, which may be rented and which can develop and maintain temperatures as low as —46°C (-50°F). The cost of the rooms was not excessive (approximately $100 per day), but several serious problems were noted. First, it appeared that the technician costs for controlling temperatures would be excessive, if an accurate day-to-day temperature cycle were to be used. Second, the facility could not be easily duplicated by most state DOTs, and as a result the test could not be easily used for future material quality control and acceptance testing. Finally, the cost to accumulate data would be considerable because the test ap-paratus and instrumentation would also be in the low temper-ature environment, and the accuracy and operation of this equipment is difficult to control at low temperature.
The boiling liquid apparatus appeared to be simple, relatively economical, and easily duplicated for cooling specimens to a specific controlled temperature. Liquid freon or nitrogen can be combined with another fluid and exposed to the atmosphere as a boiling liquid. It will maintain constant temperature for long periods of time. Simple control of the relative volumes of the liquid will 'accurately control the temperature, and different temperatures may be achieved by adjusting the volume ratios. This method appears to be relatively economical for developing and holding a low temperature. However, it was not clear how
12
the specimen could be kept cold during the actual test, because it is difficult to use force actuators and electronic instrumen-tation in a fluid. Further, it is not clear how the apparatus could accommodate a temperature history other than constant tem-perature.
MTS, Instron, and most test equipment manufacturers sell small environmental chambers for use with their load frames. However, the small chambers are expensive (in the order of $20,000). It would be relatively easy to adapt load and mea-surement equipment to these chambers. Such chambers are also available in most major test laboratories. They are typically cooled by an agent such as dry ice pellets. Low temperatures can be achieved, but the system appears to be practical only for a very short time. As a result, it would have to be combined with a freezer or the low temperature bath noted earlier. This would require that the cold specimen be moved from one unit to another, and this greatly increases the risk of partial thawing of the elastomer and resulting loss of stiffness, increasing the probability of error and misinterpretation of the results. Thus, while the apparatus is likely to be readily available, it is not likely to produce the desired practical results.
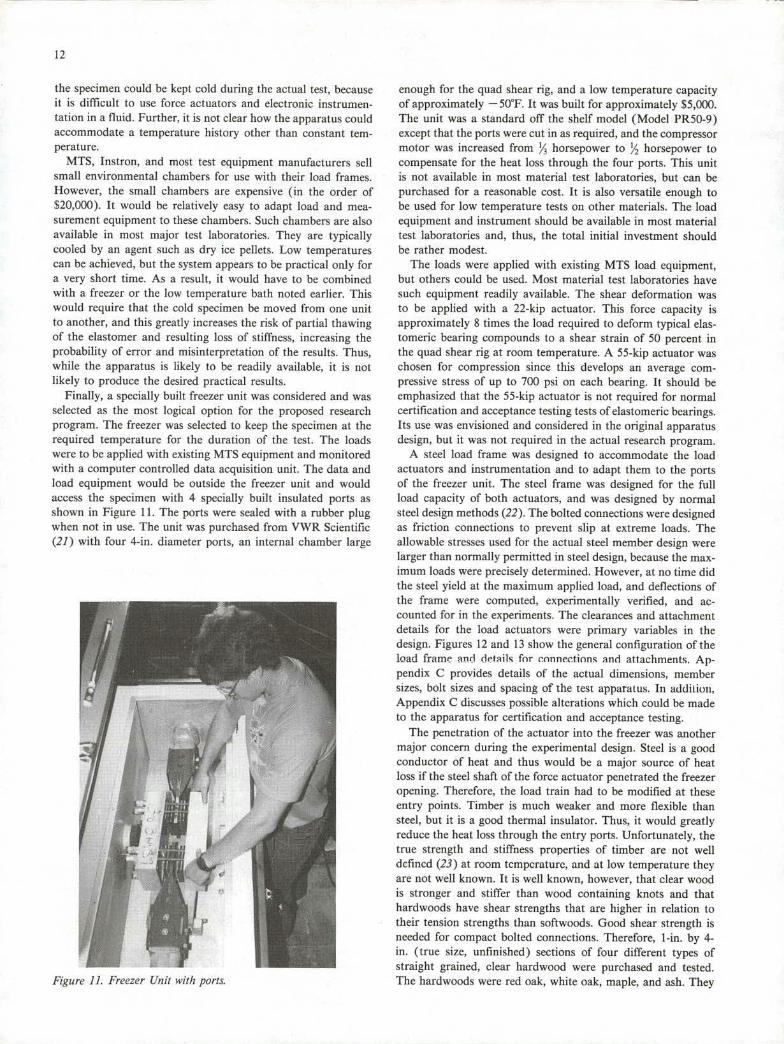
Finally, a specially built freezer unit was considered and was selected as the most logical option for the proposed research program. The freezer was selected to keep the specimen at the required temperature for the duration of the test. The loads were to be applied with existing MTS equipment and monitored with a computer controlled data acquisition unit. The data and load equipment would be outside the freezer unit and would access the specimen with 4 specially built insulated ports as shown in Figure 11. The ports were sealed with a rubber plug when not in use. The unit was purchased from VWR Scientific (21) with four 4-in, diameter ports, an internal chamber large
Figure 11. Freezer Unit with ports.
enough for the quad shear rig, and a low temperature capacity of approximately —50°F. It was built for approximately S5,000. The unit was a standard off the shelf model (Model PR50-9) except that the ports were cut in as required, and the compressor motor was increased from 1/3 horsepower to 1/2 horsepower to compensate for the heat loss through the four ports. This unit is not available in most material test laboratories, but can be purchased for a reasonable cost. It is also versatile enough to be used for low temperature tests on other materials. The load equipment and instrument should be available in most material test laboratories and, thus, the total initial investment should be rather modest.
The loads were applied with existing MTS load equipment, but others could be used. Most material test laboratories have such equipment readily available. The shear deformation was to be applied with a 22-kip actuator. This force capacity is approximately 8 times the load required to deform typical elas-tomeric bearing compounds to a shear strain of 50 percent in the quad shear rig at room temperature. A 55-kip actuator was chosen for compression since this develops an average com-pressive stress of up to 700 psi on each bearing. It should be emphasized that the 55-kip actuator is not required for normal certification and acceptance testing tests of elastomeric bearings. Its use was envisioned and considered in the original apparatus design, but it was not required in the actual research program.
A steel load frame was designed to accommodate the load actuators and instrumentation and to adapt them to the ports of the freezer unit. The steel frame was designed for the full load capacity of both actuators, and was designed by normal steel design methods (22). The bolted connections were designed as friction connections to prevent slip at extreme loads. The allowable stresses used for the actual steel member design were larger than normally permitted in steel design, because the max-imum loads were precisely determined. However, at no time did the steel yield at the maximum applied load, and deflections of the frame were computed, experimentally verified, and ac-counted for in the experiments. The clearances and attachment details for the load actuators were primary variables in the design. Figures 12 and 13 show the general configuration of the load frame and detailc for connections and attachments. Ap-pendix C provides details of the actual dimensions, member sizes, bolt sizes and spacing of the test apparatus. In addition, Appendix C discusses possible alterations which could be made to the apparatus for certification and acceptance testing.
The penetration of the actuator into the freezer was another major concern during the experimental design. Steel is a good conductor of heat and thus would be a major source of heat loss if the steel shaft of the force actuator penetrated the freezer opening. Therefore, the load train had to be modified at these entry points. Timber is much weaker and more flexible than steel, but it is a good thermal insulator. Thus, it would greatly reduce the heat loss through the entry ports. Unfortunately, the true strength and stiffness properties of timber are not well dcfincd (23) at room temperature, and at low temperature they are not well known. It is well known, however, that clear wood is stronger and stiffer than wood containing knots and that hardwoods have shear strengths that are higher in relation to their tension strengths than softwoods. Good shear strength is needed for compact bolted connections. Therefore, 1-in, by 4-in. (true size, unfinished) sections of four different types of straight grained, clear hardwood were purchased and tested. The hardwoods were red oak, white oak, maple, and ash. They

STEEL LOADING FRAME
00 00
QUAD— SHEAR DEVICE
FREEZER
WOODR On EARING
LOAD CELL Li
00 00
00 00
PLAN
13
ACTUATOR
ELEVATILIN Figure 12. General load frame for low temperature stiffness tests.
were tested in shear and compression at room temperature and at low temperature. The results of some of these tests are sum-marized in Table 1. Maple was selected as the material with the most suitable low temperature characteristics. Circular, wooden rods were turned down on a lathe from 4-in, by 4-in, timbers to provide approximately t/8-in. clearance between the rod and the walls of the entry ports. Steel connections for both tension and compression loading were designed to connect the timber to the load actuator shaft and the quad shear load rig. The details of the adapters are given in Appendix C, and a general overview is shown in Figures 12 and 13. Figures 11 and 13 show the finished rig with the shear actuator and with the clamped compression configuration. The unclamped compres-sion configuration would require a second actuator and a compression load train similar to that shown for shear.
The timber links used in the load train and the load frame caused some complications in interpretation and analysis of the test data. The load cells and linear variable differential trans-formers (LVDTs) were located outside the freezer unit because electronic equipment is very sensitive and may drift when sub-jected to temperature change. These problems are avoided by locating the instruments outside the freezer unit, but additional problems are introduced because the measured deformation in-cludes the deformation of the timber links and the load frame. In most experiments, deformation of the load apparatus is trivial and not considered. However, timber is much more flexible than
steel, and the connections between the steel and timber are more deformable than normal steel-to-steel connections. Thus, defor-mations of the test apparatus were measured by loading the test rig to its full load capacity with steel blocks inserted in place of the 4 elastomeric pads. The deformation of the test apparatus was small compared to the deformations of the test bearings during the normal testing operation, but it was not insignificant. As a result, the test apparatus deformations were deducted from all test measurements. The test apparatus deformations were remeasured at intervals throughout the experimental research so that drift or loosening of the test apparatus could be accounted for.
Table 1. Tests on hardwood specimens at different temperatures (in psi).
Wood Compressive C'nhing Strength Shear Strength Parallel to Grain
at Room Temp. After 6 Days @ -50 Degrees F
Of Room Temp. After 3 Hr. @ 50 Degrees F
After 6 Days @ -50 Degrees F
WhiteOak 9714 11657 1467 1458 1766
Red -. -- 1008 883 -.
.ftsh 10362 13180 1617 1217 925
Maple 12533 13962 1867 1342 1650
14
Figure 13. Photograph of the complete test apparatus.
THE TEST PROCEDURE
After the test apparatus was designed and built, a series of initial calibration tests were performed. The calibration tests were used to develop a standardized test procedure that could be used to satisfy the major objectives of this task of the research. The standard test method would assure repeatable, comparable results from all parts of the research and it would serve as a basis for the test procedure proposed as part of all AASHTO Specification. The calibration tests were made at different load rates, temperatures, and maximum strains. It was noted that some research (14) has suggested that the stiffness increase due to low temperature crystallization is decreased or eliminated by the cyclic dynamic straining which occurs in elastomeric bear-ings. Therefore, one of the major objectives of the calibration testing was to develop a test procedure that would provide work to the test specimen which would be typical, but not excessively larger than that expected during a normal day of service.
This reduction in stiffness is partially illustrated in Figure 14 which shows the cyclic shear stress-strain behavior of all elas-tomeric bearing at two different temperatures and duration of crystallization periods. Figure 14(a) shows the behavior after 20 days at - 10°C (14°F), while Figure 14(b) shows the behavior after 10 days at - 30°C ( - 22°F). Note that the scales for the two figures are different. The cyclic strains were nearly identical for both tests. The instantaneous stiffness of the specimen is the slope of the curve. This figure shows that the instantaneous stiffness of the specimen at - 30°C (-22°F) is approximately 29 times as large as the instantaneous stiffness at room tem-perature. After 3/4 cycles of deformation, the low temperature specimen is only approximately 12 times as stiff as the room temperature specimen. This is a significant reduction in the comparative stiffness caused by work done on the specimen and the resulting break down in crystallization which occurred, but it is clear that a significant portion of the low temperature crystallization stiffness remains after completion of the load cycles. This reduction was typically much greater at lower tem-peratures, as shown in the figure. The reduction appears to be caused by the strain induced by cyclic loading, and it appears to be consistent with the observations of Coe and others (13).
Figure 14 also shows that both specimens experience a re-duction in stiffness due to the initial cycle of loading. This is a
well-known phenomenon (3, 4), and nearly all shear test pro-cedures for elastomeric bearings account for it by requiring that the bearing be subjected to several deformation cycles before the actual test is performed. The cause of this reduction in initial stiffness is not precisely known. However, the reasoning, noted above, suggests that it may be caused by breakdown of the strain crystallization of the elastomer. Many elastomers, including both Neoprene and natural rubber, strain-crystallize (3). The strain crystallization is frequently credited for the good fatigue performance of some elastomer compounds. In any case, the reduction noted during the first cycle illustrates why it is not desirable to use the initial instantaneous low temperature stiff-ness. Small errors in the timing of data collection can result in large errors in the instantaneous stiffness and, as a result, the experimental results would be erratic and unrepeatable. Any test procedure used for acceptance or certification testing must provide repeatable results. On the other hand, both parts of Figure 14 show that the average stiffness is quite stable after 3/4
cycle of complete deformation was completed. Further, this average stiffness still showed the effects of crystallization and thermal stiffening. In other words, the low temperature crys-tallization stiffness was not completely broken down by work performed during cyclic loading. As a result, the data obtained during the half cycle of deformation immediately after comple-tion of the first 3/4 cycle was used for this analysis. The data acquisition was set up so that 20 data points were evenly dis-tributed through each half cycle of deformation, as shown in Figure 15. Further, the data from the two end points at each end of the half cycle of interest were discarded because of the hysteresis that is always noted with cyclic shear deformation. Thus, a least squares fit of the data points marked by a cross in Figure 16 were used to determine the stiffness.
Other factors also were considered in the development of a standard test procedure. While the elastomeric bearing strains had to be selected to model the daily temperature cycle and to consider the effect of breakdown of crystallization, they also had to be controlled to simplify the experimental procedure. If the maximum shear strain is large, the shear force required to deform the bearing is also large. This increased force becomes extremely important when the bearing is very stiff at low tem-perature. Large forces require larger force actuators and a heavy test frame and increase the risk of injury or damage if the test
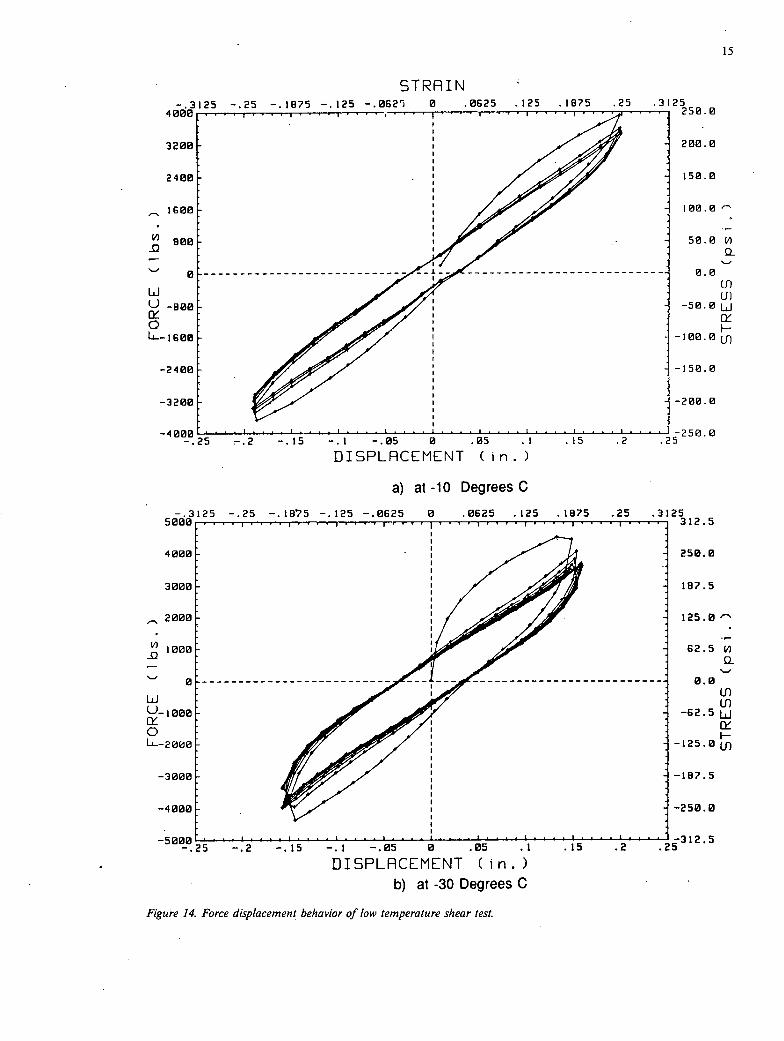
15
STRAIN -.3125 -.25 -.1075 -.125 -.062' 0 .0625 .125 .1875 .25 .3125
4000 • 250.0
3200 : 200.0
2400 I 150.0
1600 100.0
900 500l a
0
. 0. 0
Ui II 1L LI) '-' -eee
I
I - 50.0 LiJ ft I
0
---- 100.0(J)
-2400 -150.0
-3200 -200.0
. .25250.0 .25 -.2 15
DISPLACEMENT (in. ) at -10 Degrees C
-.3125 -.25 -.1B75 -.125 -.0625 0 .0625 .125 .1075 .25 .3125 5000 312.5
4000 - - 250.0
3000 - 187.5
,- 2000
..
125.0
1000 11;9PP
62.5 - a
0.0 I Ui II
U) -ieeo -62.5 UJ
0
--
-125.0 Ln
-3000 -187.5
-4000 : -250.0
S000 -3125 -.25 -.2 -.15 -.1 -.05 0 .05 .2 .25
DISPLACEMENT (i n. ) at -30 Degrees C
Figure 14. Force displacement behavior of low temperature shear test.
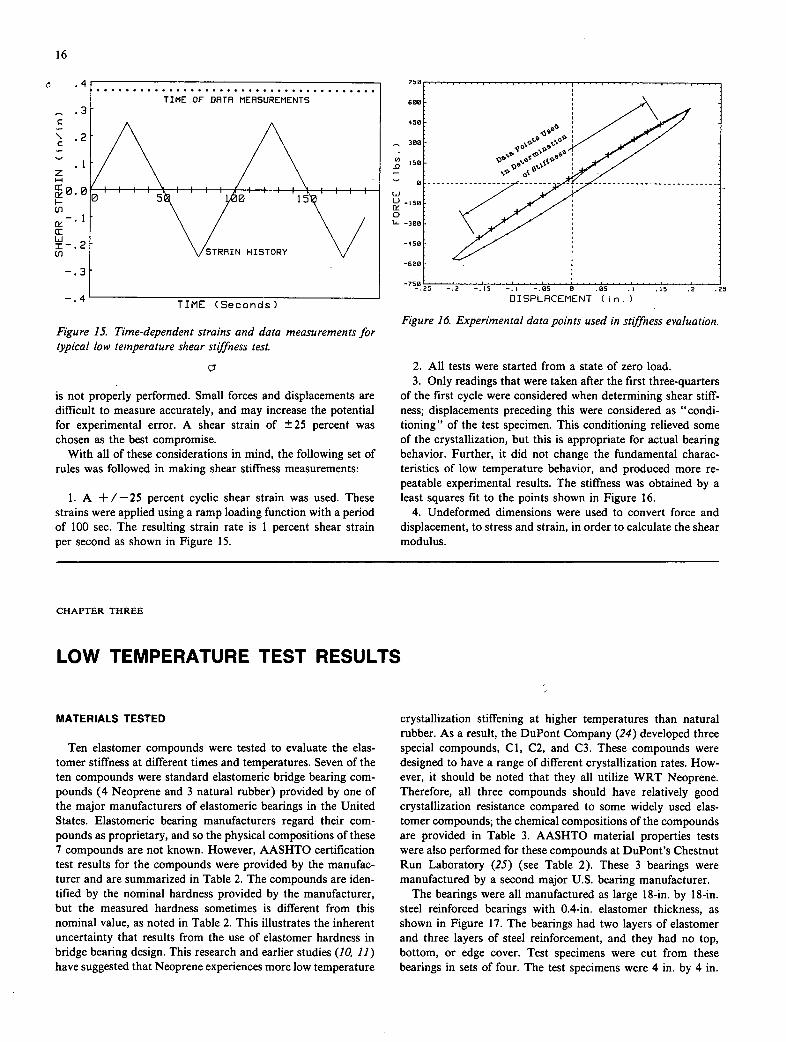
16
C
\ .2 C
TIME OF DATA MEASUREMENTS
75€
60€
45€
30€
5€
U -15€
0 L_
-45€
-60€
-75€
N HISTORY
-.3
-.4 TIME (Seconds)
DISPLACEMENT (in.)
Figure 15. Time-dependent strains and data measurements for typical low temperature shear stiffness test.
is not properly performed. Small forces and displacements are difficult to measure accurately, and may increase the potential for experimental error. A shear strain of ±25 percent was chosen as the best compromise.
With all of these considerations in mind, the following set of rules was followed in making shear stiffness measurements:
1. A +/-25 percent cyclic shear strain was used. These strains were applied using a ramp loading function with a period of 100 sec. The resulting strain rate is 1 percent shear strain per second as shown in Figure 15.
Figure 16. Experimental data points used in stiffness evaluation.
All tests were started from a state of zero load. Only readings that were taken after the first three-quarters
of the first cycle were considered when determining shear stiff-ness; displacements preceding this were considered as "condi-tioning" of the test specimen. This conditioning relieved some of the crystallization, but this is appropriate for actual bearing behavior. Further, it did not change the fundamental charac-teristics of low temperature behavior, and produced more re-peatable experimental results. The stiffness was obtained by a least squares fit to the points shown in Figure 16.
Undeformed dimensions were used to convert force and displacement, to stress and strain, in order to calculate the shear modulus.
CHAPTER THREE
LOW TEMPERATURE TEST RESULTS
MATERIALS TESTED
Ten elastomer compounds were tested to evaluate the elas-tomer stiffness at different times and temperatures. Seven of the ten compounds were standard elastomeric bridge bearing com-pounds (4 Neoprene and 3 natural rubber) provided by one of the major manufacturers of elastomeric bearings in the United States. Elastomeric bearing manufacturers regard their com-pounds as proprietary, and so the physical compositions of these 7 compounds are not known, However, AASHTO certification test results for the compounds were provided by the manufac-turer and are summarized in Table 2. The compounds are iden-tified by the nominal hardness provided by the manufacturer, but the measured hardness sometimes is different from this nominal value, as noted in Table 2. This illustrates the inherent uncertainty that results from the use of elastomer hardness in bridge bearing design. This research and earlier studies (10, 11) have suggested that Neoprene experiences more low temperature
crystallization stiffening at higher temperatures than natural rubber. As a result, the DuPont Company (24) developed three special compounds, Cl, C2, and C3. These compounds were designed to have a range of different crystallization rates. How-ever, it should be noted that they all utilize WRT Neoprene. Therefore, all three compounds should have relatively good crystallization resistance compared to some widely used elas-tomer compounds; the chemical compositions of the compounds are provided in Table 3. AASHTO material properties tests were also performed for these compounds at DuPont's Chestnut Run Laboratory (25) (see Table 2). These 3 bearings were manufactured by a second major U.S. bearing manufacturer.
The bearings were all manufactured as large 18-in, by 18-in. steel reinforced bearings with 0.4-in. elastomer thickness, as shown in Figure 17. The bearings had two layers of elastomer and three layers of steel reinforcement, and they had no top, bottom, or edge cover. Test specimens were cut from these bearings in sets of four. The test specimens were 4 in. by 4 in.

17
Table 2. Certification test results.
Elastomer Compound
Elastorner Type
Nominal Hardness
Shore A Duro
Elongation at Break
%
Tensile Strength
(psi)
Shear Modulus at Room Temp.
(psi)
CR50 Neoprene 51 647 2890 . 115
NR50 Natural Rubber 54 656 3038 155
CR55 Neoprene 53 591 2777 140
NR55 Natural Rubber 59 602 2865 155
CR60 Neoprene 58 486 2679 ISO
NR60 Natural Rubber 63 517 2863 185
CR65 Neoprene 64 575 2801 185
Cl Neoprene 62 480 2900 180
C2 Neoprene 62 378 2004 175
C3 Neoprene 62 352 1833 160
Note. Elongation at break and tensile strength data provided by bearing manulacturer for compounds CR50, NR50, CR55, NR55, CR60. NR60, and CR65. Data for the three
special Neoprene compounds was provided by the DuPont Company. Hardness and shear modulus measured at the university 01 Washington.
They were initially cut oversize and were carefully machined to produce a snug fit (at room temperature) into the recessed plates of the quad shear rig shown in Figure 9 and Appendix C. The specimens were then installed into the freezer and testing pro-ceeded. Hardness tests were performed in conjunction with the
Table 3. Special Neoprene compounds (parts per hundred Neoprene).
Ingredients Compound Cl
Compound C2
Compound C3
NnopreneWRT 100 100 100
High-activity Magnesia 4 4 4
Octamine 2 2 2
Wingstay 100 1 1 1
Stearic Acid 0.5 0.5 0.5
Carbon Black )N.376) 30 40 40
Tetramethylthiuram Disulphide 0.7 0.7 0.7
Ethylene Thiourea 1 1
Zinc Oxide 5 5 5
Dioctyl Sebacate 10
Butyt Oteate -- 12 20
Circo Light Process Oil -- 8
stiffness tests. The hardness tests were performed on the elas-tomer from the test bearing. The clearance in the quad-shear rig was not adequate for use of a durometer, and so an additional test specimen of the identical compound was inserted into the freezer and subjected to the same temperature history for the
18" .
Plan View
0.4''.lftsto.sr -- -. -- •- -- •- - •- -- -- - -- 318st..1
Cross Section
Figure 17. Standard test bearing.

18
hardness tests. Relaxation and "thaw" stiffness recovery tests 1000
were also performed at intervals throughout the study and are summarized in this chapter.
LD
I-
U) U) Li z
U)
a: Li I U)
Li NJ
-J Cr
0 1
LOW TEMPERATURE STIFFNESS RESULTS
The NR55 and CR55 compounds, tested first, were tested more extensively than the other compounds. The tests were completed so that basic information on time and temperature on Neoprene and natural rubber would be available for use in later tests on other compounds. The basic information was used to select time and temperature requirements for the other tests.
Figure 18 shows stiffness as a function of time for a wide range of temperatures with the CR55 compound. All stiffness measurements are normalized by dividing the measured stiffness as a function of time and temperature by the stiffness achieved when the specimen was tested at room temperature. The stiffness was measured by the methods noted previously at approximately 24-hour intervals. The cross marks indicate the actual stiffness measurements. The data were taken at approximately 24-hour intervals because this provided a more substantial body of in-formation. The close test interval did not affect the test results because, as Figure 19 shows, the measured stiffness is nearly identical regardless of whether the specimen is tested every day or once every several days. While this observation is based strictly on the test procedure used in this research in which the stiffness was computed from the second cycle of load (i.e., at the start of the first load cycle), and probably would not be correct if instantaneous stiffness had been used, its import cannot be ignored because it allowed stiffness testing at frequent inter-vals. As indicated by Figure 14 and earlier research (14) dy-namic strain partially breaks down the low temperature crystallization stiffness and, therefore, the comparison in Figure 19 clearly shows that there is a limit as to how much breakdown may occur.
Previous research by Murray and Detenber (10) has suggested that the maximum crystallization rate occurred at temperatures in the order of - 10°C (14°F). The rate of increase, which is shown by the slope of the curve in Figure 18, is clearly not maximal at - 10°C (14°F) and furthermore it varies with time.
C -50 TEMPERATURES IN DEGREES CELSIUS
12 IS TIME (DAYS)
Figure 18. Stiffness as a function of time and temperature for CR55 bearings.
TIME (days)
Figure 19. Comparison of the measured stiffness of CR55 elas-tomer compound as a function of time with different test fre-quency.
At —40°C (-40°F), the increase in stiffness was smaller and occurred more slowly than at higher and lower temperatures. This observation indicates that there may be a maximum crys-tallization temperature, as suggested by earlier research (10), but it is clearly in the range of —30°C to —35°C (-22°F to —31°F) rather than —10°C (14°F). The situation is made more complicated because at temperatures below about —30°C (- 22°F) the stiffness remained nearly constant during an initial period, then increased rapidly. This is illustrated by the - 35°C (-31°F) curve where there is approximately a 4-day delay before crystallization started, but very rapid crystallization be-gan at that point. All the crystallization curves indicated a plateau in the stiffness after a period of steady stiffness increase.
At —50°C (-58°F) the behavior was quite different. The stiffness increased to more than 60 times the room temperature value within 4 days. This dramatic increase in stiffness indicates that - 50°C (- 58°F) is below the second order transition tem-perature. The stiffness increase is not instantaneous, as suggested by Murray and Detenber (10), but it is, indeed, very rapid. This is consistent with the observations noted by Stevenson (11); refer also to Figure 4 earlier in this chapter.
Figure 20 shows stiffness as a function of time for a wide range of temperatures for the NR55 compound. A comparison of Figures 18 and 20 indicates that the natural rubber compound stiffened less and more slowly than the Neoprene compound, but it would be a serious mistake to suggest that no crystalli-zation had occurred. The stiffness increased to approximately 8.75 times the room temperature stiffness after 22 days at - 30°C (- 22°F). This is approximately 35 percent less than the stiffness noted for the CR specimen under similar conditions. There is a fundamental difference, however. In the natural rubber, crys-tallization started much later and proceeded more slowly, but had not reached a plateau even after 22 days. The NR55 com-pound did not stiffen appreciably at —50°C(-58°F), indicating its second order transition temperature was lower than this. Further, the natural rubber compound had much less increase in stiffness due to low temperature crystallization than the com-parable Neoprene compound at the —10°C to —25°C (14°F to - 11°F) temperature range.

LI
LI
U, U, IJ z L-
U,
a: a: U :i: On Ca
NJ
—j a:
a: 0 z
TEMPERATURES IN DEGREES CELSIUS
-40
LI
LI
U) U, U z U.
I— U)
a: Cr
U)
0 U NJ
—J Cl:
ix 0 a:
TEMPERATURES IN DEGREES CELSIUS
-30
19
TIME (DAYS)
Figure 20. Stiffness as a function of time and temperature for NR55 bearings.
Figures 21, 22, 23, 24 and 25 illustrate the time and tem-perature dependent stiffness of the CR50, NR50, CR60, NR60 and CR65 compounds. The curves are similar to Figures 18 and 20. All of the Neoprene elastomer compounds were below their second order transition temperatures at —50°C (-58°F) but none of the natural rubber compounds were below the transition temperature at that point. The compounds generally experienced their maximum crystallization stiffness at temper-atures in the order of —30°C (-22°F). The NR50 compound exhibited very little crystallization stiffness after 7 days at - 30°C (-22°F), but the NR60 compound exhibited about the same crystallization as Neoprene compounds at that time and tem-perature. This clearly indicates that low temperature crystalli-zation is a problem with both natural rubber and Neoprene. A natural rubber with poor crystallization resistance will develop internal forces in the order of those commonly seen in Neoprene.
Figures 26, 27, and 28 show the low temprature stiffness of the three special Neoprene compounds, Cl, C2, and C3, re-spectively. These compounds qompare favorably to the other Neoprene compounds. All three had good crystallization re-sistance and compare fairly well to the best of the natural rubber
TIME (days)
Figure 22. Stiffness as a function of time and temperature for NR50 bearings.
21 LI
LI
U) U) UJ a: U. U.
I—WI'
a: a: Ui a:
U)
0 Li NJ
-J Cr
a: 0 z
TIME (DAYS)
Figure 23. Stiffness as a function of time and temperature for CR60 bearings.
TEMPERATURES IN DEGREES CELSIUS
-50
-30
-10
21
TEMPERATURES IN DEGREES CELSIUS LI
I—
LI
WI U) I-i a:
I—U))
a: a: Li
U)
0 Li
—J a: a: 0 a:
-50 TEMPERATURES IN DEGREES CELSIUS
-30
-10
-IA
-30
TIME (DAYS) TIME (DAYS)
Figure 21. Stiffness as a function of time and temperature for Figure 24. Stiffness as a function of time and temperature for CR50 bearings. NR60 bearings.

20
21 LD 'S
I-
U) I,
U) Li z Ls. 1. I- U) (I a: a: Li a: U)
Li NJ
-J cr E a: 0
TEMPERATURES IN DEGREES CELSIUS
-30
TEMPERATURES IN DEGREES CELSIUS
-30 -l0
TIME (DAYS)
TIME (DAYS)
Figure 25. Stiffness as a function of time and temperature for Figure 27. Stiffness as a function of time and temperature for CR65 bearings, special Neoprene compound C2 bearings.
compounds. The natural rubber compounds were not specially designed, as were the Cl, C2, and C3 compounds, but this good performance suggests that very good low temperature crystal-lization resistance can be achieved with both types of rubber. The material properties for the Cl compound suggest that it could be used in a bearing, because the elongation at break and tensile strength of this compound are well within AASHTO limits of 350 percent and 2,500 psi, respectively, for 60 hardness elastomer.
ELASTOMER HARDNESS
The hardness of the elastomer was also measured at approx-imately 24-hour intervals for the various elastomer compounds, times, and temperatures, and the measured results are shown in Figures 29 to 38. The hardness measurement results were very susceptible to measurement technique. The hardness is a surface measurement, and may change dramatically with time. If a warm durometer is applied to a cold bearing, a maximum
reading is indicated, and the reading falls dramatically with time because the warm durometer warms the elastomer surface. This time interval is in the order of a very few seconds. If the du-rometer is kept in the freezer, it prevents the heat transfer from the durometer to the elastomer, but the durometer tends to ice up and become inoperable. If the bearings are removed from the freezer for the hardness test, the surface warms quickly and the hardness is underestimated. When hardness readings were taken on bearings that were removed from the freezer after storage at - 40°C (- 40°F), the measured hardness was 18 per-cent less than the value obtained while in the freezer. This is an important difference because Figure 29 indicates that the total hardness increase at —40°C (-40°F) was in the order of 50 percent. The thermal mass of the specimens used here was much larger than that of typical hardness specimens. The dif-ficulties experienced here suggest that even greater ones exist with the smaller specimens, casting doubt on the reliability of hardness data from other studies. In order to minimize these difficulties, a standard measurement procedure was followed.
TEMPERATURES IN DEGREES CELSIUS 21
c-S 'S
Ln
I-c-S
U) Ui z U-U- - I- U) I a: Cr Ui a: U)
0 Li NJ -J Cl: a: 0 a:
TEMPERATURES IN DEGREES CELSIUS
-40
-30
-30 -10
TIME (DAYS)
TIME (DAYS)
Figure 26. Stiffness as a function of time and temperature for Figure 28. Stiffness as a function of time and temperature for special Neoprene compound Cl bearings, special Neoprene compound C3 bearings.

-35
-30
FT
-20
TEMPERATURES IN DEGREES CELSIUS
-30
TEMPERATURES IN DEGREES CELSIUS
TIME (DAYS) TIME (DAYS)
Figure 29. Hardness as a function of time and temperature for Figure 32. Hardness as a function of time and temperature for CR55 bearings. NR50 bearings.
95
3-,
85
05
U) U) U
75
a:
U) U) U 1 0 o 75 a: :1:
,- 65
55
TIME (DAYS) TIME (DAYS)
Figure 30. Hardness as a function of time and temperature for Figure 33. Hardness as a function of time and temperature for NR55 bearings. CR60 bearings.
t -50
-30
-(0
TEMPERATURES IN DEGREES CELSIUS
I
U) U)
z 0 a: I
Ld C—u6 0
0
I
5
-30
5
-10
TEMPERATURES IN DEGREES CELSIUS
0 4 8 12 lB 2B TIME (DAYS) TIME (DAYS)
Figure 31. Hardness as a function of time and temperature for Figure 34. Hardness as a function of time and temperature for CR50 bearings. NR60 bearings.

22
95
95 -30
85 LI) ci) LI
a: 75 a:
a: LI I- w 65
55
8 U) LI) Li z a:? a:
a: LI I-LiB 0 a: = 0
5
-30
TEMPERATURES IN DEGREES CELSIUS
45 TIME (DAYS)
Figure 35. Hardness as a function of time and temperature for CR65 bearings.
TEMPERATURES IN DEGREES CELSIUS
TIME (DAYS)
Figure 38. Hardness as a function of time and temperature for special Neoprene compound C3 bearings.
95 F--~ -. -50
8
5
TEMPERATURES IN DEGREES CELSIUS
TIME (DAYS)
Figure 36. Hardness as a function of time and temperature for special Neoprene compound Cl bearings.
95
8 -30 U) U) LI 1 0 a:? a: I a: -l0 LI I-LI6 0 a: = 0
01
TEMPERATURES IN DEGREES CELSIUS
TIME (DAYS)
Figure 37. Hardness as a function of time and temperature for special Neoprene compound C2 bearings.
Hardness readings were taken with a Shore type A-2 du-rometer.
The readings were taken as soon as the indenter was firmly pressed into the elastomer. A minimum distance of 1/2 in. was maintained between successive readings.
The bearing was kept in, or nearly in, the freezer while all readings were being taken. All readings were taken as fast as possible so that elastomer would not have a chance to warm up.
Approximately 10 separate hardness readings were taken at each interval. The median value was used as the actual hard-ness rating for that time and temperature.
Comparisons of Figures 29 through 38 with Figures 18 and 20 through 28 show a correlation between elastomer hardness and low temperature stiffness. Gent (16) has suggested that the correlation between elastomer stiffness and elastomer hardness is quite strong. However, comparison of these figures clearly indicates that this is not the case for low temperature stiffness. For example, Figure 18 shows that this stiffness of the CR55 compound varies greatly with time and temperature, while Fig-ure 29 shows that the hardness has much less variation after a very few days at the lower temperature. The hardness is 89, 85, and 90 after 4 days at —50°C (-58°17), 11 days at —20°C (-4°F), and 17 days at —35°C (-31°F), respectively, while the stiffness varies between approximately 60, 8, and 19.5 times room temperature stiffness. Similar variations can be noted in the other data. Further, most curves indicate a poor correlation between the time of the stiffness increase and the time of the hardness increase. The fact that the shear stiffness measured here is an average for all the material in the specimen, whereas the hardness is a local, surface measurement undoubtedly ac-counts for some of the difference. Hardness is clearly not a good indicator of low temperature stiffness and is not a rational mea-sure of the low temperature behavior of the elastomeric com-pound. This also explains discrepancies noted between this work and the earlier research of Murray and Detenber (10), since the earlier work used hardness and compression set as the measures of low temperature stiffness.
-40
-30
-10

23
RELAXATION OF THE LOW TEMPERATURE 6005
STIFFNESS 577 TCST RCLRXURTI
The second phase of NCHRP Project 10-20 indicated (4) that extremely large forces could be developed in the bearing if stress relaxation did not occur. As a result, relaxation tests were per-formed in this phase of research at each temperature for each elastomer compound. The relaxation test was normally per-formed during the final day of testing for that compound and temperature, because the force was normally largest at that time and the force reduction due to relaxation was more readily observable. During the relaxation test the hydraulic actuator was fixed at a displacement corresponding to a strain of ap-proximately 25 percent, and the force was measured at periodic intervals. The total applied displacement was the sum of the test frame's displacement and the bearing's displacement. This total displacement was corrected by subtracting the test frame's deflection in order to find the bearing displacement. However, during the relaxation tests the force was constantly changing; therefore, after this correction was applied, the actual bearing displacement steadily increased as the force decreased. To ac-count for this, the displacement was adjusted to bring the ac-tuator force to its proper value during the relaxation test by using the shear modulus measured just before the relaxation test. The displacement on which the change in force was based was the difference between the actual bearing displacement and the average bearing displacement over the entire test. It should be noted that the correction was relatively small compared to the bearing displacement; however, it was significant, particu-larly for the bearings with large initial low temperature stiffness.
Figure 39 shows a typical force relaxation curve for an elas-tomeric bearing. It displays exponential decay typical of vis-coelastic response from the initial force to the final force. The force reductions ranged from 19 percent to 95 percent. However, the 95 percent reduction occurred in one of the Neoprene com-pounds that was below the second order transition temperature and was not representative of ordinary low temperature crys-tallization relaxation behavior. The largest force reduction for crystallization behavior was 65 percent. Table 4 summarizes the results of the low temperature relaxation tests. Generally the relaxation percentage was largest with tests that had experienced the greatest amount of low temperature stiffening, but there were a few exceptions. The time required for complete stress relaxation varied for different elastomer compounds and tem-peratures. Table 4 also indicates the time required to complete 90 percent of the force reduction noted in each test. Specimens that relaxed a large amount usually relaxed quite quickly, while specimens that relaxed small amounts usually took a longer period of time. The time required for 90 percent of the relaxation to be completed varied between 10 min and 5 hours. The time required for 100 percent of the relaxation is not easily estimated because of the nature of the curve, but it generally appears that relaxation is essentially complete after 1/2 day or less.
THAW TESTS AND TIME REQUIRED FOR CRYSTALLIZATION
Previous research (10) has shown that the elastomer regains its room temperature stiffness after it is returned to room tem-perature for a period of time. The delay required to achieve this change in stiffness may be quite important, because the bridge
TDPERATURE-30 C 555
532
IS .0
4B7 t'J U 13~ 465
442
420
39?
375
TIME (minutes)
Figure 39. Typical force relaxation curve.
may expand considerably during a warming temperature cycle, and large bearing forces (4) may occur during this warming cycle if the bearing retains its low temperature stiffness. Murray and Detenber (10) suggest that decrystallization occurs when Neoprene is held at a higher temperature, but their observations were primarily based on hardness, which has been shown to be a poor indicator of elastomer stiffness. They suggest that the thaw temperature is approximately 15 centigrade degrees (27 fahrenheit degrees) above the temperature at which crystalli-zation first occurs.
Tests were performed to measure the time required for this room temperature stiffness recovery, and, for lack of a better title, these tests will be referred to as "thaw" tests. They were performed on each specimen immediately after the final low temperature stiffness test was completed. The freezer was turned off and the door was opened to allow the cold air to escape. The stiffness of the bearing was then measured by the usual method at time intervals throughout the warming cycle. Figures
Table 4. Data summary of relaxation tests.
Elastomer Compound
Temperature Degrees F
Relaxation in %
Time Required to Complete 90% of the Observed
Retaxation (Minutes)
Ratio of the Maximum
Stiffness to the Room
Temperature Stiffness
CR50 -30 64 45 15
NR50 -30 29 30 1.7 -50 40 10 1.2
CR55 -10 23 300 5.7 .20 28 210 8.6 -25 41 180 11 -30 40 140 12 35 63 90 19
.50 95 10 45
NR55 .10 19 70 1.3 -30 60 120 8.4 40 42 60 3.8
-50 56 45 2.8
CR60 -10 39 95 5.6 -30 65 70 14
NR60 -30 45 40 8.7 50 50 40 2.4
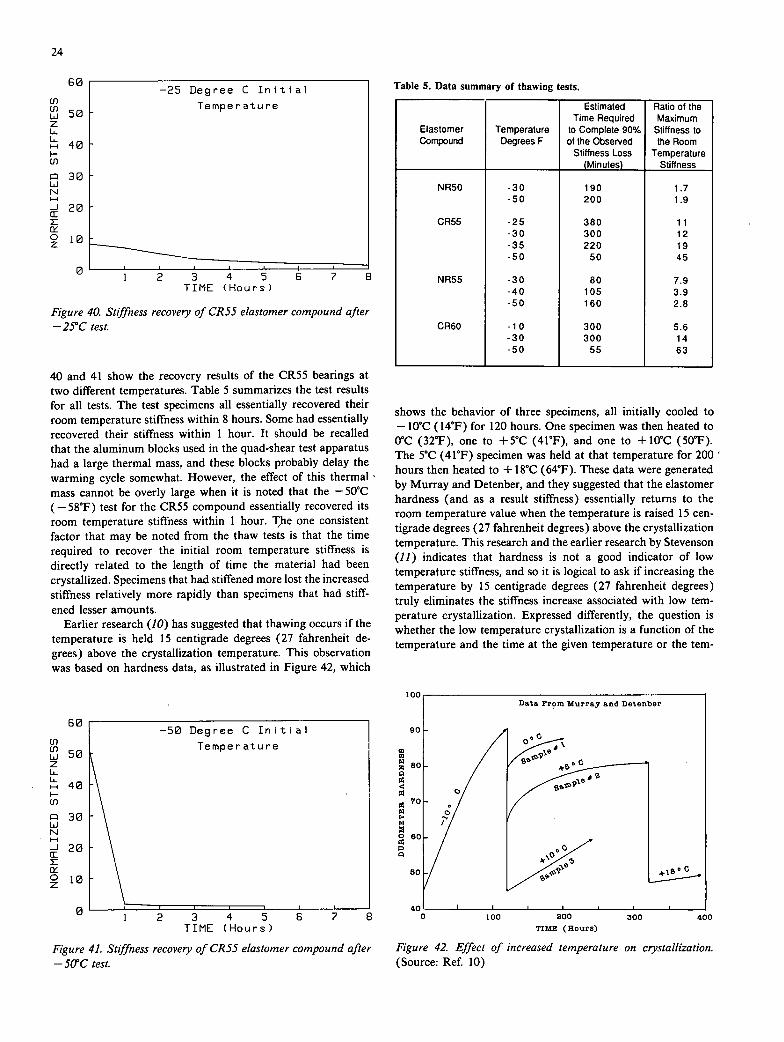
24
U) U) U 50
i—i 40 I.- U)
im 30 Li N
20
10
-25 Degree C Initial Temperature
1 2 3 4 5 6 7 8 TIME (Hours)
Figure 40. Stiffness recovery of CR55 elastomer compound after —25°C test.
40 and 41 show the recovery results of the CR55 bearings at two different temperatures. Table 5 summarizes the test results for all tests. The test specimens all essentially recovered their room temperature stiffness within 8 hours. Some had essentially recovered their stiffness within 1 hour. It should be recalled that the aluminum blocks used in the quad-shear test apparatus had a large thermal mass, and these blocks probably delay the warming cycle somewhat. However, the effect of this thermal mass cannot be overly large when it is noted that the - 50°C (- 58°F) test for the CR55 compound essentially recovered its room temperature stiffness within 1 hour. T,he one consistent factor that may be noted from the thaw tests is that the time required to recover the initial room temperature stiffness is directly related to the length of time the material had been crystallized. Specimens that had stiffened more lost the increased stiffness relatively more rapidly than specimens that had stiff-ened lesser amounts.
Earlier research (10) has suggested that thawing occurs if the temperature is held 15 centigrade degrees (27 fahrenheit de-grees) above the crystallization temperature. This observation was based on hardness data, as illustrated in Figure 42, which
-50 Degree C Initial Temperature
1 2 3 4 5 6 7 8 TIME (Hours)
Figure 41. Stiffness recovery of CR55 elastomer compound after —50°C test.
Table 5. Data summary of thawing tests.
Elastomer Compound
Temperature Degrees F
Estimated Time Required
to Complete 90% of the Observed
Stiffness Loss (Minutes)
Ratio of the Maximum
Stiffness to the Room
Temperature Stiffness
NR50 -30 190 1.7 -50 200 1.9
CR55 -25 380 11 -30 300 12 -35 220 19 -50 50 45
NR55 -30 80 7.9 -40 105 3.9 -50 160 2.8
CR60 -10 300 5.6 -30 300 14 -50 55 63
shows the behavior of three specimens, all initially cooled to —10°C (14°F) for 120 hours. One specimen was then heated to 0°C (32°17), one to +5°C (41°F), and one to + 10°C (50°17). The 5°C (41°F) specimen was held at that temperature for 200 hours then heated to + 18°C (64°17). These data were generated by Murray and Detenber, and they suggested that the elastomer hardness (and as a result stiffness) essentially returns to the room temperature value when the temperature is raised 15 cen-tigrade degrees (27 fahrenheit degrees) above the crystallization temperature. This research and the earlier research by Stevenson (11) indicates that hardness is not a good indicator of low temperature stiffness, and so it is logical to ask if increasing the temperature by 15 centigrade degrees (27 fahrenheit degrees) truly eliminates the stiffness increase associated with low tem-perature crystallization. Expressed differently, the question is whether the low temperature crystallization is a function of the temperature and the time at the given temperature or the tem-
Ut - Data Prom Murray and Detenber
90
80 C
Kli
70-
80
lb
4C I
V 100 4VV 000 400
TIME (Hours)
Figure 42. Effect of increased temperature on crystallization. (Source: Ref. 10)
in U) Li 50
1
i— 40 I—U)
30 Li N
20
10
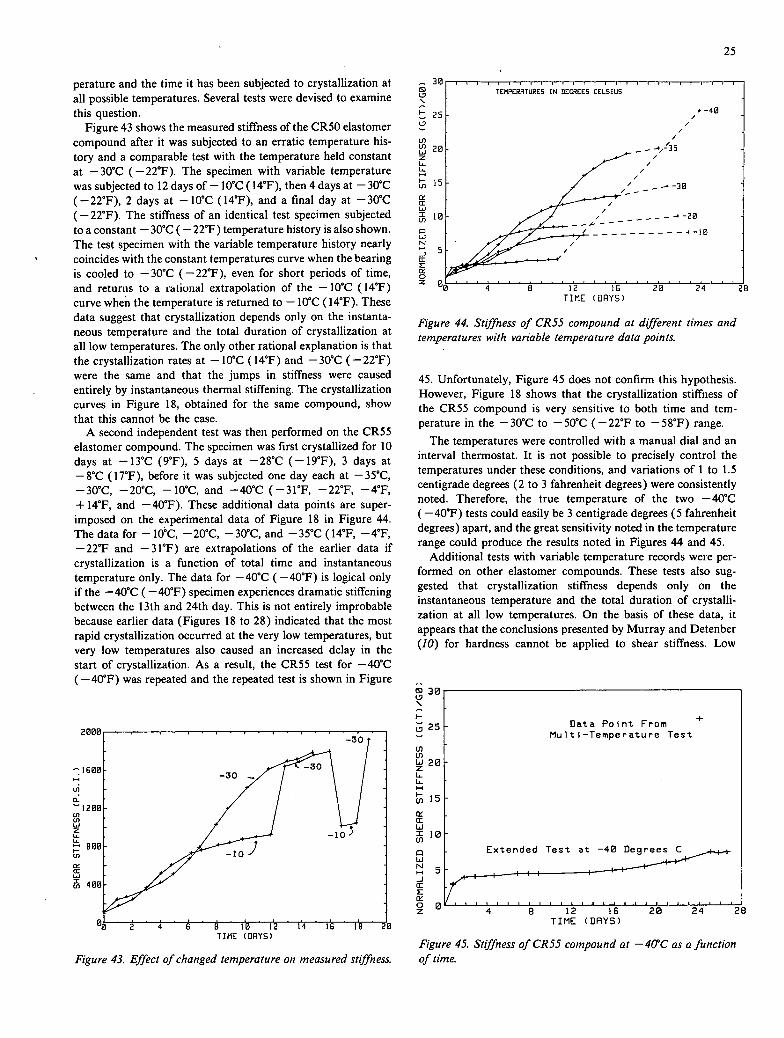
25
U) U) U
perature and the time it has been subjected to crystallization at all possible temperatures. Several tests were devised to examine this question.
Figure 43 shows the measured stiffness of the CR50 elastomer compound after it was subjected to an erratic temperature his-tory and a comparable test with the temperature held constant at - 30°C (-22°F). The specimen with variable temperature was subjected to 12 days of - 10°C (14°F), then 4 days at - 30°C (-22°F), 2 days at —10°C (14°F), and a final day at —30°C (- 22°17). The stiffness of an identical test specimen subjected to a constant - 30°C ( - 22°F) temperature history is also shown. The test specimen with the variable temperature history nearly coincides with the constant temperatures curve when the bearing is cooled to - 30°C (- 22°F), even for short periods of time, and returns to a tational extrapolation of the - 10°C (14°F) curve when the temperature is returned to - 10°C (14°F). These data suggest that crystallization depends only on the instanta-neous temperature and the total duration of crystallization at all low temperatures. The only other rational explanation is that the crystallization rates at —10°C (14°F) and —30°C (-22°F) were the same and that the jumps in stiffness were caused entirely by instantaneous thermal stiffening. The crystallization curves in Figure 18, obtained for the same compound, show that this cannot be the case.
A second independent test was then performed on the CR55 elastomer compound. The specimen was first crystallized for 10 days at —13°C (9°F), 5 days at —28°C (-19°F), 3 days at —8°C (17°F), before it was subjected one day each at —35°C, —30°C, —20°C, - 10°C, and —40°C (-3 1°F, —22°F, —4°F, + 14°F, and —40°F). These additional data points are super-imposed on the experimental data of Figure 18 in Figure 44. The data for - 10°C, —20°C, —30°C, and —35°C (14°F, —4°F, - 22°F and —31°F) are extrapolations of the earlier data if crystallization is a function of total time and instantaneous temperature only. The data for —40°C (-40°F) is logical only if the —40°C (-40°F) specimen experiences dramatic stiffening between the 13th and 24th day. This is not entirely improbable because earlier data (Figures 18 to 28) indicated that the most rapid crystallization occurred at the very low temperatures, but very low temperatures also caused an increased delay in the start of crystallization. As a result, the CR55 test for —40°C (-40°F) was repeated and the repeated test is shown in Figure
U, 0
U) U) U z 4- 4-
I-U,
Es a: I-i x U,
TIME (DAYS)
Figure 43. Effect of changed temperature on measured stiffness.
30 TEMPrRRTURS IN DEGREES CaSIUS
- -40
-30
/
I -
4I_20 (0
TIME (DAYS)
Figure 44. Stiffness of CR55 compound at dfferent times and temperatures with variable temperature data points.
45. Unfortunately, Figure 45 does not confirm this hypothesis. However, Figure 18 shows that the crystallization stiffness of the CR55 compound is very sensitive to both time and tem-perature in the —30°C to —50°C (-22°F to —58°F) range.
The temperatures were controlled with a manual dial and an interval thermostat. It is not possible to precisely control the temperatures under these conditions, and variations of 1 to 1.5 centigrade degrees (2 to 3 fahrenheit degrees) were consistently noted. Therefore, the true temperature of the two —40°C (-40°F) tests could easily be 3 centigrade degrees (5 fahrenheit degrees) apart, and the great sensitivity noted in the temperature range could produce the results noted in Figures 44 and 45.
Additional tests with variable temperature records were per-formed on other elastomer compounds. These tests also sug-gested that crystallization stiffness depends only on the instantaneous temperature and the total duration of crystalli-zation at all low temperatures. On the basis of these data, it appears that the conclusions presented by Murray and Detenber (10) for hardness cannot be applied to shear stiffness. Low
30
\ I- 25
Data Point From +
Multi—Temperature Test
(I) (') 20
4- 4- -4 I-
15
Es
U 10
Ul
TIME (DAYS)
Figure 45. Stiffness of CR55 compound at - 40°C as a function of time.

26
temperature crystallization stiffness appears to depend only on the instantaneous temperature of the bearing and the length of time it has crystallized at all low temperatures. Thawing or recovery of the stiffness from the low temperature crystallization occurs when the temperature rises above a critical temperature. The experiments of this research do not indicate precisely the temperature at which crystallization is started or relieved. How-ever, it is clear that crystallization stiffness is not lost when the specimen is warmed to a temperature more than 15 centigrade degrees (27 fahrenheit degrees) above the temperature at which crystallization had occurred, as suggested by Murray and De-tenber. This can be seen in Figure 44 where it can be seen that the bearing which was crystallized at - 28°C (- 19°F) does not lose its crystallization stiffness when its temperature is raised as much as 18 centigrade degrees (32 fahrenheit degrees) above this temperature. When the data of this study are combined with that of earlier work, it would appear that low temperature crystallization starts when temperatures fall to approximately 5°C (41°F) or below, and clearly is relieved when temperatures rise above approximately 15°C (59°F).
SIMULATION OF FIELD CONDITIONS
This research shows that the low temperature stiffness de-pends on the time and temperature of the bearing. Dramatic increases in stiffness may occur, and forces 20 to 50 times the room temperature force are possible with a given bearing de-formation. The research also shows that 19 percent to 65 percent of this force may relax within a few minutes or hours after the deformation due to stress relaxation, and the stiffness increase may disappear entirely due to thawing action after the temper-
ature is elevated. Past research (4) has shown that additional factors affect the forces experienced by the bridge and the bear-ing, including the actual temperature record and the daily move-ment required of the bearing. Bridge bearings typically experience only a small part of their annual movement cycle during a given day. Many compensating factors are involved in this diverse problem, and so a realistic test to simulate actual field conditions was performed (26). This test was performed to correlate the earlier results to actual field conditions, and more accurately estimate the forces that could be expected in a bridge bearing under actual field conditions.
The CR55 elastomer compound was selected for this field simulation, because the largest body of experimental information was available for this compound and it exhibited a wide range of stiffness characteristics at different times and temperatures. Long term, low temperature records (27,28) were examined to develop an appropriate test program. Table 6 gives the regions and time periods considered in this evaluation. The low tem-perature records were selected to be very low, but not inordi-nately so. That is, they are temperature records that could be expected to occur within a 50-year period in a large part of the United States. Eleven states are represented in Table 6. These temperature records were plotted and examined (26) in some detail.
Examination of the temperature records showed that differ-ences between the daily high and low temperature may be as large as 33 centigrade degrees (60 fahrenheit degrees), but dif-ferences of 11 to 17 centigrade degrees (20 to 30 fahrenheit degrees) were more typical. The records were examined to de-termine if they had any similarities so that a generic test program could be devised to simulate several of these temperature his-tories at the same time. When these monthly records were ex-
Table 6. Low temperature records considered for service conditions test.
Location I
Degrees F emperature Month and Year
Period of Initial Higher Temp. Period of Later Lower Temp.
Average Temp. Duration Average Temp Duration Degrees F Days Degrees F Days
Anchorage, Alaska -34 Jan-85 5 7 -20 3
Billings, Montana -38 Feb-36 -4 7 -21 6
Bismark, North Dakota -44 Jan-50 -3 7 -20 6
Boise, tdaho -23 Dec-72 26 7 -9 4
Chicago, Illinois -34 Jan-66 15 7 -1 0 3
Dututh, Minnesota -39 Jan-72 16 7 -29 2
Fargo, North Dakota -35 Jan-77 -4 7 -18 10
Flagstaff, Arizona -23 Dec-78 29 7 -5 2
Flint, Michigan -25 Jan-76 21 7 -4 2
Minneapotis, Minnesota -34 Jan-70 11 7 -19 4
Pueblo, Colorado -30 Feb-51 33 7 -9 2
St. Louis, Missouri -14 Jan-77 11 7 -2 3
Syracuse. New York -26 Jan-66 24 7 -9 1

—5 C-)
27
amined, it was determined that all of the records had a period of approximately 7 days of relatively cool temperatures followed by 2 to 10 days of very cold temperatures and several records had a sudden sharp warming trend after the cold period. There were daily fluctuations in the temperatures in all cases, but they fell within a narrow band over both zones.
Elastomers do not conduct heat very well. As a result, the elastomeric bridge bearing will not reach the daily extremes, and will maintain approximately average temperature over the three different periods. Some bridges (particularly steel bridges) very nearly experience the full daily temperature cycle (29), and so the bearing will be deformed in accordance with the daily temperature cycle. The range of the daily fluctuation in tem-perature is small compared to the annual temperature cycle, and so the range of daily shear strain would also be small (in the order of 10 percent shear strain). When these factors were considered the temperature records of Anchorage, Billings, Bis-marck, Fargo, and Minneapolis could be reasonably simulated with the bearing temperature record shown in Figure 46 and the bearing strain record (i.e., the bridge thermal movement record divided by the bearing height), as shown in Figure 47.
It should be emphasized that this simulation included all factors of crystallization, relaxation, and thawing of the elas-tomer. It also included the effect of working the elastomer with the daily deformation cycle, and it utilized realistic tempera-tures, strains, and load rates. That is, the daily strain cycle was slowly applied over the 24-hour period. The temperatures were manually controlled. The loads and strains were controlled elec-tronically throughout the entire 18-day period. The measured bearing forces are shown in Figure 48. It can be seen that relatively large forces occurred. The design force for these test bearings, based on the room temperature stiffness and 50 percent shear strain is 1,088 lb, and therefore the bearing experienced forces in the order of 4.6 times the design force. This increase in force is relatively large because the CR55 elastomer is not particularly well suited for the environmental conditions that were applied. It stiffens approximately 11 times the room tem-perature stiffness at —28°C (- 19°F) rather than the limit of 4 times required in the draft specification (Appendix B). This is a significant increase in force and it includes all of the beneficial effects of relaxation and thawing of the elastomer. However, the CR55 elastomer compound is not particularly resistant to
50
TIME(CAYs)
Figure 47. Time-dependent strain record used for environmental simulation elastomeric bearing test.
crystallization and the average low temperature - 28°C ( - 19°F) was quite low. Nevertheless, forces 4.6 times the design force are not insignificant. Further, low temperatures less than - 28°C (- 19°F) are quite possible in many parts of the continental United States and nearly all of Canada and Alaska. These low temperatures and the resulting bearing forces may sometimes cause damage to the bridge structure, and they illustrate why it is important to consider the low temperature properties of the elastomer in the bridge design.
CORRELATION WITH OTHER TEST RESULTS
These experiments illustrate the general low temperature be-havior of elastomeric bridge bearings. They lead to some im-portant conclusions in the evaluation of this behavior and serve as a basis for design recommendations made later in this report. The results are relevant to the forces expected in the bridge and bridge bearing, and so it is advisable to assure that the results are consistent with measurements performed in other labora-tories; therefore, supporting tests were performed at the Fire-stone Central Research Laboratory (30) in Akron, Ohio, and
10 12 14 16 1
5000
4000
3000
IJ 2000 -j
1000
0
-1000
-2000
TIME (DAYS)
TIMEIDAYS)
Figure 46. Temperature record used for environmental simulation elastomeric bearing test.
Figure 48. Measured force in elastomeric bearing during envi-ronmental simulation.
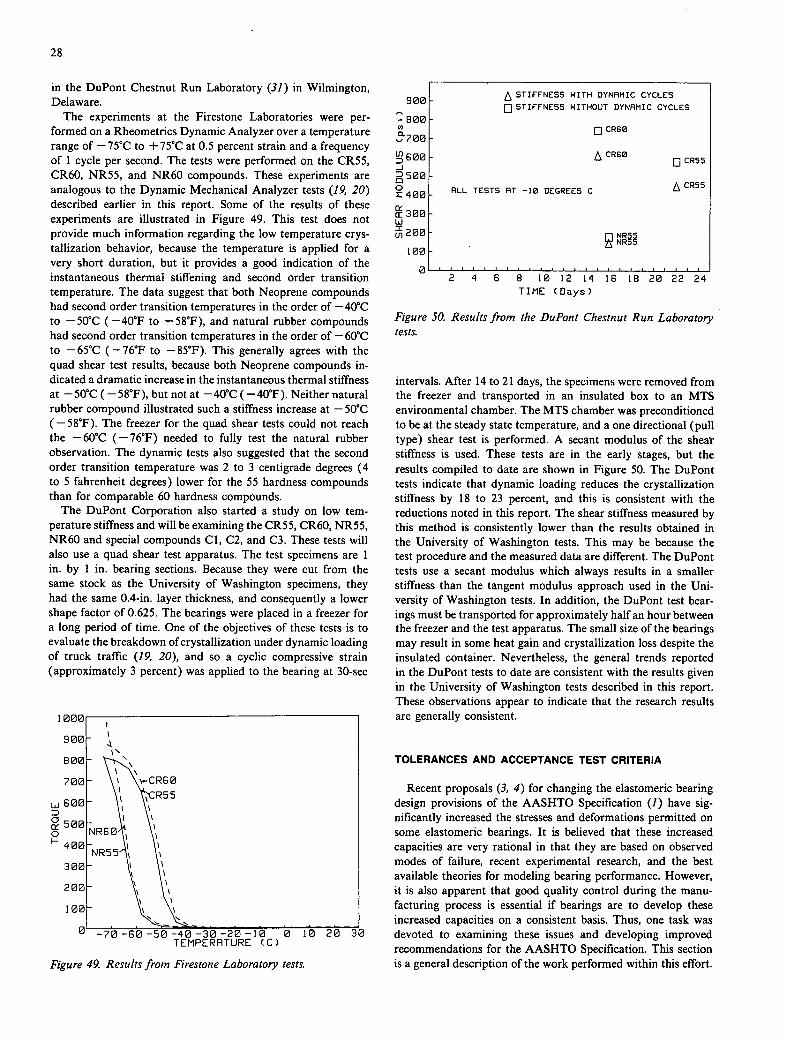
800 v)
700
600 -J MD 500 0 Z 400 Of cE 300 U Ln 200
100
28
in the DuPont Chestnut Run Laboratory (31) in Wilmington, Delaware.
The experiments at the Firestone Laboratories were per-formed on a Rheometrics Dynamic Analyzer over a temperature range of - 75°C to + 75°C at 0.5 percent strain and a frequency of 1 cycle per second. The tests were performed on the CR55, CR60, NR55, and NR60 compounds. These experiments are analogous to the Dynamic Mechanical Analyzer tests (19, 20) described earlier in this report. Some of the results of these experiments are illustrated in Figure 49. This test does not provide much information regarding the low temperature crys-tallization behavior, because the temperature is applied for a very short duration, but it provides a good indication of the instantaneous thermal stiffening and second order transition temperature. The data suggest that both Neoprene compounds had second order transition temperatures in the order of - 40°C to - 50°C (- 40°F to —5 8°F), and natural rubber compounds had second order transition temperatures in the order of - 60°C to —65°C (-76°F to —85°F). This generally agrees with the quad shear test results, because both Neoprene compounds in-dicated a dramatic increase in the instantaneous thermal stiffness at - 50°C ( — 5 8°F), but not at - 40°C (- 40°F). Neither natural rubber compound illustrated such a stiffness increase at - 50°C ( — 5 8°F). The freezer for the quad shear tests could not reach the - 60°C (- 76°F) needed to fully test the natural rubber observation. The dynamic tests also suggested that the second order transition temperature was 2 to 3 centigrade degrees (4 to 5 fahrenheit degrees) lower for the 55 hardness compounds than for comparable 60 hardness compounds.
The DuPont Corporation also started a study on low tem-perature stiffness and will be examining the CR55, CR60, NR55, NR60 and special compounds Cl, C2, and C3. These tests will also use a quad shear test apparatus. The test specimens are 1 in. by 1 in. bearing sections. Because they were cut from the same stock as the University of Washington specimens, they had the same 0.4-in, layer thickness, and consequently a lower shape factor of 0.625. The bearings were placed in a freezer for a long period of time. One of the objectives of these tests is to evaluate the breakdown of crystallization under dynamic loading of truck traffic (19, 20), and so a cyclic compressive strain (approximately 3 percent) was applied to the bearing at 30-sec
6!
0
0 F- 4
00
00 - \' \\
- \ \'.-CR60
00 - R55
NR60
—70 —60 —50 —40 —30 —20 —10 0 10 20 30 TEMPERATURE (C)
Figure 49. Results from Firestone Laboratory tests.
STIFFNESS WITH DYNAMIC CYCLES
D STIFFNESS WITHOUT DYNAMIC CYCLES
fl CR60
CR60 D CR55
ALL TESTS AT —10 DEGREES C CR55
fl NR55 'NR55
2 4 6 8 10 12 14 16 18 20 22 24 TIME (Days)
Figure 50. Results from the DuPont Chestnut Run Laboratory tests.
intervals. After 14 to 21 days, the specimens were removed from the freezer and transported in an insulated box to an MTS environmental chamber. The MTS chamber was preconditioned to be at the steady state temperature, and a one directional (pull type) shear test is performed. A secant modulus of the shear stiffness is used. These tests are in the early stages, but the results compiled to date are shown in Figure 50. The DuPont tests indicate that dynamic loading reduces the crystallization stiffness by 18 to 23 percent, and this is consistent with the reductions noted in this report. The shear stiffness measured by this method is consistently lower than the results obtained in the University of Washington tests. This may be because the test procedure and the measured data are different. The DuPont tests use a secant modulus which always results in a smaller stiffness than the tangent modulus approach used in the Uni-versity of Washington tests. In addition, the DuPont test bear-ings must be transported for approximately half an hour between the freezer and the test apparatus. The small size of the bearings may result in some heat gain and crystallization loss despite the insulated container. Nevertheless, the general trends reported in the DuPont tests to date are consistent with the results given in the University of Washington tests described in this report. These observations appear to indicate that the research results are generally consistent.
TOLERANCES AND ACCEPTANCE TEST CRITERIA
Recent proposals (3, 4) for changing the elastomeric bearing design provisions of the AASHTO Specification (1) have sig-nificantly increased the stresses and deformations permitted on some elastomeric bearings. It is believed that these increased capacities are very rational in that they are based on observed modes of failure, recent experimental research, and the best available theories for modeling bearing performance. However, it is also apparent that good quality control during the manu-facturing process is essential if bearings are to develop these increased capacities on a consistent basis. Thus, one task was devoted to examining these issues and developing improved recommendations for the AASHTO Specification. This section is a general description of the work performed within this effort.
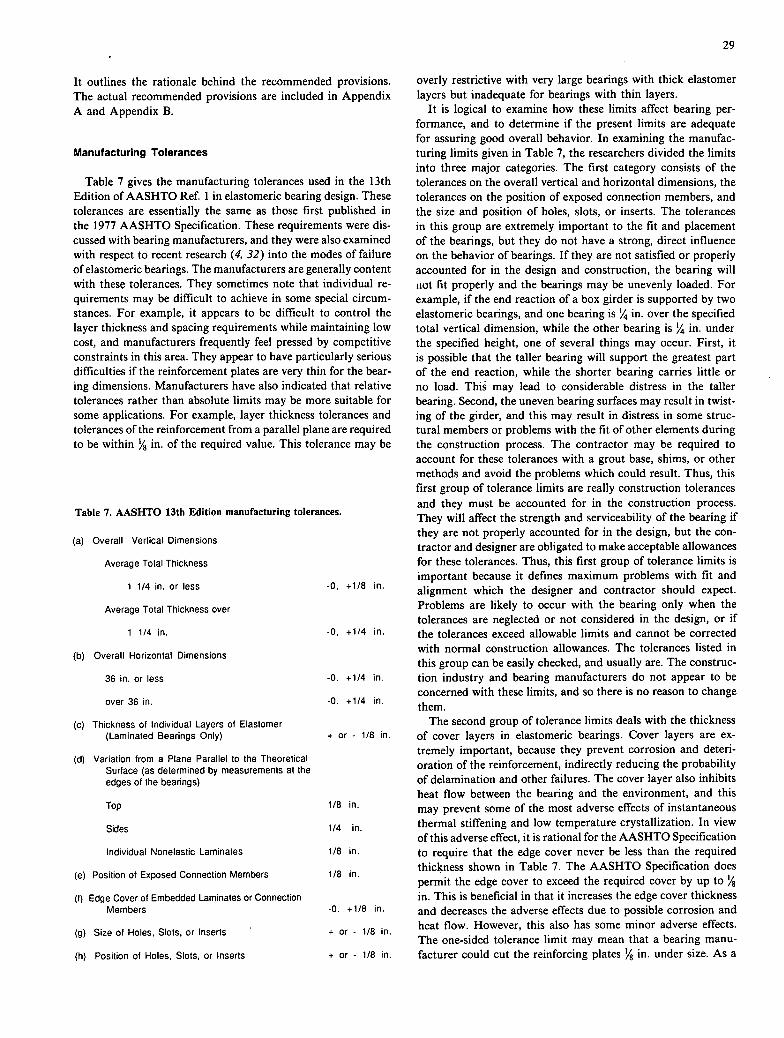
29
It outlines the rationale behind the recommended provisions. The actual recommended provisions are included in Appendix A and Appendix B.
Manufacturing Tolerances
Table 7 gives the manufacturing tolerances used in the 13th Edition of AASHTO Ref. 1 in elastomeric bearing design. These tolerances are essentially the same as those first published in the 1977 AASHTO Specification. These requirements were dis-cussed with bearing manufacturers, and they were also examined with respect to recent research (4, 32) into the modes of failure of elastomeric bearings. The manufacturers are generally content with these tolerances. They sometimes note that individual re-quirements may be difficult to achieve in some special circum-stances. For example, it appears to be difficult to control the layer thickness and spacing requirements while maintaining low cost, and manufacturers frequently feel pressed by competitive constraints in this area. They appear to have particularly serious difficulties if the reinforcement plates are very thin for the bear-ing dimensions. Manufacturers have also indicated that relative tolerances rather than absolute limits may be more suitable for some applications. For example, layer thickness tolerances and tolerances of the reinforcement from a parallel plane are required to be within '/8 in. of the required value. This tolerance may be
Table 7. AASHTO 13th Edition manufacturing tolerances.
Overall Vertical Dimensions
Average Tolal Thickness
1 1/4 in. or less -0, +1/8 in.
Average Total Thickness over
1 1/4 in. -0, +1/4 in.
Overall Horizontal Dimensions
36 in. or less -0. +1/4 in.
over 36 in. 0 +1/4 in.
Thickness of Individual Layers of Elaslomer (Laminated Bearings Only) + or - 1/8 in.
Variation from a Plane Parallel to the Theoretical Surface (as determined by measuremenls at the edges of the bearings)
Top 1/8 in.
Sides 1/4 in.
Individual Nonelaslic Laminates 1/8 in.
Position of Exposed Connection Members 1/8 in.
Edge Cover of Embedded Laminates or Connection Members 0 +1/8 in
Size of Holes, Slols, or Inserts + or - 1/8 in.
Position of Holes, Slots, or Inserts + or - 1/8 in.
overly restrictive with very large bearings with thick elastomer layers but inadequate for bearings with thin layers.
It is logical to examine how these limits affect bearing per-formance, and to determine if the present limits are adequate for assuring good overall behavior. In examining the manufac-turing limits given in Table 7, the researchers divided the limits into three major categories. The first category consists of the tolerances on the overall vertical and horizontal dimensions, the tolerances on the position of exposed connection members, and the size and position of holes, slots, or inserts. The tolerances in this group are extremely important to the fit and placement of the bearings, but they do not have a strong, direct influence on the behavior of bearings. If they are not satisfied or properly accounted for in the design and construction, the bearing will not fit properly and the bearings may be unevenly loaded. For example, if the end reaction of a box girder is supported by two elastomeric bearings, and one bearing is '/ in. over the specified total vertical dimension, while the other bearing is 4 in. under the specified height, one of several things may occur. First, it is possible that the taller bearing will support the greatest part of the end reaction, while the shorter bearing carries little or no load. This may lead to considerable distress in the taller bearing. Second, the uneven bearing surfaces may result in twist-ing of the girder, and this may result in distress in some struc-tural members or problems with the fit of other elements during the construction process. The contractor may be required to account for these tolerances with a grout base, shims, or other methods and avoid the problems which could result. Thus, this first group of tolerance limits are really construction tolerances and they must be accounted for in the construction process. They will affect the strength and serviceability of the bearing if they are not properly accounted for in the design, but the con-tractor and designer are obligated to make acceptable allowances for these tolerances. Thus, this first group of tolerance limits is important because it defines maximum problems with fit and alignment which the designer and contractor should expect. Problems are likely to occur with the bearing only when the tolerances are neglected or not considered in the design, or if the tolerances exceed allowable limits and cannot be corrected with normal construction allowances. The tolerances listed in this group can be easily checked, and usually are. The construc-tion industry and bearing manufacturers do not appear to be concerned with these limits, and so there is no reason to change them.
The second group of tolerance limits deals with the thickness of cover layers in elastomeric bearings. Cover layers are ex-tremely important, because they prevent corrosion and deteri-oration of the reinforcement, indirectly reducing the probability of delamination and other failures. The cover layer also inhibits heat flow between the bearing and the environment, and this may prevent some of the most adverse effects of instantaneous thermal stiffening and low temperature crystallization. In view of this adverse effect, it is rational for the AASHTO Specification to require that the edge cover never be less than the required thickness shown in Table 7. The AASHTO Specification does permit the edge cover to exceed the required cover by up to '/ in. This is beneficial in that it increases the edge cover thickness and decreases the adverse effects due to possible corrosion and heat flow. However, this also has some minor adverse effects. The one-sided tolerance limit may mean that a bearing manu-facturer could cut the reinforcing plates % in. under size. As a

30
result, the effective shape factor will be smaller than the nominal value, and the resulting strains in the elastomer and bearing will be larger than expected. The reduction in shape factor is relatively small in most practical circumstances. For example, the reduction in shape factor is less than 2 percent for an 8 in. by 8 in. bearing. The detrimental effect may be larger with extremely small bearings, but this does not appear to be a serious practical problem.
The thickness requirements for top and bottom cover layers are not specifically listed, but the parallel layer thickness and normal layer thickness requirements indirectly apply. Normal cover layers are in the order of 1/4 in. for most practical bearings. The 1/8 in. tolerance permitted for layer thickness will frequently be too large in this case. This tolerance may cause a significant change in the shape factor, stiffness, and strains of the cover layer. Therefore, it appears that the tolerances for the top and bottom cover layer thickness should be somewhat more restric-tive than the general layer thickness requirements because of these factors. While the limit of the second group of tolerances is cleaç, it is not clear how the state transportation departments can assure that the tolerances are actually achieved. It is not possible to measure the edge cover accurately without destroying the bearing. Therefore, some of the acceptance test requirements outlined in later parts of this section are directed toward this objective.
The third group of tolerances consists of the layer thickness and parallelism requirements. This third group of tolerance requirements can have a significant impact (32) on the strength, stiffness, and general behavior of elastomeric bearings, and it represents a major concern in the design of bearings. Figure 51 shows the force deflection curves for the compression test of a bearing with good layer thickness and parallelism quality con-trol, and an identically sized bearing with poor layer quality control. The bearing with poor quality control experienced ap-proximately 50 percent larger deflections at similar loads and failed at smaller loads than the bearing with good quality con-trol. The high quality bearing was well within the AASHTO Specification limit, while the poorly made bearing was well outside. Other comparison tests have been performed and the results are essentially the same. Bearings with poor layer thick-ness quality control have much larger strains and fail at smaller stresses for virtually all modes of failure.
Rupture of Reinforcement
SPoor
ZInat
,
l
\ /
/Reinforcement
on
Layer Control
Rupture of
,Seuere Deiamlnation
eel Viol do
.1 .2 .3 .4 AVERAGE COMPRESSIVE STRAIN (in/in)
Figure 51. Effect of good and poor layer thickness control on force deflection behavior.
These comparisons suggest that the tolerances in group three are very important to the performance of the bearing, but the present AASHTO limits would appear to be appropriate for most practical sized bearings. The present limits may be inad-equate for some unusual bearing geometries. For example, large shape factor bearings of modest size require thin elastomer lay-ers. A 1/8-in. variation in layer thickness represents a dramatic change in the shape factor and will result in increased strains and deflections noted in Figure 51. These tolerances could sig-nificantly increase the probability of delamination or failure of that layer for these bearings. Relative tolerances would eliminate these problems. However, the relative tolerances will be difficult to meet in some cases, and they will probably increase the cost of the bearing. This increased cost would appear to be justified because these large shape factor bearings will be designed for much larger stress levels than existing bearings. As a result, additional relative tolerances have been added to the third group of tolerances in the specifications proposed in Appendix B. Dimensional errors in the third group are also difficult to mea-sure accurately without destroying the bearing, but they can be approximately assessed with the short duration load test de-scribed later. One of the major objectives of the load test is thus compliance with layer thickness tolerances. Randomly selected bearings can also be cut open if the load test results are not definitive. However, this is clearly a destructive test that is useful in evaluating the general quality control of an individual man-ufacturer rather than a particular bearing.
Acceptance Test Requirements
Since the proposed Method B elastomeric bearing design spec-ification (4) permits stress levels that may be up to 100 percent larger than those recently permitted by the AASHTO Specifi-cation, acceptance test requirements are essential to assure that the bearing will perform well under the increased load capacity. Material property tests for the elastomer have been required by the AASHTO Specification for many years. Although there is not a completely rational basis for some of these limits, they have produced many satisfactory bearings, and therefore will be retained in the proposed specification presented in Appendix B. The earlier chapters of this report have discussed the low temperature stiffness of elastomers, and new low temperature material property testi are outlined in the next chapter and Appendixes A and B. Tests will be required on completed bear-ings to assure that they are manufactured to the required tol-erances and proper quality control necessary to assure good bearing performance. These tests are discussed in this section of the report.
The AASHTO Method A design specification (1) was based on design recommendations developed during the first phase of NCHRP Project 10-20. The recommendations included two parts. The first part was the basic design method, and it was adopted (more or less verbatim) in the 1985 AASHTO provi-sions (1). The second part of these recommendations was a proposal (3) for Section 25 of the Division 11—Construction provisions of AASHTO. This second proposed specification in-cluded additional low temperature material tests, load test re-quirements for all bearings, and acceptance test requirements for randomly selected bearings. These recommendations were not adopted with the Method A provisions because of questions about the low temperature requirements. A substantially mod-ified proposal for Section 25 of Division II is included in Ap-
U)
in 15
1— U)
U > i—i 10 U) U) U
a-
05 i)
LI 0 cr2 c U >0

31
pendix B, and it is essential that general attributes of this section be adopted as quality control provisions whenever the proposed Method B is used in the design.
Short Duration Load Test
Scction 25.7 of Appendix B requires that every bearing de-signed by Method B be load tested with a short duration load test wilele the load is 150 percent of the total dead and live load on the bearing. The bearing is loaded for 5 mm, unloaded, and reloaded for a period of time that is long enough to complete a thorough usual iiispectiuii. The unload sequcicc is rcquircd because this allows slip and loss ot friction to occur if delami-nation occurs. The test is short, but the fully loaded bearing must be carefully examined. Bearings with cracks, tears, or uneven or unusual bulge patterns must be rejected. This test accomplishes several objectives. First, it is a quick, economical check for delamination of the elastomer from the reinforcement. Delamination always starts at the edge of the reinforcement, because the shear strains in the elastomer are largest in that region. Delamination is caused by inadequate bond or attach-ment between the rubber and the laminate. Lack of cleanliness and quality control are the primary culprits if delamination occurs. Local delamination will cause nonuniform bulging such as shown in Figure 52. The third layer or so from the top of this bearing has a bulge that is much greater than the bulge
Figure 52. Photograph oft/ic nonuniform bulge pattern associated with local delamination.
/- / V Figure 53. Photograph of a loaded bearing with nonuniform layer thicknesses.
noted for other layers. Further, the bulge varies significantly along the perimeter of the bearing. It should be emphasized that the bulge noted here represents an extreme case. However, the pattern is typical of local delamination, and it is cause for rejection of the bearing. Bearings may still perform adequately with local delamination, but the probability of failure of bearings with local delamination during their service life is much larger than other bearings. As a result, bearings with significant local delaminations should be rejected.
The second major objective of the short duration load test is that it is the only reliable indicator of the layer thickness and parallelism tolerances described earlier in this chapter. These tolerances are extremely important to the strength and stiffness of the bearing, but they cannot be directly measured by the state agency. Bearings with significant variations in layer thickness or bulge patterns will have variations in the bulge patterns. Figure 53 shows a bearing where the layer thickness of the bulge patterns is uniform around the perimeter of the bearing, but one layer bulge is much larger than the others. This indicates that one layer is too thick, and is cause for rejection if the thickness difference exceeds tolerances as it does in the bearing shown in this figure. Figure 54 shows the layer thickness of the bearing of Figure 53 after it was cut open. Figure 55 shows the bulge pattern for a bearing with reinforcement layers that are not parallel. The bottom layers in this bearing show a bulge pattern which indicates that the reinforcement layers are not quite flat or parallel. Note that the second regular (non-cover)
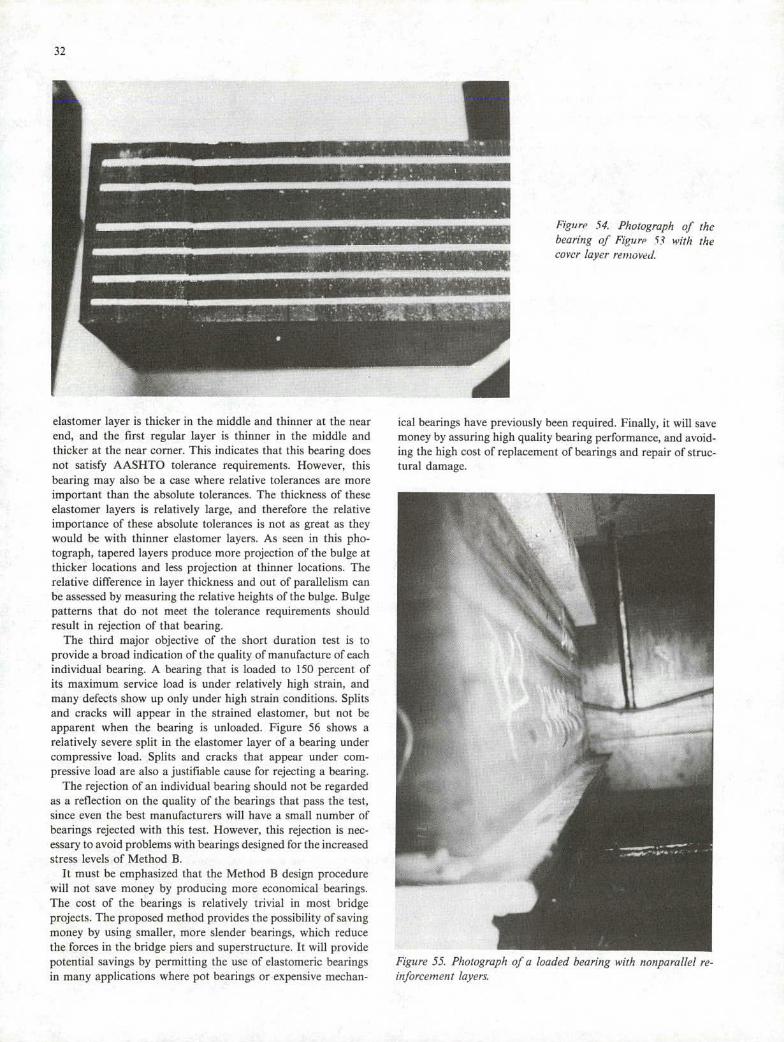
32
F/gun' 54. Photograph of the bearing of Figure' 13 with the cover layer 1CIflOVLJ.
elastomer layer is thicker in the middle and thinner at the near end, and the first regular layer is thinner in the middle and thicker at the near corner. This indicates that this bearing does not satisfy AASHTO tolerance requirements. However, this bearing may also be a case where relative tolerances are more important than the absolute tolerances. The thickness of these elastomer layers is relatively large, and therefore the relative importance of these absolute tolerances is not as great as they would be with thinner elastomer layers. As seen in this pho-tograpli, tapered layers produce more projection of the bulge at thicker locations and less projection at thinner locations. The relative difference in layer thickness and out of parallelism can be assessed by measuring the relative heights of the bulge. Bulge patterns that do not meet the tolerance requirements should result in rejection of that bearing.
The third major objective of the short duration test is to provide a broad indication of the quality of manufacture of each individual bearing. A bearing that is loaded to 150 percent of its maximum service load is under relatively high strain, and many defects show up only under high strain conditions. Splits and cracks will appear in the strained elastomer, but not be apparent when the bearing is unloaded. Figure 56 shows a relatively severe split in the elastomer layer of a bearing under compressive load. Splits and cracks that appear under com-pressive load are also a justifiable cause for rejecting a bearing.
The rejection of an individual bearing should not be regarded as a reflection on the quality of the bearings that pass the test, since even the best manufacturers will have a small number of bearings rejected with this test. However, this rejection is nec-essary to avoid problems with bearings designed for the increased stress levels of Method B.
It must be emphasized that the Method B design procedure will not save money by producing more economical bearings. The cost of the bearings is relatively trivial in most bridge projects. The proposed method provides the possibility of saving money by using smaller, more slender bearings, which reduce the forces in the bridge piers and superstructure. It will provide potential savings by permitting the use of elastomeric bearings in many applications where pot bearings or expensive mechan-
ical bearings have previously been required. Finally, it will save money by assuring high quality bearing performance, and avoid-ing the high cost of replacement of bearings and repair of struc-tural damage.
Figure 55. Photograph of a loaded bearing with nonparallel re-inforcemen t layers.

33
While the authors believe that the short duration load test is an essential element of the quality assurance required for the Method B specification, they caution that the results of this test must not be interpreted too literally. The short duration load test is an approximate test that can be easily applied to each and every bearing. It will cause rejection of some bearings that may have provided satisfactory service, and it may miss a few that cause later problems. However, it will eliminate most po-tential problems if the results are properly interpreted.
It is probably not in the bridge engineers best interest to reject bearings that appear to marginally fail tolerance require-ments, because this rejection may not be supported if the bearing is cut open. It may be in the best interest of the manufacturer to eliminate all marginal or potentially defective bearings in the short term load test, because the financial consequences of failing the long duration load test are much more severe.
Long Duration Test Requirements
There were some instances in which delamination occurred under long duration loading even though it was not apparent during a short duration load test. Delamination represents a cracking or separation of the bond and a slip of the bonded surface. Friction may prevent slip even though the bond is broken, but friction of elastoniers is strongly time-dependent. Thus, the bearing delaminates when subjected to a long duration loading. This problem is somewhat analogous to test require-ments for unreinforced bearings. Unreinforced bearings rely on friction at the load surface to prevent slip and restrain the bulging. Friction frequently restrains the slip for short duration loading, but it cannot do this for a long time, particularly if the loading has a cyclic component. As a result, the present AASHTO Specification (1) reduces the nominal shape factor of unreinforced bearings by a /3 factor to account for the in-creased strain and deflection produced by the slip. Long duration tests for delamination of reinforced bearings are required for similar reasons. It should be noted that base isolation has been
used in a number of structures in the United States in recent years, and long duration load tests have been required (33, 34) for each bearing in some of these structures.
The long duration load test is described in Appendix B. It is a more nearly foolproof, but much more expensive test than the short-term one. It is not difficult to perform, but it requires that an expensive load apparatus be tied up for many hours. It further requires a careful inspection during the end of the loaded period for cracks, flaws, or irregular bulge patterns such as those shown in Figures 52, 53, 55, and 56. In an ideal situation, the re-searchers would recommend that each bearing be subjected to a long duration load test on each and every structure. However, this will require considerable time and cost even for modest size bridges.
It is therefore proposed that a sampling procedure be em-ployed to reduce the cost, and this procedure is outlined in the proposal for Section 25.7 of Division II in Appendix B. The proposed test procedure is based on the observation that delam-ination and separation are related to inadequate cleanliness and quality control by the manufacturer. In this procedure, it is recommended that all bearings be tested and inspected under the short duration loading, and that at least 10 percent of the bearings which pass the short duration test be tested under long duration loading. The 10 percent long duration test requirement will require that a random selection of at least one bearing of each size and material and at least 10 percent of each size group be tested under long duration loading. Any bearing that exhibits cracks, flaws, or delamination under the long duration test will be rejected. Under the sampling procedure, the rejection of a single bearing will result in rejection of the entire lot of untested bearings. That is, if a single bearing of the sample fails the long duration load test, only those bearings that pass the test will be acceptable. The manufacturer may then be offered the choice of paying for a long duration test for each bearing or replacing the untested bearings and submitting them to be sampled for a new long term test at his cost.
It is clear that this sampling approach cannot eliminate all potential problems, but it keeps them to an acceptable level
Figure 56. Photograph of a bear-ing with splits and cracks in the elastomer.
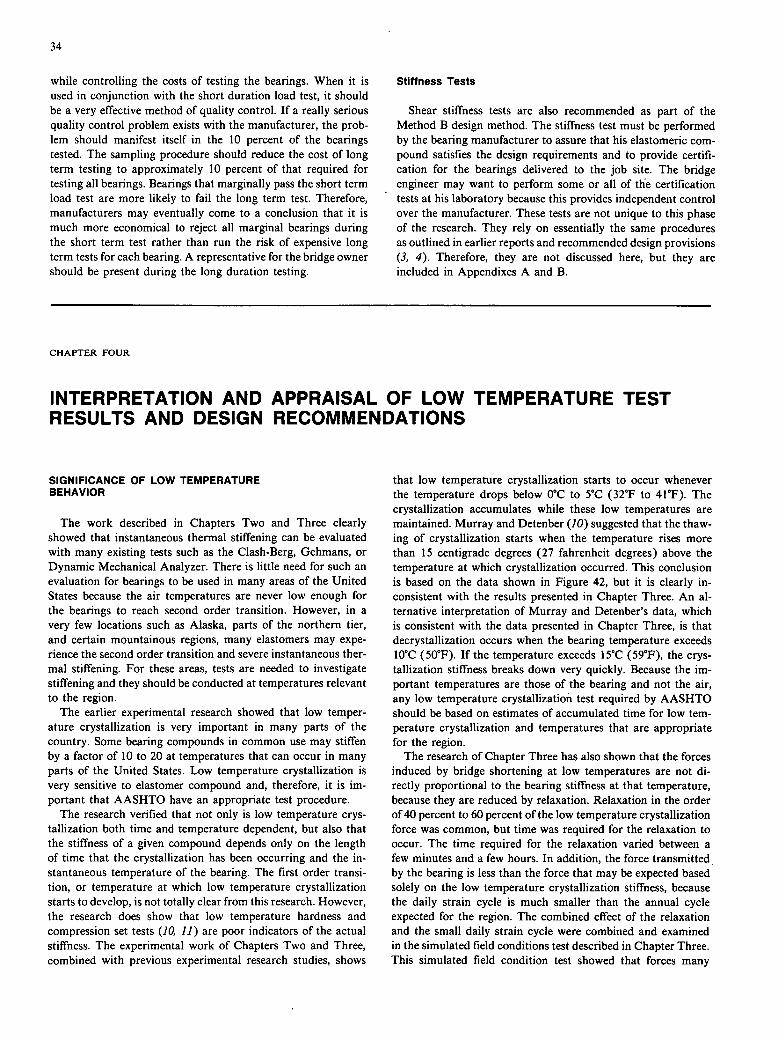
34
while controlling the costs of testing the bearings. When it is used in conjunction with the short duration load test, it should be a very effective method of quality control. If a really serious quality control problem exists with the manufacturer, the prob-lem should manifest itself in the 10 percent of the bearings tested. The sampling procedure should reduce the cost of long term testing to approximately 10 percent of that required for testing all bearings. Bearings that marginally pass the short term load test are more likely to fail the long term test. Therefore, manufacturers may eventually come to a conclusion that it is much more economical to reject all marginal bearings during the short term test rather than run the risk of expensive long term tests for each bearing. A representative for the bridge owner should be present during the long duration testing.
Stiffness Tests
Shear stiffness tests are also recommended as part of the Method B design method. The stiffness test must be performed by the bearing manufacturer to assure that his elastomeric com-pound satisfies the design requirements and to provide certifi-cation for the bearings delivered to the job site. The bridge engineer may want to perform some or all of the certification tests at his laboratory because this provides independent control over the manufacturer. These tests are not unique to this phase of the research. They rely on essentially the same procedures as outlined in earlier reports and recommended design provisions (3, 4). Therefore, they are not discussed here, but they are included in Appendixes A and B.
CHAPTER FOUR
INTERPRETATION AND APPRAISAL OF LOW TEMPERATURE TEST RESULTS AND DESIGN RECOMMENDATIONS
SIGNIFICANCE OF LOW TEMPERATURE BEHAVIOR
The work described in Chapters Two and Three clearly showed that instantaneous thermal stiffening can be evaluated with many existing tests such as the Clash-Berg, Gehmans, or Dynamic Mechanical Analyzer. There is little need for such an evaluation for bearings to be used in many areas of the United States because the air temperatures are never low enough for the bearings to reach second order transition. However, in a very few locations such as Alaska, parts of the northern tier, and certain mountainous regions, many elastomers may expe-rience the second order transition and severe instantaneous ther-mal stiffening. For these areas, tests are needed to investigate stiffening and they should be conducted at temperatures relevant to the region.
The earlier experimental research showed that low temper-ature crystallization is very important in many parts of the country. Some bearing compounds in common use may stiffen by a factor of 10 to 20 at temperatures that can occur in many parts of the United States. Low temperature crystallization is very sensitive to elastomer compound and, therefore, it is im-portant that AASHTO have an appropriate test procedure.
The research verified that not only is low temperature crys-tallization both time and temperature dependent, but also that the stiffness of a given compound depends only on the length of time that the crystallization has been occurring and the in-stantaneous temperature of the bearing. The first order transi-tion, or temperature at which low temperature crystallization starts to develop, is not totally clear from this research. However, the research does show that low temperature hardness and compression set tests (10, 11) are poor indicators of the actual stiffness. The experimental work of Chapters Two and Three, combined with previous experimental research studies, shows
that low temperature crystallization starts to occur whenever the temperature drops below 0°C to 5°C (32°F to 41°F). The crystallization accumulates while these low temperatures are maintained. Murray and Detenber (10) suggested that the thaw-ing of crystallization starts when the temperature rises more than 15 centigrade degrees (27 fahrenheit degrees) above the temperature at which crystallization occurred. This conclusion is based on the data shown in Figure 42, but it is clearly in-consistent with the results presented in Chapter Three. An al-ternative interpretation of Murray and Detenber's data, which is consistent with the data presented in Chapter Three, is that decrystallization occurs when the bearing temperature exceeds 10°C (50°17). If the temperature exceeds 15°C (59°F), the crys-tallization stiffness breaks down very quickly. Because the im-portant temperatures are those of the bearing and not the air, any low temperature crystallization test required by AASHTO should be based on estimates of accumulated time for low tem-perature crystallization and temperatures that are appropriate for the region.
The research of Chapter Three has also shown that the forces induced by bridge shortening at low temperatures are not di-rectly proportional to the bearing stiffness at that temperature, because they are reduced by relaxation. Relaxation in the order of 40 percent to 60 percent of the low temperature crystallization force was common, but time was required for the relaxation to occur. The time required for the relaxation varied between a few minutes and a few hours. In addition, the force transmitted by the bearing is less than the force that may be expected based solely on the low temperature crystallization stiffness, because the daily strain cycle is much smaller than the annual cycle expected for the region. The combined effect of the relaxation and the small daily strain cycle were combined and examined in the simulated field conditions test described in Chapter Three. This simulated field condition test showed that forces many
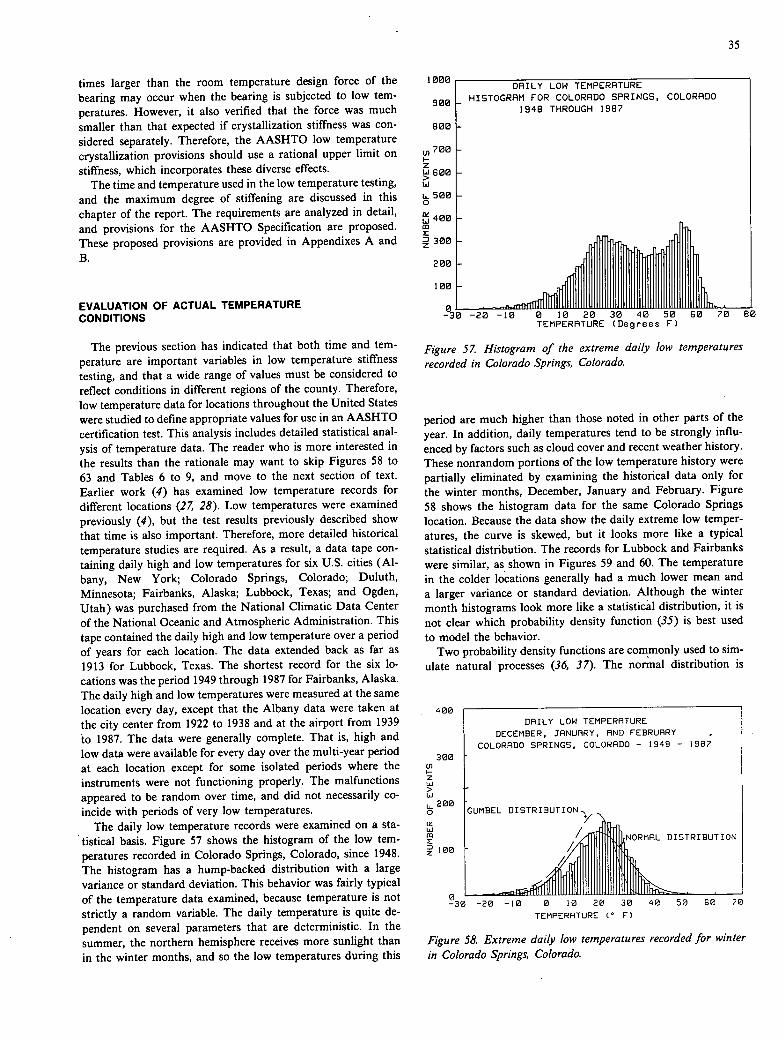
380 (I) I- z hi > hi 200
0
times larger than the room temperature design force of the bearing may occur when the bearing is subjected to low tem-peratures. However, it also verified that the force was much smaller than that expected if crystallization stiffness was con-sidered separately. Therefore, the AASHTO low temperature crystallization provisions should use a rational upper limit on stiffness, which incorporates these diverse effects.
The time and temperature used in the low temperature testing, and the maximum degree of stiffening are discussed in this chapter of the report. The requirements are analyzed in detail, and provisions for the AASHTO Specification are proposed. These proposed provisions are provided in Appendixes A and B.
1000
900
800
Ln 700 I— z Li 600
L 580 0
400
z 300
200
DAILY LOW TEMPERATURE HISTOGRAM FOR COLORADO SPRINGS, COLORADO
1948 THROUGH 1987
35
EVALUATION OF ACTUAL TEMPERATURE CONDITIONS
The previous section has indicated that both time and tem-perature are important variables in low temperature stiffness testing, and that a wide range of values must be considered to reflect conditions in different regions of the county. Therefore, low temperature data for locations throughout the United States were studied to define appropriate values for use in an AASHTO certification test. This analysis includes detailed statistical anal-ysis of temperature data. The reader who is more interested in the results than the rationale may want to skip Figures 58 to 63 and Tables 6 to 9, and move to the next section of text. Earlier work (4) has examined low temperature records for different locations (27, 28). Low temperatures were examined previously (4), but the test results previously described show that time is also important. Therefore, more detailed historical temperature studies are required. As a result, a data tape con-taining daily high and low temperatures for six U.S. cities (Al-bany, New York; Colorado Springs, Colorado; Duluth, Minnesota; Fairbanks, Alaska; Lubbock, Texas; and Ogden, Utah) was purchased from the National Climatic Data Center of the National Oceanic and Atmospheric Administration. This tape contained the daily high and low temperature over a period of years for each location. The data extended back as far as 1913 for Lubbock, Texas. The shortest record for the six lo-cations was the period 1949 through 1987 for Fairbanks, Alaska. The daily high and low temperatures were measured at the same location every day, except that the Albany data were taken at the city center from 1922 to 1938 and at the airport from 1939 to 1987. The data were generally complete. That is, high and low data were available for every day over the multi-year period at each location except for some isolated periods where the instruments were not functioning properly. The malfunctions appeared to be random over time, and did not necessarily co-incide with periods of very low temperatures.
The daily low temperature records were examined on a sta-tistical basis. Figure 57 shows the histogram of the low tem-peratures recorded in Colorado Springs, Colorado, since 1948. The histogram has a hump-backed distribution with a large variance or standard deviation. This behavior was fairly typical of the temperature data examined, because temperature is not strictly a random variable. The daily temperature is quite de-pendent on several parameters that are deterministic. In the summer, the northern hemisphere receives more sunlight than in the winter months, and so the low temperatures during this
100
0 38 48 58 60 78 8 TEMPERATURE (Degrees F)
Figure 57 Histogram of the extreme daily low temperatures recorded in Colorado Springs, Colorado.
period are much higher than those noted in other parts of the year. In addition, daily temperatures tend to be strongly influ-enced by factors such as cloud cover and recent weather history. These nonrandom portions of the low temperature history were partially eliminated by examining the historical data only for the winter months, December, January and February. Figure 58 shows the histogram data for the same Colorado Springs location. Because the data show the daily extreme low temper-atures, the curve is skewed, but it looks more like a typical statistical distribution. The records for Lubbock and Fairbanks were similar, as, shown in Figures 59 and 60. The temperature in the colder locations generally had a much lower mean and a larger variance or standard deviation. Although the winter month histograms look more like a statistical distribution, it is not clear which probability density function (35) is best used to model the behavior.
Two probability density functions are commonly used to sim-ulate natural processes (36, 37). The normal distribution is
00 DAILY LOW TEMPERATURE
DECEMBER, JANUARY, AND FEBRUARY COLORADO SPRINGS, COLORADO - 1949 - 1907
GUMBEL UTION
CK hi m z
lOB
30 -20 -10 0 10 20 30 40 50 60 70
TEMPERATURE (' F)
Figure 58. Extreme daily low temperatures recorded for winter in Colorado Springs, Colorado.
0 -3

400 U, I- z Li > U 300 L. 0
ix 200
z D z
toe
92
Ul 300
36
500 DAILY LOW TEMPERATURE
DECEMBER, JANUARY, AND FEBRUARY LUBBOCK, TEXAS - 1913 - 1987
UMBEL DISTRIBUTION°
TEMPERATURE (° F)
Figure 59. Extreme daily low temperatures recorded for winter in Lubbock, Texas.
frequently used because it has well-behaved mathematical char-acteristics and is easily manipulated. It is a symmetric distri-bution, however, and clearly cannot accurately model data that have a skewed distribution, such as that commonly seen with extreme values of natural processes. The Gumbel distribution is also commonly used. It is regarded as a limiting distribution for extreme values, and it is used in many important engineering problems such as the statistics of extreme velocity for wind load calculations. These two probability densities were fitted to the extreme low temperature data and are plotted on Figures 58 to 60. It should be noted that the usual form of the Gumbel distribution had to be modified slightly because the present data were extreme low values rather than the usual extreme high values. The probability that the extreme low temperature is below a given temperature on a given day is the integral of the probability density function from minus infinity to the specified temperature. The probability that the temperature will fall below this specific temperature in a given year is approximately 90 times the daily probability. These statistical predictions were examined and temperatures that have a 50-year return period were estimated with the two different density functions. They are listed for the six locations in Table 8 along with the historic low temperatures recorded for that region. The table, combined with graphs such as Figures 58 to 60, shows that neither prob-
400
DAILY LOW TEMPERATURE DECEMBER, JANUARY, AND FEBRUARY FAIRBANKS, ALASKA - 1949 - 1987
GUMBEL DISTRIBUTION
0 70 -60 -50 -40 -30 -20 -lB 0 tO 20 30 40 50 60 70
TEMPERATURE (° F)
Figure 60. Extreme daily low temperatures recorded for winter in Fairbanks, Alaska.
ability density function provides an accurate estimate of the probability of occurrence over the entire range of extreme daily low temperature data. The Gumbel distribution appears too skewed, in that it overestimates the probability of temperature below the mean and underestimates the probabilities for tem-peratures above the mean. It frequently made a more accurate prediction of expected temperatures such as the expected ex-treme annual or 5-year low. However, its estimate of the 50-year low was much lower than the coldest recorded temperature at all six sites. The normal distribution provides a better estimate of the probability of occurrence over most of the low temperature range. In particular, it appeared to make a reasonable estimate of the extreme low temperature expected over a 50-year interval and will overestimate the probability with temperatures related to longer periods. Table 8 shows that the normal distribution did not provide a particularly reasonable estimate of the expected extreme temperature over a 50-year intervai for Fairbanks, Alaska. This occurs because the Fairbanks data have a sub-stantial number of data points in the —45 to —50°C (-49 to - 58°F) range. Instrumentation frequently is not reliable at these extreme temperatures, and some of these data points may be questionable because they are not included in some Weather Bureau records (27, 28). The large number of these extreme data points skews the curve and results in a very low 50-year
Table 8. Low temperature data for six locations in the United States.
Location Period of Record
Historic Low Temperature
Mean Daily Low Temperature
Standard Deviation
Extreme Low for 50 Year Return Maximum
Consecutive (Degrees F) for Winter for Winter Normal Gumbel Days Below
Daily Low Distribution Distribution 32 Degrees F
Albany, New York 1922-87 -28 16 12.8 34 F -60 F 33
Colorado Springs, Colorado 1948-87 -27 18 10.4 -23 F 44 F 14
Duluth, Minnesota 1948-87 -39 2 15 -55 F -87 F 70.
Fairbanks, Alaska 1949-87 -62 -17 18.3 -87 F -125 F 154
Lubbock,Texas 1913-87 -17 27 9.2 -8 F -28 F 8
Ogden,Utah 1928-87 -26 20 10.7 -22 F -43 F 22

37
prediction. In view of these comparisons, it appears that the normal distribution method is the better statistical tool for es-timating low temperatures required for low temperature testing. A value for the 50-year extreme low temperature is needed for design. To derive one, the use of recorded low temperature data is recommended whenever a long enough record exists, but where the history is less than 50 years long, a statistical analysis based on the normal distribution should be applied to such winter-month records as are available.
BRITTLENESS AND INSTANTANEOUS THERMAL STIFFNESS
Brittleness and instantaneous thermal stiffness tests must be performed to assure good low temperature behavior of elasto-meric bridge bearings. Previous discussion has indicated that the existing brittleness test (ASTM D746) and the Clash-Berg (ASTM D1043) test appear to be suitable tests for these objec-tives. However, the temperature used for these tests must be correlated to the region in which they are used. The existing brittleness test (1, 9) requires that no failures occur when the specimen is subjected to impact at —40°C (-40°17), and verifies that the elastomer has not passed through the glass transition. The glass transition is an important temperature because brittle failure could occur if the temperature of an elastomeric bearing falls below it. As a result, the brittleness test should be performed at a temperature well below the historic low or the 50-year predicted extreme low temperature. A temperature of 5 centi-grade degrees (9 fahrenheit degrees) below the historic (50 year) low is recommended. The —40°C (-40°F) temperature is thus probably adequate for Lubbock, Ogden, or Colorado Springs. The - 40°C (- 40°F) brittleness test is clearly not adequate for Duluth and Fairbanks, but may be marginally adequate for Albany, New York. The statistical predictions for Fairbanks, Alaska, are of questionable validity and should not be used; therefore, it is difficult to recommend a suitable temperature. However, it should be much lower than —40°C (-40°17).
The Clash-Berg test is proposed as a method for evaluating the instantaneous low temperature stiffness of the elastomer. Elastomers that are near or below the second order transition temperature may stiffen dramatically within a very short time. Specimen CR55 stiffened to more than 50 times its room tem-perature stiffness at - 50°C (-5 8°F). These dramatic stiffness increases may result in extremely large forces in the bridge and the bearing, which may result in damage to the bridge and its substructure. The Clash-Berg test measures the relative stiffness after it has been exposed to a short duration of a given tem-perature. As with many tests on rubber products, the test does not give the value of a material property that can subsequently be used for design, but rather the change in stiffness with tem-perature gives a relative measure of the degree of thermal stiff-ening. It is recommended that the Clash-Berg test be performed at or below the design 50-year extreme low temperature. It is recommended that this stiffness be no greater than 4 times the room temperature stiffness. The temperature will be below the lowest temperature that could practically be experienced by the bridge bearing during the life of the structure and is keyed to the location of the bridge. It should be recalled that elastomers are relatively poor conductors of heat, and so the bearing will never reach the extreme low air temperatures if they are of short
duration. Thus, the Clash-Berg test should be performed at a temperature of 3 to 6 centigrade degrees (5 to 10 fahrenheit degrees) colder than the bearing temperature, and the brittleness test should have a margin of 8 to 11 centigrade degrees (15 to 20 fahrenheit degrees).
The Clash-Berg test is a quick economical test which can be performed by the bearing manufacturer in much the same way as he now performs the tensile elongation and low temperature brittleness tests. The results could be extremely important for regions of low temperature. It should be less important for the other regions, but it is a good and fairly economical quality control test. A manufacturer who has difficulty meeting this test probably will have greater difficulty with other low tem-perature tests. As a result, this test is recommended for all temperature zones.
LOW TEMPERATURE CRYSTALLIZATION TEST
Low temperature crystallization can result in a dramatic in-crease in stiffness when the bearing is subjected to low temper-atures for a long period of time. The research has suggested that the stiffness depends only on the duration of time for which the elastomer has been crystallizing and the instantaneous tem-perature of the bearing. At nearly all temperatures, the elastomer stiffens relatively rapidly during the earlier part of the crystal-lization, but it then reaches a plateau and further stiffness in-creases occur much more slowly. Lower temperatures result in more rapid stiffness increases and much higher stiffness at the plateau. However, very low temperature tests often show a delay before the rapid crystallization stiffening starts. Both natural rubber and Neoprene stiffen with low temperature crystalliza-tion, but under normal conditions natural rubber stiffens less than comparable Neoprene. However, a Neoprene compound which is highly resistant to low temperature crystallization stiff-ness will experience a much smaller stiffness increase than a natural rubber with poor crystallization resistance. Natural rub-ber frequently crystallizes at a slower rate than comparable Neoprene, but natural rubber usually takes longer to reach the stiffness plateau. The starting and ending points during which crystallization occurs are not precisely defined. However, it is clear that crystallization stiffness starts to develop when the temperature of the bearing falls much below 0°C (32°17). It is also clear that thawing starts to occur whenever the temperature rises well above this point.
Both the temperature and the duration of the low temperature crystallization tests must be correlated to the regional climate. The temperature data for the six locations were examined to determine a reasonable duration for the test programs. The bearing temperature depends on many factors including the bearing size and geometry. There is a longer time lag (4) in the temperature change for larger bearings. When the combined effects of these factors are considered, it can be seen that a running average of the air temperature is the realistic measure of the extreme temperature of the bearing itself. A 3-day running average of the Colorado Springs and Fairbanks data is shown in Figures 61 and 62, and Table 9 gives the statistics. The running average reduces the extremes of the statistical distri-bution and, as a result, reduces the standard deviations. This difference is most apparent in intermediate climates such as Albany, Colorado Springs, and Ogden. This occurs because these
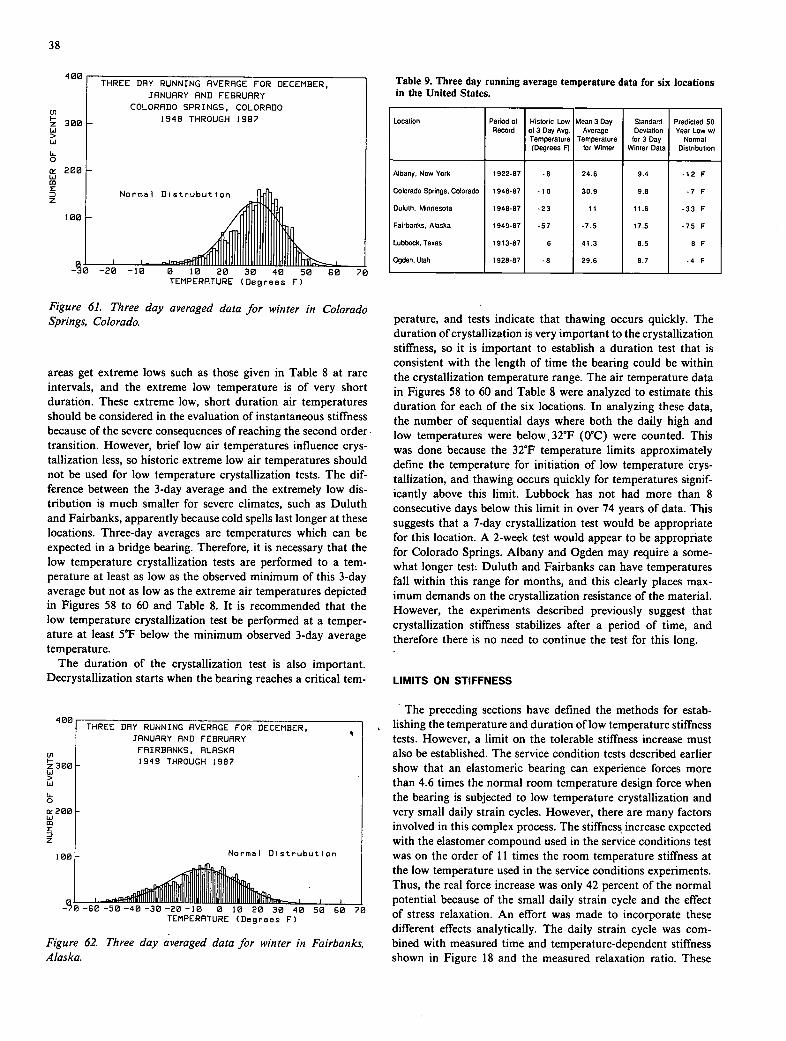
uIl,IIlIIIl5I,IIrIIjIp!III,I,III1pIIIttII,tjI.,____ I _50, -20 —10 0 10 20 30 40 50 60 70
TEMPERATURE (Degrees F)
Table 9. Three day running average temperature data for six locations in the United States.
Location Period 01 Record
Historic Low 013 Day Avg. Temperature (Degrees F)
Mean 3 Day Average
Temperature for Winter
Standard Deviation for 3 Day
Winter Data
Predicted 50 Year Low w/
Normal Distribution
Albany, New York 1922.87 -8 24.6 9.4 -12 F
Colorado Springs, Colorado 1948-87 . t 0 30.9 9.8 7 F
Duluth, Minnesota 1948-87 -23 11 11.6 -33 F
Fairbanks, Alaska 1949-87 .57 .75 17.5 -75 F
Lubbock.Texas 1913-87 6 41.3 8.5 8 F
Ogden,Utah 1928-87 -8 29.6 8.7 -4 F
38
400 THREE DAY RUNNING AVERAGE FOR DECEMBER,
JANUARY AND FEBRUARY
COLORADO SPRINGS, COLORADO
1948 THROUGH 1987
Normal Distrubution
100
Figure 61. Three day averaged data for winter in Colorado Springs, Colorado.
areas get extreme lows such as those given in Table 8 at rare intervals, and the extreme low temperature is of very short duration. These extreme low, short duration air temperatures should be considered in the evaluation of instantaneous stiffness because of the severe consequences of reaching the second order transition. However, brief low air temperatures influence crys-tallization less, so historic extreme low air temperatures should not be used for low temperature crystallization tests. The dif-ference between the 3-day average and the extremely low dis-tribution is much smaller for severe climates, such as Duluth and Fairbanks, apparently because cold spells last longer at these locations. Three-day averages are temperatures which can be expected in a bridge bearing. Therefore, it is necessary that the low temperature crystallization tests are performed to a tem-perature at least as low as the observed minimum of this 3-day average but not as low as the extreme air temperatures depicted in Figures 58 to 60 and Table 8. It is recommended that the low temperature crystallization test be performed at a temper-ature at least 5°F below the minimum observed 3-day average temperature.
The duration of the crystallization test is also important. Decrystallization starts when the bearing reaches a critical tem-
402 THREE DAY RUNNING AVERAGE FOR DECEMBER,
JANUARY AND FEBRUARY
I-n FAIRBANKS, ALASKA
300 1949 THROUGH 1987
U > U U- 0 ir 200 U
z
100
Normal Distrubution
_I I —10-60-50-40-30-20-18 0 10 20 30 40 50 60 70
TEMPERATURE (Degrees F)
Figure 62. Three day averaged data for winter in Fairbanks, Alaska.
perature, and tests indicate that thawing occurs quickly. The duration of crystallization is very important to the crystallization stiffness, so it is important to establish a duration test that is consistent with the length of time the bearing could be within the crystallization temperature range. The air temperature data in Figures 58 to 60 and Table 8 were analyzed to estimate this duration for each of the six locations. In analyzing these data, the number of sequential days where both the daily high and low temperatures were below, 32°F (0°C) were counted. This was done because the 32°F temperature limits approximately define the temperature for initiation of low temperature crys-tallization, and thawing occurs quickly for temperatures signif-icantly above this limit. Lubbock has not had more than 8 consecutive days below this limit in over 74 years of data. This suggests that a 7-day crystallization test would be appropriate for this location. A 2-week test would appear to be appropriate for Colorado Springs. Albany and Ogden may require a some-what longer test Duluth and Fairbanks can have temperatures fall within this range for months, and this clearly places max-imum demands on the crystallization resistance of the material. However, the experiments described previously suggest that crystallization stiffness stabilizes after a period of time, and therefore there is no need to continue the test for this long.
LIMITS ON STIFFNESS
The preceding sections have defined the methods for estab-lishing the temperature and duration of low temperature stiffness tests. However, a limit on the tolerable stiffness increase must also be established. The service condition tests described earlier show that an elastomeric bearing can experience forces more than 4.6 times the normal room temperature design force when the bearing is subjected to low temperature crystallization and very small daily strain cycles. However, there are many factors involved in this complex process. The stiffness increase expected with the elastomer compound used in the service conditions test was on the order of 11 times the room temperature stiffness at the low temperature used in the service conditions experiments. Thus, the real force increase was only 42 percent of the normal potential because of the small daily strain cycle and the effect of stress relaxation. An effort was made to incorporate these different effects analytically. The daily strain cycle was com-bined with measured time and temperature-dependent stiffness shown in Figure 18 and the measured relaxation ratio. These

39
were then combined with the strain history shown in Figure 47 and the temperature history shown in Figure 46. This resulted in the force prediction shown in Figure 63. This figure contains the measured forces shown is a dashed line obtained in the service conditions tests of Figure 48.
Two different predictions are contained on this figure. The first prediction is based on a 12-hour time step with the above data and is illustrated with the asterisk symbols on the figure. The second prediction is depicted as a solid line and is based on the data integrated over time. Both predictions show trends similar to those of the experimental results, but the analysis underpredicts the maximum force measured during the exper-iments. Nevertheless, it predicted a significant increase in the bridge bearing force over the design force.
It is logical to ask why the predicted forces are somewhat smaller than the experimental service conditions test results when the predictions are based on the test results for the identical elastomer compound. This difference was analyzed in some de-tail, and is primarily related to the way the tests were performed. Figure 14 shows the cyclic shear force strain behavior of the CR55 bearing after it was crystallized at - 10°C (14°F) and —30°C (-22°F). This stiffness and force during the first cycle of deformation are significantly larger than the values noted in later cycles. The difference was described earlier in this report, and can be attributed to a potential breakdown in the crystal-lization due to the strain and deformation of the elastomer (14). The stiffness test results were based on the lower force value that was based on the partially decrystallized elastomer. This was done because the results were repeatable and less sensitive to possible experimental error after the first 3/4 cycle was com-plete; and it was desirable to consider the breakdown in crys-tallization noted in other research (14) because bridges may experience this in actual conditions. The relaxation test was based on the initial forces, and the relaxation measured during this test includes this extra reduction. However, the stress re-laxation and breakdown in crystallization are fundamentally similar phenomenon. They are both caused by the viscoelastic behavior of the elastomer. Thus, the force reduction measured during the relaxation tests was too large when applied to the
TIME(DRYS)
Figure 63. Predicted and measured bridge bearing forces under the service condition test.
stiffness tests because the measured reduction incorporated a reduction which was already included in the stiffness measure-ments. The magnitude of this double deduction varied with different experiments, but Figure 14 indicates that the double deduction was in the order to 15 percent of the total force for the CR55 experiments. Figure 63 indicates that the difference between the measured service condition tests and the compu-tations are also in the order of 15 percent. Therefore, this dif-ference in test procedure may be a reason for the difference in experimental and predicted force conditions.
When these differences are resolved, the analytical procedures and the experimental results described earlier lead to a rational limit on the low temperature stiffness of the elastomer. In the selection of this limit, it is desirable to assure that the maximum force in the elastomeric bearing under low temperature condi-tions is held to within an acceptable range of the design force at room temperature. At the same time, it is recognized that a severe low temperature stiffness may occur only once or twice in the life of the structure. Therefore, extreme forces that are somewhat larger than the design force at room temperature may be allowed. The bridge is designed with factors of safety (or load factors) larger than 1.5, and the extreme low temperature force is approximately a once in 50-year phenomenon. There-fore, no damage should occur to the bridge if the bridge pier is designed for a room temperature bearing force, and the low temperature force is 1.5 times this value. The small frequency of occurrence should make the use of this factor an acceptable structural practice. The field condition simulation test showed that the bearing force was 4.6 times the room temperature design force when the measured stiffness at the extreme conditions was 11 times the room temperature value. This test indicates that the force in the bearing will not exceed 1.5 times the room temperature force if the elastomeric compound does not stiffen more than 3.6 times the room temperature stiffness. The 3.6 factor would be an overly conservative limit, however, because the field condition test considered time and temperature but did not consider the elastic deformation of piers, girders, and abut-ments. When the elastic deformation is added to the equation a stiffness limit of 4.0 is appropriate.
The stiffness limit of 4.0 is applied to all geographic regions of the country, but the time and temperature are varied as appropriate. Therefore, the ratio of forces should be similar for all zones. It is therefore recommended that the bridge piers, girders, and abutments be designed for the force achieved when the maximum bearing movement (normally approximately 50 percent shear strain) is applied to the bearing with room tem-perature stiffness (i.e., the term H in the recommended speci-fication section 14.2). If the elastomer satisfies the low temperature grade requirements and is tested with a measured stiffness ratio less than 4.0 as required, this practice will indicate that the bearing will most probably never develop a force larger than 1.5 times this value under any practical condition. Under the worst case scenario, the field test indicates that the force should never exceed approximately 2.5 times the design force. As noted in Appendix A of NCHRP Report 298 (4), bridges which have beams, girders, and abutments, and are much stronger than normal, or have a positive slip surface, can tolerate stiffer bearings under extreme low temperatures. Table 14.3.2 of the recommended specification permits the reduction of the grade requirements by one step under these conditions, and larger forces may occur.

40
ZONE AND GRADE REQUIREMENTS
This chapter has discussed the rationale for defining the low temperature test requirements for elastomeric bridge bearings, and recommended provisions for the AASHTO Specification based on this rationale are presented in Appendixes A and B. It is clear from this discussion that the low temperature test requirements must be very different for different parts of the country. The distinction between different elastomer grades has historically been based on ASTM D2000 (38), and this standard was used as the basis for low temperature elastomer grades in earlier specifications and guidelines (4, 12). The proposed spec-ifications shown in Appendix A and Appendix B use 5 elastomer grades and low temperature zones to define the design require-ments. These grades follow a rationale similar to, but different from, ASTM D2000. The grade designations are based on brit-tleness and stiffness test results as outlined earlier in this chapter.
Five zones were required because the temperature studies demonstrated that low temperature behavior was too broad to produce economical and functional bearing designs with limited zone designations. The definition of a zone for a given location should be made with the analytical methods described in this chapter. That is, the extreme temperature and the maximum durations of temperatures below 32°F (0°C) should be deter-mined, and these should be used in selecting the elastomer grade and conducting the tests listed in Appendix B.
While the researchers believe that the elastomer grade should be selected on the basis of the temperature history at the bridge site, Figure 64 illustrates an approximate division of the United States into low temperature zones. The zones were conserva-tively defined; therefore, this map is more likely to overestimate, rather than underestimate, the zone designation by up to one zone. The map is based on a broad observation of temperature patterns. Zone A is likely to be the Gulf Coast and Southern California coastal regions. These are essentially regions where virtually no low temperature analysis need be made. Zone B is the inland portions of the southern tier of the United States
Figure 64. Map presenting guidelines for recommended low tem-perature zones in the United States.
where very modest low temperature test requirements are needed. It is expected that Lubbock, Texas, would fall within this zone. Zone C would be the major portion of the central part of the United States which would include Colorado Springs. Zone D would include only the very northern tier of the United States plus high mountainous areas in the central area. Duluth would clearly fall into Zone D. Albany and Ogden could be borderline to either Zone C or Zone D. Zone E would include Alaska, although it is possible that the southern coastal regions of Alaska may qualify for Zone D. The elastomer grade re-quirements for these zones and the test requirements for each grade are given in the appendixes. In many, but not all, cases, the elastomer grade number corresponds to the low temperature grade number. They do not always agree, because the material designations are designed to be approximately consistent with existing ASTM standards (12, 38).
CHAPTER FIVE
CONCLUSIONS AND RECOMMENDATIONS
CONCLUSIONS
A number of major conclusions resulted from this research. These are:
1. Low temperature may cause dramatic increases in the stiff-ness of elastomeric bearings, and the increased stiffness may result in significant increases in the forces transmitted by the bearing to the substructure. The stiffness increase is very sen-sitive to the elastomer compound. Improved test and acceptance procedures are required to control the stiffness increase and the resulting increase in substructure forces. Recommendations for these procedures are proposed in the design provisions of Ap-pendixes A and B.
The low temperature stiffness increase is caused by the combined effect of instantaneous low temperature stiffening and time dependent low temperature crystallization. The stiffness due to low temperature crystallization of a given elastomer compound depends only on the instantaneous temperature of the elastomer and the duration of the low temperature. Hardness and compression set are poor indicators of low temperature stiffness.
The low temperature crystallization stiffness generally had a short period with no time dependent stiffness increase, fol-lowed by a period of increasing stiffness and an ultimate plateau in the stiffness. Lower temperatures generally resulted in a longer initial delay, but a more rapid stiffness increase and a higher plateau than higher temperatures. This does not support
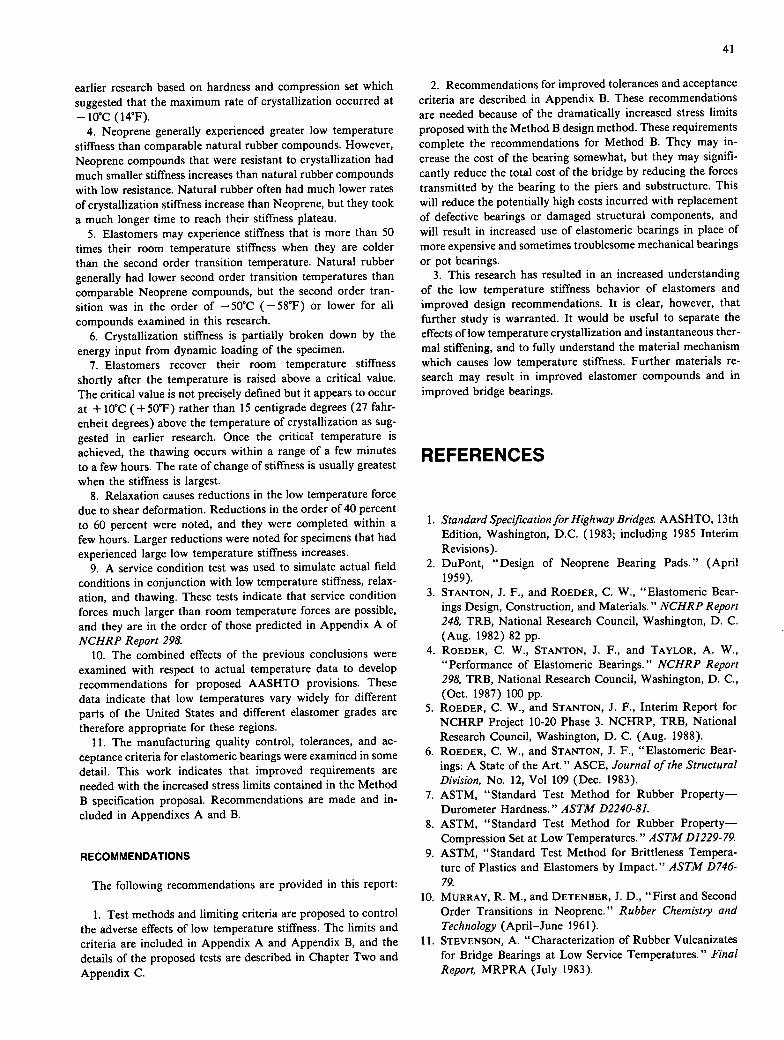
41
earlier research based on hardness and compression set which suggested that the maximum rate of crystallization occurred at -10°C (14°F).
Neoprene generally experienced greater low temperature stiffness than comparable natural rubber compounds. However, Neoprene compounds that were resistant to crystallization had much smaller stiffness increases than natural rubber compounds with low resistance. Natural rubber often had much lower rates of crystallization stiffness increase than Neoprene, but they took a much longer time to reach their stiffness plateau.
Elastomers may experience stiffness that is more than 50 times their room temperature stiffness when they are colder than the second order transition temperature. Natural rubber generally had lower second order transition temperatures than comparable Neoprene compounds, but the second order tran-sition was in the order of - 50°C (-5 8°F) or lower for all compounds examined in this research.
Crystallization stiffness is partially broken down by the energy input from dynamic loading of the specimen.
Elastomers recover their room temperature stiffness shortly after the temperature is raised above a critical value. The critical value is not precisely defined but it appears to occur at + 10°C (+ 50°F) rather than 15 centigrade degrees (27 fahr-enheit degrees) above the temperature of crystallization as sug-gested in earlier research. Once the critical temperature is achieved, the thawing occurs within a range of a few minutes to a few hours. The rate of change of stiffness is usually greatest when the stiffness is largest.
Relaxation causes reductions in the low temperature force due to shear deformation. Reductions in the order of 40 percent to 60 percent were noted, and they were completed within a few hours. Larger reductions were noted for specimens that had experienced large low temperature stiffness increases.
A service condition test was used to simulate actual field conditions in conjunction with low temperature stiffness, relax-ation, and thawing. These tests indicate that service condition forces much larger than room temperature forces are possible, and they are in the order of those predicted in Appendix A of NCHRP Report 298.
The combined effects of the previous conclusions were examined with respect to actual temperature data to develop recommendations for proposed AASHTO provisions. These data indicate that low temperatures vary widely for different parts of the United States and different elastomer grades are therefore appropriate for these regions.
The manufacturing quality control, tolerances, and ac-ceptance criteria for elastomeric bearings were examined in some detail. This work indicates that improved requirements are needed with the increased stress limits contained in the Method B specification proposal. Recommendations are made and in-cluded in Appendixes A and B.
RECOMMENDATIONS
The following recommendations are provided in this report:
1. Test methods and limiting criteria are proposed to control the adverse effects of low temperature stiffness. The limits and criteria are included in Appendix A and Appendix B, and the details of the proposed tests are described in Chapter Two and Appendix C.
Recommendations for improved tolerances and acceptance criteria are described in Appendix B. These recommendations are needed because of the dramatically increased stress limits proposed with the Method B design method. These requirements complete the recommendations for Method B. They may in-crease the cost of the bearing somewhat, but they may signifi-cantly reduce the total cost of the bridge by reducing the forces transmitted by the bearing to the piers and substructure. This will reduce the potentially high costs incurred with replacement of defective bearings or damaged structural components, and will result in increased use of elastomeric bearings in place of more expensive and sometimes troublesome mechanical bearings or pot bearings.
This research has resulted in an increased understanding of the low temperature stiffness behavior of elastomers and improved design recommendations. It is clear, however, that further study is warranted. It would be useful to separate the effects of low temperature crystallization and instantaneous ther-mal stiffening, and to fully understand the material mechanism which causes low temperature stiffness. Further materials re-search may result in improved elastomer compounds and in improved bridge bearings.
REFERENCES
Standard Specflcation for Highway Bridges. AASHTO, 13th Edition, Washington, D.C. (1983; including 1985 Interim Revisions). DuPont, "Design of Neoprene Bearing Pads." (April 1959). STANTON, J. F., and ROEDER, C. W., "Elastomeric Bear-ings Design, Construction, and Materials." NCHRP Report 248, TRB, National Research Council, Washington, D. C. (Aug. 1982) 82 pp. ROEDER, C. W., STANTON, J. F., and TAYLOR, A. W., "Performance of Elastomeric Bearings." NCHRP Report 298, TRB, National Research Council, Washington, D. C., (Oct. 1987) 100 pp. ROEDER, C. W., and STANTON, J. F., Interim Report for NCHRP Project 10-20 Phase 3. NCHRP, TRB, National Research Council, Washington, D. C. (Aug. 1988). ROEDER, C. W., and STANTON, J. F., "Elastomeric Bear-ings: A State of the Art." ASCE, Journal of the Structural Division, No. 12, Vol 109 (Dec. 1983). ASTM, "Standard Test Method for Rubber Property-Durometer Hardness." ASTM D2240-81. ASTM, "Standard Test Method for Rubber Property-Compression Set at Low Temperatures." ASTM D1229-79. ASTM, "Standard Test Method for Brittleness Tempera-ture of Plastics and Elastomers by Impact." ASTM D746-79. MURRAY, R. M., and DETENBER, J. D., "First and Second Order Transitions in Neoprene." Rubber Chemistry and Technology (April-June 1961). STEVENSON, A. "Characterization of Rubber Vulcanizates for Bridge Bearings at Low Service Temperatures." Final Report, MRPRA (July 1983).

42
ASTM, "Standard Specification for Plain and Steel-Lami-nated Elastomeric Bearings for Bridges." ASTM 4014-81. British Standards Institution BS5400, Steel, Concrete, and Composite Bridges, Part 9A and 9B (1983). C0E, D. G., HOWGATE, P. G., and LACHMANN, C. J. B. L., "The Effect on Crystallization of Low Frequency Shear Strain." International Rubber Conference, Gothenberg (1986). ASTM, "Standard Test Methods for Rubber Property-Brittleness Point of Flexible Polymers and Coated Fabrics." ASTM D2137-83. GENT, A. N., "On the Relation between Indentation Hard-ness and Young's Modulus." Transactions of the Institution of the Rubber Industry, Vol 34, No. 2 (1958) pp. 46-57. ASTM, "Standard Test Methods for Stiffness Properties of Plastics as a Function of Temperature by Means of a Torsion Test." ASTM D1043-84. ASTM, "Standard Test Method for Rubber Property-Stiffening at Low Temperatures: Flexible Polymers and Coated Fabrics." ASTM .D1053-85. ASTM, "Standard Practice for Determining and Reporting Dynamic Mechanical Properties of Plastics." ASTMD4065-82. DuPont, "Operators Manual-982 DMA Dynamic Me-chanical Analyzer." PN 982006-001, DuPont, Wilmington, Delaware (Sept. 1983). So Low Environmental Equipment Catalogue, Cincinnati, Ohio (1986). AISC, Manual of Steel Construction. Eighth Edition, Amer-ican Institute of Timber Construction, Chicago, Illinois (1980). AITC, Timber Construction Manual. Second Edition, American Institute of Timber Construction, Englewood, Colorado (1974). OPONG, D., Personal Communication (DuPont Corpora-tion) to Mr. S. Bennett (D. S. Brown), October 21, 1988. SAEY, J., Personal Communication (DuPont) to Charles W. Roeder, March 21, 1989.
FELLER, T., "Low Temperature Performance of Elasto-meric Bearings." Thesis submitted in partial fulfillment of the degree of Master of Science in Civil Engineering, Uni-versity of Washington, Seattle (1989). Climates of the States. Second Edition, Gale Research Co., Detroit, Michigan (1974). Climatological Data of the States. U. S. Weather Bureau, Department of Commerce (multi-volume set of data for each state). EMERSON, M., "Bridge Temperatures for Setting Bearings and Expansion Joints." TRRL Report 5R479, Department of Transport, Crowthorne, England (1979). BETHEA, T. W., Personal Communication (Firestone) to J. F. Stanton, November 2, 1988. SEAY, J., Personal Communication (DuPont) to C. W. Roe-der and J. F. Stanton, March 13, 1989. ROEDER, C. W., STANTON, J. F., and TAYLOR, A. W., "Failure Modes of Elastomeric Bearings and Influence of Manufacturing Methods." Proc. 2nd World Congress on Bearings and Sealants. ACI Publication SP-94, Vol. I, AC!, San Antonio, Texas (1986). Dynamic Isolation Systems, Inc, Design of Lead-Rubber Isolation Bearings for Bridges. Berkeley, California (1988). TARICS, A. J., KELLY, J., and HOLLAND, R., "Quality Assurance and Control of Fabrication for a High Damping Base Isolation System." ATC, Proc., Workshop on Base Isolation and Passive Energy Dissipation, San Francisco, California (Mar. 12-14, 1986). MooD, A. M., GRAYBELL, F. A., and BOES, D. C., Intro-duction to the Theory of Statistics. Third Edition, McGraw-Hill, New York (1974). H!RTZEL, C. S., "Extreme Values of Autocorrelated Se-quences." Applied Mathematics and Computation, No. 16 (1985) pp. 327-345. GUMBEL, E. J., Statistics of Extremes, Columbia University Press, New York (1958). ASTM, "Standard Classification System for Rubber Prod-ucts in Automotive Applications." ASTM D2000-80.
APPENDIX A
RECOMMENDED AASHTO DESIGN SPECIFICATION AND COMMENTARY
SECTION 14-ELASTOMERIC BEARINGS
14.1 General
An elastomeric bridge bearing is a device constructed partially or wholly from elastomer, the purpose of which is to transmit loads and accommodate movements between a bridge and its supporting structure. This section of the Specification covers the design of plain pads (consisting of elastomer only) and reinforced bearings (consisting of alternate layers of steel or
fiberglass reinforcement and elastomer, bonded together). Ta-pered elastomer layers are not permitted. In addition to any internal reinforcement, bearings may have external steel load plates bonded to the upper or lower elastomer layers or both.
Two design procedures are provided in this section. Bearings reinforced with steel may be designed either by the procedure defined in 14.4.A or the one in 14.4.B. Bearings with fiberglass reinforcement or unreinforced pads shall be designed by 14.4.A. Both design procedures are based on service loads, and require that no impact fraction be added to the live load. The materials,
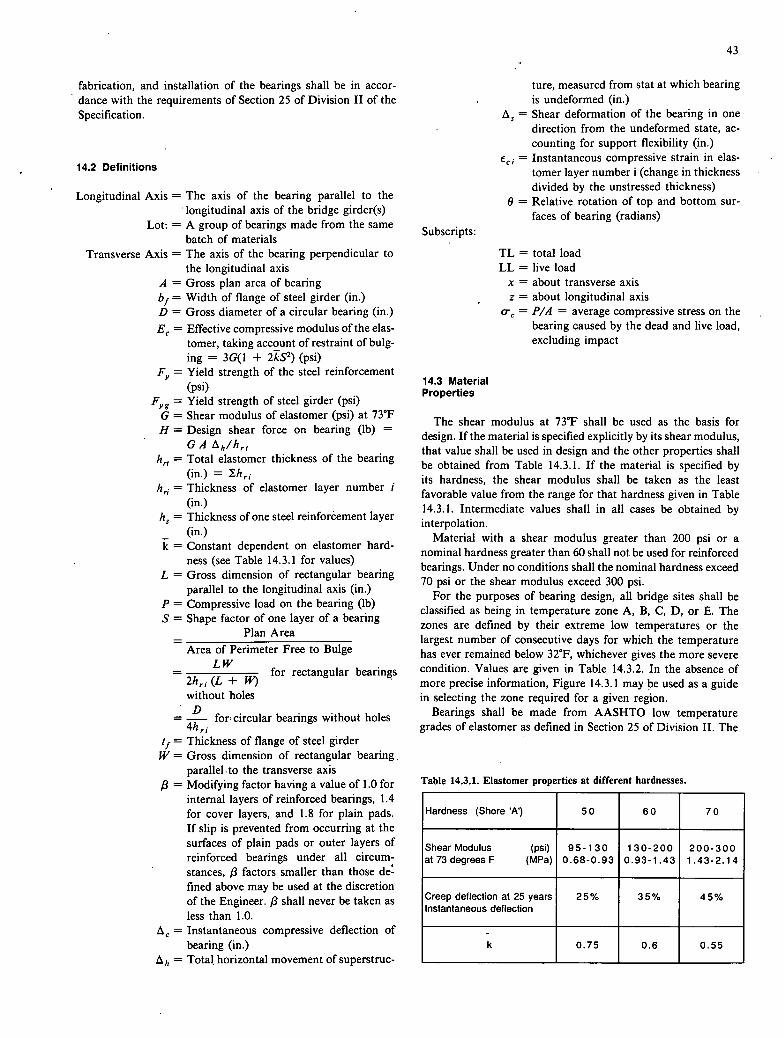
Table 14.3.1. Elastomer properties at different hardnesses.
Hardness (Shore 'A') 50 60 70
Shear Modulus (psi) at73degreesF (MPa)
95-130 0.68-0.93
130-200 0.93-1.43
200-300 1.43-2.14
Creep deflection at 25 years Instantaneous deflection
25% 35% 45%
k 0.75 0.6 0.55
14.2 Definitions
Longitudinal Axis The axis of the bearing parallel to the longitudinal axis of the bridge girder(s)
Lot: = A group of bearings made from the same Subscnpts:
batch of matenals Transverse Axis = The axis of the bearing perpendicular to
the longitudinal axis A = Gross plan area of bearing b f = Width of flange of steel girder (in.) D = Gross diameter of a circular bearing (in.)
14.3 Material Properties
The shear modulus at 7317 shall be used as the basis for design. If the material is specified explicitly by its shear modulus, that value shall be used in design and the other properties shall be obtained from Table 14.3.1. If the material is specified by its hardness, the shear modulus shall be taken as the least favorable value from the range for that hardness given in Table 14.3.1. Intermediate values shall in all cases be obtained by interpolation.
Material with a shear modulus greater than 200 psi or a nominal hardness greater than 60 shall not be used for reinforced bearings. Under no conditions shall the nominal hardness exceed 70 psi or the shear modulus exceed 300 psi.
For the purposes of bearing design, all bridge sites shall be classified as being in temperature zone A, B, C, D, or E. The zones are defined by their extreme low temperatures or the largest number of consecutive days for which the temperature has ever remained below 32F, whichever gives the more severe condition. Values are given in Table 14.3.2. In the absence of more precise information, Figure 14.3.1 may be used as a guide in selecting the zone required for a given region.
Bearings shall be made from AASHTO low temperature grades of elastomer as defined in Section 25 of Division II. The
ture, measured from stat at which bearing is undeformed (in.)
= Shear deformation of the bearing in one direction from the undeformed state, ac-counting for support flexibility (in.)
cci = Instantaneous compressive strain in elas-tomer layer number i (change in thickness divided by the unstressed thickness)
0 = Relative rotation of top and bottom sur-faces of bearing (radians)
TL = total load LL = live load
x = about transverse axis z = about longitudinal axis
= P/A = average compressive stress on the bearing caused by the dead and live load, excluding impact
43
fabrication, and installation of the bearings shall be in accor-dance with the requirements of Section 25 of Division II of the Specification.
= Effective compressive modulus of the elas-tomer, taking account of restraint of bulg-ing = 3G(l + 2k 2 ) ( psi)
F = Yield strength of the steel reinforcement (psi)
Fyg = Yield strength of steel girder (psi) G = Shear modulus of elastomer (psi) at 73F H = Design shear force on bearing (lb) =
GA h'"rt hr1 = Total elastomer thickness of the bearing
(in.) = Ih,i hr j = Thickness of elastomer layer number i
(in.) h5 = Thickness of one steel reinforcement layer
(in.) k = Constant dependent on elastomer hard-
ness (see Table 14.3.1 for values) L = Gross dimension of rectangular bearing
parallel to the longitudinal axis (in.) P = Compressive load on the bearing (lb) S = Shape factor of one layer of a bearing
= Plan Area Area of Perimeter Free to Bulge
LW = 2h, (L +
for rectangular bearings
without holes
= forl circular bearings without holes
t f = Thickness of flange of steel girder W = Gross dimension of rectangular bearing
parallel to the transverse axis /3 = Modifying factor having a value of 1.0 for
internal layers of reinforced bearings, 1.4 for cover layers, and 1.8 for plain pads. If slip is prevented from occurring at the surfaces of plain pads or outer layers of reinforced bearings under all circum-stances, /3 factors smaller than those de fined above may be used at the discretion of the Engineer. /3 shall never be taken as less than 1.0.
= Instantaneous compressive deflection of bearing (in.)
= Total horizontal movement of superstruc-

These stress limits may be increased by 10 percent where shear deformation is prevented. In bearings containing layers of dif-ferent thickness, the value of S used shall be that for the thickest layer.
14.4.A.2 Compressive Deflection
The compressive deflection, A, of the bearing shall be so limited as to ensure the serviceability of the bridge. Deflections due to total load and to live load alone shall be considered separately.
Instantaneous deflection shall be calculated as
Values for e, i shall be obtained from design aids based on tests such as presented in Figures 14.4.A.2A and 14.4.A.2B, by testing or by an approved analysis method. Figures 14.4.A.2A and 14.4.A.213 are for internal layers of reinforced bearings. They may be used for plain pads or cover layers of reinforced bearings if S is replaced by S/13.
The effects of creep of the elastomer shall be added to the instantaneous deflection when considering long-term deflec-tions. They shall be computed from information relevant to the elastomeric compound used if it is available. If not, the values given in Article 14.3 shall be used.
14.4.A.3 Shear
The horizontal bridge movement shall be taken as the max-imum possible deformation caused by creep, shrinkage, post-
1600
1400
a 1200
1000 C)
800 C)
600 C)
400
200
A
Shape factor 12 9,/I
50 durometer reinforced bearings 5
4
3
0 1 2 3 4 5 6 7
Compressive strain (%)
Figure 14.4.A.2A. Compressive stress vs. strain for 50 durometer steel-reinforced bearings.
44
Table 14.3.2. Low temperature zones and elastomer grades.
Low Temperature Zone A B C D E
50 Year Low Temperature 0 -20 -30 -45 All Others (degrees F)
Maximum number of days 3 7 14 N/A N/A below 32 degrees F
Low Temperature Elastomer Grade 0 2 3 4 5 Without Special Provisions
Low Temperature Elastomer Grade 0 0 2 3 5 With Special Provisions
minimum grade of elastomer required for each low temperature zone is specified in Table 14.3.2. The special provisions required in Table 14.3.2 are that either a positive slip apparatus be in-stalled and the bridge components shall be able to withstand forces arising from a bearing force equal to twice the design shear force or that the components of the bridge be able to resist the forces arising from a bearing force four times the design shear force as defined in Section 14.6.
14.4 Bearing Design Methods
14.4.A Design Method A
14.4.A.1 Compressive Stress
Unless shear deformation is prevented, the average compres-sive stress o, in any layer shall satisfy:
0 c.TL < GS/13 and °CTL 1,000 psi, for steel-reinforced bearings or 3c,TL 800 psi, for plain pads or fiberglass-reinforced
bearings
Figure 14.3.1. Map of low temperature zones.

1600
1400 U) a
1200 U) U)
! 1000 U,
w 800 >
600
CL
U)
400
200
A
Shape factor 12 g /
60 durometer reinforced bearings
4
3
I • I • I • I • I •
0 1 2 3 4 56 7
Compressive strain (%)
45
14.4.A.6 Reinforcement
The reinforcement shall be fiberglass or steel and its resistance in pounds per linear inch at working stress levels in each di-rection shall not be less than
1,400 h ri for fiberglass
1,700 hri for steel
For these purposes, hrj shall be taken as the mean thickness of the two layers of the elastomer bonded to the reinforcement if they are of different thicknesses. The resistance per linear inch is given by the product of the material thickness of the reinforcement and the allowable stress. The allowable stress shall be calculated taking into account fatigue loading but ignoring holes in the reinforcement. Holes shall be prohibited in fiber reinforcement. They are not recommended in steel reinforce-ment; but, if they exist, the steel thickness shall be increased by a factor (2 X gross width)/(net width).
14.4.B Method B Optional Design Procedure for Steel Reinforced Bearings
Bearings shall not be designed by the provisions of Section 14.4.13 unless they are subsequently tested in accordance with the requirements of Section 25.7 of Division II of this specifi-cation.
14.4.B.1 Compressive Stress
In any bearing layer, the average compressive stress shall satisfy:
for bearings subject to shear deformations
c.TL 1,600 psi
°c.TL 1.66 GS/f3
L.L 0.66 GS//3
for bearings fixed against shear deformations
0c.TL 1,600 psi
0c.TL 2.00 GS/$
0c,LL 1.00 GS//3
where /3 = 1.0 for internal layers and 1.4 for cover layers.
14. 4.B.2 Compressive Deflection
The compressive deflection, i, of the bearing shall be so limited as to ensure the serviceability of the bridge. Deflections due to total load and to live load alone shall be considered separately.
Instantaneous deflection shall be calculated as:
Ac = € cjh j -
tensioning, combined with thermal effects computed in accor-dance with Section 3.16 of the AASHTO Specification. The maximum shear deformation of the bearing, A, shall be taken as the horizontal bridge movement, modified to account for the pier flexibility and construction procedures. If a positive slip apparatus is installed, i need not be taken larger than the deformation corresponding to first slip.
The bearing shall be designed so that hrt >
14.4.A.4 Rotation
The rotational deformations about each axis shall be taken as the maximum possible rotation between the top and bottom of the bearing caused by initial lack of parallelism and girder end rotation. They shall be limited by:
°TL,x < 2I/L
and °TL.z < 2t/ W, for rectangular bearings
or j(0 2TL X + 02TL Z) :~ 2//D, for circular bearings
14.4.A.5 Stability
To ensure stability, the total thickness of the bearing shall not exceed the smallest of:
L/5, W/5, or D/6 for plain pads L/3, W/3, or D/4 for reinforced bearings
Figure 14.4.A.2B Compressive stress vs. strain for 60 Values for e, shall be obtained from design aids based on tests durometer steel-reinforced bearings, such as presented in Figures 14.4.A.2A and 14.4.A.2B, by testing
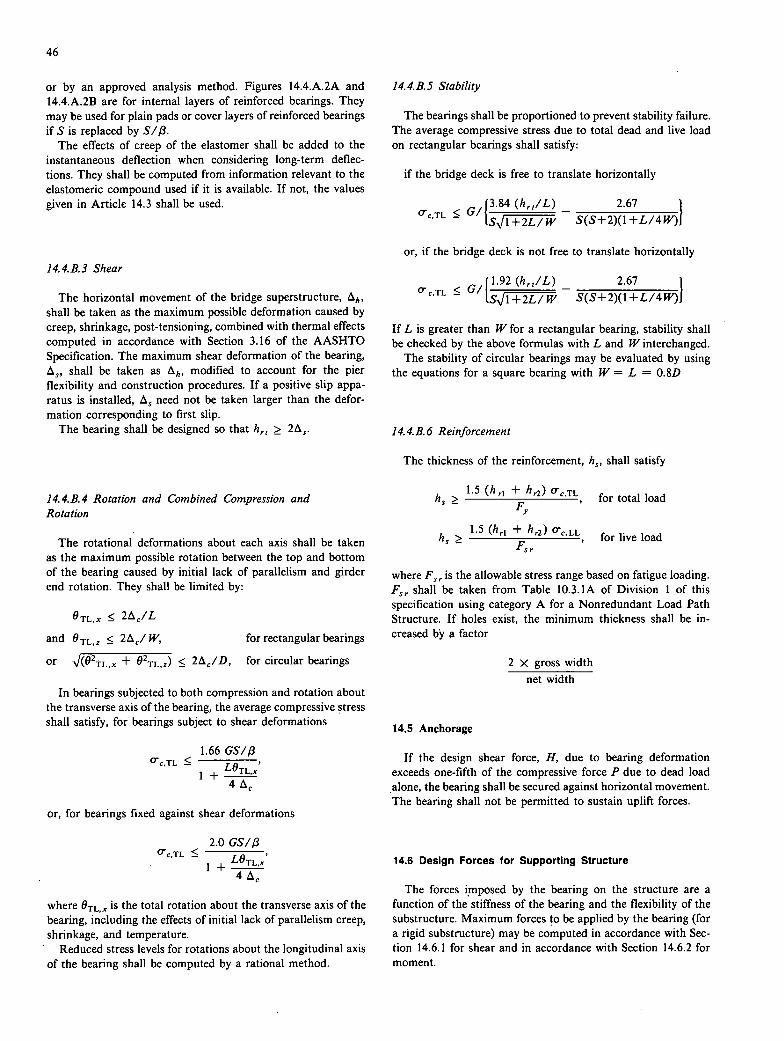
46
or by an approved analysis method. Figures 14.4.A.2A and 14.4.A.2B are for internal layers of reinforced bearings. They may be used for plain pads or cover layers of reinforced bearings if S is replaced by S/$.
The effects of creep of the elastomer shall be added to the instantaneous deflection when considering long-term deflec-tions. They shall be computed from information relevant to the elastomeric compound used if it is available. If not, the values given in Article 14.3 shall be used.
14.4.B.3 Shear
The horizontal movement of the bridge superstructure, Ah ,
shall be taken as the maximum possible deformation caused by creep, shrinkage, post-tensioning, combined with thermal effects computed in accordance with Section 3.16 of the AASHTO Specification. The maximum shear deformation of the bearing, i, shall be taken as Ah, modified to account for the pier flexibility and construction procedures. If a positive slip appa-ratus is installed, t need not be taken larger than the defor-mation corresponding to first slip.
The bearing shall be designed so that hrt >
14. 4.B. 4 Rotation and Combined Compression and Rotation
The rotational deformations about each axis shall be taken as the maximum possible rotation between the top and bottom of the bearing caused by initial lack of parallelism and girder end rotation. They shall be limited by:
°TL,x < 2L1/L
and 0TL,z :!~, 2C/ w, for rectangular bearings
or J(02TLx + 02TL0 !~ 21/D, for circular bearings
In bearings subjected to both compression and rotation about the transverse axis of the bearing, the average compressive stress shall satisfy, for bearings subject to shear deformations
1.66 GS/f3 c,TL :5 1 + LOTLX'
4
or, for bearings fixed against shear deformations
2.0 GS//3 e,TL
1 + TL,x
4
where 0TL,x is the total rotation about the transverse axis of the bearing, including the effects of initial lack of parallelism creep, shrinkage, and temperature.
Reduced stress levels for rotations about the longitudinal axis of the bearing shall be computed by a rational method.
14.4.B.5 Stability
The bearings shall be proportioned to prevent stability failure. The average compressive stress due to total dead and live load on rectangular bearings shall satisfy:
if the bridge deck is free to translate horizontally
[S.,rl 3.84 (hrt /L) 2.67
c.TL ~ G/ - S(S+2)(l+L/41
or, if the bridge deck is not free to translate horizontally
IS,fl-+l.92 (h
rj /L) 2.67 1c,TL ~ G/
— S(S+2)(l+L/4j
If L is greater than W for a rectangular bearing, stability shall be checked by the above formulas with L and W interchanged.
The stability of circular bearings may be evaluated by using the equations for a square bearing with W = L = 0.8D
14.4.B. 6 Reinforcement
The thickness of the reinforcement, h, shall satisfy
1.5 (h r1 + hr2 ) c,TL
h> F,,
for total load
1.5 (hr1 + h) o c,LL
Fsr
where Fsr is the allowable stress range based on fatigue loading. Fsr shall be taken from Table 10.3.1A of Division 1 of this specification using category A for a Nonredundant Load Path Structure. If holes exist, the minimum thickness shall be in-creased by a factor
2 X gross width net width
14.5 Anchorage
If the design shear force, H, due to bearing deformation exceeds one-fifth of the compressive force P due to dead load alone, the bearing shall be secured against horizontal movement. The bearing shall not be permitted to sustain uplift forces.
14.6 Design Forces for Supporting Structure
The forces imposed by the bearing on the structure are a function of the stiffness of the bearing and the flexibility of the substructure. Maximum forces to be applied by the bearing (for a rigid substructure) may be computed in accordance with Sec-tion 14.6.1 for shear and in accordance with Section 14.6.2 for moment.
h5 > for live load

14.6.1 Shear Force
If a positive slip apparatus is installed, H shall be taken as the largest force which can be transmitted by the apparatus. If no positive slip apparatus is installed, the design shear force shall be taken as not less than H = GA A h /hrf , where 'h is the horizontal movement of the bridge superstructure relative to conditions when the bearing is undeformed and G is the shear modulus of the elastomer at 73°F.
14.6.2 Moment
The moment induced by bending of a rectangular bearing about an axis parallel to its long side shall be taken as not less than M = (0.5E) I OTL,x/hrl, where I = WL 3 / 1 2.
14.7 Stiffeners for Steel Beams and Girders
The flanges of steel members seated on elastomeriç bearings must be flexurally stiff enough not to risk damage to the bearing. Any necessary stiffening may be accomplished by means of a sole plate or vertical stiffeners. The stiffening requirements of this section do not replace any others in this specification, but should be read in conjunction with them.
Single-webbed beams and girders symmetric about their minor (vertical) axis and placed symmetrically on the bearing need no additional stiffening if
.L< 2t1 V:3.4yi,
where b1 = total flange width, t. = thickness of flange or combined flange and sole plate, and Fyg = yield stress of the girder steel.
14.8 Provisions for Installation Effects
Allowance shall be made during design for misalignment in bridge girders due to fabrication and erection tolerance, camber, and other sources. The bearings shall be located and installed in such a way as to permit subsequent replacement.
47
14.2 Definitions
The shape factor, S, is defined in terms of the gross bearing plan dimensions. Refinements to account for the difference be-tween them and the dimensions of the reinforcement are not warranted because quality control on elastomer thickness has a more dominant influence on bearing behavior. Holes are for-bidden in fabric-reinforced bearings and are strongly discour-aged in steel-reinforced bearings. However, if they exist, their effect should be accounted for when calculating the shape factor because they reduce the loaded area and increase the area free to bulge. Suitable formulas are:
LW - d,2
S = t[2L + 2W + d.]' for rectangular bearings
- I d 2
S = At[D + for circular bearings
where di is the diameter of the ith hole in the bearing in inches. The modifying factor, /3, is introduced because the elastomer
in plain pads or the outside layers of reinforced bearings is restrained laterally by friction rather than bonding, and, except in bearings with impractically small shape factors, some slip occurs, causing more vertical deflection and higher shear stresses in the elastomer than would occur with fully bonded layers. The proposed provisions imply that a plain pad of shape factor S behaves like a reinforced bearing of shape factor S/1.8. The precise value of /3 depends on the friction at the interface be-tween the elastomer and load surface. The frictional resistance varies widely, but /3 = 1.8 is representative of practical plain pad applications.
The compressive stress allowed by design Method A (Section 14.4.A. 1) is now expressed as a single function of 5/13 for all bearings, but use of the appropriate value of /3 causes the al-lowable stress on a plain pad to be 56 percent of that of a reinforced bearing layer of the same dimensions if it is limited by GS//3. Cover layers of reinforced bearings are treated sim-ilarly except that /3 = 1.4. Design Method B (Section 14.4.13) covers only steel reinforced bearings, for which /3 = 1.0 (internal layers) or /3 = 1.4 (outer cover layers).
The increased computed deflection and the lower allowable stress resulting from the /3 factor are supported by theory and tests, and have parallels in many foreign codes.
The previous explicit restrictions on compressive strain no longer apply, but the new stress limits effectively control the strain as well.
COMMENTARY—SECTION 14
14.1 General
Two design methods are included. Method A is generally simpler but results in more conservative designs. Bearings de-signed according to Method B will generally be more highly stressed but are subject to more stringent test requirements.
Tapered layers are expressly prohibited because they cause larger shear strains, and bearings made with them fail prema-turely because of delamination or rupture of the reinforcement.
14.3 Material Properties
Shear modulus, G, is the single most important material prop-erty for design, and it is therefore the preferred means of spec-ifying the elastomer. Hardness has been widely used in the past because the test for it is quick and simple. However, the results obtained from it are variable and correlate only loosely with shear modulus, and the ranges given in Table 14.3.1 represent the variations to be found in practice. If the material is specified by hardness, a safe estimate of G must be taken for each of the design calculations. This would require, for example, taking the

48
lowest G from the range when calculating the compressive ca-pacity of the bearing, but the highest value when calculating the shear force on the pier. Specifying the material by hardness thus imposes a slight penalty in design.
Materials with a nominal hardness greater than 60 are pro-hibited for laminated bearings because they generally have a smaller elongation at break, greater stiffness and greater creep than their softer counterparts. (Their fatigue behavior does not differ in a clearly discernible way from that of softer materials). This inferior performance is generally attributed to the larger amounts of filler present. Plain pads up to 70 nominal hardness are permitted because of their satisfactory use in the past, but they do impose larger shear forces on the substructure. Their use is consequently discouraged.
Shear modulus increases as the elastomer cools, but the stiff-ening depends on both time and temperature in a complicated manner and by an amount which varies widely among materials. It is therefore important to specify and use a material with low temperature properties that are appropriate for the bridge site. The bridge site should be classified as being in one of the five zones A—E, according to the definitions in Table 14.3.2. In order of preference, the low temperature classification should be based on the 50-year temperature history at the site, a statistical anal-ysis of a shorter temperature history, or Figure 14.3.1. Table 14.3.2 gives the minimum elastomer grade to be used in each zone. Higher grades may be specified by the engineer if desired, but improvements in low temperature performance can often be obtained only at the cost of reductions in other properties. The definitions and tests for the elastomer grades, which are based on ASTM D2000, are given in Section 25 of this speci-fication.
Creep varies from one compound to another and is generally more prevalent in harder elastomers, but is seldom a problem if high quality materials are used in reinforced bearings. This is particularly true because the deflection limits are based on serviceability and are likely to be controlled by live load rather than total load. The values given in Table 14.3.2 are represen-tative of Neoprene, and are conservative for natural rubber. Creep is much larger for some other elastomers such as butyl rubber. Field experience and tests suggest that plain pads creep more than reinforced bearings, and that variable (i.e., dynamic) compressive loads exacerbate the effect. This is attributed to increased slip at the interface.
14.4.A.] Compressive Stress
The loads which can be safely placed on most structural elements are so defined as to prevent both instability and ma-terial distress to any of the materials of which they are made. The previous stress limits for elastomeric bearings did not do this, but the proposed ones attempt to.
Elastomers are virtually indestructible when subjected to hy-drostatic compression, and so tensile and shear stresses and strains control the design. These arise from imposed compression and rotation (which cause bulging of the elastomer) and from shear. Shear strains in the elastomer cause diagonal tension strains, which must be kept to some fraction of the elastomer's tension strain capacity. Both fatigue and static load must be considered.
The primary mode of failure in the elastomer is that shearing
stresses near the edge of the bearing cause delamination from the reinforcement. These stresses are restricted to levels that will not cause serious damage by limiting the applied compres-sive stress. The relationship between the shear stress and the applied compressive load depends directly on shape factor, with higher shape factors leading to higher capacities. The compres-sive limits were derived from static and dynamic (fatigue) tests, the results of which were correlated with theory. In each test, delamination was very localized and small to start with, but gradually increased and spread as the load (or the number of cycles, in the fatigue tests) was increased. There was tremendous scatter in the stress at which it started in different tests, both fatigue and static. Fatigue behavior in any material depends strongly on the distribution of microscopic flaws, so the scatter is to be expected, particularly in view of the stress concentration in the bond that happens at the edge of the reinforcement. The limits set here were therefore chosen as a fraction of that com-pressive stress which caused a damage level that was judged to be acceptably small.
The 1,600 psi limit came from static tests: no previously untested bearing started to delaminate until it had reached a stress of at least 1.5 times this value. The limits for live load and total load in terms of GS//3 address delamination due to fatigue loading in compression.
European codes generally define shear strains from all causes and place a limit on their sum. That limit is in some cases a fraction of the elastomer's elongation at break and in others a constant for all elastomers. The proposed Design Method A is less explicit, but, by limiting the average compressive stress to a proportion of GS and setting values for permissible simulta-neous rotation and shear deformation, the maximum tensile strain is limited implicitly. As an example, a square laminated bearing with the maximum allowable compression, rotation, and shear would cause a peak tensile strain in the rubber of ap-proximately 220 percent, or 63 percent of the minimum elon-gation at break specified by AASHTO for 60-durometer materials.
14. 4.A.2 Compressive Deflection
Limiting instantaneous deflections may be important to en-sure that deck joints and seals are not damaged. Furthermore, bearings that are too flexible in compression could cause a small step in the road surface at a deck joint when traffic passes from one girder to the other, giving rise to impact loading. A max-imum relative deflection across a joint of I/ in. is suggested. Joints and seals that are sensitive to relative deflections may require limits that are tighter than this. Long-term deflections should be accounted for as well when considering joints and seals between sections of the bridge which rest on bearings of different design, and when estimating redistribution of forces in continuous bridges caused by support settlement. Provided high quality materials are used, the effects of creep are unlikely to cause problems.
Predictions of total compressive deflections are inherently somewhat unreliable because bedding-in effects obscure the true zero for deflection. To overcome this problem when design aids are constructed from test results, the measured stress-strain curves are often shifted along the strain axis so that they satisfy some arbitrary criterion, such as linearly projecting the curves
49
below 250 psi and making all such projections pass through a common zero.
In practice, the change in deflection due to live load is likely to be more important than the total deflection, and it can be reliably predicted either by design aids based on test results or by using theoretically based equations. In the latter case, it is important to include the effects of bulk compressibility of the elastomer, especially for high shape factor bearings.
14.4.A.3 Shear
In concrete bridges, the greatest movement is likely to be shortening because of the influence of shrinkage and creep. If the bridge girders are lifted to allow the bearings to spring back after some of the girder shortening has occurred, that may be accounted for in design. A i represents the best estimate of the shear deformation that the bearing will undergo. This should be limited to + / —0.5 hrj in order to avoid rollover at the edges and delamination due to fatigue problems. It should be noted that A, which is the basis for calculating the required elastomer thickness, is different from and smaller than Ah, on which the Design Shear Force for the substructure is based.
The shear provisions were based on fatigue tests conducted to 20,000 cycles, which represent one expansion/contraction cycle per day for approximately 55 years. The results will there-fore be unconservative if the shear deformation is caused by high cycle loading due to braking forces or vibration. The max-imum shear deformation due to these high cycle loadings should be restricted to no more than +/-0.l0 hrj unless better in-formation is available. At this strain amplitude, the experiments showed that the bearing has an essentially infinite fatigue life.
14.4.A.4 Rotation
Rotation may be accommodated either by deformation of the bearing or by attachment of a rocking device. If the bearing deforms, the compressive stress on it is reduced on one side and increased on the other. The compressive stress limits of Section 14.4.A.1 are adequate to prevent damage in compression: the limits on rotation given in this section imply no net upwards displacement of any point on the bearing in order to prevent tension strains occurring. This is necessary because reversal of strain in the elastomer significantly reduces its fatigue life.
The corner of a rectangular bearing has the greatest potential for uplift because it is affected by rotations about both axes. However, the stresses there, which are due to compression, are negligible, so the critical location is at the middle of each side. Rotation limits are therefore presented for each axis separately. In circular bearings, the most severe effect is found by adding the rotations vectorially.
Rotations from all sources must be considered, including those arising from construction tolerances on lack of parallelism be-tween the bearing seat and underside of the girder. The latter can be corrected, for example, either by means of taped sole plates or a thin gout bed; otherwise, an allowance for their effects must be included in the estimate of total rotation.
Ordinarily, bearings should be oriented so that rotation occurs about their long axes, because rotation about their short axes causes higher stresses in the elastomer.
14.4.A.5 Stability
A reinforced bearing is relatively stiff in rotation and flexible in shear, causing its buckling load to be significantly lower than that computed using the bending stiffness alone. Surprisingly, stocky bearings will fail by instability rather than material dis-tress. A buckling theory exists, and, if used in conjunction with additional assumptions, slenderness limits can be developed be-low which the effects of instability may be neglected. Reasonable agreement is obtained with the geometric proportions that have traditionally provided satisfactory bearings.
The thickness limit for reinforced bearings has been changed from W/2 to W/3 to reflect the increase in allowable stress and the possibility of shear deformation in the lateral direction.
14.4.A.6 Reinforcement
The reinforcement must be adequate to sustain the tensile stresses induced by compression of the bearing, which increase with compressive load. With the present load limitations (1,100 psi maximum), the minimum steel plate thickness practical for fabrication will usually provide adequate strength.
For bearings reinforced with layers of fiberglass fabric in which alternate elastomer layers are V8 in. and /8 in. thick, the provisions require that fabric reinforcing must be able to resist a working load of 350 lb/in.
Holes in the reinforcement cause stress concentrations that have a harmful effect, and so holes are discouraged. The required increase in steel strength to account for material removed when cutting holes is a separate issue from the stress concentration caused by the hole. Fiber reinforcement can carry no shear stress within its own plane and, therefore, the stresses in the reinforcement cannot spread around a hole in the same way possible with a plate, and holes are thus not permitted.
14.4.B Method B Optional Design Procedure for Steel Reinforced Bearings
The design method described in Section 14.4.11 is intended to allow for higher compressive stresses and more slender bearings, both of which can lead to smaller horizontal forces on the substructure. To qualify for the more liberal design, the bearing must be subjected to more rigorous testing. Indicating it on the plans signals that the more stringent tests are needed.
14.4.B.1 Compressive Stress
The 1,600 psi stress limit is intended to control delamination of the elastomer from the reinforcement under static load. De-lamination test results show tremendous scatter, but the 1,600 psi stress limit provides satisfactory results if it is combined with a limit on the shear strain.
The limits of 1.66 GS on total load and 0.66 GS on live load are intended to control fatigue cracking and delamination. They are based on the observation that fatigue cracking in experiments remained acceptably low if the maximum shear strain due to total dead and live load was kept below 3.0 and the maximum.

50
shear strain range for cyclic loading was kept below 1.5. The level of damage considered acceptable had to be selected arbi-trarily; therefore, the limits are not clear-cut.
Two limits are given, one for total load and one for live load, and the more restrictive one will control.
Increases in the load to simulate the effects of impact are not required. This is because the impact stresses are likely to be only a small proportion of the total load, and also because the stress limits are based on fatigue damage, the limits of which are not clear-cut. Furthermore, the impact fraction defined in Section 3.8.2 of this specification does not represent the effective load increase on a bearing.
14.4.B.2 Compressive Deflection
The provisions of this section are identical to those of Section 14.4.A.2.
14.4.B.3 Shear
The provisions of this section are identical to those of Section 14.4.A.3.
sible and the second formula should be used. This freedom to move horizontally should be distinguished from the question of whether the bearing is subject to shear deformations (relevant to Sections 14.4.B.3 and 14.4.B.4). In a bridge that is fixed at one end, the bearings at the other end will be subject to imposed shear deformation, but will not be free to translate in the sense relevant to buckling.
14.4.B. 6 Reinforcement
The equations determine the reinforcement thickness required for strength. The minimum thickness for good quality fabri-cation should be obtained from the fabricator, but should be at least '/16 in.
14.5 Anchorage
The friction coefficient between elastomers and mating sur-faces varies with compressive stress and surface type. However, the 0.2 implicit here represents a practical approximate value.
14.4.B.4 Rotation and Combined Compression and Rotation
The uplift provisions are identical to those of Section 14.4.A.4. The two limitations given on compressive stresses are based
on limiting the total shear strain due to compression, rotation, and shear. The limits are the 3.0 and 1.5 described in Section 14.4.B.l. The equations are simplified by the observation that the maximum shear strain due to rotation is relatively insensitive to the aspect ratio of the bearing if the bearing is rotated about its longer axis. If rotation occurs about the short axis, the equa-tions given in 14.4.B.4 may not be conservative, and the strains must be computed by a rational analysis.
14.4.B.5 Stability
The average compressive stress is limited here to half the predicted buckling stress. The latter is calculated using the buck-ling theory developed by Gent, modified to account for changes in geometry during compression and calibrated against exper-imental results. This provision will permit taller bearings and reduced shear forces compared to those permitted under pre-vious specifications.
These provisions are different from those in the earlier pro-posal for Design Method B. The earlier ones were based directly on the work of Gent, and prove very conservative for low bearings. The formulas presented here were based on test results that were correlated with a modified version of Gent's analysis.
The first formula corresponds to buckling in a sidesway mode and is relevant for bridges in which the deck is not rigidly fixed against horizontal translation at any point. This may be the case in many bridges for transverse translation (perpendicular to the longitudinal axis). If one point on the bridge is fixed against horizontal movement, the sidesway buckling mode is not pos-
14.6 Design Forces for Supporting Structure
The forces transmitted between the substructure and super-structure through the bearing are needed for design of those elements. The shear forces are a function of the stiffnesses of the different components and of the loads and deformations that act on them. Because the stiffness of the bearings depends on temperature and time, an exact analysis is both difficult and too time-consuming for everyday use.
A rational analysis for shear should take into account the force-deformation characteristics of the superstructure, the sub-structure (including pier and foundation flexibility) and the bear-ing. The bearing stiffness is influenced by both instantaneous thermal stiffening and low-temperature crystallization stiffening, of which the latter depends strongly on time and temperature. However, crystallization is partially reversed by the application of mechanical work, such as when the bearing undergoes shear deformations. Elastomers also relax with time, so this, too, must be taken into account. Relaxation is more pronounced at low temperatures. The temperature of the bearing must be estab-lished when evaluating these effects, and the calculation of it must take into account the extent of exposure to heating and cooling sources as well as the bearing's thermal mass. (Bearings are often shaded from the sun.)
In lieu of such an analysis, a simple but approximate design equation is presented. The equation is based on the results of a one month long test in which the temperature and deformation were functions of time in order to simulate the true environ-mental conditions at a bridge site, and on detailed analyses of behavior of elastomers at low temperature and temperature his-tories at selected cities in the United States. This study indicated that a bearing designed by the methods proposed here, which satisfies the low temperature material requirements of Section 25 of Division II, will develop a maximum force of approxi-mately 1.5 times the Design Shear Force specified in Section

51
14.7 once or twice in a 50-year period. The 1.5 times the Design Shear Force is therefore equivalent to a factored load, and, if the load factor is taken as 1.5, the force defined in Section 14.7 is then a rational choice for a service-level Design Shear Force.
If a positive slip apparatus, such as a PTFE slider, is used, the force may be taken as the maximum which the apparatus can transmit. This force should be evaluated in a way that takes into account the expected conditions. (For example, the coef-ficient of friction may be sensitive to lubrication or low tem-perature.)
A rational analysis for moment could be performed, for ex-ample, using the Finite Element Method. The approximate for-mula given for moment does not apply for rotation about the
bearing's strong axis. The bearings should preferably be oriented so that moments do not occur about this axis.
14.8 Provisions for Installation Effects
Allowance must be made in design of the bearings for stresses and deformations introduced by some components being not exactly as specified, even though they are within specified tol-erances. Examples are rotation of the bearing due to out-of-level of the underside of the steel or precast concrete girder, or un-equal loading on two bearings supporting a box girder caused by shrinkage or asymmetric thermal effects.
APPENDIX B
RECOMMENDED AASHTO CONSTRUCTION SPECIFICATION AND COMMENTARY
SECTION 25—ELASTOMERIC BEARINGS
25.1 Scope
Elastomeric bearings as herein defined shall include unrein-forced pads (consisting of elastomer only) and reinforced bear-ings with steel or fabric laminates.
25.2 General Requirements
Bearings shall be furnished with the dimensions, material properties, elastomer grade and type of laminates required by the plans. The Design Method (A or B) and the design load shall also be shown on the plans and testing shall be performed accordingly. In the absence of more specific information, bear-ings shall be Grade 3, 60-durometer elastomer, and steel rein-forced, and shall be subjected to the load testing requirements corresponding to Method A design.
25.3 Materials
25.3.1 Properties of the Elastomer
The raw elastomer shall be either virgin Neoprene (poly-chloroprene) or virgin natural rubber (polyisoprene). The elas-tomer compound shall be classified as being of low temperature grade 0, 2, 3, 4, or 5. The grades are defined by the testing requirements in Tables 25.3.1A and 25.3.113. A higher grade of elastomer may be substituted for a lower one.
The elastomer compound shall meet the minimum require-ments of Tables 25.3. 1A and B except as otherwise specified by the Engineer. Test requirements may be interpolated for inter-mediate hardnesses. If the material is specified by its shear modulus, its measured shear modulus shall lie within 15 percent
of the specified value. A consistent value of hardness shall also be supplied for the purpose of defining limits for the tests in Tables 25.3. 1A and B. If the hardness is specified, the measured shear modulus must fall within the range of Table 14.2.2A in Section 14.2.2 of Division I. When test specimens are cut from the finished product, the physical properties shall be permitted to vary from those specified in Tables 25.3.1A and B by 10 percent. All material tests shall be carried out at 73°F ± 4°F (23°C ± 2°C) unless otherwise noted. Shear modulus tests shall be carried out using the apparatus and procedure described in annex A of ASTM D4014.
25.3.2 Steel Laminates
Steel laminates used for reinforcement shall be made from rolled mild steel conforming to ASTM A36, A570, or equivalent, unless otherwise specified by the Engineer. The laminates shall have a minimum nominal thickness of 16 gage. Holes in plates for manufacturing purposes will not be permitted unless they have been accounted for in the design, as shown on the plans.
25.3.3 Fabric Reinforcement
Fabric reinforcement shall be woven from 100 percent glass fibers of "E" type yarn with continuous fibers. The minimum thread count in either direction shall be 25 threads per inch (10 threads per cm). The fabric shall have either a crowfoot or an 8 Harness Satin weave. Each ply of fabric shall have a minimum breaking strength of 800 lb/in. (140 KN/m) of width in each thread direction. Holes in the fabric will not be permitted.
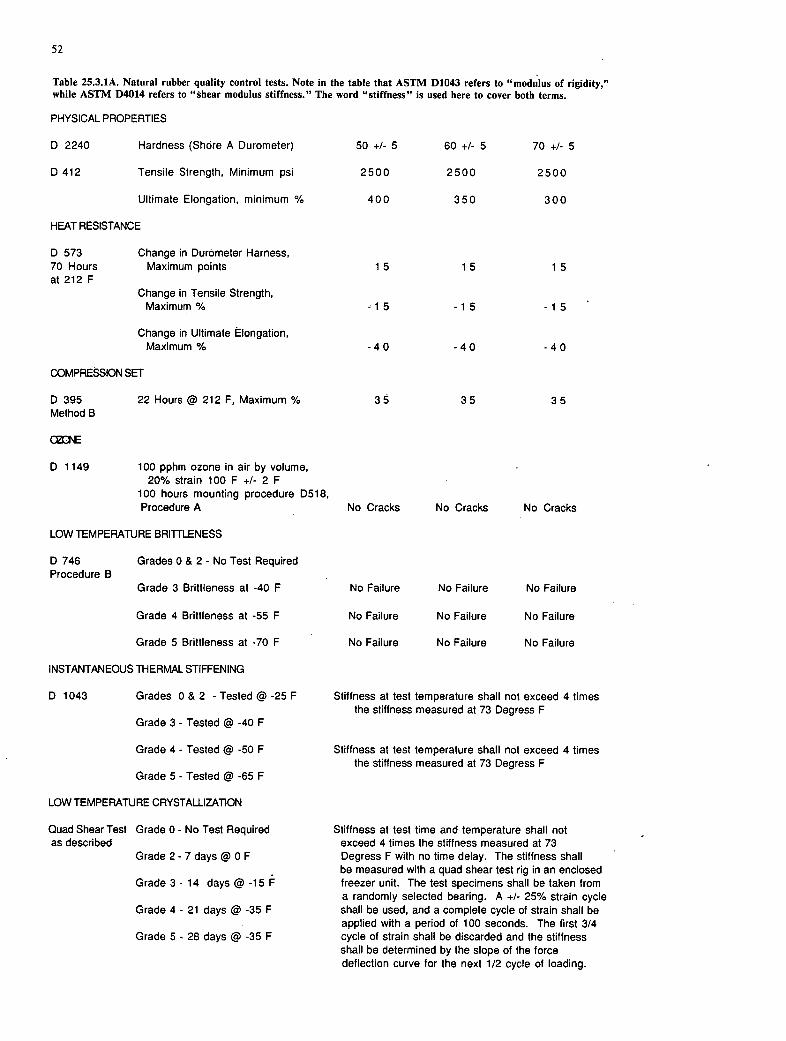
52
Table 25.3.1A. Natural rubber quality control tests. Note in the table that ASTM D1043 refers to "modulus of rigidity," while ASTM D4014 refers to "shear modulus stiffness." The word "stiffness" is used here to cover both terms.
PHYSICAL PROPERTIES
D 2240 Hardness (Shore A Durometer) 50 +1- 5 60 +1- 5 70 +1- 5
D 412 Tensile Strength, Minimum psi 2500 2500 2500
Ultimate Elongation, minimum % 400 350 300
HEAT RESISTANCE
D 573 Change in Durometer Harness, 70 Hours Maximum points 1 5 15 1 5 at 212 F
Change in Tensile Strength, Maximum % -- 1 5 - 1 5 - 1 5
Change in Ultimate Elongation, Maximum % -40 -40 -40
COMPRESSION SET
D 395 22 Hours @ 212 F, Maximum %
35 35 35 Method B
D 1149 100 pphm ozone in air by volume, 20% strain 100 F +1- 2 F
100 hours mounting procedure D518, Procedure A
No Cracks No Cracks No Cracks
LOW TEMPERATURE BRI1TLENESS
D 746 Grades 0 & 2 - No Test Required Procedure B
Grade 3 Brittleness at -40 F
No Failure No Failure No Failure
Grade 4 Brittleness at -55 F
No Failure No Failure No Failure
Grade 5 Brittleness at -70 F
No Failure No Failure No Failure
INSTANTANEOUS ThERMAL STIFFENING
D 1043 Grades 0 & 2 - Tested @ -25 F
Stiffness at test temperature shall not exceed 4 times the stiffness measured at 73 Degress F
Grade 3 - Tested @ -40 F
Grade 4 - Tested @ -50 F
Stiffness at test temperature shall not exceed 4 times the stiffness measured at 73 Degress F
Grade 5 - Tested @ -65 F
LOW TEMPERATURE CRYSTAWZATION
Quad Shear Test Grade 0 - No Test Required
Stiffness at test time and temperature shall not as described
exceed 4 times the stiffness measured at 73 Grade 2 - 7 days @ 0 F
Degress F with no time delay. The stiffness shall be measured with a quad shear test rig in an enclosed
Grade 3 - 14 days @ -15 F
freezer unit. The test specimens shall be taken from a randomly selected bearing. A +1- 25% strain cycle
Grade 4 - 21 days @ -35 F
shall be used, and a complete cycle of strain shall be applied with a period of 100 seconds. The first 3/4
Grade 5 - 28 days @ -35 F
cycle of strain shall be discarded and the stiffness shall be determined by the slope of the force deflection curve for the next 1/2 cycle of loading.

53
Table 25.3.1B. Neoprene quality control tests. Note inthe table that ASTM D1043 refers to "modulus of rigidity," while ASTM D4014 refers to "shear modulus stiffness." The word "stiffness" is used here to cover both terms.
PHYSICAL PROPERTIES
D 2240 Hardness (Shore A Durometer) 50 +1- 5 60 +1- 5 70 +1- 5
D 412 Tensile Strength, Minimum psi 2500 2500 2500
Ultimate Elongation, minimum % 450 400 300
HEAT RESISTANCE
D 573 Change in Durometer Harness, 70 Hours Maximum points 10 10 10 at 158 F
Change in Tensile Strength, Maximum% -25 -25 -25
Change in Ultimate Elongation, Maximum% -25 -25 -25
COMPRESSION SET
D 395 22 Hours @ 158 F, Maximum % Method B
CODNE
D 1149 25 pphm ozone in air by volume, 20% strain 100 F +1- 2 F
48 hours mounting procedure D518, Procedure A
LOW TEMPERATURE BRI11LENESS
D 746 Grades 0, 2 - No Test Required Procedure B
Grade 3 Brittleness at -40 F
Grade 4 Brittleness at -55 F
Grade 5 Brittleness at -70 F
INSTANTANEOUS THERMAL STIFFENING
D 1043 Grades 0 & 2 - Tested @ -25 F
Grade 3 - Tested @ -40 F
Grade 4 - Tested @ -50 F
Grade 5 - Tested @ -65 F
LOW TEMPERATURE CRYSTALLIZATION
Quad Shear Test Grade 0 - No Test Required as described
in annex A of Grade 2 - 7 days @ 0 F ASTM D4014
Grade 3 - 14 days @ -15 F
Grade 4 - 21 days @ -35 F
Grade 5 - 28 days @ -35 F
25 25 25
No Cracks No Cracks No Cracks
No Failure No Failure No Failure
No Failure No Failure No Failure
No Failure No Failure No Failure
Stiffness at test temperature shall not exceed 4 times the stiffness measured at 73 Degress F
Stiffness at test time and temperature shall not exceed 4 times the stiffness measured at 73 Degréss F with no time delay. The stiffness shall be measured with a quad shear test rig in an enclosed freezer unit. The test specimens shall be taken from a randomly selected bearing. A +1- 25% strain cycle shall be used, and a complete cycle of strain shall be applied with a period of 100 seconds. The first 3/4 cycle of strain shall be discarded and the stiffness shall be determined by the slope of the force deflection curve for the next 1/2 cycle of loading.

54
25.3.4 Bond
The vulcanized bond between fabric and reinforcement shall have a minimum peel strength of 30 lb/in. (5.2 KN/m). Steel laminated bearings shall develop a minimum peel strength of 40 lb/in. (6.9 KN/m). Peel strength tests shall be performed by ASTM D429 Method B.
25.4 Fabrication
Bearings with steel laminates shall be cast as a unit in a mold and shall be bonded and vulcanized under heat and pressure. The mold finish shall conform to standard shop practice. The internal steel laminates shall be sandblasted and cleaned of all surface coatings, rust, mill scale, and dirt before bonding, and shall be free of sharp edges and burrs. External load plates (sole plates) shall be protected from rusting by the manufacturer, and preferably shall be hot bonded to the bearing during vul-canization. Bearings that are designed to act as a single unit with a given shape factor must be manufactured as a single unit.
Fiberglass-reinforced bearings may be vulcanized in large sheets and cut to size. Cutting shall be performed in such a way as to avoid heating the materials and shall produce a smooth finish with no separation of the fiberglass from the elastomer. Fiberglass reinforcement shall be at least single ply for the top and bottom reinforcement layers and double ply for internal reinforcement layers. Fiberglass shall be free of folds and ripples and shall be parallel Co the top and bottom surfaces.
Plain pads may be molded, extruded, or vulcanized in large sheets and cut to size. Cutting shall not heat the material, and shall produce a smooth finish.
Flash tolerance, finish, and appearance shall meet the re-quirements of the latest edition of the Rubber Handbook, pub-lished by the Rubber Manufacturers Association, Inc., RMA F3 and T.063 for molded bearings and RMA F2 for extruded bearings.
25.5 Fabrication Tolerances
Plain pads and laminated bearings shall be built to the spec-ified dimensions within the following tolerances:
Overall Height Design Thickness l/4 in. (32 mm) or less —0, +'/ in. (-0, +3 mm) Design Thickness over —0, + V4 in. (-0, + 6 mm) 11/4 in. (32 mm)
Overall Horizontal Dimensions 36 in. (0.914 m) or less —0, +1/4 in. (-0, +6 mm) Over 36 in. (0.914 m) —0, +'/2 in. (-0, +12 mm)
Thickness of Individual Layers of Elastomer (Laminated Bearings Only) At any point within the ± 20% of design value but no bearing more than ± 1/8 in. (± 3 mm)
Parallelism with Opposite Face Top and bottom 0.005 radians Sides 0.02 radians
Position of Exposed Connection Members Holes, slots or inserts ± Y8 in. (± 3 mm)
Edge Cover Embedded laminates or connection members —0, +'/8 in. (-0, +3 mm)
Thickness —0, the smaller of Top and bottom cover + '/16 in. (1.5 mm) and layers (if required) + 20% of the nominal
cover layer thickness
Size Holes, slots, or inserts ± '/8 in. (± 3 mm)
25.6 Marking and Certification
The manufacturer shall certify that each bearing satisfies the requirements of the plans and these specifications, and shall supply a certified copy of material test results. Each reinforced bearing shall be marked in indelible ink or flexible paint. The marking shall consist of the orientation, the order number, lot number, bearing identification number, and elastomer type and grade number. Unless otherwise specified in the contract doc-uments, the marking shall be on a face that is visible after erection of the bridge.
25.7 Testing
25.Z1 Scope
Materials for elastomeric bearings and the finished bearings themselves shall be subjected to the tests described in this sec-tion. Material tests shall be in accordance with the appropriate Table 25.3.1A or Table 25.3.113.
25.72 Frequency of Testing
The ambient temperature tests on the elastomer described in Section 25.7.3 shall be conducted for the materials used in each lot of bearings. In lieu of performing a shear modulus test for each batch of material, the manufacturer may elect to provide certificates from tests performed on identical formulations within the preceding year, unless otherwise specified by the Engineer. Test certificates from the supplier shall be provided for each lot of reinforcement.
The three low temperature tests on the elastomer described in Section 25.7.4 shall be conducted on the material used in each lot of bearings for grades 3, 4, and 5 material and the instantaneous thermal stiffening test shall be conducted on ma-terial of grades 0 and 2. For grade 3 material, in lieu of the low temperature crystallization test, the manufacturer may choose to provide certificates from low-temperature crystallization tests
55
performed on identical material within the last year, unless otherwise specified by the Engineer. Low temperature brittleness and crystallization tests are not required for grades 0 and 2 materials, unless especially requested by the Engineer.
Every finished bearing shall be visually inspected in accor-dance with Section 25.7.5.
Every steel reinforced bearing shall be subjected to the short-term load test described in Section 25.7.6.
From each lot of bearings either designed by Method B of Section 14.4, Division I of this specification or made from grade 4 or grade 5 elastomer, a random sample shall be subjected to the long-term load test described in Section 25.7.7. The sample shall consist of at least one bearing chosen randomly from each size and material batch and shall comprise at least 10 percent of the lot. If one bearing of the sample fails, all the bearings of that lot shall be rejected, unless the manufacturer elects to test each bearing of the lot at his expense. In lieu of this procedure, the Engineer may require every bearing of the lot to be tested.
The Engineer may require shear stiffness tests on material from a random sample of the finished bearings in accordance with Section 25.7.8.
25.73 Ambient Temperature Tests on the Elastomer
The elastomer used shall at least satisfy the limits prescribed in the appropriate Table 25.3. 1A or B for durometer hardness, tensile strength, ultimate elongation, heat resistance, compres-sion set, and ozone resistance. The bond to the reinforcement, if any, shall also satisfy Section 25.3.4. The shear modulus of the material shall be tested at 73°F using the apparatus and procedure described in annex A of ASTM D4014. It shall fall within 15 percent of the specified value, or within the range for its hardness given in Section 14.3 of Division I if no shear modulus is specified.
25.7.4 Low Temperature Tests on the Elastomer
Grades 3, 4, and 5 elastomers shall be subjected to low tem-perature brittleness tests (ASTM D746), instantaneous low tem-perature stiffness tests (ASTM D 1043), and low temperature crystallization tests (ASTM D4014). Grades 0 and 2 elastomers shall be subjected to instantaneous low temperature stiffness tests (ASTM D1043). The tests shall be performed in accor-dance with the requirements of Tables 25.3. 1A and B and the compound shall satisfy all limits for its grade.
25.7.5 Visual Inspection of the Finished Bearing
Every finished bearing shall be inspected for compliance with dimensional tolerances and for overall quality of manufacture. In steel reinforced bearings, the edges of the steel shall be pro-tected everywhere from corrosion.
25. 7.6 Short-Duration Compression Tests on Bearings
The bearing shall be loaded in compression to 1.5 times its maximum design load. The load shall be held constant for 5 mm, removed, and reapplied for another 5 mm. The bearing shall be examined visually while under the second loading. If the bulging pattern suggests laminate parallelism or a layer thickness that is outside the specified tolerances, or poor lam-inate bond, the bearing shall be rejected. If there are three or more separate surface cracks that are greater than 0.08 in. (2 mm) wide and 0.08 in. (2 mm) deep, the bearing shall be rejected.
25.7 7 Long-Duration Compression Tests on Bearings
The bearing shall be loaded in compression to 1.5 times its maximum design load for a minimum period of 15 hours. If, during the test, the load falls below 1.3 times the maximum design load, the test durtion shall be increased by the period of time for which the load is below this limit. The bearing shall be examined visually at the end of the test while it is still under load. If the bulging pattern suggests laminate parallelism or a layer thickness that is outside the specified tolerances, or poor laminate bond, the bearing shall be rejected. If there are three or more separate surface cracks that are greater than 0.08 in. (2 mm) wide and 0.08 in. (2 mm) deep, the bearing shall be rejected.
25.7.8 Shear Modulus Tests on Material from Bearings
The shear modulus of the material in the finished bearing shall be evaluated by testing a specimen cut from it using the apparatus and procedure described in annex A of ASTM D4014, or, at the discretion of the Engineer, a comparable nondestruc-tive stiffness test may be conducted on a pair of finished bearings. The shear modulus shall fall within 15 percent of the specified value, or within the range for its hardness given in Section 14.3 of Division I if no shear modulus is specified. If the test is conducted on finished bearings, the material shear modulus shall be computed from the measured shear stiffness of the bearings, taking due account of the influence on shear stiffness of bearing geometry and compressive load.
25.8 Installation
Bearings shall be placed on surfaces that are plane to within 1/16 in. and, unless the bearings are placed in opposing pairs, horizontal to within 0.01 radians. Any lack of parallelism be-tween the top of the bearing and the underside of the girder that exceeds 0.01 radians shall be corrected by grouting or as otherwise directed by the Engineer.
Exterior plates of the bearing shall not be welded unless at least IY2 in. of steel exists between the weld and the elastomer. In no case shall the elastomer or the bond be subjected to temperatures higher than 400°F (204°C).

56
COMMENTARY—SECTION 25
25.1 Scope
This specification does not cover pot bearings, bearings made from polymers other than virgin natural rubber (polyisoprene) or virgin Neoprene (polychioroprene), or mechanical bearings. AASHTO specification M251-74 does not apply to bearings designed in accordance with Section 14 of Division I and Section 25 of Division II of this specification.
25.2 General Requirements
The designer and the contractor must provide sufficient in-formation to permit manufacture and certification of the bearing. This requires additional information when a higher level cer-tification is required. The design load is required because it is needed in some of the test procedures.
25.3 Materials
25.3.1 Properties of the Elastomer
At present, only natural rubber (polyisoprene) and Neoprene (polychloroprene) are permitted. This is because both have an extensive history of satisfactory use. In addition, much more field experience exists with these two materials than with any other, and almost all of it is satisfactory.
The low-temperature grading system addresses the problem of stiffening of the elastomer at low temperatures. Special com-pounding and curing are needed to avoid the problem but they increase cost and in extreme cases may adversely affect some other properties. These adverse effects can be minimized by choosing a grade of elastomer appropriate for the conditions prevailing at the site. The grades follow the approach of ASTM D2000 and D4014, with more stringent low temperature test criteria for higher grades.
Tables 25.3. lA and B outline the required properties of the elastomer. The standards are sometimes different for Neoprene and natural rubber, which appears inconsistent because in some ways the requirements resemble a performance specification. However, the present state of knowledge is inadequate to pin down precisely those material properties needed to assure good bearing behavior, so the tests are intended to ensure good quality material. Natural rubber and Neoprene have different strengths and weaknesses, so different tests are indeed appropriate. (Gen-erally, natural rubber creeps less, suffers less low-temperature stiffening, and has a better elongation at break—but Neoprene has better chemical, ozone, and aging resistance.)
The previous low temperature brittleness test has been aug-mented by two other tests: the Clash-Berg test for low temper-ature stiffness (ASTM D1043) and a test for low temperature crystallization stiffening (the ASTM D4014 quad shear test conducted at low temperature). All three tests are required for elastomers of grade 3 and above. Previously, the brittleness test at —40°F was required for all elastomers, including those to be used in the southern tier states; yet, no test was required for thermal or crystallization stiffening, even in the northern tier states or Alaska.
The brittleness test essentially detects glass transition, but gives no indication of stiffening. The Clash-Berg test is intro-duced to detect instantaneous low temperature stiffening. It is quick to perform and requires only a modest investment in special equipment. Crystallization stiffening is both time- and temperature-dependent, but constitutes a significant portion of the total low temperature stiffening of many elastomers. De-tecting it is therefore important and is done by the long-duration shear stiffness test. In addition to the ASTM D4014 quad-shear apparatus, this test requires a freezer that surrounds the ap-paratus. Because of the nature of the crystallization, the test may take up to 28 days; therefore, it is not required for every lot of bearings.
Hardness is maintained as a material property because it is widely used in rubber technology and is easy to measure. How-ever, measurements are sensitive to the method used, and hard-ness generally gives only rough indication of mechanical properties, particularly at low temperatures. The shear modulus is a much more useful property, but is more time consuming to measure.
25.3.2 Steel Laminates
It is intended that a mild steel of a well-defined ASTM Stan-dard be used. However, no single suitable ASTM grade is avail-able in thicknesses both less than and greater than '/ in. The minimum thickness is intended to ensure that the steel will not deform excessively during sandblasting or molding of the bear-ing. For large bearings, thicknesses greater than 16 gage may be needed for this purpose, and individual manufacturers should be consulted. In many cases, use of the minimum thickness will ensure satisfaction of Section 14.4.A.6 and 14.4.B.6 of Division I.
25.3.3 Fabric Reinforcement
Fiberglass is the only fabric proven to perform adequately as reinforcement, and only one grade is currently permitted. Po-lyester has proved too flexible, and both it and cotton are not strong enough. The strength of the reinforcement governs the compressive strength of the bearing when minimum amounts are used; therefore, if stronger fabric with acceptable bond prop-erties is developed, the stress limits of Section 14.4.A. 1 of Di-vision I may be reconsidered. However, thorough testing over a wide range of loading conditions, including fatigue, will be needed prior to acceptance.
25.3.4 Bond
Adequate bond is essential if the reinforcement is to be ef-fective. It is particularly important at the edges of the bearing.
25.4 Fabrication
Bearings that are designed as a single unit must be built as a single unit, because the shape factor, bearing stiffness and

57
strength, and general behavior under load will be different if built in sections.
In order to achieve good bond, the steel laminates must first be thoroughly sand blasted and cleaned and then protected against contamination until fabrication is complete.
Edge cover is primarily needed to prevent corrosion of the reinforcement and ozone attack of the bond. However, it also decreases the probability of delamination by reducing the stress concentrations at the exposed outer surface.
In the past, bonding during vulcanization has been the most successful method of attaching the laminates, and is required for bonding of internal laminates. Practical difficulties, however, may arise in hot bonding of external plates; thus, hot bonding is strongly recommended for them, but not required.
25.5 Fabrication Tolerances
Some of the tolerances have been changed to relative values, because an absolute tolerance such as 1/16 in. may be overly large for a small bearing and unrealistically small for a large bearing. Parallelism of the two faces of a single layer is controlled by the limitation on thickness at any point.
25.6 Marking and Certification
In the short-term, marking simplifies the identification of the correct bearings and establishing which way up they should be placed at the job site. In the long-term, it may permit the removal of bearings after a number of years of service to check the change in material properties over time. It also helps in settling disputes.
25.7 Testing
Testing requirements fall into two main categories: material quality control tests and load tests on the finished bearings to detect poor fabrication.
The material tests at ambient temperature have been retained from previous editions of the Specification. They are quick and easy to do and are to be performed on each batch of material.
Three low temperature material tests are required for elas-tomer grades 3 to 5, and the temperature at which the tests are conducted are now different for each grade. One test is required for grades 0 and 2 materials. The low temperature crystallization tests can be time consuming, so it may be done annually for each material instead of for each batch. The low temperature brittleness and instantaneous stiffening tests are quick and easy, so they are to be performed on every batch of grade 3 to grade
5 material in order to provide some ongoing control of low temperature behavior.
Each steel-reinforced bearing is to be subjected to a short-duration compressive test to 150 percent of maximum design load. The bulging pattern provides a means of checking gross defects in fabrication. This proofload test is only an approximate indicator of bearing quality, and it may both allow a few low-quality bearings into service as well as cause the rejection of a small number of bearings that would have performed adequately. However, the latter is a small price for detecting most major fabrication defects. It is important because only surface hardness and external dimensions can be checked with any ease once the bearing has been delivered.
Delamination is the most common defect and the 15-hour compression test is more likely to show it than is the 5-min test. Because the 15-hour test is more time-consuming, it may be done on a random sample of the bearing lot, but the press production time that it uses may be minimized if it is conducted overnight. Bearings made from grade 4 or grade 5 elastomers are to be subjected to the same test because achieving the nec-essary low temperature properties requires special compounding which could place other properties such as bond at risk if it is not done properly. The 15-hour load test may also be used to resolve differences arising from the failure of a bearing to pass a lower level test.
The shear test provides a check on the material properties from tbe body of the bearing. Specially molded samples, such as those useii 'n the material quality control tests, are much smaller than the finishd bearing and so may require different curing times and temperatures. Specimens cut from the finished bearing provide a comparison with the material quality control samples.
Complete bearings may be tested, and this is most easily done using two identical bearings on top of one another with a shear load plate between them. However, in bearings with more than two or three layers, bending and buckling effects may reduce the shear stiffness of the complete bearing below the value GA / hr1 given by the simple shear model. It is important to distin-guish between unacceptable material and failure to analyze the rather complicated behavior with sufficient accuracy.
25.8 Installation
If the bearing seat is not horizontal, gravity loads will cause shear in the elastomer. The underside of the girder and the top surfaces of the bearing must also be parallel to avoid imposing excessive rotation and the stresses it causes in the bearing.
Welding to load plates should be avoided if possible. If it must be done, proper precautions should be taken to avoid damaging the bond by heat.
it

58
APPENDIX C
TESTING EQUIPMENT
TEST FRAME USED IN THE RESEARCH
Details of the test frame used in the research and described in this report are shown in Figures Cl to C6. The system performed well, but it was necessary to account for the frame deflections when computing the bearing deflection.
The design of the system was dominated by the timer loading rods, which were used to minimize heat gain into the freezer. The arrangement used was chosen because the connections seemed likely to work. However, the result is a somewhat bulky frame and, if compressive load is to be applied at the same time as shear, three separately controlled actuators would be nec-essary. This is so because the aluminum blocks could not be allowed to move in the direction perpendicular to the compres-sion, as the compressive force would then be eccentric.
An alternative arrangement is shown in Figure C7 which avoids this situation. It was not tried in this project but is offered here as a suggestion for any testing agency interested in building a low temperature test rig. Its advantages are that no steel frame is needed, a smaller freezer could be used and fewer ports are needed in the freezer.
The compressive load would be applied by a flat jack, inside the freezer. It would be necessary to use a hydraulic fluid which would not freeze at the testing temperatures. One center plate would be used in place of the two shown in Figure Cl, and the relative movement, required for shearing the bearings would be supplied by a rod in a sleeve. Figure C7 shows a steel rod in a timber sleeve as a compromise between compact size and low heat transfer. Other arrangements are also possible.
00
00
" V~c
PLAN
ELE VAT TEN Figure Cl. Plan and elevation of test system.

59
MC 10 x 33. 6 -
3/4" A325 Bolt " Slip Critical Connection (typical)
W 10 xô 0
Figure C2. Detail A.
dia. steel bolts
1" dia. threaded hole
—r IL1 r 4½"
-- I __ I 1 L ------ I I I I I I
& I
I I
4" dia.) 1'
Maple rod 4'l" 1"r . l' Steel 4½" dia. Solid round
)r i 7½"
Figure C3. Detail B.
(A36)
low' 16,14
" dia. bolts
Figure C4. Detail C
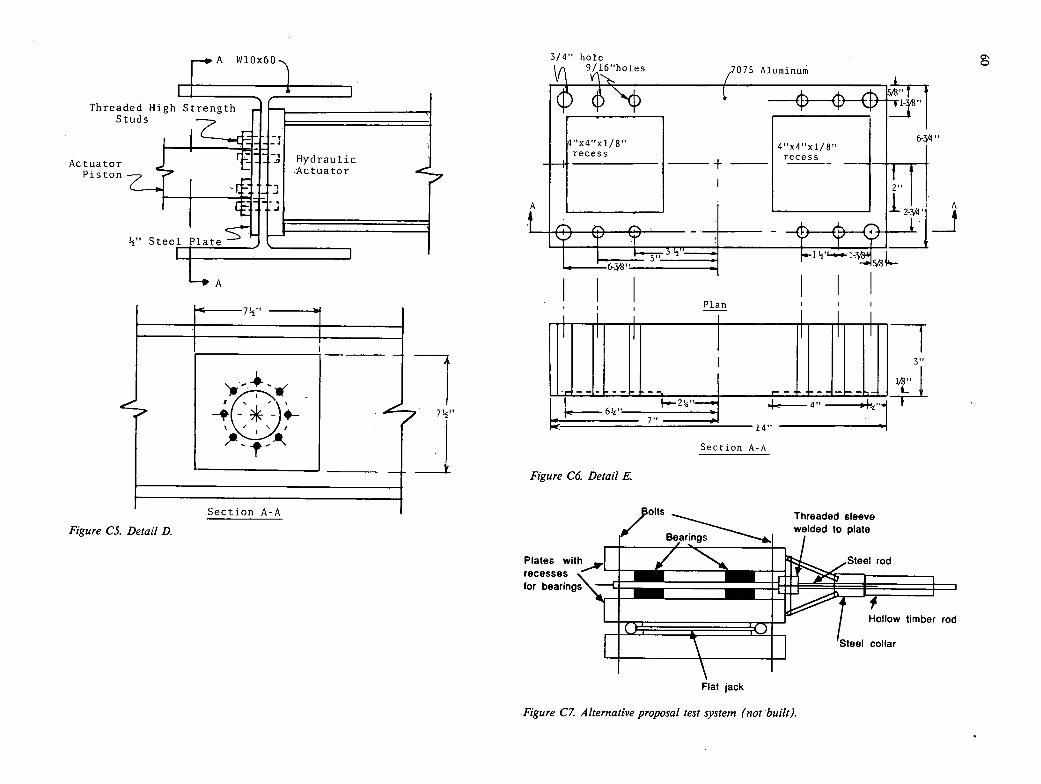
Threac SI
Actuator Piston
7½'
Section A-A
Figure C5. Detail D.
75 Aluminum
4'x4"xl/8" recess
3/4" hole Ic 9/16'hoies
"x4'xl/8" recess
-I-
I 2-3/4
A
I
L I 6-3i8"
Plan
LIILJL. 644"
2¼"
14"
JLJILLJ " 4d
Section A-A
Figure C6. Detail E.
,'t"
UIIb Threaded sleeve
Bng -s. welded to plate
Plates with r •••11gt/ '•••••'•ilI
Steel rod
recesses for bearing
- Hollow timber rod
Lee1 collar I-
Flat jack
Figure C7. Alternative proposal test system (not built).
ON 0

APPENDIX D
DESIGN EXAMPLES USING METHOD B SPECIFICATIONS
The calculations for the following examples were done on a spreadsheet on a
microcomputer. The output is shown at the end of each example. The user inputs the
information in the boxes. As each of the bearing dimensions (L, W, h, h5, N layers) is
selected, the limits (maximum or minimum) are calculated for the next dimension by the
program. For example, when only N layer remains to be chosen, three lower bounds (due
to shear deformation, compressive stress under combined compression and rotation, and
net tension stress) and one upper bound (due to stability) are shown. The user selects a
value which lies within all the bounds.
Bearing Type
Use a rectangular bearing made from 55+1-5 durometer elastomer. Table 14.3.1
gives 112.5 psi :5 G :5 160 psi, k = 0.675.
Design for Compressive Stress (Section 14.4.B.1) Plan area ~: (78 + 33) kips
- — 70 in2 1.600ksi
Try 7" x 12" (overall) bearing, A = 84 in2
= I I 1k/84 in2 = 1.321 ksi < 1.66 GS 1.321ksi
=7.076 1.66 x 0.1125 ksi
(Note that the minimum value of G from the range is used.)
hri LW 7.0x 12.0
= 0.312 in
2S (L + W)2 x 7.076 (7.0 + 12)
Try 0.25" layers, S = 8.842
Example 1.
A 125' simple span bridge in Duluth, Minnesota is made from prestressed concrete
girders at 6' c/c, with an 8 deck. It has no skew and all movement is accounted for at one
end. Shrinkage and creep cause 1/2" shortening after erection. Each girder may be treated
as carrying 50% of the HS-20 live load in one lane. The girders have a 24' wide bottom
flange, h = 73.5", A = 626 in2, I = 456,000 in4. Choose suitable elastomeric bearings.
Loading
Dead load reaction/bearing = 1.25 k/ft x 62.5 = 78k
Live load reaction/bearing (truck loading) = 33k
Live load rotation = 0.0025 radians
Then for live load only
aalJ = 0.66 GS = 0.66 x 0.1125 x 8.842 = 0.657 ksi
> O.393 ksi = OLL ok
Minimum Elastomer Thickness for Shear (Section 14.4.B.3)
0.5" creep and shrinkage given.
AASHTO Section 3.16 gives the temperature fall for a cold climate as 45°F
ALs = cLLT = .0000055 (125) 12 (45) = 0.37 inch (shortening)
= 0.37 + 0.5 = 0.87 inch
hrt = 2 As = 1.74 inches - Use 1.75 inch elastomer thickness, 6 internal 1/4 layers,
plus 1/8' cover top and bottom.
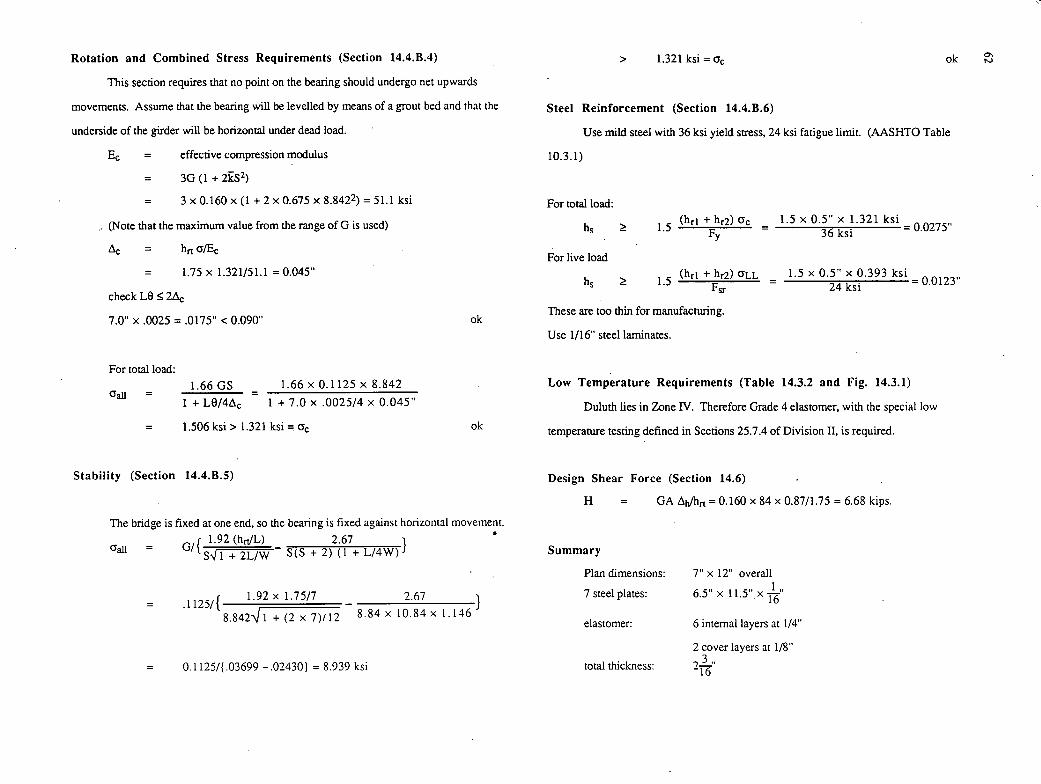
Rotation and Combined Stress Requirements (Section 14.4.B.4)
This section requires that no point on the bearing should undergo net upwards
movements. Assume that the bearing will be levelled by means of a grout bed and that the
underside of the girder will be horizontal under dead load.
E = effective compression modulus
= 3G(1+2kS2)
= 3 x 0.160 x (1 + 2 x 0.675 x 8.8422) = 51.1 ksi
(Note that the maximum value from the range of G is used)
= hrtYfEc
= 1.75 x 1.321/51.1 = 0.045"
checkLe 2Ac
7.0" x .0025 = .0175" <0.090 ok
> 1.321 ksi =cT
Steel Reinforcement (Section 14.4.B.6)
Use mild steel with 36 ksi yield suess, 24 ksi fatigue limit. (AASHTO Table
10.3.1)
For total load: (hr i + hr2) a - 1.5 x 0.5" x 1.321 ksi -
hs ~ 1.5 F 0.0275" - 36ksi -
For live load (hri + hr2) YLL - 1.5 x 0.5" X 0.393 ksi
0.0123" h ~ 1.5 Fsr - 24 ksi
These are too thin for manufacturing.
Use 1/16" steel laminates.
For total load: 1.66 GS 1.66 x 0.1125 x 8.842
call = = 1 + LO/4 1 + 7.0 x .0025/4 x 0.045"
= 1.506 ksi> 1.321 ksi
Stability (Section 14.4.B.5)
Low Temperature Requirements (Table 14.3.2 and Fig. 14.3.1)
Duluth lies in Zone IV. Therefore Grade 4 elastomer, with the special low
ok temperature testing defined in Sections 25.7.4 of Division 11, is required.
Design Shear Force (Section 14.6)
H = GA iJhi.t = 0.160 x 84 x 0.87/1.75 = 6.68 kips.
The bridge is fixed at one end, so the bearing is fixed against horizontal movement. 1.92 (hrtJL) 2.67
gail G/t,j _s(s + 7)(l + L/4w)
= .1125/1 1.92x 1.75/7 2.67
} 8.842']l + (2 x 7)/12 8.84 x 10.84 x 1.146
= 0.1125/(03699 -.024301 = 8.939 ksi
Summary
Plan dimensions
7 steel plates:
elastomer:
total thickness:
7" x 12" overall
6.5"x11.5"x' 16
6 internal layers at 1/4"
2 cover layers at 1/8"
16

Elastomeric Bearing Design using
AASI-1T0 Method B
Gmin(ksl)= 0.113 p DL(klp)= 78 Gmax(ksl)= 0.160 p LL(kip)= 33
k bar = 0.675 p TL(kip)= 111 Fy (ksi) = 36 rot (Fad) = 0.0025
Fsr (ksi) =_24 As (in) =_0.870
Max/mm
area 69.375 L 5.781 W 9.911
h ri (TL) 0.312 h ri (LL) 0.418 S (TL) 7.076 S (LL) 5.291
h s (TL) 0.0275 h s (LL) 0.0123 N lay (as) 7.0 N lay (uplift) 1.4 N lay (comp) 2.3 N lay (stab) 20.8
Actual values
area 84 L(short) 7 W(Iong) 12 IL stress 1.321 LL stress 0.393
h Fl 10.250 I
S 8.842 Ec 51.142
h s 0.0625 N layers 7 h total 2.188 wt elastomer 6.4 wt steel 10.5
NCHRP Method B Exmp 1
This bearing was deliberately made as small as possible by stressing it as highly
as possible, in order to demonstrate Method B's potential for reducing the bearing size. A
larger bearing working at lower stress could be selected for other reasons, such as girder
stability during construction.
The designer might choose to use a temperature fall of more than 45°F in view
of Duluth's extreme low of-39°F. This would require a thicker bearing.
The bearing can withstand a total rotation of .0055 radians at the given loads.
Rotations larger than this would cause overstress on the compressive side. This rotation
capacity is probably too small to accommodate normal construction tolerances on leveling,
so either the grout layer assumed in the problem would have to be used, or a larger bearing
with more rotation capacity could be selected
Bearing L= 7
W= 12 tot weight= 16.9
Design shear= 6.68
Summary N layers= 7
hri= 0.25 hrt= 1.75 hs= 0.0625
h Iotal= 2.1875

Reinforcement (Section 14.4.A/6)
Fsr 24 ksi = 24,000 psi
Load = 1700 hri = 1700 x 0.25" = 425 lb/in
Resistance = 24,000 psi x h
hs 425/24,000 = 0.0178"
This is too thin for fabrication. Use minimum .j' laminates.
Example 2
Same specification as example 1, but design bearing by Method A. Use the same
elastomer.
Minimum Thickness for Shear (Section 14.4.A.4)
hn 1.75' as before
Minimum Dimensions for Stability (Section 14.4.A.5)
Since hJL < 1/3, W ~ L ~t 3 x 1.75' = 5.25"
Minimum Area for Load (Section 14.4.A.1)
a:51000psi A>lllk/1.Oksi=111 in2
Try 7" x 16" bearing
A= 112 in2
cc < GS/, f3 = 1.0 for internal layers
CYC = 111K/112in2 = 0.991ksi
S 2~ 1.0x0.991/0.1125ksi = 8.809
LW 7.0x16.0
hr ~ = = 0.276 2S (L + W) 2 x 8.809 (7.0 + 16.0)
Use 1/4" layers. S = 9.739.
Rotation Requirements (Section 14.4.A.3)
= 3G(l+2kS2)=3x0.160(1+2x0.675x9.7392)=61.9ksi
Lc = Ph11JAEc = ill X 1.75/112 X 61.9 = 0.0279"
OL = 0.0025 x 7.0 = 0.0175" < 0.056" = 2Ac ok
Design Shear Force
H = GAAh/hrt =0.160 x 112 x 0.87/1.75 = 8.9 kips.
Summary
Plan dimensions:
13 steel plates:
elastomer:
total thickness:
7" x 16' overall
6.5" x 15.5" x 1/16"
6 internal layers at 1/4"
2 cover layers at 1/8" 3"
216
Notes:
1) This bearing is about 33% larger than the one designed by Method B for the
same circumstances, in Example 1. Despite the extra size it may prove cheaper since the
test requirements are less stringent. This is reasonable since the circumstances are
commonplace.

Example 3
Redesign the bearing of Example ito minimize the horizontal forces applied to the
substructure. Use a compound with a known G = 100 psi at room temperature, hardness
50. Do not use elastomer thicknesses less than 0.2'.
Check Rotation and Combined Stress (Sections 14.4.B.3-4)
Ec = 3G (1 + 2kS2) = 57.25 ksi
= PhrdAEc =111X8.0/81X57.25 = 0.1915"
OL = 0.0025 x 9 = 0.0225" < 0.383" = 2Ac
(YaH1.66GS = = 1.814>1.SSOksi ok
1 + LO/4Ac
ok
Solution
This will require using the smallest plan dimensions and greatest height possible. Design Shear Force (Section 14.4.B.2)
Since the rotations were found to use up only a small amount of the compressive capacity, H = GA Thrt = 0.100 x 81 x 0.87/8.0 = 0.88 kips.
try a square bearing. This will increase the buckling load and allow a taller bearing.
Compression (Section 14.4.B.1)
cy, = 111k/A :51600psi A~!70 in2
Try 9" x 9" bearing
A = 81in2 cY=1370psi
< 1.66 GS .. S 2: 1370/100 x 1.66 = 8.26
h1.1 < 2S W)
= 0.273". Use 0.20 layers
S=11.25
Summary
Plan dimensions:
39 steel plates:
elastomer:
total thickness:
Notes:
9" x 9" overall
8.5" x 8.5' x 1/16"
39 internal layers at 0.20"
2 cover layers at 0.10 ll
10.5"
1) The Design Shear Force is substantially smaller than with the earlier designs for
the sante conditions.
The bearing is small and slender compared to many in use today. As with the
Examples I and 2, it was designed to a specific objective, and other criteria which could
apply in some cases were ignored.
Stability was evaluated on the assumption that the bearing was fixed against
translation. If this is not the case in the transverse direction, then the bearing would need to
be larger in plan or lower.
Layers thinner than 0.200" would have permitted a more slender bearing and a
ON lower Design Shear Force. However, 0.200" was used as a practical lower limit. LA
Stability (Section 14.4.B.5)
ForS =11.25,L=WandG=0.l00ksi
(rall = 0.100/ {hr
—0.014331 ksi 91.339
:.h!~ 8.0"
Use 39 layers at 0.20" each, plus 2 cover layers at 0.10", hrt = 8.0"

NCHRP Method B Exmp 3 Example 4 ON
Elastomeric Bearing Design using
AASHTO Method B
Gmin(ksi) 0.100 p DL(kip)= 78 Gmax(ksi) 0.100 p LL(kip)= 33
k bar = 0.75 p TL(kip)= 111 Fy (ksi) = 36 rot (rad) = 0.0025
Fsr (ksi) =_24 A s (in) =_0.870
Max/min Actual values
area 69.375 area 81 L 7.708 L(short) 9 W 7.708 W(Iong) 9
TL stress 1.370 LL stress 0.407
h ri (TL) 0.273 ____________
h ri (LL) 0.365 h ri 10.200 I S (TL) 8.255 S (LL) 6.173 S 11.250
Ec 57.253 h s (TL) 0.0228 h s (LL) 0.0102 h s 0.0625 N lay (as) 8.7 N layers 40 N lay (uplift) 2.4 h total 10.500 N lay (comp) 2.8 wt elastomer 28.1 N lay (stab) 39.9 wt steel 57.7
Bearing Summary L= 9 N layers= 40
W= 9 hri= 0.2 tot weight= 85.8 hrt= 8
Design shear= 0.88 hs= 0.0625 h total= 10.5
Design a bearing for a post-tensioned cast in place concrete box girder bridge in
Florida. PDL =400k, P1.1 = 100k, is = 4.5" total, 8 = .015C total. Use an elastomer with
a known G = 140 psi, appmximately 60 hardness. Use the smallest bearing possible,
regardless of Design Shear Force. The other end of the bridge is fixed.
Design for Compressive Stress (Section 14.4.B.1)
Plan area >. (400 + 100) kips
= 312.5 in2 1.600 ksi
Try 16" x 22', A = 352 in2 500
= 1.420ksi !~ 1.66GS
S2!1.420/1.66x.140 = 6.112 LW 352
h~2 (L + W) = 2 x 6.112 (16 + 22) = 0.758"
Try 5/8' layers, S = 7.411
Minimum Elastomer Thickness for Shear (Section 14.4.B.2)
h1 t ~! 2Ls = 2 x 4.5 = 9.0"
N > 9.0/0.625 = 14.4
Try 14 layers at 5/8' + 7 cover layers at 5/16" each
hrt = 9.375"
Rotation and Combined Stress (Section 14.4.133)
E3G(1+2kS2)28.098ksi
= h1. /E = 9.375 x 1.420/28.098 = .4378"
LO = 16 x .015 = 0.24" <0.948" = 2Ac ok
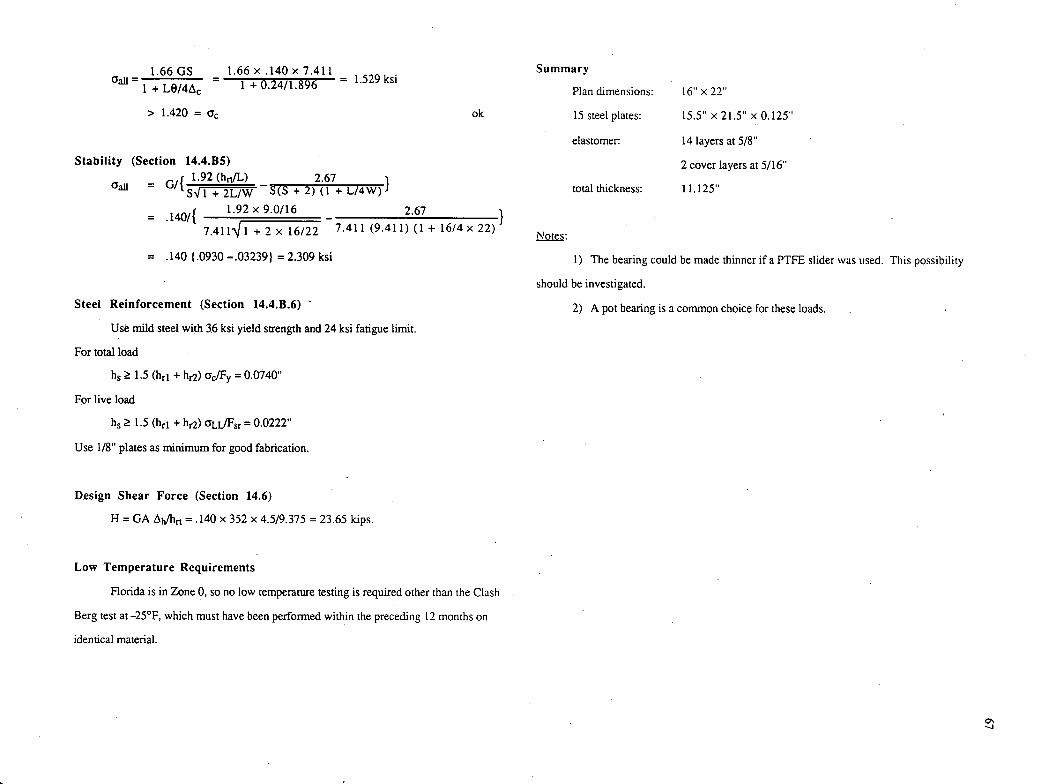
Summary
Plan dimensions:
ok 15 steel plates:
elastomer:
1.66GS 1.66 x .140x 7.411 aall =
1 + Le/4 = 1.529 ksi 1 + 0.24/1.896 =
> 1.420 = crc
Stability (Section 14.4.B5)
CFaU = oi{ 1.92(hrtJL) - 2.67 S1 +2L/W S(S + 2) (1 + L/4W)}
= .140/{ 1.92 x 9.0/16 2.67
7.4111 + 2 x 16/22 7.411 (9.411) (1 + 16/4 x 22)
= .140 (.0930 -.03239) = 2.309 ksi
Steel Reinforcement (Section 14.4.13.6) -
Use mild steel with 3.6 ksi yield strength and 24 ksi fatigue limit.
For total load
h ~ 1.5 (hri + h) c/Fy = 0.0740"
For live load
h5 ~ 1.5 (hri + h) LL/Fsr = 0.0222"
Use 1/8' plates as minimum for good fabrication.
Design Shear Force (Section 14.6)
H = GA Lxjjh = .140 x 352 x 4.5/9.375 = 23.65 kips.
Low Temperature Requirements
Florida is in Zone 0, so no low temperature testing is required other than the Clash
Berg test at —25°F, which must have been performed within the preceding 12 months on
identical material.
16" x22"
15.5" x 21.5" x 0.125"
14 layers at 5/8"
2 cover layers at 5/16"
total thickness:
11. 125"
The bearing could be made thinner if a PTFE slider was used. This possibility
should be investigated.
A pot bearing is a common choice for these loads.
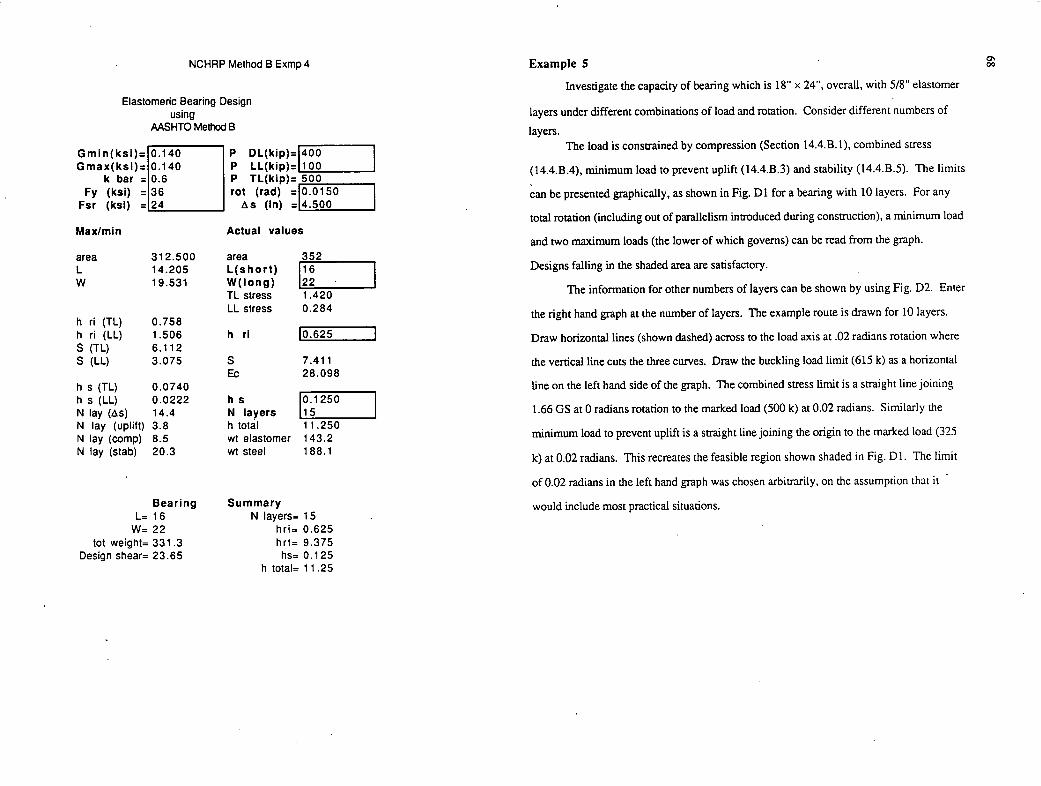
0' 00 NCHRP Method B Exmp 4 Example 5
Investigate the capacity of bearing which is 18' x 24', overall, with 5/8" elastomer
Elastomenc Bearing Design using layers under different combinations of load and rotation. Consider different numbers of
AASHTO Method B layers.
Gmin(ksi)=I0.140 I l I P DL(kip)= 400 The load is constjained by compression (Section 14.4.B.1), combined stress
Gmax(ksi)=l0.140 I P LL(kjP)11 00 I (14.4.B.4), minimum load to prevent uplift (14.4.B.3) and stability (14.4.B.5). The limits k bar =10.6 I P TL(kip)=500
Fy (ksi) =136 rot (rad) I0.0150 I can be presented graphically, as shown in Fig. Dl fora bearing with 10 layers. For any Fsr (ksl) =124 I is (in) =14.500 I
total rotation (including out of parallelism introduced during construction), a minimum load Max/min Actual values
and two maximum loads (the lower of which governs) can be read from the graph.
area 312.500 L 14.205
area 352 L(short)116
I Designs falling in the shaded area are satisfactory.
W 19.531 W(long) 122 The information for other numbers of layers can be shown by using Fig. D2. Enter TL stress 1.420 LL stress 0.284 the right hand graph at the number of layers. The example route is drawn for 10 layers.
h ri (TL) 0.758 h ri (LL) 1.506 h ri 10.625 I Draw horizontal lines (shown dashed) across to the load axis at .02 radians rotation where S (TL) 6.112 S (LL) 3.075 S 7.411 the vertical line cuts the three curves. Draw the buckling load limit (615k) as a horizontal
Ec 28.098 h s (IL) 0.0740 line on the left hand side of the graph. The combined stress limit is a straight line joining h s (LL) 0.0222 h s 10.1250 I N lay (as) 14.4 N layers Ii 5 I 1.66 GS at 0 radians rotation to the marked load (500 k) at 0.02 radians. Similarly the
N lay (uplift) 3.8 h total 11.250 minimum load to prevent uplift is a straight line joining the origin to the marked load (325 N lay (comp) 8.5 wt elastomer 143.2
N lay (stab) 20.3 wt steel 188.1 k) at 0.02 radians. This recreates the feasible region shown shaded in Fig. Dl. The limit
of 0.02 radians in the left hand graph was chosen arbitrarily, on the assumption that it
Bearing Summary would include most practical situations. L= 16 N layers= 15
W= 22 hri= 0.625 tot weight= 331.3 hrt= 9.375
Design shear= 23.65 hs= 0.125 h total= 11.25

H
0
o 1000 0 0
a E 0 --
- 0— 500
n t 1%
0.01
Rotation (radians)
0.02 0 5 10 15 20 25 30 No. of layers
Ch '.0
Figure Dl Load and Rotation Capacity of 18" x 24" Bearing with Ten 5/8" Elastomer Layers
0 0. . . 0 —I
700
600
500
400
300
200
100
0
Stability
0.00 0.01
Rotation (radians)
1600
1400
1200
2000
0 a
1500
Nouplift
D Combined stress
+ Stability
FigureD2 .-i000 Load and Rotation Capacity of . 18" x 24" Bearing with Any
10 800
Number of 5/8" Elastomer Lay- c ers 0 600
400
200
ioo

THE TRANSPORTATION RESEARCH BOARD is a unit of the National Research Council, which serves the National Academy of Sciences and the National Academy of En-gineering. It evolved in 1974 from the Highway Research Board which was established in 1920. The TRB incorporates all former HRB activities and also performs additional functions under a broader scope involving all modes of transportation and the interactions of transportation with society. The Board's purpose is to stimulate research concerning the nature and performance of transportation systems, to disseminate information that the research produces, and to en-courage the application of appropriate research findings. The Board's program is carried out by more than 270 committees, task forces, and panels composed of more than 3,300 admin-istrators, engineers, social scientists, attorneys, educators, and others concerned with transpor-tation; they serve without compensation. The program is supported by state transportation and highway departments, the modal administrations of the U.S. Department of Transportation, the Association of American Railroads, the National Highway Traffic Safety Administration, and other organizations and individuals interested in the development of transportation.
The National Academy of Sciences is a private, nonprofit, self-perpetuating society of dis-tinguished scholars engaged in scientific and engineering research, dedicated to the furtherance of science and technology and to their use for the general welfare. Upon the authority of the charter granted to it by the Congress in 1863, the Academy has a mandate that requires it to advise the federal government on scientific and technical matters. Dr. Frank Press is president of the National Academy of Sciences.
The National Academy of Engineering was established in 1964, under the charter of the National Academy of Sciences, as a parallel organization of outstanding engineers. It is au-tonomous in its administration and in the selection of its members, sharing with the National Academy of Sciences the responsibility for advising the federal government. The National Academy of Engineering also sponsors engineering programs aimed at meeting national needs, encourages education and research and recognizes the superior achievements of engineers. Dr. Robert M. White is president of the National Academy of Engineering.
The Institute of Medicine was established in 1970 by the National Academy of Sciences to secure the services of eminent members of appropriate professions in the examination of policy matters pertaining to the health of the public. The Institute acts under the responsibility given to the National Academy of Sciences by its congressional charter to be an adviser to the federal government and, upon its own initiative, to identify issues of medical care, research, and education. Dr. Samuel 0. Thier is president of the Institute of Medicine.
The National Research Council was organized by the National Academy of Sciences in 1916 to associate the broad community of science and technology with the Academy's purpose of furthering knowledge and advising the federal government. Functioning in accordance with general policies determined by the Academy, the Council has become the principal operating agency of both the National Academy of Sciences and the National Academy of Engineering in providing services to the government, the public, and the scientific and engineering corn-munities. The Cuuiieil is administered jointly by both Academies and the Institute of Medicine. Dr. Frank Press and Dr. Robert M. White are chairman and vice chairman, respectively, of the National Research Council.
TRANSPORTATION RESEARCH BOD National Research Council U
2101 Constitution Avenue, N.W.
Washington, D.C. 20418
ADDRESS CORRECTION REQUESTED
NON-PROFIT ORG. U.S. POSTAGE
PAID WASHINGTON, D.C.
PERMIT NO 8970
000015t1003 NATERIfLS ENGR
IDAHO TRANS DEPT DIV OF HWYS P 0 BOX 7129 - BOISE
I ID 83707