master's thesis: web-based real-time information...
TRANSCRIPT

Web-based Real-time InformationDashboardAn event-driven approach to visualize telemetry data
VINCENT ANDERSSONMARTIN HESSLUND
Department of Software EngineeringChalmers University of TechnologyGothenburg, Sweden 2013Master’s Thesis 2013:1

The Author grants to Chalmers University of Technology and University ofGothenburg the non-exclusive right to publish the Work electronically and in anon-commercial purpose make it accessible on the Internet. The Author warrants thathe/she is the author of the Work, and warrants that the Work does not contain text,pictures or other material that violates copyright law.The Author shall, when transferring the rights of the Work to a third party (forexample a publisher or a company), acknowledge the third party about this agreement.If the Author has signed a copyright agreement with a third party regarding the Work,the Author warrants hereby that he/she has obtained any necessary permission fromthis third party to let Chalmers University of Technology and University ofGothenburg store the Work electronically and make it accessible on the Internet.
Dashboard
MARTIN HESSLUND,VINCENT ANDERSSON,
c©MARTIN HESSLUND, June 2013.c©VINCENT ANDERSSON, June 2013.
Examiner: JORGEN HANSSONSupervisor: MIROSLAW STARON
Chalmers University of TechnologyUniversity of GothenburgDepartment of Software EngineeringSE-412 96 GothenburgSwedenTelephone + 46 (0)31-772 1000Department of Software EngineeringGothenburg, Sweden June 2013

Abstract
Traditional information dashboards where data are updated at fixed intervals or on userinteraction do not fulfill all needs for software development practitioners. There is a needfor access to information in real-time in order to support decisions in an ever-changingreality.
The research presented in this thesis was conducted during 6 months, using a designscience research methodology, with the industrial partner Surikat. Part of the study isinterviews with three employees at Surikat as well as quantitative performance measure-ments on a proof-of-concept system developed during the thesis.
The proof-of-concept was realized with an event-driven architecture using WebSocketfor communication between server and client. Performance measurements revealed thatthe system gives an average round-trip time, RTT, of 5066ms across all tests. The testsranged from 1 client and 1 message per second to 50 clients and 80 messages per second,with and without aggregations on the server. The test also showed there are significantdifference between browsers. The average RTT was 1640ms for Chrome and 17285msfor Internet Explorer.
The proof-of-concept developed during this thesis shows that it is possible to cre-ate real-time information dashboards using open source frameworks and emerging webtechnologies, such as WebSocket. The performance tests show that the system copeswell compared to the requirements developed with Surikat but that there are signifi-cant differences between older and newer browsers. In addition, interviews revealed thatreal-time updates give project managers support to make faster decisions.

Acknowledgements
We would like to thank Surikat for giving us the opportunity to do this thesis. Weare especially thankful to all interviewees and our supervisor at Surikat who helped usthroughout the study with valuable feedback. We would also like to thank AssociateProfessor Miroslaw Staron, Chalmers University of Technology, who guided us throughthis thesis.
The Authors, Gothenburg, June 2013

Contents
1 Introduction 11.1 Scope and limitations . . . . . . . . . . . . . . . . . . . . . . . . . . . . . 21.2 Contribution and thesis structure . . . . . . . . . . . . . . . . . . . . . . . 2
2 Background 32.1 Theoretical framework . . . . . . . . . . . . . . . . . . . . . . . . . . . . . 3
2.1.1 Real-time computing . . . . . . . . . . . . . . . . . . . . . . . . . . 42.1.2 Event-driven architecture . . . . . . . . . . . . . . . . . . . . . . . 42.1.3 Telemetry . . . . . . . . . . . . . . . . . . . . . . . . . . . . . . . . 52.1.4 Visualization . . . . . . . . . . . . . . . . . . . . . . . . . . . . . . 5
2.2 Related work . . . . . . . . . . . . . . . . . . . . . . . . . . . . . . . . . . 62.2.1 Real-time computing for the web . . . . . . . . . . . . . . . . . . . 62.2.2 Telemetry and dashboards . . . . . . . . . . . . . . . . . . . . . . . 62.2.3 Visualization Systems . . . . . . . . . . . . . . . . . . . . . . . . . 72.2.4 Data processing . . . . . . . . . . . . . . . . . . . . . . . . . . . . . 8
2.3 Available technologies . . . . . . . . . . . . . . . . . . . . . . . . . . . . . 8
3 Methodology 103.1 Context . . . . . . . . . . . . . . . . . . . . . . . . . . . . . . . . . . . . . 103.2 Research objective and questions . . . . . . . . . . . . . . . . . . . . . . . 103.3 Design science research . . . . . . . . . . . . . . . . . . . . . . . . . . . . . 11
3.3.1 Awareness of the problem . . . . . . . . . . . . . . . . . . . . . . . 113.3.2 Suggestion and Development . . . . . . . . . . . . . . . . . . . . . 133.3.3 Evaluation . . . . . . . . . . . . . . . . . . . . . . . . . . . . . . . 13
4 Results 174.1 Architecture of the dashboard . . . . . . . . . . . . . . . . . . . . . . . . . 17
4.1.1 Architectural drawing . . . . . . . . . . . . . . . . . . . . . . . . . 174.1.2 Communications . . . . . . . . . . . . . . . . . . . . . . . . . . . . 194.1.3 Real-time aspects . . . . . . . . . . . . . . . . . . . . . . . . . . . . 19
i

CONTENTS
4.1.4 Database . . . . . . . . . . . . . . . . . . . . . . . . . . . . . . . . 204.1.5 Queries and subscriptions . . . . . . . . . . . . . . . . . . . . . . . 204.1.6 Data generation . . . . . . . . . . . . . . . . . . . . . . . . . . . . 22
4.2 Measuring latency . . . . . . . . . . . . . . . . . . . . . . . . . . . . . . . 244.2.1 Server load . . . . . . . . . . . . . . . . . . . . . . . . . . . . . . . 244.2.2 Latency . . . . . . . . . . . . . . . . . . . . . . . . . . . . . . . . . 25
4.3 Benefits of real-time dashboards . . . . . . . . . . . . . . . . . . . . . . . 294.3.1 Interviews . . . . . . . . . . . . . . . . . . . . . . . . . . . . . . . . 29
5 Discussion 325.1 Performance . . . . . . . . . . . . . . . . . . . . . . . . . . . . . . . . . . . 325.2 Benefits and applications . . . . . . . . . . . . . . . . . . . . . . . . . . . 335.3 Design trade-offs . . . . . . . . . . . . . . . . . . . . . . . . . . . . . . . . 345.4 Ethical implications . . . . . . . . . . . . . . . . . . . . . . . . . . . . . . 355.5 Threats to validity . . . . . . . . . . . . . . . . . . . . . . . . . . . . . . . 35
6 Conclusion 37
Bibliography 39
A Interview questions 43
B User stories 45B.1 Functional . . . . . . . . . . . . . . . . . . . . . . . . . . . . . . . . . . . . 45
B.1.1 Control panel . . . . . . . . . . . . . . . . . . . . . . . . . . . . . . 45B.1.2 Client . . . . . . . . . . . . . . . . . . . . . . . . . . . . . . . . . . 46B.1.3 Interface . . . . . . . . . . . . . . . . . . . . . . . . . . . . . . . . . 47
B.2 Quality . . . . . . . . . . . . . . . . . . . . . . . . . . . . . . . . . . . . . 48B.2.1 Interoperability . . . . . . . . . . . . . . . . . . . . . . . . . . . . . 48B.2.2 Performance . . . . . . . . . . . . . . . . . . . . . . . . . . . . . . 49B.2.3 Security . . . . . . . . . . . . . . . . . . . . . . . . . . . . . . . . . 49B.2.4 Usability . . . . . . . . . . . . . . . . . . . . . . . . . . . . . . . . 50B.2.5 Reliability . . . . . . . . . . . . . . . . . . . . . . . . . . . . . . . . 50B.2.6 Adaptability . . . . . . . . . . . . . . . . . . . . . . . . . . . . . . 51B.2.7 Portability . . . . . . . . . . . . . . . . . . . . . . . . . . . . . . . 51
C Framework selection 52C.1 Sample application . . . . . . . . . . . . . . . . . . . . . . . . . . . . . . . 53C.2 Selected framework . . . . . . . . . . . . . . . . . . . . . . . . . . . . . . . 53
D Quantitative study 54
ii

1 Introduction
Different stakeholders in software projects have different information needs. Developerswant to see detailed information of the development progress and project managers wantto see the overall status of the projects (Buse & Zimmermann 2012). A common way toshow this information is to use information dashboards (Jakobsen et al. 2009) (Treude &Storey 2010) (Kobielus et al. 2009). To be able to satisfy the different needs, a dashboardmust be highly customizable with respect to information source and how it is displayed.
Traditionally, information dashboards visualize data collected from systems at regularintervals such as every day or hour, which is not fast enough (Johnson 2007) (Treude &Storey 2010). The constantly changing reality of software development demands a newway to approach software monitoring where the information is up-to-date all the time.A more event-driven approach is needed, where the information visible to the user isupdated within seconds of the availability of new data (Levina & Stantchev 2009).
Thanks to the evolution of handheld devices, stakeholders want to have instant accessto information everywhere. Not only on their handheld devices but on whatever device,such as computers, phones, tablets and information radiators (Whitworth & Biddle2007), they currently have access to. With all these devices, there are large differencesin operating system, screen size and especially performance (Wang et al. 2011). Toavoid costly development of several different tools, it is desirable for a single solution towork across the segmented landscape. One way to address this problem is to use webtechnologies, which are available on all major platforms (Charland & LeRoux 2011).
One large obstacle encountered when trying to achieve continuous updates using webtechnologies is that these technologies are generally not well suited for this type of usage.Traditional web communications are not constructed to handle communication initiatedby the server (Bozdag et al. 2007). Recent developments have however made efforts toimprove this by introducing WebSocket giving a significantly better performance thantraditional web communications (Agarwal 2012).
By using recent technological advancements in the area of real-time web communi-cations, this thesis suggests that information dashboards can be improved by providingfaster information updates. This presents a few challenges:
• What are suitable real-time requirements for information dashboards?
• How to achieve these requirements on mobile and regular clients.
• Whether real-time updates are necessary for all information.
• What benefits real-time information provides in dashboards.
1

1.1. SCOPE AND LIMITATIONS CHAPTER 1. INTRODUCTION
1.1 Scope and limitations
The scope and limitations of this thesis are the following.
• This study has focused on real-time computing from a software and web applicationperspective. This is due to lack of control over hardware when dealing with Internetconnections and consumer devices as well as the need for a single solution formultiple environments.
• Only solutions that work in a web-based environment without third party plugins,such as flash, have been examined as not all devices have support for such plugins(Vaidya & Naik 2013).
• This study only includes one case, Surikat. The extent of the study was limiteddue to the short duration, less than 6 months, of the master’s thesis.
1.2 Contribution and thesis structure
Chapter 2 describes earlier work with dashboards, software project measurements andintroduces the web technologies that make real-time web applications possible. Chapter 3presents the research questions and covers the methodology used for the thesis. Chapter4 covers the architecture of the proof-of-concept solution as well as presents the resultsfrom qualitative and quantitative studies conducted. Chapter 5 discusses the findings.Chapter 6 provides the conclusions, limitations and future work of this thesis.
2

2 Background
The background for this thesis can be divided into three areas. Firstly, the theoreticalframework that explains the theories this thesis is built upon is explained. Secondly,other studies of similar products are covered and lastly, the technologies that make real-time web applications possible are presented. These three background areas and theirmain content are shown in figure 2.1.
2.1 Theoretical framework
This section discusses different areas that offer principles applicable to information dash-boards.
Figure 2.1: Mind map of the background study
3

2.1. THEORETICAL FRAMEWORK CHAPTER 2. BACKGROUND
2.1.1 Real-time computing
Real-time systems are described by Stankovic et al. as systems that not only depend onthe correctness of the execution, but also the time it takes to perform those executions(1992). Common for all real-time systems is the presence of an execution deadline. Thereare three classes of real-time systems that define the value of the information after theexecution deadline (Shin & Ramanathan 1994).
• Hard – Not meeting the deadline can have catastrophic consequences.
• Firm – The information is useless after the deadline.
• Soft – Information decreases in value after the deadline but is still useful.
A system is not real-time just because a component is real-time; all parts of the sys-tem need to meet the time constraints. This makes it hard to create real-time systemsthat communicate over the Internet. Due to lack of the concept of predictable dead-lines in the TCP protocol, real-time computing in the traditional sense is impossible(Gamini Abhaya et al. 2012). This means that while a true real-time system can knowin advance whether a request will be fulfilled before its deadline, web-based systems canonly know after the request is processed if it met its deadline. Since there is no guaranteethat the message is received by the client at all (Xiao & Ni 1999), it is not suitable tohave hard real-time in web-based systems.
2.1.2 Event-driven architecture
Systems that are progressed by notable things happening can be designed by followingan event-driven pattern (Michelson 2006).
Events are uniquely identifiable and each contains the source of the event, a time-stamp as well as an event body. The event body must be predefined in such a way thatall consumers of the event know how to process it. Events can be generated both outsideand inside the system. Event-driven architectures are highly decoupled where eventgenerators have no knowledge of what happens to an event after it has been generated(Michelson 2006).
Events are often processed after they are collected. There are three styles for eventprocessing: simple event processing, stream event processing, and complex event pro-cessing.
Simple event processing is the most basic one and consists of an event triggering anaction downstream in the event chain.
Stream event processing is slightly more involved than simple event processing. Datais filtered and only forwarded to subscribers of that information. Stream event processingdoes, as simple event processing, only deal with one event at the time.
With complex event processing, it is possible to look at events in a context. Thisenables the system to take actions based on multiple events across a span of time,different event sources or other relations (Michelson 2006).
4

2.1. THEORETICAL FRAMEWORK CHAPTER 2. BACKGROUND
It is also possible to combine event-driven architecture with service-oriented archi-tecture, SOA. This reduces the coupling further as the usage of web services removessome of inflexibility in other solutions; such as remote procedure call based ones (Levina& Stantchev 2009).
2.1.3 Telemetry
Telemetry is the broad term describing highly automated collection of measurementsfrom a distance (Telemetry 2013). Telemetry can be applied in a number of areas. Theareas of interest here are the collection of data and measurements from other softwaresystems for example project management systems or any other enterprise system coreto company operations. Data is generally gathered by small add-ons in these systems.
Software project telemetry is defined by Johnson et al. (2005) as having five charac-teristics:
• “The data is collected automatically by tools that regularly measure various char-acteristics of the project development environment.”
• “The data consists of a stream of timestamped events where the time-stamp issignificant for analysis.”
• “Both developers and managers can continuously and immediately access the data.”
• “Telemetry analyses exhibit graceful degradation.”
• “Analysis includes in-process monitoring, control, and short-term prediction.”
This type of metric gathering is very flexible and can be adjusted to work well inmost projects, as it requires little effort to collect the data. This could be especiallywell suited for agile development as it gives frequent and continuous measurements andallows for fast feedback on decision making (Johnson et al. 2005).
2.1.4 Visualization
Using visualizations to provide more understanding when working with large data sets iswidely recognized within the sciences (Keim et al. 2006). The use of visualizations in thefield of business intelligence, BI, has gained a lot of popularity and various visualizationsare now commonplace in various BI tools.
This thesis focuses on web-based technologies and that introduces some limitationsregarding visualization. Most important is compatibility with most browsers. Thisgenerally means adherence to the HTML5 standard1. The JavaScript library Data-Driven Documents2, D3 for short, offers a transparent and simple way to create scalablevector graphics, SVG3, (Bostock et al. 2011).
1http://www.w3.org/TR/html5/2http://d3js.org/3http://en.wikipedia.org/wiki/Svg
5

2.2. RELATED WORK CHAPTER 2. BACKGROUND
In modern companies, not all data is located in a single service making it cumbersometo look at relationships between data from different services. To solve this problem, someresearch has gone into the field of enterprise mashups (Pahlke et al. 2010). The term’mashup’ has its roots in consumer web services that aggregate content, and sometimeslayout, from other services. Enterprise mashups are constructed in a similar fashion butgenerally only aggregate services from a company’s intranet (Pahlke et al. 2010). Enter-prise Mashups can be categorized by their complexity from just displaying user interfaceelements from different services to creating workflows from different components.
Enterprise mashups are in many ways related to business intelligence dashboards.One of the many uses for mashups is to create dashboards where the user is free tocustomize the functionality without support from IT professionals (Kobielus et al. 2009).
2.2 Related work
In this section, previous work in the area of real-time computing for the web, severaltools that use dashboards to display data as well as techniques used to process andvisualize data are presented.
2.2.1 Real-time computing for the web
This section summarizes results from three related studies that involve real-time com-puting for web. These studies try to solve the problem at the end systems, server andclient. This is the easiest part to solve since it is the only one under complete controlwithout making changes to the Internet infrastructure.
Wu et al. (2000) identified four problems when sending real-time video on the In-ternet. These four problems are bandwidth, delay, loss and heterogeneity. They presenta framework that handles the problems at the end systems. The framework consists oftwo components: congestion control and error control.
Another solution for real-time video over the Internet is to send the information overUDP, which allows the server to control the frame size and rate. The client informs theserver if a frame is lost or did not meet the deadline so that the server can change theframe size and rate to the client (Hsiao et al. 2012). When showing live video, framesthat arrive after their viewing time do not add any value. Thus the server never re-sendsframes; this type of behavior belongs to the firm real-time systems.
Gamini Abhaya et al. (2012) have provided a set of guidelines for developing a web-based real-time middleware. To get predictable execution times in the middleware, allthe lower levels of the program need to support predictable executions, that means thatthe operating system as well as the programming language have to support it.
2.2.2 Telemetry and dashboards
Recent research in the area of software project telemetry has resulted in a few tools.One tool that specializes in software engineering process telemetry is Hackystat.
Hackystat did not support real-time updates of data through server pushes as of 2006
6

2.2. RELATED WORK CHAPTER 2. BACKGROUND
(Keim et al. 2006). Hackystat’s architecture has since been completely redesigned using aservice-oriented approach (Johnson et al. 2009) and now supports near real-time updatesthrough polling.
Another tool is FASTDash, which helps development teams to know what files thatare currently being worked on. The information is presented in widgets on a dashboardthat is displayed on a large shared screen or on each developer’s computer (Biehl et al.2007).
Similar to FASTDash is WIPDash, which is a dashboard that visualizes the overallstatus of a project on a large shared display. This system differs from FASTDash bysupporting interaction from the user. For example, it is possible to click on a teammember and see all work items assigned to that team member. The information on thedisplay is updated once per minute by querying the server (Jakobsen et al. 2009).
To examine how dashboards are used to improve awareness in software engineeringprojects, Treude & Storey (2010) studied software teams using IBM Jazz in their devel-opment processes. In addition to dashboards, Jazz also includes feeds showing events.The study found that it is important to address awareness on both a high and low level.
Information dashboards are also used outside the field of software engineering. Thereexist several commercial and open-source tools for real-time monitoring of business pro-cesses. These systems are generally referred to as Business Activity Monitors. Some ofthe software giants have their own propriety systems456. There also exist a couple ofopen-source alternatives, such as WSO2 Business Activity Monitor7. These systems areall integrated with other systems from the same vendor, which makes them less flexible.
2.2.3 Visualization Systems
There exist several types of visualization systems. The ones that are most interestingin our case are the programming toolkits, which are popular for presenting live data.Google Chart8, Highcharts9 and JFreeChart10 are examples of toolkits that have a lim-ited number of chart types that the user can choose from.
For users that want to be able to add new chart types and other types of visualization,tools like Protovis (Bostock & Heer 2009) and D3 (Bostock et al. 2011) are a bettersolution. Both tools allow the user to create any type of visualization with the tools’JavaScript API. The downside is that it is harder to get started since the learning curveis steeper. However, the learning curve is even steeper for learning the different SVGAPIs of all browsers (Bostock et al. 2011).
4http://www-01.ibm.com/software/integration/business-monitor/5http://www.microsoft.com/biztalk/en/us/business-activity-monitoring.aspx6http://www.oracle.com/technetwork/middleware/bam/overview/index.html7http://wso2.com/products/business-activity-monitor/8https://developers.google.com/chart/9http://www.highcharts.com/
10http://www.jfree.org/jfreechart/
7

2.3. AVAILABLE TECHNOLOGIES CHAPTER 2. BACKGROUND
2.2.4 Data processing
To display more interesting information than simple raw data, some sort of data pro-cessing is necessary. Following are a few alternatives.
Firstly, Druid is a “real-time” analytical data storage that consists of 4 types of nodesthat together make the Druid cluster. The four different types are:
• Real-time node receives the data stream and makes it available for real-time queries;the information is stored in memory.
• Historical node stores segments, Druid’s fundamental storage unit, in the perma-nent storage as well as exposing them for querying.
• Broker node knows what segments exists and on which nodes they are stored. Italso handles the incoming queries and routes them to the correct nodes.
• Coordination or master node is responsible for all segment management, loadingnew segments, dropping outdated segments, segment replication and balancingsegment load.
Druid does not use SQL as its querying language; it has instead developed its ownquerying language that is based on JSON, JavaScript Object Notation (Yang et al.2013).
When the thesis started, Druid only had support for permanent storage in AmazonS3. Since the information shown by systems like dashboards can be company secrets theoption for running the database on private servers is necessary.
Secondly is OLAP, on-line analytical processing (Codd et al. 1993). It is a frameworkfor making complex statistical calculations, such as moving average and drill-downs,where the data is often represented as a multidimensional cube. There are three mainapproaches that support OLAP queries: Relational, Multidimensional and Hybrid OLAP(Chaudhuri et al. 2001). To get a quick query response the data cube needs to beconfigured and precomputed (Harinarayan et al. 1996). Examples of products thatimplement OLAP are Mondrian11 and IBM Cognos TM112.
2.3 Available technologies
One problem often encountered when creating web applications is when the server hasnew information it wants to push to the client. This has not been possible since webclients do not have a permanent connection to the server. Push communication has sofar been implemented in web clients by performing so called long polling. Long pollingworks by opening a connection and keeping it alive until the server returns data. Whendata is received, the connection is closed and a new connection is established.
11http://mondrian.pentaho.com/12www.ibm.com/software/products/us/en/cognostm1
8

2.3. AVAILABLE TECHNOLOGIES CHAPTER 2. BACKGROUND
Long polling and several other techniques that use Ajax to send messages in a pushlike style are collected under the umbrella term Comet (Bozdag et al. 2007). All thesetechniques are transported on the HTTP connect and for each new message sent, a newconnection has to be established. This introduces significant overhead making Cometinappropriate when sending data to clients with constraints on bandwidth, such as mobiledevices (Liu & Sun 2012).
The desired way to push information is to open a TCP socket to the client, as it hasless overhead in the communication between the server and the client. Web browsers donot support this by default so a browser plug-in, such as Java-applets, Adobe Flash orMicrosoft Silverlight, is required for this technique. The plug-in forwards the connectionto JavaScript code running as usual in the browser. The requirement of a plug-in makesthis method less desirable as it is not possible to install plug-ins in all browsers (Vaidya& Naik 2013). The recent increase of security issues in mainly Java (Securelist 2013)and the hidden nature of the plug-in code may make the application appear as malwareto the user, further reducing the suitability of the plug-in approach.
WebSocket is a technique that takes the advantages of socket to the web, and issupported by most web browsers (Deveria 2013a). It opens a persistent connection tothe server over port 80, which means that it works even if the client is behind a firewallor a proxy that only allows connection over port 80. The socket allows communicationboth ways so that the client and the server can send messages to each other withouthaving to reestablish a new connection after each message. Since WebSocket does notuse the HTTP protocol for transmitting messages, there is less overhead on each message(Agarwal 2012). WebSocket is standardized by IETF in RFC 6455 (Fette & Melnikov2011) and W3C is in the progress of standardizing it for web browsers. WebSocket isalso under standardization for the Java platform as JSR 356 (Coward 2013).
An alternative to WebSocket is Server-sent events, SSE, which is part of the HTML5draft. SSE allows for one-directional push communication from the server to the clientover the HTTP protocol (Hickson 2012). Since the connection is one-directional, SSEdoes not offer any QoS and thus, it is not known to the server whether the client receivedthe message (Hickson 2012). It is then up to the client to tell the server in the nextrequest which is the latest received message.
9

3 Methodology
This chapter introduces the research questions of this thesis as well as the methodologyused to answer them and in which context.
3.1 Context
This thesis was conducted in cooperation with Surikat. Surikat is an IT company thatin addition to creating its own services also offers consultancy and support services.Representatives from Surikat provided requirements and insight into the problem as wellas continuous feedback.
3.2 Research objective and questions
The focus of this thesis is to explore if information in real-time help with making decisionsin the daily work. The goals are stated in the following research questions.
• How well does the dashboard perform against its real-time requirements?
How many simultaneous clients can the dashboard handle and still meet thereal-time requirements?
How long time does it take from an event until the data is shown on thedashboard?
How many events can be generated from data sources at the same time andstill meet the real-time requirements?
• What technique and architecture for middleware are required for it to work onmobile devices as well as on regular clients?
• What benefits does real-time information provide in the context of dashboards?
What information needs to be real-time?
How do the dashboard support practitioners at Surikat in formulating deci-sions?
10

3.3. DESIGN SCIENCE RESEARCH CHAPTER 3. METHODOLOGY
3.3 Design science research
A design science research approach as described by Vaishnavi & Kuechler (2004) wasadopted for this thesis. The process is split into five major steps: awareness of theproblem, suggestion, development, evaluation and conclusion. The idea is that each ofthese steps increases the understanding of the problem and allows for further refinement.
Figure 3.1: The design science research process based on image by Vaishnavi & Kuechler(2004)
The workflow of this thesis is illustrated in figure 3.2. Each column represents thedifferent phases of the study. Rectangles represent development and study activities,hexagons represent feedback from stakeholders and ovals represent demonstrations. Thedifferent phases are described more in the following sections.
3.3.1 Awareness of the problem
Prior to the start of the thesis, Surikat had prepared a conceptual draft of how theyimagined the appearance of the end result. This draft served as the basis for discussionsaround the requirements imposed on the system. The initial requirements were elicitedthrough casual discussions around the system and a requirement interview with tworepresentatives from Surikat, the representatives were a project manager with 1.5 yearsof experience and the company’s Chief Operations Officer, COO. The interview resulted
11

3.3. DESIGN SCIENCE RESEARCH CHAPTER 3. METHODOLOGY
Figure 3.2: Workflow during the thesis study
in a rough set of requirements and user stories, see appendix B, which were brokendown into smaller parts as they became the target of current development work. Thefocus of the initial requirements was to achieve a shared understanding of the qualityrequirements of the system and the rough outlines of its functionality.
Following is a short summary of the requirements:
• The maximum time from an event until it is shown to a user is 10 seconds.
• The average time from an event until it is shown to a user is lower than 2 seconds.
• The server shall re-send messages not received by the client.
• Events exceeding the time limits should still be shown to the user.
• The system should work in all popular web browsers, Internet Explorer 9 or newer.
As mentioned in section 2.1.1, classical real-time on the web is impossible since theunderlying technology is best effort. The usual definition of real-time on the web iswhen the information comes so fast that the delay is not noticeable to the user. Thereare several theories for sending real-time video over the Internet, see section 2.2.1, forthe firm real-time systems. This classification cannot be used in the dashboard sinceinformation loss is not acceptable and data that is delayed should still be displayed.Thus, the classification of the dashboard is soft. Furthermore, these theories are notapplicable to the dashboard as it uses HTTP, which in turn uses TCP as transportprotocol (Fielding et al. 1999).
In this study, there are no temporal validity intervals as described by Xiong et al.(2002). Deadlines are thus not imposed by the state of the data, as in many cases oftraditional real-time, but rather derived from user experience aspects.
The time it takes from that an event is created until it is displayed on the dashboardneeds to be measured, to know if the system fulfills the real-time requirements. No
12

3.3. DESIGN SCIENCE RESEARCH CHAPTER 3. METHODOLOGY
Figure 3.3: The parts of the event flow measured.
measures to control the systems that generate the events and what information theywant to send to the dashboard was implemented. Thus it was decided that the time tofocus on measuring and minimizing is the time from an event enter the dashboard systemuntil it is displayed. Two metrics were used to know what parts of the dashboard systemthat needed to be improved: one that counts the total time and one that measures thetime it takes for the server to process the information. As can be seen in figure 3.3, thedifferent parts of the client and the server were not distinguished since only the totaltime and when it differs were of interest. Important in this study was whether it is theclient or the server that is the problem.
3.3.2 Suggestion and Development
Based on the initial requirements, an initial design of the system’s architecture wasconstructed. This architecture then served as a basis for a prototype system. Theprototype was evaluated to determine how well it performs against the initial qualityrequirements. A demonstration of the prototype was made to the stakeholders to getfeedback and ideas for the implementation of the proof-of-concept system. The prototypewas then extended and used as the core in the proof-of-concept system.
Development of the proof-of-concept system was conducted on a weekly basis withreviews with customers ending every week. At these occasions, the progress of the weekwas demonstrated and the following week was planned. This included re-prioritizing therequirements for the system and setting goals for what were expected to be completedthe following week.
3.3.3 Evaluation
To answer the research questions the evaluation was split into to two parts: a qualitativeand a quantitative study.
13

3.3. DESIGN SCIENCE RESEARCH CHAPTER 3. METHODOLOGY
Qualitative study
Interviews were conducted with employees at Surikat after they used the dashboard inorder to answer research question 3. The user tests are in the context of aid for softwaredevelopment processes as Surikat is a software engineering company. Three employees atSurikat have been included in this process. Following is a presentation of the employees’roles and experience in the industry:
• Project manager, software delivery manager for 1.5 years and with 6 years ofexperience in the industry as a software developer.
• Project manager, system delivery manager for 3 years and has worked as a softwaredeveloper for 6 years.
• Lead developer with 15 years of experience.
Both authors held all interviews, where one had the role of the interviewer and theother of the transcriber. The questions posed during the interview can be found inappendix A. Each interview took 15-30 minutes.
Test periodDuring a period of two weeks, the system was hosted on a development server at Surikatenabling employees to test the system. The test period started with a presentation of thedashboard at a monthly meeting. Here, the basic functionality of the user interface andthe system capabilities were explained. An API documentation for the data insertioninterface was also mailed to requesting participants after the meeting.
In addition to the possibility to access the dashboard from workstations, a RaspberryPI1 displayed the dashboard on a large screen in the area most developers work in.Displayed here were a mix of different graphs showing data from the sources describedin section 4.1.6.
Quantitative study
A quantitative study was performed on the dashboard after the development phase. Thesystem was stress-tested with a varying number of simultaneous clients and amounts ofdata to give an indication of how the system scales for large user environments.
Metric collectionMeasuring the time from the moment an event enters the system until the client receivesit presents some difficulties. Simply checking the time on the server when sending andthe time of reception in the client is not guaranteed to give accurate data since the clocksin the server and the client might not be synchronized. This was solved by syncing theserver clock to an NTP, Network time protocol, server and then let the client sync itsclock to the dashboard server, so that both clocks are in sync.
1http://www.raspberrypi.org/
14

3.3. DESIGN SCIENCE RESEARCH CHAPTER 3. METHODOLOGY
In addition to measuring the time from server to client, the round-trip time, RTT,is also measured. The RTT is measured in the server and acts as some indication ofmeasurement problems in the client.
Test setupThe server used in the quantitative study had an Intel core 2 duo E8400 CPU, 8GB of
DDR3 RAM, 100Mbps Internet connection and was running Ubuntu 12.10. The databaseis MySQL 5.52 and Java environment OpenJDK 7u213 with the servlet container Jetty9.0.24. The Java virtual machine allowed a maximum of 2GB of RAM.
In addition to the measurements from the built in metric system, the study alsoincluded measurements of the server resource usage. The parameters measured duringthe test were the average CPU usage in percentage per core, average RAM usage inbytes and average network traffic in bits per second. These were collected using a set ofutilities installed on the server.
The test was executed with 1, 5, 10, 25, and 50 different clients connected to thesystem. Each test was run for one and a half minute and between each test, the databasetables were truncated. The time of each test was chosen based on it being long enoughto have a fairly constant flow of incoming data while keeping the test time down to allowfor more test runs. The clients were all running Windows 7 as the operating systemand 50% were using Internet Explorer 9 as web browser the rest used Chrome 26; allwere connected to Chalmers network. Data were sent into the system at 1, 10, 20, and80 messages/second, by posting events to the system with a script. The script was runlocally on the server so that the data insertion should not affect the bandwidth to theserver. The script generates new messages at a constant rate, which might not reflectreal-life usage patterns. It does however show how the system performs during high loadperiods which is likely to represent worst case usage.
Two types of subscriptions were used in the test: one showing time series data andthe other one displaying the data summarized and grouped by name. This was doneto test the different types of event handled by the system. How subscriptions work isdescribed in section 4.1.5. The two subscriptions were not loaded in the same test sothe test was executed twice. For the configurations used in the test see appendix D.
AnalysisAfter the stress test, the data were analyzed to determine if the system fulfilled thereal-time requirements.
The system load was compared to the number of messages sent to the system withthe different numbers of clients connected; the tests were performed for all types ofsubscriptions. This was done to give an indication of how the system scaled and whatthe limits for the maximum number of clients and messages per second are.
2http://www.mysql.com3http://openjdk.java.net/4http://www.eclipse.org/jetty/documentation/9.0.2.v20130417/
15

3.3. DESIGN SCIENCE RESEARCH CHAPTER 3. METHODOLOGY
To determine if there is a difference between different browsers, the time measuredfrom the different browser were compared in a diagram and a Welch’s t-test was pre-formed on the data. Welch’s t-test was used since it is a version of Student’s t-test thatworks where the variance of the two populations is not equal (Welch 1947). A statisticalsignificance of 0.05, as is customary, was used in the test. The null hypothesis is thatthe browser used should not affect the time for updates to pass through the system.
16

4 Results
In this chapter, the results from the studies are presented. Firstly, the architecture im-plemented in the proof-of-concept system is described. Secondly, the data gathered fromthe performance tests are presented. Lastly is a summary of the interviews conductedwith employees at Surikat.
4.1 Architecture of the dashboard
One major architectural decision was to base the implementation solely on open sourceframeworks and third party software. This decision is based on that it is hard to motivatethe investment in propriety third-party frameworks and technologies when working withemerging technologies with an uncertain future.
When working with open source components, it is important to understand the licenseagreement. If one has the intention to commercialize the product, one must make surethat the software is not bound by the licenses of third-party components in such a waythat prohibits this.
4.1.1 Architectural drawing
The architecture is designed to be event-driven where data generators input data intothe system at one end and events are generated to the clients that subscribe to that typeof event data.
The flow of information in the system is similar to that described by Michelson(2006). The architecture fits well for the system, as most operations in the system arein some way the result of new events with new data entering the system. In figure 4.1,the major components of the system are shown. The components in the box labeled’GWTClient’ are all part of the client and the rest of the components are part of theserver. The server side code is implemented in Java; the client is implemented usingGoogle Web Toolkit, GWT1, as Surikat had previous experience with the framework.
The system is designed to be easily extended with more functionality. This is achievedin mainly three areas. Firstly, it is possible to replace most components of the systemwith a different implementation. This is possible due to use of the dependency injectionpattern (Fowler 2004). Spring framework is used for configuration of the dependencyinjection on the server side; on the client side, dependency injection from GWT is used.
1https://developers.google.com/web-toolkit/
17

4.1. ARCHITECTURE OF THE DASHBOARD CHAPTER 4. RESULTS
Figure 4.1: Architecture of the proof-of-concept system
18

4.1. ARCHITECTURE OF THE DASHBOARD CHAPTER 4. RESULTS
Secondly, it is possible to add new data sources during runtime. How this is achieved isdescribed in more detail in section 4.1.6. Lastly, all graphs are implemented in JavaScriptand are looked up based on their name. To add a new graph, one simply includes thesource file of the graph in the HTML-page, adds the line looking up the name of thenew chart in a chart factory and it is available for the application without requiring theentire system to be rebuilt.
The client-side code is the critical part when attempting to achieve compatibilitywith different types of devices. The use of GWT, which is compiled to regular JavaScript(Google 2012), assured that most web browsers would be able to use the basic function-ality of the application (Deveria 2013b). Two additional techniques are used to providefull functionality. Firstly, WebSocket is used to provide the communication between theserver and the client. WebSocket is supported by most of the newer browsers on alldevices (Deveria 2013a). Secondly, SVG is used to display the visualizations. SVG isalso supported by most of the newer browsers (Deveria 2013c).
4.1.2 Communications
WebSocket is used as the transport protocol for Internet communications in this thesis.When using WebSocket, it is possible to use a sub-protocol for defining how messagesare sent across the connection. For the implementation described in this thesis, it wasdecided not to use a special sub-protocol. Instead, JSON formatted strings are sent usingthe Java framework atmosphere2. The selection process for the WebSocket frameworkis described in appendix C. This is the simplest approach and gives the most flexibilitywith regard to client implementation. The implementation might require more work incases where there already are good frameworks for a sub-protocol but it is simpler toimplement in case no framework is available.
Communications were implemented according to the publisher-subscriber patternwhere the node transmitting data, the publisher, has no knowledge about the receiver,the subscriber. The connection of subscribers to publishers is handled by the middleware,which in the case of this thesis is the framework Atmosphere (Eugster et al. 2003).
4.1.3 Real-time aspects
The efforts taken to fulfill the real-time requirements stated earlier in this thesis aredivided into three separate areas. To begin with, the different data sources can bedefined with different priorities. A data source with priority 1 has the highest priorityin the system and is placed earlier in the execution queue. If multiple data points havethe same priority, the first to enter the system is processed first.
Secondly, a system for post-mortem analysis of the system’s performance is built in.This makes it possible to give a statistical estimation of the time it will take to processand send the next data point based on the current trend. The metric system is basicallyimplemented as other data generators, but the data is inserted by sending it through
2http://github.com/Atmosphere/atmosphere
19

4.1. ARCHITECTURE OF THE DASHBOARD CHAPTER 4. RESULTS
the WebSocket connection, as can be seen in figure 4.1, instead of using the REST API.How the measurement system works is described in greater detail in section 3.3.3.
Finally, the database is only involved in updates that aggregate data. This allowsdata points for time series subscriptions to pass through the system with little process-ing.
4.1.4 Database
As can be seen in figure 4.1, the system uses two databases. One database, the one in thebox labeled ’UserConfigurations’, is used to store the user configurations and metadatafor the widgets visible on the clients. The second database is used to store the datainserted by the data generators.
The selected database is MySQL, which has less functionality in the field of dataanalytics than other alternatives discussed in section 2.2.4, but is easier to integrate intothe rest of the system since it is well supported by Spring framework. The effects of thedatabase choice are that some SQL and database specific features had to be developed.These features are: conversion from JSON based subscriptions to SQL statements, post-processing and filtering of data.
4.1.5 Queries and subscriptions
The developed dashboard concept revolves around the idea of subscriptions. A subscrip-tion refers to a persistent query on the dataset with aggregations, filters and groupings.The format for queries designed in this thesis was influenced by the query format usedby Druid (Yang et al. 2013).
Subscriptions are divided into two categories, ”group by” and ”time series”, to fulfilldifferent needs. These subscription types map against the different processing stylesdescribed by Michelson (2006). Time series subscriptions are based on the conceptstream event processing where new data points are forwarded to clients that subscribesto that type of data. Group by subscriptions are related to complex event processing andoften require the server to recalculate aggregations to fit the new data into the contextof the subscription.
The difference between the format of time series and group by subscriptions is small.Group by subscriptions are the most complicated as they have more properties. Anexample of a group by subscription is shown in figure 4.2. This subscription gets theaverage time it took to send the last five data points filtered to only include devicessharing the same platform as a Raspberry PI. There are a few particularly interestingproperties of this subscription. Firstly, ’clientToken’ is a property that is used whenregistering the subscription and assigning a publication path. Secondly, the ’data’ objectwhich contains what data source to use and properties for selecting the fields from thatsource. Finally, we have the ’postAggregations’ property. This specifies computations toperform in the ’DataAnalysis’ component shown in figure 4.1. In this case, an averageis computed from the field ’timeDiff’.
20

4.1. ARCHITECTURE OF THE DASHBOARD CHAPTER 4. RESULTS
{
"queryType":"GROUPBY",
"clientToken":"metricAvg",
"data":{
"metric":{
"aggregations":[
{
"type":"value",
"fieldName":"timeDiff"
}
],
"aggregationFilter":{
"type":"selector",
"dimension":"platform",
"operand":"=",
"value":"Linux armv6l"
}
}
},
"orderBy":{
"field":"id",
"order":"desc"
},
"maxReturn":5,
"postAggregations":[
{
"type":"statistics",
"name":"timeDiffAvg",
"fn":"avg",
"fields":[
{
"type":"fieldAccess",
"name":"timeDiff",
"datasource":"metric"
}
]
}
]
}
Figure 4.2: Group by subscription
A time series query would look similar to that of figure 4.2 but with fewer propertiesand the property ’queryType’ set to ’TIMESERIES’.
The separation of subscription types is also beneficial for performance. By usinggroup by subscriptions and doing all aggregations on the server the client has lighterwork to perform and the amount of data sent between the server and client can beminimized. This is important for meeting the time constraints on all types of clients.In addition, performing calculations on the server is anticipated to reduce the totalamount of computation, as multiple clients with identical subscriptions only require thecalculations to be performed once.
21

4.1. ARCHITECTURE OF THE DASHBOARD CHAPTER 4. RESULTS
4.1.6 Data generation
In effort to decouple the sensors collecting data from the system, insertions are performedthrough a web service running a REST interface. The basis for this decision is thatSurikat indicated that most systems that would feed data into the dashboard would beweb-based, making the HTTP protocol the natural choice. The decision to use RESTrather than SOAP was due to the simplicity of REST.
One could argue that there are more suitable solutions for data generators that arenot web-based, such as various hardware sensors. But as more and more devices areconnected to the Internet (Atzori et al. 2010), a REST API is compatible with morethan just web-based data generators.
Implementation of data generators
While it was not the focus of the thesis to develop data generators to hook into existingsystems, a few simple examples were developed for testing purposes. Most useful is apost-commit hook created for the version control software Git3. The generator insertsthe time, branch, author and number of changes for a commit into the system afterit is made. Other implemented data generators were a random data generator and anapplication that inserts what keys a user presses on the keyboard. The last example wasimplemented by one of the interview subjects as part of the user testing.
Inserting data
When a new data generator is created, it needs to be connected to the dashboard’s datainsertion API. The first step is to create a database table for the new data source. Thisis done by making an HTTP Post request with a JSON specifying the properties of thedata source. An example of such a message, used to create the table for the Git datagenerator, is shown in figure 4.3. Defined here are some properties for the table andwhat columns the table should have. All properties of the data source have an identifier,which must be unique in its scope. That means it must be unique for each source andfor each column within a source. The name property is the display name in the userinterface. A data source can define a priority. How priorities work is described in section4.1.3. If no priority is defined, a default value of 100 will be used. All columns also havea data type defining what the system should expect in new data points.
3http://git-scm.com/
22

4.1. ARCHITECTURE OF THE DASHBOARD CHAPTER 4. RESULTS
{
"Identifier":"git",
"name":"Git",
"priority":1,
"columns":
[
{
"identifier":"author",
"datatype":"string",
"name":"Author name"
},
{
"identifier":"date",
"name":"Commit date",
"datatype":"long"
},
{
"identifier":"changes",
"name":"Number of changes",
"datatype":"long"
},
{
"identifier":"branch",
"name":"Branch name",
"datatype":"string"
}
]
}
Figure 4.3: JSON payload for creating Git data source
When the database table is created, it is possible to insert new data points for thatdata source. These are also inserted by performing an HTTP Post request with a JSONpayload. In figure 4.4 is an example of how a new data point is inserted into the table ofthe data source from the example in figure 4.3. The data point contains a source, whichis the unique identifier for the data source the point belongs to, and a data object. Thedata object has the identifier of all columns in the data source as keys and a value ofthe corresponding data type defined when creating the source. All columns are optionaland can be ignored if no data exists.
23

4.2. MEASURING LATENCY CHAPTER 4. RESULTS
{
"source":"git",
"data":{
"author":"Martin Hesslund",
"date":1300020202,
"changes":100,
"branch":"master"
}
}
Figure 4.4: JSON payload for inserting data to Git data source
4.2 Measuring latency
In this section, data from performance measurements are presented.
4.2.1 Server load
Memory usage during the test was around 1.3GB for Java and 55MB for MySQL inde-pendent of the amount of data sent to the system and the number of clients connected.This can be explained by that there is no cache function implemented in the code andthe little extra memory it took to handle more connections is not noticeable.
The CPU usage did increase as the number of clients and the data flow rose. Itis possible to see in figure 4.5 that the CPU usage of Java increases rather linearlyto the number of messages processed. This is due to each message using roughly thesame amount of processing power. MySQL’s CPU usage did not increase that muchwhen running the time series subscription. This can be explained by the database onlyperforming insertions of data with this type of subscription. In the group by test, the loadon the database is higher since it not only needs to insert the data but also summarizethe entire table on each new message.
Figure 4.5: CPU usage on the test server during each test. The test name is according tothe following pattern: type of test, number of clients, message/second
24

4.2. MEASURING LATENCY CHAPTER 4. RESULTS
One thing that needs to be mentioned is that the total number of messages is higherthan the amount sent to the system by the script; the real number of messages receivedper second can be calculated by the following equation:
numberofevents/second+clients∗numberofevents/second = numberofmessages/second
The extra messages are sent by the measurement system.
4.2.2 Latency
Due to problems when trying to sync Internet Explorer’s local clock, time measure-ments from those clients during the tests cannot be used. To get latency informationcomparable between different browsers, the round trip time is used in the data analysis.
During the stress test of the system, the overall average round trip time, RTT, forthe messages collected is 5066ms. The total number of metric points collected duringthe tests are 510801, which is on average 162 points per second. The average RTT ishigher than the requirement for the system which is to not be above 2000ms. For thetests with a lower number of clients and less messages per second, 52.7% has an averageRTT of 143ms, which met the goal time of 2000ms. The requirement that the max RTTshould not exceed 10000ms is not met for either selection of the data.
Figure 4.6: Round trip times, in procentage, that meet the real-time requirments
As can be seen in figure 4.6, most tests meet the deadline from the real-time re-quirements. In total, 87.2% of the messages are displayed before 2000ms and 91.3% aredisplayed before 10000ms after they enter the server. The average RTT for the messagesover 10000ms is 54320ms.
25

4.2. MEASURING LATENCY CHAPTER 4. RESULTS
Figure 4.7: Round trip time in average during time series test, the figure use a logarithmicscale with base 10
The test with the time series subscription showed that the system had no problemsevering the clients with new updates, see figure 4.10. However, as can be seen in figure4.7 and figure 4.9, the average RTT rose as the number of clients and messages increased.This happens for both web browsers and can be explained by the rendering of the chart inthe client. The JavaScript used to display the chart have a problem with the time seriesgraph when the number of messages per second is higher than one. At that frequency,the array that is used to store the data do not have time to remove the old data untila new data point is revived which cause a memory leak, which crashed the client. As aresult of the crash, less metric data is sent to the server, which is visible in figure 4.10.Because the clients crashed when sending 20 messages/second, the test with 80 messagesper second was not executed with the time series subscription.
26

4.2. MEASURING LATENCY CHAPTER 4. RESULTS
Figure 4.8: Round trip time in average during group by test, the figure use a logarithmicscale with base 10
The average RTT measured during the group by tests is 5490ms, see figure 4.8 forthe RTT in each group by test. Time series test have the average RTT of 3646ms.
The Welch’s t-test gave the p-value 2.2e−16, which shows, with a statistical signifi-cance of 95%, that the null hypothesis can be rejected. The alternative hypothesis, thatthe choice of browser affects the RTT, is therefore valid. By comparing the different webbrowser types, it is, in figure 4.9, possible to see that Internet Explorer 9 has a higherRTT than Chrome 26 especially when the number of messages increases. The averageRTT for Chrome is 1640ms and for Internet Explorer is it 17285ms and when lookingat the time it take for the message to be received in the client the average for Chromeis 508ms and the value for Internet Explorer is completely wrong, -407717ms, since theclients have failed to sync the clock.
27

4.2. MEASURING LATENCY CHAPTER 4. RESULTS
Figure 4.9: Round trip time per web browser, the figure use a logarithmic scale with base10
In the group by with 10 messages/second and 25 clients connected, the InternetExplorer clients have a problem showing the messages in time. As can be seen in figure4.10, the server-side system did not have any problem and with the amount of data. Itis possible to see that it was one single Internet Explorer client that had problems bylooking at the complete data set for that test.
Figure 4.10: Average process time of each message on the server
Processing the messages on the server is generally not a problem during the tests, seefigure 4.10. However during the group by tests with 25 and 50 clients and 80 messagesper second, the average processing time started to increase and the maximum processingtime increased by 250% compared to the test with 20 messages/second. This indicates
28

4.3. BENEFITS OF REAL-TIME DASHBOARDS CHAPTER 4. RESULTS
that the server is approaching its maximum capacity. Furthermore, it is possible tosee that there are some inaccuracies in the measurements. The group by test with 80messages per second and 25 simultaneous clients had a higher average processing timethan the test with 50 clients. This could be related to the disconnection of clientsdiscussed further in section 5.1.
4.3 Benefits of real-time dashboards
This section presents the results of the qualitative study conducted in order to gainperspective on the perceived advantages of having instant access to information. Thisstudy was, as described in section 3.3.3, performed by letting users work with the systemand answering questions during interviews.
4.3.1 Interviews
This section summarizes the interviews that followed the user tests of the proof-of-concept system. This section is divided into subsections based on topics in the interviewquestions. The full list of questions is found in appendix A.
Information usage
When asked what systems the interviewees regularly extract information or reports fromthe answers are relatively similar. The three most used systems were the build andcontinuous integration software, the bug tracker and the time report system. Thesesystems are used on a daily basis by all interviewees and are business critical as theyprovide information required for the billing of customers.
There was also a desire to combine data from different sources in a simple manner.This was described as too difficult without tool support. An existing solution explainedwas an integration database that is used to combine data from two different systems.This solution was a bit complicated and not flexible enough to be extended with morefunctionality. One example of visualization not possible with this solution is to get allunfinished tasks for a project and the number of hours spent on each.
Another thing one project manager mentioned was that it is sometimes necessaryto visit several different systems to get access to all information needed for one task.This takes significant time and is something that should be possible to perform moreefficiently.
Some of the reports regularly used by the interviewees contain more advanced visual-ization than those available in the proof-of-concept. This implies the need for simplicityin extending the system with additional visuals as new needs emerge.
Usefulness of real-time updates
According to interviewees, having real-time updates of developers’ entries in time re-porting systems and bug trackers is a time saver for project managers. This allows for
29

4.3. BENEFITS OF REAL-TIME DASHBOARDS CHAPTER 4. RESULTS
tracking of progress on a finer level than possible with periodical reports. It was alsomentioned that fresher information gives better support for decision making and fasteraccess to information results in better decisions.
It was also positive that while the updates were instantaneous, they were not asdemanding and disturbing as notifications via mail. Mail updates had a tendency toclutter the inbox of the user and were often thrown away before they were read.
Real-time updates on an information radiator were described as motivating. Laggardswould be encouraged to enter information, such as time reports, directly after finishingtasks rather than waiting to the end of the week. It was hypothesized that this wouldimprove the accuracy of the time reports. Project managers would also save time, asthey would not have to spend time asking people if they had filled their time report andlet developers work undisturbed until they were ready to input their info.
Although the attitude was generally positive, real-time updates were not perceivedas beneficial in all cases. One example is that some reports are based on data from thelatest quarter and here it makes less sense to have the data from the beginning of thequarter until the current date.
Tool integration
Two of the interviewees had tried to add a data generator to the system. Their generalopinion was that it was fairly simple to work with the API but requested more optionsfor inserting data. The API seemed powerful enough but there was an uncertainty if itwould be flexible enough; a concern that is hard to address until more advanced datasources are integrated.
According to one subject, the fact that the API only accepts one data point with eachevent might put unnecessarily high load on the system generating data if the frequencyis high but the need for continuous updates is not. The suggestion was to allow thegenerator to collect events under a time span and send them collectively as one eventto the dashboard. It was also suggested making it possible to sidestep the event-drivennature of the API and let the dashboard poll the generator for new data at intervals.
Another related note was that sometimes the problem is not in what way the datais fetched or inserted into the system, but rather the format of the data. Systems wherepeople input free form information needs either strict routines for how the data shall beformatted or very intelligent semantic parsing if useful visualizations are to be producedfrom it. One example was absence from the office, which is not always reported in thesame way.
User experience
Only one of the interviewees had tried using the system on a mobile device, using An-droid. He tried both the standard Android browser and Chrome for Android whereChrome gave a superior user experience.
Most of the popular desktop browsers were represented among the interview subjects.The exception being Opera and Safari which none of the interview subjects used.
30

4.3. BENEFITS OF REAL-TIME DASHBOARDS CHAPTER 4. RESULTS
All of the interviewees stated that the user interface needs more polish in order forthe system to be usable in their actual workflow. Another point discussed regardingthe user interface was how to control the position of the widgets. The widgets in theproof-of-concept system were placed on the screen in a floating position. One intervieweewould have preferred more control over the widget position, such as one would get fromplacing the widgets freely on a grid.
31

5 Discussion
In this section are comments on the results as well as discussion of the ethical implicationsthe dashboard system could have.
5.1 Performance
As seen in the results, the system performs well with low load, but the RTT increaseswhen the number of clients and messages grow. Why the RTT increased has differentpossible explanations for the two types of tests.
In the time series test, the JavaScript in the client is the big problem. It caused theclient to crash due to a memory leak when handling the new messages and it needs tobe improved to work when a high amount of messages per second is sent to one graph.
The group by test did not have the same problem with the JavaScript, even thoughthe amount of messages per second were higher than for the time series test. Thisis because the information in the graph is replaced for every new message allowingJavaScript to garbage collect the old message. The server did on the other hand have ahigher load during this test. The system setup reached its maximum amount of client,50 clients connected and 80 messages/second, but the server load never reached 100%.One possible explanation for the problem is that the router used to hit its maximumnumber of concurrent connections and therefore had problems receiving the metric data.The router used in the tests has a maximum of 200 connections according to a test bythe website SmallNetBuilder (Higgins 2009). The number of connections used duringthe test can be calculated as follows: 50 for the Chrome clients, one for each WebSocketconnection and one used for time synchronization, 150 for Internet Explorer, 6 for eachclient to receive messages and send metrics (Lawrence 2011). This gives a total of 200connections for the clients plus a few extra connections for system monitoring and variousbackground processes.
While the server load never reached 100%, it started to increase rapidly, see section4.2.2. The server used, see section 3.3.3, is a five year old desktop computer. Moore’slaw suggests that a modern server would have at least four times better computationpower than the one used in the test. Thus the system would be able to handle a lotmore messages and clients when running on a modern server.
In the results, it is shown that Chrome is faster than Internet Explorer, see figure 4.9.This can be explained by IE 9’s use of long polling for transporting the messages. Foreach message received, the connection to the server is closed and a new one needs to beopened. Chrome 26 can send and receive messages over WebSocket so no new connection
32

5.2. BENEFITS AND APPLICATIONS CHAPTER 5. DISCUSSION
needs to be opened and less overhead is sent with each message (Agarwal 2012). Theperformance of the client is likely to improve as the latest version of all the popularbrowsers all have support for WebSocket (Deveria 2013a). In addition, JavaScript isgetting faster and faster with each generation of browsers.
Round trip time is used during the measurement to determine if the system achievesthe goal of max 10 second for a message to be displayed in the client, however that doesadd extra latency on the measured time since the message has to comeback to the server.In section 4.2.2, is it mentioned that the time for a message to be displayed in the clientis much lower than the RTT, but could not be used since Internet Explorer has problemswith clock syncing.
5.2 Benefits and applications
During the interviews, project managers seemed more positive than developers to theneed for real-time updates. This might be attributed to project managers having tasksmore frequently depending on accessing and evaluating information, or noticeable short-comings in the tools currently used.
When using information as support for making decisions, the more current the in-formation the better. When one has access to the latest data, less guessing about thecurrent situation or wait for the data to be collected are required. This makes it possibleto use information visualizations where data collection was previously too slow, leadingto support for more decisions. This aligns with the points that emerged during the in-terviews; decision making has to be quick and effective, which is not possible if one relieson information that takes a long time to collect.
Two interviewees stated that having real-time updates on a large screen visible forall developers was motivating. One example mentioned was filling time reports afterevery different task instead of estimating the time spent on each project at the end ofthe week. It is previously established that information radiators increase motivation inagile teams (Whitworth & Biddle 2007) and seeing the radiator update instantly mightincrease this motivation.
Not all information needs to be updated continuously. Some information the inter-view subjects work with is in reports from fixed time periods, such as quarters. Whilethese types of reports are still necessary, continuous updates can be used to follow theprogress for the current period and compare it on a fine level to previous results.
Mentioned during the interviews was that the unobtrusive nature of the dashboardis a good quality. This contradicts findings by Jakobsen et al. (2009) who state that aredesign of their system, WIPDash, would have included more noticeable alerts. Thismight be the result of different ways of working with information. WIPDash facilitateswhat Treude & Storey (2010) describes as low-level awareness where information suchas what files are currently being worked on is displayed. The uses for the dashboardmentioned during the interviews were more related to high-level awareness. Anotherdifference might be how the dashboard is used. If the dashboard is ever present in thebackground, notifications might be helpful in directing focus to the changes. But if the
33

5.3. DESIGN TRADE-OFFS CHAPTER 5. DISCUSSION
dashboard is a place visited for a task to obtain certain information, notifications fromit when no information is needed might be disturbing.
The desire for notifications can also be related to the frequency of updates. If eventshappen seldom, it might be helpful to be alerted of the change whereas in cases whereevents are frequent, it might disrupt the work on other tasks.
5.3 Design trade-offs
The system is designed, as mentioned in section 4.1.1, with the focus of being easy toextend. This required some trade-offs regarding optimizing the system for real-timeprocessing of messages. This is since the system does not know what information isavailable for the user and what the user want to analyze. To compensate for this, theevents with the highest priority are processed first and events that do not need databaseaggregations are passed through the system with little processing, as mentioned in section4.1.3. The rational for prioritizing flexibility over real-time properties is that the systemwould have to be very specialized for a single organization if this flexibility was notpresent.
Another trade-off is the event handling. Systems like Hackystat, has a bufferedevent middleware which makes it possible to collect information even if the system is notconnected to the server (Johnson 2007). This limits the system in the area of real-timeanalysis. The dashboard system requires data sources to send the events as soon as theyare generated to achieve real-time performance. To put this responsibility on the datagenerators are necessary to achieve a solution where the system does not need to poll thegenerators for new data all the time. For information that does not need to be real-time,the data source can implement its own cache functionality to be able to store a certainamount of events until it sends them to the dashboard server.
Another thing to keep in mind when adopting systems like the dashboard is compat-ibility with existing tools. As pointed out by Johnson et al. (2005): telemetry systemsrequire the possibility to extend the tools used with sensors. If extension support is notpresent, it might be possible to create a script that extracts the information from theapplication and inserts it into the dashboard. For this to work efficiently, the API wouldhave to be extended to support batch insertions that it, as mentioned in section 4.3.1,currently does not.
On the client, the JavaScript used to render the charts is flexible, thus making itpossible to easily create new charts. The user can also specify what information thatshould be shown in the chart. This flexibility makes it harder to know if the systemfulfills the real-time requirement. For example, as presented in section 4.2.2, the chartsdid not work as well as expected with high amounts of time series data. However, thistrade-off is necessary as different users and teams have different visualization needs asJakobsen et al. (2009) discovered in their study of WIPDash.
The dashboard works across all devices tested and gives continuous updates and usingweb technologies for this type of application seems very feasible. While the performanceof mobile devices were not compared to that of desktops, it stands to reason that due to
34

5.4. ETHICAL IMPLICATIONS CHAPTER 5. DISCUSSION
the fact that wireless connections are less stable, the performance would be lower.
5.4 Ethical implications
This section discusses some of the different ethical implications of this thesis.
Usage of information
When dealing with information visualization systems, the ethical implications are largelydependent on the type of information displayed. In the case of software developmentmonitoring, the information is often related to the development work and some metricscan thus be used to evaluate the performance of employees. It can be considered unethicalto have such large insight into individual workers’ day-to-day performance and careshould be taken when using this type of information. This is an observation the creatorsof Hackystat have made as well (Johnson 2007).
Correctness of data
When working with data, there is always the possibility of errors. This could haveconsequences if vital decisions are based on the information. While it could be arguedthat whoever uses the information bear the responsibility of assessing its correctness,the tools shall provide as much aid as possible to the process.
Solicitation bias
As this thesis was conducted in collaboration with a company, there is always a riskthat the interests of the company have affected the outcome of the study. To avoid thispotential bias, a few measures were taken.
Firstly, efforts to align the goals of the study and Surikat were made such as creatinga plan at the beginning of the thesis and agreeing on the course of action.
Secondly, while Surikat have provided continuous feedback with regard to the featuresof the proof-of-concept system, the work on this have been conducted independently.
Finally, an interest to create an academic study was shared by all parties.
5.5 Threats to validity
We recognize that there are several threats to the validity of this thesis. Following arethe major threats identified:
• The clients used in the performance test were all running on the same type ofhardware connected to the same network. This was due to the use of a classroomas a test lab. Though similar clients might not represent actual use of the system,it allows for comparisons between different web browsers and reduces the numberof unforeseen dependent variables.
35

5.5. THREATS TO VALIDITY CHAPTER 5. DISCUSSION
• Only one data source, visualized in one graph, was used during the stress test.This does not simulate the daily use of the system. However, this was used foreasier comparison between the different event types.
• The tests were only executed for one and a half minute. Running longer testsmight have revealed performance problems that do not arise until the system hasbeen online for longer periods of time. As all tests ran for an equally long time,comparisons between them should be accurate.
• The number of interview subjects was only three. However, as each intervieweehad several roles, most roles in software projects were represented. Furthermore,the total number of employees at Surikat limited the number of potential interviewsubjects.
36

6 Conclusion
This thesis examined the benefits of real-time updates in information dashboards byimplementing a proof-of-concept system and conducting performance measurements andinterviews with employees at Surikat. During the study, it was found that access to real-time updates of information are helpful to software engineers, and project managers inparticular.
The interviews revealed that real-time information in dashboards are beneficial inseveral ways. Firstly, the fast updates allows project managers to base more decisionson data which was previously not available. Secondly, project managers save time byalways being able to get an up-to-date overview of data from different systems, such astime reports or bug trackers, without spending lots of time asking all developers abouttheir progress. This also lets the developers focus on their work. Finally, when thedashboard is shown on an information radiator, the instant updates are motivating asseeing the data change gives incentive to finish more tasks or update time logs directlyafter a task is completed.
The interviews revealed that not all information needs real-time updates and that theway data are analyzed sometimes requires data in fixed time periods. One major time-saver is instead the automatic collection of all data from different systems into one systemso no manual labor is required when combining the different sources of information.
While the web is not designed for true real-time communications, it is possible useWebSocket for soft real-time communication without predictable execution times whenusing the latest web browsers. WebSocket is also gaining support on mobile devicesmaking web applications suitable for uses when the targeted devices are widespread.
In the performance tests conducted in this study, it is possible to see the large dif-ferences between new and older web browsers. Google Chrome 26 from 2013 performedsignificantly better than Internet Explorer 9 from 2011; this was likely due to the inclu-sion of WebSocket in Chrome. It stands to reason that the performance achieved in thefastest web browsers will spread to all web-connected platforms.
The duration of this study was rather short and further investigation in the area isnecessary. Following are some suggestions for future work:
• Further study of the dashboard’s performance during actual use. This would givemore accurate data regarding usage patterns and better insight into what parts ofthe system are slow and unpredictable. Here it would also be desirable to conductmore tests with mobile devices to find how the performance differs between differentplatforms.
37

CHAPTER 6. CONCLUSION
• While the underlying technology works similarly on desktops and mobile devices,the usage scenarios might be vastly different. Thus it is important to understandhow mobile clients are, or could be, used for consuming project information. Thiswould give better insight into if specialized interfaces are required for these devices.
• Not covered in this study is how real-time information can be integrated intodevelopment processes. In particular, it is necessary to develop guidelines for howit should be determined what information each organization benefits from havingreal-time access to.
This study was conducted in the context of software engineering projects but thebenefits of real-time dashboards are likely transferable to other business areas wheredependence on periodical reports is the current practice.
38

Bibliography
Agarwal, S. (2012), Real-time web application roadblock: Performance penalty of htmlsockets, in ‘Communications (ICC), 2012 IEEE International Conference on’, pp. 1225–1229.
Atzori, L., Iera, A. & Morabito, G. (2010), ‘The internet of things: A survey’, ComputerNetworks 54(15), 2787 – 2805.
Biehl, J. T., Czerwinski, M., Smith, G. & Robertson, G. G. (2007), Fastdash: a visualdashboard for fostering awareness in software teams, in ‘Proceedings of the SIGCHIconference on Human factors in computing systems’, ACM, pp. 1313–1322.
Bostock, M. & Heer, J. (2009), ‘Protovis: A graphical toolkit for visualization’, Visual-ization and Computer Graphics, IEEE Transactions on 15(6), 1121–1128.
Bostock, M., Ogievetsky, V. & Heer, J. (2011), ‘D3; data-driven documents’, Visualiza-tion and Computer Graphics, IEEE Transactions on 17(12), 2301–2309.
Bozdag, E., Mesbah, A. & van Deursen, A. (2007), A comparison of push and pulltechniques for ajax, in ‘Web Site Evolution, 2007. WSE 2007. 9th IEEE InternationalWorkshop on’, pp. 15 –22.
Buse, R. & Zimmermann, T. (2012), Information needs for software development analyt-ics, in ‘Software Engineering (ICSE), 2012 34th International Conference on’, pp. 987–996.
Charland, A. & LeRoux, B. (2011), ‘Mobile application development: Web vs. native’,Queue 9(4), 20:20–20:28.
Chaudhuri, S., Dayal, U. & Ganti, V. (2001), ‘Database technology for decision supportsystems’, Computer 34(12), 48–55.
Codd, E., Codd, S. & Salley, C. (1993), ‘Providing olap (on-line analytical processing)’.
Coward, D. e. a. (2013), ‘Jsr 356: Javatm api for websocket’.URL: http://jcp.org/en/jsr/detail?id=356 (2013-06-04)
39

BIBLIOGRAPHY BIBLIOGRAPHY
DeMichiel, L. & Shannon, B. (2013), ‘Jsr 342: Javatm platform, enterprise edition 7(java ee 7) specification’.URL: http://jcp.org/en/jsr/detail?id=342 (2013-06-04)
Deveria, A. (2013a), ‘Can i use web sockets?’.URL: http://caniuse.com/websockets (2013-06-04)
Deveria, A. (2013b), ‘Compatibility tables for support of javascript api in desktop andmobile browsers.’.URL: http://caniuse.com/#cats=JS API (2013-05-31)
Deveria, A. (2013c), ‘Compatibility tables for support of svg in desktop and mobilebrowsers.’.URL: http://caniuse.com/#cats=SVG (2013-05-31)
Eugster, P. T., Felber, P. A., Guerraoui, R. & Kermarrec, A.-M. (2003), ‘The many facesof publish/subscribe’, ACM Comput. Surv. 35(2), 114–131.
Fette, I. & Melnikov, A. (2011), ‘The websocket protocol’.URL: http://tools.ietf.org/html/rfc6455 (2013-06-04)
Fielding, R., Gettys, J., Mogul, J., Frystyk, H., Masinter, L., Leach, P. & Berners-Lee,T. (1999), ‘Hypertext transfer protocol – http/1.1’.URL: http://www.w3.org/Protocols/rfc2616/rfc2616.html (2013-05-22)
Fowler, M. (2004), ‘Inversion of control containers and the dependency injection pattern’.
Gamini Abhaya, V., Tari, Z. & Bertok, P. (2012), ‘Building web services middlewarewith predictable execution times’, World Wide Web 15(5-6), 685–744.
Google (2012), ‘Google web toolkit’.URL: https://developers.google.com/web-toolkit/ (2013-05-31)
Harinarayan, V., Rajaraman, A. & Ullman, J. D. (1996), ‘Implementing data cubesefficiently’, SIGMOD Rec. 25(2), 205–216.
Hickson, I. (2012), ‘Server-sent events’.URL: http://www.w3.org/TR/eventsource/ (2013-06-04)
Higgins, T. (2009), ‘Linksys wrt320n dual-band wireless-n gigabit router reviewed -routing performance, wireless features’.URL: http://www.smallnetbuilder.com/wireless/wireless-reviews/30795-linksys-wrt320n-dual-band-wireless-n-gigabit-router-reviewed?start=1 (2013-05-28)
Hsiao, Y.-M., Chen, C.-H., Lee, J.-F. & Chu, Y.-S. (2012), ‘Designing and implement-ing a scalable video-streaming system using an adaptive control scheme’, ConsumerElectronics, IEEE Transactions on 58(4), 1314–1322.
40

BIBLIOGRAPHY BIBLIOGRAPHY
Jakobsen, M., Fernandez, R., Czerwinski, M., Inkpen, K., Kulyk, O. & Robertson, G.(2009), ‘Wipdash: Work item and people dashboard for software development teams’,Human-Computer Interaction–INTERACT 2009 pp. 791–804.
Johnson, P. (2007), Requirement and design trade-offs in hackystat: An in-process soft-ware engineering measurement and analysis system, in ‘Empirical Software Engineer-ing and Measurement, 2007. ESEM 2007. First International Symposium on’, pp. 81–90.
Johnson, P., Kou, H., Paulding, M., Zhang, Q., Kagawa, A. & Yamashita, T. (2005),‘Improving software development management through software project telemetry’,Software, IEEE 22(4), 76 – 85.
Johnson, P., Zhang, S. & Senin, P. (2009), ‘Experiences with hackystat as a service-oriented architecture’, University of Hawaii, Honolulu .
Keim, D., Mansmann, F., Schneidewind, J. & Ziegler, H. (2006), Challenges in visualdata analysis, in ‘Information Visualization, 2006. IV 2006. Tenth International Con-ference on’, pp. 9 –16.
Kobielus, J., Karel, R., Evelson, B. & Coit, C. (2009), ‘Mighty mashups: do-it-yourselfbusiness intelligence for the new economy’, Information & Knowledge ManagementProfessionals, Forrester 47806, 1–20.
Lawrence, E. (2011), ‘Internet explorer 9 network performance improvements’.URL: http://blogs.msdn.com/b/ie/archive/2011/03/17/internet-explorer-9-network-performance-improvements.aspx (2013-05-28)
Levina, O. & Stantchev, V. (2009), Realizing event-driven soa, in ‘Internet and WebApplications and Services, 2009. ICIW ’09. Fourth International Conference on’, pp. 37–42.
Liu, Q. & Sun, X. (2012), ‘Research of web real-time communication based on websocket’, International Journal of Communications, Network and System Sciences5(12), 797–801.
Michelson, B. M. (2006), ‘Event-driven architecture overview’, Patricia Seybold Group2.
Pahlke, D. W. I. I., Beck, R. & Wolf, D. W. I. M. (2010), ‘Enterprise mashup systems asplatform for situational applications’, Business & Information Systems Engineering2(5), 305–315.
Securelist (2013), ‘Kaspersky lab report: Evaluating the threat level of software vulner-abilities’.URL: http://www.securelist.com/en/analysis/204792278 (2013-06-04)
41

BIBLIOGRAPHY BIBLIOGRAPHY
Shin, K. & Ramanathan, P. (1994), ‘Real-time computing: a new discipline of computerscience and engineering’, Proceedings of the IEEE 82(1), 6–24.
Stankovic, J. A. et al. (1992), ‘Real-time computing’, Invited paper, BYTE pp. 155–160.
Stoyanchev, R. (2012), ‘Support for the websocket protocol’.URL: https://jira.springsource.org/browse/SPR-9356 (2013-05-17)
Telemetry (2013), ‘Encyclopaedia britannica online’.URL: http://www.britannica.com/EBchecked/topic/585928/telemetry (2013-06-04)
Treude, C. & Storey, M.-A. (2010), Awareness 2.0: staying aware of projects, developersand tasks using dashboards and feeds, in ‘Proceedings of the 32nd ACM/IEEE Inter-national Conference on Software Engineering - Volume 1’, ICSE ’10, ACM, New York,NY, USA, pp. 365–374.
Vaidya, A. H. & Naik, S. (2013), ‘Comprehensive study and technical overview of ap-plication development in ios, android and window phone 8’, International Journal ofComputer Applications 64(19).
Vaishnavi, V. & Kuechler, B. (2004), ‘Design science research in information systems’.URL: http://desrist.org/design-research-in-information-systems/ (2013-06-04)
Wang, Z., Lin, F. X., Zhong, L. & Chishtie, M. (2011), Why are web browsers slow onsmartphones?, in ‘Proceedings of the 12th Workshop on Mobile Computing Systemsand Applications’, HotMobile ’11, ACM, New York, NY, USA, pp. 91–96.
Welch, B. L. (1947), ‘The generalization ofstudent’s’ problem when several differentpopulation variances are involved’, Biometrika 34(1/2), 28–35.
Whitworth, E. & Biddle, R. (2007), The social nature of agile teams, in ‘Agile Conference(AGILE)’, pp. 26–36.
Wu, D., Hou, Y. T. & Zhang, Y.-Q. (2000), ‘Transporting real-time video over theinternet: challenges and approaches’, Proceedings of the IEEE 88(12), 1855–1877.
Xiao, X. & Ni, L. (1999), ‘Internet qos: a big picture’, Network, IEEE 13(2), 8–18.
Xiong, M., Ramamritham, K., Stankovic, J., Towsley, D. & Sivasankaran, R. (2002),‘Scheduling transactions with temporal constraints: exploiting data semantics’,Knowledge and Data Engineering, IEEE Transactions on 14(5), 1155–1166.
Yang, F., Tschetter, E., Merlino, G., Ray, N., Leaute, X. & Ganguli, D. (2013), ‘Druid:A real-time analytical data store’.
42

A Interview questions
• What is your position?
– How many years have you worked in that position?
– How many years have you worked in the industry?
• Could you describe what type of information you regularly use in your work?
– How often do you work with this information?
– How important is the analysis of this information for your work?
• Do you today have information in periodical reports you would like to have instantaccess to?
– If yes, what type of data?
• How long time do you think is acceptable to wait from the information is createduntil it is visible on your screen?
– Is the threshold for acceptable time the same for all information you use?
• Do you today have information in different reports/systems that you would like toanalyze/visualize in the same graph/dashboard?
• Do you perceive the dashboard as beneficial to your work?
– What functionality in the system have you tried?
– Describe what functionality you found most valuable.
– Is there any functionality you miss in the system?
– Could you describe a scenario where this functionality would make your workeasier?
• Which web browser(s) did you use to access the system?
– If more than one, was the user experience similar on all browsers?
• Which type of device did you use to access the system? (Computer, Smartphone,Information display, etc.)?
– If more than one, was the user experience satisfying on all devices?
43

APPENDIX A. INTERVIEW QUESTIONS
• Have you tried adding new data sources?
• Have you created an add-on to another software tool that inserts data into thedashboard-system?
• Have you used any similar tools? If yes, which ones?
– How does this system compare to those tools?
• Do you believe you have gained a stronger base to stand on when making decisionsusing this new system?
• Is there anything you would like to add?
44

B User stories
B.1 Functional
B.1.1 Control panel
ID: DF:Con-1 User story: As auser I want to beable to manage mydashboards
Origin: Product owner Dependency:
Description: There should be a control panel where users can manage their dash-boards and widgets.
Rationale: Users shall be able manage their dashboards.
ID: DF:Con2 User story: As auser I want to beable to create dash-boards
Origin: Product owner Dependency: DF-Con-1
Description: Users shall be able to create their own dashboards in the control panel.
Rationale: Users shall be able to have different dashboard for different screens.
ID: DF:Con-3 User story: As auser I want to beable to create wid-gets
Origin: Product owner Dependency:DF-Con-2
Description: Users shall be able to create widgets to their dashboards in the controlpanel.
Rationale: The dashboard needs to be customizable for all users.
45

B.1. FUNCTIONAL APPENDIX B. USER STORIES
ID: DF:Con-4 User story: As auser I want to savewidget template
Origin: Product owner Dependency:DF-Con-3
Description: Users can save widgets they have created as a template and use witha different data source.
Rationale: To save time for the user when creating a dashboard.
ID: DF:Con-5 User story: As auser I want to beable to share wid-gets
Origin: Product owner Dependency:DF-Con-4
Description: Users shall be able to share widgets with other users.
Rationale: To help other users to create dashboards faster.
ID: DF:Con-6 User story: Asa user I want tobe able to combinedata sources in wid-gets
Origin: Product owner Dependency:
Description: Users shall be able to combine data from several sources in a widget.
Rationale: Helps users to see how different data sources affect each other and geta better understand of the current state of their project.
ID: DF:Con-7 User story: As auser I want to beable to log in
Origin: Product owner Dependency:
Description: Users needs to log in to be able to manage their dashboards.
Rationale: Only users that should have access to the system should be able allowedto use it.
B.1.2 Client
ID: DF:Cli-1 User story: Origin: Product owner Dependency:
Description: The client should load a configuration file from the server that de-scribes what the dashboard interface contains.
Rationale: The client should be customizable and only need to load a differentconfiguration file to look different.
46

B.1. FUNCTIONAL APPENDIX B. USER STORIES
B.1.3 Interface
ID: DF:Int-1 User story: As auser I want to inter-act with the dash-board
Origin: Product owner Dependency:
Description: Users shall be able to drill down into the information in the widgetsand the surrounding widgets should update to show information relevant to theselection.
Rationale: The dashboard shall help users to visual data as they want.
ID: DF:Int-2 User story: As auser I want to beable use the systemon all my devices
Origin: Product owner Dependency:
Description: The dashboard shall work on all devices that have a modern webbrowser.
Rationale: The system shall work on all types of devices.
ID: DF:Int-3 User story: As auser I want to visu-alize data on a map
Origin: Product owner Dependency:
Description: The dashboard shall be able to visualize data on a map.
Rationale: Maps are good to visualize position data.
ID: DF:Int-4 User story: As auser I want to visu-alize data in a table
Origin: Product owner Dependency:
Description: The dashboard shall be able to visualize data in table form.
Rationale: Tables are good for combining data, e.g. project data from differentsources.
47

B.2. QUALITY APPENDIX B. USER STORIES
ID: DF:Int-5 User story: As auser I want to seea bar chart over thedata
Origin: Product owner Dependency:
Description: The dashboard shall be able to show bar charts with data.
Rationale: Graphs is a good way to visualize data to the user.
ID: DF:Int-6 User story: As auser I want to seea line chart over thedata
Origin: Product owner Dependency:
Description: The dashboard shall be able to show a line chart with data from thedifferent sources.
Rationale: Graphs is a good way to visualize data to the user.
B.2 Quality
B.2.1 Interoperability
ID: DQ:IO-1 User story: Origin: Product owner Dependency:
Description: Communications between server and client must have support for theJava programming language.
Rationale: The server side of the application will be written in Java.
ID: DQ:IO-2 User story: Origin: Product owner Dependency:
Description: Communications between server and client must have libraries forJavaScript.
Rationale: The client side application will be written in JavaScript.
ID: DQ:IO-2 User story: Soft-ware licenses
Origin: Product owner Dependency:
Description: The components in the system need to have software licenses thatallow the customer to sell the system without having to publish the source code.
Rationale: The system is going to be a part of a product.
48
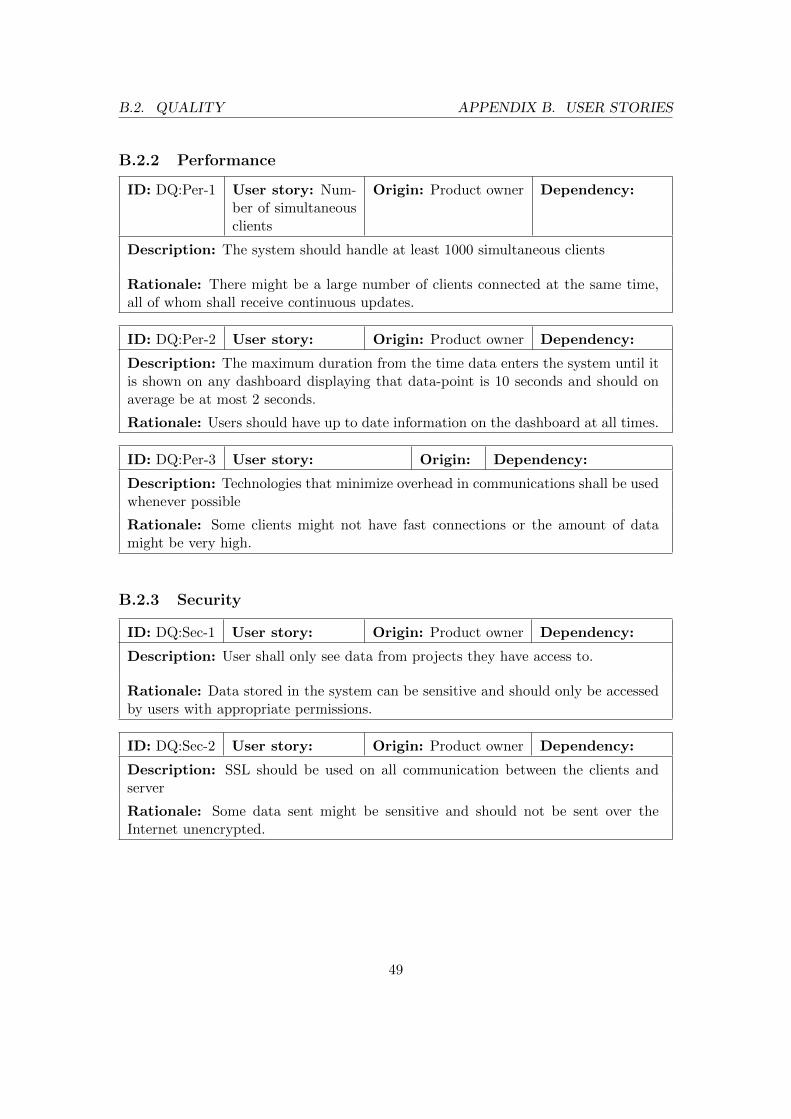
B.2. QUALITY APPENDIX B. USER STORIES
B.2.2 Performance
ID: DQ:Per-1 User story: Num-ber of simultaneousclients
Origin: Product owner Dependency:
Description: The system should handle at least 1000 simultaneous clients
Rationale: There might be a large number of clients connected at the same time,all of whom shall receive continuous updates.
ID: DQ:Per-2 User story: Origin: Product owner Dependency:
Description: The maximum duration from the time data enters the system until itis shown on any dashboard displaying that data-point is 10 seconds and should onaverage be at most 2 seconds.
Rationale: Users should have up to date information on the dashboard at all times.
ID: DQ:Per-3 User story: Origin: Dependency:
Description: Technologies that minimize overhead in communications shall be usedwhenever possible
Rationale: Some clients might not have fast connections or the amount of datamight be very high.
B.2.3 Security
ID: DQ:Sec-1 User story: Origin: Product owner Dependency:
Description: User shall only see data from projects they have access to.
Rationale: Data stored in the system can be sensitive and should only be accessedby users with appropriate permissions.
ID: DQ:Sec-2 User story: Origin: Product owner Dependency:
Description: SSL should be used on all communication between the clients andserver
Rationale: Some data sent might be sensitive and should not be sent over theInternet unencrypted.
49

B.2. QUALITY APPENDIX B. USER STORIES
B.2.4 Usability
ID: DQ:Usa-1 User story: Origin: Product owner Dependency:
Description: The Dashboard should work in all popular web browsers, InternetExplorer 9 or newer
Rationale: The system is going to be used by different users on different computers.
ID: DQ:Usa-2 User story: Origin: Product owner Dependency:
Description: The interface should feel responsive to the end user.
Rationale: Users do not like systems that are slow and do not responds to theiractions
ID: DQ:Usa-3 User story: Origin: Product owner Dependency:
Description: The system shall be able to send data to clients of any type.
Rationale: It should be possible to extend the system to other clients then webbrowsers.
ID: DQ:Usa-4 User story: Origin: Product owner Dependency:
Description: A user with computer usage experience should be able to create basicwidgets
Rationale: The system should be easy to understand and use.
B.2.5 Reliability
ID: DQ:Rel-1 User story: Lostconnection to server
Origin: Product owner Dependency:
Description: The dashboard shall show the received information even if connectionto the server is lost. But interaction with the data are disabled until connection isreestablished
Rationale: Users should still see the received information even if the connection islost.
ID: DQ:Rel-3 User story: Origin: Product owner Dependency:
Description: The server shall re-send messages not received by the client.
Rationale: If the client perform aggregations of the data, it is vital that all datapoints exist.
50

B.2. QUALITY APPENDIX B. USER STORIES
ID: DQ:Rel-4 User story: Origin: Product owner Dependency:
Description: If the connection to the server is lost. The client shall automaticallyreconnect.
Rationale: No user interaction shall be required to restore a lost connection.
ID: DQ:Rel-5 User story: Origin: Product owner Dependency:
Description: The system shall allow for scaling without large reconstruction.
Rationale: System shall be future proof to some extent.
B.2.6 Adaptability
ID: DQ:Ada-1 User story: Newdata sources
Origin: Product owner Dependency:
Description: The system should have a standardized way to send data and addnew sources.
Rationale: It should be easy to add new data sources without having to modifyany part of the system.
B.2.7 Portability
ID: DQ:Por-1 User story: Origin: Dependency:
Description: The server shall run on the newest Java application servers and servletcontainers.
Rationale: Full functionality is expected to work on newest servers
51

C Framework selection
There exist several frameworks that can be used for communication over WebSocketbetween client and server. To select the communication framework most suited for oursystem the following criterion was used:
• WebSocket support - The framework should support WebSocket by itself with-out any extra systems.
• Automatic fallback - The framework should have support for automatic fallbackto another technique for communication for clients that do not support WebSocket.
• GWT - It is preferred if the framework has support for GWT as this is the toolkitselected to create the client.
• JavaScript - To support easy development of new clients for developers that donot want to use GWT or if the framework does not support GWT.
• Multiple communication protocols - It is better if the framework supportdifferent standards for sending and receiving messages so different types of clientsand data source generators can be connected.
• Deploy to different servlets - The framework need to support different servletimplementations as the system should be easy to deploy on different servers.
The most popular open source alternatives found where: JBoss Errai1, Play frame-work2, CometD3, Atmosphere4 and jWebSocket5. A quick comparison between theframeworks is listed in table C.1. Standardized support for WebSocket will be avail-able in Java EE 7 on its release in Q2 2013 (DeMichiel & Shannon 2013). As it is notyet released, it will not be taken under consideration in this thesis. As mentioned inthe thesis, Spring framework is used in the system, the most convenient would be to useSpring for communication with clients as well. Unfortunately, Spring does not supportWebSocket communication in the current version, 3.2. It is however under developmentand will most likely be supported in release 4.0 (Stoyanchev 2012).
1http://www.jboss.org/errai2http://www.playframework.com/3http://cometd.org/4https://github.com/Atmosphere/atmosphere5http://jwebsocket.org/
52

C.1. SAMPLE APPLICATION APPENDIX C. FRAMEWORK SELECTION
JBos
sE
rrai
Pla
yfr
amew
ork
Com
etD
Atm
ospher
e
jWeb
Soc
ket
WebSocket Yes* Yes Yes Yes Yes
Automatic fallback Comet No Comet Comet Flash
GWT Yes No Yes Yes Yes
JavaScript Yes Yes Yes Yes Yes
Multiple communication protocols No No No Yes No
Deploy to different servlets Yes** Yes Yes** Yes No
Table C.1: Comparison of Java based WebSocket frameworks*Not in current version of JBoss Application Server** Not tested but should work for most servlets
C.1 Sample application
To determine which framework to use a small sample application were created in all theframeworks except jWebSockets. This was due to the fallback method, flash, which asexplained in the thesis does not work on all phones and tablets.
The purpose of the sample application was to identify strengths and weaknesses ofdifferent frameworks for using the WebSocket implementations in the most commonservlet containers. It was also important to see how they handled legacy clients, thepublisher-subscriber pattern and their ease of use.
The application devised was a very simple one where the user selected which, ofa finite amount, channels the client should subscribe to. All channels sent differentinformation on fixed intervals and the data was displayed and continuously updated bythe client.
C.2 Selected framework
JBoss Errai was not selected because WebSocket only worked when running the latestbeta version of JBoss Application Server. Play framework did not support automaticfallback and since all targeted browsers do not support WebSocket, Play framework wasnot selected. CometD only support WebSocket when deployed on Jetty. The frameworkwe decided to use in the system is Atmosphere since it has better support for differentservlet containers and has a good implementation for GWT.
53

D Quantitative study
In this appendix, the configuration used in the stress test is presented. Figure D.4 is thedata source used in the test. The chart configurations used can be seen in figure D.5and D.6. The system load collected during the time series test can be found in table D.1and for the group by test in table D.2
#!/bin/bash
url="http://localhost:8888/rest/client/newdata"
source="stressdata1"
sleep=$1 # sleep interval between requests
while true
do
nameValue=$(shuf -i 97-122 -n 1)
name=$(printf \\$(printf "%o" $nameValue))
value=$(shuf -i 1-100 -n 1)
curl -H "Content-type: application/json" \
-H "Accept: application/json" \
-k \
--connect-timeout 5 \
-X POST -d "{\"source\":\"$source\",\"data\":{\"name\":\"$name\",\"value\":$value}}" \
$url &
sleep $sleep
done
Figure D.1: Script used to generate events during the stress-test.
54

APPENDIX D. QUANTITATIVE STUDY
{
"data":{
"stressdata1":{
"aggregations":[
{
"fieldName":"ts_insert",
"name":"ts_insert",
"type":"value"
},
{
"fieldName":"rtt",
"name":"RTT",
"type":"value"
}
]
}
},
"clientToken":"StresstestSub",
"metric":true,
"queryType":"TIMESERIES"
}
Figure D.2: Time series subscription used in stress-test
{
"data":{
"stressdata1":{
"aggregations":[
{
"fieldName":"name",
"name":"name",
"type":"value"
},
{
"fieldName":"value",
"name":"value",
"type":"sum"
}
],
"dimensions":[
"name"
]
}
},
"clientToken":"stresstest2Sub",
"metric":true,
"queryType":"GROUPBY"
}
Figure D.3: Group by subscription used in stress-test
55

APPENDIX D. QUANTITATIVE STUDY
{
"name":"Stressdata1",
"identifier":"stressdata1",
"priority":1,
"columns":[
{
"identifier":"name",
"name":"name",
"datatype":"string"
},
{
"identifier":"value",
"name":"value",
"datatype":"integer"
}
]
}
Figure D.4: Data source used in the test
{
"title":"stresstest",
"type":"barchart",
"dimensions":{
"xaxis":{
"field":"StresstestSub/stresstestdata1/ts_insert",
"label":"Time inserted in database",
"limit":30
},
"yaxis":{
"field":"StresstestSub/stresstestdata1/value",
"label":"Value"
}
}
}
Figure D.5: Time series chart used in latency test
56

APPENDIX D. QUANTITATIVE STUDY
{
"title":"stresstest2",
"type":"barchart",
"dimensions":{
"xaxis":{
"field":"stresstest2Sub/stresstestdata1/name",
"label":"Name",
"limit":26
},
"yaxis":{
"field":"stresstest2Sub/stresstestdata1/value",
"label":"Value"
}
}
}
Figure D.6: Group by chart used in latency test
Clie
nts
Mes
sage
/sec
ond
Java
cpu
MyS
QL
cpu
Trans
mitt
ed
Rec
eive
d
1
1 1.5 % 0.1 % 6.58 kbit/s 5.16 kbit/s
10 15.78 % 0.76 % 34.22 kbit/s 26.4 kbit/s
20 13.8 % 1.22 % 52.27 kbit/s 110.13 kbit/s
5
1 1.72 % 0.33 % 36.71 kbit/s 22.4 kbit/s
10 12.44 % 1.58 % 210.22 kbit/s 126.76 kbit/s
20 11.36 % 1.64 % 123.39 kbit/s 154.84 kbit/s
10
1 2.7 % 0.58 % 75.82 kbit/s 41.96 kbit/s
10 19.1 % 2.54 % 442.84 kbit/s 252.09 kbit/s
20 18.93 % 2.59 % 318.13 kbit/s 309.07 kbit/s
25
1 5.96 % 1.14 % 183.56 kbit/s 101.24 kbit/s
10 40.46 % 5.56 % 1.09 Mbit/s 631.91 kbit/s
20 35.88 % 4.84 % 663.64 kbit/s 740.27 kbit/s
50
1 9.69 % 1.97 % 366.31 kbit/s 196.98 kbit/s
10 68.33 % 9.38 % 2.23 Mbit/s 1.35 Mbit/s
20 58.28 % 7.94 % 1.43 Mbit/s 1.51 Mbit/sTable D.1: Server load during time series test
57

APPENDIX D. QUANTITATIVE STUDY
Clie
nts
Mes
sage
/sec
ond
Java
cpu
MyS
QL
cpu
Trans
mitt
ed
Rec
eive
d
1
1 0.56 % 0.13 % 5.87 kbit/s 10.31 kbit/s
10 5.14 % 1.3 % 33.24 kbit/s 103.29 kbit/s
20 10.63 % 3.14 % 62.58 kbit/s 193.6 kbit/s
80 32.42 % 23.4 % 237.87 kbit/s 736.98 kbit/s
5
1 2.01 % 0.24 % 37.24 kbit/s 27.11 kbit/s
10 15 % 2.42 % 351.82 kbit/s 323.64 kbit/s
20 21.6 % 5.08 % 536.8 kbit/s 720 kbit/s
80 46.73 % 24.32 % 670.67 kbit/s 2.21 Mbit/s
10
1 1.99 % 0.37 % 62.4 kbit/s 63.73 kbit/s
10 19.17 % 3.6 % 574.58 kbit/s 758.76 kbit/s
20 36.84 % 7.39 % 1.08 Mbit/s 1.43 Mbit/s
80 70.64 % 25.92 % 1.62 Mbit/s 4.39 Mbit/s
25
1 4.87 % 0.8 % 194.4 kbit/s 251.73 kbit/s
10 40.22 % 6.49 % 1.46 Mbit/s 1.74 Mbit/s
20 74.44 % 12.78 % 2.93 Mbit/s 3.29 Mbit/s
80 104.21 % 29.59 % 3.48 Mbit/s 10.3 Mbit/s
50
1 8.3 % 1.43 % 356.53 kbit/s 480.62 kbit/s
10 68.78 % 10.31 % 2.94 Mbit/s 3.58 Mbit/s
20 123.36 % 19.1 % 5.76 Mbit/s 6.75 Mbit/s
80 55.18 % 21.58 % 3.34 Mbit/s 11.16 Mbit/sTable D.2: Server load during group by test
58