master’s thesis in economics the association between
TRANSCRIPT

Master’s thesis in Economics
The association between integrated thinking and corporate
reporting quality
Moderating effects of board of directors’ and audit committee characteristics
Abstract
This study examines the relationship between integrated thinking and corporate reporting quality.
Specifically, by means of agency and stakeholder theory, it is examined whether integrated thinking
implementation fulfills the need for information asymmetry reduction and increased stakeholder
focus. Moreover, this study looks into whether integrated thinking might increase the voluntary
disclosure of higher quality information. Corporate reporting quality is measured by means of
financial and non-financial reporting quality proxies. This study explores potential moderating effects
of characteristics of the board of directors, such as its size, independence and gender diversity, and
the audit committee, such as its expertise and independence. Using a sample of 100 European
organizations for the period of 2009-2019, the results indicate that integrated thinking has a positive
effect on financial reporting quality, but not on corporate and non-financial reporting quality.
Additionally, board size, board independence, board gender diversity, audit committee expertise and
audit committee independence all are shown to have either short or long term positive moderating
effects on the association between integrated thinking and reporting quality. The findings are useful
for stakeholders, regulators and standard setters, as an increased focus on these internal assurance
mechanisms could lead to enhanced integrated thinking and reporting quality.
Keywords: Integrated thinking, integrated reporting, corporate reporting quality, corporate
governance mechanisms, board of directors, audit committee, moderating effect
Name Jesse Lemajnski
Student number 4612590
Supervisor Dr. D. Reimsbach
Specialization Accounting and Control
Date 25th of June 2021

2
Contents
1. Introduction ..................................................................................................................................... 3
2. Theoretical background and hypotheses development .................................................................. 7
2.1 Non-financial information disclosure ...................................................................................... 7
2.2 Integrated thinking and corporate reporting quality .............................................................. 9
2.2.1 Financial reporting quality ............................................................................................. 10
2.2.2 Non-financial reporting quality ..................................................................................... 11
2.3 Corporate governance mechanisms ...................................................................................... 12
2.3.1 Board of directors .......................................................................................................... 13
2.3.2 Audit committee ............................................................................................................ 16
3. Research design ............................................................................................................................. 18
3.1 Sample ................................................................................................................................... 18
3.2 Measurement of variables .................................................................................................... 19
3.2.1 Dependent variable ....................................................................................................... 19
3.2.2 Independent variable .................................................................................................... 23
3.2.3 Moderating variables .................................................................................................... 23
3.2.4 Control variables............................................................................................................ 24
3.3 Regression model specification ............................................................................................. 26
4. Data analysis and results ............................................................................................................... 27
4.1 Descriptive statistics .............................................................................................................. 27
4.2 Statistical assumption tests ................................................................................................... 29
4.3 Hypothesis testing ................................................................................................................. 30
4.4 Additional lag analysis ........................................................................................................... 33
4.5 Robustness analysis ............................................................................................................... 36
5. Discussion and conclusion ............................................................................................................. 37
5.1 Discussion .............................................................................................................................. 37
5.2 Conclusion ............................................................................................................................. 38
5.3 Limitations and future research ............................................................................................ 40
References ............................................................................................................................................. 42
Appendices ............................................................................................................................................ 53
Appendix A: Statistical assumption tests .......................................................................................... 53
Appendix B: Additional robustness regression analyses ................................................................... 55

3
1. Introduction
The communicative burden placed on organizations with regard to their corporate disclosure has
increased rigorously in the past decades (Beretta & Bozzolan, 2008; Healy & Palepu, 2001). Fueled by
the accumulation of recent scandals, crises and climate change, there is a longing desire for an
increase in the quality of corporate reporting. Past events, like those of Enron and Worldcom’s
misleading financial disclosure and Volkswagen’s emission scandal, have changed stakeholders’
confidence in the way organizations carry out their disclosure. Confidence should be restored by
aiming for full transparency, responsibility and accountability (Borgia, 2005). Organizations have
been put under more pressure by shareholders, stakeholders and society in general, to become
‘good corporate citizens’ (Epstein & Buhovac, 2014). They are expected to complement their
financially oriented goals by conforming to sustainability related quality concerns regarding
environmental, social and governmental (ESG) issues and thus become more focused on their long
term impacts (Berger, Cunningham, & Drumwright, 2004).
To address the demand for increased transparency, responsibility and accountability, issuing
non-financial reports in combination with financial reports is seen as the main strategy (Rupley,
Brown, & Marshall, 2017). Stand-alone reports have been criticized for their inability to provide a
complete and thorough understanding of the organization (Bachoo, Tan, & Wilson, 2013). As a result,
integrated reporting adoption is gaining momentum as a holistic form of corporate reporting that
combines annual reports, sustainability reports and corporate governance reports (Rivera-Arrubla &
Zorio-Grima, 2016). There are few cases in which the reporting of non-financial information is
mandated, but integrated reporting is predominantly of voluntary nature. By adopting integrated
reporting, organizations adhere to stakeholder pressure, while simultaneously enhancing their ability
to create “value over the short, medium and long term” (IIRC, 2011, p. 7). This value creation process
arises from addressing issues that were not discussed by mere financial reporting (Lai, Melloni, &
Stacchezzini, 2018).
However, integrated reporting adoption requires a different organizational mentality, as
mainstream corporate reporting is perceived to have severe shortcomings (Feng, Cummings, &
Tweedie, 2017). Individual reports lead to unnecessary complexity, disparity among reporting
frameworks causes lack of unambiguity and corporate reporting in general struggles with the
absence of timeliness and relevance (Adams, 2015; Eccles & Saltzman, 2011; Krzus, 2011;
Rowbottom & Locke, 2016). According to the International Integrated Reporting Council (IIRC),
current corporate reporting especially fails to capture “critical interdependencies between strategy,
governance, operations and financial and non-financial performance” (IIRC, 2011, p. 2). The
integrated reporting framework enables organizations to tackle these interdependencies by

4
connecting financial, social, intellectual, manufactured, human and natural capital to their strategy,
which allows organizations to create value, and thus quality, over time (Feng, Cummings, & Tweedie,
2017). This particular link between capital and strategy essentially illustrates the concept of
integrated thinking, on which the integrated reporting process is founded. Integrated thinking can be
defined as “the active consideration by an organization of the relationships between its various
operating and functional units and the capitals that the organization uses or affects” (IIRC, 2021, p.
3). By taking into consideration the interest of heterogeneous stakeholders with an integrated
approach, organizations could be better fit to provide quality (Busco, Granà, & Quattrone, 2017).
Previous studies have shown that organizations are willing to demonstrate that sustainability
related concerns are inherent in their policy and business operations and thus provide high quality to
their stakeholders (Epstein & Buhovac, 2014; Eweje, 2011). However, the reasoning for this
willingness to voluntarily report on these aspects can differ. Organizations are expected to act
accountably and responsibly towards their stakeholders (Mulgan, 1997). The notion of stakeholder
pressure is closely linked to the legitimacy theory, which suggests that organizations use non-
financial disclosure as a strategy to influence public perception (Dhaliwal, Li, Tsang, & Yang, 2011).
These organizations are forced to satisfy societal expectations, the so-called ‘social contract’, if they
want to continue their operations (Deegan, 2002). Providing higher quality disclosure is therefore in
their best interest. Moreover, signaling theory explains why organizations that provide greater value
attempt to reveal their true nature and strategy towards sustainability by disclosing more non-
financial information, ultimately aiming to increase their market value (Dhaliwal, Li, Tsang, & Yang,
2011). Whereas integrated thinking might lead to organizations providing greater value and thus
higher quality to their stakeholders, these theories suggest that these higher quality organizations
are in turn more likely to voluntarily provide higher quality disclosure.
Interestingly, what these different theories show is that a distinction should be made
between the quantity and the quality of corporate reporting. Rather than making sure that the
disclosed information is concise and material, organizations tend to resort to ‘over reporting’
(Montecalvo, Farneti, & De Villiers, 2018). Even though an increased amount of disclosed information
would seem desirable to reduce information asymmetry (Leuz & Verrecchia, 2000), its impact could
actually be quite damaging for corporate reporting quality. By shifting focus on quality, rather than
quantity, corporate disclosure has the potential to reduce information asymmetry in accordance with
agency theory, by decreasing the amount of private information, ultimately leveling the playing field
for investors (Brown & Hillegeist, 2007). This particular shift in focus is visible in the corporate
reporting literature and requires more attention (Eccles & Serafeim, 2015; Klai & Omri, 2011). More
specific, drivers of corporate reporting quality need to be further explored (Manning, Braam, &
Reimsbach, 2019; Pistoni, Songini, & Bavagnoli, 2018; Vitolla, Raimo, & Rubino, 2019).

5
Some potential drivers of corporate reporting quality can be found in varying corporate
governance mechanisms. Effective corporate governance mechanisms are likely to have a positive
moderating effect on the relationship between integrated thinking and corporate reporting quality
(Hamad, Draz, & Lai, 2020). It is argued that “it takes leadership – a certain kind of leadership – to
transform a business into a sustainable business” (Eweje, 2011). The adoption of integrated thinking
requires a vision, commitment, and leadership for it to have positive effects on corporate reporting
quality (Eweje, 2011). An organization’s stakeholders and its management have to deal with a
separation of ownership and control. According to Cohen et al. (2011), the board of directors and its
audit committee are some of the most crucial corporate governance mechanisms to resolve this
issue. In line with agency theory, the aforementioned corporate governance mechanisms may reduce
information asymmetry and thus aid in the goals of integrated thinking (Odoemelam & Ofoegbu,
2018). Therefore, this study examines the moderating effects of corporate governance mechanisms
such as board monitoring and audit committee effectiveness, to examine whether these mechanisms
have a moderating effect on the relationship between integrated thinking and reporting quality. To
operationalize these moderating effects, this study builds on previous studies that have found effects
on integrated reporting and its quality. These effects are elicited by characteristics such as the board
of director’s size, independence and diversity (Frias-Aceituno, Rodriguez-Ariza, & Garcia-Sanchez,
2013; Hurghiş, 2017; Velte & Stawinoga, 2017) and the audit committee’s independence and
expertise (Haji & Anifowose, 2016), as all are able to influence and put pressure on the integrated
thinking decision-making process (Gunarathne & Senaratne, 2017).
This study examines the relationship between integrated thinking and the quality of corporate
reporting. Moreover, it explores whether there are moderating effects that influence said
relationship. Pistoni et al. (2018) argue that the drivers of corporate reporting quality can be both
internal firm specific characteristics and external environmental characteristics. Therefore, this study
aims to find how and under what circumstances integrated thinking might affect corporate reporting
quality. This leads to the following research question:
How and under what circumstances does integrated thinking elicit corporate reporting quality?
This study aims to contribute to prior research in several ways. First, it fulfills the request of several
studies (Manning, Braam, & Reimsbach, 2019; Pistoni, Songini, & Bavagnoli, 2018; Vitolla, Raimo, &
Rubino, 2019) to look into the drivers of corporate reporting quality more thoroughly. Since
integrated thinking is a relatively new concept, the literature surrounding it is rather scarce.
Moreover, the quantity of corporate reporting in relation to its determinants has been examined

6
before (Odoemelam & Ofoegbu, 2018). Therefore, by shifting the focus to the quality of corporate
reporting, this study aims to contribute to this current knowledge gap. Second, this study examines
the relationship between integrated thinking and corporate reporting quality by examining the
conditions under which the effect might be strengthened or weakened. More specific, the role of
certain board of directors’ and audit committee characteristics as a moderator is explored. This study
is one of the first to examine moderating effects with respect to the relationship between integrated
thinking and corporate reporting quality. Therefore, it might have severe implications for regulators
and standard setters, as governance regulations might prove to be the key to enhance integrated
thinking and corporate reporting quality.
The remainder of this study is structured as follows. Chapter 2 will present the theoretical
background relevant to integrated thinking, corporate reporting quality and the possible moderating
effects of board of directors’ and audit committee characteristics, followed by the development of
hypotheses. Next, chapter 3 will provide the research design including the sample, variables and
model. Chapter 4 contains the data analysis and the results. The last section, chapter 5, includes the
discussion of possible implications, conclusion, limitations and suggestions for future research.

7
2. Theoretical background and hypotheses development
2.1 Non-financial information disclosure
Non-financial information disclosure, such as information regarding economic, social and governance
(ESG) factors and corporate social responsibility (CSR), is highly demanded by stakeholders
nowadays. Stakeholders aim to get a full understanding of the organization, the view provided
should be fair and the valuation of the less tangible assets is crucial for the value-creation process of
the organization (Arvidsson, 2011). Non-financial information disclosure is still mostly of voluntary
nature, whereas the disclosure of financial information is mandated for public organizations. The
rationale behind voluntary non-financial information disclosure practices can be derived from a wide
array of theories, as this practice is too complex to be explained by a single theory (Arvidsson, 2011;
Buhr, 2007; Fernando & Lawrence, 2014).
Agency theory is defined by the agency relationship, in which it differentiates between the
engaging party, the principal, and the party with decision-making authority, the agent (Shehata,
2014). Linking this to voluntary disclosure practices, it is the shareholders, as the principals, that
demand a certain degree of information provision from the management of the organization, the
agent. Their reasoning being, that agents are assumed to be acting in their own interest, following
the idea of opportunistic behavior (Zogning, 2017). Opportunistic behavior is defined as the
manipulation of information accessible to managers and arises from the difference in accessible
information between the two parties, called information asymmetry (Stiglitz, 1985). This clear
conflict of interest is partly resolved by voluntary disclosure of non-financial information, as it both
closes the information gap between principals and agents and convinces stakeholders that
management is acting accordingly (Shehata, 2014; Watson, Shrives, & Marston, 2002). Moreover,
more disclosure could be beneficial for the firm itself, as it was found to enhance the performance
and effectiveness of corporate governance mechanisms (Siagian, Siregar, & Rahadian, 2013).
In the extant literature, voluntary disclosure theory is used to describe the willingness of
organizations to show that non-financial concerns are inherent in their policy and business
operations, and is often related to signaling theory and legitimacy theory (Epstein & Buhovac, 2014;
Eweje, 2011). Disclosure is seen as a tool of communication to stakeholders (Guidry & Patten, 2012).
However, besides using this tool as a way to reduce information asymmetries between agents and
principals, disclosure can also be used in ways in which organizations partake in impression
management in response to social and political pressures (Darrell & Schwartz, 1997; Patten, 1991).
The latter phenomenon stems from the superior information managers have compared to their
stakeholders and is aided by the limitations of accounting regulation and auditing (Guidry & Patten,
2012). Healy and Palepu (2001) describe that contracting, political, and corporate reasons incentivize

8
managers to partake in impression management.
Signaling theory posits that organizations that provide great value and high quality to their
stakeholders tend to signal this to the market (Clarkson, Li, Richardson, & Vasvari, 2008; Healy &
Palepu, 2001). Generally speaking, users of information have to deal with information asymmetry in
an attempt to distinguish superior and inferior performers (Spence, 1973). The (voluntary) disclosure
of information hence closes this information gap by providing credible signals that are both
observable and too costly to imitate by inferior performers (Certo, 2003). One of the main motives
for superior performing organizations to disclose ESG and CSR related information is to distinguish
themselves to attract investors and enhance reputation (Gugerty, 2009). Moreover, by revealing
their true nature and strategy towards sustainability by increasing the quantity of non-financial
information disclosure, organizations are able to increase their market value due to reduced cost of
capital and improved financing (Dhaliwal, Li, Tsang, & Yang, 2011).
Legitimacy theory delineates the actions organizations take to conform to societal
expectations (Cohen, Krishnamoorthy, & Wright, 2004; Deegan, 2002). By adhering to these norms, a
good state of legitimacy can be maintained, which is crucial for an organization’s continued survival
(An, Davey, & Eggleton, 2011). The expectations of society are ever changing and unforeseen
circumstances can lead to severe organizational threats and risks (Fernando & Lawrence, 2014).
Therefore, opposed to signaling theory, legitimacy theory mostly pertains to organizations with
inferior non-financial performance. Whereas superior performers attempt to signal their true
performance, these inferior performers only selectively disclose favorable information to deceive
public perception (Dhaliwal, Li, Tsang, & Yang, 2011). Due to the omission of unfavorable news,
stakeholders and the general public will overestimate an organization’s capabilities, ultimately
legitimizing its actions (Freedman & Patten, 2004; Lindblom, 1994). However, to avoid a bad image,
providing higher quality disclosure is still in their best interest.
Stakeholder theory defines an organization’s ability to create value and its effectiveness in
relation to its stakeholders (Fernando & Lawrence, 2014; Parmar, Freeman, Harrison, Wicks, Purnell,
& De Colle, 2010). These stakeholders can range from shareholders to customers and can be defined
as “any group or individual who can affect or is affected by the achievement of the firm’s objectives”
(Freeman, 2010, p. 49). This theory builds on the idea of accountability and the broader concept of
responsibility (Mulgan, 1997). This concept posits that the organization should not merely focus on
living up to the expectations of its shareholders, but also to the expectations of its stakeholders in
general. This means that organizations are expected to go beyond providing financially oriented
insights that mostly pertain to shareholders and investors. Organizations could do this by reporting
information on its accountability and responsibility regarding its non-financial activities and
externalities (Guthrie, Petty, & Ricceri, 2006; Smith, 2008). Some key assumptions within stakeholder

9
theory deal with the effectiveness of achieving organizational goals, the balancing of conflicting
interests of different stakeholders and the organization’s adherence to financial, social and
environmental responsibilities to its stakeholders (Fernando & Lawrence, 2014). Thus, an
organization’s management is incentivized to voluntarily disclose information beyond what the
market requires to positively influence its stakeholders (Mahoney, 2012; Michelon, 2011).
2.2 Integrated thinking and corporate reporting quality
In contrast to stand-alone reporting, integrated reporting aims to provide organizations with a
holistic approach to corporate reporting that combines annual reports, sustainability reports and
corporate governance reports that were previously being issued separately (Rivera-Arrubla & Zorio-
Grima, 2016; Rodriguez & LeMaster, 2007). This system of reporting is guided by extensive
frameworks and standards that address measurement and disclosure related issues with regard to
the aforementioned capitals, regulations and assurance (IIRC, 2021, p3). Not only does integrated
reporting allow information to be linked to financial statements with more ease, it also adheres to
the call for increased transparency, responsibility and accountability which is in accordance with
stakeholder theory (Lee, 2008; Rupley, Brown, & Marshall, 2017). Whereas the IIRC argues that
stakeholders are offered a comprehensive overview of relevant financial and non-financial
information that focuses on “value over the short, medium and long term” (IIRC, 2011, p. 7), some
argue that pivotal problem areas underlying the integrated reporting framework need to be
addressed before it can “stand the test of time” (Oll & Rommerskirchen, 2018).
Integrated reporting and integrated thinking are two concepts that should go hand in hand if
the goal is to positively influence corporate reporting quality, mostly because integrated reporting
requires a solid foundation on which it should be built (Feng, Cummings, & Tweedie, 2017; Lodhia,
2015). Integrated reporting on its own would lack the underlying organizational mindset inherent
within integrated thinking, which can together be defined as the ‘process’ (Mertins, Kohl, & Orth,
2012). This ‘process’, the “active consideration by an organization of the relationships between its
various operating and functional units and the capitals that the organization uses or affects” (IIRC,
2021, p. 3), could enable a multiplicity of benefits, including increased effectiveness of capital and
resource allocation and it could thus improve the organization’s business strategy (Feng, Cummings,
& Tweedie, 2017). According to Dumai and Dai (2017), a shift from ‘silo thinking’ to ‘integrated
thinking’ is visible within organizations that adopt integrated reporting, evoked by the re-thinking of
strategy, business model and corporate governance. This essentially means that organizational
processes are considered as integrated, rather than separated. In line with agency theory, this has
the potential to decrease information asymmetries and enhance the quality of disclosure. However,

10
a certain level of engagement is required to drive organizational change, as involvement of actors
within the organization is fundamental for the institutionalization of the new reporting practice and
the enhancement of its quality (Guthrie, Manes-Rossi, & Orelli, 2017).
This shift to a state where integrated thinking is embedded into daily organizational affairs is
said to enhance the connectivity between information flows and management reporting, analysis
and decision-making (IIRC, 2021). This is closely linked to one of integrated thinking’s main aims:
better overall internal and external communication. To put it another way, integrated thinking elicits
the conveyance of information of how value is created over time (Venter, Stiglingh, & Smit, 2017). It
is of great importance for organizations to try to balance their short and long term value creation
goals (Churet & Eccles, 2014). Finding this balance depends on the organization’s ability to deal with
unforeseen risks and other economic, social and governance related issues. By managing every
potential source of value, integrated thinking and integrated reporting could provide a long term
outlook that facilitates corporate reports of high quality (De Villiers, Venter, & Hsiao, 2017). This is
mainly due to the fact that these long term outlooks are relevant for stakeholders (Serafeim, 2015).
In summary, integrated thinking ultimately aims to enhance the quality of disclosed
information for stakeholders to ensure efficient capital allocation and to support integrated internal
thinking to emphasize the value creation, preservation and destruction processes of the firm (Barth,
Cahan, Chen, & Venter, 2017). The adoption of integrated thinking and integrated reporting has been
found to positively affect corporate reporting quality, as it provides a clear overview of the firm’s
strategy (Pavlopoulos, Magnis, & Latridis, 2019). Moreover, integrated thinking may allow
organizations to provide value with more ease. Subsequently, in line with signaling theory, these
organizations may signal their increase in value provision by providing corporate disclosure of higher
quality. Additionally, the improved transparency and clarity that comes with integrated reporting
makes it more desirable for stakeholders than stand-alone reporting (Eccles & Krzus, 2014).
Integrated thinking takes the stakeholder’s legitimate needs and interest into account (IIRC, 2021).
Lastly, it is in the organizations best interest to provide high quality information if its goal is to
legitimize its way of doing business. Therefore, it is expected that integrated thinking will have a
positive effect on the quality of corporate reporting. This leads to the following hypothesis:
H1a: There is a positive association between integrated thinking and corporate reporting quality
2.2.1 Financial reporting quality
Corporate reporting quality can be split up into financial reporting quality and non-financial reporting
quality. Prior academic literature lacks a generally accepted definition of financial reporting quality
(Cohen, Krishnamoorthy, & Wright, 2004; Gaynor, Kelton, Mercer, & Yohn, 2016). However, in

11
accordance with the IASB (2021), financial insights should include information on the organization’s
practices and should be of use to investors, lenders and creditors for decision-making and resource
allocation purposes (Gaynor, Kelton, Mercer, & Yohn, 2016). The usefulness of information depends
on several qualitative characteristics. It should be provided in a timely manner (IASB, 2021) and
should be fully, fairly and faithfully represented (Jonas & Blanchet, 2000). It should also be reliable,
which entails that it should be verifiable, neutral, complete and free from error (IASB, 2021). Gassen
and Schwedler (2010) found that there is a trade-off between relevance and reliability, as relevant
outcomes are often less reliable and reliable values are less relevant. Lastly, clear and concise
presentation of information enhances its understandability and usefulness (IASB, 2021).
Financial reporting quality can be exemplified by earnings management, as it has been found
to be inversely related with the existence of earnings management within organizations (Dechow &
Schrand, 2004). According to Healy and Wahlen (1999), “earnings management occurs when
managers use judgment in financial reporting and in structuring transactions to alter financial reports
to either mislead some stakeholders about the underlying economic performance of the company or
to influence contractual outcomes that depend on reported accounting numbers” (Healy & Wahlen,
1999, p. 368). Thus, management’s incentives have a big influence on financial reporting quality
(Gaynor, Kelton, Mercer, & Yohn, 2016). Moreover, earnings management is oftentimes linked to a
poor set of standards and will lead to low quality financial reports (Lo, 2008). Earnings management
practices decrease the faithful representation of the financial statements and therefore decrease
financial reporting quality (DeFond & Zhang, 2014; Jonas & Blanchet, 2000). Opportunistic behavior
in the form of earnings management can be diminished by means of efficient corporate governance
mechanisms. For example, audit committees serve as internal organizational mechanisms and
function as financial reporting overseer and stakeholder protector (McDaniel, Martin, & Maines,
2002). Furthermore, the opportunistic behavior of managers can be counteracted by integrated
thinking, as stakeholders’ needs are embedded within the decision-making processes (IIRC, 2011;
Jonas & Blanchet, 2000). Therefore, integrated thinking and earnings management are expected to
be negatively associated. In addition, earnings management is expected to be negatively related to
financial reporting quality. These expectations can be expressed in the following hypothesis:
H1b: There is a positive association between integrated thinking and financial reporting quality
2.2.2 Non-financial reporting quality
The number of organizations that have adopted non-financial reporting has been steadily increasing
in recent years (Diouf & Boiral, 2017). Acting in a sustainable way encompasses the linkage of
environmental and social issues to economic objectives (GRI, 2020). This approach is oftentimes

12
referred to as the triple bottom line of sustainability (Quick, 2008). Much like financial information,
non-financial information should adhere to similar requirements as it should be full and transparent
(Bachoo, Tan, & Wilson, 2013; Jonas & Blanchet, 2000). In accordance with signaling theory,
organizations are expected to credibly convey high quality non-financial information to their
stakeholders to decrease the knowledge gap between the two parties. However, based on legitimacy
theory, organizations are expected to disclose non-financial information in an attempt to legitimize
their behavior. Disclosing high quality information would be in their best interest.
Whenever integrated thinking is apparent within an organization, decision-making is based
upon the aforementioned sustainability related economic, environmental and social dimensions.
Venter et al. (2017) argue that this coincides with a clear organizational structure in which managers
are coerced to think in an integrated manner. Moreover, Lodhia (2015) states that this organized way
of working ultimately leads to a responsible and proactive way to resolve issues like information
asymmetries, which is in line with both agency and stakeholder theory. The concise way of working
inherent in integrated thinking could therefore also be able to contribute to higher quality (non-
financial) reports on these issues (Venter, Stiglingh, & Smit, 2017). In line with these arguments, the
following hypothesis is formulated:
H1c: There is a positive association between integrated thinking and non-financial reporting quality
2.3 Corporate governance mechanisms
The interconnectedness between integrated thinking and corporate reporting quality is subject to
organizational structures, policies and controls as these have the ability to steer the organization’s
processes towards its objectives (Hamad, Draz, & Lai, 2020). As Eweje (2011) argued, it is impossible
to get a comprehensive view on corporate objectives without having a complete understanding of
how corporate management satisfies the demands of its stakeholders. This is conisistent with
stakeholder theory, which posits that managers have fiduciary obligations to its stakeholders
(Freeman, 1994). To positively affect corporate reporting quality, the adoption of integrated thinking
requires management to show leadership with vision and commitment (Eweje, 2011). As investors
seek to assess the organization’s performance and credibility, more is demanded from organization
in terms of the quality, quantity and integratedness of their reporting practices (Clarkson, Li,
Richardson, & Vasvari, 2008; Sawani, Zain, & Darus, 2010).
Corporate governance mechanisms are organizational structures that can aid in embedding
integrated thinking within organizations (Guthrie, Manes-Rossi, & Orelli, 2017). According to Guthrie
et al. (2017), embedding integrated thinking within organizations could benefit from explicit
13
coercion, which concerns the facilitating process that empowers agents within the organization to
act towards the goals of integrated thinking. Aras and Crowther (2008) noted that organizations with
a more complete understanding of both corporate governance and non-financial issues will provide
more complete and higher quality reports. Previous research that examined the effect of corporate
governance on corporate reporting quality state that poorly governed firms have a higher likelihood
to be associated with financial statement fraud, and thus with lower quality corporate reporting
(Beasley, 1996; Dechow, Sloan, & Sweeney, 1995). Effective corporate governance mechanisms were
found to be complementary in its benefits towards the quality of corporate financial and non-
financial disclosure (Michelon & Parbonetti, 2012).
More specific, with agency theory in mind, the board of directors is seen as the main
corporate governance mechanism that can bring about organizational change and it has the ability to
institutionalize integrated thinking within the organization (Guthrie, Manes-Rossi, & Orelli, 2017;
Nanka-Bruce, 2011). Additionally, Haji and Anifowose (2016) state that the audit committee, as one
of the board’s subcommittees and the organization’s internal assurance mechanism, “functions to
ensure the integrity of non-financial disclosures in the integrated reports” (Haji & Anifowose, 2016,
p. 916). The audit committee thus strongly influences whether the organization discloses quality
information, be it to signal or to legitimize their actions. Moreover, an organization’s stakeholders
and its management have to deal with a separation of ownership and control. According to Cohen et
al. (2011), the board of directors and its audit committee are some of the most crucial corporate
governance mechanisms to resolve this issue. Therefore this thesis examines and differentiates
between board monitoring and audit committee effectiveness to examine their potential moderating
effects on the association between integrated thinking and corporate reporting quality.
2.3.1 Board of directors
As posed by Gillan (2006), the board of directors, the organization’s internal governing body, is often
seen as the lynchpin of corporate governance. It both has an obligation to its shareholders and is
responsible for the organization’s decision-making and monitoring (Gillan, 2006). Also, the board of
directors aims to implement policies for stakeholder engagement and tries to attain holistic
transparency (Frias-Aceituno, Rodriguez-Ariza, & Garcia-Sanchez, 2013). With respect to agency
theory, better monitoring enables the closing of the information gap between principal and agent in
which the interest alignment of both parties is central (Jensen & Meckling, 1976). Previous studies
show that the performance of the board can reduce information asymmetries, protecting
shareholder’s interests in consequence (Michelon & Parbonetti, 2012). Moreover, because of its
responsibility for a clear vision and mission in which sustainability related values are anchored, the

14
board has the ability to force management’s adoption of, and compliance with, non-financial
reporting guidelines (Amran, Lee, & Devi, 2014). Managing board effectiveness therefore has the
potential to moderate the relationship between integrated thinking and corporate reporting quality
(Vitolla, Raimo, & Rubino, 2020). Corporate governance mechanisms, like the board, are the prime
instruments to drive change. For example, by providing greater responsibility and transparency,
more effective boards could enhance the positive effects of integrated thinking on corporate
reporting quality. Put differently, how effective the board is, has the ability to determine and alter
the relationship between integrated thinking and reporting quality.
In the extant literature, the effectiveness of the board in attaining the aforementioned goals
is mostly determined by its characteristics such as its size, independence and diversity (Beasley,
1996; Frias-Aceituno, Rodriguez-Ariza, & Garcia-Sanchez, 2013; Kang, Cheng, & Gray, 2007). First, the
increased agency problems that arise in larger boards cause the monitoring effectiveness of the
board to be less optimal and larger board have also been linked to a lower willingness to disclose
information regarding corporate actions (De Andres, Azofra, & Lopez, 2005). Controversially,
previous research has shown that the presence of a considerable number of directors is associated
with a greater assurance of accurate corporate disclosure (Frias-Aceituno, Rodriguez-Ariza, & Garcia-
Sanchez, 2013). Moreover, Hurghiş (2017) found a direct link between boards of greater size and the
issued integrated report being in accordance with the IIRC framework. In agreement with the latter,
it is believed that the relationship between the integration and the quality of corporate information
is positively moderated by boards of larger size.
Next, the board’s effectiveness significantly increases in case of a greater number of
independent board members. Board independence is characterized by board members that have no
direct involvement with regular business operations (Liao, Luo, & Tang, 2015) and are not officially
associated with the organization in the form of material financial interests (Harjoto & Jo, 2011).
These non-executive directors are known to be striving for proper conduct, ultimately aiming to
attain organizational objectives (Frias-Aceituno, Rodriguez-Ariza, & Garcia-Sanchez, 2013). Greater
independence comes with greater objectivity and non-executive directors have no fear for
reputational losses (Fama & Jensen, 1983). Dependent directors were also found to be associated
with a more short-term orientation, whereas independent directors would take a broader
perspective with regard to financial organizational goals (Johnson & Greening, 1999). This is in
accordance with the findings of Lim et al. (2007), as they state that independent boards generally
disclose more forward looking information. With that in mind, a positive moderating effect of the
independence of the board on the relationship between integrated thinking and corporate reporting
quality is expected.
Last, the board’s diversity can be described as the disparity of characteristics inherent within

15
board members (Frias-Aceituno, Rodriguez-Ariza, & Garcia-Sanchez, 2013). Robinson and Dechant
(1997) declare that greater diversity promotes enhanced problem-solving and increased leadership
effectiveness. Not only is this caused by the fact that different ideas lead to the inclusion of more
perspectives, but also because of the consideration of different ethics, traditions and cultures.
Several studies have shown that both the quality and the quantity of non-financial disclosure are
positively affected by increased board diversity (Andrew, Gul, Guthrie, & Teoh, 1989; Guthrie &
Parker, 1990; Michelon & Parbonetti, 2012). This holds for gender diversity as well, as an increase in
female board members is linked to an increased consideration of non-financial issues due to specific
values inherent in women (Diamantopoulos, Schelgelmilch, Sinkovics, & Bohlen, 2003). For example,
women are considered to be less self-centered, which increases board monitoring effectiveness
(Liao, Luo, & Tang, 2015). The larger extent of ethical perceptions therefore causes gender diverse
boards to outperform boards that are less diverse (Carter, Simkins, & Simpson, 2003; Erhardt,
Werbel, & Shrader, 2003). Also, according to Velte and Stawinoga (2017), greater board diversity is
strongly correlated with stakeholders’ perceptions about the communication processes of the
organization. Consequently, it is expected that the diversity of the board of directors positively
moderates the relationship between integrated thinking and corporate reporting quality.
In line with agency theory, stakeholder theory and the work of Michelon and Parbonetti
(2012), the board of directors and its characteristics is expected to be fundamental to an
organization’s quality of disclosure. Moreover, more effective boards have the ability to indirectly
increase disclosure quality by enhancing integrated thinking. Thus, board monitoring effectiveness is
expected to positively moderate the relationship between integrated thinking and financial, non-
financial and corporate reporting quality. Hence, the following hypotheses have been formulated:
H2a: There is a positive moderating effect of board monitoring effectiveness on the association
between integrated thinking and corporate reporting quality
H2b: There is a positive moderating effect of board monitoring effectiveness on the association
between integrated thinking and financial reporting quality
H2c: There is a positive moderating effect of board monitoring effectiveness on the association
between integrated thinking and non-financial reporting quality

16
2.3.2 Audit committee
One of the board’s responsibility committees to which it can delegate authority is the audit
committee, which is responsible for overseeing the organization’s reporting processes as ‘the
ultimate monitor’ (Klein, 2002). Auditors have criticized audit committees for being ineffective as a
corporate governance mechanism (Cohen, Krishnamoorthy, & Wright, 2004). Nevertheless, the audit
committee ensures the reliability of the organization’s reporting processes by selecting and meeting
with the external auditor (Abdullah & Nasir, 2004). Moreover, it meets separately with senior
financial management, all whilst remaining critical towards whether all parties are still acting in the
organization’s best interests (DeZoort, Hermanson, Archambeault, & Reed, 2002). Next to that, the
audit committee contributes to internal control improvements by aiming for better accountability
and risk management (Bananuka, Nkundabanyanga, Nalukenge, & Kaawaase, 2018). To get a clear
understanding of what the effectiveness of the audit committee implies, the definition by DeZoort et
al. (2002) is used, which states: “an effective audit committee has qualified members with the
authority and resources to protect stakeholder interests by ensuring reliable financial reporting,
internal controls, and risk management through Its diligent oversight efforts” (DeZoort, Hermanson,
Archambeault, & Reed, 2002). This definition highlights the most relevant characteristics for its
moderating effect on the relationship between integrated thinking and corporate reporting quality,
by simultaneously increasing its scope from shareholders to stakeholders (Haji & Anifowose, 2016).
In compliance with stakeholder theory, the audit committee’s duties towards stakeholders should aid
in decreasing the overload of information, thus enhancing its quality (Velte, 2018).
In the extant literature, characteristics such as independence and expertise are used to
determine the effectiveness of the audit committee in attaining the aforementioned goals (Chariri &
Januarti, 2017; Raimo, Vitolla, Marrone, & Rubino, 2021; Velte, 2018). First, the independence of the
board, depicted by number of independent audit committee members, can have significant effects
on the committee’s effectiveness. Much like board independence, audit committee independence is
characterized by members that are not involved in the organization’s day-to-day operations and that
have no material financial interests (Madi, Ishak, & Manaf, 2014). They are less sensitive and
vulnerable to management pressure, reducing the risk of opportunistic behavior (Allegrini & Greco,
2013). In accordance with agency theory, information asymmetries are remedied as independent
directors in the audit committee are better able to impose transparent and high quality disclosure (Li,
Mangena, & Pike, 2012). Audit committee independence has been found to lead to increased and
better voluntary disclosure (Akhtaruddin & Haron, 2010; Patelli & Prencipe, 2007). Therefore, in
accordance with the latter and with Madi et al. (2014), it is believed that the relationship between
integrated thinking and the quality of corporate information is positively moderated by the
independence of the audit committee.

17
Next, previous research has found that audit committees with financial expertise can be
linked to a higher effectiveness in accomplishing its oversight duties (Tanyi & Smith, 2015). Financial
expertise can be defined as the inclusion of financial experts in the audit committee (Haji &
Anifowose, 2016). Examples of financial experts are those educated or experienced in accounting,
auditing or finance. Haji and Anifowose (2016) argue that some of the main benefits of audit
committee expertise are that it “mitigates conflicts between management and external auditors;
curbs well internal control weaknesses; results in positive capital market reactions; and enhances
financial and non-financial disclosures” (Haji & Anifowose, 2016, p. 924). Moreover, less earnings
management and fewer accounting restatements are other positive effects associated with audit
committee financial expertise (Tanyi & Smith, 2015). Audit committees with financial expertise cause
managers of the firm to think in an integrated manner (Venter, Stiglingh, & Smit, 2017). The larger
part of previous literature has found financial expertise to be linked to higher quality financial
reporting (Haji & Anifowose, 2016). It is therefore assumed that the association between integrated
thinking and corporate reporting quality benefits from the inclusion of financial experts in the audit
committee.
In line with agency theory and stakeholder theory, as well as the work of Madi et al. (2014)
and Haji and Anifowose (2016), the audit committee and its characteristics, as part of the board of
directors, is expected to have a positive moderating effect on the association between integrated
thinking and financial, non-financial and corporate reporting quality. Therefore, the following
hypotheses have been formulated:
H3a: There is a positive moderating effect of audit committee effectiveness on the association
between integrated thinking and corporate reporting quality
H3b: There is a positive moderating effect of audit committee effectiveness on the association
between integrated thinking and financial reporting quality
H3c: There is a positive moderating effect of audit committee effectiveness on the association
between integrated thinking and non-financial reporting quality

18
3. Research design
3.1 Sample
Within this study, a panel data analysis with a sample consisting of 100 European listed organizations
was conducted. A sample set of 1000 firm-year observations was collected for the period of 2009 to
2019. Due to limited access to the measure for non-financial reporting quality, these 100
organizations have been selected based on full data availability. Table 1 and table 2 show the country
and industry distributions of these organizations respectively. No yearly distinction has been made,
as the organizations remained similar over the years. The relevant financial and non-financial data
has been obtained from the Refinitiv Eikon database, which builds on the ASSET4 database of
Thomson Reuters. For the sake of consistency, the denotation of the Euro is used. Some amounts
denoted in other currencies than the Euro were therefore converted.
Some of the key limitations of research within the realm of corporate reporting quality were
noisy measures of sustainability reporting (Bachoo, Tan, & Wilson, 2013). The Environmental, Social
and Corporate Governance (ESG) data from the Refinitiv Eikon database is a well acknowledged
source as “ESG Scores from Refinitiv Eikon are designed to transparently and objectively measure a
company’s relative ESG performance, commitment and effectiveness across 10 main themes
(emissions, environmental product innovation, human rights, shareholders, etc.) based on publicly-
reported data” (Refinitiv, 2021). Moreover, it provides ESG related indicators in a much needed
systematic and comprehensive way (De Villiers, Rinaldi, & Unerman, 2014; Simnett & Huggins, 2015).
In addition, the ESG transparency disclosure score was obtained from Bloomberg Data Services.
Table 1. Organizations across country distribution (based on ISO codes)
Country Number of firms
Austria 1 (1%)
Belgium 2 (2%)
Denmark 5 (5%)
Finland 6 (6%)
France 16 (16%)
Germany 24 (24%)
Greece 1 (1%)
Italy 4 (4%)
Netherlands 4 (4%)
Norway 1 (1%)
Spain 2 (2%)
Sweden 9 (9%)
Switzerland 8 (8%)
United Kingdom 17 (17%)
Total 100 (100%)

19
Table 2. Organizations across industry distribution (based on SIC codes)
Industry Number of firms
Construction 1 (1%)
Manufacturing 78 (78%)
Mining 4 (4% )
Retail trade 1 (1%)
Services 7 (7%)
Transportation, communication, electric, gas and sanitary services 8 (8%)
Wholesale trade 1 (1%)
Total 100 (100%)
3.2 Measurement of variables
3.2.1 Dependent variable
This study uses corporate reporting quality as its dependent variable. To measure this variable, it has
been divided into two separate proxies, being financial reporting quality and non-financial reporting
quality.
3.2.1.1 Financial reporting quality
Previous studies used a wide variety of measures to capture financial reporting quality, like the
examination of information completeness (Botosan, 1997), information usefulness (Müller, Riedl, &
Sellhorn, 2015) and the likelihood of earnings manipulations (Dechow, Myers, & Shakespeare, 2010).
The latter coincides with the idea of Jonas and Blanchet (2000), who argue that high quality financial
reports should not mislead its users. Instead, they propose that financial reports should provide
sufficient and competent information (Jonas & Blanchet, 2000). These goals are not met when an
organization partakes in earnings manipulation or earnings management. Several studies have shown
that organizations predominantly use two types of earnings management strategies as substitutes:
‘accrual-based earnings management’ and ‘real earnings management’ (Badertscher, 2011; Braam,
Nandy, Weitzel, & Lodh, 2015; Cohen, Dey, & Lys, 2008). Accrual-based earnings management can be
defined as the alteration of accounting procedures and estimates to bias certain transactions in the
organization’s financial statements (Zang, 2012). This way, actual economic performance can be
concealed, while still remaining within the borders of the generally accepted accounting principles
(Dechow & Skinner, 2000). Unlike accrual-based earnings management, which changes the
accounting methods, real earnings management is achieved when reported earnings are altered by
changing the timing or structuring of a business transaction (Roychowdhury, 2006; Zang, 2012). This
study uses accrual-based earnings management and real earnings management as proxies for
financial reporting quality.

20
Accrual-based earnings management
To capture the degree of earnings management within an organization, previous earnings
management studies have used discretionary accruals (e.g. Dechow & Dichev, 2002; Cohen &
Zarowin, 2010; Zang, 2012). To separate discretionary accruals from non-discretionary accruals, the
Jones Model can be used (Bernard & Skinner, 1996). This model has later been modified to adjust for
growth in credit sales by Dechow et al. (1995). The Modified Jones Model serves to reduce failures in
earnings management detection and has been found to be the most powerful model in detecting
earnings management (Dechow, Sloan, & Sweeney, 1995; Jackson, 2018). First, the total accruals
should be determined (Braam, Nandy, Weitzel, & Lodh, 2015):
(1)
where: = total accruals in year t of firm i; = net income in year t of firm i and
= cash flows from operating activities in year t of firm i. Following that, the Modified Jones
Model (Dechow, Sloan, & Sweeney, 1995) can be used to isolate the discretionary part:
(
) (
) (
)
(2)
where: = total assets in year t of firm i; = change in net sales in year t of firm i;
= change in accounts receivables in year t of firm i; = (gross) property, plant and
equipment in year t of firm i. This equation can be separated in a non-discretionary part (
)
(
) (
) and a discretionary part . This residual denotes the discretionary
accruals of which the absolute value is used to determine the degree of accrual-based earnings
management in an organization, now referred to as the proxy ABEM. The degree of ABEM is inversely
related with financial reporting quality.
Real earnings management
A different way of capturing the degree of earnings management within an organization is by altering
reported earnings. Roychowdhury (2006) differentiates between discretionary expenditure
reduction, overproduction and sales manipulation. Accordingly, three proxies can be used to capture
these real earnings management dimensions: abnormal levels of discretionary expenses, abnormal
levels of production costs and abnormal cash flows from operations (Braam, Nandy, Weitzel, & Lodh,

21
2015). Several other earnings management studies have built on Roychowdhury (2006) to derive
corresponding formulas for the three proxies (e.g. Cohen & Zarowin, 2010; Li V., 2019; Zang, 2012).
First, the abnormal levels of discretionary expenses can be estimated using the following equation:
(
) (
)
(3)
where: = discretionary expenses in year t of firm i, sum of SG&A (selling, general and
administrative expenses) and R&D (research and development) expenses. The estimated residual
resulted in the abnormal CFO (REM_CFO). Second, the abnormal levels of production costs can be
estimated using the following equation:
(
) (
) (
) (
)
(4)
where: = production costs in year t of firm i, sum of COGS (cost of goods sold) and the
change in inventory. The estimated residual resulted in the abnormal CFO (REM_PROD). Third, the
abnormal cash flows from operations can be estimated using the following equation:
(
) (
) (
)
(5)
where: = cash flow from operations in year t of firm i. The estimated residual resulted in
the abnormal CFO (REM_DISX). Similar to the approach of Braam et al. (2015), the variables
REM_CFO and REM_DISX have been multiplied by -1 for interpretation purposes, as higher residuals
will then represent higher levels of real activities manipulation. Together, the three proxies can be
combined into the overarching proxy REM. This proxy for real earnings management is inversely
related to financial reporting quality.
3.2.1.2 Non-financial reporting quality
Compared to financial reporting quality, non-financial reporting quality has been relatively
underexplored. However, as high quality reports should provide stakeholders with sufficient
information to assess the organization’s performance, the reports should reflect both positive and
negative aspects of the organization’s performance (Krivačid, 2017). Therefore, a score based system,
like a proxy that enables the quantification of the level of disclosure, can be used to measure non-
22
financial disclosure quality (Bachoo, Tan, & Wilson, 2013). A well-acknowledged proxy for the
measurement of non-financial reporting quality is the trusted and reliable Environmental, Social and
Governance disclosure score (ESG score) from Bloomberg Data Services, which is based on 400
quantitative and qualitative measures to rate an organization’s ESG related policies and practices
(Bloomberg, 2020). However, it should be noted that this ESG score measures transparency and
accountability, rather than performance (Tamimi & Sebastianelli, 2017). Bloomberg combines the
separate scores for environmental, social and governance dimensions into one composite measure
consisting of the most material and best reported metrics (Bloomberg, 2020). The ESG score includes
metrics like greenhouse gas emissions, anti-bribery ethics and the percentage of women on the
board of directors (Tamimi & Sebastianelli, 2017). Organizations are given a score ranging from 0,
meaning no disclosure or low-quality disclosure, to 100, meaning full disclosure or high-quality
disclosure (Bloomberg, 2020). This study therefore uses the Bloomberg ESG score, denoted as
BBESG, to measure the quality of non-financial reporting.
3.2.1.3 Corporate reporting quality
For the determination of the dependent variable corporate reporting quality, financial reporting
quality and non-financial reporting quality needed to be combined. The variables ABEM and REM
were equally weighted in the determination of financial reporting quality, FRQ. The ESG transparency
score from Bloomberg Data Services was used to determine non-financial reporting quality, NFRQ. To
combine FRQ and NFRQ, dummy variables were created for the assessment of the overall corporate
reporting quality. The dummy variable FRQ therefore denotes the organization’s financial reporting
quality and the dummy variable NFRQ captures the organization’s non-financial reporting quality.
These dummy variables allow the sample to be split in two commensurable groups as it uses the
median as a distinctive separator. A dummy variable received a value of 1 in case of the reporting
quality of firm i in year t being above the industry median and 0 otherwise. Subsequently, the
dummy variable for corporate reporting quality, CRQ was created. This dummy variable received a
score of 1 in case of the organization scoring a value of 1 on both the FRQ and the NFRQ and 0 in case
of the organization scoring a 0 on either, or both, of the dummies. This conservative approach has
been chosen over a more detailed approach including multiple dummies to measure corporate
reporting quality on different levels, like has been done in the work of Wang et al. (2018). A single
dummy would be most suitable as an indicator of corporate reporting quality as it includes
organizations that score above median on both financial and non-financial reporting quality.

23
3.2.2 Independent variable
This study uses integrated thinking as its independent variable, denoted as IT. In line with previous
literature, an appropriate proxy is used to determine how well the organization implements CSR
related activities in their organizational thinking (De Villiers, Venter, & Hsiao, 2017; Venter, Stiglingh,
& Smit, 2017). The Corporate Social Responsibility strategy score, taken from the ASSET4 Thomson
Reuters Eikon database, is used as a proxy to determine the degree of integrated thinking. The CSR
strategy score can be used to reflect ‘a company's practices to communicate that it integrates the
economic (financial), social and environmental dimensions into its day-to-day decision-making
processes’, according to the ASSET4 database. It summarizes various vision and strategy aspects that
have to do with an organization’s integration strategy on the basis of twelve separate scores, like
policy, implementation and transparency. This definition is closely linked to the definition of the IIRC
(2021). This measure is an index score ranging from 0 to 100. The CSR strategy score has previously
been used as a measure for integrated reporting quality (Serafeim, 2015), but has later been used as
a measure of integrated thinking as it is better suited as a measure of integratedness rather than
quality (Busco, Malafronte, Pereira, & Staritam, 2019; De Villiers, Venter, & Hsiao, 2017; Venter,
Stiglingh, & Smit, 2017).
3.2.3 Moderating variables
To measure board monitoring and audit committee effectiveness, both variables have been split up
into separate variables and are defined in accordance with the Refinitiv Eikon database (Refinitiv,
2021). Whereas Manning et al. (2019) created a composite measure to capture the effectiveness of
board monitoring, the variables board size, board independence and board gender diversity have
been employed separately to examine board monitoring effectiveness, in line with other studies (Li &
Wahid, 2018; Vitolla, Raimo, & Rubino, 2019). This way it is possible to determine whether and, if
applicable, how strong the separate variables might moderate the relationship between integrated
thinking and reporting quality. The variable BSIZE is used to represent an organization’s board size,
which corresponds to the total number of members on the board at the end of the fiscal year. Board
independence, denoted as BIND, is measured by the percentage of non-executive board members.
Non-executive board members are deemed as independent, as they are not involved in any financial
relationship with the firm (De Villiers, Naiker, & Van Staden, 2011). The diversity of the board of
directors is represented by the numeric variable board gender diversity (BDIV), for which the
percentage of female board members is used. The variables audit committee independence and
audit committee expertise have been employed to examine audit committee effectiveness. Audit
committee independence, denoted as ACIND, is measured as the proportion of non-executive board

24
members to the total of audit committee members, similar to board independence. The dummy
variable ACEXP is used to represent audit committee expertise. This variable states whether the
organization has an audit committee consisting of at least three members and at least one financial
expert, receiving a value of 1, or 0 otherwise. The measurement of these variables is in line with
prior research (e.g. De Andres, Azofra, & Lopez, 2005; De Villiers, Naiker, & Van Staden, 2011; Frias-
Aceituno, Rodriguez-Ariza, & Garcia-Sanchez, 2013; Raimo, Vitolla, Marrone, & Rubino, 2021).
3.2.4 Control variables
This study includes several control variables within the model to control for their possible effects on
the dependent, independent and moderating variables. These control variables consist of firm
characteristics that have been shown to affect the aforementioned variables. Consistent with Braam
et al. (2015), the size of an organization (CSIZE) is used as it is oftentimes closely linked to its quantity
and quality of disclosure. Next to that, larger firms have a higher likelihood to identify and manage
non-financial issues (De Villiers, Naiker, & Van Staden, 2011). The organization’s size is measured by
taking the natural log of total assets of the organization. Next, the organization’s financial leverage
(FINLEV) can be associated with managers being more likely to initiate accounting procedure and
earnings manipulation (DeFond & Jiambalvo, 1994). Additionally, debt levels have been linked to firm
performance (De Villiers, Naiker, & Van Staden, 2011). The financial leverage can be calculated by
means of the debt-to-equity ratio. Discretionary accruals were found to be positively related to
growth opportunities (Braam, Nandy, Weitzel, & Lodh, 2015). Hence, the market-to-book value ratio
(MTBV) is used to analyze the organization’s growth opportunities. Organizations with higher MTBV
ratios are related to greater investment opportunities and better overall performance (De Villiers,
Naiker, & Van Staden, 2011). The return on assets (ROA) of an organization is included to account for
financial performance (FPERF). The model also includes the ESG score from the Eikon Refinitiv
database, which scores an organization’s non-financial performance (NFPERF) on the basis of
environmental, social and corporate governance pillars (Refinitiv, 2021). Both financial and non-
financial performance were found to have positive effects on corporate reporting quality (Hummel &
Schlick, 2016). This study also controls for the assurance of non-financial information by means of the
corporate social responsibility assurance control variable (ASSUR). According to Ballou et al. (2018)
assurance providers have the ability to identify and prevent inaccuracies in reports, thus enhancing
their quality. Also, this study controls for possible industry and year effects by adding dummy
variables for each of them, consistent with prior literature (Cho & Patten, 2007; De Villiers, Naiker, &
Van Staden, 2011). Table 3 summarizes all implemented variables and their definitions.

25
Table 3. Variable definitions
Variable Definition Data source Independent variable IT Integrated thinking CSR strategy score (“TRESGCGVSS”)
Dependent variables ABEM Accrual-based earnings management Predicted with the Modified Jones model
(1995) REM Real earnings management Predicted with the models for REM_CFO,
REM_PROD and REM_DISX FRQ Financial reporting quality Based on the combination of the standardized
scores of ABEM and REM NFRQ Non-financial reporting quality Based on the Bloomberg Data Services ESG
score, BBESG CRQ Corporate reporting quality Dummy variable based on the combination of
FRQ and NFRQ
Moderating variables BSIZE Board size Total number of board members of the
company (“CGBSDP060”) BIND Board independence Percentage of non-executive board members
of the company (“CGBSO06V”) BDIV Board gender diversity Percentage of women on the board of the
company (“CGBSO03V”) ACIND Audit committee independence Percentage of non-executive board members
on the audit committee (“CGBFDP019”) ACEXP Audit committee expertise Existence of audit committee with at least
three members and one financial expert (“CGBFO03V”)
Control variables CSIZE Company size Natural logarithm of total assets of the
company (“WC02999”) FINLEV Financial leverage The amount of debt the company uses to
finance its assets (“WC08231”) MTBV Market-to-book-value ratio Market value of the company divided by its
book value (“MTBV”) FPERF Financial performance Measured by the return on assets of the
company (“WC08326”) NFPERF Non-financial performance Refinitiv’s ESG score based on environmental,
social and governance pillars (“TRESGCS”) ASSUR External assurance Is the organization externally audited?
(“CGVSDP030”) INDUS Industry classification Industry dummies (SIC codes) YEAR Year Time dummies

26
3.3 Regression model specification
Panel data regressions were run to test this study’s hypotheses. These regression analyses have been
performed in Stata. In order to check for moderating effects, interaction terms have been added for
the variables of board monitoring effectiveness and audit committee effectiveness. These interaction
terms have been centered for interpretation purposes. These interactions can now be interpreted as
effects that are averaged around the mean and it avoids the problem of multicollinearity. The
following three regression models were formulated. These models belong to financial reporting
quality, non-financial reporting quality and corporate reporting quality respectively. Additionally, to
control for causality and to distinguish between short and long term effects, a similar model
including lag effects is used. These lag effects might exist due to some variables needing more time
to develop their respective effects.
(6)

27
4. Data analysis and results
4.1 Descriptive statistics
Table 4 contains the descriptive statistics for the dependent, independent, moderating and control
variables that are included in this study. The financial, non-financial and corporate reporting quality
scores are displayed as dummy variables and include 1200 observations due to some variables using
two year lags within their respective models. Overall, less than half of the observed organizations
scored above average on both financial and non-financial reporting quality, as the mean of CRQ is
0.37. The IT variable is expressed as a percentage. The mean of the integrated thinking percentage is
64.06 and ranged from 1.04 and 99.11, which means that some organizations were found to
implement next to no integrated thinking, whereas other organization almost achieved the full score
for integrated thinking.
The board of director’s size ranged from 2 to 23 and averaged out on a size of 12 board
members. The BIND variable is expressed as a percentage. The observed organizations scored
relatively high on board independence as its mean is 87.7%. The percentage of women on the board
was found to average out at 21.96%, which means that the gender diversity of the board of directors
is relatively low. Much like board independence, audit committee independence scored relatively
high with an average percentage of 95.85. The ACEXP variable is a dummy variable in which
organizations either had an audit committee consisting of at least three members and one financial
expert, or not. Most organizations were found to have audit committee expertise, as its mean is 0.79.
Table 4. Descriptive statistical analysis
Variable Observations Mean Standard deviation Minimum Maximum
CRQ 1,200 0.37 0.48 0 1
NFRQ 1,200 0.57 0.50 0 1
FRQ 1,200 0.59 0.49 0 1
IT 1,000 64.06 26.87 1.04 99.11
BSIZE 1,000 12.39 4.11 2 23
BIND 1,000 87.70 13.96 0 100
BDIV 1,000 21.96 12.01 0 57.14
ACIND 1,000 95.85 11.73 0 100
ACEXP 1,000 0.79 0.41 0 1
CSIZE 1,100 16.46 1.72 11.76 20.70
FPERF 1,000 6.05 6.11 -9.22 32.29
NFPERF 1,000 66.45 16.88 18.86 94.68
FINLEV 1,000 82.40 73.71 0.15 383.84
MTBV 1,000 2.78 2.23 0.34 14.45
ASSUR 1,000 0.83 0.37 0 1 Note: See Table 3 for variable definitions.
28
The control variable CSIZE is expressed as the natural logarithm of the organization’s total assets.
Company size ranged from 11.76 to 20.70. The organization’s financial performance has a mean of
6.05, whereas the organization’s non-financial performance has a mean of 66.45. The return on
assets is used as a proxy for the variable FPERF and the variable NFPERF is based on the ESG score
from Refinitiv (2021). The ratio of debt that the observed organizations used to finance their assets
ranged from 0.15 to 383.84. Lastly, the mean of the market-to-book ratio averaged out on 2.78.
Table 5 sets out the correlations for the variables included in this study. The independent
variable IT is significantly and positively correlated with corporate reporting quality, which might be
an indication of multicollinearity. The variables used to express board monitoring effectiveness are
also significantly and positively correlated with both corporate reporting quality and integrated
thinking. These findings are in line with previous literature as integrated thinking is often considered
to be a governance initiative (Amran, Lee, & Devi, 2014; Venter, Stiglingh, & Smit, 2017). To test
whether these strong correlations suggest multicollinearity, some statistical assumption tests are
performed in the subsequent part.
Table 5. Pearson correlations
1 2 3 4 5 6 7
1 CRQ 1.000
2 NFRQ 0.653* 1.000
3 FRQ 0.640* 0.122* 1.000
4 IT 0.236* 0.359* -0.043 1.000
5 BSIZE 0.125* 0.119* 0.011 0.262* 1.000
6 BIND 0.102* 0.154* -0.027 0.079* 0.332* 1.000
7 BDIV 0.074* 0.208* -0.106* 0.138* -0.056 0.055 1.000
8 ACIND -0.017 0.024 -0.032 0.099* 0.172* 0.170* -0.088*
9 ACEXP 0.057 0.043 0.012 0.245* -0.042 -0.150* 0.040
10 CSIZE 0.179* 0.302* -0.005 0.539* 0.413* 0.240* 0.217*
11 FPERF -0.167* 0.010 -0.336* 0.019 -0.194* -0.129* 0.030
12 NFPERF 0.321* 0.495* -0.039 0.664* 0.263* 0.266* 0.291*
13 FINLEV 0.183* 0.093* 0.241* -0.006 0.210* 0.040 -0.017
14 MTBV -0.144* -0.038 -0.190* -0.057 -0.201* -0.189* 0.119*
15 ASSUR 0.160* 0.288* -0.075* 0.495* 0.152* 0.116* 0.218*
8 9 10 11 12 13 14 15
8 ACIND 1.000
9 ACEXP 0.058 1.000
10 CSIZE 0.034 0.141* 1.000
11 FPERF -0.161* 0.047 -0.073* 1.000
12 NFPERF 0.120* 0.141* 0.645* -0.050 1.000
13 FINLEV 0.086* -0.032 0.074* -0.372* 0.106* 1.000
14 MTBV -0.192* -0.024 -0.174* 0.505* -0.055 0.079* 1.000
15 ASSUR 0.016 0.171* 0.333* -0.079* 0.392* 0.016 -0.042 1.000
* indicates statistical significance at the 5% level. Note: See Table 3 for variable definitions.

29
4.2 Statistical assumption tests
In order to check whether the model used in the panel data regression analysis is not biased and
leads to robust results, some additional tests are performed. These test results can be found under
Appendix A. This is done before de panel data is analyzed, to adhere to the model assumptions of
panel data. First of all, the Hausman test is conducted to determine whether the fixed effects model
fits best with the panel data or if the random effects regression model should be used instead. This
test examines whether the explanatory variables and the error term are correlated. From table A1
can be seen that the Hausman test provides a p-value of 0.0000 (p < 0.01). This means that the null
hypothesis should be rejected, as it states that the error term is uncorrelated with the explanatory
variables. Therefore, the fixed effects model is the appropriate model to use (Yaffee, 2003). The fixed
effects model implicitly controls for the industry dummies.
Subsequently, the Breusch-Pagan/ Cook-Weisberg test is performed to check for
heteroskedasticity. Heteroskedasticity is present whenever the variance of the error terms of a
regression depends on the independent variables. According to the panel data regression
assumptions, the variance of the observation should be approximately identical. Table A2 shows that
the null hypothesis of homoscedasticity is rejected as the test provides a p-value of 0.0000 (p < 0.01).
Therefore, the cluster option is used to correct for heteroskedasticity (and potential autocorrelation),
as this clusters the results per organization (Williams, 2011).
Next, the panel data is tested for multicollinearity in two ways. First, a correlation matrix is
used, followed by the variance inflation factor test. Multicollinearity essentially means that an
independent variable is highly correlated with one or more other independent variable(s). This would
lead to the problem of not being able to distinguish the effect of each individual independent
variable. A value of 0.8 or higher would indicate a strong correlation and a value ranging from 0.5 to
0.8 would indicate a moderate correlation (Alin, 2010). As can be seen in table A3, no correlation
coefficients exceed the 0.8 threshold, which suggests there is no multicollinearity. Additionally, the
variance inflation factor (VIF) test has been performed to control for multicollinearity. Table A4
shows both the VIF and the tolerance (TOL) scores for the variables included in this study. The TOL
score is calculated by dividing 1 by the score of the VIF test. The VIF score can be interpreted as
follows: a score of 1 equals no correlation, whereas a score of 5 and higher indicates a high
correlation (Daoud, 2017). As none of this study’s variables exceed the VIF score of 5, it can be
concluded that there is indeed no multicollinearity in the model, adhering to the assumption of panel
data models.

30
4.3 Hypothesis testing
After these statistical assumption tests, the conditional fixed effects logistic regression model
including the cluster option is used. Six models are run to test the formulated hypotheses, regarding
the effect of integrated thinking on corporate reporting quality and possible moderating effects of
board monitoring and audit committee effectiveness. Models 1 to 6 either take financial, non-
financial or corporate reporting quality as their dependent variable. Models 1, 3 and 5 contain the
logistic regression results without interaction terms, whereas models 2, 4 and 6 incorporate
interaction terms within their respective regressions to identify possible moderating effects. Table 6
shows the results of the logistic regressions after controlling for the effects of the control variables.
Recall that the first set of hypotheses focuses on how strongly corporate reporting quality,
financial reporting quality and non-financial reporting quality are affected by the level of integrated
thinking inherent in organizations. The results in model 1 indicate that IT has a positive and
insignificant effect on corporate reporting quality (β = .016, p = .323). This means that an increase in
integrated thinking within the observed organizations does not lead to an increase in corporate
reporting quality. Therefore, the results provide no support for hypothesis 1a. These results are
inconsistent with previous literature, as integrated thinking was found to have positive significant
effects on corporate reporting quality (Venter, Stiglingh, & Smit, 2017). Next, the results in model 3
show a positive insignificant effect of IT on FRQ (β = .018, p = .210). As there is no significant effect of
integrated thinking on financial reporting quality, there is no evidence for hypothesis 1b. Similarly,
the results in model 5 show a positive and insignificant effect of IT on NFRQ (β = .011, p = .517). On
this basis, hypothesis 1c should also be rejected.
The second set of hypotheses focuses on the expected positive moderating effects of board
monitoring effectiveness on the association between integrated thinking and corporate, financial and
non-financial reporting quality. Model 2, 4 and 6 test these moderating effects by means of
interaction variables, respectively. Model 2, which has corporate reporting quality as its dependent
variable, shows significant effects for IT*BSIZE at the 5% level (β = .007, p = .031) and insignificant
effects for the two other variables for board monitoring effectiveness, being IT*BIND (β = -.000, p =
.737) and IT*BDIV (β = .001, p = .162). These mixed results provide some support for hypothesis 2a.
Similarly, models 6 shows the same mixed moderating effects on the relationship between
integrated thinking and non-financial reporting quality, whereas model 4 shows no significant effects
of these moderating variables on financial reporting quality. Thus, hypothesis 2b should be rejected,
while hypothesis 2c finds some support. This means that of the variables for board monitoring
effectiveness, only board size is found to have a moderating effect on the association between
integrated thinking and corporate and non-financial reporting quality.

31
The third set of hypotheses captures the expectations of positive moderating effects of audit
committee effectiveness on the association between integrated thinking and corporate, financial and
non-financial reporting quality. These moderating effects are tested by the inclusion of interaction
terms in models 2, 4 and 6. Model 4 shows a positive significant effect of IT*ACEXP on FRQ at the 5%
level (β = .038, p = .036). Audit committee expertise therefore slightly positively moderates the effect
of integrated thinking on financial reporting quality. The variable IT*ACIND in model 4 is insignificant
(β = .001, p = .260). These mixed results provide some support for hypothesis 3b. Models 2 and 6
provide no evidence for hypotheses 3b and 3c, as no significant moderating effects have been found
for the audit committee effectiveness variables on the association between integrated thinking and
corporate and non-financial reporting quality respectively. Collectively, the results in table 6 provide
support for hypotheses 2a, 2c and 3b.
Furthermore, some of the control variables show contradictory significant results. Financial
performance is found to have negative significant effects on financial reporting quality at the 5%
level (β = -.144, p = .038). Next to that, financial performance was found to have a positive significant
effect on non-financial reporting quality at the 5% level (β = .129, p = .027). Non-financial
performance is found to have similar significant effects on both corporate reporting quality and non-
financial reporting quality at the 5% and 10% level (β = -.063, p = .017) and (β = .063, p = .063),
respectively. Next, financial leverage (FINLEV) is found to have small positive significant effects on
financial reporting quality at the 1% level (β = .015, p = .000). The control variable MTBV, which is a
proxy for an organization’s growth opportunities, shows negative significant effects on financial
reporting quality at the 1% level (β = -.793, p = .009). Lastly, ASSUR is found to have negative
significant effects on financial reporting quality at the 5% level (β = -1.630, p = .038).

32
Table 6. Logistic regression results
VARIABLES (1) CRQ (2) CRQ (3) FRQ (4) FRQ (5) NFRQ (6) NFRQ IT 0.016 0.017 0.018 0.018 0.011 0.014
(0.016) (0.012) (0.014) (0.015) (0.017) (0.014)
BSIZE 0.377*** 0.384*** -0.108 -0.106 0.349*** 0.369***
(0.121) (0.122) (0.097) (0.101) (0.134) (0.125)
BIND 0.017 0.013 0.003 0.000 0.010 0.032
(0.023) (0.023) (0.010) (0.012) (0.018) (0.024)
BDIV 0.003 0.010 0.006 0.001 0.065** 0.069**
(0.025) (0.028) (0.022) (0.021) (0.030) (0.031)
ACIND -0.006 -0.003 -0.025 -0.015 0.028 0.020
(0.032) (0.027) (0.016) (0.024) (0.026) (0.028)
ACEXP -0.208 -0.279 -0.301 -0.116 0.306 0.409
(0.474) (0.548) (0.466) (0.488) (0.467) (0.498)
ITxBSIZE
0.007**
0.003
0.010***
(0.003)
(0.003)
(0.003)
ITxBIND
0.000
0.001
0.002
(0.001)
(0.001)
(0.001)
ITxBDIV
0.001
0.000
0.001
(0.001)
(0.001)
(0.001)
ITxACIND
0.001
0.001
0.001
(0.001)
(0.001)
(0.001)
ITxACEXP
0.018
0.038**
0.017
(0.018)
(0.018)
(0.023)
CSIZE -0.002 0.384 0.630 0.358 0.218 0.215
(0.940) (0.948) (0.817) (0.838) (0.995) (0.997)
FPERF 0.009 0.016 -0.144** -0.147** 0.129** 0.141**
(0.044) (0.042) (0.069) (0.070) (0.058) (0.056)
NFPERF -0.002 0.003 -0.063** -0.066** 0.063* 0.078**
(0.031) (0.030) (0.026) (0.027) (0.034) (0.032)
FINLEV 0.000 -0.001 0.015*** 0.015*** -0.006 -0.008*
(0.005) (0.005) (0.004) (0.004) (0.005) (0.004)
MTBV -0.326 -0.264 -0.793*** -0.745** -0.179 -0.141
(0.214) (0.204) (0.303) (0.294) (0.190) (0.196)
ASSUR -0.449 0.075 -1.630** -1.508* 0.337 0.574
(1.032) (0.987) (0.787) (0.810) (0.984) (0.998)
Year dummies Yes Yes Yes Yes Yes Yes
Industry dummies Yes Yes Yes Yes Yes Yes
N 439 439 426 426 482 482
Wald X2
54.36 86.22 109.49 165.57 61.93 98.49
Model 2, 4 and 6 include interaction terms. Robust standard errors in parentheses. Note: See Table 3 for variable definitions. *** p<0.01, ** p<0.05, * p<0.1

33
4.4 Additional lag analysis
To distinguish between short and long term effects, the same conditional logistic regression model is
used, which includes 1-year and 2-year lag effects for the independent and moderating variables.
These results are shown in table 7 and 8 respectively. The results in both table 7 and 8 indicate that
integrated thinking has lag effects on financial reporting quality, providing support for hypothesis 1b.
However, the results do not indicate significant lag effects of integrated thinking on corporate and
non-financial reporting quality. Regarding the moderating effects, both tables show significant
moderating effects of board independence on the relationship between integrated thinking and
corporate reporting quality, providing additional support for hypothesis 2a. Moreover, board
independence has significant positive moderating 2-year lag effects on the relationship between
integrated thinking and non-financial reporting quality, providing additional support for hypothesis
2c. Hypothesis 2a is also supported by the moderating 2-year lag effects of board gender diversity.
Next, audit committee independence is found to have positive moderating 1-year lag effects under
model 2 and 4 combined with 2-year lag effects under model 2, providing support for hypothesis 3a
and additional support for 3b. Also, audit committee expertise is found to have moderating 1-year
lag effects on the relationship between integrated thinking and financial reporting quality, providing
further evidence for hypothesis 3b. Collectively, the results in tables 7 and 8 provide support for
hypotheses 1b, 2a, 2c, 3a and 3b.

34
Table 7. Logistic regression results with 1-year lag effects of the independent/ moderating variables
VARIABLES (1) CRQ (2) CRQ (3) FRQ (4) FRQ (5) NFRQ (6) NFRQ ITt-1 0.018 0.011 0.039** 0.044*** -0.008 -0.007
(0.017) (0.016) (0.016) (0.017) (0.014) (0.014)
BSIZEt-1 0.388*** 0.372*** 0.032 0.005 0.168 0.178
(0.136) (0.130) (0.120) (0.127) (0.148) (0.149)
BINDt-1 0.014 -0.051* 0.014 0.017 0.004 -0.022
(0.018) (0.029) (0.012) (0.019) (0.052) (0.046)
BDIVt-1 0.032 0.038 0.027 0.028 0.076** 0.084**
(0.030) (0.035) (0.023) (0.025) (0.037) (0.033)
ACINDt-1 -0.039 -0.009 -0.055* -0.063** 0.051 0.068*
(0.028) (0.028) (0.030) (0.029) (0.033) (0.038)
ACEXPt-1 0.723 0.648 0.373 0.233 0.028 -0.243
(0.506) (0.609) (0.474) (0.535) (0.467) (0.455)
ITxBSIZEt-1
0.003
0.000
0.002
(0.003)
(0.003)
(0.003)
ITxBINDt-1
0.003***
0.000
0.001
(0.001)
(0.001)
(0.001)
ITxBDIVt-1
0.001
0.000
0.000
(0.001)
(0.001)
(0.001)
ITxACINDt-1
0.002*
0.001**
0.001
(0.001)
(0.001)
(0.002)
ITxACEXPt-1
0.020
0.045*
0.034
(0.025)
(0.023)
(0.028)
CSIZE 1.326 1.875* 1.136 1.299 0.855 0.777
(0.911) (1.030) (0.991) (1.090) (1.002) (1.012)
FPERF 0.050* 0.062** -0.067 -0.064 0.118** 0.120**
(0.030) (0.031) (0.061) (0.057) (0.049) (0.048)
NFPERF 0.025 0.034 -0.076** -0.081** 0.104*** 0.101***
(0.030) (0.031) (0.032) (0.032) (0.028) (0.027)
FINLEV -0.002 -0.000 0.014*** 0.015*** -0.010 -0.010*
(0.005) (0.006) (0.005) (0.005) (0.006) (0.005)
MTBV -0.224 -0.157 -0.822** -0.793** -0.003 -0.008
(0.203) (0.198) (0.371) (0.359) (0.198) (0.194)
ASSUR -1.951* -1.811* -1.670 -1.966* 0.180 -0.021
(1.052) (1.068) (1.119) (1.080) (1.086) (1.066)
Year dummies Yes Yes Yes Yes Yes Yes
Industry dummies Yes Yes Yes Yes Yes Yes
N 350 350 361 361 388 388
Wald X2
55.13 80.76 77.68 135.52 73.09 91.44
Model 2, 4 and 6 include interaction terms. Robust standard errors in parentheses. Note: See Table 3 for variable definitions. *** p<0.01, ** p<0.05, * p<0.1
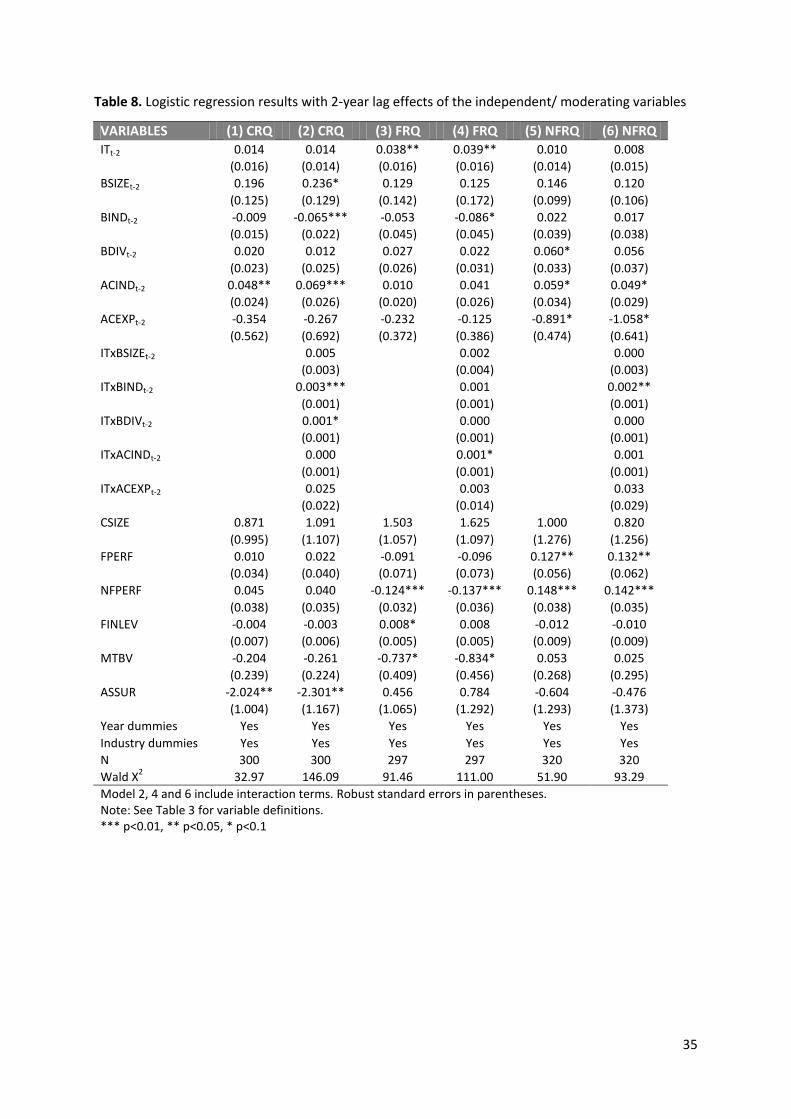
35
Table 8. Logistic regression results with 2-year lag effects of the independent/ moderating variables
VARIABLES (1) CRQ (2) CRQ (3) FRQ (4) FRQ (5) NFRQ (6) NFRQ ITt-2 0.014 0.014 0.038** 0.039** 0.010 0.008
(0.016) (0.014) (0.016) (0.016) (0.014) (0.015)
BSIZEt-2 0.196 0.236* 0.129 0.125 0.146 0.120
(0.125) (0.129) (0.142) (0.172) (0.099) (0.106)
BINDt-2 -0.009 -0.065*** -0.053 -0.086* 0.022 0.017
(0.015) (0.022) (0.045) (0.045) (0.039) (0.038)
BDIVt-2 0.020 0.012 0.027 0.022 0.060* 0.056
(0.023) (0.025) (0.026) (0.031) (0.033) (0.037)
ACINDt-2 0.048** 0.069*** 0.010 0.041 0.059* 0.049*
(0.024) (0.026) (0.020) (0.026) (0.034) (0.029)
ACEXPt-2 -0.354 -0.267 -0.232 -0.125 -0.891* -1.058*
(0.562) (0.692) (0.372) (0.386) (0.474) (0.641)
ITxBSIZEt-2
0.005
0.002
0.000
(0.003)
(0.004)
(0.003)
ITxBINDt-2
0.003***
0.001
0.002**
(0.001)
(0.001)
(0.001)
ITxBDIVt-2
0.001*
0.000
0.000
(0.001)
(0.001)
(0.001)
ITxACINDt-2
0.000
0.001*
0.001
(0.001)
(0.001)
(0.001)
ITxACEXPt-2
0.025
0.003
0.033
(0.022)
(0.014)
(0.029)
CSIZE 0.871 1.091 1.503 1.625 1.000 0.820
(0.995) (1.107) (1.057) (1.097) (1.276) (1.256)
FPERF 0.010 0.022 -0.091 -0.096 0.127** 0.132**
(0.034) (0.040) (0.071) (0.073) (0.056) (0.062)
NFPERF 0.045 0.040 -0.124*** -0.137*** 0.148*** 0.142***
(0.038) (0.035) (0.032) (0.036) (0.038) (0.035)
FINLEV -0.004 -0.003 0.008* 0.008 -0.012 -0.010
(0.007) (0.006) (0.005) (0.005) (0.009) (0.009)
MTBV -0.204 -0.261 -0.737* -0.834* 0.053 0.025
(0.239) (0.224) (0.409) (0.456) (0.268) (0.295)
ASSUR -2.024** -2.301** 0.456 0.784 -0.604 -0.476
(1.004) (1.167) (1.065) (1.292) (1.293) (1.373)
Year dummies Yes Yes Yes Yes Yes Yes
Industry dummies Yes Yes Yes Yes Yes Yes
N 300 300 297 297 320 320
Wald X2
32.97 146.09 91.46 111.00 51.90 93.29
Model 2, 4 and 6 include interaction terms. Robust standard errors in parentheses. Note: See Table 3 for variable definitions. *** p<0.01, ** p<0.05, * p<0.1

36
4.5 Robustness analysis
As the results from the logistic regressions are somewhat contradictory to previous research and not
in line with some of the formulated hypotheses, additional robustness analyses are performed to
check whether these results are consistent. Referring back to tables 1 and 2, the data sample consists
of a set of industries and countries. From table 2 can be seen that 78% of the organizations are in the
manufacturing industry, which might bias the results. Similarly, table 1 shows that Germany (24%),
Great Britain (17%) and France (16%) each take up a large portion of the observed organizations.
Therefore, separate logistic regressions are run in which the manufacturing industry or one of the
aforementioned countries is omitted. Again, the results differentiate between no lag, 1-year lag and
2-year lag effects. The results for the robustness analyses excluding the manufacturing industry and
Germany, France or Great Britain are shown in appendix B.
The removal of the manufacturing industry from the sample causes the results to be slightly
altered compared to the results from table 6 to 8. As can be seen from table B1, different conclusions
can be made on whether the hypotheses should be accepted or rejected. Without the inclusion of
the manufacturing company, evidence for hypotheses 1a and 1c is found as integrated thinking
seemingly positively affects corporate and non-financial reporting quality. Moreover, a positive
significant moderating effect for BIND and ACIND on the association between integrated thinking and
corporate quality is found, whereas other variables that were shown to have significant moderating
effects in the original regression analysis like BSIZE and ACEXP are shown to be insignificant. Similar
inconsistencies can be found in the 1-year and 2-year lag analyses. Even though the omission of the
manufacturing industry causes the results and their interpretation to be slightly different and
inconsistent, it is important to note that leaving out the manufacturing industry severely reduces the
sample size and should thus be interpreted with caution.
Next, when removing the organizations located in Germany, it causes the results to be more
in line with the original analysis. Similar effects, such as the moderating effects of BSIZE on the
relationship between integrated thinking and corporate reporting quality and the moderating effects
of ACEXP on the relationship between integrated thinking and financial reporting quality are found.
Moreover, comparing the 1-year and 2-year lag analyses of the results in which Germany is omitted
to the original results, similar long term (moderating) effects are found, again providing support for
hypotheses 1b, 2a and 3b. Identically, the results for the logistic regressions in which Great Britain or
France is omitted show consistent results. These results might indicate that the sample size became
too small after the omission of the manufacturing industry, but that the original results are found to
be robust according to the robustness analyses that leave out some of the largest countries.

37
5. Discussion and conclusion
5.1 Discussion
The results confirm that there is some evidence for the expected positive association between
integrated thinking and financial reporting quality in the long run. This indicates that the supposed
benefits of integrated thinking, such as the easier linkage of financial statements, the more
comprehensive overview of financial information and the reduction of information asymmetries,
prove to be beneficial for the quality of financial reporting, which is in line with both stakeholder and
agency theory (Lee, 2008; Rupley, Brown, & Marshall, 2017). However, contradictory to what was
expected, there is no evidence for the expected positive relationship between integrated thinking
and corporate or non-financial reporting quality, both short and long term. The supposed benefits of
integrated thinking, such as the elicited conveyance of information of how value is created over time
or the improved transparency and clarity that is said to come with integrated thinking, seem to have
no significant effects on the voluntary disclosure of higher quality non-financial information, finding
no support for both signaling and legitimacy theory (Barth, Cahan, Chen, & Venter, 2017; Eccles &
Krzus, 2014).
In addition, the results confirm that certain characteristics of the board of directors and the
audit committee have moderating effects on the association between integrated thinking and
reporting quality. In the short run, the board’s size was found to positively moderate the relationship
between integrated thinking and both corporate and non-financial reporting quality. This is in line
with the findings of Frias-Aceituno et al. (2013) and Hurgiş (2017), who argue that larger boards are
associated with greater conformance to guidelines and greater assurance of accurate corporate
disclosure. In addition, board independence was found to positively moderate the relationship
between integrated thinking and both corporate and non-financial reporting quality in the long run.
This is in line with the works of Johnson and Greening (1999) and Lim et al. (2007), in which
independent directors are deemed to strive for proper conduct and are associated with the
disclosure of broader and more forward looking information. This could also indicate that the board
of directors’ size and independence might (indirectly) affect whether organizations attempt to signal
or legitimize their corporate behavior by providing higher quality non-financial information. Board
gender diversity was found to have significant long term moderating effects. This is in line with
previous research that found gender diverse boards to be more stakeholder-oriented (Velte &
Stawinoga, 2017).
Audit committee expertise was found to have both short and long term positive moderating
effects on the relationship between integrated thinking and financial reporting quality. This is in line
with previous literature, which claimed that the inclusion of financial experts, such as accountants
38
and auditors, causes firms to think in a more integrated manner, have less internal control
weaknesses and enhance financial disclosure (Haji & Anifowose, 2016). Moreover, according to
DeZoort et al. (2002), qualified audit committee members protect stakeholder interests by ensuring
reliable financial reporting, thus decreasing information asymmetries, which is in line with both
agency and stakeholder theory. However, no moderating effects were found for audit committee
expertise on the relationship between integrated thinking and both corporate and non-financial
reporting quality. This might indicate that financial experts are mainly focused on financial aspects,
whereas non-financial aspects tend to get neglected. Next, audit committee independence was
found to have significant positive moderating effects on the relationship between integrated thinking
and both corporate and financial reporting quality. Similar to independent board members and in
line with agency theory, independent audit committee members tend to reduce the risk of
opportunistic behavior and contribute to more transparent disclosure (Allegrini & Greco, 2013).
However, no evidence is found for moderating effects of audit committee independence on the
relationship between integrated thinking and non-financial reporting quality. This is contradictory to
previous literature, which found audit committee independence to be associated with increased and
better voluntary disclosure (Akhtaruddin & Haron, 2010; Patelli & Prencipe, 2007).
5.2 Conclusion
Organizations are expected to reduce information asymmetries and to provide higher quality
information to their stakeholders. Therefore, by making use of agency and stakeholder theory, this
study examined the relationship between integrated thinking and corporate reporting quality in a
European setting. Additionally, with signaling and legitimacy theory in mind, it examined whether
organizations, that implement integrated thinking to a higher degree, voluntarily provided higher
quality corporate disclosure. This study aimed to examine how and under what circumstances
integrated thinking elicits corporate reporting quality. Thus, it explored whether this relationship
between integrated thinking and corporate reporting quality is moderated by characteristics of the
board of directors and the audit committee, such as size, independence, diversity and expertise. In
order to do so, corporate reporting quality was represented by a combination of financial reporting
quality, for which two earnings management proxies were used, and non-financial reporting quality,
for which the Bloomberg transparency score was used. Three hypotheses were formulated based on
previous literature, each divided in three subcomponents. To test these hypotheses, a conditional
fixed effects logistic regression model including the cluster option was used. Additional lag analyses
were performed to differentiate between short and long term effects.
The first set of hypotheses expected a positive association between integrated thinking and

39
corporate (H1a), financial (H1b) and non-financial reporting quality (H1c). The results provided
evidence for H1b in the long term, but did not support H1a and H1c. This means that a business
strategy that includes both financial and non-financial aspects merely enhances financial reporting
quality, but not non-financial reporting quality. This could indicate that the underlying integrated
reporting framework indeed needs to be addressed before it can “stand the test of time” (Oll &
Rommerskirchen, 2018).
The second set of hypotheses expected a positive moderating effect of characteristics of the
board on the association between integrated thinking and corporate (H2a), financial (H2b) and non-
financial reporting quality (H2c). The results provide some evidence for H2a and H2c, both short and
long term. The board’s size positively moderates the relationship between integrated thinking and
both corporate and non-financial reporting quality short term, whereas the board’s independence
positively moderates the relationship between integrated thinking and both corporate and non-
financial reporting quality long term. Also, support was found for moderating effects of the board’s
gender diversity on the relationship between integrated thinking and corporate reporting quality.
This could indicate that the integratedness of the organization’s strategy and the quality of disclosure
could benefit from larger, more independent and more diverse boards.
The third set of hypotheses expected a positive moderating effect of characteristics of the
audit committee on the association between integrated thinking and corporate (H3a), financial (H3b)
and non-financial reporting quality (H3c). The results do not support H3c, but do provide evidence
for H3a and H3b. Audit committee expertise was found to have positive moderating effects on the
association between integrated thinking and financial reporting quality short term and long term,
whereas audit committee independence was found to positively moderate the association between
integrated thinking and both corporate and financial reporting quality long term. This could indicate
that, contrary to the criticism of Cohen et al. (2004), audit committee effectiveness, in the sense of
more expertise and independence, could contribute to more integratedness and higher quality
disclosure. Thus, referring back to the initial aim of this study to explore how and under what
circumstances integrated thinking elicits corporate quality, this relationship could benefit from
alterations in the board’s size/ independence/ gender diversity and the audit committee’s expertise/
independence.
This study contributes to existing literature by looking into the drivers of corporate reporting
quality, by providing more insights into the realm of integrated thinking and by examining potential
moderating effects on the relationship between integrated thinking and corporate reporting quality.
This study informs regulators and standard setters with evidence that the current integrated thinking
and reporting framework is useful in enhancing financial reporting quality, but not yet able to
increase non-financial reporting quality, which is contradictory to the framework’s aim. Moreover,

40
this study supports the potential significance of the board of directors and the audit committee as
internal assurance mechanisms that can contribute to integrated reporting practices and corporate
disclosure. As Haji and Anifowose (2016) pose that external assurance mechanisms might be too
costly and challenging for some organizations, an increased focus on these internal mechanisms
might prove to be a cost-effective alternative.
5.3 Limitations and future research
The results and conclusions from this study should be interpreted with caution in the light of some
limitations. First, as the disclosure of non-financial information is still mainly of voluntary nature, the
provided non-financial information might be subject to selection bias. Next, the Bloomberg
transparency score also has its limitations, even though it is a well-acknowledged measure for non-
financial information quality that increases comparability, reliability and verifiability. Due to the
limited data availability of the non-financial reporting quality measure from the Bloomberg Data
Services database, the sample size became skewed towards the manufacturing industry, leading to
potentially biased results. Moreover, to determine whether organizations use their disclosure either
as a signaling or legitimation tactic, future studies could differentiate between organizations with
superior and inferior performance. Also, to see how integrated thinking (and reporting) develops
over the coming years and how it might affect reporting quality, future studies should conduct
similar research.
This study’s use of variables and methods should be discussed. Whereas some studies
measured board monitoring and audit committee effectiveness by means of composite measures
(e.g. Manning et al., 2019), this study attempted to look into the separate drivers of board
monitoring and audit committee effectiveness individually. As this study examined only three
measures for board monitoring effectiveness and two measures for audit committee effectiveness,
future studies could look into further measures to get a fuller understanding of what aspects of the
board and audit committee might affect integrated thinking and/ or increase reporting quality.
Examples of such measures could be the presence of different ownership structures, director tenure,
CEO presence and influence, audit committee activity and audit committee diligence.
Moreover, different proxies for financial and non-financial reporting quality could be used to
determine whether the proxies used in this study are robust and consistent. Future studies could, for
example, make use of scores to measure analyst-perceived financial reporting quality (Felo,
Krishnamurthy, & Solieri, 2003) or could create self-made proxies to assess non-financial reporting
quality criteria (Hoffmann, Dietsche, & Hobelsberger, 2018). The method used to determine the
dummy variable for corporate reporting quality, consistent with Braam et al. (2015), which uses the

41
industry median for financial and non-financial reporting quality, could also be altered by using
different demarcations or standardization. The method used in this study loses some of its predictive
power by dividing the separate proxies in dummies. Future research could also look into a more
comprehensive measure for overall corporate reporting quality.
Also, the effects that were examined in this study might be more nuanced, as the effects of
the characteristics of board monitoring and audit committee effectiveness on corporate reporting
quality might depend on, for example, the culture of the countries being studied (He, Labelle, Piot, &
Thornton, 2009). Future studies could therefore distinguish between different cultures. Additionally,
future studies could discriminate between different orientations, for instance between stakeholder
and shareholder-oriented countries. These different orientations were found to determine
differences in the level of voluntary disclosure (Meek, Roberts, & Gray, 1995). Lastly, it could be
interesting to look into whether the effect of integrated thinking on reporting quality differs between
countries with mandatory and voluntary disclosure.
42
References
Abdullah, S., & Nasir, N. (2004). Accrual management and the independence of the boards of
directors and audit committees. International Journal of Economics, Management and
Accounting, 12(1).
Adams, C. (2015). The international integrating reporting council: a call to action. Critical Perspectives
on Accounting, 27, 23-28.
Akhtaruddin, M., & Haron, H. (2010). Board ownership, audit committees' effectiveness and
corporate voluntary disclosures. Asian Review of Accounting.
Alin, A. (2010). Multicollinearity. Wiley Interdisciplinary Reviews: Computational Statistics, 2(3), 370-
374.
Allegrini, M., & Greco, G. (2013). Corporate boards, audit committees and voluntary disclosure:
Evidence from Italian listed companies. Journal of Management & Governance, 17(1), 187-
216.
Amran, A., Lee, S., & Devi, S. (2014). The influence of governance structure and strategic corporate
social responsibility toward sustainability reporting quality. Business Strategy and the
environment, 23(4), 217-235.
An, Y., Davey, H., & Eggleton, I. (2011). Towards a comprehensive theoretical framework for
voluntary IC disclosure. Journal of Intellectual Capital.
Andrew, B., Gul, F., Guthrie, J., & Teoh, H. (1989). A note on corporate social disclosure practices in
developing countries: the case of Malaysia and Singapore. The British Accounting Review,
21(4), 371-376.
Aras, G., & Crowther, D. (2008). Culture and corporate governance. SRRNet.
Arvidsson, S. (2011). Disclosure of non-financial information in the annual report. Journal of
intellectual capital.
Bachoo, K., Tan, R., & Wilson, M. (2013). Firm value and the quality of sustainability reporting in
Australia. Australian Accounting Review, 23(1), 67-87.
Badertscher, B. (2011). Overvaluation and the choice of alternative earnings management
mechanisms. The Accounting Review, 86(5), 1491-1518.
Ballou, B., Chen, P., Grenier, J., & Heitger, D. (2018). Corporate social repsonsibility assurance and
reporting quality: Evidence from restatements. Journal of Accounting and Public Policy, 37(2),
167-188.
Bananuka, J., Nkundabanyanga, S., Nalukenge, I., & Kaawaase, T. (2018). Internal audit function,
audit committee effectiveness and accountability in the Ugandan statutory corporations.
Journal of Financial Reporting and Accounting.

43
Barth, M., Cahan, S., Chen, L., & Venter, E. (2017). The economic consequences associated with
integrated report quality: Capital market and real effects. Accounting, Organizations and
Society, 62, 43-64.
Beasley, M. (1996). An empirical analysis of the relation between the board of director composition
and financial statement fraud. Accounting review, 443-465.
Beretta, S., & Bozzolan, S. (2008). Quality versus quantity: the case of forward-looking disclosure.
Journal of Accounting, 23(3), 333-376.
Berger, I., Cunningham, P., & Drumwright, M. (2004). Social alliances: Company/ nonprofit
collaboration. California management review, 47(1), 58-90.
Bernard, V., & Skinner, D. (1996). What motivates managers' choice of discretionary accruals? Journal
of Accounting and Economics, 22(1-3), 313-325.
Bloomberg. (2020). Bloomberg Impact Report 2020. Bloomberg Data Services.
Borgia, F. (2005). Corporate governance & transparency role of disclosure: how prevent new financial
scandals and crimes. American University Transnational Crime and Corruption Center School
of International Service.
Botosan, C. (1997). Disclosure level and the cost of equity capital. Accounting review, 323-349.
Braam, G., & Peeters, R. (2018). Corporate sustainability performance and assurance on sustainability
reports: Diffusion of accounting practices in the realm of sustainable development.
Corporate Social Responsibility and Environmental Management, 25(2), 164-181.
Braam, G., Nandy, M., Weitzel, U., & Lodh, S. (2015). Accrual-based and real earnings management
and political connections. The International Journal of Accounting, 111-141.
Breusch, T., & Pagan, A. (1980). The Lagrange multiplier test and its applications to model
specification in econometrics. The review of economic studies, 47(1), 239-253.
Brown, S., & Hillegeist, S. (2007). How disclosure quality affects the level of information asymmetry.
Review of accounting studies, 12(2), 443-477.
Buhr, N. (2007). Histories of and rationales for sustainability reporting. Sustainability accounting and
accountability, 57, 59-62.
Busco, C., Granà, F., & Quattrone, P. (2017). Integrated thinking.
Busco, C., Malafronte, I., Pereira, J., & Staritam, M. (2019). The determinants of companies' levels of
integration: does one size fit all? The British Accounting Review, 51(3), 277-298.
Carter, D., Simkins, B., & Simpson, W. (2003). Corporate governance, board diversity, and firm value.
Financial review, 38(1), 33-53.
Certo, S. (2003). Influencing initial public offering investors with prestige: Signaling with board
structures. Academy of management review, 28(3), 432-446.
44
Chariri, A., & Januarti, I. (2017). Audit committee characteristics and integrated reporting: Empirical
study of companies listed on the johannesburg stock exchange.
Cho, C., & Patten, D. (2007). The role of environmental disclosures as tools of legitimacy: A research
note. Accounting, organizations and society, 32(7-8), 639-647.
Churet, C., & Eccles, R. (2014). Integrated reporting, quality of management, and financial
performance. Journal of Applied Corporate Finance, 26(1), 56-64.
Clarkson, P., Li, Y., Richardson, G., & Vasvari, F. (2008). Revisiting the relation between environmental
performance and environmental disclosure: An emperical analysis. Accounting, organizations
and society, 33(4-5), 303-327.
Clarkson, P., Li, Y., Richardson, G., & Vasvari, F. (2008). Revisiting the relation between environmental
performance and environmental disclosure: An empirical analysis. Accounting, organizations
and society, 33(4-5), 303-327.
Cohen, D., & Zarowin, P. (2010). Accrual-based and real earnings management activities around
seasoned equity offerings. Journal of accounting and Economics, 50(1), 2-19.
Cohen, D., Dey, A., & Lys, T. (2008). Real and accrual-based earnings management in the pre- and
post-Sarbanes-Oxley periods. The Accounting Review, 83(3), 757-787.
Cohen, J., Holder-Webb, L., Nath, L., & Wood, D. (2011). Retail investors' perception of the decision-
usefulness of economic performance, governance, and corporate social responsibility
disclosures. Behavioral Research in Accounting, 23(1), 109-129.
Cohen, J., Krishnamoorthy, G., & Wright, A. (2004). The corporate governance mosaic and financial
reporting quality. Journal of accounting literature, 87-152.
Connelly, B., Certo, S., Ireland, R., & Reutzel, C. (2011). Signaling theory: A review and assessment.
Journal of management, 37(1), 39-67.
Council, I. I. (n.d.). The international <IR> framework.
Daoud, J. (2017). Multicollinearity and regression analysis. Journal of Physics: Conference Series,
949(1).
Darrell, W., & Schwartz, B. (1997). Environmental disclosures and public policy pressure. Journal of
accounting and public policy, 16(2), 125-154.
De Andres, P., Azofra, V., & Lopez, F. (2005). Corporate boards in OECD countries: Size, composition,
functioning and effectiveness. Corporate Governance: An International Review, 13(2), 197-
210.
De Villiers, C., Naiker, V., & Van Staden, C. (2011). The effect of board characteristics on firm
environmental performance. Journal of management, 37(6), 1636-1663.
De Villiers, C., Rinaldi, L., & Unerman, J. (2014). Integrated Reporting: Insights, gaps and an agenda
for future research. Accounting, Auditing & Accountability Journal.

45
De Villiers, C., Venter, E., & Hsiao, P. (2017). Integrated reporting: background, measurement issues,
approaches and an agenda for future research. Accounting & Finance, 57(4), 937-959.
Dechow, P., & Dichev, I. (2002). The quality of accruals and earnings: The role of accural estimation
errors. The accounting review, 77(s-1), 35-59.
Dechow, P., & Schrand, C. (2004). Earnings quality.
Dechow, P., & Skinner, D. (2000). Earnings management: Reconciling the views of accounting
academics, practitioners, and regulators. Accounting horizons, 14(2), 235-250.
Dechow, P., Myers, L., & Shakespeare, C. (2010). Fair value accounting and gains from asset
securitizations: A convenient earnings management tool with compensation side-benefits.
Journal of accounting and economics, 49(1-2), 2-25.
Dechow, P., Sloan, R., & Sweeney, A. (1995). Causes and consequences of earnings manipulation: An
analysis of firms subject to enforcement actions by the SEC. Contemporary accounting
research, 13(1), 1-36.
Deegan, C. (2002). The legitimising effect of social and environmental disclosures- a theoretical
foundation. Accounting, Auditing & Accountability Journal, 15(3), 282-311.
DeFond, M., & Jiambalvo, J. (1994). Debt covenant violation and manipulation of accruals. Journal of
accounting and economics, 17(1-2), 145-176.
DeFond, M., & Zhang, J. (2014). A review of archival auditing research. Journal of accounting and
economics, 58(2-3), 275-326.
DeZoort, F., Hermanson, D., Archambeault, D., & Reed, S. (2002). Audit committee effectiveness: A
synthesis of the empirical audit committee literature. Audit Committee Effectiveness: A
synthesis of the empirical audit committee literature, 21, 38.
Dhaliwal, D., Li, O., Tsang, A., & Yang, Y. (2011). Voluntary nonfinancial disclosure and the cost of
equity capital: The initiation of corporate social responsibility reporting. The accounting
review, 59-100.
Diamantopoulos, A., Schelgelmilch, B., Sinkovics, R., & Bohlen, G. (2003). Can socio-demographics still
play a role in profiling green consumers? A review of the evidence and an empirical
investigation. Journal of Business research, 56(5), 465-480.
Diouf, D., & Boiral, O. (2017). The quality of sustainability reports and impression management.
Accounting, Auditing & Accountability Journal.
Dumay, J., & Dai, T. (2017). Integrated thinking as a cultural control? Meditari Accountancy Research.
Eccles, R., & Krzus, M. (2014). The integrated reporting movement: Meaning, momentum, motives,
and materiality. John Wiley & Sons.
Eccles, R., & Saltzman, D. (2011). Achieving sustainability through integrated reporting. Stanford
Social Innovation Review, 3, 56-61.
46
Eccles, R., & Serafeim, G. (2015). Corporate and integrated reporting. A functional perspective.
Corporate stewardship: Achieving sustainable effectiveness, 156.
Epstein, M., & Buhovac, A. (2014). Making sustainability work: Best practices in managing and
measuring corporate social, environmental, and economic impacts. Berrett-Koehler
Publishers.
Erhardt, N., Werbel, J., & Shrader, C. (2003). Board of director diversity and firm financial
performance. Corporate governance: An international review, 11(2), 102-111.
Eweje, G. (2011). A shift in corporate practice? Facilitating sustainability strategy in companies.
Corporate Social Responsibility and Environmental Management, 18(3), 125-136.
Fama, E., & Jensen, M. (1983). Separation of ownership and control. The journal of law and
Economics, 26(2), 301-325.
Felo, A., Krishnamurthy, S., & Solieri, S. (2003). Audit committee characteristics and the perceived
quality of financial reporting: an empirical analysis. Working paper: SSRN 401240.
Feng, T., Cummings, L., & Tweedie, D. (2017). Exploring integrated thinking in integrated reporting-
an exploratory study in Australia. Journal of Intellectual Capital.
Fernando, S., & Lawrence, S. (2014). A theoretical framework for CSR practices: Integrating legitimacy
theory, stakeholder theory and institutional theory. Journal of Theoretical Accounting
Research, 10(1), 149-178.
Freedman, M., & Patten, D. (2004). Evidence on the pernicious effect of financial report
environmental disclosure. Accounting Forum, 28(1), 27-41.
Freeman, R. (1994). The politics of stakeholder theory: Some future directions. Business ethics
quarterly , 409-421.
Frias-Aceituno, J., Rodriguez-Ariza, L., & Garcia-Sanchez, I. (2013). The role of the board in the
dissemination of integrated corporate social reporting. Corporate social responsibility and
environmental management, 20(4), 219-233.
Gassen, J., & Schwedler, K. (2010). The decisoin usefulness of financial accounting measurement
concepts: Evidence from an online survey of professional investors and their advisors.
European Accounting Review, 19(3), 495-509.
Gaynor, L., Kelton, A., Mercer, M., & Yohn, T. (2016). Understanding the relation between financial
reporting quality and audit quality. Auditing: A journal of Practice & Theory, 35(4), 1-22.
Gillan, S. (2006). Recent developments in corporate governance: An overview.
GRI. (2020). GRI Standards Glossary. Global Reporting Initiative (GRI).
Gugerty, M. (2009). Signaling virtue: Voluntary accountability programs among nonprofit
organizations. Policy Sciences, 42(3), 243-273.

47
Guidry, R., & Patten, D. (2012). Voluntary disclosure theory and financial control variables: An
assessment of recent environmental disclosure research. Accounting Forum, 36(2), 81-90.
Gunarathne, N., & Senaratne, S. (2017). Diffusion of integrated reporting in an emerging South Asian
(SAARC) nation. Managerial Auditing Journal.
Guthrie, J., & Parker, L. (1990). Corporate social disclosure practice: a comparative international
analysis. Advances in public interest accounting, 3, 159-175.
Guthrie, J., Manes-Rossi, F., & Orelli, R. (2017). Integrated reporting and integrated thinking in Italian
public sector organisations. Meditari Accountancy Research.
Guthrie, J., Petty, R., & Ricceri, F. (2006). The voluntary reporting of intellectual capital: comparing
evidence from Hong Kong and Australia. Journal of intellectual capital.
Haji, A., & Anifowose, M. (2016). Audit committee and integrated reporting practice: does internal
assurance matter? Managerial Auditing Journal.
Hamad, S., Draz, M., & Lai, F. (2020). The Impact of Corporate Governance and Sustainability
Reporting on Integrated Reporting: A Conceptual Framework. Sage Open, 10(2),
2158244020927431.
Harjoto, M., & Jo, H. (2011). Corporate governance and CSR nexus. Journal of business ethics, 100(1),
45-67.
He, L., Labelle, R., Piot, C., & Thornton, D. (2009). Board monitoring, audit committee effectiveness,
and financial reporting quality: Review and synthesis of empirical evidence. Journal of
Forensic & Investigative Accounting, 1(2).
Healy, P., & Palepu, K. (2001). Information asymmetry, corporate disclosure, and the capital markets:
A review of the empirical disclosure literature. Journal of accounting and economics, 31(1-3),
405-440.
Healy, P., & Wahlen, J. (1999). A review of the earnings management literature and its implications
for standard setting. Accounting horizons, 13(4), 365-383.
Hoffmann, E., Dietsche, C., & Hobelsberger, C. (2018). Between mandatory and voluntary: non-
financial reporting by German companies. Sustainability Management Forum, 26(1-4), 47-63.
Hummel, K., & Schlick, C. (2016). The relationship between sustainability performance and
sustainability disclosure- Reconciling voluntary disclosure theory and legitimacy theory.
Journal of accounting and public policy, 35(5), 455-476.
Hurghiş, R. (2017). Integrated reporting and board features. Audit Financiar, 15, 83-92.
IASB. (2021). Conceptual Framework for Financial Reporting. International Accounting Standards
Board.
IIRC. (2011). Towards integrated reporting: Communicating value in the 21st century. London:
International Integrated Reporting Council.

48
IIRC. (2021). International <IR> Framework. London: International Integrated Reporting Council.
Jackson, A. (2018). Discretionary accruals: earnings management... or not? Abacus, 54(2), 136-153.
Jensen, M., & Meckling, W. (1976). Theory of the firm: Managerial behavior, agency costs and
ownership structure. Journal of financial economics, 3(4), 305-360.
Johnson, R., & Greening, D. (1999). The effects of corporate governance and institutional ownership
types on corporate social performance. Academy of management journal, 42(5), 564-576.
Jonas, G., & Blanchet, J. (2000). Assessing quality of financial reporting. Accounting horizons, 14(3),
353-363.
Kang, H., Cheng, M., & Gray, S. (2007). Corporate governance and board composition: Diversity and
independence of Australian boards. Corporate Governance: An International Review, 15(2),
194-207.
Klai, N., & Omri, A. (2011). Corporate governance and financial reporting quality: The case of Tunisian
firms. International business research, 4(1), 158-166.
Klein, A. (2002). Economic determinants of audit committee independence. The Accounting Review,
77(2), 435-452.
Krivačid, D. (2017). Sustainability reporting quality: the analysis of companies in Croatia. Journal of
accounting and management, 7(1), 1-14.
Krzus, M. (2011). Integrated reporting: if not now, when. Zeitschrift für internationale
Rechnungslegung, 6(6), 271-276.
Lai, A., Melloni, G., & Stacchezzini, R. (2018). Integrated reporting narrative accountability: the role of
prepares. Accounting, Auditing & Accountability Journal, 31(5), 1381-1405.
Lee, M. (2008). A review of the theories of corporate social responsbility: Its evolutionary path and
the road ahead. International journal of management reviews, 10(1), 53-73.
Leuz, C., & Verrecchia, R. (2000). The economic consequences of increased disclosure. Journal of
accounting research, 91-124.
Li, J., Mangena, M., & Pike, R. (2012). The effect of audit committee characteristics on intellectual
capital disclosure. The British Accounting Review, 44(2), 98-110.
Li, N., & Wahid, A. (2018). Director tenure diversity and board monitoring effectiveness.
Contemporary Accounting Research, 35(3), 1363-1394.
Liao, L., Luo, L., & Tang, Q. (2015). Gender diversity, board independence, environmental committee
and greenhouse gas disclosure. The British Accounting Review, 47(4), 409-424.
Lim, S., Matolcsy, Z., & Chow, D. (2007). The association between board composition and different
types of voluntary disclosure. European Accounting Review, 16(3), 555-583.
49
Lindblom, C. (1994). The implications of organizational legitimacy for corporate social performance
and disclosure. Critical Perspectives on Accounting Conference.
Lo, K. (2008). Earnings management and earnings quality. Journal of accounting and economics, 45(2-
3), 350-357.
Lodhia, S. (2015). Exploring the transition to integrated reporting through a practice lens: an
Australian customer owned bank perspective. Journal of business ethics, 129(3), 585-598.
Madi, H., Ishak, Z., & Manaf, N. (2014). The impact of audit committee characteristics on corporate
voluntary disclosure. Procedia-Social and Behavioral Sciences, 164, 486-492.
Mahoney, L. (2012). Standalone CSR Reports: A Canadian Analysis. Issues in Social & Environmental
Accounting, 6.
Manning, B., Braam, G., & Reimsbach, D. (2019). Corporate governance and sustainable business
conduct - Effects of board monitoring effectiveness and stakeholder engagement on
corporate sustainability performance and disclosure choices. Corporate Social Responsibility
and Environmental Management, 26(2), 351-366.
Martinez, C. (2016). Effects of integrated reporting on the firm's value: evidence from voluntary
adopters of the IIRC's framework. University of St. Gallen.
McDaniel, L., Martin, R., & Maines, L. (2002). Evaluating financial reporting quality: The effects of
financial expertise vs. financial literacy. The Accounting Review, 77(s-1), 139-167.
Meek, G., Roberts, C., & Gray, S. (1995). Factors influencing voluntary annual report disclosures by
US, UK and continental European multinational corporations. Journal of international
business studies, 26(3), 555-572.
Mertins, K., Kohl, H., & Orth, R. (2012). Integrated reporting and integrated thinking-a resource
oriented perspective. EIASM Proceedings, 8th Interdisplinary Workshop on "Intangibles,
Intellectual Capital & Extra-Financial Information".
Michelon, G. (2011). Sustainability disclosure and reputation: A comparative study. Corporate
reputation review, 14(2), 79-96.
Michelon, G., & Parbonetti, A. (2012). The effect of corporate governance on sustainability
disclosure. Journal of management & governance, 16(3), 477-509.
Montecalvo, M., Farneti, F., & De Villiers, C. (2018). The potential of integrated reporting to enhance
sustainability reporting in the public sector. Public Money & Management, 5, 365-374.
Mulgan, R. (1997). The processes of public accountability. Australian Journal of Public Administration,
56(1), 25-36.
Müller, M., Riedl, E., & Sellhorn, T. (2015). Recognition versus disclosure of fair values. The
Accounting Review, 90(6), 2411-2447.

50
Nanka-Bruce, D. (2011). Corporate governance mechanisms and firm efficiency. International Journal
of Business and Management, 6(5), 28.
Odoemelam, N., & Ofoegbu, G. (2018). Corporate board characteristics and environmental disclosure
quanity: a comparative analysis of traditional and integrated reporting evidence.
Oll, J., & Rommerskirchen, S. (2018). What's wrong with integrated reporting? A systematic review.
NachhaltigkeitsManagementForum | Sustainability Management Forum, 26(1-4), 19-34.
Parmar, B., Freeman, R., Harrison, J., Wicks, A., Purnell, L., & De Colle, S. (2010). Stakeholder theory:
The state of the art. Acedemy of Management Annals, 4(1), 403-445.
Patelli, L., & Prencipe, A. (2007). The relationship between voluntary disclosure and independent
directors in the presence of a dominant shareholder. European Accounting Review, 16(1), 5-
33.
Patten, D. (1991). Exposure, legitimacy, and social disclosure. Journal of Accounting and public policy,
10(4), 297-308.
Pavlopoulos, A., Magnis, C., & Latridis, G. (2019). Integrated reporting: An accounting disclosure tool
for high quality financial reporting. Research in International Business and Finance, 49, 13-40.
Pistoni, A., Songini, L., & Bavagnoli, F. (2018). Integrated reporting quality: An empirical analysis.
Corporate Social Responsibility and Environmental Management, 25(4), 489-507.
Quick, R. (2008). Voluntary sustainability reporting practices in Germany: a study on reporting
quality. Portuguese Journal of Accounting and Management, 5(1), 7-35.
Raimo, N., Vitolla, F., Marrone, A., & Rubino, M. (2021). Do audit committee attributes influence
integrated reporting quality? An agency theory viewpoint. Business Strategy and the
Environment, 30(1), 522-534.
Refinitiv. (2021). Environmental, Social and Corporate Governance - ESG. Retrieved May 2021, 6,
from Refinitiv: https://www.refinitiv.com/en/financial-data/company-data/esg-data
Rivera-Arrubla, Y., & Zorio-Grima, A. (2016). Integrated reporting, connectivity, and social media.
Psychology & Marketing, 33(12), 1159-1165.
Robinson, G., & Dechant, K. (1997). Building a business case for diversity. Academy of Management
Perspectives, 11(3), 21-31.
Rodriguez, L., & LeMaster, J. (2007). Voluntary corporate social responsibility disclosure: SEC "CSR
Seal of Approval". Business & society, 46(3), 370-384.
Rowbottom, N., & Locke, J. (2016). The emergence of integrated reporting. Accounting and Business
Research, 46(1), 83-115.
Roychowdhury, S. (2006). Earnings management through real activities manipulation. Journal of
accounting and economics, 42(3), 335-370.

51
Rupley, K., Brown, D., & Marshall, S. (2017). Evolution of corporate reporting: From stand-alone
corporate social responsibility reporting to integrated reporting. Research in Accounting
Regulation, 29(2), 172-176.
Sawani, Y., Zain, M., & Darus, F. (2010). Preliminary insights on sustainability reporting and assurance
practices in Malaysia. Social Responsibility Journal.
Serafeim, G. (2015). Integrated reporting and investor clientele. Journal of Applied Corporate
Finance, 27(2), 34-51.
Shehata, N. (2014). Theories and determinants of voluntary disclosure. Accounting and Finance
Research (AFR), 3(1).
Siagian, F., Siregar, S., & Rahadian, Y. (2013). Corporate governance, reporting quality, and firm
value: evidence from Indonesia. Journal of accounting in emerging economies.
Simnett, R., & Huggins, A. (2015). Integrated reporting and assurance: where can research add value?
Sustainability Accounting, Management and Policy Journal.
Smith, A. (2008). Bounded volition: The interaction of social determinism & choice. ProQuest.
Spence, A. (1973). Job market signaling. Quarterly Journal of Economics, 87, 355-379.
Stiglitz, J. (1985). Information and economic analysis: a perspective. The Economic Journal, 95, 21-41.
Tamimi, N., & Sebastianelli, R. (2017). Transparency among S&P 500 companies: An analysis of ESG
disclosure scores. Management Decision.
Tanyi, P., & Smith, D. (2015). Busyness, expertise, and financial reporting quality of audit committee
chairs and financial experts. Auditing: A Journal of Practice & Theory, 34(2), 59-89.
Velte, P. (2018). Is audit committee expertise connected with increased readability of integrated
reports: Evidence from EU companies. Problems and Perspectives in Management, 16(2), 23-
41.
Velte, P., & Stawinoga, M. (2017). Integrated reporting: The current state of empirical research,
limitations and future research implications. Journal of Management Control, 28(3), 275-320.
Venter, E., Stiglingh, M., & Smit, A. (2017). Integrated thinking and the transparency of tax
disclosures in the corporate reports of firms. Journal of International Financial Management
& Accounting, 28(3), 394-427.
Vitolla, F., Raimo, N., & Rubino, M. (2019). Appreciations, criticisms, determinants, and effects of
integrated reporting: A systematic literature review. Corporate Social Responsibility and
Environmental Management, 26(2), 518-528.
Vitolla, F., Raimo, N., & Rubino, M. (2020). Board characteristics and integrated reporting quality: an
agency theory perspective. Corporate Social Responsibility and Environmental Management,
27(2), 1152-1163.
52
Wang, Z., Reimsbach, D., & Braam, G. (2018). Political embeddedness and the diffusion of corporate
social repsonsibility practices in China: A trade-off between financial and CSR performance?
Journal of Cleaner Production, 198, 1185-1197.
Watson, A., Shrives, P., & Marston, C. (2002). Voluntary disclosure of accounting ratios in the UK. The
British Accounting Review, 34(4), 289-313.
Williams, R. (2011). OGLM9: Stata module to estimate Ordinal Generalized Linear Models.
Yaffee, R. (2003). A primer for panel data analysis . Connect: Information Technology at NYU, 1-11.
Zang, A. (2012). Evidence on the trade-off between real activities manipulation and accrual-based
earnings management. The Accounting Review, 87(2), 675-703.
Zogning, F. (2017). Agency theory: A critical review. European journal of business and management,
9(2), 1-8.
53
Appendices
Appendix A: Statistical assumption tests
Table A1. Hausman test
Panel: dependent variable CRQ
Coef.
Chi-squared test value 104.96 P-value 0.0000
Table A2. Breusch-Pagan/ Cook-Weisberg test
Panel: dependent variable CRQ
Coef.
Chi-squared test value 115.27 P-value 0.0000
Table A3. Multicollinearity test
1 2 3 4 5 6 7
1 IT 1.000
2 BSIZE 0.262 1.000
3 BIND 0.041 0.242 1.000
4 BDIV 0.122 -0.046 0.094 1.000
5 ACIND 0.160 0.203 0.198 -0.114 1.000
6 ACEXP 0.230 -0.007 -0.127 0.029 0.100 1.000 7 CSIZE 0.475 0.424 0.209 0.184 0.076 0.121 1.000
8 FPERF -0.043 -0.186 -0.093 0.013 -0.171 0.009 -0.104
9 NFPERF 0.548 0.288 0.278 0.307 0.180 0.105 0.626
10 FINLEV 0.038 0.285 0.037 -0.022 0.076 -0.011 0.138
11 MTBV -0.028 -0.146 -0.124 0.128 -0.222 -0.007 -0.103
12 ASSUR 0.495 0.152 0.116 0.218 0.016 0.171 0.333
8 9 10 11 12
8 FPERF 1.000
9 NFPERF -0.088 1.000
10 FINLEV -0.387 0.132 1.000
11 MTBV 0.577 -0.050 -0.017 1.000
12 ASSUR -0.079 0.392 0.016 -0.042 1.000
Note: See Table 3 for variable definitions.

54
Table A4. Variance inflation factor test
Variable VIF TOL
IT 2.00 0.500002
BSIZE 1.46 0.685053
IT*BSIZE 1.33 0.752371
BIND 1.25 0.798064
IT*BIND 1.17 0.854385
BDIV 1.22 0.817515
IT*BDIV 1.13 0.884378
ACIND 1.85 0.541733
IT*ACIND 1.84 0.544737
ACEXP 1.17 0.852704
IT*ACEXP 1.31 0.763056
CSIZE 1.99 0.503166
FPERF 2.02 0.495154
NFPERF 2.25 0.044986
FINLEV 1.41 0.709530
MTBV 1.81 0.551438
ASSUR 1.51 0.664062
Mean VIF 1.57 Note: See Table 3 for variable definitions.

55
Appendix B: Additional robustness regression analyses
Table B1. Robustness analysis: logistic regression results (manufacturing industry omitted)
VARIABLES (1) CRQ (2) CRQ (3) FRQ (4) FRQ (5) NFRQ (6) NFRQ IT 0.151* 2.468* 0.068 0.126 0.064*** 0.005
(0.081) (1.362) (0.054) (0.080) (0.023) (0.035)
BSIZE 0.898* -0.860 0.152 0.348 0.114 -0.358
(0.535) (1.028) (0.593) (0.706) (0.386) (0.389)
BIND 0.019 0.009 0.054*** 0.024 -0.060** -0.067
(0.021) (0.351) (0.020) (0.068) (0.028) (0.187)
BDIV 0.019 0.158 -0.025 0.000 0.350*** 0.359*
(0.067) (0.227) (0.039) (0.066) (0.112) (0.202)
ACIND 0.233** 14.011* -0.047 0.013 0.376*** 0.675**
(0.111) (7.507) (0.058) (0.079) (0.087) (0.295)
ACEXP 1.414 -0.477 1.733 1.407 0.047 -1.020
(1.449) (3.570) (1.284) (1.256) (1.007) (1.945)
ITxBSIZE
0.083
0.015
0.014
(0.079)
(0.016)
(0.037)
ITxBIND
0.023***
0.005
0.001
(0.009)
(0.008)
(0.013)
ITxBDIV
0.034
0.004
0.002
(0.028)
(0.003)
(0.006)
ITxACIND
0.532*
0.004
0.018
(0.282)
(0.003)
(0.014)
ITxACEXP
1.272
0.137
0.055
(1.031)
(0.157)
(0.191)
CSIZE 9.349** 9.724*** 8.443*** 9.900 24.453*** 21.534***
(4.129) (3.495) (3.155) (6.173) (4.263) (5.053)
FPERF -0.145* -0.496 -0.745*** -0.662*** 0.234* 0.269**
(0.081) (0.437) (0.158) (0.165) (0.121) (0.113)
NFPERF -0.017 -0.045 -0.026 -0.133 0.019 -0.018
(0.084) (0.086) (0.055) (0.086) (0.105) (0.230)
FINLEV 0.009 0.063* 0.050** 0.050* 0.018*** 0.019**
(0.007) (0.033) (0.022) (0.030) (0.005) (0.009)
MTBV 0.412 1.876 -0.945* -0.965 0.212 0.541
(0.635) (1.144) (0.523) (0.675) (0.504) (0.694)
ASSUR 13.060*** 29.183 -7.431*** -7.508*** 23.470*** 32.991***
(2.642) (34.573) (2.211) (2.717) (3.280) (12.518)
Year dummies Yes Yes Yes Yes Yes Yes
Industry dummies Yes Yes Yes Yes Yes Yes
N 106 106 108 108 98 98
Model 2, 4 and 6 include interaction terms. Robust standard errors in parentheses. Note: See Table 3 for variable definitions. *** p<0.01, ** p<0.05, * p<0.1

56
Table B2. Robustness analysis: logistic regression results with 1-year lag effects of the independent/
moderating variables (manufacturing industry omitted)
VARIABLES (1) CRQ (2) CRQ (3) FRQ (4) FRQ (5) NFRQ (6) NFRQ ITt-1 0.078 0.192 0.242*** -0.106*** -0.101 -0.085**
(0.062) (0.138) (0.085) (0.038) (0.071) (0.034)
BSIZEt-1 1.230** 2.497* 3.079** -0.634* -0.067 0.652
(0.517) (1.435) (1.390) (0.332) (0.493) (0.417)
BINDt-1 -0.005 0.027 0.193*** 0.145 -0.063 -0.254
(0.023) (0.162) (0.057) (0.248) (0.058) (0.194)
BDIVt-1 0.110* 0.471 -0.097** 0.245*** 0.268 0.230
(0.057) (0.335) (0.047) (0.051) (0.182) (0.214)
ACINDt-1 -0.035 -0.546 -0.851*** -1.532*** 0.228 0.340
(0.082) (0.444) (0.250) (0.204) (0.153) (0.298)
ACEXPt-1 1.805 -1.924 9.666*** -0.974 -0.365 0.737
(1.142) (3.219) (3.546) (1.945) (1.221) (1.079)
ITxBSIZEt-1
0.078
0.071***
0.006
(0.055)
(0.018)
(0.014)
ITxBINDt-1
0.002
0.002
0.012
(0.011)
(0.009)
(0.009)
ITxBDIVt-1
0.018*
0.013***
0.004
(0.011)
(0.004)
(0.006)
ITxACINDt-1
0.011
0.010*
0.005
(0.012)
(0.005)
(0.012)
ITxACEXPt-1
0.540
0.295
0.069
(0.397)
(0.210)
(0.074)
CSIZE 13.576*** 28.071 1.650 9.328 9.349 10.373*
(5.221) (18.244) (4.934) (9.548) (10.220) (5.657)
FPERF -0.102 -0.314 -0.929** -0.759** 0.084 0.027
(0.099) (0.231) (0.441) (0.381) (0.075) (0.073)
NFPERF 0.023 0.022 0.159 -0.286 0.288* 0.249
(0.071) (0.128) (0.224) (0.179) (0.149) (0.178)
FINLEV 0.007 0.005 0.094* 0.040** -0.007 -0.003
(0.007) (0.007) (0.054) (0.017) (0.008) (0.011)
MTBV 0.494 -0.579 -4.632** -3.260** 1.168** 1.308
(0.554) (1.502) (2.242) (1.610) (0.579) (0.989)
ASSUR 14.246*** 14.686*** -29.849*** -24.750*** 21.485*** 17.383***
(2.477) (1.974) (2.960) (1.699) (5.975) (2.608)
Year dummies Yes Yes Yes Yes Yes Yes
Industry dummies Yes Yes Yes Yes Yes Yes
N 95 95 91 91 86 86
Model 2, 4 and 6 include interaction terms. Robust standard errors in parentheses. Note: See Table 3 for variable definitions. *** p<0.01, ** p<0.05, * p<0.1

57
Table B3. Robustness analysis: logistic regression results with 2-year lag effects of the independent/
moderating variables (manufacturing industry omitted)
VARIABLES (1) CRQ (2) CRQ (3) FRQ (4) FRQ (5) NFRQ (6) NFRQ ITt-2 0.074** 0.813*** 0.050 0.172 -0.042 0.160
(0.030) (0.267) (0.034) (0.126) (0.062) (0.099)
BSIZEt-2 0.362 0.711 0.115 0.556 0.586 2.853***
(0.386) (0.681) (0.722) (0.450) (0.380) (0.999)
BINDt-2 0.223 1.591** -0.020 -0.448** 0.511 0.483
(0.154) (0.691) (0.033) (0.219) (0.557) (0.701)
BDIVt-2 0.120 0.678** 0.067 0.493 0.202 0.386**
(0.089) (0.312) (0.092) (0.307) (0.125) (0.189)
ACINDt-2 0.044 5.856** -0.664*** 0.288 -0.000 1.447
(0.115) (2.452) (0.098) (0.599) (0.207) (0.917)
ACEXPt-2 -1.559 -3.760 -0.390 -2.639 -2.929 -2.034**
(1.119) (2.540) (0.771) (2.157) (2.135) (0.911)
ITxBSIZEt-2
0.085***
0.097*
0.044***
(0.028)
(0.057)
(0.017)
ITxBINDt-2
0.052**
0.029**
0.036**
(0.023)
(0.013)
(0.014)
ITxBDIVt-2
0.015
0.025**
0.009
(0.012)
(0.011)
(0.006)
ITxACINDt-2
0.225**
0.008
0.049
(0.100)
(0.010)
(0.044)
ITxACEXPt-2
0.051
0.021
0.024
(0.156)
(0.119)
(0.261)
CSIZE 5.694* -14.823 8.030 -6.940* -9.728 -15.638
(3.329) (10.145) (5.960) (3.836) (11.154) (11.627)
FPERF -0.407** -1.443** -0.511*** -0.893*** -0.080 -0.364**
(0.164) (0.718) (0.140) (0.238) (0.108) (0.153)
NFPERF 0.160** 0.122 -0.107 0.357 0.431** 0.513***
(0.079) (0.109) (0.224) (0.386) (0.187) (0.195)
FINLEV -0.001 0.008 0.040** 0.126 -0.013 0.005
(0.014) (0.014) (0.019) (0.103) (0.025) (0.014)
MTBV -0.915 0.286 -2.544* -12.061* 0.866 0.557
(0.852) (1.252) (1.323) (6.866) (0.840) (0.576)
ASSUR 15.780*** 4.273 -18.014*** -5.544 22.276*** 10.019***
(1.861) (6.601) (3.858) (11.173) (4.402) (3.525)
Year dummies Yes Yes Yes Yes Yes Yes
Industry dummies Yes Yes Yes Yes Yes Yes
N 80 80 72 72 72 72
Model 2, 4 and 6 include interaction terms. Robust standard errors in parentheses. Note: See Table 3 for variable definitions. *** p<0.01, ** p<0.05, * p<0.1
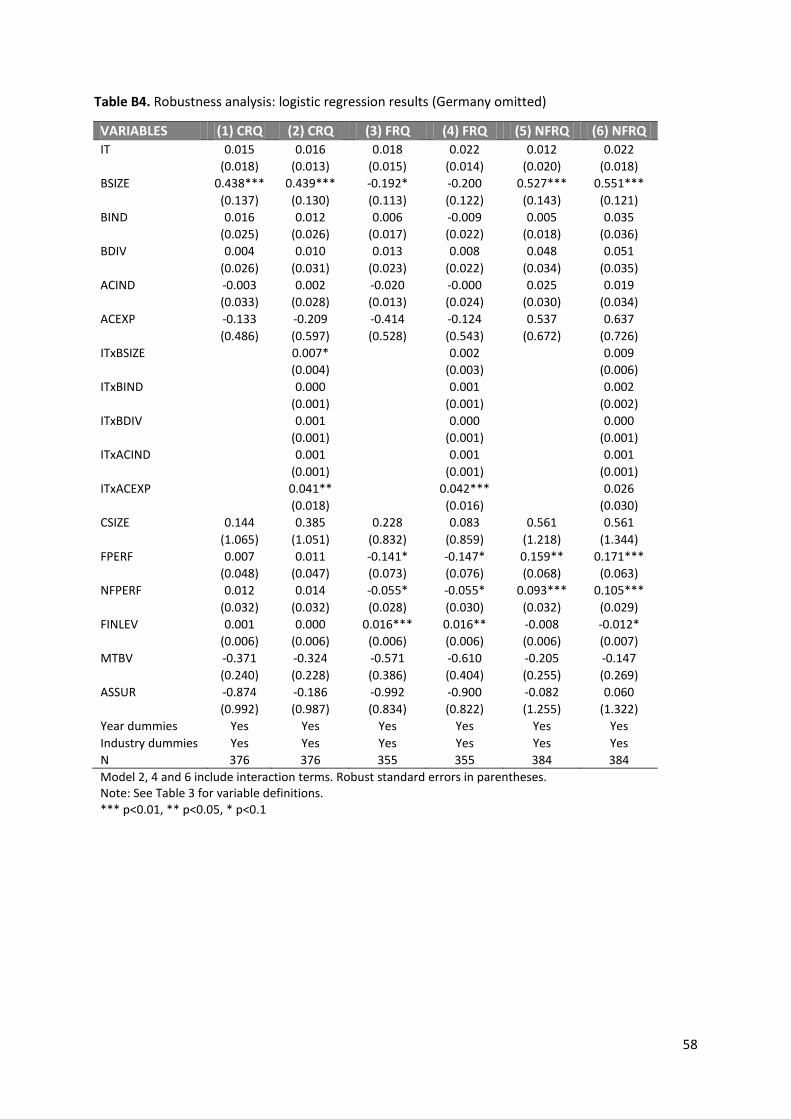
58
Table B4. Robustness analysis: logistic regression results (Germany omitted)
VARIABLES (1) CRQ (2) CRQ (3) FRQ (4) FRQ (5) NFRQ (6) NFRQ IT 0.015 0.016 0.018 0.022 0.012 0.022
(0.018) (0.013) (0.015) (0.014) (0.020) (0.018)
BSIZE 0.438*** 0.439*** -0.192* -0.200 0.527*** 0.551***
(0.137) (0.130) (0.113) (0.122) (0.143) (0.121)
BIND 0.016 0.012 0.006 -0.009 0.005 0.035
(0.025) (0.026) (0.017) (0.022) (0.018) (0.036)
BDIV 0.004 0.010 0.013 0.008 0.048 0.051
(0.026) (0.031) (0.023) (0.022) (0.034) (0.035)
ACIND -0.003 0.002 -0.020 -0.000 0.025 0.019
(0.033) (0.028) (0.013) (0.024) (0.030) (0.034)
ACEXP -0.133 -0.209 -0.414 -0.124 0.537 0.637
(0.486) (0.597) (0.528) (0.543) (0.672) (0.726)
ITxBSIZE
0.007*
0.002
0.009
(0.004)
(0.003)
(0.006)
ITxBIND
0.000
0.001
0.002
(0.001)
(0.001)
(0.002)
ITxBDIV
0.001
0.000
0.000
(0.001)
(0.001)
(0.001)
ITxACIND
0.001
0.001
0.001
(0.001)
(0.001)
(0.001)
ITxACEXP
0.041**
0.042***
0.026
(0.018)
(0.016)
(0.030)
CSIZE 0.144 0.385 0.228 0.083 0.561 0.561
(1.065) (1.051) (0.832) (0.859) (1.218) (1.344)
FPERF 0.007 0.011 -0.141* -0.147* 0.159** 0.171***
(0.048) (0.047) (0.073) (0.076) (0.068) (0.063)
NFPERF 0.012 0.014 -0.055* -0.055* 0.093*** 0.105***
(0.032) (0.032) (0.028) (0.030) (0.032) (0.029)
FINLEV 0.001 0.000 0.016*** 0.016** -0.008 -0.012*
(0.006) (0.006) (0.006) (0.006) (0.006) (0.007)
MTBV -0.371 -0.324 -0.571 -0.610 -0.205 -0.147
(0.240) (0.228) (0.386) (0.404) (0.255) (0.269)
ASSUR -0.874 -0.186 -0.992 -0.900 -0.082 0.060
(0.992) (0.987) (0.834) (0.822) (1.255) (1.322)
Year dummies Yes Yes Yes Yes Yes Yes
Industry dummies Yes Yes Yes Yes Yes Yes
N 376 376 355 355 384 384
Model 2, 4 and 6 include interaction terms. Robust standard errors in parentheses. Note: See Table 3 for variable definitions. *** p<0.01, ** p<0.05, * p<0.1

59
Table B5. Robustness analysis: logistic regression results with 1-year lag effects of the independent/
moderating variables (Germany omitted)
VARIABLES (1) CRQ (2) CRQ (3) FRQ (4) FRQ (5) NFRQ (6) NFRQ ITt-1 0.014 0.006 0.045** 0.062*** -0.013 -0.016
(0.020) (0.020) (0.018) (0.019) (0.017) (0.022)
BSIZEt-1 0.375*** 0.363*** -0.021 -0.116 0.213 0.266*
(0.140) (0.134) (0.137) (0.186) (0.155) (0.152)
BINDt-1 0.015 -0.053 0.012 0.006 0.001 -0.028
(0.019) (0.038) (0.014) (0.020) (0.061) (0.055)
BDIVt-1 0.033 0.045 0.019 0.021 0.094** 0.104**
(0.035) (0.041) (0.021) (0.023) (0.048) (0.041)
ACINDt-1 -0.030 0.003 -0.040 -0.043 0.058* 0.085**
(0.030) (0.031) (0.025) (0.029) (0.035) (0.038)
ACEXP t-1 1.303* 1.476* 0.326 0.073 0.621 0.440
(0.714) (0.765) (0.524) (0.593) (0.715) (0.702)
ITxBSIZEt-1
0.002
0.009**
0.005
(0.005)
(0.004)
(0.005)
ITxBINDt-1
0.003**
0.000
0.001
(0.001)
(0.001)
(0.001)
ITxBDIVt-1
0.001
0.000
0.001
(0.001)
(0.001)
(0.002)
ITxACINDt-1
0.002
0.001*
0.002
(0.001)
(0.001)
(0.002)
ITxACEXPt-1
0.036
0.040*
0.021
(0.024)
(0.021)
(0.042)
CSIZE 1.500 1.994* 0.920 1.104 1.039 0.932
(1.052) (1.153) (1.021) (1.142) (1.323) (1.327)
FPERF 0.042 0.054 -0.073 -0.071 0.119** 0.124**
(0.031) (0.034) (0.065) (0.062) (0.052) (0.053)
NFPERF 0.016 0.028 -0.063* -0.069** 0.116*** 0.120***
(0.033) (0.032) (0.035) (0.034) (0.027) (0.029)
FINLEV -0.003 -0.001 0.012* 0.015* -0.020** -0.021***
(0.007) (0.007) (0.007) (0.009) (0.008) (0.008)
MTBV -0.228 -0.166 -0.593 -0.597 0.207 0.217
(0.238) (0.219) (0.443) (0.439) (0.257) (0.252)
ASSUR -1.955* -1.905* -1.303 -1.503 -0.676 -0.524
(1.068) (1.015) (1.283) (1.392) (1.411) (1.478)
Year dummies Yes Yes Yes Yes Yes Yes
Industry dummies Yes Yes Yes Yes Yes Yes
N 306 306 303 303 312 312
Model 2, 4 and 6 include interaction terms. Robust standard errors in parentheses. Note: See Table 3 for variable definitions. *** p<0.01, ** p<0.05, * p<0.1

60
Table B6. Robustness analysis: logistic regression results with 2-year lag effects of the independent/
moderating variables (Germany omitted)
VARIABLES (1) CRQ (2) CRQ (3) FRQ (4) FRQ (5) NFRQ (6) NFRQ ITt-2 0.010 0.007 0.031* 0.054** 0.001 -0.006
(0.019) (0.018) (0.018) (0.024) (0.022) (0.020)
BSIZEt-2 0.223* 0.292** 0.097 -0.037 0.235 0.290
(0.135) (0.143) (0.146) (0.223) (0.151) (0.182)
BINDt-2 -0.037 -0.092** -0.046 -0.067 0.009 0.007
(0.034) (0.039) (0.044) (0.044) (0.039) (0.051)
BDIVt-2 0.021 0.003 0.028 0.016 0.076* 0.097*
(0.028) (0.029) (0.025) (0.029) (0.046) (0.054)
ACINDt-2 0.076*** 0.095*** 0.009 0.049* 0.096*** 0.088***
(0.027) (0.030) (0.020) (0.026) (0.035) (0.033)
ACEXPt-2 -0.383 -0.195 -0.129 -0.236 -1.313*** -1.012
(0.755) (0.882) (0.540) (0.523) (0.475) (0.818)
ITxBSIZEt-2
0.008
0.010
0.005
(0.005)
(0.006)
(0.006)
ITxBINDt-2
0.003***
0.001
0.001
(0.001)
(0.001)
(0.001)
ITxBDIVt-2
0.002**
0.000
0.001
(0.001)
(0.001)
(0.002)
ITxACINDt-2
0.000
0.001*
0.001
(0.001)
(0.001)
(0.001)
ITxACEXPt-2
0.032
0.009
0.112***
(0.025)
(0.014)
(0.036)
CSIZE 1.468 1.603 1.575 1.306 0.793 1.168
(1.159) (1.220) (1.312) (1.338) (1.769) (1.812)
FPERF 0.000 0.014 -0.091 -0.101 0.167*** 0.191***
(0.036) (0.046) (0.067) (0.073) (0.061) (0.073)
NFPERF 0.039 0.037 -0.130*** -0.143*** 0.199*** 0.220***
(0.039) (0.035) (0.039) (0.041) (0.042) (0.041)
FINLEV -0.007 -0.008 0.005 0.007 -0.030*** -0.033***
(0.011) (0.010) (0.007) (0.008) (0.011) (0.012)
MTBV -0.141 -0.188 -0.738 -0.681 0.427 0.435
(0.331) (0.295) (0.486) (0.488) (0.341) (0.400)
ASSUR -2.255** -2.663** 0.818 1.306 -2.287 -2.442
(0.983) (1.234) (1.443) (1.732) (2.197) (1.712)
Year dummies Yes Yes Yes Yes Yes Yes
Industry dummies Yes Yes Yes Yes Yes Yes
N 260 260 260 260 251 251
Model 2, 4 and 6 include interaction terms. Robust standard errors in parentheses. Note: See Table 3 for variable definitions. *** p<0.01, ** p<0.05, * p<0.1

61
Table B7. Robustness analysis: logistic regression results (France omitted)
VARIABLES (1) CRQ (2) CRQ (3) FRQ (4) FRQ (5) NFRQ (6) NFRQ IT 0.010 0.017 0.020 0.019 0.003 0.014
(0.017) (0.014) (0.014) (0.015) (0.020) (0.017)
BSIZE 0.281** 0.285** -0.102 -0.088 0.310** 0.356**
(0.119) (0.123) (0.100) (0.105) (0.156) (0.161)
BIND 0.012 0.008 0.003 0.000 0.011 0.025
(0.020) (0.023) (0.011) (0.013) (0.019) (0.020)
BDIV -0.016 -0.009 -0.005 -0.009 0.048 0.037
(0.028) (0.030) (0.023) (0.023) (0.032) (0.038)
ACIND 0.008 0.006 -0.030* -0.021 0.039 0.033
(0.032) (0.030) (0.017) (0.024) (0.030) (0.030)
ACEXP -0.012 -0.137 -0.306 -0.150 0.416 0.449
(0.516) (0.560) (0.507) (0.529) (0.505) (0.524)
ITxBSIZE
0.006*
0.004
0.009***
(0.003)
(0.003)
(0.003)
ITxBIND
0.000
0.001
0.001
(0.001)
(0.001)
(0.001)
ITxBDIV
0.001
0.001
0.002*
(0.001)
(0.001)
(0.001)
ITxACIND
0.000
0.001
0.000
(0.001)
(0.001)
(0.001)
ITxACEXP
0.003
0.036*
0.021
(0.020)
(0.021)
(0.025)
CSIZE -0.015 0.259 0.158 -0.102 -0.128 0.274
(1.190) (1.200) (0.791) (0.825) (1.182) (1.167)
FPERF -0.017 -0.011 -0.154** -0.155** 0.115* 0.141**
(0.056) (0.055) (0.072) (0.072) (0.059) (0.056)
NFPERF 0.000 0.003 -0.036 -0.039 0.061 0.081**
(0.037) (0.037) (0.023) (0.024) (0.040) (0.038)
FINLEV -0.000 -0.001 0.013*** 0.014*** -0.005 -0.006
(0.005) (0.006) (0.004) (0.005) (0.005) (0.005)
MTBV -0.065 -0.004 -0.786** -0.742** 0.024 0.078
(0.272) (0.255) (0.317) (0.309) (0.288) (0.301)
ASSUR -0.590 -0.327 -1.710** -1.585* 0.695 0.432
(1.159) (1.166) (0.782) (0.818) (1.118) (1.099)
Year dummies Yes Yes Yes Yes Yes Yes
Industry dummies Yes Yes Yes Yes Yes Yes
N 355 355 383 383 360 360
Model 2, 4 and 6 include interaction terms. Robust standard errors in parentheses. Note: See Table 3 for variable definitions. *** p<0.01, ** p<0.05, * p<0.1

62
Table B8. Robustness analysis: logistic regression results with 1-year lag effects of the independent/
moderating variables (France omitted)
VARIABLES (1) CRQ (2) CRQ (3) FRQ (4) FRQ (5) NFRQ (6) NFRQ ITt-1 0.007 -0.001 0.041** 0.044** -0.025 -0.023
(0.020) (0.021) (0.017) (0.017) (0.016) (0.021)
BSIZEt-1 0.378** 0.381** 0.069 0.072 0.226 0.233
(0.151) (0.156) (0.126) (0.134) (0.151) (0.143)
BINDt-1 0.008 -0.051* 0.014 0.022 0.002 -0.046
(0.016) (0.030) (0.012) (0.023) (0.054) (0.072)
BDIVt-1 0.029 0.051 0.017 0.019 0.087** 0.095*
(0.033) (0.039) (0.023) (0.024) (0.040) (0.049)
ACINDt-1 -0.026 0.001 -0.059* -0.066** 0.056 0.065*
(0.028) (0.029) (0.031) (0.030) (0.035) (0.034)
ACEXPt-1 1.048** 1.389* 0.328 0.271 -0.304 -0.517
(0.510) (0.717) (0.501) (0.525) (0.443) (0.632)
ITxBSIZEt-1
0.003
0.002
0.001
(0.003)
(0.003)
(0.003)
ITxBINDt-1
0.003**
0.000
0.002
(0.001)
(0.001)
(0.002)
ITxBDIVt-1
0.001
0.001
0.000
(0.001)
(0.001)
(0.001)
ITxACINDt-1
0.002
0.001
0.000
(0.001)
(0.001)
(0.001)
ITxACEXPt-1
0.018
0.028
0.020
(0.034)
(0.026)
(0.035)
CSIZE 1.850 2.155 0.679 0.696 0.841 0.917
(1.158) (1.405) (1.034) (1.135) (1.271) (1.270)
FPERF 0.041 0.046 -0.076 -0.075 0.113** 0.123**
(0.032) (0.034) (0.065) (0.062) (0.054) (0.055)
NFPERF 0.037 0.025 -0.045 -0.047 0.110*** 0.103***
(0.041) (0.042) (0.032) (0.034) (0.034) (0.032)
FINLEV -0.002 0.000 0.013*** 0.013*** -0.009 -0.007
(0.005) (0.006) (0.005) (0.005) (0.005) (0.005)
MTBV 0.174 0.127 -0.803** -0.772** 0.217 0.152
(0.216) (0.237) (0.384) (0.371) (0.299) (0.301)
ASSUR -2.189* -1.907 -1.809* -2.007* 0.547 0.219
(1.282) (1.457) (1.095) (1.030) (1.087) (1.096)
Year dummies Yes Yes Yes Yes Yes Yes
Industry dummies Yes Yes Yes Yes Yes Yes
N 283 283 322 322 286 286
Model 2, 4 and 6 include interaction terms. Robust standard errors in parentheses. Note: See Table 3 for variable definitions. *** p<0.01, ** p<0.05, * p<0.1
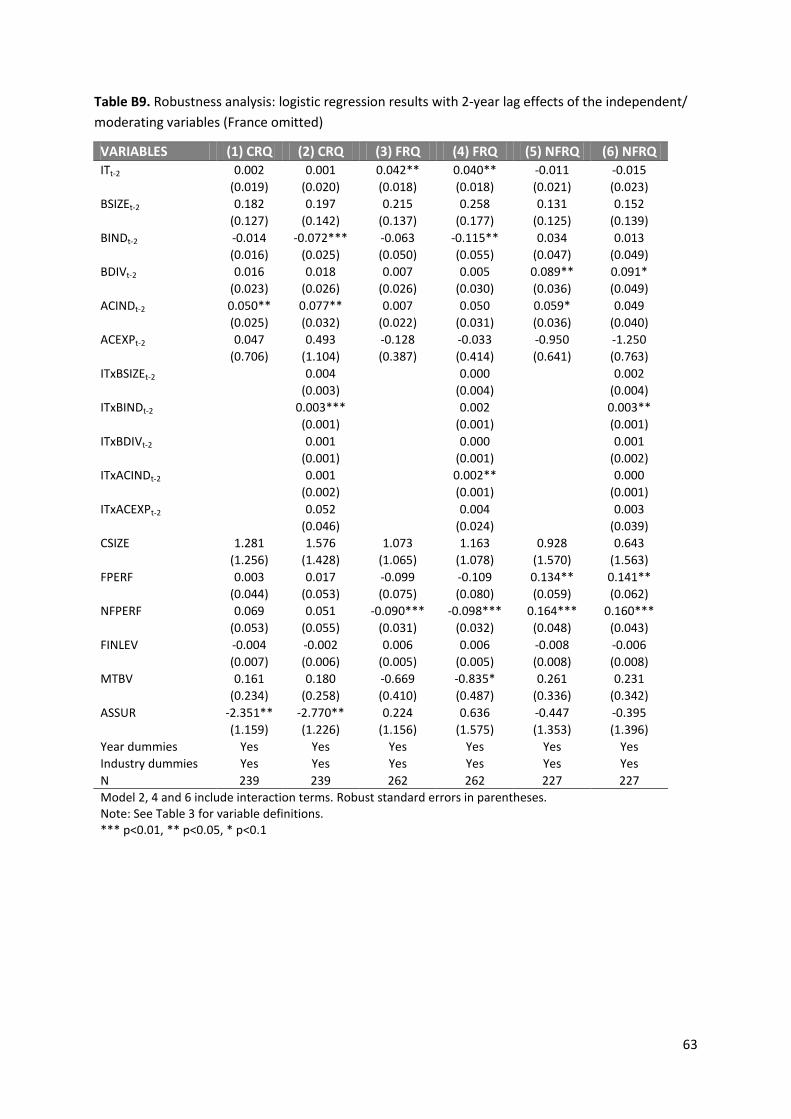
63
Table B9. Robustness analysis: logistic regression results with 2-year lag effects of the independent/
moderating variables (France omitted)
VARIABLES (1) CRQ (2) CRQ (3) FRQ (4) FRQ (5) NFRQ (6) NFRQ ITt-2 0.002 0.001 0.042** 0.040** -0.011 -0.015
(0.019) (0.020) (0.018) (0.018) (0.021) (0.023)
BSIZEt-2 0.182 0.197 0.215 0.258 0.131 0.152
(0.127) (0.142) (0.137) (0.177) (0.125) (0.139)
BINDt-2 -0.014 -0.072*** -0.063 -0.115** 0.034 0.013
(0.016) (0.025) (0.050) (0.055) (0.047) (0.049)
BDIVt-2 0.016 0.018 0.007 0.005 0.089** 0.091*
(0.023) (0.026) (0.026) (0.030) (0.036) (0.049)
ACINDt-2 0.050** 0.077** 0.007 0.050 0.059* 0.049
(0.025) (0.032) (0.022) (0.031) (0.036) (0.040)
ACEXPt-2 0.047 0.493 -0.128 -0.033 -0.950 -1.250
(0.706) (1.104) (0.387) (0.414) (0.641) (0.763)
ITxBSIZEt-2
0.004
0.000
0.002
(0.003)
(0.004)
(0.004)
ITxBINDt-2
0.003***
0.002
0.003**
(0.001)
(0.001)
(0.001)
ITxBDIVt-2
0.001
0.000
0.001
(0.001)
(0.001)
(0.002)
ITxACINDt-2
0.001
0.002**
0.000
(0.002)
(0.001)
(0.001)
ITxACEXPt-2
0.052
0.004
0.003
(0.046)
(0.024)
(0.039)
CSIZE 1.281 1.576 1.073 1.163 0.928 0.643
(1.256) (1.428) (1.065) (1.078) (1.570) (1.563)
FPERF 0.003 0.017 -0.099 -0.109 0.134** 0.141**
(0.044) (0.053) (0.075) (0.080) (0.059) (0.062)
NFPERF 0.069 0.051 -0.090*** -0.098*** 0.164*** 0.160***
(0.053) (0.055) (0.031) (0.032) (0.048) (0.043)
FINLEV -0.004 -0.002 0.006 0.006 -0.008 -0.006
(0.007) (0.006) (0.005) (0.005) (0.008) (0.008)
MTBV 0.161 0.180 -0.669 -0.835* 0.261 0.231
(0.234) (0.258) (0.410) (0.487) (0.336) (0.342)
ASSUR -2.351** -2.770** 0.224 0.636 -0.447 -0.395
(1.159) (1.226) (1.156) (1.575) (1.353) (1.396)
Year dummies Yes Yes Yes Yes Yes Yes
Industry dummies Yes Yes Yes Yes Yes Yes
N 239 239 262 262 227 227
Model 2, 4 and 6 include interaction terms. Robust standard errors in parentheses. Note: See Table 3 for variable definitions. *** p<0.01, ** p<0.05, * p<0.1

64
Table B10. Robustness analysis: logistic regression results (Great Britain omitted)
VARIABLES (1) CRQ (2) CRQ (3) FRQ (4) FRQ (5) NFRQ (6) NFRQ IT 0.014 0.017 0.025 0.032** 0.006 0.008
(0.015) (0.012) (0.015) (0.015) (0.018) (0.015)
BSIZE 0.418*** 0.459*** -0.049 -0.010 0.316** 0.366***
(0.129) (0.132) (0.109) (0.119) (0.135) (0.135)
BIND 0.025 0.016 -0.004 0.002 0.022 0.041*
(0.029) (0.024) (0.010) (0.014) (0.023) (0.023)
BDIV -0.000 0.009 0.009 0.004 0.062** 0.071**
(0.027) (0.030) (0.024) (0.022) (0.031) (0.035)
ACIND -0.013 -0.008 -0.021 -0.012 0.036 0.030
(0.032) (0.024) (0.015) (0.026) (0.026) (0.027)
ACEXP -0.160 -0.160 -0.282 -0.092 0.611 0.778
(0.520) (0.641) (0.524) (0.590) (0.585) (0.638)
ITxBSIZE
0.006**
0.006**
0.009***
(0.003)
(0.003)
(0.003)
ITxBIND
0.000
0.000
0.002*
(0.001)
(0.001)
(0.001)
ITxBDIV
0.001
0.001
0.001
(0.001)
(0.001)
(0.001)
ITxACIND
0.001
0.002*
0.000
(0.001)
(0.001)
(0.001)
ITxACEXP
0.012
0.032
0.015
(0.019)
(0.021)
(0.027)
CSIZE -1.207 -0.839 0.549 -0.019 -0.494 -0.538
(1.022) (0.998) (1.119) (1.138) (1.026) (0.948)
FPERF 0.010 0.023 -0.122 -0.124* 0.088* 0.106**
(0.054) (0.053) (0.075) (0.074) (0.051) (0.045)
NFPERF -0.017 -0.010 -0.079** -0.083** 0.029 0.048
(0.037) (0.036) (0.033) (0.036) (0.037) (0.037)
FINLEV 0.005 0.004 0.015*** 0.018*** -0.001 -0.003
(0.005) (0.006) (0.004) (0.006) (0.005) (0.005)
MTBV -0.502* -0.416* -0.866** -0.757** -0.290 -0.230
(0.258) (0.238) (0.340) (0.369) (0.178) (0.166)
ASSUR -0.101 0.369 -1.961** -2.138** 0.290 0.606
(1.245) (1.067) (0.842) (0.843) (1.139) (1.101)
Year dummies Yes Yes Yes Yes Yes Yes
Industry dummies Yes Yes Yes Yes Yes Yes
N 372 372 350 350 409 409
Model 2, 4 and 6 include interaction terms. Robust standard errors in parentheses. Note: See Table 3 for variable definitions. *** p<0.01, ** p<0.05, * p<0.1

65
Table B11. Robustness analysis: logistic regression results with 1-year lag effects of the independent/
moderating variables (Great Britain omitted)
VARIABLES (1) CRQ (2) CRQ (3) FRQ (4) FRQ (5) NFRQ (6) NFRQ ITt-1 0.026 0.018 0.051*** 0.065*** -0.009 -0.013
(0.016) (0.016) (0.018) (0.019) (0.016) (0.017)
BSIZEt-1 0.386** 0.360** -0.013 -0.025 0.252 0.245
(0.161) (0.155) (0.166) (0.199) (0.193) (0.192)
BINDt-1 0.027 -0.015 0.011 0.039 -0.001 -0.029
(0.017) (0.036) (0.012) (0.026) (0.044) (0.052)
BDIVt-1 0.021 0.025 0.028 0.032 0.059 0.067*
(0.031) (0.034) (0.025) (0.027) (0.041) (0.038)
ACINDt-1 -0.058* -0.037 -0.054* -0.069** 0.065* 0.082**
(0.031) (0.031) (0.033) (0.033) (0.034) (0.041)
ACEXPt-1 0.749 0.662 0.636 0.648 -0.048 -0.268
(0.508) (0.577) (0.495) (0.568) (0.521) (0.478)
ITxBSIZEt-1
0.002
0.002
0.004
(0.003)
(0.003)
(0.003)
ITxBINDt-1
0.002
0.001
0.001
(0.001)
(0.001)
(0.001)
ITxBDIVt-1
0.001
0.001
0.000
(0.001)
(0.001)
(0.001)
ITxACINDt-1
0.002*
0.001*
0.001
(0.001)
(0.001)
(0.002)
ITxACEXPt-1
0.017
0.058**
0.034
(0.024)
(0.029)
(0.030)
CSIZE 0.839 1.233 0.779 0.764 0.257 0.168
(0.945) (1.033) (1.361) (1.614) (0.824) (0.837)
FPERF 0.083* 0.098** -0.042 -0.041 0.095** 0.092**
(0.043) (0.044) (0.063) (0.060) (0.042) (0.039)
NFPERF 0.021 0.031 -0.096** -0.107** 0.078*** 0.080***
(0.033) (0.035) (0.041) (0.043) (0.028) (0.027)
FINLEV 0.003 0.003 0.016*** 0.018*** -0.005 -0.006
(0.005) (0.006) (0.005) (0.005) (0.005) (0.005)
MTBV -0.363 -0.274 -0.881** -0.736** -0.116 -0.095
(0.232) (0.223) (0.405) (0.374) (0.200) (0.195)
ASSUR -2.459** -2.288** -2.127* -2.645** -0.120 -0.193
(1.076) (1.095) (1.217) (1.222) (1.260) (1.211)
Year dummies Yes Yes Yes Yes Yes Yes
Industry dummies Yes Yes Yes Yes Yes Yes
N 299 299 304 304 323 323
Model 2, 4 and 6 include interaction terms. Robust standard errors in parentheses. Note: See Table 3 for variable definitions. *** p<0.01, ** p<0.05, * p<0.1

66
Table B12. Robustness analysis: logistic regression results with 2-year lag effects of the independent/
moderating variables (Great Britain omitted)
VARIABLES (1) CRQ (2) CRQ (3) FRQ (4) FRQ (5) NFRQ (6) NFRQ ITt-2 0.023 0.020 0.057*** 0.059*** 0.005 -0.004
(0.015) (0.015) (0.017) (0.017) (0.015) (0.018)
BSIZEt-2 0.336** 0.361** 0.222 0.295 0.237** 0.153
(0.143) (0.154) (0.172) (0.207) (0.112) (0.125)
BINDt-2 -0.005 -0.039 -0.036 -0.045 0.045 0.041
(0.016) (0.024) (0.041) (0.064) (0.050) (0.047)
BDIVt-2 0.011 0.004 0.019 0.028 0.032 0.025
(0.025) (0.026) (0.025) (0.035) (0.036) (0.040)
ACINDt-2 0.039 0.053* 0.010 0.042 0.053 0.044
(0.027) (0.032) (0.017) (0.028) (0.041) (0.032)
ACEXPt-2 -0.457 -0.297 -0.342 -0.290 -0.840 -0.992
(0.574) (0.679) (0.362) (0.409) (0.529) (0.665)
ITxBSIZEt-2
0.005
0.002
0.003
(0.003)
(0.004)
(0.004)
ITxBINDt-2
0.001*
0.001
0.002
(0.001)
(0.002)
(0.002)
ITxBDIVt-2
0.001
0.001
0.000
(0.001)
(0.001)
(0.001)
ITxACINDt-2
0.000
0.002**
0.000
(0.001)
(0.001)
(0.001)
ITxACEXPt-2
0.030
0.004
0.036
(0.021)
(0.016)
(0.029)
CSIZE 0.219 0.156 0.068 0.211 0.301 -0.062
(1.124) (1.230) (1.400) (1.603) (1.140) (1.170)
FPERF 0.036 0.048 -0.069 -0.073 0.140** 0.142**
(0.042) (0.048) (0.060) (0.058) (0.056) (0.070)
NFPERF 0.019 0.021 -0.160*** -0.169*** 0.132*** 0.123***
(0.039) (0.038) (0.041) (0.046) (0.044) (0.041)
FINLEV 0.001 -0.000 0.011** 0.011* -0.003 -0.002
(0.006) (0.005) (0.005) (0.007) (0.006) (0.008)
MTBV -0.370 -0.367 -0.855* -0.873* -0.192 -0.225
(0.237) (0.228) (0.456) (0.479) (0.246) (0.285)
ASSUR -1.637 -1.805 0.608 0.819 -0.543 -0.341
(1.273) (1.417) (1.004) (1.065) (1.477) (1.508)
Year dummies Yes Yes Yes Yes Yes Yes
Industry dummies Yes Yes Yes Yes Yes Yes
N 259 259 254 254 266 266
Model 2, 4 and 6 include interaction terms. Robust standard errors in parentheses. Note: See Table 3 for variable definitions. *** p<0.01, ** p<0.05, * p<0.1