masters in f m f w p e r ctt - iseg
TRANSCRIPT
MASTERS IN
FINANCE
MASTERS FINAL WORK PROJECT
EQUITY RESEARCH - CTT
CAROLINA SILVA COUTINHO
OCTOBER – 2015

MASTERS IN
FINANCE
MASTERS FINAL WORK PROJECT
EQUITY RESEARCH - CTT
CAROLINA SILVA COUTINHO
SUPERVISOR:
PROF. DOUTOR CARLOS MANUEL COSTA BASTARDO
OCTOBER – 2015

iii
Abstract
CTT – Correios de Portugal is the leading company in Portugal for the mail and express
business units. Having also experience with financial services, being this a growing division
for the company. Currently, the company is trying to leverage the wide retail network with
the launching of a Postal Bank aiming at expand the product offer and encourage the
cross-selling. CTT also wants to take advantage of the brand perception that consumers
have, targeting the average-income and more conservative consumers.
The goal of this project is to understand if the stocks are under or overvalued and
according to this, give a final recommendation to the investor. This valuation was focused
not only on the company but also on its environment (macroeconomic framework and
peers). Moreover, it was performed a sensitivity analysis, in order to observe how would
the stock’s price respond with a variation on the perpetual growth rate and cost of equity.
With this assessment and having in consideration the assumptions taken, it was possible
to reach to a target price on 31/12/2014 of €12.14. Being the market price on this date of
€ 8.02, it is possible to conclude that the stocks were undervalued, given that the investor
was able to have a potential gain. Hence, the recommendation given to investors was to
buy CTT’s shares.
Keyword: Company Valuation, DCF, Equity Value, Relative Valuation, FCFE, CTT

iv
Index
Abstract ............................................................................................................................................. iii
Index ................................................................................................................................................. iv
Equation Index ................................................................................................................................... v
Figure Index ....................................................................................................................................... vi
Table Index ........................................................................................................................................ vi
Abbreviations List ............................................................................................................................. vii
1. Introduction ...............................................................................................................................1
2. Literature Review .......................................................................................................................3
2.1. Framework .........................................................................................................................3
2.2. Valuation methods .............................................................................................................4
2.2.1 Discounted Cash Flow model ......................................................................................4
2.2.1.1 Firm Valuation ........................................................................................................4
2.2.1.2 Equity valuation ......................................................................................................9
2.2.1.3 Adjusted Present Value ........................................................................................12
2.2.1.4 Economic Value Added (EVA) ...............................................................................14
2.2.2 Relative Valuation .....................................................................................................14
2.2.3 Asset Based Valuation ..............................................................................................16
2.2.4 Contingent Claim Valuation ......................................................................................16
3. Company overview ...................................................................................................................17
3.1 History ..............................................................................................................................17
3.2 Business Portfolio .............................................................................................................18
3.3 Business Strategy ..............................................................................................................18
3.4 Operational Performance .................................................................................................19
3.5 Shareholders Structure .....................................................................................................21
3.6 Shares Performance and Dividends Policy ........................................................................22
3.7 Strategic Analysis .............................................................................................................22
3.8 CTT’s Future – Bank of CTT, S.A. .......................................................................................24
4. Macroeconomic Framework ....................................................................................................25
5. Valuation ..................................................................................................................................26

v
5.1 Assumptions ...........................................................................................................................26
5.2 DCF – Equity Valuation ...........................................................................................................28
5.3 Relative Valuation ..................................................................................................................29
5.4 Sensitivity analysis ..................................................................................................................31
6. Conclusion ................................................................................................................................33
Bibliography .....................................................................................................................................35
Annexes ............................................................................................................................................39
Annex 1 – CTT Group ....................................................................................................................39
Annex 2 – Revenues by Segment .................................................................................................39
Annex 3 – Results and Ratios........................................................................................................40
Annex 4 – Shareholders Structure on December, 31 2014 ...........................................................40
Annex 5 – CTT Share Price Evolution ............................................................................................41
Annex 6 – CTT Stock Price Evolution VS PSI-20 Index ...................................................................41
Annex 7 – Portuguese GDP growth rate (2005-2014) ..................................................................42
Annex 8 – Consumer Price Index for Portugal (2005-2014)..........................................................42
Annex 9 - Porter’s Five Forces Analysis ........................................................................................43
Annex 10 – SWOT Analysis ...........................................................................................................44
Annex 11 – Application of the Relative Valuation Method ..........................................................45
Annex 12 – Income Statement .....................................................................................................45
Annex 13 – Balance Sheet ............................................................................................................46
Equation Index
Equation 1 – FCFF Formula .................................................................................................................5
Equation 2- WACC formula ................................................................................................................5
Equation 3 - CAPM equation ..............................................................................................................6
Equation 4 - Enterprise Value .............................................................................................................9
Equation 5- Terminal Value ................................................................................................................9
Equation 6- Value per share ...............................................................................................................9
vi
Equation 7- Gordon Growth Model (GGM) ......................................................................................10
Equation 8- Free Cash Flow to Equity ...............................................................................................11
Equation 9 - Equity Value .................................................................................................................11
Equation 10- APV formula ................................................................................................................12
Equation 11- Value of the Unlevered Firm .......................................................................................13
Equation 12- Value of Tax Benefits ..................................................................................................13
Equation 13- PV of Expected Bankruptcy Cost .................................................................................14
Equation 14- Economic Value Added ...............................................................................................14
Equation 15- FCFE calculation using FCFF ........................................................................................28
Figure Index
Figure 1 - Most used multiples .........................................................................................................15
Figure 2 - Porter Five Forces Model .................................................................................................24
Table Index
Table 1 - 2014 Sales for CTT peers in percentage .............................................................................20
Table 2 - Competitor’s EBITDA .........................................................................................................21
Table 3 – FCFE calculation ................................................................................................................28
Table 4 - Fair Value vs. Historical Price .............................................................................................29
Table 5 - Relative Valuation ..............................................................................................................30
Table 6 - Sensitivity analysis .............................................................................................................32

vii
Abbreviations List
APT- Arbitrage Pricing Theory
APV- Adjusted Present Value
B2B – Business to Business
B2C – Business to Customer
CAPEX-Capital Expenditure
CAPM- Capital Asset Pricing Model
CPI - Consumer Price Index
DCF – Discounted Cash Flow
DDM – Dividend Discounted Model
DPS – Dividends per Share
EBIT- Earnings before Income and Taxes
EBITDA - Earnings before Income, Taxes, Depreciation and Amortization
ECB – European Central Bank
EV- Enterprise Value
EVA- Economic Value Added
FCFF- Free Cash Flow to the Firm
FCFE- Free Cash Flow to Equity
GGM- Gordon Growth Model
GDP- Gross Domestic Product
IPO- Initial Public Offering

viii
IRC- Corporate Income Tax
IMF –International Monetary Fund
NWC- Net Working Capital
ROA- Return on Assets
ROE- Return on Equity
SWOT - Strengths, Weaknesses, Opportunities and Threats
TV – Terminal Value
WACC- Weighted Average Cost of Capita
YTM – Yield-To-Maturity
Carolina Coutinho Equity Research -CTT 1
1
1. Introduction
With the beginning of the Economic and Financial Assistance Program, Portugal had the
need to privatize some companies and divest in some private companies. In 2013, the
privatization process of CTT - Correios de Portugal began, the same had already been done
in similar companies in other European countries such as, Germany, Belgium, Netherlands
and Denmark, among others.
Nowadays, the privatization process of CTT is successfully finished and CTT is the only
company in PSI-20 with 100% free float.
For the future CTT have four goals. First, with the new technologies the mail unit sales
have been decaying, CTT intends to contradict this tendency, while also, taking advantage
of the growth trend in parcels and gain market share. Aligned with these, they intend to
launch the Postal Bank and make this the major sales driver in the future and in order to
accomplish these, CTT will use the extensive physical network and brand recognition in
order to reduce the costs of the Postal Bank.
The purpose of this project is to value the company aiming to establish its target price at
31/12/2014. This project is divided into four different sections:
1. In the first part – Literature Review – the different and most used valuation
methods will be explained in detail. Once these methods are clearly explained, one
can more easily identify which are the most suitable methods for CTT’s case.
2. Secondly, the company will be analyzed. The history will be presented, as well as
the company's business portfolio and its strategy. It will also be important to
Carolina Coutinho Equity Research -CTT 2
2
examine the shareholder structure, the evolution of the performance of the stocks
and the dividend policy in force. It will be done an operational analysis where CTT
will be compared to its peers.
3. In the third section, the macroeconomic framework will be presented.
4. The last part will show the assumptions made, the valuation realized, the results
reached and how these results change using different assumptions. To observe this
it will be performed a sensitivity analysis. As it will be possible to observe, the
method used was the Discounted Cash Flows (equity valuation), the relative
valuation will be used in order to validate the results obtained in the DCF.

Carolina Coutinho Equity Research -CTT 3
3
2. Literature Review
2.1. Framework
Valuation has a major role in several areas, such as corporate finance, mergers and
acquisitions and portfolio management (Damodaran, 2010).
In his work, Fernandez (2015) outlines eight goals of valuation. Which are, to determine
the value for buying and selling operations; to value listed companies and compare the
theoretical price to the price of the market; in a situation of public offering, valuation is
also used to justify the price at which the stocks are selling; to compare its value to the
value of other assets; to grant compensation schemes based on value creation; to identify
and stratify the main value drivers; to make strategic decisions; and finally, to measure the
company policies and create a strategic plan.
According to Damodaran (2006), there are four main approaches: Discounted Cash Flow,
Relative Valuation, Asset Based Valuation and finally, Contingent Claim Valuation. These
four models should lead to equivalent results when using similar assumptions.
Regarding all the existing theory about corporate valuation, there still exists a huge gap
between theory and practice, mainly due to the lack of direction about how to estimate
the necessary parameters, leading practitioners to make their own assumptions. This can
induce substantial errors and differences in the estimation of parameters. This subject was
studied by Bancel & Mittoo (2014), where they reached to a few important conclusions.
For example, despite the majority of the financial experts assumed to use Discounted Cash
Flow and Relative Valuation models, the final results were completely different, essentially

Carolina Coutinho Equity Research -CTT 4
4
due to a lack of guidance in the estimation and also to the fact that practitioners ignore
some recommendations presented in theory.
2.2. Valuation methods
2.2.1 Discounted Cash Flow model
Discounted Cash Flow (DCF) models are the most popular instruments for estimating the
value of either projects or companies. DCF is computed by using the cumulative present
value of the expected cash flows discounted with the appropriate risk-adjusted discount
rate. This discount rate represents the cost of capital and can be derived using the capital
market models, e.g. Capital Asset Pricing Model (CAPM) or Arbitrage Pricing Model (APM).
This method has several different approaches, being the three most important the Firm
Valuation, Equity Valuation and the Adjusted Present Value (Damodaran, 2006; Kemper,
2010).
2.2.1.1 Firm Valuation
This first approach was created in the 1950’s by Modigliani & Miller (1958) and has
suffered some changes across the years. According to Damodaran (2006), this approach
consists in valuing the whole firm by discounting the free cash flow to the firm (FFCF) by
the weighted average cost of capital (WACC).
So, to reach to the firm value, one has to take three steps. Firstly, determine the free cash
flow to the firm.

Carolina Coutinho Equity Research -CTT 5
5
According to Damodaran (2010), FFCF is the sum of all cash flows of the firm after all
expenses are paid, thus it is the value left to all the claim holders of the firm. And it is
computed using the following formula:
Equation 1 – FCFF Formula
The second step is to calculate the WACC. WACC is the required rate of return of all of the
firm’s assets. Equation 2 presents WACC’s formula.
Equation 2- WACC formula
Kd: Cost of debt E: Equity level
ʈ: Tax rate Ke: Cost of equity
D: Debt level
On its work, Fernandez (2015b) warns that the WACC is neither a cost nor a required
return and this is a common mistake. Accordingly, the WACC is the weighted average of
the cost of debt and the required return of equity.
How to compute the WACC?
First, it is necessary to compute the cost of equity. Copeland, Koller & Murrin (1996)
recommend using capital asset pricing model (CAPM) or the arbitrage pricing
theory (APT).

Carolina Coutinho Equity Research -CTT 6
6
Regarding the APT, it was created by Ross (1976), who claims that if there are no arbitrage
opportunities, then the returns of the assets are approximately linearly related to the
factor loading.
CAPM was created in the 1960’s and has as main assumptions that investors act rationally
and are in the presence of efficient markets (Quiry, Dallocchio, Le Fur, & Salvi, 2009). The
equation for the cost of equity is as presented below:
Equation 3 - CAPM equation
Rf: Risk-free rate
β: Systematic risk
Km: Return of market portfolio
In order to implement the CAPM, it is needed to estimate these three variables (risk-free
rate, beta and market risk premium). These factors will be explained subsequently.
Starting by the risk-free rate, this is one of the main difficulties when applying the CAPM
model. The problem is how to choose which rate to use. This rate should incorporate no
risk of default and also no coupon reinvestment risk. According to these criteria, the risk
free rate chosen should be a default-free (government) zero coupon rate (Damodaran,
2008). The rate that should be used changes among different economies, typically when
doing a valuation in Europe, it is advisable to use a German zero coupon bond and for a
valuation in United States of America, it is desirable to use a treasury bond.
In relation to beta, Rosenberg & Guy (1975) state that the systematic risk (beta) capture
the part of the investment risk that cannot be eliminated throughout diversification. In

Carolina Coutinho Equity Research -CTT 7
7
practice, a stock with a beta higher than one will be riskier than the market and so they
offer higher returns than average in order to compensate the risk.
Beta can be estimated using a simple linear regression between market returns and
returns of the security (Quiry et al., 2009) and usually is estimated using the last three to
five years of available data.
Lastly, the market risk premium is the difference between the market expected return and
risk free rate. Despite all the models suggested by several academics there is no model
that is able to estimate accurately the market risk premium.
According to Fernandez (2015b), there are four different concepts:
1. Historical Equity Premium: historical differential return of the stock market over
treasuries.
2. Expected Equity Premium: expected differential return of the stock market over
treasuries.
3. Required Equity Premium: incremental return of the market portfolio over the risk-
free rate that is required by the investor to hold the market portfolio. The CAPM
model considers that the expected and required equity premium are the same.
4. Implied Equity Premium: is the required equity premium that occurs from a pricing
model and by assuming that the markets are efficient.
The most frequently used, easiest to understand and compute is the first one, since it is
the difference between the returns of the portfolio and the risk-free rate.

Carolina Coutinho Equity Research -CTT 8
8
Several authors have studied the market risk premium used by academics and
practitioners. For example, Copeland et al. (1996) estimate that the market risk premium
fluctuate around 4.5 and 5.5 percent, whereas Fernandez (2009) analyzed the average
market risk premium used in 2008 by professors in several countries and find out that in
the United States this average was about 6.4% while in Europe was 5.3%. Moreover,
Fernandez (2009b) studied 100 textbooks and found out that the proposals for the market
risk premium varied from 3% to 10%. And this difference of values was mainly due to the
lack of clarification of the four different concepts.
The main difference between CAPM and APT is the way they measure market risk. Since
CAPM assumes the market risk is absorbed in the market portfolio and APT allows for
more than one source of market risk and measures the sensitivity to changes in each one
of its sources (Damodaran, 2010).
Considering now the cost of debt, this rate is the interest a company has to pay on new
debt (Berk, DeMarzo, & Harford, 2011). The most usual way to estimate is through the
yield-to-maturity (YTM). This is the internal rate of return that an investor expects to
receive if he holds the bond until maturity. Other possibility to estimate the cost of debt is
using the CAPM and the debt betas. Though, debt betas are difficult to estimate since the
market for corporate bonds is not liquid enough.
To conclude, if the firm reaches a stable growth after n years and starts growing at a
stable rate (g), then the value of the firm will be:
Carolina Coutinho Equity Research -CTT 9
9
Equation 4 - Enterprise Value
Equation 5- Terminal Value
2.2.1.2 Equity valuation
The second approach consists in valuing the equity component of the business. It is
possible to distinguish two different models in this approach, the dividend discounted
model (DDM) and the free cash flow to equity (FCFE).
Dividend Discounted Model
DDM is the oldest and simplest discounted cash flow model and it states that the present
value of the expected cash flows is the value of the asset (Damodaran, 2011). The basis for
this model consists in assuming that the only cash flow the investor receives when buying
stocks is the dividend.
To compute the equity value using this model it is necessary to compute two variables,
the expected dividends and the cost of equity. The expected dividends can be obtained by
making assumptions about the future growth rates of dividends and the payout ratios
(Damodaran, 2010). The cost of equity, as seen previously, is obtained using CAPM or APT.
Equation 6 presents the value of the company per share:
Equation 6- Value per share
Carolina Coutinho Equity Research -CTT 10
10
E(DPSt) = Expected dividends per share
Ke= Cost of equity
In equation 6, it can be perceived that the dividends did not suffer any growth. This is the
original model. A posteriori, Gordon observed that the dividends tend to grow at a
constant rate perpetually – Gordon Growth Model (equation 7).
Equation 7- Gordon Growth Model (GGM)
E(DPSt) = Expected dividends per share
Ke= Cost of equity
G = Expected growth rate
After this model, Gordon introduced the two stage model that has two different periods.
The first, where it allows for an unstable period of growth, and the second being a period
of stable growth (Platt, Demirkan, & Platt, 2010). A simpler model was created by Fuller &
Hsia (1984), where it was added some constraints regarding the risk and dividend payout.
This model (H-model) considers that a firm’s growth rate declines (or increases) linearly
from an above-normal (or below-normal) rate to a normal rate. This model is considered
to be more practical than the general one, and more realistic than the GGM.
Free Cash Flow to Equity (FCFE)
FCFE is a method to compute the company’s equity and represents the amount of money
that shareholders receive from the company, after expenses. Damodaran (2006) highlights

Carolina Coutinho Equity Research -CTT 11
11
that with this model the analyst is discounting potential dividends rather than actual
dividends. Equation 8 presents the formula for FCFE:
Equation 8- Free Cash Flow to Equity
This method is usually used in special circumstances, e.g. valuing a highly leverage
transaction, where the capital structure is constantly changing or for financial firms, where
the cost of capital is difficult to estimate (DePamphilis, 2010). It is also common to observe
practitioners using variants of FCFE to evaluate the attractiveness of the companies as an
investment (Damodaran, 2006).
Having the FCFE computed, the analyst can easily compute the equity value by discounting
the FCFE at the cost of equity as it can be observed in Equation 9. As previously, the cost
of equity can be obtained using the CAPM or the APT.
Equation 9 - Equity Value
Damodaran (2006) compared the DDM and the FCFE and observed that the equity value
computed by both models will be equal whenever the dividends of the DDM are equal to
the ones considered by the FCFE or when the FCFE is higher than the dividend, but the
firm chose to apply the excess cash (FCFE-Dividends) in fairly priced assets. Contrarily,
they can be different in three situations. First, when the FCFE is higher than the dividend
and the excess cash either earns below market rates or is applied in assets that are not

Carolina Coutinho Equity Research -CTT 12
12
fairly value and have a negative net present value. Second, if the FCFE is higher than the
dividend that will lower the debt-equity ratios and lead to an underleveraged firm, causing
a loss in value. Lastly, when the dividends are greater than FCFE, there are several
hypotheses, one is that the firm might be borrowing money to pay dividends which will
make the firm to become overleveraged and lose value, or if the company is paying too
much in dividends, this might lead to capital rationing constraints, which also makes the
firm to lose value.
2.2.1.3 Adjusted Present Value
The last discounted cash flow is the Adjusted Present Value (APV), this model was
developed by Myers in 1974 and the purpose of this model is to value each claim of the
firm individually. Booth (2002) affirms that the fundamental idea of this model is that the
value of the company may be divided in two groups, the unlevered value of the firm and
the value of its debt tax shield.
The overall value of the firm is given by Equation 10.
Equation 10- APV formula
Copeland et al. (1996) have stated that in a perfect market, the capital structure of the
company will not affect the value of its economic assets. The only things that may affect
the firm value are market imperfections, such as taxes and distress costs.
According with Damodaran (2006), in order to apply the APV method, first it is necessary
to compute the value of the unlevered firm:
Carolina Coutinho Equity Research -CTT 13
13
Equation 11- Value of the Unlevered Firm
Ru: unlevered cost of equity
The next step is to calculate the value of the expected tax benefit. Since, when debt is
added to the firm, this creates a benefit (the interest expenses are tax deductible). The
value of the tax benefits is determined as follows:
Equation 12- Value of Tax Benefits
Rd: unlevered cost of capital
Despite academics agreed that tax shields should be discounted at an appropriate rate,
they have not agreed to which rate to use (Luehrman, 1997). Cooper & Nyborg (2004),
Inselbag & Kaufold (1997) and Myers (1974) believe that the appropriate rate is the cost
of debt. However, Harris & Pringle (1985) believe the appropriate rate is the cost of
equity.
The final step requires estimating the boost on the bankruptcy risk that the debt has
created. These are the present value of expected bankruptcy cost (Equation 13). This is
one of the main difficulties of this model, given that the needed variables are not easily
computed.
Carolina Coutinho Equity Research -CTT 14
14
Equation 13- PV of Expected Bankruptcy Cost
2.2.1.4 Economic Value Added (EVA)
EVA, also known as economic profit, is a particular version of excess return models.
According with Damodaran (2011), EVA measures the excess value created by an
investment or a portfolio of investment. Equation 14 presents how EVA is computed.
Equation 14- Economic Value Added
2.2.2 Relative Valuation
Relative valuation is the method of valuing assets by comparing them to similar ones that
are valued in the marketplace. When applying this method the analyst is assuming that
markets are efficient.
In order to apply this method, the analyst has to identify companies that are similar to the
target firm. According with Sharma & Prashar (2013), first it should be created a broader
group of comparables and then, narrow it according to the similarity with the target
company. The comparable companies are chosen based on its business profile (sector,
end markets, products and services, geography and distribution channels) and its financial
profile (size, return on investment, growth pattern and profitability).
Jinda (2011) observed two different types of multiples: the enterprise value multiples and
the equity multiples. Figure 1 presents the most used multiples in each category.

Carolina Coutinho Equity Research -CTT 15
15
Source: Annual Reports of CTT and ESN
Figure 1 - Most used multiples
The multiples to use are chosen according to the nature of the business or the industry in
which the company operates.
Relative Valuation has several advantages. Damodaran (2006) claims that this approach
requires less information, less assumptions, it is easier to understand and more likely to
reflect the market mood of the moment. Also, this approach tends to yield values closer to
the market price. The fact that multiples reflect the market mood of the moment it is both
an advantage and a disadvantage, since if the industry is overvalued (undervalued) the
valuation will present high (low) values. Moreover, this method allows for a data
manipulation, because the analyst can choose a multiple that gives a biased valuation or
choose the wrong comparable firm.

Carolina Coutinho Equity Research -CTT 16
16
2.2.3 Asset Based Valuation
This approach consists on estimating the business value as the net amount of its assets
and liabilities. However, several authors believe this method is a subset of the previous
approaches, since it needs to use the DCF or the RV to compute the value of the individual
assets (Damodaran, 2006). Damodaran (2010) presents two ways of valuing its net assets:
liquidation value and replacement cost. Some other authors present one other indicator,
the book value (DePamphilis, 2010).
The liquidation value, also known as breakup value can be obtained by summing the price
of the firm’s assets if they were sold. The replacement cost estimates the cost that would
be incurred if all the firm’s assets were replaced at current market prices. Finally, the book
value presents the value of the firm has the sum of the asset’s value in the balance sheet.
2.2.4 Contingent Claim Valuation
The last approach consists in valuing real options (opportunities) by assuming that the
underlying asset has the characteristics of financial options (DePamphilis, 2010). In
financial terms, opportunities are very similar to options, so they can be valued as such.
Many authors believe this method is a step further from traditional models, such as DCF,
since it allows to make a more informed investment choice, given that managers consider
the value of keeping their options open (Leslie & Michaels, 1997). Albeit this approach is a
complement and not a replacement of the DCF analysis (Luerhman, 1997).
This approach can be applied using three different models: Black-Scholes model, Binomial
model and the Monte Carlo Simulation.

Carolina Coutinho Equity Research -CTT 17
17
This method has some disadvantages, like the fact that is more time consuming, less
intuitive and it might be difficult to apply this tool to corporate problems.
3. Company overview
3.1 History
During the time of Discoveries, Portugal was in the center of the world and the king D.
Manuel I felt the need to create a postal service that would allow to make contacts with
other stats and merchants. So, in 1520 the king created the postal service. Initially, this
service was used only by the aristocracy, merchants and the royal family and the deliveries
were made via foot or horseback. It was only in 1893 that the postal service became
available to the population.
From 1960 forward, the number of customers started to increase substantially and the
deliveries were already made by car or train. The company that since 1606 was private
became public in 1970 (Vegar, 2014).
More recently, Portugal received external help from Europe (European Commission,
European Central Bank and International Monetary Fund) and was advised to privatize
several Portuguese companies, being one of them CTT- Correios de Portugal.
This privatization occurred in the end of 2013. Initially, the state privatized only 70% using
two different methods, an IPO and direct sales. Later in 2014, the government sold the
remaining 30%, through the accelerated book building process.

Carolina Coutinho Equity Research -CTT 18
18
3.2 Business Portfolio
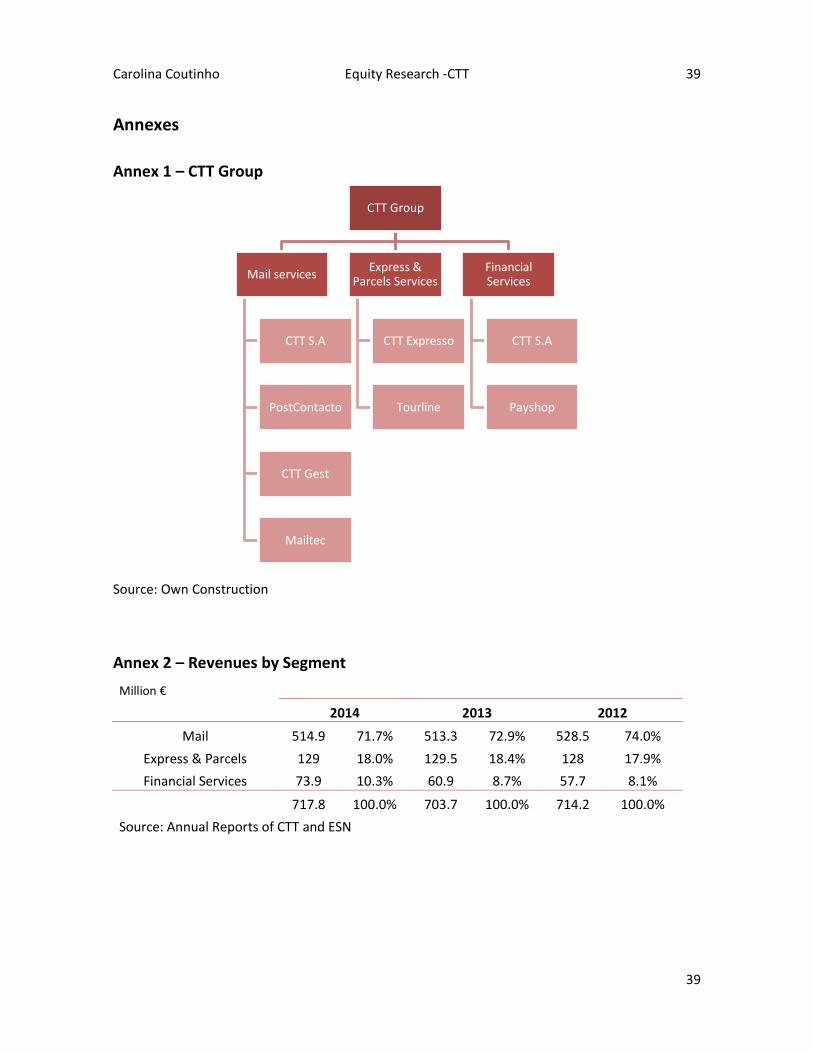
The CTT group operates in three different areas of business. These are, mail, express &
parcels and financial services (annex 1). Each one of these business units have several
subsidiaries allocated.
The mail service operates in the field of postal services and corporate solutions. The
companies that provide this service are: CTT S.A., PostContacto, CTT Gest and Mailtec.
The express & parcels business unit is present in three different markets, Portugal (market
leader with CTT Expresso), Spain (through Tourline) and Mozambique (where CTT holds
50% of the capital of CORRE). Not only offers express and parcels services, but also some
additional logistical services.
Finally, the financial services division provides services through two companies: CTT S.A.
and Payshop. There are three different types of services: Savings and Insurance,
Payments, Money Orders and Transfers and Consumer Credit. CTT is preparing the
launching of a new bank, the Postal Bank and its main purpose is to offer services to the
financially conservative population with low income.
3.3 Business Strategy
The primary goal of the company is to have a stable and sustained growth of dividends
allied with the continuous growth of the company’s value and the improvement of the
profitability in each one of the business units. In order to achieve these objectives, the
company has delineated a few strategic guidelines. The company is focused in maintaining
the business value of couriers; while also, taking advantage of the e-commerce and use it

Carolina Coutinho Equity Research -CTT 19
19
to enlarge the growth of Express & Parcels; and finally, launching the Postal Bank in order
to expand the financial services unit.
With the increase of new technologies and subsequent decrease in the sales of the mail
unit, the future of the company relies heavily on the launching of the Bank. The Postal
Bank will be supported by a low cost principle, since it will be using the already existing
wide retail network of the company. The target consumer will be the already customer
from the financial services unit of CTT, but also the average-income and more
conservative customer, who wants simpler and competitive products. The Postal Bank will
also aim at benefiting from cross-selling opportunities.
3.4 Operational Performance
Regarding the operational performance of the company there are several aspects to take
in consideration. In this chapter we will also compare the CTT indicators, in order to
understand how the company is established in the market. The peers (Royal Mail Group,
Post NL, BPost, UK Mail Group, TNT Express and DHL) used in this chapter are the ones
used to perform the relative valuation, so they will be explained in the more detail in the
valuation chapter.
Starting by analyzing how sales are distributed by each segment, it is possible to observe
in Annex 2, that throughout the years in analysis the business unit that sells more is the
mail segment, although in relative terms this value has been declining. Financial services
were the segment that presented a higher growth, mainly due to the increase of the
products offered and its quality and also due to the strategic partnership implemented.
Carolina Coutinho Equity Research -CTT 20
20
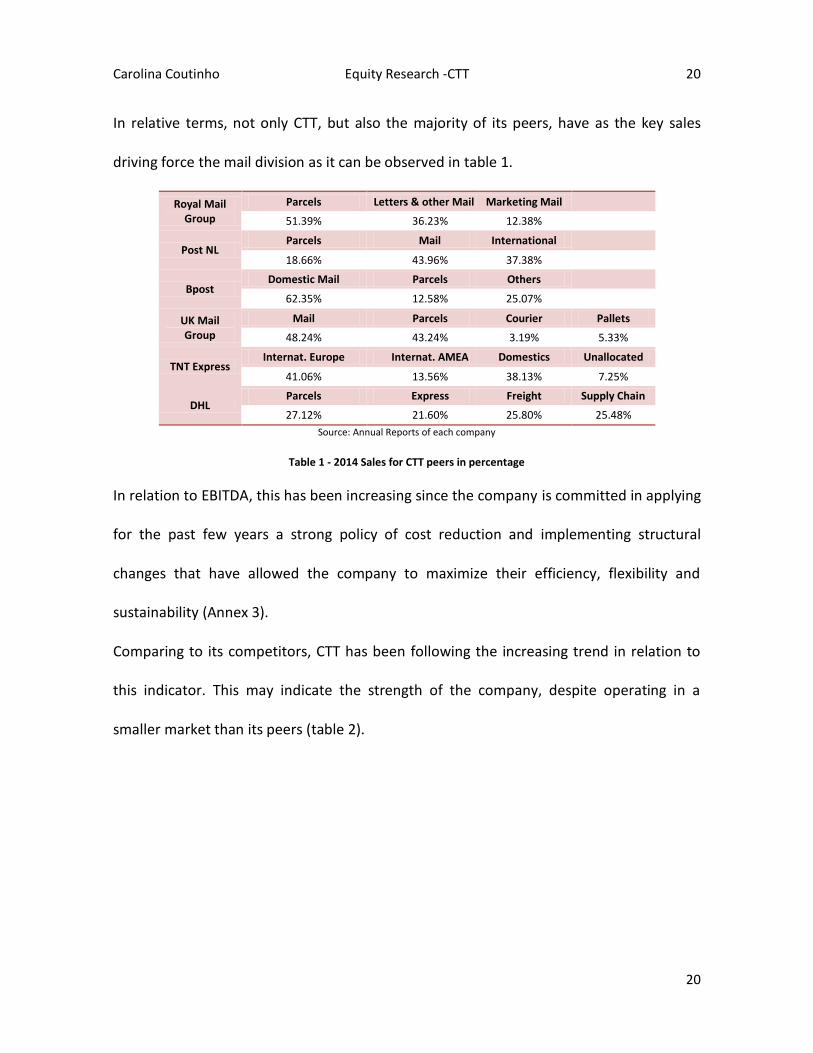
In relative terms, not only CTT, but also the majority of its peers, have as the key sales
driving force the mail division as it can be observed in table 1.
Royal Mail Group
Parcels Letters & other Mail Marketing Mail
51.39% 36.23% 12.38%
Post NL Parcels Mail International
18.66% 43.96% 37.38%
Bpost Domestic Mail Parcels Others
62.35% 12.58% 25.07%
UK Mail Group
Mail Parcels Courier Pallets
48.24% 43.24% 3.19% 5.33%
TNT Express Internat. Europe Internat. AMEA Domestics Unallocated
41.06% 13.56% 38.13% 7.25%
DHL Parcels Express Freight Supply Chain
27.12% 21.60% 25.80% 25.48%
Source: Annual Reports of each company
Table 1 - 2014 Sales for CTT peers in percentage
In relation to EBITDA, this has been increasing since the company is committed in applying
for the past few years a strong policy of cost reduction and implementing structural
changes that have allowed the company to maximize their efficiency, flexibility and
sustainability (Annex 3).
Comparing to its competitors, CTT has been following the increasing trend in relation to
this indicator. This may indicate the strength of the company, despite operating in a
smaller market than its peers (table 2).

Carolina Coutinho Equity Research -CTT 21
21
2014 2013 2012
Royal Mail Group 1,207,436 €1 1,055,180 €1 838,107 €1
Post NL 494,000 € 588,000 € 511,000 €
BPost 551,800 € 511,600 € 380,500 €
UK Mail Group 39,098 €1 35,453 €1 31,506 €1
TNT Express DHL
91,000 € 3,165,000 €
195,000 € 2,926,000 €
354,000 € 2,766,000 €
Source: Annual Reports of each company
Table 2 - Competitor’s EBITDA
Regarding the return on equity (ROE), this has increased, from 13.1% in 2012 to 29.4% in
2014, illustrating the increase of net income of 116% in the period of 2012-2014. Also for
this same reason, the return on assets (ROA) presents a large growth. In relation to the
financial autonomy of the company, the equity ratio has been decreasing throughout the
last years, meaning that the risk has been increasing.
3.5 Shareholders Structure
CTT is the first Portuguese company to be listed with 100% free float. On December 31
2014, CTT presented a share capital of 150,000,000 shares corresponding to a value of
75,000,000 Euro.
The structure of the shareholders is presented in Annex 4. By looking at the table, it is
noticeable that the major stake of the company is held by Standard Life Investments
1 The values for Royal Mail Group and UK Mail Group were converted from GBP to EUR, using the following rates for each respective year:
GBP/EUR
31-12-2014 1.2777
31-12-2013 1.2018
31-12-2012 1.2307 Table - Exchange Rate – GBP/EUR

Carolina Coutinho Equity Research -CTT 22
22
(Holdings) Limited and the lowest is held by The Goldman Sachs Group, Inc. who in 2013
held almost 5% of the company.
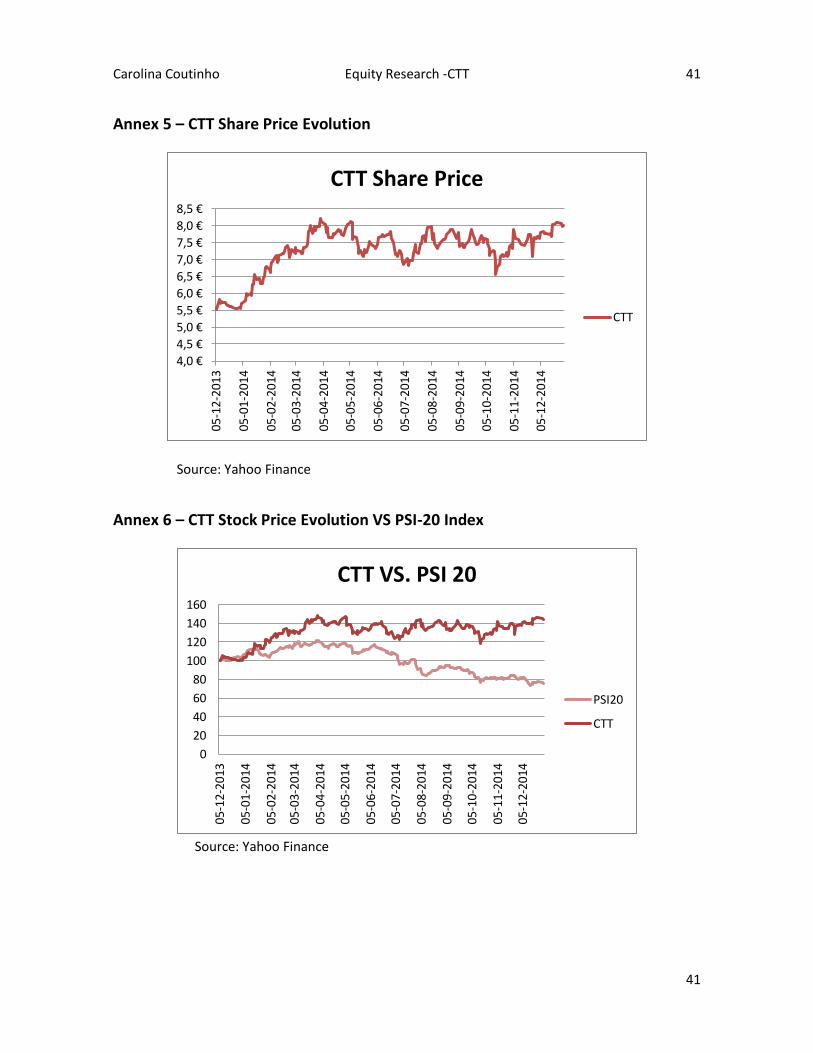
3.6 Shares Performance and Dividends Policy
The Portuguese government set the price of the IPO at 5.52 Euros, however when the
market opened at December 5 2013, the stock started selling at 5.90Euros. In March 2014,
the company debuted in the PSI 20 index. The stock has been having a continuous
appreciation has it is possible to see in the Annex 5. The stock presents a higher growth
until May 2014 and henceforth some ups and downs. Comparing the stock with PSI 20, it
is clear that the CTT’s stocks have outperformed the market (Annex 6). Through the period
of December 5 2013 until December 31 2014, CTT has appreciated 44.71%, whereas the
index has depreciated 32.62%.
In relation to the dividends policy, CTT paid in 2013 a dividend of 2.20 Euros per share and
an extraordinary dividend of 0.65 Euros per share. In 2014, the company paid a dividend
of 0.40 Euros per share concerning the period of 2013, presenting in 2014 a payout ratio
of 78.43%. This has always been a goal of the company, to delivery most of the profits to
the shareholders.
3.7 Strategic Analysis
In order to perform a better analysis of CTT and its industry, it was applied the Porter Five
Forces Model and it was made a SWOT (Strengths, Weaknesses, Opportunities and
Threats) analysis. In the former (figure 2 and annex 7), the business unit that was analyzed
more in-depth was the mail segment, since this is the area that represents a higher share

Carolina Coutinho Equity Research -CTT 23
23
of the sales (in 2014 represented 71.4% of the overall sales). Regarding the industry
competition, there are a high number of existing companies present in the three markets
where CTT operates. However, the threat of new entrants is very low especially for the
mail industry since this industry has been impacted by the appearance of new
technologies. This is also directly related to the fact that there are a lot of substitute
products. Nevertheless, the new technologies tend to increase the volume of e-commerce
and the express segment should have an increase in sales. In relation to the bargaining of
both suppliers and customers, this is very low to suppliers and individual customers, yet
for B2B (business to business) it is possible to observe some degree of bargaining.
For the SWOT analysis (Annex 8), the main strengths are the human resources, the strong
financial background and the brand perception that the consumers have of the company.
On the weaknesses and threats side, CTT are very dependent of the domestic market, the
increase in the regulatory environment, the liberalization of the postal sector and finally,
the lack of investment opportunities, normal for a country that is trying to overcome an
economic crisis. However, CTT should be able surpass its weaknesses and threats by
creating new products which should generate new habits and needs to consumers that
until now did not exists. Finally, the company should also bet on new business areas.

Carolina Coutinho Equity Research -CTT 24
24
Figure 2 - Porter Five Forces Model
3.8 CTT’s Future – Bank of CTT, S.A.
As stated previously, CTT are in the process of creating a postal bank. The launching of this
new bank will happen in two different phases. The first stage will take place in November
of 2015 and will be using a “soft-opening” approach, later on, in 2016 the second stage
will go off with a massive opening to the general public. With this method the company
can make sure that everything goes smoothly, without any errors in the first stage and
move on to the second phase.
The launching of the bank goes in line with the CTT’s strategy to expand the offer of
financial products and gaining a relevant quota in the Portuguese financial market. This
Source: Own Construction
Carolina Coutinho Equity Research -CTT 25
25
project follows the path of other European postal companies, such as Deutsche Post,
Correos and La Poste.
The bank will be a wholly-owned subsidiary of the CTT - Correios de Portugal. The
subsidiary will provide savings, credit and structured products, as well as risk insurances,
among others. The target will be the average income and conservative consumers who
need a bank to execute their daily banking operations, leveraging the vast retail network
of the company and high recognition of the Portuguese public. Moreover, the bank will be
following a low cost principle and will offer competitive and simple banking products, as
well as integrate all the retail channels – physical stores, online and mobile.
4. Macroeconomic Framework
The year of 2014 was marked positively by the end of the Economic and Financial
Assistance Program which was in plan since 2011 with European Commission, ECB and
IMF. By applying this program, the government was able to decrease the public expense
and balance both social security and public health system, these was achieved by
increasing revenues (mainly through the fiscal policy).
Regarding the Gross Domestic Product (GDP), as can be observed in annex 7, in 2011
when the program was first implemented the GDP had a negative growth rate of 1.83%.
Until 2013 the GDP followed a continuously decreasing path (in 2012 had decreased -
4.03% and in 2013 -1.60%). With the end of the program, Portugal was able to finally
present a positive rate of 0.90%.
Carolina Coutinho Equity Research -CTT 26
26
It is also important to observe the evolution of the Consumer Price Index (CPI). In 2011,
this indicator had a value of 3.65%, which decreased until it reached a negative value of
0.28% in 2014 (annex 8).
In the euro zone, the Euribor rate has presented low rates especially since 2012. Now-a-
days, presents negative rates for same maturities. Regarding the currency, this has been
devaluating towards the main world currencies.
5. Valuation
This chapter intends to make a valuation of CTT the purpose of this is to understand if the
stock is undervalued or overvalued. CTT will be evaluated by having in consideration data
until 31 of December 2014 and the final value will be compared using this date.
The method that seemed to be more appropriate was the Discounted Cash Flow – Equity
Valuation, given that the studied company does not present a high degree of leverage. It
will also be performed a relative valuation in order to understand if this approach follows
the same line as the DCF valuation.
5.1 Assumptions
In order to apply the equity valuation some assumptions had to be made. These are
explained below.
Regarding the growth of sales, it was assumed an increase of 4% until 2018 and
henceforth a 2% rate. The reasons behind these values are mainly due to the launching of
the postal bank that should lead to an increase of sales, aligned with the positive

Carolina Coutinho Equity Research -CTT 27
27
macroeconomic environment and the continuity of the Transformation Program that has
been put in place since 2013.
In relation to the tax rate, this remained unchanged from 2011 until 2013 (at a level of
25%) and decreased to 23% in 2014. From 2014 onwards, the IRC tax rate was assumed to
be constant for the forecasted period.
To compute the cost of equity it was used the model CAPM. Firstly, to use this, it was
necessary to compute the beta. Beta was calculated using a linear regression between the
stocks of CTT and the PSI-20 index. The beta reached was 0.55, which means that CTT
presents less risk that the index. Secondly, the 10-year German Bund was used as a proxy
for the risk-free rate (0.541% - 31/12/2014). Also, the risk premium chosen was 9.92%.
This rate was selected according to Damodaran pick’s for a company operating in
Portugal. Lastly, having these values established it was possible to reach a value for the
cost of equity equal to 6.04%.
Concerning the terminal value, the perpetual growth rate used to discount this was 1.50%.
This rate was chosen because the company has good expectations towards the future with
the launch of the postal bank, some new partnerships and the positive future perspectives
of the Portuguese economy.
Regarding the remaining variables, the projection values were computed using either a
margin of the respective variable towards sales or an average of the growth rates of the
historical dates.

Carolina Coutinho Equity Research -CTT 28
28
5.2 DCF – Equity Valuation
In order to apply the equity valuation approach, first it was necessary to make projections
in relation to several variables, as explained above. The second step is to compute the
FCFF using the method explained in the literature review section. Once the FCFF was
reached it was possible to calculate the FCFE using the following equation:
Equation 15- FCFE calculation using FCFF
Source: Own Construction
Table 3 – FCFE calculation
After obtaining the FCFE and the TV, these were discounted and it was possible to reach
the company’s value. Having these, it was necessary to discard the short, medium and
long term debt and include the cash and cash equivalents to reach the equity value of the
firm. The table below summarizes the results of the DCF valuation.
2015 2016 2017 2018 2019
FCFF 60,065.84 57,037.93 59,319.45 61,692.23 67,603.29
Interest*(1-t) 8,481.30 8,820.55 9,173.38 9,540.31 9,731.12
Net Borrowing 654.27 680.44 707.66 735.96 750.68
FCFE 52,238.80 48,897.82 50,853.73 52,887.88 58,622.86
TV 1,481,132.47
PV(FCFE) 49,264.63 43,488.41 42,652.93 41,833.50 43,729.76
PV(TV) 1,104,851.69

Carolina Coutinho Equity Research -CTT 29
29
Equity Value 1,820,675.56
Shares Outstanding 150,000.00
Fair Value per Share € 12.14
Price at 31/12/2014 € 8.02
Potential Gain 51.34%
Table 4 - Fair Value vs. Historical Price
Finally, the fair value of CTT achieved was €12.14. With a market price of €8.02 on
31/12/2014, CTT stocks can be considered to be undervalued since having these prices it is
possible to have a gain (51.34%).
5.3 Relative Valuation
The relative valuation was applied with the purpose of complementing the DCF valuation.
The first step was to choose the peer group. The companies used as multiples were
chosen according to the market in which they operate, in this case the target market was
the European one and the core business should be either mail or express & parcels.
According to these, the chosen companies were: Bpost, Deustche Post, Royal Mail, Poste
NL, UK mail group plc and TNT Express.
Annex 9 shows the values used to compute the multiples and the below table presents the
values computed for CTT and its peers.
Source: Own Construction

Carolina Coutinho Equity Research -CTT 30
30
Table 5 - Relative Valuation
After observing the table it is possible to conclude several things:
1. Comparing the EV to EBITDA of CTT with its peers it is possible to conclude that the
company is undervalued since the price paid by the investor for the benefit of
receiving the company’s cash flow is lower than the price paid for the cash flow of
its peers.
2. In relation to the EV to Sales, the investor desires the lowest possible EV to Sales
this would mean that the company is undervalued. However in this case, CTT is not
the company with the lower EV to Sales; hence CTT has low sales relative to its
value.
3. PER is one of the most commonly used multiple and it shows how many years does
an investor needs to earn back the price paid for the stock. Thus, when using this
multiple, the value desired should be positive but as lower as possible. Contrarily
to the desired, CTT value is one of the analyzed companies with the highest value.
4. Moreover, CTT presents a PBV higher than one, this means that the company is
undervalued, which confirms the results of the DCF valuation.
Company Country EV/EBITDA EV to Sales PER PBV Dividend Yield Earnings Yield
CTT Portugal 4.01 0.77 15.59 4.83 4.99% 6.41%
Bpost Belgium 6.59 1.49 14.03 6.05 6.02% 7.13%
Deustche Post Germany 10.94 0.61 15.80 3.42 2.96% 6.33%
Royal Mail UK 5.03 0.50 3.27 1.74 4.78% 30.54%
Poste NL Netherlands 4.15 0.48 6.07 16.46%
UK mail group UK 8.73 0.55 14.96 3.62 4.51% 6.68%
TNT Express Netherlands 28.17 0.40 1.37 0.70%
Average 9.66 0.69 11.62 3.50 3.99% 12.26%
Price per share 8.70 € 3.22 € 5.98 € 5.82 €
Source: Own Construction
Carolina Coutinho Equity Research -CTT 31
31
5. Regarding the Dividend Yield multiple, this is higher than the average of the peers,
meaning CTT on average distributes more dividends than its peers.
6. Finally, the earnings yield represent the opposite of the PER, so being the earnings
yield lower than the average of the peers, the stock is considered to be
undervalued.
It is also possible to observe with this relative valuation, that the stock’s fair value ranges
between €3.22 and €8.70. This range is very different from the value obtained as being
the fair value but similar to the market value on 31/12/2014.
When looking at both results it is important to note that the equity valuation is built using
several assumptions which can influence the final results. For this reason, in the next
chapter it will be performed a sensitivity analysis with the purpose of showing how do the
price per share moves in relation to a shift in different variables.
5.4 Sensitivity analysis
As said previously the fair value given by the valuation will depend strongly by the values
assumed. Having this, it is necessary to perform a sensitivity analysis in order to
understand how the price per share responds to a variation either on the cost of equity,
the perpetual growth rate, or both.
The below table shows the sensitivity analysis performed:

Carolina Coutinho Equity Research -CTT 32
32
Source: Own Construction
Table 6 - Sensitivity analysis
It can be perceived by the table that both variables (cost of equity and perpetual growth
rate) have a major influence in the final result of the valuation.
For example, having has a starting point the scenario used in the valuation, for an increase
of one percentage point in the cost of equity (to 7.04%), ceteris paribus, there is a
decrease in the price per share from originally € 12.14 to € 10.67. Regarding the impact
caused by a change of the perpetual growth rate, an increase of half a percentage point
(2.00%), ceteris paribus, leads to an increase from € 12.14 to € 12.98 of the share price.
It is also important to note that whichever rates are assumed for the two variables, if the
values are in the range used in the sensitivity analysis, the final value will always be
greater than the market value. Hence, the market price will always be undervalued.
12,14 € 0,50% 1,00% 1,50% 2,00% 2,50% 3,00%
4.04% 14,80 € 16,35 € 18,51 € 21,73 € 27,04 € 37,45 €
5.04% 12,42 € 13,30 € 14,42 € 15,91 € 17,99 € 21,09 €
6,04% 10,90 € 11,46 € 12,13 € 12,98 € 14,06 € 15,49 €
7,04% 9,85 € 10,23 € 10,67 € 11,20 € 11,86 € 12,67 €
8,04% 9,08 € 9,35 € 9,66 € 10,02 € 10,45 € 10,96 €
9,04% 8,48 € 8,69 € 8,91 € 9,17 € 9,47 € 9,82 €
Perpetual growth rate
Co
st o
f eq
uit
y

Carolina Coutinho Equity Research -CTT 33
33
6. Conclusion
The process of a company valuation is the practice used to reach to the value of a
company; this value is not necessarily the price for which a company may be sold.
Especially since companies are not only valuated in buying/ selling situations. The process
of valuation may happen due to the planning of the future of a company, decision-making,
among other reasons. This process is not objective and the final result may depend of the
final purpose, the assumptions taken and finally, according to the method used. For this
project, the methods used were the DCF – Equity Valuation and the relative valuation. The
first method was chosen mainly because of the low volatility of cash flows and to the fact
that CTT are in the stage of maturity in its life cycle. The second method was performed in
order to complement the first valuation.
With the DCF approach it was possible to conclude that CTT stocks were undervalued on
the 31/12/2014, given that the market value was €8.02 and the fair value computed was
€12.14. According to this, the final recommendation for the investor would be to buy the
stocks. Since the market should automatically lead the price to its target price. This
conclusion was validated by the sensitivity analysis performed. Using this analysis it was
possible to confirm that whichever is the cost of equity and/or perpetual growth rate
chosen, as long as it is between 4.04% - 9.04% for the former and between 0.50% - 3.00%
for the latter, the market price will always be undervalued taken in consideration the
assumptions made previously.

Carolina Coutinho Equity Research -CTT 34
34
Regarding the future of the company, it will depend both of the macroeconomic
environment and the company events. For the macroeconomic environment, it is
expected that Portuguese GDP will increase as well as investment, exportations and
private consume. This should affect directly CTT, since e-commerce will increase and CTT
should have a boost in the express & parcels business unit sales.
Concerning the CTT events that should boost its sales, these are the launching of the new
bank and the partnerships that CTT should be able to implement. For example, in 2015,
CTT are implementing a few partnerships that has as main purpose to use its wide retail
chain to offer other types of services (not only postal services), this partnership was made
with the Portuguese Government (Espaço Cidadão) and EDP. Moreover, CTT will have to
also be able to struggle against the substitution effect and embrace globalization and new
technologies, throughout the constant innovation and creation of new products.

Carolina Coutinho Equity Research -CTT 35
35
Bibliography
Books and working papers:
Bancel, F., & Mittoo, U. R. (2014). The gap between theory and practice of Firm Valuation.
Journal of Applied Corporate Finance (Vol. 26, pp. 106–117).
Berk, J., DeMarzo, P., & Harford, J. (2011). Fundamentals of Corporate Finance. Prentice
Hall.
Booth, L. (2002). Finding Value Where None Exists: Pitfalls in Using Adjusted Present
Value. Journal of Applied Corporate Finance, 15(1), 95–104. doi:10.1111/j.1745-
6622.2002.tb00344.x
Copeland, T., Koller, T., & Murrin, J. (2010). Valuation Measuring and Managing the Value
of Companies (Fifth Edition). Mckinsey & Company, Inc.
Cooper, I. A., & Nyborg, K. G. (2004). The value of tax shields IS equal to the present value
of tax shields. CEPR Discussion Paper No. 5182.
Damodaran, A. (2006). Valuation Approaches and Metrics: A Survey of the Theory and
Evidence. Foundations and Trends® in Finance, 1(November), 693–784.
Damodaran, A. (2008). What is the riskfree rate ? A Search for the Basic Building Block,
(December).
Damodaran, A. (2010). Investment Valuation: Tools and Techniques for Determining the
Value of Any Asset.
Damodaran, A. (2011). The Little Book of Valuation: How to Value a Company, Pick a Stock
and Profit. John Wiley & Sons, Ltd.

Carolina Coutinho Equity Research -CTT 36
36
DePamphilis, D. (2010). Mergers, Acquisitions, and Other Restructuring Activities (Fifth).
Elsevier, Inc.
Fernandez, P. (2009a). Markert Risk Premium used by Professors: in 2008: a Survey with
1400 answers (Vol. 3).
Fernandez, P. (2009b). The Equity Premium in 100 Textbooks, 1–25.
Fernandez, P. (2015a). Company valuation methods.
Fernandez, P. (2015b). Equity Premium : Historical , Expected , Required and Implied.
Fernandez, P. (2015c). Ten badly explained topics in most Corporate Finance Books (p.
IESE Business School).
Fuller, R. J., & Hsia, C.-C. (1984). A Simplified Common Stocic Vaiuation. Financial Analysts
Journal, 40(5), 49–56.
Harris, R. S., & Pringle, J. J. (1985). Risk-Adjusted Discount Rates-Extensions From the
Average-Risk Case. The Journal of Financial Research, 8, 237–244.
Inselbag, I., & Kaufold, H. (1997). Two DCF Approaches for Valuing Companies Under
Alternative Financing Strategies (and How to Choose Between Them). Journal of
Applied Corporate Finance, 10, 114–122. doi:10.1111/j.1745-6622.1997.tb00132.x
Jindal, T. (2011). Relative Valuation – Based on Multiples. Chartered Accountants Journal,
(december 2011).
Kemper, A. (2010). Investment and Company Valuation. In Valuation of Network Effects in
Software Markets (pp. 15–29).
Carolina Coutinho Equity Research -CTT 37
37
Leslie, K. J., & Michaels, M. P. (1997). The real power of real options. McKinsey Quarterly,
3, 4–23. Retrieved from
http://elibrary.ru/item.asp?id=3015843\nwww.mckinseyquarterly.com/corpfina/rep
o97.asp
Luehrman, T. A. (1997). Using APV: A Better Tool for Valuing Operations. Harvard Business
Review.
Luerhman, T. A. (1997). What’s It Worth? A General Manager's Guide to Valuation.
Harvard Business Review, 75, 132–142.
Modigliani, F., & Miller, M. H. (1958). The cost of capital, corporation finance and the
theory of investment. The American Economic Review, 48(3), 261–297.
Myers, S. C. (1974). Interactions of Corporate Financing and Investment Decisions -
Implications for Capital Budgeting. The Journal of Finance, 29(1), 1–25.
Platt, H., Demirkan, S., & Platt, M. (2010). Free Cash Flow, Enterprise Value, and Investor
Caution. Journal of Private Equity, 13(4), 42–50. doi:10.3905/jpe.2010.13.4.042
Quiry, P., Dallocchio, M., Le Fur, Y., & Salvi, A. (2009). Corporate Finance Theory and
Practice. John Wiley & Sons, Ltd.
Rosenberg, B., & Guy, J. (1975). Prediction of Beta from Investment Fundamentals (No.
33).
Ross, S. A. (1976). The Arbitrage Theory of Capital Asset Pricing. Journar of Economic
Theory, (13), 341–360.

Carolina Coutinho Equity Research -CTT 38
38
Sharma, M., & Prashar, E. (2013). A Conceptual Framework for Relative Valuation. The
Journal of Private Equity, 29–33.
Vegar, J. (2014). Vencer a Distância - Cinco Séculos dos Correios em Portugal.
Reports:
Bpost 2014 Annual Report
Correios de Portugal, S.A. Annual reports (2011-2010, 2012, 2013,2014)
Deutsche Post DHL Group – Annual reports 2014
PostNL – Annual reports 2014
Royal Mail plc Annual Report and Financial Statements 2014-15
TNT Express – Annual report 2014
UK Mail Group Report & Accounts - 2014
Carolina Coutinho Equity Research -CTT 39
39
Annexes
Annex 1 – CTT Group
Source: Own Construction
Annex 2 – Revenues by Segment
Million €
2014 2013 2012
Mail 514.9 71.7% 513.3 72.9% 528.5 74.0%
Express & Parcels 129 18.0% 129.5 18.4% 128 17.9%
Financial Services 73.9 10.3% 60.9 8.7% 57.7 8.1%
717.8 100.0% 703.7 100.0% 714.2 100.0%
Source: Annual Reports of CTT and ESN
CTT Group
Mail services
CTT S.A
PostContacto
CTT Gest
Mailtec
Express & Parcels Services
CTT Expresso
Tourline
Financial Services
CTT S.A
Payshop

Carolina Coutinho Equity Research -CTT 40
40
Annex 3 – Results and Ratios
2014 2013 2012
EBITDA 135,100 122,928 104,339
EBITDA Margin 18.80% 17.40% 14.60%
Net Income 77,171 61,016 35,735
Thousand €
2014 2013 2012
ROE 29.4% 22.10% 13.10%
ROA 6.71% 5.69% 3.36%
Leverage Ratio 126.16% 121.31% 124.43%
Equity Ratio 21.10% 25.08% 25.72%
Source: Annual Reports of CTT and ESN
Annex 4 – Shareholders Structure on December, 31 2014
Shareholder Nº of Shares % Standard Life Investments (Holdings) Limited 10,007,653 6.67%
Aegon NV 5,141,137 3.43% Allianz Global Investors Europe GmbH (AGIE) 4,695,774 3.13%
UBS Group AG 3,830,469 2.55%
Morgan Stanley 3,553,396 2.37%
UniCredit S.p.A 3,128,282 2.09%
Artemis Investment Management LLP 3,104,624 2.07%
FMR LLC 3,096,298 2.06%
DSAM Cayman Ltd. 3,096,079 2.06%
The Goldaman Sachs Group, Inc. 3,019,750 2.01%
Other Shareholders 107,326,538 71.55%
150,000,000 100%
Source: Annual Reports of CTT
Carolina Coutinho Equity Research -CTT 41
41
Annex 5 – CTT Share Price Evolution
Annex 6 – CTT Stock Price Evolution VS PSI-20 Index
4,0 €
4,5 €
5,0 €
5,5 €
6,0 €
6,5 €
7,0 €
7,5 €
8,0 €
8,5 € 05
-12
-201
3
05-0
1-2
014
05-0
2-2
014
05-0
3-2
014
05-0
4-2
014
05-0
5-2
014
05-0
6-2
014
05-0
7-2
014
05-0
8-2
014
05-0
9-2
014
05-1
0-2
014
05-1
1-2
014
05-1
2-2
014
CTT Share Price
CTT
0
20
40
60
80
100
120
140
160
05-1
2-20
13
05-0
1-20
14
05-0
2-20
14
05-0
3-20
14
05-0
4-20
14
05-0
5-20
14
05-0
6-20
14
05-0
7-20
14
05-0
8-20
14
05-0
9-20
14
05-1
0-20
14
05-1
1-20
14
05-1
2-20
14
CTT VS. PSI 20
PSI20
CTT
Source: Yahoo Finance
Source: Yahoo Finance

Carolina Coutinho Equity Research -CTT 42
42
Annex 7 – Portuguese GDP growth rate (2005-2014)
Annex 8 – Consumer Price Index for Portugal (2005-2014)
-2,00%
-1,00%
0,00%
1,00%
2,00%
3,00%
4,00%
%
Consumer Price Index (CPI) - Portugal (2005-2014)
CPI
Source: Pordata
Source: Pordata

Carolina Coutinho Equity Research -CTT 43
43
Annex 9 - Porter’s Five Forces Analysis
1. Industry competition
Considering the number of competitors in this sector, there were in 2014 sixty-nine
companies in the mail, express and parcels segments. Despite, the high number of
companies operating in these segments, the CTT group is leader in the sector of total
postal traffic presenting 94.4% of market share, while in the express segment has 32.9% of
quota. The main competitors of CTT are: Chronopost, Noticias Direct, Vasp Premium, and
General Logistics Systems (GLS).
In what concerns the switching costs, these are low. Since the customer can easily switch
from on service to other.
2. Threat of new entrants
As to the entry of new players in the market, this possibility is not very strong, since with
the increase of electronic communications; the postal market has decreased, becoming an
unattractive market for new entries. Also, there are high entry barriers such as: level of
reputation, legal constrains, economies of scale, economies of density, high initial
investment.
3. Bargaining power of suppliers
The main suppliers of CTT are companies that offer outsourcing services, energy, fuel and
the equipment necessary like vehicles or computers. These do not present a high degree
of bargaining power since there are a lot of suppliers available in the market. Supplies
with similar products tend to compete in terms of prices leading to low prices. Another
thing that makes the supplier not having a high bargaining power are the low switching
costs, these only exist if there are contracts that have to be fulfilled.

Carolina Coutinho Equity Research -CTT 44
44
Strengths Weaknesses
Consumers have Confidence on the Brand;
Talent Management Plan – retain qualified staff;
Strategic Partnerships;
High Operational Performance;
Large Retail Network;
Consistent Dividend Policy;
Cross Selling;
CTT have a leading market share;
Decline in postal traffic;
Dependence of the Domestic Market;
Credit Risk - possibility of financial losses;
Increase in the regulatory environment;
Opportunities Threats
Innovation through the launching of new
products;
Launching of Postal Bank;
Invest on e-commerce solutions;
Higher competition - Liberalization of the postal
sector;
Globalization;
Poor economic climate.
4. Threat of substitute products
With the growth of new technologies into daily life, these have been the greatest
substitute for postal services. The postal unit has been substituted by other channels of
communication, such as internet, e-mail, fax, telephones, etc. This service not only has a
wider scope, but also arrives to the public faster target at a lower cost.
In relation to the parcel and express segments, these are not threatened by the new
technologies. These units can even growth, since companies are increasing online sales.
5. Bargaining power of customers
Regarding the bargaining power of customers, this is low for private clients. However, for
large customers, particularly in the segment of B2B (business to business), there is a
power to make pressure on the company that might downscale the frequency of delivery,
use other approach of communication towards its clients, or even delivery their own
internal mail.
Annex 10 – SWOT Analysis
Source: Own Construction

Carolina Coutinho Equity Research -CTT 45
45
Annex 11 – Application of the Relative Valuation Method
Source: Own Construction
Annex 12 – Income Statement
Source: CTT Annual Reports
CompanyShare price
(31/12/2014)Sales in € Enterprise Value EBITDA EPS
Dividend per
Share
CTT 8,02 € 703.283.590 € 542.190.000 € 135.101.000 € 0,51 € 0,40 €
Bpost 20,60 € 2.441.700.000 € 3.633.719.446 € 551.800.000 € 1,47 € 1,24 €
DHL 27,05 € 56.630.000.000 € 34.625.189.047 € 3.165.000.000 € 1,71 € 0,80 €
Royal Mail 5,34 € 12.082.025.760 € 6.075.383.279 € 1.207.435.950 € 1,63 € 0,26 €
Poste NL 3,10 € 4.240.000.000 € 2.051.854.483 € 494.000.000 € 0,51 € - €
Uk mail group plc 6,11 € 619.817.121 € 341.194.668 € 39.097.926 € 0,41 € 0,28 €
TNT Express 5,49 € 6.472.000.000 € 2.563.314.255 € 91.000.000 € 0,36 €- 0,04 €
Thousand € 2011 2012 2013 2014
Sales and Services rendered 741.850 699.332 690.069 703.284
Other operating income 23.917 14.893 14.778 14.491
Cost of sales 18.353 18.543 16.906 16.998
Supplies and external services 256.464 246.416 237.292 234.843
Staff costs 358.096 326.666 317.480 320.429
Other operating costs 18.942 11.608 10.241 10.404
EBITDA (recurring) 113.912 110.992 122.928 135.101
Impairment of inventories and accounts receivable, net 3.119 798 2.321 936
Provisions, net 6.274 2.856 118 - 1.070
Impairment of non-depreciable assets 1.942 - - 10
Deprec/amort and impairment of investments, net 22.252 24.636 24.611 21.562
EBIT (recurring) 80.325 82.702 96.114 111.523
Company restructuring (costs) - 6.653 3.623 - 37.192 -
Privatisation costs - - 4.422 2.837
Other non-recurring income and costs - 19.077 8.079 10.460
EBIT 80.325 56.972 87.236 135.418
Financial results 2.259 - 4.379 - 4.003 - 7.473 -
Gains/losses in associated companies 85 240 21 54
EBT 78.151 52.833 83.254 127.999
Income tax for the period 22.468 - 16.864 - 22.148 - 51.155 -
Net profit before non-controlling interests 55.683 35.969 61.106 76.844
Net profit attributable to non-controlling interests 423 232 89 327 -
Net profit for the period attributable to Equity holders 55.260 35.737 61.017 77.171
Carolina Coutinho Equity Research -CTT 46
46
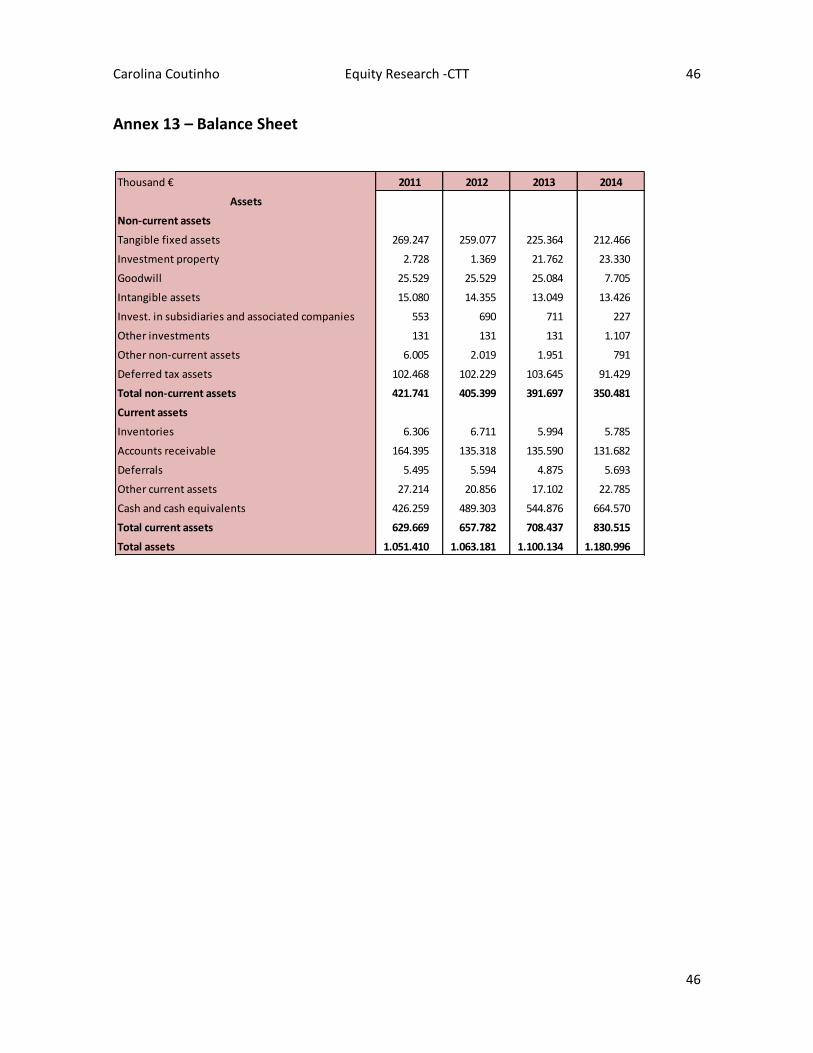
Annex 13 – Balance Sheet
Thousand € 2011 2012 2013 2014
Assets
Non-current assets
Tangible fixed assets 269.247 259.077 225.364 212.466
Investment property 2.728 1.369 21.762 23.330
Goodwill 25.529 25.529 25.084 7.705
Intangible assets 15.080 14.355 13.049 13.426
Invest. in subsidiaries and associated companies 553 690 711 227
Other investments 131 131 131 1.107
Other non-current assets 6.005 2.019 1.951 791
Deferred tax assets 102.468 102.229 103.645 91.429
Total non-current assets 421.741 405.399 391.697 350.481
Current assets
Inventories 6.306 6.711 5.994 5.785
Accounts receivable 164.395 135.318 135.590 131.682
Deferrals 5.495 5.594 4.875 5.693
Other current assets 27.214 20.856 17.102 22.785
Cash and cash equivalents 426.259 489.303 544.876 664.570
Total current assets 629.669 657.782 708.437 830.515
Total assets 1.051.410 1.063.181 1.100.134 1.180.996

Carolina Coutinho Equity Research -CTT 47
47
Source: CTT Annual Reports
Thousand € 2011 2012 2013 2014
Equity and Liabilities
Equity
Share capital 87.325 87.325 75.000 75.000
Reserves 25.793 28.629 30.398 31.774
Retained earnings 88.569 87.105 83.367 84.375
Other changes in equity 15.851 33.080 24.549 18.786 -
Net Profit att. to equity holders of parent company 55.260 35.735 61.017 77.171
Non-controlling interests 1.628 1.608 1.604 324 -
Total equity 274.426 273.482 275.935 249.210
Liabilities
Non-current Liabilities
Provisions 16.476 36.596 38.502 45.672
Medium and long term debt 5.944 4.561 3.282 1.913
Employees benefits 300.975 282.065 278.639 255.541
Deferrals 13.705 11.323 8.837 6.427
Deferred tax liabilities 6.165 5.740 5.482 4.841
Total non-current liabilities 343.265 340.285 334.742 314.394
Current liabilities
Accounts payable 346.905 349.215 391.958 499.537
Short term debt 5.165 6.857 3.717 1.846
Employee benefits 20.456 21.251 19.904 21.750
Income tax payable 7.381 863 93 6.173
Deferrals 4.676 4.369 4.103 5.502
Other current liabilities 49.136 66.859 69.682 82.584
Total current liabilities 433.719 449.414 489.457 617.392
Total liabilities 776.984 789.699 824.199 931.786
Total equity and liabilities 1.051.410 1.063.181 1.100.134 1.180.996