massachusetts’s water infrastructure: toward financial
TRANSCRIPT

Co m m o n w e a l t h o f m a s s a C h u s e t t s
Massachusetts’s Water Infrastructure: Toward Financial Sustainability
Water Infrastructure Finance Commission
February 7th, 2012
This document has been prepared by the Water Infrastructure Finance Commission of the Commonwealth of Massachusetts,
pursuant to Section 145 of Chapter 27 of the Acts of 2009.

Massachusetts’s Water Infrastructure: Toward Financial Sustainability | 1
1. Voices from the Commonwealth .......................... 1
2. Executive Summary ................................................... 3
3. Introduction ...............................................................15
4. Why the urgency around water infrastructure? ...........................................................17
5. The commonwealth relies on water for essential services, economic vitality, and quality of life ......................................................19
6. We have already made major investments in water infrastructure ............................................23
7. There is a substantial and growing “Gap” between the need for water infrastructure investment and available revenue .....................................................29
• Gap analysis
• Estimating the Gap
8. The Gap could be substantially higher if stormwater investments are included ..............33
9. Why do we have this growing Gap? ..................35
Major factors are driving up costs
• Aging systems need investments
• Environmental and public health concerns need to be addressed, with high and sometimes unpredictable costs
– Lack of primacy over federal clean water permits may be hampering best outcomes
– Nutrient control is one of the most costly considerations for communities
– Communities face potentially staggering costs for federally mandated stormwater mitigation
• Security and redundancy must be addressed
• The state faces critical environmental or growth issues that may require new infrastructure or a new paradigm for water and wastewater services
• Municipal debt is a growing burden
• There are unanticipated financial effects of water conservation
state and federal funding is trending downward
• Clean water and drinking water srf grants
• Commonwealth sewer rate relief fund
10. Affordability is an important issue for many communities ................................................57
11. We won’t make progress until the public truly understands the full costs of service and the consequences of failure to invest ...................................................59
12. Road map to a sustainable future ....................61
Strategy #1: Raise revenues
• State revolving funds are a critical foundation
• Boost revenues at the state level through a new trust fund
• Set rates to cover full cost of services
• Combined impact of rate and trust fund strategies
Strategy #2: Operate utilities more efficiently
Strategy #3: Assist towns in retiring their debt
Strategy #4: Address the issue of affordability
Strategy #5: Promote environmental sustainability
Strategy #6: Promote innovation
Strategy #7: Continue the work of the commission and educate the public
13 Recommendations ..................................................95
14 Appendices.............................................................. 111
Table of Contents
Massachusetts’s Water Infrastructure: Toward Financial Sustainability


Massachusetts’s Water Infrastructure: Toward Financial Sustainability | 1
Voices from the Commonwealth“We are keenly aware of the potential impacts of the costs of wastewater management on the people of Cape Cod. Managing the costs of necessary wastewater treatment is one of our highest priorities and a matter of great concern.” Barnstable County
Commissioners, November 10, 2010.
“I am a fan of promoting education on the importance of drinking water utilities…. Educating the consumer to the excellence and value in drinking water utilities would provide the cornerstone for supporting infrastructure maintenance.” IrvIng A. PrIest, suPerIntendent,
WrenthAm dePArtment of PublIc Works, october 22, 2010.
“As a small town water and sewer service provider, I see now as the time to take the first steps in creating a non-bureaucratic method of addressing these needs.” JAmes r. mArshAll, Jr., suPerIntendent,
PlAInvIlle WAter And seWer dePArtments october 13, 2011
“…An alternative system needs to be developed to assist in funding water and wastewater infrastructure needs. We look at the State’s Chapter 90 system for roads and highways and wonder if something similar could be created for us. The system would need to be as simple and straight forward as possible to eliminate the need for additional manpower to handle the massive administrative paperwork requirements of other funding sources. In addition, the system should not reward cities, towns, or districts that have not done their due diligence in regard to rates and conventional funding sources.” crAIg W. JAlbert, suPerIntendent,
monson WAter And seWer dePArtment, november 15, 2010.
“At a time when we should be performing infrastructure improvements to protect the public’s assets, limited funds and resources are being wasted on repairs and other emergency situations… (…) Ultimately it is the ratepayers and taxpayers in our communities that bear the burden for all costs. As you may realize, spreading the necessary expense among the approximately 2400 families or business customers is a heavy burden that many cannot afford. I ask you, how do we remain sustainable under these conditions?” bArry W. Woods, dIstrIct suPerIntendent,
buzzArds bAy WAter dIstrIct, november 10, 2010.
“The federal assistance and SRF support received have been extremely helpful, but more state assistance is needed in the form of grant aid, if our communities are to meet the enormous mandated costs of cleaner water.” chrIstoPher curtIs, chIef PlAnner, PIoneer
vAlley PlAnnIng commIssIon, november 20, 2010.
“We feel this proposed Permit (MS4 Stormwater) mandates stormwater requirements and best management practices that will prove too difficult for any town of Medway’s size, with a limited budget and staff, to execute. We are concerned that the current economic climate presents the worst possible conditions in which to apply such strict requirements.” dennIs croWley, chAIrmAn,
medWAy boArd of selectmen mArch 14, 2011.
“Springfield’s water and sewer infrastructure dates back to the 1800’s and, as in many other cities, it is aging and in need of repair and replacement. We now face a substantial financial challenge to keep our underground pipes and valves operating safely so that we can preserve the quality of life we enjoy. In Springfield today, we experience an average of one water main break a week. Routinely responding to a growing number of emergencies is a costly—and risky—way to manage our infrastructure. In recent years, we have experienced several major breaks or leaks in our transmission mains which caused property damage, traffic delays, and resulted in repairs costing from $300,000 to $500,000 per event (excluding property damage). JosePh suPreneAu, suPerIntendent,
sPrIngfIeld WAter And seWer commIssIon, november 15, 2010.
“As a small system enterprise fund that draws its revenue from a limited population we have historically struggled to afford upgrades to our aging infrastructure. …Although it is clear that the SRF program has been successful in helping reduce the burden that our rate payers must bear, our community simply cannot continue to increase its rates at or near the amounts of recent years. We need more help in the form of grants. … Regardless of our small system size, in Spencer, we are expected to provide clean, safe drinking water to the public just like everyone else.” robert d. mc neIl III P.e., utIlItIes And fAcIlItIes suPerIntendent, toWn of
sPencer, october 13, 2010.
“Acton has a long tradition of supporting water infrastructure. However, as with many communities, increasing rates and incremental water quality improvement make our customers less tolerable of paying more.” chrIstoPher Allen, dIstrIct mAnAger, Acton WAter
dIstrIct, november 23, 2010.
“At this time, the Holliston Water Department’s annual budget includes about 39% debt service—a number that will soon rise again due to a DEP mandated $1.5 million repair to an existing well site. We are essentially using “band aids” to fix know leaks and have no money in our water rate supported budget for proactive pipe replacement.” Jeff WeIse, chAIrmAn, hollIston boArd of WAter commIssIoners,
ocotber 20, 2010.


Massachusetts’s Water Infrastructure: Toward Financial Sustainability | 3
When we turn on the tap in the morning, clean, drinkable water flows from the faucet. It is an uninteresting and unremarkable fact of modern life until, one day, no water comes out.
We have learned to take the reliability of our drinking water and wastewater disposal systems as well as our storm water systems for granted. It is only when there is a major problem with our water infrastructure systems—a large water main breaks, or leaking sewage causes a beach closing, or a blocked drain causes flooding—that we start to pay attention to the thousands of miles of pipes, pumping facilities, and numerous treatment plants that are part of our water infrastructure.
Clean water is perhaps our most precious commodity and assur-edly our most recycled resource. Our water supply, wastewater treatment, and storm water management protect our health, keeping us safe from deadly waterborne diseases. The availability of high quality water is an important consideration for many businesses, including life sciences and manufacturing. A high-pressure water system allows us to put out fires, and healthy rivers, lakes and wetlands free from pollution are critical for a thriving natural environment.
A well-maintained, reliable water infrastructure system is vital to the Commonwealth’s health, economy, environment, and cultural vitality.
Yet despite its importance, our aging water infrastructure system suffers from a lack of investment, delayed maintenance and insufficient resources. Hundreds of miles of pipes are kept in service far past their useful life, leading to lost water and sewage through underground leaks and, in the worst case, water main breaks that can leave thousands of families without water for days or even weeks. Many municipal treatment plants are in need of updating to meet current public health and environmen-tal guidelines. Like the homeowner who postpones repairs until the roof leaks, we jeopardize our water services when we fail to maintain and upgrade our existing infrastructure.
Our drinking water, wastewater and stormwater infrastructure need increased investment if they are going to continue to deliver reliable clean water and keep wastes and toxic chemicals out of our environment without service interruptions.
Executive Summary
“When the well is dry, we know the worth of water.”
– Benjamin Franklin
Clean water is perhaps our most precious commodity and assuredly our most recycled resource

4 | Massachusetts’s Water Infrastructure: Toward Financial Sustainability
E x e c u t i v e S u m m a r y
At the same time, sources of revenue to pay for these invest-ments are on decline at the federal, state and municipal level. The result is a large and growing Gap—estimated to be $21.4 billion over the next 20 years—between current funding for the state’s water infrastructure and wastewater systems and the amount of funding actually needed.
The Water Infrastructure Finance Commission was created by the Massachusetts Legislature in 2009 to analyze our water infrastructure funding needs and develop recommendations for financing these needs going forward. What follows are the findings and final recommendations of this Commission.
Mind the GapThe Commission finds that Massachusetts, like other states, faces a substantial water infrastructure Gap. Using the best available data, the Commission estimates that the Common-wealth conservatively faces a $10.2 billion Gap in resources for drinking water and an $11.2 billion Gap in resources for clean water (wastewater) projects over the next 20 years.
The Commission’s Gap estimates include capital investment, repair and replacement, operations, maintenance and debt service. Estimates do not include the cost of evolving regulatory requirements or investments to accommodate economic growth. As such, these estimates are more likely to understate rather than overstate the Gap and the funding need.
One particularly large regulatory change looms on the horizon and may require significant attention and additional resources: potentially forthcoming federal stormwater regulations. Esti-mates of the expected costs to communities are varied, limited, and sometimes conflicting, but the Commission’s analysis suggests that perhaps $18 billion in stormwater investment (in addition to the $21.4 billion for water and clean water) may be required over the next 20 years depending on federal regulatory requirements.
Whether or not necessary stormwater investments are included, the message is clear: a significant increase in spending above current levels will be necessary to maintain current levels of service and sustain necessary infrastructure growth. And, while federal subsidies will continue at some level, it is clear that state
0
5
10
15
20
25
Drinking Water $10.2
billion
Clean Water $11.2 billion
Total $21.4 billion
Estimated Gap in water and clean water investments over the next 20 years (in billions of dollars)

Massachusetts’s Water Infrastructure: Toward Financial Sustainability | 5
E x e c u t i v e S u m m a r y
and local governments across the country will need to prepare integrated responses to this impending crisis.
The Gap is GrowingIf the Commonwealth does not take action quickly, this infrastructure funding Gap will only grow larger. A number of factors—including increasing costs and decreasing revenues—are contributing to the widening of this Gap.
Water utilities face many cost challenges:• Agingsystemsneedinvestments. Some water and sewer
systems in Massachusetts’ss older cities were constructed as early as the 1800s. Major federal investments in water and wastewater in the 1970s and 1980s brought new plants and new technologies to many towns, but many of these assets are nearing the end of their intended service life. As a result, many communities in the Commonwealth are facing serious challenges posed by the cost of needed upkeep, upgrades, and improvements to aging water and sewer systems.
• Environmentalandpublichealthconcernsneedtobeaddressed. Many systems are in need of improvements and upgrades in their level of treatment to meet stronger environmental or public health standards. Many municipal systems are facing ongoing, increasingly expensive, and unfunded court orders and regulatory requirements to address various environmental or public health requirements. Nutrient control and stormwater mitigation are particularly significant challenges in Massachusetts. The cost of address-ing them is high and sometimes unpredictable.
• LackofstatelevelcontroloverCleanWaterpermitsmaybepreventingsmartplanningandprioritizationofresources. Massachusetts is one of only four states in the nation that has not taken over responsibility (“primacy”) for managing water pollutant control from the federal government. While the state would still be required to meet federal standards, primacy may allow the state to work col-laboratively with cities and towns to manage wastewater and stormwater programs and provide the flexibility needed to most effectively prioritize scarce pollutant control resources. As federal wastewater and stormwater regulations become more and more stringent, having this flexibility on the local level may become increasingly important.
The Gap could nearly double if stormwater mitigation estimates are included (in billions of dollars)
10.2 11.2 18
21.4
18
0
5
10
15
20
25
30
35
40
45
Drinking Water
Clean Water
Stormwater Total
1 Summary: Closing the Gap: Innovative Solutions for America’s Water Infrastructure Forum; January 2003 http://water.epa.gov/infrastructure/sustain/upload/2009_05_26_waterinfrastructures_summary_si_waterinfrastructureforum-2003.pdf

6 | Massachusetts’s Water Infrastructure: Toward Financial Sustainability
E x e c u t i v e S u m m a r y
• Securityandredundancyinvestmentsarerequired. To pro-tect the public during emergencies—from natural disasters to system failures to acts of terrorism—communities must invest significant dollars in security and redundancy in their systems.
• Costsarerising. Pumping, delivering, collecting and cleaning water and wastewater uses a significant amount of energy, chemicals and manpower. As these costs rise, so does the cost of providing clean water. Similarly, as treatment systems become more complex, so does the level of skill and training of personnel needed to operate them, and the compensation needed to attract them has increased.
• Manywaterutilitiesarenotrunningatoptimalefficiency. Generally accepted industry best management practices exist, but are used only partially or not at all by water utilities across the state. Many municipalities need technical assis-tance and training that could help them run more efficient and financially healthy systems that recognize and address the true costs of water services.
• Municipaldebtisagrowingburden. Many municipalities have taken on increasing levels of debt to maintain their water infrastructure and meet obligations for mandated improvement projects. For many communities, this means a significant portion of their finances have been and will continue to be consumed by debt service.
Revenues are not keeping pace with needs:• Federalandstatefundingsourcesaretrendingdownward.
Both federal and state funding available to municipalities to fund water and wastewater infrastructure has steadily decreased since the 1970’s. Line items that once funded infrastructure projects, provided rate relief, or funded low-interest loans have been cut dramatically or eliminated. These funding cuts have been further exacerbated by the recent recession.
• Ratesvarywidelyanddonotalwayscoverthefullcostofservice. Unlike other utilities, all too often, municipal water and sewer rates do not come close to covering the full cost of providing clean water and eliminating waste. In particular, rates frequently do not cover capital improvement plans, the management and replacement of pipes and other assets, or
All too often, municipal water and sewer rates do not come close to covering the full cost of providing clean water and eliminating waste

Massachusetts’s Water Infrastructure: Toward Financial Sustainability | 7
E x e c u t i v e S u m m a r y
the protection of watershed land. As a result, the public has grown accustomed to low user rates and can dramatically underestimate or misunderstand and resist rates that reflect the true cost of service.
• Unanticipatedfinancialeffectsofwaterconservationhaveanimpactonutilities’bottomlines. Increasing levels of water conservation is undoubtedly good news for the environment and should be encouraged. Because water is billed based on volume sold, however, water conservation has unfortunately led to reduced revenues for maintaining water systems.
• Affordabilityisanimportantissueformanycommunities. Rate payers are very concerned about the cost of services, and system managers must address affordability in setting their rates. Keeping water and sewer service affordable is of particular concern to individuals on low and/or fixed incomes. As water infrastructure is paid for increasingly with user rates, it is important to recognize that different communities have different abilities to pay for necessary improvement.
A nationwide problemMassachusetts is not alone in facing these issues and an enor-mous water infrastructure funding Gap. The US Environmental Protection Agency has articulated these concerns repeatedly over the last decade, and continues to encourage creative solutions.
In crafting Recommendations, the Commission strove to be consistent with approaches recommended by the EPA (see boxes).
The true cost of water: educating the public and policymakersThe public is often unaware of the true costs of fully supporting, operating, maintaining and investing in our water infrastructure.
At the same time, consumers generally underestimate the value of water in protecting public health and safety, promoting economic vitality, creating jobs, and preserving our environment.
Most of all, the public and policymakers at all levels often misunderstand the consequences of failing to invest, from the
Although the figures are staggering, it is critical that our nation invest in infrastructure for the long-term protection of public health, our environment and the economy. EPA is committed to promoting sustainable practices that will help reduce the Gap between funding needs and spending at the local level. EPA believes that better management practices, efficient water and energy use, the full cost pricing of services, and using a watershed approach when making funding decisions can all help responsible municipalities and utilities operate more sustainably, now and in the long-term.”
Water inFrastructure Funding OptiOns FOr a sustainaBle Future, usepa neW england regiOn,
OctOBer 2008
The vision outlined in the Clean Water Act—fishable, swimmable waters—has not changed. In fact, this strategy is about how we can achieve a leap forward in our nation’s water quality to move us closer to realizing this vision.”
“There is no silver bullet—no single program or regulation will allow us to accomplish our goal. Carrying out all of these principles is where the true “coming together” must happen to address the primary stressors from multiple angles: smarter regulations, stronger partnerships, more balanced and coordinated compliance and enforcement, more integrated approaches to capitalize on synergies, improved communication with a broader audience, and greater leveraging of programs. Just as EPA will have to employ all of its tools, so too must all our partners.”
cOming tOgether FOr clean Water: epa’s strategy FOr achieving clean Water, puBlic discussiOn draFt,
august 2010

8 | Massachusetts’s Water Infrastructure: Toward Financial Sustainability
E x e c u t i v e S u m m a r y
EPA is firmly committed to helping local governments identify opportunities to achieve clean water using a comprehensive integrated planning approach. An integrated approach allows communities to prioritize their investments to address the most serious water issues first and provides flexibility to use innovative, cost-effective storm – and wastewater management solutions—including green infrastructure.”
epa develOps neW planning apprOach tO imprOve Water Quality in u.s. cities
BOB perciasepe, epa deputy administratOr press release – OctOBer 28, 2011
95%of American voters valued water over any other services they received, including heat and electricity 2
high costs of deferred maintenance and emergency repairs to the missed opportunity to grow our economy by strengthening our infrastructure.
The result is a lack of public attention to and support for policies that will ensure we have the resources necessary to rehabilitate our aging infrastructure, meet the challenges of environmental regulation, and continue to provide safe, clean drinking water across the Commonwealth without interruption.
Until the public begins to understand the true costs and high value of water, it will be difficult to make progress on many of the Commission’s recommendations.
There is hope, however: polling suggests that voters value clean water and are starting to become concerned about the state of the nation’s water infrastructure. A 2010 ITT Corporation survey of American voters found that:
• 69% agreed with the statement “I generally take my access to clean water for granted.”
• 95% valued water over any other services they received, including heat and electricity.
• Nearly 1 in 4 are “very concerned” about the state of the nation’s water infrastructure.
• 29% understand that water pipes and systems in America are “crumbling and approaching a state of crisis.”
• 3 out of 4 stated that disruptions in the water system would have “direct and personal consequences.”
The poll also found that voters are willing to pay more for their water services.
This is good news, because it suggests that efforts to educate the public on the actual and full costs of providing a reliable water supply can impact the willingness of ratepayers to pay for those services.
The Commission proposes a road map to a sustainable future:Over the past decade, many studies have confirmed the need for investment in the nation’s drinking water, wastewater, and stormwater infrastructure. While estimates of the size of the
2 “Value of Water Survey” ITT Corporation White Plains, NY 2010 http://www.itt.com/valueofwater/
Massachusetts’s Water Infrastructure: Toward Financial Sustainability | 9
E x e c u t i v e S u m m a r y
Gap may vary, the underlying message is clear. A significant increase in spending above current levels will be necessary to meet this investment need. And, while federal subsidies will continue at some level, it is clear that the states and local governments across the country will need to prepare integrated responses to this impending crisis.
The Commission finds that Massachusetts, like other states, faces a substantial Gap between current revenue levels and that needed over the next 20 years. This Gap is not a static number—its size will depend on our actions and many other variables. The Commission recommends that the Commonwealth should continue to gather information about the size of that Gap and the challenges facing each municipal, district, or authority in the Commonwealth. However, we can’t afford to wait for more precise information to act.
The Commonwealth needs to catch up with the rehabilitation of aging infrastructure, meet the challenges of environmental regulation, invest in a sustained asset management program, and integrate our infrastructure to be more energy efficient and more environmentally sustainable.
The challenge is to find a sustainable way of accomplishing these goals now and in the future. Today’s financial backdrop is grim, but this challenge is too important to postpone for better times.
The Commission proposes that the Commonwealth undertake a variety of approaches to move our water-related utilities to a more sustainable future.
Recommendations of the Commission The Commission believes that the Commonwealth has an obligation and an opportunity to reduce the likelihood of incon-venient or catastrophic water system failures that threaten public health and safety and our economic well-being.
We also can embrace tremendous opportunities for innovation that can stimulate research and development, provide good jobs, and lay the groundwork for a twenty-first century water infrastructure network that addresses structural deficiencies, is sustainable, cost-efficient and protective of our environment and future generations.
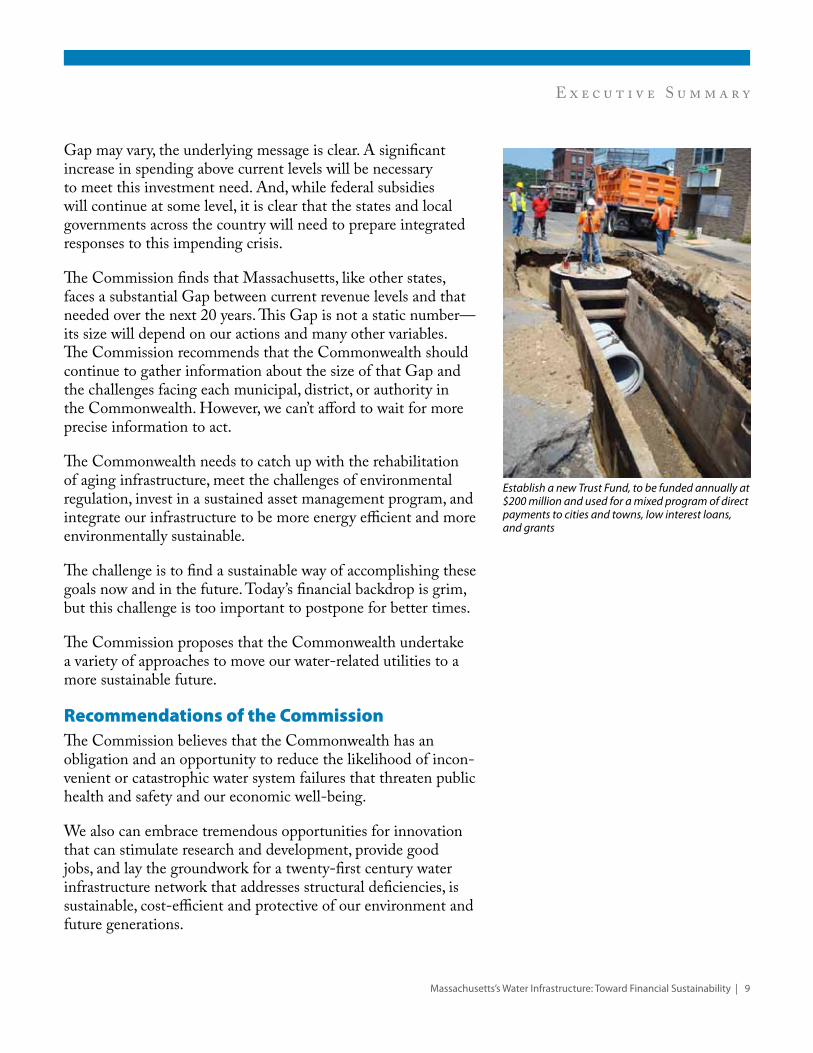
Establish a new Trust Fund, to be funded annually at $200 million and used for a mixed program of direct payments to cities and towns, low interest loans, and grants

10 | Massachusetts’s Water Infrastructure: Toward Financial Sustainability
E x e c u t i v e S u m m a r y
To do this will require a significant increase in spending above current levels.
As a Commonwealth, we can and must take strategic steps to reduce the size of the predicted Gap:
1. Increase and wisely use available funds for critical invest-ment
2. Embrace new ways of managing our infrastructure to find efficiencies and cost savings
3. Manage our water resources in more environmentally sound and sustainable ways
As we do this, the Commonwealth has an opportunity to con-tinue to bring the most modern, science-based understanding of water resources to future decisions and investments.
Specifically, the Commission recommends:1. Increasingfundsavailableforwater-relatedinfrastruc-
tureatalllevels – Sustain current programs and investments at the state
and federal level, including in particular state and federal contributions to the Water and Sewer State Revolving Funds
– Establish a new Trust Fund, to be funded annually at $200 million and used for a mixed program of direct payments to cities and towns, low interest loans, and grants
– Incent all communities, authorities and districts to utilize rate structures that reflect the full cost of water supply and wastewater treatment.
2. Reducingcostsandfindefficiencies – Provide strong incentives for municipalities, districts,
and authorities to use best management practices – Encourage enterprise funds for stormwater mitigation – Encourage appropriate regional solutions starting with
management and technical assistance and followed where appropriate with system integration
– Encourage sustainable infrastructure
Protect water sources through watershed protection programs

Massachusetts’s Water Infrastructure: Toward Financial Sustainability | 11
E x e c u t i v e S u m m a r y
– Use a watershed approach when making funding decisions
– Encourage efficient water and energy use – Encourage strategic public-private partnerships – Require adoption of best management practices in
applications for state revolving funds and other state grant loans
– Assist towns in the adoption of best management practices through changes in law, technical assistance and other incentives
3. Assistingmunicipalities,districts,andauthoritiesinretiringtheirexistingdebt
– Commit to newly structured debt assistance program funded at $50 – $60 million annually through the General Fund. While the Commission strongly recom-mends that communities approach future debt by using full-cost pricing, it recognizes that some communities will continue to need assistance in retiring their debt.
4. Addressingtheissueofaffordability – Identify creative ways to address affordability for
municipalities and individual ratepayers. Measure their local contribution and commitment using a ratio of average household annual utility cost to the commu-nity’s Median Household Income (MHI ratio).
– Consider making SRF loan decisions more need-based by considering the MHI ratio in the selection criteria for loans, grants, interest rates and principal forgiveness
– Seek new federal and state support to address afford-ability concerns
5. Promotingenvironmentalsustainability – Encourage investments and regulations that are aligned
with environmentally sustainable principles:1. Prioritize solutions that use technologies that are
environmentally and financially sustainable over the lifetime of the assets
2. Promote water conservation and water reuse
Reduce the release of nutrients in watersheds

12 | Massachusetts’s Water Infrastructure: Toward Financial Sustainability
E x e c u t i v e S u m m a r y
3. Reduce the release of nutrients in watersheds4. Encourage energy efficiency5. Prioritize solutions that keep water within its
basin while protecting water quality6. Protect water sources through watershed protec-
tion programs7. Encourage more effective management of water
resources through long-term planning, optimization of resources, and management efficiencies
8. Encourage integrated resource management, where “wastes” are viewed as resources from which revenues can be generated
– Increase regulatory flexibility to better direct funding to projects that deliver the highest public benefit
6. Promoteinnovation – Allocate resources for programs that mitigate the inher-
ent risks in innovation by supporting pilot projects, proof of concept projects and new technology
– Provide technical assistance to communities interested in innovative approaches
– Reduce regulatory barriers to innovation – Implement alternative analyses that put innova-
tive solutions on an equal footing with traditional approaches
2% LEVERAGED LOAN MODEL
New sustainable revenue stream
$200 million a year in dedicated revenue
Reserve Bonds
2% Loans
New Funding
Existing MWPAT structure
Reserve Bonds
Loans
Federal Cap Grants
State Match 20%
Contract Assist

Massachusetts’s Water Infrastructure: Toward Financial Sustainability | 13
E x e c u t i v e S u m m a r y
3 For an in-depth explanation of full-cost pricing, please see pare 59.
– Consider ways to facilitate regulatory compliance and reduce third-party litigation to address the economic risk of pilot innovative projects
– Invest in Massachusetts as a hub of innovation in the field of water, wastewater, and stormwater management and technology
– Harness the state’s educational strengths to train engineers, scientists, researchers, and workers to be at the forefront of innovative water management
7. ContinuetheworkoftheCommission – Fund an asset-based analysis of the Gap between
projected needs and revenues. This study will provide a baseline of information on costs and investments in Massachusetts.
– Invest in consumer education about the true costs and value of our water infrastructure
These strategies will help us close the GapIt is difficult to estimate precisely the size of the reduction of the Gap if these strategies are implemented. Many factors, including the levels of federal aid, economic conditions, bond market practices and more will influence the size of the Gap.
However, the Commission’s analysis suggests that:1. If municipalities, districts and authorities adopt full-cost
pricing combined with moderate, predictable rate increases and increase their water and sewer rates to 1.25 percent of their Median Household Income, and
2. If the state creates and consistently funds a new Trust Fund with $200 million to provide a mix of direct assistance, low interest loans and grants to assist towns with their water infrastructure needs, then
the state will be able to eliminate the Gap entirely over the next 20 years. Adopting efficiency and best management practice measures, as recommended above, will help individual communi-ties further reduce their own water infrastructure Gaps.
0
5
10
15
20
25
Total Gap at current rates Rates at
.75 of MHI Rates at 1.00 of MHI Rates at
1.25 of MHI
21.4
14.7
9.3
5.2
13.3
7.9
3.8
11.8
6.4
2.3
8.9
3.6
0
Tota
l Gap
Red
ucti
on in
Bill
ions
$0 M to SRF
$50 M to SRF
$100 M to SRF
$200 M to SRF
Annual contribution to State Revolving Fund
Gap reduction possible using rates increases and new revenues
Increases in rates to 1.25% of MHI with a $200 million annual
appropriation from the state eliminates the Gap entirely


Massachusetts’s Water Infrastructure: Toward Financial Sustainability | 15
IntroductionA well-maintained and resilient water infrastructure is integral to the Commonwealth’s health, economy, environment, and cultural vitality. For a number of years, environmental advocates, engineers, and water professionals have been concerned that the current rate of investment in these areas is inadequate to meet the identified needs, and that the “Gap” between current invest-ments and what is needed is growing and will lead to potentially costly and even catastrophic outcomes.
There is an increasingly urgent need to address the backlog of critical investments in our existing drinking water, wastewater, and stormwater systems, as well as to address new infrastructure investments to support economic development and growth and to meet new regulatory requirements aimed at protecting public health and water quality. Taken together, these investments will create a large and growing demand for revenues to be spent on water, wastewater, and stormwater infrastructure.
National trends are alarming. A 2011 report by the Urban Land Institute (ULI) lays out the stark challenges at all levels of government and outlines how changing times require that we revisit how to plan for, manage and pay for our critical water systems. The report concludes that infrastructure is aging, particularly in older cities. There is less federal funding. There are interagency conflicts. More responsibility for funding is falling to the states and municipalities, due in part to the partisan politics over taxes and the long term debt. The decline in federal funding is happening at a time when states are facing overall declining revenues, the end of stimulus money, and huge structural liabili-ties, particularly in health care.
The ULI report finds that states face difficult choices—often choosing to reduce infrastructure budgets rather than calling for tax increases or rate hikes. This all trickles down to the municipal level, where local officials struggle to keep systems going and may not have the political will to raise rates or fees.1
The US Environmental Protection Agency took on the task of estimating the Gap between needs and resources at the national level in 2002, at the thirty year anniversary of the landmark Clean Water Act of 1972. Using existing data and various projections as a starting point, that analysis found staggering capital needs across the country for clean water projects, drinking water investments, and operation and maintenance.2
“When the well is dry, we know the worth of water.”
– Benjamin Franklin
In 2002, the U.S. EPA released the Clean Water and Drinking Water Gap Analysis. This report estimated that if investment in water and wastewater infrastructure does not increase to address anticipated needs, the funding Gap over the next 20 years could grow to $122 billion for clean water capital costs and $102 billion for drinking water capital costs. There is also a funding Gap for operation and maintenance, which was found to be $148 billion for clean water and $161 billion for drinking water. This points to a total Gap of over $500 billion dollars.
Closing the Gap is possible if utilities undertake the work that needs to be done to address aging infrastructure and if the public understands and supports the investments needed to ensure access to safe and clean water.”
http://water.epa.gov/infrastructure/ sustain/infrastructureneeds.cfm

16 | Massachusetts’s Water Infrastructure: Toward Financial Sustainability
I n t r o d u c t i o n
Convinced of the serious implications of inadequate water infrastructure investment, Massachusetts is one of the first states to act on these concerns by establishing the Water Infrastructure Finance Commission. The objective of the Commission, estab-lished in 2009, is to quantify the funding needed to adequately manage our water service and to identify ways the Common-wealth can meet this Gap through sound planning and reforms.
The Commission’s goal is to lay out a vision for the future and identify recommendations that will ensure our infrastructure is protected.

Massachusetts’s Water Infrastructure: Toward Financial Sustainability | 17
Why the urgency around water infrastructure?
“All the water on earth has been here for 4.5 billion years.”charles Fishman—authOr OF the Big thirst
Water is perhaps our most precious commodity and assuredly our most recycled resource.
Despite the important role that water plays in our lives and our society, the infrastructure that is crucial to its delivery is often taken for granted. Our water infrastructure protects us from disease, provides fire protection, supports our economy, provides recreational opportunities, and meets our most basic daily needs. However, as long as clean water is available whenever the faucet is open, the public pays little attention to what it takes to maintain these important systems. Unlike roads and bridges, where potholes and corrosion are often visible, much of our water infrastructure is buried underground where deterioration is less apparent. In the public sphere, the most visible needs and loudest voices are often addressed first. As a result, our often-unseen water infrastructure has been neglected, and the growing maintenance needs ignored.
This is starting to change. Highly publicized interruptions to service in the Commonwealth and across the nation have caught the public’s notice. Strong voices of concerned advocates, includ-ing municipal officials, water professionals, and environmental advocates are being heard in Washington, D.C. and across the country. Recent reports from the federal government, public interest groups, think tanks, and researchers highlight significant concerns not only about our willingness to invest in a plentiful supply of clean and readily available water for growth, economic development, industry, and tourism but also our commitment to protecting the public health and safety.
In the aftermath of the mortgage crisis and subsequent economic collapse of 2008, the federal government, states and municipalities are faced with increasingly difficult choices about how to allocate scarce resources to core services that have traditionally been provided by the public sector—including public safety, education, social safety nets and infrastructure. As policy discussions evolve around public investments, it is critical that our water infrastructure remain on policymakers’ radar and in fact, occupy a high place on the priority list.
In creating the Massachusetts Water infrastructure Finance Commission, the Legislature recognized that assets in many water infrastructure systems are coming to the end of their useful
After more than 30 years of conspicuously underfunding infrastructure and faced with large budget deficits, increasing numbers of national and local leaders have come to recognize and discuss how to deal with evident problems. But a politically fractured government has mustered little appetite to confront the daunting challenges, which include finding an estimated $2 trillion just to rebuild deteriorating networks. Operating beyond their planned life cycles, these systems include roads, bridges, water lines, sewage treatment plants, and dams serving the nation’s primary economic centers.”
inFrastructure 2011: a strategic priOrity. urBan land institute and ernst and yOung 2011

18 | Massachusetts’s Water Infrastructure: Toward Financial Sustainability
Wh y t h e u r g e n c y a r o u n d w a t e r i n f r a s t r u c t u r e ?
lives, and that there is a lack of available funding to successfully maintain and replace these systems. The Commission was created to investigate the current state of water infrastructure investments in Massachusetts and respond thoughtfully, to educate the public about the extensive systems that allow us to provide safe drinking water, and to help raise the public consciousness and political will to ensure that adequate funding is provided for these essential systems.
Through this report, the Commission hopes to stimulate an overdue public conversation about the implications of failing to invest in our water systems and the urgent need to act to ensure their future. The Commission also hopes to support approaches and technologies that offer sustainable solutions for cities and towns. The report presents a roadmap for Massachusetts to manage and develop water infrastructure policy over the next twenty years.
The Commission believes that the Commonwealth has an opportunity to reduce the likelihood of inconvenient or catastrophic water system failures that threaten public health and safety and our economic well being. We also can embrace tremendous opportunities for innovation that can stimulate research and development, provide good jobs, and lay the groundwork for a twenty-first century water infrastructure network that is sustainable, cost-efficient and protective of our environment and future generations.

Massachusetts’s Water Infrastructure: Toward Financial Sustainability | 19
The Commonwealth relies on water for essential services, economic vitality, and quality of life
Public health The most basic and crucial function of our water infrastructure is to provide clean drinking water for public use and to safely dispose of wastewater. Our water systems prevent waterborne diseases such as giardia, cholera, botulism, and dysentery and are crucial for the safe functioning of hospitals and health care facilities. New concerns about the extent of pharmaceuticals, and personal careproducts in our drinking water supply are being discussed and may lead to new needs in water treatment and management to protect the public health. Because our water treatment systems have been so effective, threats from these and other diseases can seem remote, but absent sound maintenance and planning, they could have very real effects on our communi-ties.
Public safety and national securityIn a post-9/11 society, the need to anticipate and plan for resilience and redundancy in critical infrastructure, including water systems, is essential to our safety and security. Whether the threat is from a natural disaster such as an earthquake or hurricane, an unanticipated interruption in service due to a leak, contamination or asset failure, or from a terrorist attack, the state and its municipalities must plan for emergencies, employ back-up systems and consider redundancies which may not currently be in place.
A water system that provides reliable water at a high pressure and volume can also be the difference between a fire easily managed by firefighters and an urban inferno. Fire protection is supplied by many miles of water mains, which must be of sufficient size and condition to handle peak flows needed in fire incidents. In addition to water mains, water storage tanks need to be of sufficient size and condition to provide needed reserves, and in growing areas, water supplies need to be upgraded to provide the needed capacity to fight fires.
The future of water infrastructure planning and engineering must include additional attention to and preparation for possible human threats and natural disasters. Anyone impacted by an interruption in water or sewer service is quickly reminded of the
HOW SAFE IS MY DRINKING WATER?Every day, more than six million Bay Staters turn on the tap and take a drink of water from a public water supply. The public water supplies in Massachusetts are among the best in the country, and they are subject to the most stringent government standards in the world. To protect your health, both the U.S. Environmental Protection Agency (EPA) and the Massachusetts Department of Environmental Protection (MassDEP) maintain exacting standards. MassDEP requires your local water supplier to perform ongoing tests for the presence of bacteria, lead and other heavy metals, herbicides and pesticides, and industrial solvents. If testing reveals an exceedance of a federal standard, the water supplier is required to notify customers through local news media. If bacteria or chemicals are found in levels that pose a threat to your health, the water supply is treated to remove the contaminants or taken out of service if the problem can›t be solved immediately.”
dep drinking Water prOgram WeBsite http://www.mass.gov/dep/
water/drinking/drink.htm

20 | Massachusetts’s Water Infrastructure: Toward Financial Sustainability
E s s e n t i a l s e r v i c e s , e c o n o m i c v i t a l i t y , a n d q u a l i t y o f l i f e
inconveniences and urgencies of service interruptions. Redun-dancies and emergency planning can make a huge difference in getting services back on line.
The environment and tourismHealthy rivers, streams, lakes, ponds, wetlands, and coastal resources are the cornerstone of a healthy environment for the Commonwealth. The flora and fauna that thrive in our waters and wetlands are important to the food chain across the Com-monwealth, New England, and North America. Our wetlands support natural processes that cleanse our waters, and support fisheries, bird migration, and wildlife. Our ground waters are used for water supplies and maintain water levels in our lakes, rivers, and streams. Our lakes, rivers, wetlands and coastal waters support boaters, canoeists, kayakers, swimmers, fishermen, and birdwatchers. In Massachusetts, our tourism industry is strongly connected to the quality of our waters.
There is a deep connection between the way water is used, treated, and discharged on the one hand, and the health of our natural water systems on the other. There is a continuing need to integrate science-based, sustainable principles into our water management to protect our water resources while using water wisely to support our economy and our residents.
The Commonwealth faces a number of significant water resource management challenges in water quantity, quality, and manage-ment. Many of these challenges stem from disruptions to the natural hydrologic cycle through human intervention and affect both water quantity and water quality.
Some areas of the state are experiencing noticeable periodic, seasonal, or sustained degradations of the natural water systems including drought, low flow, frequent flooding, loss of wetlands, loss of habitat, or eutrophication.3 We know that a number of our river basins qualify as “stressed” and are experiencing dramatic seasonal decreases in flow, with resulting impacts on river habitats and the use of water. There are many causes of this phenomenon, and state environmental agencies are currently developing a framework, which will include regulations, to address this issue. Strategies for resolving the issue of stressed river basins are largely focused on limiting water withdrawals and requiring mitigation and offsets, such as recharging
The flora and fauna that thrive in our waters and wetlands are important to the food chain across the Commonwealth, New England, and North America

Massachusetts’s Water Infrastructure: Toward Financial Sustainability | 21
E s s e n t i a l s e r v i c e s , e c o n o m i c v i t a l i t y , a n d
q u a l i t y o f l i f estormwater so that it replicates natural water cycles, for increased withdrawals.4
There are special concerns for the City of Boston. Steadily decreasing groundwater levels in the city have exposed to the air some of the older wooden pilings which support many of our historic buildings. This exposure causes decay and loss of struc-tural integrity. Investment in better water management practices, including improved stormwater mitigation that recharges the local groundwater supply rather than sending it directly to nearby waterways, is an important part of the solution.
Economic development and jobsThe quality of our water systems has a direct impact on the economy and jobs in the Commonwealth. In addition to our tourism industry, water is critical to many other sectors. Many of our manufacturing industries, including our important life sciences industry, are reliant on the use of high quality water. Our historic fishing and agricultural industries depend on our ability to protect and manage water sustainably. Water has been identified as the “single most important resource in growing cranberries,”5 an historic Massachusetts crop, and is also essential for farmers raising fruits, vegetables, and animals.
Each of these sectors generates wastewater, and each poses particular challenges in the treatment and management of waste. Massachusetts continues to innovate in the field of waste man-agement, notably through the Commonwealth’s groundbreaking Toxic Use Reduction Act, and in the private sector. Most of these industries face regulations affecting their use of water. For example, any user (including manufacturers and farmers) that pumps over 100,000 gallons per day for three consecutive months of the year must have a permit under the state’s Water Management Act. These industries must also comply with rules and regulations regarding use of toxic materials and are encour-aged to conserve water and energy.
The availability of adequate and affordable water and sewer infrastructure is one of the primary requirements of firms looking to locate and expand in Massachusetts. For communi-ties that are competing with water-challenged states in the Southeast and West for businesses that rely on plentiful water, investments in water can pay handsome dividends. On the other
Water has been identified as the “single most important resource in growing cranberries,” an historic Massachusetts crop

22 | Massachusetts’s Water Infrastructure: Toward Financial Sustainability
E s s e n t i a l s e r v i c e s , e c o n o m i c v i t a l i t y , a n d q u a l i t y o f l i f e
hand, communities that fail to invest, or that lack sufficient water infrastructure investment, may fail to attract businesses that want to locate there.
Massachusetts has the chance to lead the nation with a focused vision for water management and to take advantage of opportunities to create new jobs and generate economic activity. Massachusetts’s plentiful average of over 40-inches of precipita-tion per year should be viewed as a competitive advantage, and investment in water infrastructure is an investment in our future competitiveness.
From a jobs perspective, it’s estimated that 57,400 jobs are created for every $1 billion spent on the drinking water infra-structure6, including jobs related directly and indirectly to water infrastructure engineering and construction.
Massachusetts, by setting a vision for water and harnessing its strengths in innovation and intellectual talent, also has an opportunity to become an innovation leader. As other parts of the country and the world face increasing water challenges from growth and possible impacts from increasing global tempera-tures, a new generation of water technologies will contribute to the global market.
Our historic fishing and agricultural industries depend on our ability to protect and manage water sustainably

Massachusetts’s Water Infrastructure: Toward Financial Sustainability | 23
35%
50%
7%
2% 6%
MWRA
Municipal water supply
Water district supply
Non-municipal communitywater supply
Served by private wells
Drinking water supplies by populationBecause a safe, clean water supply is critical for societies, communities for centuries have invested in systems to supply drinking water and dispose of wastewater. In earlier times, these systems simply transported clean water to residents and trans-ported wastewater away. But over the last century, advances in the scientific understanding of how diseases are transmitted and how our environment is impacted by waste products have led to increasingly sophisticated treatment choices and requirements.
The following provides a brief description of the various water supply systems and entities that are currently responsible for providing water, wastewater, and stormwater services in the Commonwealth.
Drinking water systemsThe DEP Drinking Water Program7 provided data on how Massachusetts residents get their water. According to their estimates, most residents get their water from public water supplies. Approximately 35% of residents are served by member communities in the Mass Water Resources Authority (MWRA) system and another 7% are served by water districts. Approxi-mately 50% of residents get their water from publicly operated municipal water systems.
Approximately 2% are customers served by privately owned public water systems in all or part of 31 communities, while approximately 6% residents are served by private wells.8
There are 43 communities9 with no community public water supply, many of which are smaller communities in the western part of the state, Cape Cod and the Islands, and others scattered across the state. Residents in these communities have private wells or other private supplies.
According to the Tighe and Bond 2010 water rate survey10, about 57% of the community water supplies use groundwater as their primary water source, with the remaining 43% relying on surface water sources, including the Quabbin Reservoir in western Massachusetts which provides drinking water to MWRA customers.
We have already made major investments in water infrastructure

24 | Massachusetts’s Water Infrastructure: Toward Financial Sustainability
We h a v e a l r e a d y m a d e m a j o r i n v e s t m e n t s i n w a t e r i n f r a s t r u c t u r e
The history of our drinking water systems dates back to the 1800’s, when towns and cities in Massachusetts began construct-ing water systems to supply residents with clean water for consumption and fire suppression. The City of Boston developed distribution reservoirs around the city, fed by nearby rivers and lakes, and in the 1890s flooded portions of the Nashua River Valley at the Wachusett Dam. At the time the Wachusett Dam was built, its reservoir serviced 29 municipalities within 10 miles of the State House and was the largest public water supply reservoir in the world. The Quabbin Tunnels and Reservoir were constructed between 1926 and 1946. According the MWRA, at the time of its completion, the Quabbin was the largest man-made reservoir in the world devoted solely to water supply. High pressure aqueducts were completed to carry water and were paid for with water rates.
While water supply began early, treatment to ensure water quality11 was rare in the United States until well into the 20th century. Poughkeepsie, NY used sand filtration in the 1870’s, and in 1908, Jersey City, NJ began to chlorinate its water. Both of these steps had huge implications for the reduction of water-borne disease outbreaks. Eventually, the federal government began to regulate the quality of drinking water. The 1974 Safe Drinking Water Act established a system of nationwide stan-dards for drinking water, and today EPA regulates more than 80 drinking water contaminants. As a result, the vast majority of the nation’s population drinks treated water, and systems have only rare violations of drinking water standards.
Massachusetts Water Resources AuthorityThe Massachusetts Water Resources Authority (MWRA), a quasi-public agency, was established by an act of the legislature in 1984 as an independent authority to assume the management and upkeep of many of the Commonwealth’s public water facilities formerly managed by the state Metropolitan District Commission (MDC, now a part of DCR), including those that supply the City of Boston. The Authority provides wholesale water and sewer services to its member communities and funds its operations primarily through user assessments and charges. The systems currently operated by MWRA include 61 communities, in whole or in part, located primarily in eastern and central Massachusetts.13 Fifty-one cities, towns and special purpose entities currently are supplied with drinking water by
The City of Boston developed distribution reservoirs around the city, fed by nearby rivers and lakes, and in the 1890s flooded portions of the Nashua River Valley at the Wachusett Dam

Massachusetts’s Water Infrastructure: Toward Financial Sustainability | 25
We h a v e a l r e a d y m a d e m a j o r i n v e s t m e n t s i n
w a t e r i n f r a s t r u c t u r ethe MWRA and forty-three cities, towns and special purpose entities connect their local sewer systems to the MWRA regional sewage collection and treatment facilities. Approxi-mately 2.55 million people in 890,000 households are served by MWRA systems.14
The MWRA provides wholesale water and sewer services to its communities, each of whom has its own distribution network that must be maintained. In addition to its operating responsibilities, the Authority is responsible for rehabilitating, repairing and maintaining its systems and for operating them in compliance with evolving environmental laws including require-ments of the federal Safe Drinking Water Act and the federal Clean Water Act. Since assuming ownership and operations of the systems in 1985, the Authority has undertaken a program of capital improvements through the implementation of rolling five-year capital improvement programs, including the Boston Harbor Cleanup Project which dramatically improved the water quality in Boston Harbor and revived the recreational use and economic vitality of the harbor and surrounding properties.
Clean water systemsThe term “clean water” infrastructure is used to describe the network of collection, treatment, and disposal facilities that collect and manage sewage (wastewater) and stormwater. These facilities include pipes, sewage treatment plants and disposal/outfall facilities and their necessary supporting infrastructure.
The Commonwealth has many large metropolitan water and sewer districts, but it also has tiny, rural sewer districts serving a relatively small population. In some areas of the state, wastewater districts have been established by an act of the Legislature and operate independently of city and town governments, setting their own rates, and managing their own finances, including the ability to utilize debt.15
Some utilities are run with the most up-to-date technology and the most current “best practices” that emphasize fiscal responsibility, sustainability, and water conservation. Others are underfunded, undercapitalized, and struggling.
Paralleling the history of Massachusetts’s drinking water systems, the development of early sewer systems also followed
The MWRA provides wholesale water and sewer services to its communities, each of whom has its own distribution network that must be maintained

26 | Massachusetts’s Water Infrastructure: Toward Financial Sustainability
We h a v e a l r e a d y m a d e m a j o r i n v e s t m e n t s i n w a t e r i n f r a s t r u c t u r e
the growth of towns and cities. Some of the state’s centralized wastewater systems date back to the end of the nineteenth century, when industrialists harnessed rivers for manufacturing, built cities around factories and mills, and used the rivers of the Commonwealth for disposal of industrial and human waste. The first sewers and collection systems were built in the late 1800s, but these were largely collection and transport mechanisms, which collected waste and sent it into harbors or down rivers and streams. Treatment plants that attempted to clean water before disposal were an innovation of the twentieth century. In Boston, the first treatment plant for primary wastewater treatment was built at Nut Island in the 1950s.
Following the passage of the Clean Water Act in 1972, the federal and state governments passed a series of laws requir-ing primary and secondary treatment for all municipal sewer systems. In the decades that followed, extraordinary investments were made by the federal, state, and municipal governments, bringing many of our rivers back to fishable and swimmable quality, cleaning our harbors, and restoring wetlands and coast-lines.
Approximately 56% of the 351 cities and towns in the Com-monwealth have some level of public sewerage service. Accord-ing to the EPA, by 2008 seventy percent (70%) of Massachusetts residents received centralized wastewater treatment services at the secondary, advanced, or no discharge treatment level. This is largely as a result of the extraordinary investments in wastewater treatment plants by the federal, state, and municipal govern-ments in the decades since Congress passed the Clean Water Act in 1972. At that time, only 12% of residents in the state had such treatment services. Facilities known as “small community wastewater facilities” serve nine percent (9%) of the population.
Residents not served by centralized treatment rely on septic systems or cesspools, which dispose of wastewater on site, and require regular pumping to remove residual solids.
StormwaterAs a Commonwealth and a nation we are just beginning to appreciate the magnitude of the challenge of increased manage-ment of stormwater. The impacts of stormwater include changes in the hydrology and water quality of a watershed, leading to a
Approximately 56% of the 351 cities and towns in the Commonwealth have some level of public sewerage service

Massachusetts’s Water Infrastructure: Toward Financial Sustainability | 27
We h a v e a l r e a d y m a d e m a j o r i n v e s t m e n t s i n
w a t e r i n f r a s t r u c t u r eseries of interrelated problems, including increases in flooding, habitat modification and loss, nutrient pollution, increased sedimentation, erosion, public health issues, decreases in habitat diversity, and aesthetic degradation.
Waterways near urban and suburban areas are most impacted by stormwater runoff. The degree and type of impact varies depend-ing on location, but the contribution is often significant when compared to other sources of environmental degradation. The National Water Quality Inventory of 1996 Report to Congress (US EPA 1998) found urban runoff to be the leading source of pollutants causing water quality impairments in ocean shoreline waters and the second leading cause of pollutants in estuaries across the country. Urban stormwater runoff was also found to be a significant source of impairment in rivers, lakes, and wetlands.19
Common pollutants include chemicals and nutrients, oil and grease from roadways, pesticides from lawns, sediment from construction sites, and trash such as cigarette butts, paper wrappers, and discarded bottles. In addition to adding these pollutants to our water supply, stormwater runoff can also cause detrimental alterations in the hydrologic characteristics of the water body. Precipitation that would naturally recharge into the groundwater is instead directed more quickly through drains and catchbasins into receiving waters. Streams capturing stormwater runoff characteristically have higher peak flow rates, issues related to erosion and scouring, increased flooding, and reduced baseflow levels.20
Once pollutants make their way into a water body, and particularly after such pollutants have negatively impacted the water and habitats, it is very difficult and expensive to restore that water body. It is much more cost effective to prevent than to treat. As a result, the US EPA has passed a series of rules and regulations aimed at preventing or reducing stormwater pollu-tion and related streamflow problems.21
The attempt to manage stormwater is not new. In the 1800s Massachusetts’s industrial cities built collection systems that were designed to collect both sewage and stormwater in the same pipe. Massachusetts has 23 communities permitted with combined sewer overflows, or CSOs. These communities include Boston, New Bedford, Worcester, and Springfield.22
Common pollutants include chemicals and nutrients, oil and grease from roadways, pesticides from lawns, sediment from construction sites, and trash such as cigarette butts, paper wrappers, and discarded bottles

28 | Massachusetts’s Water Infrastructure: Toward Financial Sustainability
We h a v e a l r e a d y m a d e m a j o r i n v e s t m e n t s i n w a t e r i n f r a s t r u c t u r e
There are many techniques for managing the flow of and reduc-ing contaminants in stormwater, including low impact designs. Some of the techniques most widely used include: drains, cis-terns, spillways, swales, catch basins, detention structures, reten-tion structures, sediment chambers, stormwater basins, vegetative buffers, ground covers, roof treatments, low impact development techniques, and piping. Some of this infrastructure is installed and maintained by the municipality—such investments as drains and catch basins along roads and highways collect water that sheets off the pavement.
Other requirements for stormwater mitigation are built into some building and zoning codes and are built and maintained by private owners.
Currently, only a handful of communities in Massachusetts have created stormwater utilities to raise revenues and spend money to address the growing need for stormwater mitigation. More communities are likely to create these utilities in the years to come in response to recent initiatives of the federal government.

Massachusetts’s Water Infrastructure: Toward Financial Sustainability | 29
There is a substantial and growing “Gap” between the need for water infrastructure investment and available revenue
A primary charge of the Water Infrastructure Finance Com-mission was to “examine the water infrastructure needs of the Commonwealth for the next 25 years as they relate to the funding Gap between the water infrastructure needs of the Commonwealth and the existing, available sources of funding.”
A similar analysis of national water infrastructure was conducted by the federal Environmental Protection Agency in 2002 and found the Gap between what’s needed to maintain our national water infrastructure and the revenue streams to meet the need is estimated at $224 billion for capital costs and $309 billion for the cost of operation and maintenance over the next 20 years.
For Massachusetts, the Commission finds that there is a sig-nificant Gap between current revenues and water infrastructure needs over the next 20 years. Using the best available data, the Commission estimates that the Commonwealth conservatively faces a $10.2 billion Gap in resources for drinking water and an $11.2 billion Gap in resources for clean water projects.
Gap estimates include the cost of capital investment, repair and replacement, operations and maintenance and debt service. Estimates do not include the cost of evolving regulatory require-ments or investments to accommodate economic growth. As such, these estimates are more likely to understate than overstate the Gap and the funding need.
As will be discussed below, the Commission further estimated that costs to address stormwater concerns and comply with proposed federal stormwater regulations could reach an addi-tional $18 billion.
Gap AnalysisThe model used to calculate the Massachusetts Gap is based on the methodology used for a similar, state-specific Gap analysis completed by Pennsylvania in their November 2008 report: “Creating a Sustainable Solution for Pennsylvania: Report of the Governor’s Sustainable Infrastructure Task Force.” 25
0
5
10
15
20
25
Drinking Water $10.2
billion
Clean Water $11.2 billion
Total $21.4 billion
Estimated Gap in water and clean water investments over the next 20 years (in billions of dollars)

30 | Massachusetts’s Water Infrastructure: Toward Financial Sustainability
Commission members reviewed the Pennsylvania approach and consulted with individuals involved in that study. Given the Commission’s budget constraints, the Massachusetts study does not include the extensive collection of data from individual system surveys and interviews as the Pennsylvania study did. However, the Commission designed an abridged methodology, using as its primary data published rate information and the most recent EPA Needs Assessments for Drinking Water and Clean Water and the information contained in the 2010 Tighe and Bond Rate Study. While these data sources have their shortcomings, the Commission believes that this methodology provides a reasonable order of magnitude for the estimate of the Massachusetts Gap, and a sound basis for policy discussion.
The Commission continues to recommend, as it did in its June 2011 initial report, that funding should be dedicated to perform a more detailed, asset-based analysis that includes more exten-sive surveying of water infrastructure systems state-wide.
Of note, the Commission performed its Gap analysis on a 20-year, rather than a 25-year basis as specified in the enabling legislation. Use of a 20-year timeframe enabled the use of federal Drinking Water26 and Clean Water Needs Survey27 data which will increase the reliability of estimates, while still looking far enough into the future to provide a basis for long-term planning that satisfies the intent of the legislative mandate.
Estimating the GapConceptually, the Gap is the aggregated, 20 year shortfall between the current revenues available for all Massachusetts water and wastewater utilities versus the anticipated need for capital investment, operations and maintenance costs, repair and replacement, and debt service for those same water and wastewater utilities.
The Gap was calculated using the following formula: Gap = Revenue – [Capital Investment + O & M + Repair & Replacement + Debt Service]
In the simplified infrastructure Gap model used by the Commission: Gap = 20-year Est. Rate Revenue – [EPA Needs Survey capital estimates + estimated increase in both O & M and Debt Service]
Th e r e i s a s u b s t a n t i a l a n d g r o w i n g “ G a p ”
Funding should be dedicated to perform a more detailed, asset-based analysis that includes more extensive surveying of water infrastructure systems statewide

Massachusetts’s Water Infrastructure: Toward Financial Sustainability | 31
Where the following are assumed: • Current annual rate revenue calculated on a community
basis using the 2010 Tighe & Bond Rate Studies modified by assumed annual consumption of 70,000 gal.
• Current annual rate revenue is equal to current O&M costs and current debt service
• Current debt service is reduced as loans are repaid and the freed-up funds are directed to repairs that are not included in the Needs Survey capital figures
• O & M plus debt service will increase at three percent (3%) per year to maintain and repair aging infrastructure
2 0 -Ye a r e s t. R ate reve n u e
- E PA n e e d s s u r vey e s t i m ate o f 2 0 - ye a r c a p i t a l n e e d s
2 0 -Ye a r i n c re a s e i n O & M a n d d e b t s e r v i ce
= 2 0 -ye a r G a p
D r i n ki n g wate r
$ 1 1 . 4 - $ 6 . 8 + $ 1 4 . 8 = $ 1 0 . 2
C l e a n wate r
$ 1 0 . 4 - $ 7 . 9 5 + $ 1 3 . 5 = $ 1 1 . 2
Results of Massachusetts Gap analysis (in $ billions)
Note: Numbers in chart do not total accurately due to rounding.
For comparison purposes, the chart below shows that the results of the Massachusetts analysis are consistent with the detailed Pennsylvania Gap relative to total population. Pennsylvania has roughly twice the population of Massachusetts, and roughly twice the estimated Gap.
Pe n n s y l va n i a M a s s a c h u s e t t s MA a s a % o f PA Po p u l at i o n 1 2 , 7 3 4 , 9 0 5 6 , 5 5 9 , 6 4 4 5 1 . 5 %G a p $ 4 3 . 8 B $ 2 1 . 4 B 4 9 . 1 %
A priority of the Commission was to be conservative in its estimates. Given the following factors which were not explicitly included in the estimates, it is unlikely that the figures overesti-mate the total Gap:
• Costs of compliance with new and evolving regulatory requirements
• Investments for economic growth• Estimated $3b in wastewater improvements needed to
Th e r e i s a s u b s t a n t i a l a n d g r o w i n g “ G a p ”
Conceptually, the Gap is the aggregated 20 year shortfall
between current revenues and anticipated costs

32 | Massachusetts’s Water Infrastructure: Toward Financial Sustainability
comply with regulatory and environmental concerns on Cape Cod28
• Substantial debt load carried by the MWRA for past work on the Boston Harbor cleanup and other projects, including those mandated by the courts
It is also important to recognize that these estimated funding Gaps ought not to be considered “an inevitability.”29 Rather, they are a potential outcome if we don’t make the investments we need to make. Moreover, there are many variables that can potentially increase or decrease the estimate.
The Gap estimate could also be affected by the following factors:
Factors that could decrease estimate30
Factors that could increase estimate
• Decreasing labor costs due to integration of services
• Regionalization of services
• Asset Management strategies
• Technology innovations
• Energy efficiency
• Increasing costs of chemicals and power
• Increasing regulatory requirements
• Population growth
• Economic expansion
• Increased borrowing costs
Th e r e i s a s u b s t a n t i a l a n d g r o w i n g “ G a p ”

Massachusetts’s Water Infrastructure: Toward Financial Sustainability | 33
The need for stormwater investments over the next 20 years is expected to increase dramatically. Estimates of the expected costs to communities are varied, limited, and sometimes conflicting, but the Commission’s analysis suggests that perhaps $18 billion in stormwater investment (in addition to the $21.4 billion for water and clean water) may be required depending on federal regulatory requirements.
Stormwater Gap AnalysisGiven growing concerns with the effects of stormwater, it is widely expected that stormwater investment in the coming years will need to grow exponentially. This is based on flooding con-cerns and an increasing understanding of the impact of storm-water contaminants, including fertilizers and roadway runoff, on drinking water supply resources and habitats. Estimating the cost of these improvements poses a significant challenge given limited historic data and the uncertainty of federal requirements.
The Commission felt it important to calculate a stormwater Gap estimate given the magnitude of expected need for these systems. The model used, however, is based on preliminary information and will need to be monitored as stormwater policy is refined. Initial estimates made by the Commission were derived using the following formula:
Stormwater Gap = (Acres of impervious surface) x (cost of stormwater management per acre)
Impervious acreage was derived from EPA documents31 for Massachusetts communities which are required to implement a stormwater management program under current EPA National Pollutant Discharge Elimination System (NPDES) regulation. This acreage (354, 701 acres) was multiplied by a$50,000 per acre estimate for design and construction of stormwater manage-ment systems. The resulting figure is a possible $18 billion in long-term stormwater capital investment need, which would not include associated operation and maintenance costs.
There was significant discussion about whether $50,000 was an accurate per acre cost, given the recognition that actual costs will vary greatly depending on proximity to local waters, design
The Gap could be substantially higher if stormwater investments are included
The Gap could nearly double if stormwater mitigation estimates are included (in billions of dollars)
10.2 11.2 18
21.4
18
0
5
10
15
20
25
30
35
40
45
Drinking Water
Clean Water
Stormwater Total

34 | Massachusetts’s Water Infrastructure: Toward Financial Sustainability
strategies, level of urbanization in the surrounding area, and soil conditions. Recent EPA estimates completed for a pilot program in the towns of Milford, Franklin and Bellingham, found per acre costs to be as high as $150,000, suggesting that $50,000 may be a low estimate. On the other hand, studies including the recently released Massachusetts Climate Change Adaptation Report indicate that more cost-effective alternatives may be found in what has been termed “soft engineering” or bio-mimicry.32
Th e g a p c o u l d b e s u b s t a n t i a l l y h i g h e r i f s t o r m w a t e r i n v e s t m e n t s a r e i n c l u d e d

Massachusetts’s Water Infrastructure: Toward Financial Sustainability | 35
Why do we have this growing Gap? The Gap results from simultaneously increasing costs (needs) and decreasing revenues. Many surveys and studies over the last decade have identified a number of major factors driving costs of water infrastructure nationwide, including aging infrastructure, the cost of environmental regulation, the cost of municipal debt, and the need to invest in security and redundancy in our infra-structure.33 At the same time, revenues are increasingly scarce at the federal, state, and local level.
The Commission found that these factors and others are at play in the Commonwealth of Massachusetts. At our four public hearings and in written testimony, all of the following issues were raised.
MAJOR FACTORS ARE DRIVING UP COSTS
Aging systems need investmentsThe Commission finds that many communities in the Com-monwealth are facing serious challenges posed by the cost of needed upkeep, upgrades, and improvements to aging water and sewer systems.
Many communities came to testify at four public hearings held by the Commission across the state, and their message was clear and consistent: water and sewer systems are aging, and many towns are overwhelmed by the need for replacement and upkeep of aging assets.
Some water and sewer systems in Massachusetts’s older cities were constructed as early as the 1800s. Major federal invest-ments in water and wastewater in the 1970s and 1980s brought new plants and new technologies to many towns, but many of these assets are nearing the end of their intended service life.
What the Commission heard was consistent with national studies conducted by the Environmental Protection Agency (EPA) on aging systems.34 Most municipalities nationwide are facing needed investment in their basic assets, such as power equipment, pipe, manholes, pumps, water and wastewater treat-ment plants, outfalls, filter beds, and the many other components of their water and sewer systems.
Water and sewer systems are aging, and many towns are overwhelmed by the need for replacement and upkeep of aging assets
It is the pipes installed between 1920 and 1959 that give us the most trouble. How long will the older pipes provide reliable service? How long can we continue to band-aid the pipes that are already failing? How will we pay to replace them in an age of skyrocketing project costs?”
craig W. jalBert mOnsOn Water and seWer department; testimOny nOvemBer 15, 2010

36 | Massachusetts’s Water Infrastructure: Toward Financial Sustainability
Wh y d o w e h a v e t h i s g r o w i n g G a p ?
We, like many other systems, have a long list of necessary critical infrastructure improvements including the rehabilitation of water mains, valves, hydrants, and services. Prioritizing the existing infrastructure needs over a ten year period would cost in excess of $6 to $7 million, not including interest. At a time when we should be performing infrastructure improvements to protect the public’s assets, limited funds and resources are being wasted on repairs and other emergency situations.”
Barry W. WOOds superintendent Buzzards Bay Water district; testimOny
nOvemBer 10, 2010
When older infrastructure goes without necessary maintenance, failures become more likely. Infrastructure failures can be small annoyances that affect a few homes—or they can be extremely disruptive due to the size of the failure, the length of time to repair, or the strategic location of the problem.
In Massachusetts, an estimated 21,00035 miles of pipes, made of such diverse materials as wood, brick, cast iron, steel, lead, clay, concrete, asbestos cement, and PVC, need repair or replacement. Older water pipes become blocked and corroded from the inside, impeding the flow of water. Other pipes leak, allowing precious treated water to be wasted, sewage to leak into ground water, or valuable ground water to be carried away in leaky sewers. These issues can lead to degraded water quality, reduced pressure that can compromise fire protection, and in the worst case, catastrophic failure that can affect a few homes, a neighborhood, an entire city, or a region. Given the cost to repair a failed water system, and the costs of associated economic and household disruption, the institution of a planned investment and mainte-nance program is not only good planning, but makes the most fiscal sense.
A delay in investment is not a savings: eventually the investment must be made either in postponed maintenance, or in an often more costly response to failure.
Replacement
Repairs
12
10
8
6
4
2
2000
$ Milli
ons
2010 2020 2030 2040 20500
Projected total expenditures for Boston due to wear-out
This chart displays estimated annual replacement costs based on 2000 data (in millions of dollars—Year 2000 dollars) for pipes needing to be replaced in Boston between the year 2000 and 2028. This chart was prepared by the American Water Works Association, and is based on the estimated age of the pipes and their useful life expectancy.36

Massachusetts’s Water Infrastructure: Toward Financial Sustainability | 37
Wh y d o w e h a v e t h i s g r o w i n g G a p ?
Environmental and public health concerns need to be addressed, with high and sometimes unpredictable costs
Another major concern is that many systems are in need of improvements and upgrades in their level of treatment in order to meet stronger environmental or public health standards. The Commission heard that many municipal systems are facing repetitive, increasingly expensive, and unfunded court orders and regulatory requirements to address various environmental or public health requirements. These costs are a major driver of the need for water infrastructure investments. These mandates also divert funds from planned repairs to new investment as required by the mandates.
There are many regulations that impact municipalities, but a few stand out as posing significant challenges. Chief among these regulations and orders are:
• Limits to water withdrawals, including water conservation restrictions, which reduce income to utilities
• Increasingly stringent nutrient reductions in treated wastewater, which demand increasingly sophisticated and expensive treatment options
• Increasingly stringent water quality regulations, which demand sophisticated and expensive treatment options
• Pending federal requirements for mitigation of stormwater impacts
• Regulations minimizing “unaccounted for” water leaking from pipes
• Updates to drinking water standards
Regulatory compliance is very expensive for communities. Communities complain that the goals of regulation, although important, are continually changing, difficult to predict, and not always well coordinated among agencies. And, while many communities agree with the goals of regulation, communities are not convinced that limited dollars are being most effectively spent to achieve the most public benefit. Finally, municipalities and districts are angry that the brunt of the cost is being borne at the local level by taxpayers or ratepayers, when the benefits have state and national significance.
GRAFTON WATER DISTRICT The Grafton Water District is located in Central Massachusetts and serves a population of just over 10,000 residents. The system has four gravel-packed wells and one treatment plant. In 2010 the water rates were $4.57 per thousand gallons with a $12.50 minimum charge. The average bill was approximately $126.75 per quarter. The district has over 25 miles of water main that is over 80 years old. Using the existing rates, the District could replace approximately one mile of pipe per year over the next 25 years, but would have no other revenue for any other capital expenditure. It is estimated that rates would need to be raised by approximately 59% to meet the depreciation of the system.
Based On testimOny OF mattheW pearsOn, manager graFtOn Water district OctOBer 20, 2010
38 | Massachusetts’s Water Infrastructure: Toward Financial Sustainability
Wh y d o w e h a v e t h i s g r o w i n g G a p ?
Many municipalities are frustrated by the length of the permit approval process, and the overlapping layers of bureaucracy within that process. In order to implement water infrastructure projects in the Commonwealth, a number of local, state, and federal permits may be required, depending on the complexity of the project.
Paperwork and long delays have a significant cost to municipalities. Unfortunately, because of staff reductions at the Department of Environmental Protection (DEP), communities may face longer, rather than shorter, waits for permit reviews. These delays slow the overall response to the Commonwealth’s infrastructure backlog.
In the face of shrinking municipal budgets, difficulty in raising rates, and declining state and federal funding, many towns shared a disturbing refrain: that funds that need to be directed toward maintaining systems are instead being directed toward regulatory compliance for which many did not see commensu-rate environmental or public benefits.
The Commission believes that there is room for improvement in tying regulation to science-based data, in aligning and coordinat-ing regulatory requirements, and in assuring compliance between federal, state and local governments, among state agencies, and across the “silos” of water regulatory authority including drinking water wastewater and stormwater.
Against the background of these general comments, the Com-mission particularly highlights three major issues:
Lack of state primacy over federal clean water permits may be hampering best outcomesThe National Pollution Discharge Elimination System (NPDES) program regulates discharges of pollutants to waters of the United States through the issuance of discharge permits under the Federal Clean Water Act. Since enactment in 1972, the NPDES permit program has led to significant improve-ments in the quality of the nation’s water.
Surprisingly, Massachusetts is one of only four states in the nation that has not adopted responsibility (“primacy”) for the state level regulation of the NPDES program from the federal
Funds that need to be directed toward maintaining systems are instead being directed toward regulatory compliance

Massachusetts’s Water Infrastructure: Toward Financial Sustainability | 39
Wh y d o w e h a v e t h i s g r o w i n g G a p ?
government. This means that there is “dual-agency” responsibility for these important clean water permits, rather than responsibil-ity resting with a single, state agency. (Massachusetts does accept primacy for the federal Drinking Water program).
The Commission heard a number of concerns about the impact of the primacy issue, voiced through the public hearings and written testimony. Some were concerned that lack of state primacy may encourage the EPA to institute more stringent regulatory requirements. For example, the NPDES aluminum requirements are only required of states in the New England EPA region (Region 1) where the EPA has federal authority in Massachusetts and New Hampshire.37
Others were concerned about the effect the federal government’s authority over wastewater and stormwater permitting has on municipal and regional wastewater utilities, which need to work with both federal and state regulatory agencies. Wastewater managers must report to both EPA and DEP on most perfor-mance issues. Municipalities feel that duplicate reporting can be more complicated, and the reporting of violations is often confused by the overlapping responsibilities of the two agencies. When permit violations occur, the agencies must collaborate to determine which will take responsibility for investigation, determination, and enforcement, increasing delays and com-plexities for affected municipalities. Currently, anyone wishing to discharge pollutants to surface waters in Massachusetts must receive permits from both DEP under state law and from EPA under the Federal Act.
The state has, from time to time, considered assuming authority for the NPDES program from EPA Region One. Most recently, in 1996, DEP hired a consultant to consider the benefits of assuming authority for the program as well as arguments against doing so. The report concluded that a Massachusetts NPDES program would be advantageous, but outlined staffing and funding challenges.38
In light of current fiscal constraints, and trends toward increasing regulation of both wastewater and stormwater, the Commission recommends that DEP revisit the issue. At a time when municipalities are facing mounting regulation related to both wastewater and stormwater, coupled with decreased funding
When permit violations occur, the agencies must collaborate
to determine which will take responsibility for investigation,
determination, and enforcement, increasing delays and complexities
for affected municipalities

40 | Massachusetts’s Water Infrastructure: Toward Financial Sustainability
Wh y d o w e h a v e t h i s g r o w i n g G a p ?
to meet new requirements, the costs and benefits of primacy may have changed. Assuming state primacy may result in better planning and prioritization of projects as well as possible savings to the state.
Advocates of assuming “primacy” argue that it would allow DEP to be the single point of contact for the federal and state pollu-tion discharge permit programs, eliminating dual permitting. It might also allow the state to:
• Tailor its NPDES permit program to meet specific state needs, while still meeting the requirements of the federal program
• Directly integrate NPDES permitting decisions into the local water management framework
• Reduce the burden imposed on the regulated community by separate, and sometimes redundant, federal and state permitting programs
• Independently interpret and apply state water quality standards in issuing permits
• Set state permitting schedules and priorities
Under this model, the NPDES program would still be a partner-ship between Massachusetts and EPA. While the state would take the lead in administering the program in Massachusetts, EPA would remain responsible for ensuring that the state carries out its responsibilities and would retain independent authority to enforce its requirements. In practice, DEP would need to continue to work with EPA. If the state is to adopt responsibility, the following should be demonstrated:
• The state must demonstrate that it can afford to administer the program
• The state must demonstrate that it can deliver equal or greater benefits to the environment
• The state program would use sound scientific information to determine permitting decisions
• That there would be flexibility to allow cost benefit analysis and to search for the best solutions using limited dollars
• The evolving role of the EPA needs to be settled
Reduce the burden imposed on the regulated community by separate, and sometimes redundant, federal and state permitting programs

Massachusetts’s Water Infrastructure: Toward Financial Sustainability | 41
Wh y d o w e h a v e t h i s g r o w i n g G a p ?
Nutrient control is one of the most costly considerations for communities across the stateNPDES permits are used to address serious concerns over nutrient pollution. Over the last decades, NPDES permits required communities to greatly reduce the level of nitrogen and/or phosphorous allowed in the discharge of treatment plants. In many communities, newer, lower limits are on the horizon, many of which will require additional and expensive technical solu-tions. At the same time, NPDES permits are more aggressive in reducing nutrients through stormwater mitigation, which is also expensive.
Nutrients, particularly nitrogen and phosphorous from septic systems, wastewater treatment plants, farms, lawns and stormwa-ter, leach into groundwater and are discharged to surface water bodies. The nutrients flow into lakes, rivers, streams, and our coastal estuaries, where they act as fertilizer to aquatic plants. The nutrients effectively accelerate the growth of nuisance plants, algae, and weeds. This in turn reduces available oxygen in the water, forcing out shellfish, indigenous plants, and fish. The term for this situation is “eutrophication.” Eutrophication is a natural process, but accelerating the eutrophic process through excessive nutrient loading in our waste waters is a major issue.
Depending on the region of the state, both phosphorous and nitrogen are important to reduce. In Metrowest, the key nutri-ent is phosphorous, and NPDES permits have succeeded in dramatic reductions in point source discharges. More needs to be done in non-point source reduction, particularly in stormwater.
In coastal regions, a key nutrient is nitrogen, and the presence of this nutrient threatens the estuaries of southeastern Massa-chusetts which provide habitat for shellfish and sea grasses, and are breeding grounds for commercial fisheries. Tidal estuaries, harbors, and bays in southeastern Massachusetts have already become eutrophic. Much of the Cape Cod area is now served primarily by septic systems. Communities there are struggling to make decisions about how best to reduce nutrient contamination in a region with very little comprehensive treatment. There is little doubt that failure to address the concerns on the Cape will not only harm coastal habitats, but also the tourism industry.
Nutrients effectively accelerate the growth of nuisance plants, algae, and weeds

42 | Massachusetts’s Water Infrastructure: Toward Financial Sustainability
Wh y d o w e h a v e t h i s g r o w i n g G a p ?
Communities throughout the Commonwealth are dealing with nutrient related issues.
The Commission proposes that the Commonwealth use a “watershed” cost/ benefit approach to determine the most cost-effective strategies, regardless of political boundaries or agency silos for management of nutrient related issues. The watershed analysis would entail a holistic look at all the contributing factors to nutrient loading in a watershed and evaluation of many alternative strategies and their benefits. This type of analysis would enable the strategic determination as to whether it is more cost-effective over the long run for a municipal treatment plant to reduce nutrients in its discharge, or whether other approaches might have similar benefits at a lower cost. This analysis would allow regulators and communities to propose long term strategic approaches that assure environmental benefits.
Communities face potentially staggering costs for federally mandated stormwater mitigation The National Pollution Discharge Elimination System (NPDES) program regulates discharges of pollutants to waters of the United States through the issuance of discharge permits under the Federal Clean Water Act. Because of the growing understanding of the negative effects of stormwater on water quality and stream flow, the Environmental Protection Agency now requires all Municipal Separated Storm Sewer Systems (so-called “MS4” systems) that have traditionally captured stormwater runoff through storm drains to obtain a NPDES permit and to develop a stormwater management program. Cities and towns in the districts governed by so-called “MS4 permits” are faced with uncertain costs due to pending federal requirements for stormwater mitigation.
In the coming decades, there is expected to be a dramatic increase in regulation and therefore, costs for stormwater man-agement. Currently in Massachusetts, an MS4 permit is required of 255 cities and towns within four districts, designated North Coastal, Merrimack, Interstate, and South Coastal. The federal MS4 stormwater permits went into effect in 2003 and require that municipalities address basic stormwater management needs including ordinances and bylaws to regulate illicit connections and discharges to a municipal storm drain system, and to address uncontrolled runoff, particularly during and after construction. Most cities and towns are still developing these programs.
We believe that the Massachusetts Estuaries Project (MEP) has done solid work. I know some have raised sincere questions about the MEP, and we need to hear those questions and make sure that we have the best available science. But we can’t be paralyzed by doubts, or strive for perfection, because perfection is the enemy of the good. The question we need to ask is whether the science is strong enough now to form the basis for making responsible decisions. If we are not there yet, let’s figure out what else we need to know, and do it quickly... because time is wasting. Second. We need to think and act regionally to solve the problem. Cape Cod has a sole source aquifer. Groundwater moves through that common aquifer across town lines. All towns contribute to the problem, and all of the towns will need to play a role in solving it – because each town has a stake in the environmental and economic health of the Cape, no matter what its percentage contribution to the nitrogen in our estuaries. This will mean, for the Cape towns, a need to think outside town boundaries and embrace acting jointly with your neighboring communities. And we at MassDEP will be thinking hard in the coming months about the ways we can use our regulatory powers and financial leverage to encourage and reward regional approaches.”
dep cOmmissiOner kenneth kimmel speech at Ocean OutFall sympOsium, may 25, 2011
http://WWW.mass.gOv/dep/aBOut/nutlOadcc.htm

Massachusetts’s Water Infrastructure: Toward Financial Sustainability | 43
Wh y d o w e h a v e t h i s g r o w i n g G a p ?
An upgrade to the MS4 permits has been proposed by the EPA, which may require more costly items such as water quality monitoring and testing. Municipal Separated Storm Sewer Systems could ultimately be regulated to address contaminated discharges, and to address run off associated with impervious surfaces. Despite the increasing regulatory and environmental requirements for stormwater management, there are currently no dedicated federal or state resources for meeting this growing need.
The most intensive stormwater management effort to date in Massachusetts is focused on the upper Charles River watershed where the EPA has instituted a Residual Designation (RDA) pilot program. This effort requires that owners of commercial, industrial and multi-family residential properties 2 acres and larger in the towns of Milford, Bellingham and Franklin construct additional stormwater facilities that reduce phosphorus pollution by 65% percent. The outcome of this pilot initiative may be the basis for future federal stormwater requirements that could be instituted for municipalities in the Charles River basin, and eventually in other watersheds across the state. To a great extent, the outcome of this pilot and subsequent final federal regulations will be a significant driver of the total funding needs for stormwater.
To generate revenue for the MS4 compliance programs, a few communities have created new “stormwater utilities” which charge a fee based on an average impervious index for a residence and/or actual measurement of impervious acreage of commercial, industrial, and business uses. In these “model” com-munities, fees are initiated in concert with a capital, operational and maintenance and debt retirement cost plan associated with implementing stormwater management best practices and a long term capital improvement program. An enterprise accounting system ensures that the fees in fact support the O & M, capital investment plan, and debt retirement plan.
Security and redundancy must be addressed Communities expect to invest significant dollars in security and redundancy in their systems to protect the public during various emergency situations. Emergency preparedness requires both operating costs and capital costs.39
STORMWATER COSTSThe Town of Reading created an ad hoc stormwater management advisory committee in 2002 to investigate funding options, identify program costs, and look at rate setting methodologies. A recommendation was made to create an enterprise fund to ensure a dedicated source of funds for stormwater operation and maintenance. Reading’s town meeting voted to establish this fund in 2006. The town raises approximately $430,000 annually, based on a residential fee of $40.00 per year for a single family or 2 family home and $40.00 per year for every 3210 square feet of other development. The town created an abatement process if residents can prove the presence of infiltration or stormwater treatment systems. The revenue is used for labor to perform stream and detention basin maintenance activities, capital expenditures, drainage mapping, detection of illicit connections, drainage infrastructure improvements, and other activities. Any money that is left over at the end of the year is rolled over into the next year’s enterprise fund budget.
http://www.ci.reading.ma.us/pages/ ReadingMA_Engineering/faq
We feel this proposed (MS4) Permit mandates stormwater requirements and best management practices that will prove too difficult for any town of Medway’s size, with a limited budget and staff, to execute. We are concerned that the current economic climate presents the worst possible conditions in which to apply such strict requirements.”
dennis crOWley, chair medWay BOard OF selectmen letter – march 14, 2011
MEDWAY

44 | Massachusetts’s Water Infrastructure: Toward Financial Sustainability
Wh y d o w e h a v e t h i s g r o w i n g G a p ?
Redundancy is a concept that water system operators plan for. Redundancy generally means eliminating or managing potential points of failure within a system. Having redundancy in the system leads to a higher degree of reliability in the event of an emergency, and also allows parts of the system to come off line for inspection or rehabilitation.40 For example, if a well is con-taminated in one part of a town, another can quickly be brought on line. If a critical water main breaks, the affected area can be isolated and alternate routes utilized.
Redundancy planning may mean developing an additional water supply, alternate water mains, or treatment capacity. These redundancies have capital costs.
Emergency preparedness guidelines from the DEP 41 encourage towns to have safety protocols in the event of emergencies: to have standby power equipment for major pump stations, an adequate fuel supply for portable generators, an inventory of spare parts, an inventory of adequate treatment supplies, and to practice routines that keep vehicles in working order and fuel tanks filled. Periodic training is essential to ensure that staff is familiar with emergency protocols. These measures are prudent and a wise use of resources.
As an example, the Massachusetts Water Resources Authority, which serves many cities and towns, in its 201242 financial report has estimated that water system redundancy expenditures are projected to increase from 12.1% of spending through 2010, to 37.8% for the FY14-18 time period.
The state faces critical environmental or growth issues that may require new infrastructure or a new paradigm for water, wastewater, and stormwater servicesSignificant parts of the Commonwealth are struggling to plan for new or expanded water infrastructure to address a variety of emerging concerns including climate change, new demands for service due to growth or potential growth, and emerging contamination problems related to stormwater, private wells, or septic systems. These communities need solutions that are cost-effective, supportive of the local economy, environmentally sustainable, and technologically reliable.
Improving the security and resilience of our nation’s drinking water and wastewater infrastructures is vital to ensure the provision of clean and safe water to all in the United States.
Significant actions are underway to assess and reduce consequences, threats, and vulnerabilities to potential terrorist attacks; to plan for and practice response to natural disasters, emergencies, and incidents; and to develop new security technologies to detect and monitor contaminants and prevent security breaches.”
“Dedicated resources are important to ensure a sustained focus on protective programs. In some circumstances, investment may be as simple as increasing the amount of time and attention that executives and managers give to protective programs. More resources should be invested where threat potential or potential consequences are greater. Utilities should identify specific protective program needs and set aside resources accordingly, through their annual capital, operations and maintenance, and staff resources plans.”
“Utilities should encourage awareness and integration of a comprehensive protective posture into daily business operations to foster a protective culture throughout the organization and ensure continuity of utility services.”
http://water.epa.gov/infrastructure/watersecurity/

Massachusetts’s Water Infrastructure: Toward Financial Sustainability | 45
Wh y d o w e h a v e t h i s g r o w i n g G a p ?
Some of these communities are starting with a small centralized water or sewer system but are facing demand to expand. Others have no centralized water or sewer systems and are attempting to deal with complex treatment challenges “from scratch” without a rate-payer base or existing facilities.
Some communities see the lack of water and wastewater infrastructure as a drawback, while others see an opportunity to shift to innovative new solutions. Conventional centralized water systems have efficiencies of scale, but can have inherent drawbacks including high energy use and transportation of water away from its sources.
Technologies that keep water local, replenish water closer to its source, and are more resilient in fluctuating climates will offer sound investments for communities in the 21st century. This theme was struck by the Massachusetts Executive Office of Energy and Environmental Affairs 2004 Water Policy, which stated: “Existing infrastructure often transports precipitation away from where it lands instead of letting it infiltrate. Trans-porting dirty water far from its source made sense historically, but today, with significant improvements in wastewater treat-ment techniques and standards, treatment levels often make the water available for reuse or recharge, thereby replenishing the natural stream flows and aquifers in the basin or sub-basin.”
Addressing these challenges may offer opportunities for technologies and systems designs that meet the so-called “triple bottom line”—simultaneously optimizing economic, social, and ecological gains.
These technologies utilize “smart, clean, and green” ways to capture the value of assets in the process. Reuse water, nutrients, and energy embedded in wastewater can be sold to utilities and customers, rather than disposed of as pollutants in the environ-ment. These systems and technologies must be appropriately scaled and utilize low impact development techniques and green infrastructure designed to restore natural infiltration and evaporation cycles, which will reduce flooding, sewer overflows, and the severity of droughts.
The vision is to utilize systems that integrate water resource considerations into all aspects of planning, building, and running
Stakeholders who need new infrastructure can be served with integrated water-centric systems that supply and treat water within a more resilient and efficient decentralized district area, and manage all of the related natural resources as benign by-products that serve local needs.” “Private capital investments in these innovative projects are an opportunity for the community to benefit without needing to make the initial public investments or carry risks. (…) In these cases, private investment would be targeted at the creative, leading-edge.”
edWard clericO and dOminic kulik natural systems utilities, letter – march, 2011

46 | Massachusetts’s Water Infrastructure: Toward Financial Sustainability
Wh y d o w e h a v e t h i s g r o w i n g G a p ?
communities and businesses, and that mimic natural designs and functions such as streams and wetlands. These approaches can improve the financial stability of communities, and can also contribute significantly to green business development and job creation.
MUNICIPAL DEBT IS A GROWING BURDENMany municipalities have taken on increasing levels of debt in order to maintain their water infrastructure and meet various obligations for mandated improvement projects. For many communities with high levels of debt, a significant proportion of their available finances have been and will continue to be consumed by debt service and will be unavailable for needed maintenance and expansion projects. Many systems have signifi-cantly raised rates to help cover the costs of debt.
Several examples paint a vivid picture:First, consider the Massachusetts Water Resources Authority (MWRA), which serves 43 communities for sewerage and 51 communities for water service for a net total of 61 communities. Since the MWRA was created in 1984, the Authority has completed nearly 7.4 billion dollars in upgrades to its water and sewer systems, including the Boston Harbor Project, the Metrowest Water Supply Tunnel, Rehabilitation of the Spot Pond Supply Mains, the Carroll water treatment plant, and mitigation of combined sewer outfalls. These investments are shown on the chart below. Nearly 80% of these capital improve-ments were mandated by state or federal regulations. Repayment of the borrowing (principal and interest payments on its bonds) now accounts for 59% of the annual MWRA budget.43
In the face of this debt, the MWRA has been able to operate by utilizing difficult budget cuts and rate increases, despite the fluctuation and elimination of state debt service assistance. However, the authority’s estimates on future debt payments clearly show that without additional assistance, the authority will be facing serious challenges in meeting the $5.8b in debt pay-ments that will be incurred over the next 35 years. Debt service payments are projected to peak by FY2022, when they are projected to total $550 million, almost as much as the proposed current expense budget for FY 2011.44
Since the MWRA was created in 1984, the Authority has completed nearly 7.4 billion dollars in upgrades to its water and sewer systems
Nearly 80% of these capital improvements were mandated by state or federal regulations (MWRA Norumbega Reservoir in Weston)

Massachusetts’s Water Infrastructure: Toward Financial Sustainability | 47
Wh y d o w e h a v e t h i s g r o w i n g G a p ?
MWRA’s Capital Improvement Program

48 | Massachusetts’s Water Infrastructure: Toward Financial Sustainability
Wh y d o w e h a v e t h i s g r o w i n g G a p ?
As can be seen on the following chart, debt service payments are projected to peak by FY 2022, when they are projected to total $550 million.45
The Town of Holliston provides another example. Town officials testified before the Commission about the impact of debt on its ability to deal with current issues. The water department’s annual budget already includes about 40% debt service for previous capital expenditures.
Beyond this existing debt, Holliston faces a DEP mandate to undertake a $1.5 million repair to an existing well site and faces additional challenges in replacing asbestos-cement pipes that have been in place for about 75 years—the average life of such pipes. Holliston maintains about 100 miles of pipe and serves 14,942 residents and 782 fire hydrants. Depending on circumstances, the average cost for pipe replacement has been estimated at about $800,000 per mile. Planning for a program of pipe replacement will be challenging to pay for, especially with the current debt load.
Another city that testified about the debt burden is the City of Fall River. Fall River has a current annual debt service cost of $7,920,000 for its wastewater improvements, which is 45% of
MWRA’s Capital Improvement Spending & Debt Service

Massachusetts’s Water Infrastructure: Toward Financial Sustainability | 49
Wh y d o w e h a v e t h i s g r o w i n g G a p ?
the entire Sewer Division budget. As a result, there has been a dramatic increase in sewer user fees and a new stormwater fee.
In addition, the city has an annual debt service cost of $2,341,699 for its water system improvements, an amount that is 28% of the entire Water Division budget and the prime cause of the dramatic increase in water user fees. It is expected that new Massachusetts dam regulations and expanded federal stormwater regulations will require the city to invest in millions more in capital improvements. To start, a $3.6 million dam improvement is underway using loans. Currently, the annual cost to a single family homeowner for water, sewer, and stormwater is $816. Fall River has an MHI of $35,814.
These three examples are illustrative of the debt pressures facing Massachusetts cities and towns.
The Commonwealth Sewer Rate Relief Fund (line item 1231-1000) was specifically designed to mitigate the escalating debt due to the costs of water and sewer service in Massachusetts. Instituted at a time (1993) when communities were experiencing double-digit rate increases as a result of federally mandated improvement projects, such as the Boston Harbor Cleanup, the fund historically helped communities cover their interest charges and also helped pay principal. At one time the account was funded annually at over 60 million dollars, and it was an important tool that helped residents in over 100 communities across the state. Eligibility for the fund is related to certain debt criteria.
Funding for the line item has fluctuated (see chart on next page). The highest assistance was offered in FY00, FY01 and FY02. In FY03, debt service assistance was eliminated. A year later, assistance was restored but never regained its earlier levels. Partly due to the economic downturn in FY09, the Governor and Legislature eliminated the appropriation in October 2008. The line item is funded at $500,000 for FY12 after three years with no expenditures.
Fall River has a current annual debt service cost of $7,920,000
for its wastewater improvements, which is 45% of the entire
Sewer Division budget

50 | Massachusetts’s Water Infrastructure: Toward Financial Sustainability
Wh y d o w e h a v e t h i s g r o w i n g G a p ?
The following chart summarizes the history of assistance offered to communities through this critical fund:46
Between FY 1994 and FY 2008 alone, this critical program distributed over $450,000,000 statewide.47 Anecdotally, the Commission heard that erosion of this stream of revenue has had an impact on the willingness of municipalities to borrow for infrastructure programs, even at low interest rates.
As funding for the Rate Relief line item has fluctuated, many communities have been impacted. For the MWRA, which over the years received the highest share of support, reductions in debt service assistance have resulted in a combination of greater reliance on reserves and budget cuts which address short-term budget needs. For example, when the account went from over $60 million in FY 2002 to zero funding in 2003, Boston was forced to institute an unprecedented mid-year rate adjustment, increasing the rate increase from 2.9% to 6.9% as part of an overall strategy in response to cover required debt payments, while cutting $420 million from its capital improvement program and $47.2 million from the current expense budget through various budget cuts including layoffs.48
20.5
31.7
31.9
46.449.0
52.3
58.961.8 60.5
0.0 0.0 0.0 0.0 0.55.0
10.512.5
25.023.0
TOWN OF MONSONThe Monson water system was established in 1894 and serves approximately 4000 customers. The town has worked diligently to maintain and upgrade their system. Since 1998 they have replaced approximately 12,000 feet of various sized water mains in six different projects, replaced a failed well with two new wells, built a new building around an existing well, added a concrete water storage tank and rehabbed an existing steel water tank. Monson completed these with grants and loans from several sources, including Community Development Block Grants, the United States Rural Development program, and the State Revolving Funds. The system now allocates 28% of its budget to debt service to pay off its borrowing.
To pay for these investments, Monson has raised its rates. One result of higher rates was that customers began to conserve water. Because less water was sold, Monson raised rates to maintain revenue. The continuing cycle of higher rates cause a manufacturing company in town to install a water recycling system to reduce their water use. The company is expected to save approximately 15 million gallons of water per year, which means the water department will see a decrease in revenue of $75,000 in FY 2012
Based On testimOny OF craig W. jalBert superintendent mOnsOn Water and seWer department
nOvemBer 15, 2010

Massachusetts’s Water Infrastructure: Toward Financial Sustainability | 51
Wh y d o w e h a v e t h i s g r o w i n g G a p ?
There are unanticipated financial effects of water conservation There has been a great deal of progress in water conservation in recent years, which is positive for the Commonwealth and the environment. Through policies issued by the Massachusetts Department of Environmental Protection and the Water Resources Commission, the Commonwealth has adopted some of the most stringent standards on water use in the nation.49 As a result, water use in Massachusetts has been on a steady decline since the 1960’s.
The chart below shows how water use in the City of Boston’s system has steadily declined since the mid 1970’s.
Boston water use 1900 to 2010
source: MWRA
The Massachusetts Water Conservation Standards (2006) stipulate that public water suppliers need to meet or make progress toward meeting a standard of 65 residential gallons per person per day and reduce their “unaccounted for water” (leakage within their distribution systems) to less than 10%. (As a point of comparison, the USEPA estimates that the average residential use in the United States is 100 gallons per person per day.) As a result of these policies, Massachusetts water suppliers have adopted many water conservation measures.
Conservation, however, has had unintended consequences. Current pricing structures used by many communities are put-ting conservation efforts in conflict with system maintenance. Because water is billed on the basis of volume sold (gallons or cubic feet) fewer gallons consumed results in reduced revenues for maintaining water systems.
Water use in Massachusetts has been on a steady decline since the 1960’s
Both federal and state funding available to municipalities has
steadily decreased since the 1970s

52 | Massachusetts’s Water Infrastructure: Toward Financial Sustainability
Wh y d o w e h a v e t h i s g r o w i n g G a p ?
STATE AND FEDERAL FUNDING IS TRENDING DOWNWARDSince 1972, the federal government has spent billions of dollars in investments to drinking water and wastewater infrastructure nationwide. When leveraged with state and local contributions, over a trillion dollars has been spent across the country during these last forty years. However, the trend is that both federal and state funding available to municipalities has steadily decreased since the 1970s.50
For example, in the past, state and federal earmarks were used to subsidize water infrastructure projects in the Commonwealth. The recent economic downturn has virtually eliminated earmarks in the Massachusetts Legislature as well as in United States Congress.
In 2008, the Massachusetts Environmental Bond bill authorized $25 million for water infrastructure projects, but constraints on the bond cap have prevented this money from being appropriated.
Small but important streams of funding still do exist in such programs as the MWRA local pipeline assistance program, the MWRA infiltration and inflow local assistance program, the MassWorks Infrastructure program, the Drinking Water Supply Grant Program, and the United States Department of Agriculture (USDA) rural assistance programs. These and other state and federal funding streams have been put to good use on diverse programs from schools to hospitals to pilot projects.51
By far the most important current funding streams for Mas-sachusetts are the federal Clean Water and Drinking Water State Revolving Fund Grants and the Massachusetts Contract Assistance Program that provides the match for them.
Clean Water and Drinking Water State Revolving Funds During the early years of the Clean Water and Drinking Water programs, federal money was disbursed in grant programs, offering 75% federal support for some programs. The state contributed a 15% match, and the municipality contributed the remaining 10%. These grants were critical to establishing our existing water infrastructure framework in many communities
State Revolving Funds (SRFs) carefully loan the money at low interest rates to municipalities, water and wastewater districts, and public water suppliers to finance drinking water and wastewater infrastructure

Massachusetts’s Water Infrastructure: Toward Financial Sustainability | 53
Wh y d o w e h a v e t h i s g r o w i n g G a p ?
—and were widely popular because municipalities paid only a fraction of the true costs of the systems.
The program was restructured and converted to today’s low interest loan program in 1989 (Clean Water) and 1993 (Drink-ing Water). Each state participates in the state-federal partner-ship that uses federal dollars from the EPA combined with state dollars to create the State Revolving Funds (SRFs) that carefully loan the money at low interest rates to municipalities, water and wastewater districts, and public water suppliers to finance drink-ing water and wastewater infrastructure.
This restructuring had the intended impact of stretching the federal dollar to accomplish more projects, but it should be noted that the shift from grants to loans has had a substantial impact on municipalities. Unlike the earlier federal grant programs, SRF loans require that the municipality or local water district pay back principal and interest, either through rates or through the local general fund. This shift has resulted in an increasing reliance over the past thirty years on local water or sewer rates to fund infrastructure.
Massachusetts is among the most highly leveraged SRF pro-grams in the country, with a track record among the top handful of states in its performance of dollars lent for infrastructure investment compared to each dollar received from the federal government. The Clean Water and Drinking Water SRFs, man-aged by the Massachusetts Water Pollution Abatement Trust in the State Treasurer’s Office, represent the most sustained and significant source of federal and state investment in water-related infrastructure in Massachusetts.
In addition to federal funding, each year the Commonwealth contributes money to the state revolving fund through a budget category called “Contract Assistance.” For FY 2012, the anticipated Contract Assistance from the Commonwealth to keep the revolving funds running is $64,986,546.52 This is Massachusetts’ss most consistent and important contribution to water infrastructure investments and represents an extraordinary commitment over the years of the program.
The leveraging capability of the Water Pollution Abatement Trust is based on its ability to leverage funds in the bond market through the use of a reserve fund, dedicated to each bond series
Upper Blackstone Water Pollution Abatement Facility

54 | Massachusetts’s Water Infrastructure: Toward Financial Sustainability
Wh y d o w e h a v e t h i s g r o w i n g G a p ?
in order to fund the projects and also to maintain the highest bond rating. Over the life of the program, the Massachusetts Water Pollution Abatement Trust has leveraged the federal capitalization grants by an average factor of 2.4, translating the $1.59 billion in federal grants into $5.44 billion in project financing. The Trust has financed $4.3 billion in clean water projects and $1.1 billion in drinking water projects since the program began.
With 97% of Massachusetts residents served by one of the 292 entities that have borrowed funds through the Trust, MWPAT’s SRF programs are critical to the Commonwealth’s clean and drinking water initiatives.53 The top borrowers include the MWRA, Fall River, Upper Blackstone Water Pollution Abate-ment District, New Bedford, Brockton, Lowell, South Essex Sewerage District, Taunton, Nantucket, Lynn Water and Sewer Commission, Chicopee, Gloucester, Chelmsford, Springfield Water and Sewer Commission, and Fitchburg.
The chart on the next page displays the leveraging capability of the Trust based on the bond series offering compared to the reserve fund needed to support the bonds. The reserve fund is the amount that the Trust has dedicated to each bond series in order to fund the project and also to ensure that the Trust will maintain the highest bond rating. Maintaining the AAA bond rating is crucial to the operation of the Trust because it reduces the cost of borrowing, thus reducing the cost incurred by the Commonwealth to subsidize the loans. The Trust has historically leveraged in between 2:1 to 3:1, with the last bond series lever-aging just above 3:1. The success of the Massachusetts Water Pollution Abatement Trust is based on its ability to leverage funds in the bond market and fund more projects than possible with a direct loan system, a “non-leveraged” model that other states in the US have adopted.54
Currently, Massachusetts uses a 2% interest rate, set by state law, for its SRF loans. This rate allows the MWPAT to finance more projects through the leveraging of federal and state funds than would be possible if the loans were zero or one percent. It also provides subsidized financing to cities and towns, and provides a source of funding to support bond debt service payments. This leveraging can be seen in the chart on the next page.55 The first column in each series shows the amount of money loaned to
There are several bills pending in Congress to reauthorize the federal Clean Water Act, which capitalizes the Clean Water SRF
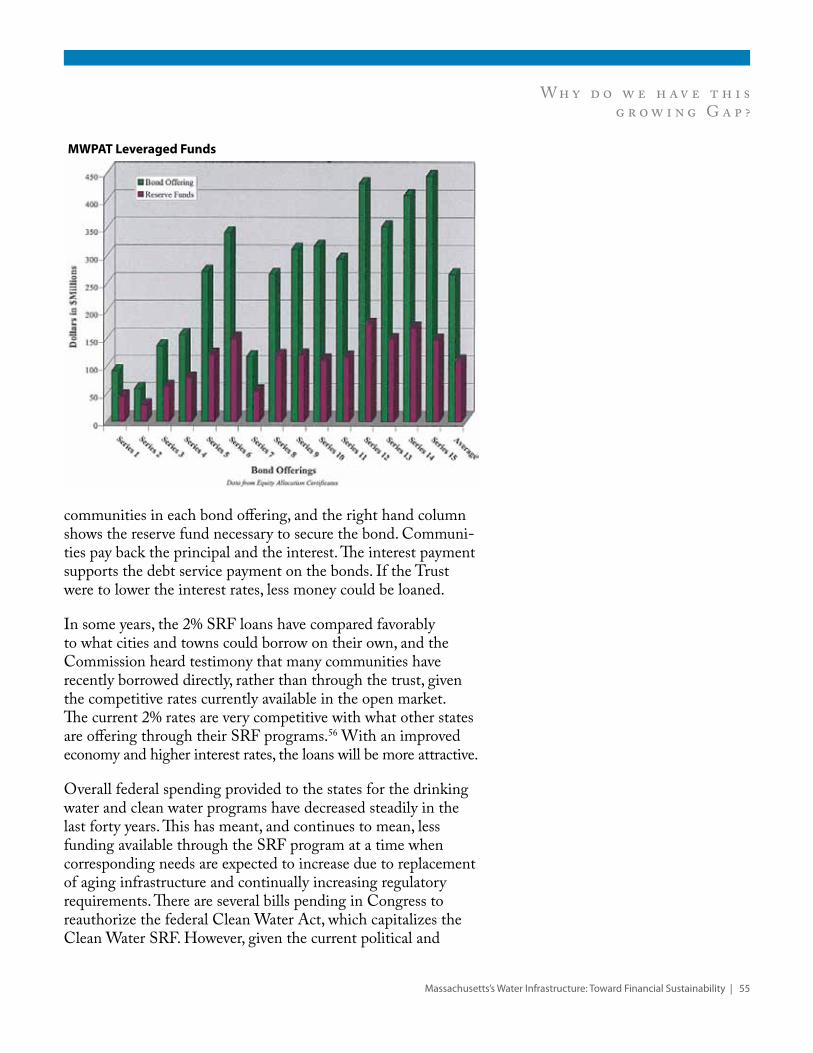
Massachusetts’s Water Infrastructure: Toward Financial Sustainability | 55
Wh y d o w e h a v e t h i s g r o w i n g G a p ?
communities in each bond offering, and the right hand column shows the reserve fund necessary to secure the bond. Communi-ties pay back the principal and the interest. The interest payment supports the debt service payment on the bonds. If the Trust were to lower the interest rates, less money could be loaned.
In some years, the 2% SRF loans have compared favorably to what cities and towns could borrow on their own, and the Commission heard testimony that many communities have recently borrowed directly, rather than through the trust, given the competitive rates currently available in the open market. The current 2% rates are very competitive with what other states are offering through their SRF programs.56 With an improved economy and higher interest rates, the loans will be more attractive.
Overall federal spending provided to the states for the drinking water and clean water programs have decreased steadily in the last forty years. This has meant, and continues to mean, less funding available through the SRF program at a time when corresponding needs are expected to increase due to replacement of aging infrastructure and continually increasing regulatory requirements. There are several bills pending in Congress to reauthorize the federal Clean Water Act, which capitalizes the Clean Water SRF. However, given the current political and
MWPAT Leveraged Funds
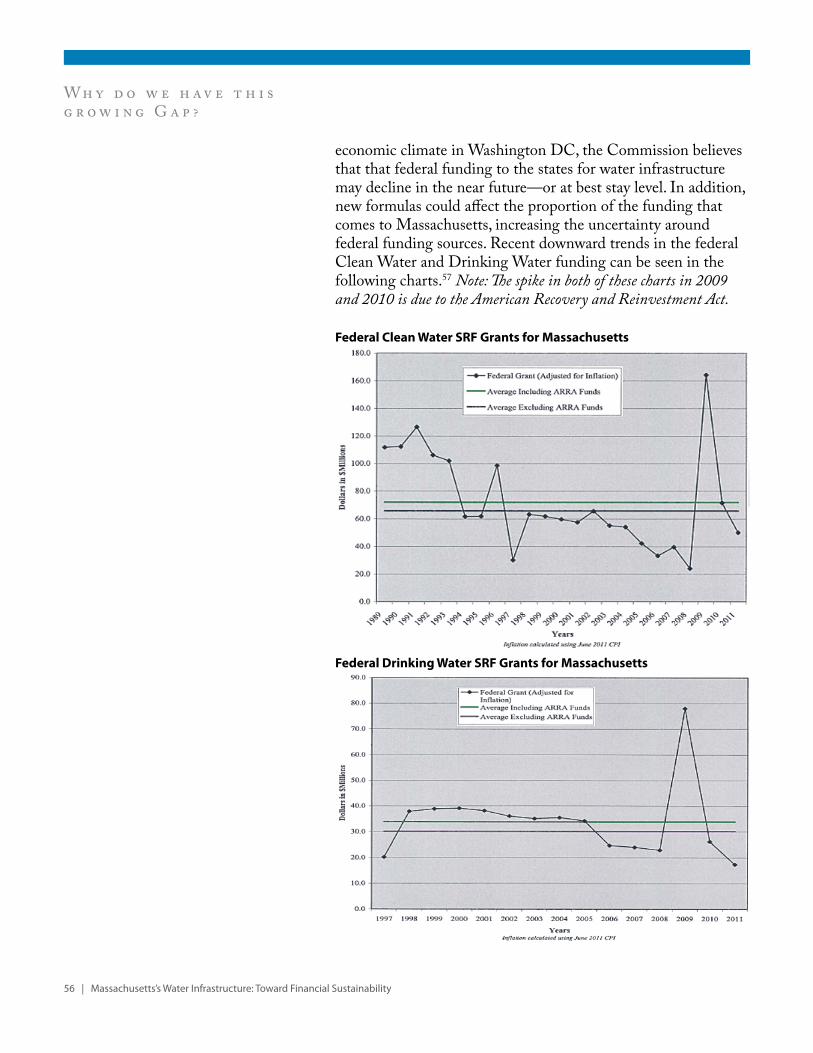
56 | Massachusetts’s Water Infrastructure: Toward Financial Sustainability
Wh y d o w e h a v e t h i s g r o w i n g G a p ?
economic climate in Washington DC, the Commission believes that that federal funding to the states for water infrastructure may decline in the near future—or at best stay level. In addition, new formulas could affect the proportion of the funding that comes to Massachusetts, increasing the uncertainty around federal funding sources. Recent downward trends in the federal Clean Water and Drinking Water funding can be seen in the following charts.57 Note: The spike in both of these charts in 2009 and 2010 is due to the American Recovery and Reinvestment Act.
Federal Clean Water SRF Grants for Massachusetts
Federal Drinking Water SRF Grants for Massachusetts

Massachusetts’s Water Infrastructure: Toward Financial Sustainability | 57
Affordability is an important issue for many communities
Ratepayers are very concerned about the cost of service, and system managers must address affordability in setting their rates. Keeping water and sewer service affordable is of particular concern to individuals on low or fixed incomes. The American Association of Retired Persons has identified this issue as one of its public policy concerns.58 If water infrastructure is to be paid for increasingly with user rates, it is important to recognize that different communities have different abilities to pay for neces-sary improvement and within communities the needs of lower income rate payers must be addressed.
For policy makers, the issue is finding ways to incent municipal, district, and authorities to set rates that adequately pay for the full cost of service in a way that doesn’t make water rates unaffordable for low and moderate income individuals and communities.
While there is general agreement that affordability is a matter of important public policy, there is no national or widely accepted benchmark for what an individual household should expect to pay.59
Rather, the EPA has adopted benchmarks for system-wide rates for all customers of a water system relative to the median household income (MHI) in a service area (rates as a percentage of the community’s median household income). The EPA uses these benchmarks as a ceiling to determine when waivers should be considered for small systems facing expensive water treatment regulations. The EPA benchmark was set at 2.0 percent each for wastewater and drinking water, and then was raised to 2.5%.60 If the proposed treatment or system improvements would result in rates higher than the benchmark, EPA could consider waiving the treatment or extending the program schedule.
Some policy makers have generalized from this EPA waiver benchmark to suggest that keeping rates below a community-wide benchmark of around 1.5 to 2.0% of Median Household Income each for water and sewer payments is reasonable. The benchmark, however, should most likely be considered in conjunction with other factors.
Much of the nation’s drinking water and wastewater infrastructure is at or near the end of its useful life. The expense of replacing the water infrastructure is contributing to a rapid increase in the cost of water service that is of concern for older, lower-income consumers, who pay a larger share of their income for utility services than other consumers. With water rates increasing at a much faster pace than inflation, finding ways to ensure that the necessary infrastructure repairs take place while supporting affordable water rates for consumers should be an important concern for policy makers.”
aarp puBlic pOlicy institute. replacing the natiOn’s deteriOrating Water
inFrastructure While maintaining aFFOrdaBle rates

58 | Massachusetts’s Water Infrastructure: Toward Financial Sustainability
A f f o r d a b i l i t y i s a n i m p o r t a n t i s s u e f o r m a n y c o m m u n i t i e s
The State of Pennsylvania, in its report, “Creating a Sustainable Solution for Pennsylvania: Report of the Governor’s Sustainable Infrastructure Task Force, November 2008” used the factor of 1.5% for both water and sewer service to extrapolate a total charge of $1,455 per year for water and sewer service to be affordable for communities with average or higher incomes.61
The Commission has examined existing rates and believes that a Median Houshold Income ratio of 1.25 is a reasonable number to use as a measure of local commitment and contribution for each water and sewer rates. Based on the 2010 state-wide average MHI of $64,081 this translates to an average household charge of $800 annually for each water and sewer. Some com-munities currently have rates that match or exceed this level. However with the current statewide average of 0.52% and 0.75% of MHI for water and sewer rates, respectively, most don’t.

Massachusetts’s Water Infrastructure: Toward Financial Sustainability | 59
We won’t make progress until the public truly understands the full costs of service and the consequences of failure to invest
The public is often unaware of the true costs necessary to fully support, operate, maintain, and invest in the Commonwealth’s water-related infrastructure. The costs of water include all the direct and indirect expenses of providing service (including such diverse items as labor, power, chemicals, benefits, taxes, pensions, retirement, administration, overhead, and capital costs including debt, depreciation, and replacement of assets).
At the same time, consumers generally underestimate the value of water for the protection of public health, fire protection, economic vitality, jobs, and environmental benefits and misun-derstand the consequences of failing to invest.62
This lack of understanding—of both costs and value—makes it difficult for some municipalities to make the case for investment. Many communities cover only the “present” costs of operation, such as power, chemicals, labor, maintenance, debt service, and personnel-related costs. In paying only part of the full cost of service, utilities will postpone the replacement of assets and the funding of depreciation.
Thus, for a service that has a very high societal value, where failures will cause great inconveniences, loss of business, and jeopardize the public health, we often fail to pay enough for the service.
Ironically, many of us see the value in high monthly fees for internet or cable service. As a point of comparison, water rates on an annualized basis compare to the following rates paid for other commonly used utilities, see chart on right.
What will it take to develop an understanding of the cost of infrastructure needed to dispose of wastewater and to bring clean water to our homes and businesses, 24 hours a day, 7 days a week? In 2010, the ITT Corporation conducted a survey of American voters regarding the value of water.63 Sixty nine percent of those polled agreed with the statement: “I generally take my access to clean water for granted.” A full 95% of Ameri-can voters polled in the same survey value water over any other
Current Average Rates Expressed As Average Monthly Payment And As Percentage Of Median Household Income
Avg Monthly Pmt.
% MHI
Water rate $ 28 0.52%
Sewer rate $ 41 0.75%
Cellular Phone $50-60* 0.92%-1.10%
Cable TV/Internet
$70** 1.28%
Electricity $45-65† 0.83%-1.19%
Sources: *Kiplinger’s May 2009; **Centris Research April 2009; †Mass. EOEEA website
The average citizen, who ultimately must vote for and pay for new water/nutrient infrastructure, needs a big picture overview of the water/waste situation and deserves a detailed comparison and analysis of ALL available options, in order to make an informed decision whether to pay for a particular technology.”
earle Barnhart, the green center, inc. testimOny at Water inFrastructure hearing nOvemBer 10, 2010

60 | Massachusetts’s Water Infrastructure: Toward Financial Sustainability
P u b l i c U n d e r s t a n d i n g
service they receive, including heat and electricity. Nearly one in four American voters is “very concerned” about the state of the nation’s water infrastructure. Twenty nine percent of voters polled understand that water pipes and systems in America are “crumbling and approaching a state of crisis.” Three out of four American voters polled in the survey stated that disruptions in the water system would have “direct and personal consequences.”
The poll also found that voters are willing to pay more for their water service. This poll is important, because it suggests that efforts to educate the public on the actual and full costs of providing a reliable water supply can impact the willingness of ratepayers to pay for those services.
I am a fan of promoting education on the importance of drinking water utilities. The majority of Public Works Functions are generally downplayed and taken for granted. However, drinking water facilities are held to extremely high standards and regimens and are the best bargain in existence. (….) Educating the consumer to the excellence and value in drinking water utilities would provide the cornerstone for supporting infrastructure maintenance.”
irving a. priest, superintendent tOWn OF Wrentham department OF puBlic WOrks
letter —OctOBer 22, 2010

Massachusetts’s Water Infrastructure: Toward Financial Sustainability | 61
Closing the Gap in Massachusetts will require a combination of strategies:
1. Raise revenues
2. Operate our water, clean water, and stormwater utilities more efficiently
3. Assist towns in retiring their debt
4. Address the issue of affordability
5. Promote environmental sustainability
6. Promote innovation
7. Continue the work of the commission and
8. Educate the public
Over the past decade, many studies have confirmed the need for investment in the nation’s drinking water, wastewater, and stormwater infrastructure. While estimates of the size of the Gap may vary, the underlying message is clear. A significant increase in spending above current levels will be necessary to meet this investment need. And, while federal subsidies will continue at some level, it is clear that the states and local governments across the country will need to prepare integrated responses to this impending crisis.64
The Commission finds that Massachusetts, like other states, faces a substantial Gap between current revenues levels and that needed over the next 20 years. This Gap is not a static number—its size will depend on our actions and many other variables. The Commission recommends that the Commonwealth should continue to gather information about the size of that Gap and the challenges facing each municipal, district, or authority in the Commonwealth. However, we can’t afford to wait for more precise information to act.
The Commonwealth needs to catch up with the rehabilitation of aging infrastructure, meet the challenges of environmental regulation, invest in a sustained asset management program, and integrate our infrastructure to be more energy efficient and more environmentally sustainable.
The challenge is to find a sustainable way of accomplishing these goals now and in the future. Today’s financial backdrop is grim, but this challenge is too important to postpone for better times.
The Commission proposes that the Commonwealth undertake a variety of approaches to move our water-related utilities to a more sustainable future.
As we build on our many accomplishments, the Commonwealth has an opportunity to continue to bring the most modern, science-based understanding of water resources to future deci-sions and investments.
The Commission proposes a road map to a sustainable future

62 | Massachusetts’s Water Infrastructure: Toward Financial Sustainability
R o a d m a p t o a s u s t a i n a b l e f u t u r e
STRATEGY #1: RAISING REVENUES The state and federal government have a critical financial role, as was recognized in the early 1970s during the inception of Clean Water and Safe Drinking Water Acts, to assist with direct grants to help municipalities meet the requirements of federal and stormwater, state clean water, and safe drinking water acts. Closing the Gap will be difficult without strong leadership locally, state-wide and in Congress and a commitment to the issue of water infrastructure investment.
We need increased spending at the federal level and Massachu-setts must be a part of that conversation. We must advocate with Congress for maximum funding for existing critical accounts, including in particular the State Revolving Funds for Safe Drinking Water Act and Clean Water Act, the USDA Rural Development Water Infrastructure Program, and key energy and sustainability accounts that impact water-related infrastructure investments. The state should also advocate for new programs and funding that will stimulate jobs while addressing our water infrastructure needs, including new tax credits for research and development and innovation in water technology and innovative stormwater solutions.
But Massachusetts can’t afford to wait for Washington to solve the problem. We can and must take actions at the state and local level to reduce the Gap. The Commission recommends a three-pronged approach.
The State Revolving Funds are a critical foundationFirst, we must, at a minimum, maintain our existing state and federal funding programs, especially the State Revolving Funds (Water Pollution Abatement Trust Fund).
Massachusetts relies on the federal government, which has contributed an average of 65.8 million dollars a year towards Massachusetts’ss clean water revolving fund and 30.1 million a year (with the exception of 2009 and 2010 when additional funding from the ARRA program was available) toward the drinking water revolving fund.65 The Commonwealth must advocate for these programs in Congress.
A NEW PATH TO CLEAN WATER The vision outlined in the Clean Water Act—fishable, swimmable waters—has not changed. In fact, this strategy is about how we can achieve a leap forward in our nation’s water quality to move us closer to realizing this vision.”
“There is no silver bullet—no single program or regulation will allow us to accomplish our goal. Carrying out all of these principles is where the true “coming together” must happen to address the primary stressors from multiple angles: smarter regulations, stronger partnerships, more balanced and coordinated compliance and enforcement, more integrated approaches to capitalize on synergies, improved communication with a broader audience, and greater leveraging of programs. Just as EPA will have to employ all of its tools, so too must all our partners.”
cOming tOgether FOr clean Water: epa’s strategy FOr achieving clean Water
puBlic discussiOn draFt, august 2010

Massachusetts’s Water Infrastructure: Toward Financial Sustainability | 63
R o a d m a p t o a s u s t a i n a b l e f u t u r e
Moreover, the Governor and the Massachusetts Legislature must continue their commitment to the Contract Assistance line item (the state match) in the state budget which allows the federal dollars to be leveraged.
The Commonwealth should do all it can to maintain the strong performance of the Water Pollution Abatement Trust, so that the Trust continues its stewardship of state and federal investments, its high credit rating, and maintains its strong track record of success.
Boost Revenues at the State Level through a New Trust FundSecond, the Commission recommends the creation of a new statewide Trust Fund, with the funds administered by the Water Pollution Abatement Trust—parallel to but separate from the existing State Revolving Funds.
The Commission recommends that at least $200 million per year be deposited into the new Trust Fund.
The Trust Fund would be used to provide a mix of: • Direct support for cities and towns to be deposited into
their enterprise funds and to be used for capital investments and asset management. These direct payments will begin to reduce the infrastructure spending Gap in each community in a sustained and predictable way. (The Commission envisions this annual municipal payment to be similar to the “Chapter 90 model” currently used to support highway investments) and
• A program of grants and 2% loans, directed toward a diverse set of needs including, planning, design, and construction, assistance with cost-benefit analysis, principal forgiveness, additional debt relief, and funding to encourage research and development.
Grants and loans from the Trust Fund should be structured to incent municipalities, authorities, and districts to utilize or adopt best management practices in full cost pricing, financial manage-ment, asset management, and environmental sustainability, and use watershed-based solutions and regional approaches.
Direct payments will begin to reduce the infrastructure spending Gap in each community in a sustained and predictable way

64 | Massachusetts’s Water Infrastructure: Toward Financial Sustainability
R o a d m a p t o a s u s t a i n a b l e f u t u r e
The program should include provisions for communities without existing utilities or with utilities that serve only a small fraction of the municipal population. Many of these communities are facing enormous pressures to address environmental or public health challenges without a significant rate base or past invest-ment in infrastructure.
Difficult choices will need to be made about how best to disburse these funds to achieve the diverse goals of this program. There is great urgency in the need to reduce the Gap as well as great interest in innovation.
The Commission recommends that the Legislature appropriate $200 million for the Trust Fund each year from the General Fund. If new revenues need to be raised in order to fund the Trust, the Commission favors sources with a nexus to the water investment issue, such as new fees on pollutants such as fertil-izers and pesticides or possibly revenue from a new Bottle Bill.
There was considerable discussion by the Commission about recommending a state-wide surcharge on water and sewer rates to fund the new trust, but because the Commission also favors a strategy of full-cost pricing in the setting of rates, this could be an unfair reliance on local rate payers to address an issue that has national and state-wide implications. The use of such a surcharge needs further consideration.
The Commission has prepared two illustrative scenarios to demonstrate the potential power of this new trust fund.
Scenario one: mixed disbursement model (direct payments, grants, and low interest loans)Under this scenario:
• 20% of the fund would go directly to cities and towns for infrastructure investments (much like Chapter 90 currently assists towns with highway infrastructure),
• 40% would be offered as grants, additional debt relief, and principal forgiveness
• 40% would be put in a separate 2% loan program leveraged similarly to the existing SRF loan program
Am
ount
in M
illio
ns
Scenario one: mixed disbursement model estimated remaining Gap after 20 years if trust fund is funded at $200 million per year (given current economic conditions)

Massachusetts’s Water Infrastructure: Toward Financial Sustainability | 65
R o a d m a p t o a s u s t a i n a b l e f u t u r e
Assuming current interest rates and bond policy, and assuming that all grants and allocations are used for investments needed to reduce the Gap, this “mixed model” scenario could reduce the anticipated Gap by more than $5 billion dollars over 20 years.66
The advantage of this approach to cities and towns is that the grants and direct “Chapter 90-style” annual payment would not have to be repaid, so the state takes on some of the burden.
The model is demonstrated in the sketch above, and the estimated reduction in the Gap (over 20 years) is shown on the chart on the preceding page.
Scenario two: 2% leveraged loan modelIf the same $200 million annual funding of the new trust was utilized solely for a 2% loan program, leveraged through a reserve trust, using current interest rate and bond policy assump-tions, it is estimated that the Gap reduction could be increased by an additional $2.56 billion over that same 20 year period.67
The second scenario is represented schematically on the sketch on the next page and the estimated reduction in the Gap is shown on the chart, to the right.
The increased Gap reduction is important, but it should be noted that in this scenario, cities, towns, districts and authorities must ultimately pay back all the loan and interest, so the entire burden of infrastructure funding falls on the town and/or the ratepayer.
Am
ount
in M
illio
ns
Scenario two: 2% leveraged loan model estimated remaining Gap after 20 years if trust fund is funded at $200 million per year (given current economic conditions)
Scenario one: mixed disbursement model
Existing MWPAT structure
ReseRve Bonds
Loans
Federal Cap Grants
State Match 20%
Contract Assist
New sustainable revenue stream
$200 million a year in dedicated revenue
20%
80%
40%40%
Reserve Bonds
TownNew
Funding
2% Loans Grants

66 | Massachusetts’s Water Infrastructure: Toward Financial Sustainability
R o a d m a p t o a s u s t a i n a b l e f u t u r e
Despite the fact that the second scenario reduces the Gap more dramatically, the Commission recommends the mixed disburse-ment model (scenario one), which offers greater assistance to cities, towns, and ratepayers.
Marketconditions: It should be noted that market conditions (such as interest rates, the differential between market and treasury bond rates, costs of borrowing, and potential changes to federal or state tax codes) could substantially alter the assump-tions on which these estimates were made.68 For example, if these same estimates had been made using 2007 market condi-tions, the conditions would have been more favorable and would have led to a more substantial reduction in the Gap. The chart below shows the estimated remaining Gap after 20 years if the Mixed Model Trust Fund were funded at $200 million per year but had been invested with 2007 market conditions.
Conversely, if bond policy changes in the future to reduce the incentive for investment in bond offerings, the outlook could become less favorable.
Commitmenttothetrust:The success of the trust fund will depend on the assurance of long term sustainability of resources, so the Commission strongly recommends that all revenues be deposited into a dedicated trust fund. The program should be directed toward municipalities, authorities, and districts that adopt best management practices in full cost pricing, financial management, asset management, and environmental sustainabil-ity, and use integrated water management planning, watershed-based solutions, and regional approaches.
Am
ount
in M
illio
ns
Using 2007 market conditions estimated remaining Gap after 20 years if funded at 200 million annually
Scenario two: 2% leveraged loan model
New sustainable revenue stream
$200 million a year in dedicated revenue
Reserve Bonds
2% Loans
New Funding
Existing MWPAT structure
Reserve Bonds
Loans
Federal Cap Grants
State Match 20%
Contract Assist
Massachusetts’s Water Infrastructure: Toward Financial Sustainability | 67
R o a d m a p t o a s u s t a i n a b l e f u t u r e
Communities should set rates to recover the full cost of serviceThird, we must strongly incent municipal, district, and authority commissioners to utilize full cost pricing. Many Massachusetts communities are already doing this, thereby making steady progress on their needed investments. We must bring the rest into this more sustainable model.
A review of Massachusetts water and sewer rates suggests that a significant portion of the infrastructure Gap can be met by consistent, moderate rate increases over time, including set-asides for long-term capital investments.
User rates in Massachusetts are documented in the annual Tighe & Bond Water Rate and Sewer Rate surveys69 and the annual Water and Sewer Retail Rate Survey published by the Massa-chusetts Water Resources Authority (MWRA) Advisory Board. Each survey calculates an average water and sewer rate payment by household based on an average annual domestic consumption of 90,000 gallons. In using the survey data the Commission adjusted the consumption to 70,000 gallon annually.
On one end of the spectrum, many well-run water supply systems and sewer systems set their rates based not only on their day-to-day costs—such as electricity, chemicals, fuel, transporta-tion, and personnel—but also on careful capital improvement plans that make reasonable accommodation for the management and replacement of assets such as pipes, manholes, and pumps, and the protection of watershed land. Some of these systems use more sophisticated rate structures to encourage off-peak use or to encourage conservation. The money that is collected through rates is deposited into an enterprise fund, where it is used only for the purposes of paying short term bills and for the careful replacement of longer term assets. Communities that manage their utilities in this fashion practice “full-cost pricing.”
However, there are also public operating systems in Mas-sachusetts that are not using best management practices and are therefore inadequately funded by rates, lack enterprise fund accounts, and lack asset management or capital planning proce-dures. These systems may not raise enough through their rates to cover the annual expenses of the utility—and many systems do little to set aside money for more serious long-term asset invest-
There are public operating systems in Massachusetts that
are not using best management practices and are therefore
inadequately funded by rates

68 | Massachusetts’s Water Infrastructure: Toward Financial Sustainability
R o a d m a p t o a s u s t a i n a b l e f u t u r e
ments. Water commissioners in some systems are reluctant to raise rates for a variety of reasons, including the hardship to their customers. In some communities, the money collected in water or sewer rates is deposited not into a dedicated enterprise fund, but rather into the municipality’s general fund, where it might be used to fund other town priorities, unrelated to operation, maintenance and investment in water systems. In communities that have been charging rates below the cost of service, the public can dramatically underestimate or misunderstand the true cost of providing service, leading to lack of support for proactive system management, and objections when rates inevitably rise in response to emergency repairs or deferred maintenance.
Communities generally do better when they institute rates that are consistent with a long-term maintenance and management plan. There are a number of planning tools available to assist communities with water planning, however they are not consis-tently used across the state.
In 2006, the Water Resources Commission, comprised of both public and agency representatives and chaired by the Secretary of the Executive Office of Energy and Environmental Affairs, published Water Conservation Standards,70 establishing updated statewide goals for water conservation and water use efficiency and providing guidance on the most current conservation measures. In Section 4.0, the concept of full cost pricing is outlined, stating: “Consumers should be charged the full cost of water. Full cost pricing refers to price levels that recover all the direct and indirect costs associated with providing water.” The standards also note that full cost pricing includes all costs, including operations, maintenance, capital and indirect costs such as environmental impacts and watershed protection. A full cost pricing structure also includes (but is not limited to) a water conservation program including the promotion of retrofit and rebate programs, water audits, a public education program, leak detection equipment, metering, and automated meter reading equipment, all staff expenses, including benefits and training, and all pumping, treatment, distribution system operation, repair, and maintenance, watershed land protection programs, and a capital replacement fund, capital depreciation account, and debt service.
The 2006 Water Conservation document also recommends enterprise accounts and several preferred rate structures to
Number of communities with water and sewer rates above and below 1.25% of Median Household Income

Massachusetts’s Water Infrastructure: Toward Financial Sustainability | 69
R o a d m a p t o a s u s t a i n a b l e f u t u r e
encourage the reduction of nonessential water use. There currently is no mandate for these practices, leaving room for variability of what gets paid for through user rates.
The state should adopt policies that incent full cost pricing. The state should offer incentives and assistance to cities and towns to move them toward full cost pricing, and take other necessary steps to encourage or require communities to meet the guidelines. Most importantly, it is critical for state agencies to offer technical assistance to cities, towns, authorities and districts on rate structures and rate setting—and offer education to the public on why these rate structures are so important.
For Further information on rates and rate structure, consult the Appendix.
In making its recommendation to adopt full-cost pricing, the Commission evaluated the impact on community affordability. While the concept of affordability is subjective, and there is no established benchmark, the Commission looked at water and sewer rates in the Commonwealth using the measure of annual cost as a percentage of Median Household Income (MHI), a yardstick suggested by and used for affordability calculations. Compared against this measure, there is significant variability in municipalities across the Commonwealth.
The chart to the right shows that the vast majority of municipalities have rates for both water and sewer services that are significantly less than 1.25% of that community’s MHI, leading the Commission to conclude that many communities have the capacity for moderate, incremental increases in rates to accommodate full-cost pricing while still remaining within affordability standards.
If communities were to adopt this approach, the Commission projects that the 20-year Gap could be significantly reduced, town by town, if the new revenues are used to reduce the existing Gap.
Combined Impact of Rate and Revenue StrategiesAt current rates, the Gap is $10.2 B for drinking water infrastruc-ture and $11.2 for wastewater for a combined Gap of 21.4 billion.
0
5
10
15
20
25
Total Gap at current rates Rates at
.75 of MHI Rates at 1.00 of MHI Rates at
1.25 of MHI
21.4
14.7
9.3
5.2
13.3
7.9
3.8
11.8
6.4
2.3
8.9
3.6
0
Tota
l Gap
Red
ucti
on in
Bill
ions
$0 M to SRF
$50 M to SRF
$100 M to SRF
$200 M to SRF
Annual contribution to State Revolving Fund
Gap reduction possible using rates increases and new revenues
Increases in rates to 1.25% of MHI with a $200 million annual
appropriation from the state eliminates the Gap entirely

70 | Massachusetts’s Water Infrastructure: Toward Financial Sustainability
R o a d m a p t o a s u s t a i n a b l e f u t u r e
If all rates were increased over time by 5% per year to 0.75% of MHI the total Gap would be reduced to $14.7 billion. An increase in rates of by 5% per year to 1.00% of MHI would further reduce the Gap to $9.3 billion. At rates increased by 5% per year to 1.25% of MHI, the Gap is reduced to $5.2 billion.
An approach that incorporates increases in rates to 1.25% of MHI with a $200 million annual appropriation from the state, eliminates the Gap entirely. The chart to the right shows the impact of various funding strategies on the overall Gap.
Given the number of variables, including uncertainty in market conditions and the bond market, it is difficult to estimate precisely the possible reduction in the Gap. However, the Com-mission’s analysis finds that if:
• Municipalities, districts and authorities adopt full cost pric-ing to combined with moderate, predictable rate increases of 5% per year up to 1.25% of Median Household Income; and
• The state funds a new Trust Fund with $200 million funded annually through the state General Fund to assist towns with their water infrastructure needs
Then, the state will be able to eliminate the Gap over the next 20 years. Adopting other Commission recommendations to find efficiencies and use best management practices will help individual towns use community discretion to further reduce their Gap.

Massachusetts’s Water Infrastructure: Toward Financial Sustainability | 71
R o a d m a p t o a s u s t a i n a b l e f u t u r e
STRATEGY #2: OPERATE OUR WATER, CLEAN WATER, AND STORMWATER UTILITIES MORE EFFICIENTLY
Encourage municipalities, districts, and authorities to adopt financial best practicesIn addition to the inconsistencies in rate setting practices cited above, the Commission found that there is a need for greater use of best management practices by municipalities across the state such as asset management, capital planning, and enterprise accounting. The Commission believes that there should be strong incentives and assistance to move communities toward adoption of those best practices. This suite of best management practices will help bring all systems to financial habits that recognize and address the true costs of service.
Generally speaking, systems that use purposeful rate structures, capital improvement plans, asset management best practices, and enterprise fund accounting are able to make more progress toward a sustainable system. Like a wise homeowner who paints his home regularly and who consistently invests in the maintenance and timely replacement of heating systems, roofs, and windows, a water or sewer system should work to maintain and replace assets.
The Environmental Protection Agency71 recognizes that the renewal and replacement of assets that make up our water infrastructure is a constant and ongoing task. To efficiently manage this ongoing responsibility, water management profes-sionals nationwide utilize best management practices in asset management wherein all the assets of a system are maintained at a defined level of service for the lowest life cycle cost. This concept is widely accepted and practiced.
A well-run utility will utilize a suite of best management prac-tices that does four things:
1. maintains up-to-date information about the history and condition of all assets
2. integrates renewal and replacement costs into a responsive long term capital plan
There is a need for greater use of best management practices by municipalities across the state such as asset management, capital planning, and enterprise accounting

72 | Massachusetts’s Water Infrastructure: Toward Financial Sustainability
R o a d m a p t o a s u s t a i n a b l e f u t u r e
3. sets rates at a level adequate to provide steady and sustained investments toward asset replacement and upgrade
4. applies enterprise account principles to ensure that the revenues are dedicated to these purposes
Assetmanagementplanning: A true asset management plan is based on a deep understanding of the condition of current assets and a planned timetable for maintenance and replacement. Assets are defined as “components of a facility with an indepen-dent physical and functional identity and age (for example, a pump, motor, sedimentation tank, or water main).”72
Rather than wait for failure, municipalities should create a main-tenance and replacement program that minimizes failure and the costly disruptions caused by failure—including flooding , road repair, economic disruption and inconvenience. Age of an asset is one factor—but not the only one. Experts know that age is not always the best gauge for when maintenance is needed. Many new technologies, such as Geographic Information Service (GIS), enable municipalities to identify the location, condition and maintenance history of assets, which is especially useful for water infrastructure which is for the most part underground.
Capital improvement plans: A capital improvement plan is based on the asset management information—as well as any additional information about expected capital improvements the system will need such as upgrades to address regulatory require-ments. The plan presents the public with a clear framework for what needs to be done, the timeframe for completion and the cost. This forward thinking approach is essential in gaining public acceptance and trust.
Enterprisefunds: An enterprise fund gives communities the ability to separately account for financial activities associated directly with water infrastructure using a separate accounting and financial reporting mechanism. Enterprise accounting can be used when the service is provided for a fee, such as a water rate fee, as opposed to a general tax.
Because enterprise funds are managed separately from “general fund” municipal accounts, rates collected can be dedicated to the water, wastewater, or stormwater utility, and money can be set aside for long-term infrastructure repair and replacement.
Assets are defined as “components of a facility with an independent physical and functional identity and age”

Massachusetts’s Water Infrastructure: Toward Financial Sustainability | 73
R o a d m a p t o a s u s t a i n a b l e f u t u r e
Information gathered via enterprise fund accounting also facilitates planning and data-driven decision making. Utilities in communities that don’t utilize enterprise fund accounts send their income into the community’s General Fund, and then must compete with other municipal needs for appropriations.
The Commission was surprised to discover that many Mas-sachusetts communities don’t utilize these practices.
The Commission also found that many communities lack basic information about the value of their assets. Without information on the value of the system, it is difficult to recommend a budget target for annual reinvestment for replacement and rehabilitation and further increases the likelihood of reactive, rather than proactive, investment.
There are steps that the state could take to encourage more communities to adopt best management practices, including:
1. technical assistance2. grants to assist in asset inventories3. incentives (e.g. requiring best management practices in
order to qualify for state grants)4. steps to help districts adopt enterprise fund accounting
Encourage other efficienciesEncourage regional solutions where appropriate. Regionalization may offer efficiencies in certain situations. Regionalization can include such practices as shared purchasing, shared staffing, regional planning, regional management of water systems or assets that may be owned and controlled by separate towns or districts, and, at its most comprehensive, regionaliza-tion can include the complete integration of a number of towns into one system.
Regionalization does not necessarily imply “centralized” solu-tions. Several towns might join together to provide management and monitoring of assets in different towns that may not be linked in any physical way. Or towns with septic tank issues might utilize a regionally administered “circuit rider” to handle Title V issues in several towns to address a common nutrient issue.
The Commission also found that many communities lack basic information about the value of their assets

74 | Massachusetts’s Water Infrastructure: Toward Financial Sustainability
R o a d m a p t o a s u s t a i n a b l e f u t u r e
The Commonwealth already has a substantial regional approach to water supply delivery and sewage treatment. The state’s largest regional authority is the MWRA, established by an act of the Legislature in 1984 to supply water and wastewater treatment to 2.5 million people and more than 5,500 large industrial users in 61 metropolitan Boston Communities. Other multi-town water supply districts serve an additional 456,000 residents, and there are a number of multi-town wastewater treatment districts as well.
Centralized management, operation, and monitoring of either decentralized or classic centralized assets could make a good deal of financial sense for smaller communities who lack the resources for full time support of a water-related utility. Regional entities can provide a management framework with sufficient resources to ensure proper operation and maintenance of either centralized or decentralized facilities, and may allow a region facing the need for new services to select the best mix of each.
Regional solutions may provide particularly compelling solutions in regions of the state facing court orders or looming costs for nutrient reduction and stormwater mitigation. Such creativity often takes extraordinary leadership in Massachusetts, where a strong sense of “home rule,” makes regional planning and coordination challenging.
Regionalization offers the potential for cost savings and efficien-cies when new or upgraded treatment is needed, but also requires the buy-in and careful coordination among member communi-ties. Inter-municipal agreements can be used to help towns move toward regional agreements, or water districts can be created by acts of the legislature.
Regional approaches have been and continue to be a priority of the Commonwealth in recent years, with the Governor, the Lieutenant Governor, the Division of Local Services, Regional Planning Agencies, the Legislature, and many municipal groups working together to offer technical assistance, eliminate statutory barriers, and encourage regional agreements for all kinds of municipal matters. The Commission finds that the Commonwealth should continue to work to eliminate barriers to regionalization in water-related systems, and perhaps take a more central role in the planning and coordination of regional facilities.
REGIONALIZATIONThe Mattapoisett River Valley Water District includes water supply sources operated by the towns of Fairhaven, Marion, and Mattapoisett, also serving the Town of Rochester. Each town was experiencing elevated concentrations o iron and manganese in their wells, requiring several wells to be taken offline. Rather than constructing several treatment facilities for the eight wells, the towns teamed to construct a single advanced water treatment facility. This is the third ultra-filtration treatment facility in the state, and provides exceptional treatment, allowing the towns to meet and exceed current and future treatment standards. Construction was financed with a low interest loan obtained through the Drinking Water State Revolving Fund Program. These towns had a history of working together on water resources protection issues through the Mattapoisett River Valley Water Supply Protection Advisory Committee. For twenty years, the Committee had assessed annual fees to the members based on the amount of water pumped and used these fees for land purchase and other water resource protection measures. They met regularly regarding watershed planning, resource management and to review pumping data. Following town meeting votes in each town, special legislation, Chapter 367 of the Acts of 2004, was needed to create the district. The total cost of the project was approximately $12 million and the three towns achieved a cost savings of approximately $5 million by building the plant jointly.

Massachusetts’s Water Infrastructure: Toward Financial Sustainability | 75
R o a d m a p t o a s u s t a i n a b l e f u t u r e
Provide guidance to communities using public private part-nerships, contracts, and project delivery.
Many communities in Massachusetts face difficult and complex choices about how to pay for services, particularly as the economy has worsened in the last few years. One option on the menu of solutions is the concept of public/private partnerships and/or contracts for private services.
These partnerships can take many different forms. On one end of the spectrum is the outright sale of public utility assets (land, wells, reservoirs, treatment facilities, pipes, mains) to a private, investor-owned company that takes responsibility for all opera-tions, maintenance, and expansion of services for a community. The Commission discussed the outright sale of public utility assets of Massachusetts communities frequently and is very skeptical about such an approach. The Commission’s opposition to outright sale of such assets is out of a concern for the under-valuing of the public assets and loss of public control over these irreplaceable assets. The importance of the municipal controlled asset to long and short term economic development cannot be overstated. It is critical that governmental units maintain fiscal control over the assets.
However, there is a broad range of lesser choices that offer the opportunity for efficiencies while preserving the public’s interests. These include a simple outsourcing of various discrete services (such as provision of supplies and meter reading), private contract operation and maintenance of existing plants, or contracts for the integrated design, construction, and subsequent operation of new facilities (Design-Build-Operate contracts).
Municipalities should weigh many factors before proceeding. It is important to consider all the costs and benefits of these arrangements, including the proposed savings and efficiencies, the potential impact on rates, the regulatory requirements facing the community, various environmental considerations, personnel implications, and more. Communities must weigh the implica-tions of replacing existing employees and contracting out the control over day-to-day operations. They should consider the safeguards they need to have in place to assure the contractor performs as promised. It is crucial that all these deliberations be open and transparent.
The importance of the municipal controlled asset to long and short
term economic development cannot be overstated
76 | Massachusetts’s Water Infrastructure: Toward Financial Sustainability
R o a d m a p t o a s u s t a i n a b l e f u t u r e
Clearly, in some circumstances, these arrangements can offer advantages to communities. The largest gains are often in improved operations of water utilities. Private contractors can offer experience and expertise that would be expensive for many small to medium sized utilities to provide with their own employees. Contractual arrangements may offer savings in salaries and benefits, although some studies have shown that the savings may not be what they are often assumed.73 Under some circumstances, private companies can provide needed capital, or share the risk for innovative technologies.
With a private operating contract, water and/or wastewater rates may be more likely to reflect the true cost of service. It should be noted, however, that rates can move in either direction, depending on the financial condition of the utility, the cost savings realized, and near-term improvements and investments called for under the contract.
Inter-municipal agreements in combination with private contracts can be used to consolidate the management of several small-to-medium sized utilities under a single private contract, and this holds great promise for improved performance. New management, communication, and monitoring technologies create opportunities for economies of scale and scope.
Private contracts are attractive because they promise a competi-tive environment with the attendant advantages of competitive markets. However, the natural monopoly attributes of water services (capital intensity, high costs of duplicating infrastruc-ture) make competition tricky. Strong competition is likely to exist at the point in time when private proposals are submitted, and competition may continue along the boundaries of the service area. But during the contract period, conditions of the contract must substitute for active year-to year competition.
The state should protect the interests of municipalities and ratepayers by offering guidelines, model procurement agree-ments, and other assistance.
Private contractors can offer experience and expertise that would be expensive for many small to medium sized utilities to provide with their own employees

Massachusetts’s Water Infrastructure: Toward Financial Sustainability | 77
R o a d m a p t o a s u s t a i n a b l e f u t u r e
STRATEGY #3: ASSIST TOWNS IN RETIRING DEBTThe Commission recognizes that some communities, authorities, and districts face staggering debt loads due to past infrastructure investments mandated by court orders, regulatory mandates, and other imperatives. While the Commission strongly recommends that communities approach future debt within the concept of “full cost pricing,” it recognizes that some communities will continue to need assistance in retiring their debt.
The Commission recommends that, in addition to other revenues called for in this report, the state create a new debt assistance program funded at $50-60 million annually through the General Fund.
In the past, the Commonwealth Sewer Relief Fund, pursuant to Section 22Z of Chapter 29 of the General Laws, offered meaningful assistance to many Commonwealth communities. In recent years, the account has not been fully funded. The new Debt Assistance Program would replace this program and would be applicable to both water and sewer debt relief assistance and limited to such debt relief only. The enabling language for the account will need to be redrafted to make sure that the com-munities that need assistance in debt relief can receive it.

78 | Massachusetts’s Water Infrastructure: Toward Financial Sustainability
R o a d m a p t o a s u s t a i n a b l e f u t u r e
STRATEGY #4: ADDRESS THE ISSUE OF AFFORDABILITYFull cost pricing is one of the foundations of the Commission’s strategy to close the Gap. However, the Commission recognizes that some communities face particularly challenging and costly environmental problems. Other municipal utilities serve lower income populations who struggle to pay their utility bills. Still others face significant debt or very large backlogs of investments. Full cost pricing may therefore result in rates that are unaffordable.
While there is general agreement that affordability is a matter of important public policy, there is no national or widely accepted benchmark for what an individual household should expect to pay. The Commission suggests using the average annual household water and/or sewer rate as a percentage of median household income for that community. Given the Commission’s analysis, it seems reasonable that this benchmark for rates would likely be in the neighborhood of 1.25% of Median Household Income each for both water and sewer.
Thus, if a community not yet using full cost pricing finds that its average annual household cost for drinking water is well under the benchmark, then the community should be encouraged to move toward full cost pricing through a series of predictable, sequential rate increases.
Communities that utilize full cost rate structures but whose rates fall above the affordability benchmark should be considered for additional assistance, through priority consideration in allocating state and federal funding.
The state as well as those who set local water service rate poli-cies should also consider ways to assist low income individual households with water and sewer rates by utilizing “lifeline” and other similar methods.
The Commonwealth should encourage federal subsidies to assist communities utilizing full cost rates that exceed the low income benchmarks.
C u r re n t ave r a g e a n n u a l h o u s e h o l d c o s t *
M a x i m u m a f fo rd a b l e h o u s e h o l d c o s t b a s e d o n 1 . 2 5 % M H I fo r t h e ave r a g e h o u s e h o l d
D r i n ki n g wate r $ 3 3 4 $ 8 0 1
% M H I 0 . 5 2 % 1 . 2 5 %Wa s tewate r ( s ewe r ) $ 4 8 9 $ 8 0 1
% M H I 0 . 7 5 % 1 . 2 5 %Average current water rates in Massachusetts compared to Median Household Income (MHI), and what the average would rise to if systems were charging at a rate equal to 1.25% of average statewide MHI
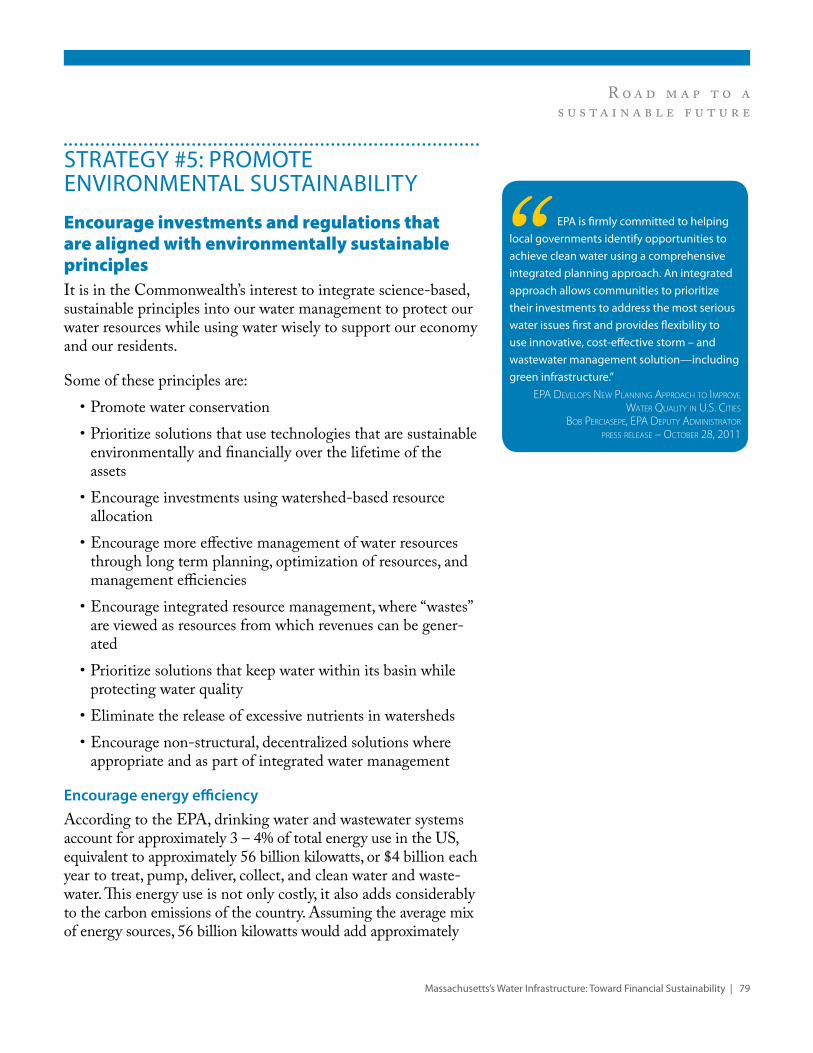
Massachusetts’s Water Infrastructure: Toward Financial Sustainability | 79
R o a d m a p t o a s u s t a i n a b l e f u t u r e
STRATEGY #5: PROMOTE ENVIRONMENTAL SUSTAINABILITY
Encourage investments and regulations that are aligned with environmentally sustainable principlesIt is in the Commonwealth’s interest to integrate science-based, sustainable principles into our water management to protect our water resources while using water wisely to support our economy and our residents.
Some of these principles are: • Promote water conservation• Prioritize solutions that use technologies that are sustainable
environmentally and financially over the lifetime of the assets
• Encourage investments using watershed-based resource allocation
• Encourage more effective management of water resources through long term planning, optimization of resources, and management efficiencies
• Encourage integrated resource management, where “wastes” are viewed as resources from which revenues can be gener-ated
• Prioritize solutions that keep water within its basin while protecting water quality
• Eliminate the release of excessive nutrients in watersheds• Encourage non-structural, decentralized solutions where
appropriate and as part of integrated water management
Encourage energy efficiency According to the EPA, drinking water and wastewater systems account for approximately 3 – 4% of total energy use in the US, equivalent to approximately 56 billion kilowatts, or $4 billion each year to treat, pump, deliver, collect, and clean water and waste-water. This energy use is not only costly, it also adds considerably to the carbon emissions of the country. Assuming the average mix of energy sources, 56 billion kilowatts would add approximately
EPA is firmly committed to helping local governments identify opportunities to achieve clean water using a comprehensive integrated planning approach. An integrated approach allows communities to prioritize their investments to address the most serious water issues first and provides flexibility to use innovative, cost-effective storm – and wastewater management solution—including green infrastructure.”
epa develOps neW planning apprOach tO imprOve Water Quality in u.s. cities
BOB perciasepe, epa deputy administratOr
press release – OctOBer 28, 2011

80 | Massachusetts’s Water Infrastructure: Toward Financial Sustainability
R o a d m a p t o a s u s t a i n a b l e f u t u r e
45 million tons of greenhouse gas to the atmosphere annu-ally.75 Energy use in future years is expected to increase due to increased populations and more stringent regulations.76 As regulation evolves with respect to nutrients and emerging contaminants like pharmaceuticals and personal care products in our water supplies, the treatment and associated energy use are expected to increase.
Energy costs have a huge impact on communities. EPA estimates that drinking water and wastewater plants are typically the largest energy consumers in a municipality—accounting for 30-40% of the total energy consumed by a municipality. Two studies in 2007 put that figure as high as 55%.77 DEP estimates that in the state of Massachusetts, towns spend approximately $150 million per year in electrical costs to treat 662 billion gallons of wastewater and drinking water. The good news is that many studies have estimated potential savings in energy costs for these same utilities in the range of 15-30%.78
With the growth in renewable energy options and new and emerging water technologies that provide reduced energy usage, there are significant opportunities to upgrade existing facilities to be more energy efficient and generate long-term savings. The Consortium for Energy Efficiency has issued guidance for water and wastewater facilities, noting that some of the best opportu-nities for energy efficiency (and cost efficiency) gains are present when a facility is upgraded, expanded, or being built new. These types of projects offer opportunities to thoroughly integrate energy efficiency into the operations of the plant.
The Massachusetts’s DEP and local strategic partners are already working together to assist with the implementation of efficiency and renewable energy projects that will result in substantial energy savings for all the targeted facilities. In December of 2007, Massachusetts Executive Office of Energy and Environ-mental Affairs and the Department of Environmental Protec-tion, in cooperation with the Dept. of Energy Resources, EPA, UMass, the Mass Renewable Energy Trust, the Consortium for Energy Efficiency and major gas and electric utilities, launched an energy management pilot for drinking water and wastewater treatment facilities with the goal of reducing the amount of energy consumed by water treatment by 20%, reducing green-house gas emissions, and saving communities money.
Next generation designs come from a different engineering model: Use treat, store, and reuse water efficiently on a smaller scale, and blend these designs into restorative water hydrologies.
What will it take for our country to get on the path toward sustainable water infrastructure? For a start, we need to restore research funding so that we’re leading the development of new technologies and capturing jobs and profits in the global marketplace. We should provide tax incentives that encourage builders, architects, and homeowners to adopt and implement these systems.”
valerie nelsOn in Water envirOnment FederatiOn magazine—
Viewpoint: truly SuStainable water infraStructure septemBer 2008 vOlume 20 numBer 9
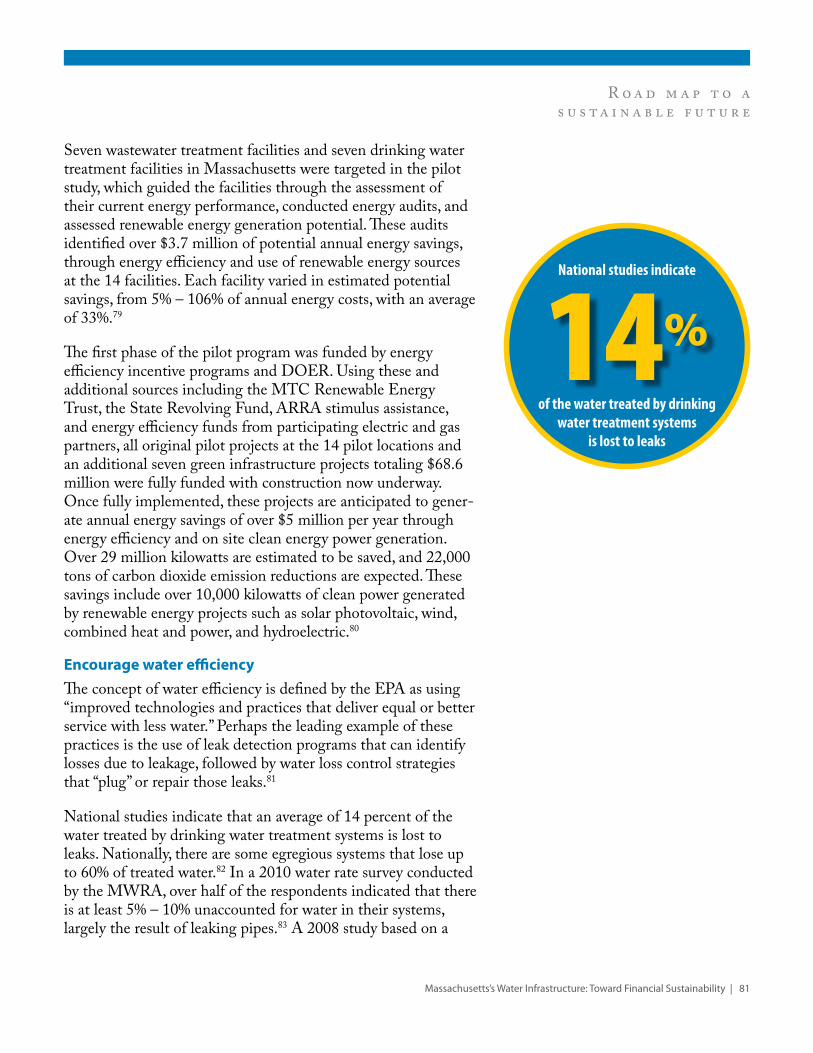
Massachusetts’s Water Infrastructure: Toward Financial Sustainability | 81
R o a d m a p t o a s u s t a i n a b l e f u t u r e
Seven wastewater treatment facilities and seven drinking water treatment facilities in Massachusetts were targeted in the pilot study, which guided the facilities through the assessment of their current energy performance, conducted energy audits, and assessed renewable energy generation potential. These audits identified over $3.7 million of potential annual energy savings, through energy efficiency and use of renewable energy sources at the 14 facilities. Each facility varied in estimated potential savings, from 5% – 106% of annual energy costs, with an average of 33%.79
The first phase of the pilot program was funded by energy efficiency incentive programs and DOER. Using these and additional sources including the MTC Renewable Energy Trust, the State Revolving Fund, ARRA stimulus assistance, and energy efficiency funds from participating electric and gas partners, all original pilot projects at the 14 pilot locations and an additional seven green infrastructure projects totaling $68.6 million were fully funded with construction now underway. Once fully implemented, these projects are anticipated to gener-ate annual energy savings of over $5 million per year through energy efficiency and on site clean energy power generation. Over 29 million kilowatts are estimated to be saved, and 22,000 tons of carbon dioxide emission reductions are expected. These savings include over 10,000 kilowatts of clean power generated by renewable energy projects such as solar photovoltaic, wind, combined heat and power, and hydroelectric.80
Encourage water efficiencyThe concept of water efficiency is defined by the EPA as using “improved technologies and practices that deliver equal or better service with less water.” Perhaps the leading example of these practices is the use of leak detection programs that can identify losses due to leakage, followed by water loss control strategies that “plug” or repair those leaks.81
National studies indicate that an average of 14 percent of the water treated by drinking water treatment systems is lost to leaks. Nationally, there are some egregious systems that lose up to 60% of treated water.82 In a 2010 water rate survey conducted by the MWRA, over half of the respondents indicated that there is at least 5% – 10% unaccounted for water in their systems, largely the result of leaking pipes.83 A 2008 study based on a
14%of the water treated by drinking
water treatment systems is lost to leaks
National studies indicate

82 | Massachusetts’s Water Infrastructure: Toward Financial Sustainability
R o a d m a p t o a s u s t a i n a b l e f u t u r e
review of Massachusetts Department of Environmental Protec-tion Annual Statistical Reports (ASRs) filed by local water districts, suggests that Massachusetts drinking water utilities are losing over 1 billion gallons of water per year due to leaking pipes and infrastructure, at a significant cost to the Com-monwealth’s ratepayers. This water loss is the result of over 2,300 leaks identified by water system during 2006.84
Treated water that leaks from pipes is water that the public has paid to treat, but for which it derives no value. This water is deemed “unaccounted for water”. Reducing unaccounted for water can not only save water, it can also reduce water withdraw-als from our aquifers and reduce energy, pumping, and treatment costs.
The EPA advocates for water-related utilities to use both “sup-ply side best management practices” such as accurate meters, leak detection, and repair of leaks as well as “demand side best management practices” such as rates that encourage conservation and public education programs.
The problem is slightly different on the wastewater side of the equation. Sewer pipes are meant to transport wastewater from sanitary fixtures such as toilets, sinks, bathtubs, dishwashers, washing machines, and showers. Every gallon of water that enters a wastewater treatment plant must be treated, which costs money—money for energy, chemicals, personnel, transportation.
The term inflow and infiltration describes the flow of either stormwater or groundwater into sewer mains and pipes. “Inflow” generally refers to stormwater that enters into separate sanitary sewer systems through drains, downspouts, pumps, and streams. During a rain event, stormwater entering a sewer system can fill it quickly above its capacity, leading to sewer backflows, flooding, or releases of contaminated water into surface water bodies. “Infiltration” generally refers to groundwater that enters sanitary sewer systems through cracks and leaks in pipes, mains, and manholes.
If a city wastewater plant experiences a doubling of the load on the system during a rainstorm, the infrastructure must be designed to accommodate that increased flow and pay to build and process that flow. These costs will be paid by the ratepayers.
WATER REUSEIn 2000, MassDEP issued Interim Guidelines on Reclaimed Water to guide the permitting and operation of water reuse facilities. In 2009 DEP promulgated 314 CMR 20.00: Reclaimed Water Permit Program and Standards, which now regulate reclaimed water systems and establishes requirements for the use, sale, and distribution of reclaimed water.
From the start, DEP has endeavored “to encourage water reuse in Massachusetts while continuing to protect public health.”
• The public must be told that reclaimed water is in use.
• Wastewater treatment plants producing reclaimed water are required to maintain a high level of treatment with redundant mechanical systems and backup power.
• Comprehensive monitoring of both the wastewater effluent and the groundwater is required to demonstrate that standards are met.
MassDEP has approved about a dozen projects since issuing its Interim Guidelines in 2000, including Gillette Stadium, the Wrentham Village Premium Outlets, watering at golf courses, and reuse at manufacturing and office facilities.
excerpts FrOm the dep WeBpage
http://www.mass.gov/dep/water/wastewater/wrfaqs.htm
and 314 CMR 20.00 http://www.mass.gov/dep/
service/regulations/314cmr20.pdf

Massachusetts’s Water Infrastructure: Toward Financial Sustainability | 83
R o a d m a p t o a s u s t a i n a b l e f u t u r e
Investments made to decrease inflow and infiltration will result in direct savings to the Commonwealth.
The reduction of unaccounted for water in water supply systems and inflow and infiltration in sanitary sewer systems require sustained, long term strategies, but these strategies do work. The first step is to measure the problem to monitor flow at various locations within the system. Technologies with dyes and/or remote monitoring devices can be used to look for cracks or damage.
Encourage water reuseBecause water supplies cannot be continuously expanded to accommodate new development, the challenges associated with stressed river basins, the expense of treating water, increasingly strict permitting standards and other challenges, the promo-tion of water reuse must be a significant policy priority. The reclamation of treated wastewater for non-potable uses such as landscaping, industrial processes and toilet flushing could offer water systems ways to improve both environmental and financial outcomes.
Reusing water can be helpful for a number of reasons. Reusing water can reduce environmental stress in sensitive river and stream basins, reduce the amount of wastewater that needs to be disposed of, provide industrial users with a low cost supply of water, reduce the community impact of larger developments, and reduce treated wastewater discharges into water bodies.
Reused water can be used for a number of purposes across a broad spectrum of interests. Reused water can be used for the irrigation of public parks and recreational centers, athletic fields and school yards, for vehicle washing facilities, fertilizer produc-tion, concrete production, fire protection, for industrial cooling systems, for agricultural purposes and for groundwater recharge. Many of these potential uses could become revenue positive endeavors for systems that approach water use holistically.
Encourage investments using watershed-based resource allocationWatershed-based planning and permitting is an approach that encourages a holistic watershed analysis to provide a framework for evaluating all stressors within a hydrologically-defined drain-age basin, rather than viewing individual sources one at a time.
Reused water can be used for the irrigation of public parks and recreational centers, athletic fields and school yards

84 | Massachusetts’s Water Infrastructure: Toward Financial Sustainability
R o a d m a p t o a s u s t a i n a b l e f u t u r e
Many, including EPA, recognize a number of positive outcomes from watershed-based permitting, including opportunities to achieve more environmentally effective results and to reduce the cost of improving the quality of the nation’s waters.85
The EPA strongly encourages watershed-based approaches in its NPDES permitting as an “innovative tool for achieving new efficiencies and environmental results.”86 The concept of utilizing a watershed or river basin approach to water resources management is not a new one. It is the principal basis for water resources management in the British Isles, and was recognized as a key concept for management of the Clean Water Act in Section 209 of the Act. Section 208 of the Act also encouraged regionalization and area-wide planning. Massachusetts had watershed based planning in the 1990s.
Unfortunately, under many of our current regulatory frame-works, including federal EPA water and wastewater programs, enforcement and responsibility is directed at political boundaries (municipalities) rather than on watersheds, making it difficult to implement regional solutions which can be the most effective and cost-effective. Lack of watershed planning can result in money being spent in ways that are not of the greatest value to either the public or the environment.
In 1972, when the Clean Water Act was passed, the tools available to planners were limited, as was our ability to model water quality and to scientifically determine the impacts of actions on the environment. As a result, in the early years of the Clean Water Act, water quality criteria were set based on broad concepts of what was considered necessary to improve our water resources. Principal water quality concerns were related to oxygen depletion, suspended solids, toxicity, and aesthetic issues such as color and turbidity.
As the federal Clean Water Act approaches its fortieth anniver-sary, many basic wastewater concerns have been dealt with, and the issues before us are more complex ones—such as developing site specific science-based control for nutrients and how best to address difficult water quality concerns through treatment. Concepts such as reuse of treated water, recharging water locally, and sustainable, decentralized treatment innovations are gaining importance, while permitting has expanded to include manage-ment and mitigation of stormwater.
The EPA strongly encourages watershed-based approaches in its NPDES permitting

Massachusetts’s Water Infrastructure: Toward Financial Sustainability | 85
R o a d m a p t o a s u s t a i n a b l e f u t u r e
Today we have more direct access to environmental data and have made quantum leaps in our ability to model the science. These advances allow us to evaluate a range of choices with more confidence than in the past. Our ability to measure the param-eters of environmental concern and to determine their impacts has evolved. Methods for testing and monitoring water quality have been improved and detection levels for many contaminants have been reduced, so that we are able to identify minute quanti-ties of substances that may or may not affect the aquatic environ-ment. This tremendous surge in information must be evaluated carefully to avoid subjective conclusions and too hastily drafted regulatory actions. To effectively manage our environment, data must be scientifically evaluated to identify whether impacts actually exist and how best to mitigate those that do.
The Commission believes that there is much to be gained in using watershed frameworks to determine the most effective ways to meet environmental and public health goals with our limited public dollars. The Commonwealth should return to the watershed based planning approach envisioned in the Clean Water Act.
There is a broad range of models for what a new Massachusetts watershed or river basin planning approach would look like. Many variables, such as the role of stakeholders in the process, the role of the DEP and EPA, the integration of planning into the existing regulatory and financing (SRF) structure, the inte-gration of science, the collection and monitoring of data, need to be determined.
From a financial perspective, river basin planning should be comprehensive and aimed toward setting affordable, prioritized, coordinated goals that follow a logical sequence. The planning should include area-wide management objectives that include all aspects of water quality needs within a framework that takes into account all stakeholders. Such integrated water planning should include all water infrastructure needs from water main and sewer repair and replacement to stormwater management, agricultural requirements and new treatment facilities. Goals and priorities for completion and management of these facilities should be realistically set based on science that shows direct contribution to water quality improvement and the financial capability of the communities they serve.
From a financial perspective, river basin planning should be comprehensive and aimed toward setting affordable, prioritized, coordinated goals that follow a logical sequence

86 | Massachusetts’s Water Infrastructure: Toward Financial Sustainability
R o a d m a p t o a s u s t a i n a b l e f u t u r e
Utilize appropriate decentralized infrastructure: There is a spectrum of decentralized infrastructure technologies and approaches—some with a proven track record and others that are emerging—that have the potential to play an important role in managing water in a financially and/or environmentally sustainable way. These technologies and approaches foster such sustainable goals as encouraging water conservation or recharging of treated water to keep water local.
Some of these approaches are scaled at the household level, such as urine diverting toilets, rain gardens, and semi-permeable surfaces, and can be encouraged or incentivized through local building codes to reduce the amount of water entering the centralized stormwater system in a community. Others are scaled at a neighborhood or large building level, setting up shared systems for on-site, rechargeable treatment of wastewater or the reuse of treated water for certain purposes.
Across the country and the world, engineers and planners are using these decentralized technologies alone or to complement centralized systems, in order to meet local, statewide, and federal water policy goals. Examples of these kinds of technologies include those mentioned above as well as locally available composting services, permeable reactive barriers and applied aquaculture among others.
In some cases decentralized systems relying on home-based or small scale alternative technologies may achieve results comparable or better than traditional centralized systems and at reduced cost. For example, urine-diverting toilets can effectively remove 80% of nitrogen from a household’s wastewater. The Commission recommends that the Commonwealth encourage the adoption of technologies that can conserve water and protect the environment, particularly in fragile or at risk areas. The Commonwealth should work to help educate the public about what water conservation technologies are available by raising awareness about the US EPA’s water sense partnership program, and perhaps offering state level evaluation and incentives for environmentally friendly products in the same way as the suc-cessful energy star program.
THE CITY OF PHILADELPHIAhas proposed a Green City, Clean Waters strategy to improve the city’s water resources by “greening” at least one third of the existing impervious cover in their Combined Sewer System drainage areas over the next 25 years. These “greened acres” will be designed to filter or store the first inch of rainwater runoff each time it rains.
It is estimated that one acre of land receives one million gallons of rainfall each year. Where the land is currently impervious, it all runs into the sewer and becomes polluted. It is estimated that a Greened Acre will stop 80-90% of this pollution from occurring.
The Philadelphia Water Department intends to invest approximately $2.4 billion over the 25 year period ($1.2 billion in 2009 dollars).
http://www.phillywatersheds.org/doc/GCCW_AmendedJune2011_LOWRES-web.pdf

Massachusetts’s Water Infrastructure: Toward Financial Sustainability | 87
R o a d m a p t o a s u s t a i n a b l e f u t u r e
Increase regulatory flexibility to better direct funding to projects that deliver the highest public benefitThe Commission believes that there is room for improvement in permitting and regulation so that we utilize our scarce resources for the projects and approaches that will yield the highest public benefit.
Water resource projects often require review and/or approval of numerous regulatory authorities at local, state, and federal levels of government. Often these programs have competing or con-flicting environmental priorities that can hinder the timely, cost effective delivery of projects. The Commission believes that these program tradeoffs are neither simple nor insignificant. At the Commission’s hearings, communities expressed frustration with the silos of decision making and regulation, limited time frames for permits, and the lack of coordination between projects, all of which can lead to poorly sequenced implementation of related projects or even the selection of a solution that will inadvertently negatively impact another problem.
For example, increased energy requirements are not always weighed when choosing the best approaches to water or waste-water treatment. An approach that might benefit receiving water quality (for example, extremely low nutrient limits) could also require significantly increased energy use or produce increases in chemical waste solids due to power and/or chemical use. Con-versely, an approach that would decrease energy use (for example, the use of gravity flow rather than a wastewater pump station) might result in negative impacts to a wetland resource due to the gravity pipeline alignment. The present regulatory process is not well suited to weighing these tradeoffs, which can be complex and significant.
The Commission believes that we need to look at regulation more holistically so that we are purposeful in funding projects to give us the highest public benefit. A municipality, watershed or region should be encouraged to build infrastructure that is selected, sequenced, and phased to optimize the use of resources. It should be encouraged to use scarce resources in the most efficient way possible rather than be required to meet compart-mentalized, rigid requirements.
…new regulations, energy, climatic, and environmental issues will require significant new investments. Meeting these challenges requires either a significant new investment in infrastructure, or a paradigm shift in our approach to urban water resources. …
Today, the Philadelphia Water Department (PWD) has a unique opportunity to address modern challenges to managing our water resources and infrastructure in an innovative way. By transforming Philadelphia into a 21st Century Sustainable City, we can move toward a realization of Penn’s vision for a vibrant, healthy, and green city. “
green city, clean Water repOrt, june 2011: http://www.phillywatersheds.org/doc/GCCW_
AmendedJune2011_LOWRES-web.pdf
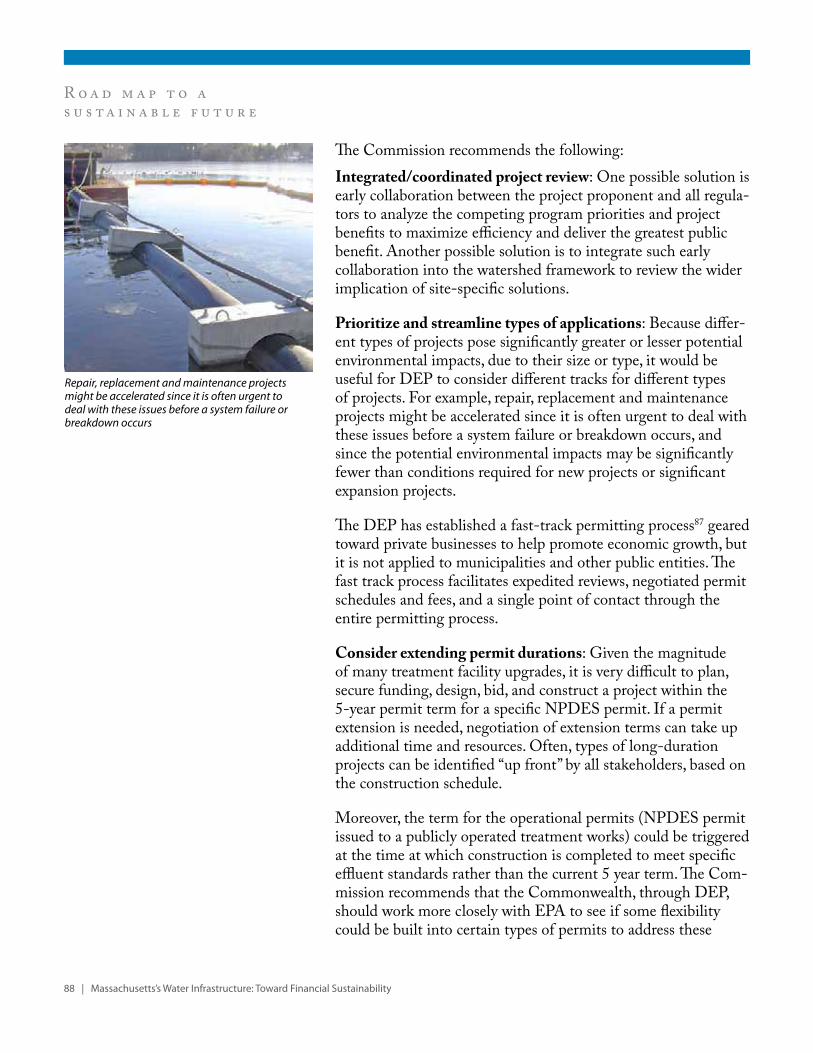
88 | Massachusetts’s Water Infrastructure: Toward Financial Sustainability
R o a d m a p t o a s u s t a i n a b l e f u t u r e
The Commission recommends the following: Integrated/coordinatedprojectreview: One possible solution is early collaboration between the project proponent and all regula-tors to analyze the competing program priorities and project benefits to maximize efficiency and deliver the greatest public benefit. Another possible solution is to integrate such early collaboration into the watershed framework to review the wider implication of site-specific solutions.
Prioritizeandstreamlinetypesofapplications: Because differ-ent types of projects pose significantly greater or lesser potential environmental impacts, due to their size or type, it would be useful for DEP to consider different tracks for different types of projects. For example, repair, replacement and maintenance projects might be accelerated since it is often urgent to deal with these issues before a system failure or breakdown occurs, and since the potential environmental impacts may be significantly fewer than conditions required for new projects or significant expansion projects.
The DEP has established a fast-track permitting process87 geared toward private businesses to help promote economic growth, but it is not applied to municipalities and other public entities. The fast track process facilitates expedited reviews, negotiated permit schedules and fees, and a single point of contact through the entire permitting process.
Considerextendingpermitdurations: Given the magnitude of many treatment facility upgrades, it is very difficult to plan, secure funding, design, bid, and construct a project within the 5-year permit term for a specific NPDES permit. If a permit extension is needed, negotiation of extension terms can take up additional time and resources. Often, types of long-duration projects can be identified “up front” by all stakeholders, based on the construction schedule.
Moreover, the term for the operational permits (NPDES permit issued to a publicly operated treatment works) could be triggered at the time at which construction is completed to meet specific effluent standards rather than the current 5 year term. The Com-mission recommends that the Commonwealth, through DEP, should work more closely with EPA to see if some flexibility could be built into certain types of permits to address these
Repair, replacement and maintenance projects might be accelerated since it is often urgent to deal with these issues before a system failure or breakdown occurs

Massachusetts’s Water Infrastructure: Toward Financial Sustainability | 89
R o a d m a p t o a s u s t a i n a b l e f u t u r e
issues, including the possible use of the EPA’s recently published policy entitled “Achieving Water Quality Through Integrated Municipal Stormwater and Wastewater Plans”, dated October 27, 2011.
Co-benefits: The term co-benefits refers to all the positive outcomes of a strategy or action. Water infrastructure can be designed to provide a number of environmental and economic benefits in addition to improving water quality: by facilitating recharge of ground water and surface water supplies, providing cleaner emissions (including the reduction of carbon emissions), reducing the temperature of emissions, reducing energy demand, reducing flooding, and providing community benefits such as improved aesthetics, improved human health, and additional recreational and wildlife areas.
Regulations should be amended as needed so that such addi-tional benefits can be considered. Such flexibility should include optimization and integrated timing of construction, alternative management and financing mechanisms, and phasing of pilot projects and adaptive management. Examples of such flexibility include but are not limited to:
• Consideration of energy and total lifecycle costs as a factor in treatment choices
• Sequencing of water, wastewater, and stormwater projects to allow highest priority projects to be started first
• Regulations that reflect the evolution in management to involve more private companies and the possible participa-tion of homeowners and other private property owners
• Flexibility of planning and permitting to accommodate the uncertainty of breakthrough technologies, changing climate conditions, and other factors
• Consideration of fast tracking certain permits (repair, maintenance, and replacement for example)
• Consideration of longer permit durations
Water infrastructure can be designed to provide a number of environmental and economic benefits

90 | Massachusetts’s Water Infrastructure: Toward Financial Sustainability
R o a d m a p t o a s u s t a i n a b l e f u t u r e
STRATEGY#6: PROMOTE INNOVATIONMany cities and towns are working to adopt sustainable principles as they manage their water systems, encourage energy and water efficiency, and approach problems such as drought, seasonal flooding, climate-induced changes, low flows, nutrient loading, and mitigating combined sewer overflows. Increasing attention is being given to the design and development of innovative water technologies and approaches that reduce waste and are more consistent with environmental and fiscal sustain-ability. These technologies are rapidly evolving from an ideal into reality, and may offer solutions that optimize environmental goals, make economic sense, and address social inequities.
The Commission heard testimony about a wide range of state of the art management practices and innovative technologies that are emerging through entrepreneurial efforts, government support, and creative partnerships. These solutions are often hybrid approaches that optimize new and existing infrastructure. Some models are partnerships with private capital investments.
The best of these practices and technologies protect the public health, are environmentally more effective than traditional systems, and also result in life cycle operating cost savings. Some highlight technologies and approaches that emphasize keeping water local. Others integrate wastewater reuse in large develop-ments or building codes. Many mimic natural systems. Some convert waste products generated by water treatment processes into marketable products which generate income. Others are based on natural systems and processes that minimize water extraction and energy consumption, contribute to water and soil health, and support livable, healthy, and sustainable communities.
Many of these approaches and technologies are being tested “on the ground” at different scales. For example, the MWRA has been a leader in the use of innovative and cost saving technologies such as selling processed sewage waste as fertilizer and capturing energy through methane recapture and harnessing energy from the flow of wastewater.
Some innovation is being tested in targeted pilot studies. For example, the town of Grafton is piloting a bio-remediation technology to treat contaminated water and sediments in the Fisherville canal using mycelial and bacterial digestion.88
PILOT PROJECT LEADS TO A COST-SAVING OPERATION The Town of Concord was aware that stringent new phosphorus limits were being considered that could require costly upgrades to its wastewater treatment plant. The town collaborated with Cambridge Water Technology, the developers of an innovative phosphorus reduction technology, (magnetically enhanced coagulation or CoMag). A pilot demonstration project was installed at the Concord treatment plant, treating 100 gallons per minute, achieving positive results. No operational costs were borne by the town during the demonstration project. Eventually the Town incorporated the technology into its 20 year old wastewater treatment facility-- the first full scale CoMag tertiary treatment installation in the world.
“As operation has continued, the system has reached low phosphorus levels at a wide range of flow rates and influent loads. The full-scale system is operating better than anticipated based on pre-design data. The CoMag system has immediately proven its ability to meet Concord’s upcoming phosphorus limits as well as the lower limits required in many NPDES permits nationwide, while providing additional benefits relating to a variety of other effluent quality parameters.”
elena prOakis ellis and alan h. cathcart
“selectiOn, installatiOn, startup and testing OF the WOrld’s First Full scale cOmag phOsphOrus
reductiOn tertiary treatment system.”

Massachusetts’s Water Infrastructure: Toward Financial Sustainability | 91
R o a d m a p t o a s u s t a i n a b l e f u t u r e
Other ideas are being successfully utilized in schools and com-mercial buildings as part of the emerging “green technologies” innovative effort. For example, the Whitman-Hanson Regional High School included a 20,000 gallon underground storage tank to collect rainwater from the roof surfaces for use in flushing toilets. The Cape Cod Community College in West Barnstable utilized a system that combines water reduction and water reuse features. These sustainable practices were estimated to reduce overall water consumption at this public building by 85% compared to a standard system.89
However, some communities, districts, and authorities find it difficult to take the plunge and invest scarce dollars into promis-ing, but untested, approaches. The Commission recognizes that there are many barriers to the use of these innovative approaches or technologies, and believes that more needs to be done to encourage and facilitate them.
Finding funding for the piloting of these emerging approaches can be challenging. Some communities have utilized funding sources dedicated to green design, water sustainability, or building construction and renovation projects. There are other funding streams available for innovative, decentralized, site-level water infrastructure and building technologies through programs administered at the state and federal level.90
Nevertheless, the extraordinary pressures on the limited resources available for water infrastructure have the potential to squeeze out new ideas.
In order to reduce the risks associated with innovation, the Commission has made a number of recommendations to review regulatory, financial, and legal obstacles, including:
• Allocate resources for programs that mitigate the inherent risks in innovation by supporting pilot projects, proof of concept projects, and new technology
• Provide technical assistance to communities interested in innovative approaches
• Reduce regulatory barriers to innovation , including possible obstacles in procurement laws
• Implement alternative analyses that put innovative solutions on an equal footing with traditional approaches
IN NOVEMBER OF 1997,on the 25th Anniversary of the Clean Water Act, the Massachusetts Clean Water Council issued a report that summarized the extraordinary progress made in the Commonwealth over the 25 years since the passage of the Act in 1972. The report found that, through a combination of programs, including construction of municipal and regional wastewater plants, pretreatment programs for industrial dischargers, and the control of industrial wastes, millions of pounds of pollutants were prevented from reaching Massachusett›s rivers. Prior to 1972, large sections of rivers in Massachusetts were “virtually unusable”. In 1972, only 28 percent of the monitored rivers and streams in the Commonwealth supported fishing and swimming. By 1997, that number was 70 percent. Similar improvements were gained in our lakes and coastal waters.
The STaTe of The WaTerS in MaSSachuSeTTS: aSSeSSing ProgreSS and SeTTing PrioriTieS
massachusetts clean Water cOuncil, nOvemBer 1997

92 | Massachusetts’s Water Infrastructure: Toward Financial Sustainability
R o a d m a p t o a s u s t a i n a b l e f u t u r e
• Develop managed process to reduce economic risks related to use of innovative technologies. Invest in Massachusetts as a hub of innovation in the field of water, wastewater, and stormwater management and technology
• Harness the state’s educational strengths to train engineers, scientists, researchers, and workers to be at the forefront of innovative water management
The Commission also recommends that the Commonwealth invest in Massachusetts as a hub of innovation in the field of water, wastewater, and stormwater management and technol-ogy. Massachusetts is in an excellent position to be a leader in developing and utilizing innovative, sustainable solutions that improve water quality and provide cost effective ways to address our infrastructure needs. This is a sector with great promise for new jobs at different levels of expertise.
As a Commonwealth, we should build on our long tradition of leadership in technology, engineering, research, and development to keep Massachusetts in the forefront of innovation. Just as twentieth century investments in water and wastewater treat-ment technology made enormous progress in addressing the issues of the day, the Commission believes that Massachusetts is poised to meet the challenges of twenty-first century water infrastructure.
The Commonwealth should harness the state’s educational strengths to train engineers, scientists, researchers, and workers to be at the forefront of innovative water management across the country.
Finding solutions to today’s water resources challenges opens doors for Massachusetts—whose academic, professional, and business leadership is poised to make our state a hub of innova-tion for water infrastructure. The state can play a major role in capturing the benefits of emerging technology.
The Commission recommends that we build on existing professional and academic collaborations and encourage public/private partnerships with universities, colleges, and trade schools, NGOs, agencies, and the private sector.91
As a Commonwealth, we should build on our long tradition of leadership in technology, engineering, research, and development to keep Massachusetts in the forefront of innovation
Massachusetts’s Water Infrastructure: Toward Financial Sustainability | 93
R o a d m a p t o a s u s t a i n a b l e f u t u r e
It is important to communicate with stakeholders such as residents, businesses, community leaders, and institutions about the true cost of supplying water, wastewater, and stormwater services
STRATEGY #7: CONTINUE THE WORK OF THE COMMISSION & EDUCATE THE PUBLICWith the filing of this report, the Commission’s work will be done. But the task of addressing the problem is just beginning. The Commission recommends several initiatives to guide the Commonwealth in collecting necessary data, raising public awareness, and building a coalition of stakeholders. Most importantly:
• Stakeholders and agencies should create a coalition to continue advocating for the policies and recommendations in this report.
• The Commission recommends that the state supplement the current data available on water-related infrastructure fund-ing by conducting an asset-based analysis based on a survey of a statistically significant and regionally diverse sample of Massachusetts communities in order to provide a baseline of information to evaluate the success of efforts to meet the water infrastructure needs of the Commonwealth. This study will provide a baseline of information on costs and invest-ments in Massachusetts.
• To gain and sustain public support for water infrastructure investments, and to convince voters and elected officials to raise appropriate revenues, it is important to communicate with stakeholders such as residents, businesses, community leaders, and institutions about the true cost of supplying water, wastewater, and stormwater services. The true cost includes not just direct costs, but also hidden costs and externalities over the lifetime of an asset.


Massachusetts’s Water Infrastructure: Toward Financial Sustainability | 95
Recommendations1.Createacoalitiontocontinueadvocacyfortherecom-
mendationsoftheCommission2.Fundanasset-basedanalysisoftheGapbetween
projectedneedsandrevenuesThe Commission recommends that the state supplement the current data available on water-related infrastructure funding by conducting an asset-based analysis based on a survey of a statis-tically significant and regionally diverse sample of Massachusetts communities in order to provide a baseline of information on costs and investments in Massachusetts to evaluate the success of efforts to meet the water infrastructure needs of the Com-monwealth. This study will provide a baseline of information on costs and investments in Massachusetts.
3.Raisepublicawarenessofthetruevalueandcostofwater-relatedservices
To gain and sustain public support for water infrastructure investments, and to convince voters and elected officials to raise appropriate revenues, it is important to communicate with stakeholders such as residents, businesses, community leaders, and institutions about the true cost of supplying water, wastewa-ter, and stormwater services. The true cost includes not just direct costs, but also hidden costs and externalities over the lifetime of an asset.
a. Identify a lead Massachusetts agency to develop and distribute educational materials.
b. Allocate funding as needed to agencies such as the Divi-sion of Local Services, EOEEA, DEP and/or the Water Pollution Abatement Trust for working with stakeholders to develop a campaign and educational program on the true cost of water infrastructure, and the implications of inaction. Audiences should include both residents and public officials. Materials should explain the need to sup-port capital planning, asset management, wise investments, and adequate rates to support our water infrastructure. In developing the message, consult with appropriate agencies, trade organizations, advocates, environmental groups, local districts and authorities. The US EPA should also be encouraged to partner in this endeavor.
Continue the work of the commission
Educate the public

96 | Massachusetts’s Water Infrastructure: Toward Financial Sustainability
R e c o m m e n d a t i o n s
c. Charge agencies and all stakeholders, including munici-palities, districts, and authorities, to get out the message through appropriate media and public service outreach. Investigate and utilize opportunities for public/private partnerships for education and outreach.
d. Charge appropriate agencies to advocate for asset manage-ment, capital planning, and enterprise accounts for com-munities.
A review of Massachusetts water and sewer rates suggests that a significant portion of the infrastructure Gap can be met by consistent, moderate rate increases over time, including set-asides for long-term capital investments. However, additional state and federal subsidies, beyond those currently available, will still be needed to compensate for decreases in federal assistance, address escalating debt service, subsidize projects that would be otherwise unaffordable, such as wastewater projects on Cape Cod, and assist communities with limited revenue generating capacity due to lower household incomes.
4.AdvocateforincreasedfederalfundingIt is critical to make sure that water infrastructure financing receives a growing share of the federal budget. All parties interested in sustainable investments in water infrastructure need to redouble their efforts at influencing the debate in Congress in order to maximize available funding to Massachusetts.
a. Advocate with Congress for maximizing funding for existing critical accounts:
– State Revolving Funds for Safe Drinking Water Act and Clean Water Act
– USDA Rural Development Water Infrastructure Program
– Key energy and Sustainability Accounts with impact on water-related infrastructure investments
b. Advocate with Congress to create new programs and funding:
– New tax credits for research and development and innovation in water technology
Increased Funding

Massachusetts’s Water Infrastructure: Toward Financial Sustainability | 97
R e c o m m e n d a t i o n s
– New tax credits and accelerated depreciation for inno-vative stormwater solutions
– New subsidies to assist communities with full cost rates
5.IncreaseavailableresourcesatthestatelevelMassachusetts has had some successful programs to assist municipalities, authorities, and districts meet the high costs of water investments. Some of these sources have been cut in recent years and should be restored.
The Commonwealth has one of the most highly leveraged SRF programs in the country. It is critical that the Legislature continue to fund the state share of this crucial fund.
It is also important to find additional sources of revenues to address the identified Gap in resources and the growing need for water-related infrastructure investment.
a. Maintain strong annual funding levels for the Common-wealth’s share of the State Revolving Funds in the Water Pollution Abatement Trust
b. Maintain the leveraging capability of the Water Pollution Abatement Trust
1. Maintain the leveraging capacity of the trust by utilizing the 2% interest rate as the standard interest rate for most loans
2. Consider offering lower interest rates (under 2%) for projects that meet certain objectives for afford-ability, environmental sustainability, inter-municipal cooperation, nutrient reduction, etc.
3. Consider expansion of nutrient deficiency 0% loan program (ten year sunset) for other priorities, particularly stormwater mitigation (CSO)
4. Consider ways to fund design/engineering expen-ditures retroactively through the SRF if the project ultimately goes to construction
c. Create a new, $200 million dollar a year Trust Fund within the Water Pollution Abatement Trust. The Commission recommends that the Legislature appropriate $200 million
Increased Funding
98 | Massachusetts’s Water Infrastructure: Toward Financial Sustainability
R e c o m m e n d a t i o n s
to the new Trust Fund each year from the General Fund. If new revenues need to be raised in order to fund the Trust, the Commission favors sources with a nexus to the water investment issue, such as revenue from a new Bottle Bill, or new fees on pollutants such as fertilizers and pesticides. There was considerable discussion by the Commission of imposing a state-wide surcharge on water and sewer rates to fund the new trust, but because the Commission also favors a strategy of full-cost pricing in the setting of rates, this could be an unfair reliance on local rate payers to address an issue that has national and state-wide implications. The use of such a surcharge would need further consideration.
At least $200 million dollars annually should be appropriated, and the funding should be put into a dedicated trust without risk of being reallocated in the state budget process to assure the long-term sustainability of resources. This new Trust Fund will be used for:
1. Direct support for water infrastructure to be deposited into their enterprise funds and to be used for capital investments and asset management that will reduce the infrastructure spending Gap in each community in a sustained and predictable way. (The Commission envisions this annual municipal payment to be similar to the “Chapter 90 model” currently used to support highway investments)
2. A program of grants and 2% loans, directed toward a diverse set of needs including planning, design, and construction, assistance with cost-benefit analysis, principal forgiveness, additional debt relief, and funding to encourage research and development
Access to these new funds should be structured to incent municipalities, authorities, and districts that adopt best manage-ment practices in full cost pricing, financial management, asset management, and environmental sustainability, and use watershed-based solutions and regional approaches.
The program should include provisions for communities without existing utilities or with utilities that serve only a small fraction of the municipal population. Many of these communities are facing enormous pressures to address environmental or public
Increased Funding

Massachusetts’s Water Infrastructure: Toward Financial Sustainability | 99
R e c o m m e n d a t i o n s
health challenges without a significant rate base or past invest-ment in infrastructure.
d. Assist towns in retiring existing debt. Create a new Debt Relief Fund to replace the existing Commonwealth Sewer Rate Relief Fund, to be funded annually from the General Fund at $50-60 million. This fund should be used to retire existing debt, and should be available to all communities meeting state criteria for water and wastewater debt, including but not limited to MWRA communities.
e. Deposit all Safe Drinking Water Assessments into a dedicated fund in DEP for implementation of the Safe Drinking Water Act
f. Charge the Water Pollution Abatement Trust with finding additional ways to extend the capacity of the Trust
6.Encouragemunicipalities,districts,andauthoritiestocoverreasonablecostsofservice(fullcostpricing)whensettingrates.
The Commonwealth should encourage full cost pricing by all municipal, authority, and district systems. With large needs for investments, communities will need to rely more on rates to cover the full costs of water, wastewater, and stormwater costs.
Transparency, stability, and predictability of rates will play an increasing role in determining the availability and cost of capital for infrastructure needs. A consistent and purposeful rate struc-ture builds credibility with customers and creditors. Encourage communities to adopt full cost pricing:
a. Charge DOR/Division of Local Services to adopt defini-tions, best management practices, and policies as needed for full cost pricing, delineating what direct and indirect costs should be covered by full cost pricing
b. Give funding priority to municipalities, districts, and authorities that utilize full cost pricing
c. Provide funding for the appropriate agencies to provide technical assistance to communities interested in moving toward full cost pricing in rates and to provide rate struc-ture studies
d. Encourage Water Pollution Abatement Trust, DEP, and
Increased Funding

100 | Massachusetts’s Water Infrastructure: Toward Financial Sustainability
R e c o m m e n d a t i o n s
other agencies to offer priority in grants and loans for municipalities, districts, and authorities utilizing full cost pricing
As we address the Water Infrastructure challenge, we recognize that smaller or less affluent communities may have more dif-ficulty adopting full cost pricing. There has been much discussion at the national level as to what level of rates it is reasonable to ask a community to pay, and what happens if a community can’t pay. We need to find ways to pay for water infrastructure investments in all communities while addressing the issue of affordability.
The EPA has never adopted a measure to indicate how much an individual household can pay for water services before they become unaffordable. Rather, EPA has adopted criteria that set affordability benchmarks for system-wide rates collected from all customers of a water system relative to the median household income (MHI) in a service area. The EPA benchmark for afford-ability is set at 2.0 to 2.5 percent of MHI each for wastewater and drinking water.
The Commission recommends based on economic studies and comparison with the cost of other utilities that rates under 1.25% of MHI each for water and sewer service should generally be considered affordable.
7.Institutemeasurestoaddressaffordabilityforlowincomeratepayersandcommunitiesa. Direct WPAT to review SRF policies and identify ways
to address affordability to municipalities and to individual ratepayers. Consider making SRF loan decisions more needs-based using the MHI index, offer more points on SRF applications to less affluent communities, and use MHI benchmark as factor in setting level of funding, interest rate, or principal forgiveness.
b. Include Median Household Income in the selection criteria for SRF loans, grants, interest rates and principal forgive-ness
c. Seek new federal and state support for affordability issues
Address Affordability
Massachusetts’s Water Infrastructure: Toward Financial Sustainability | 101
R e c o m m e n d a t i o n s
It is in the state’s interest to encourage or require that water, wastewater, and stormwater utilities adopt best management practices that encourage financial and environmental sustain-ability.
8.EncourageBestManagementPracticesinassetman-agement,capitalimprovementplans,andenterpriseaccounting
These practices encourage a municipality to plan, operate, and undertake infrastructure investments more effectively. These practices make it easier for rate payers and voters to understand the full life cycle costs of water, sewer, and stormwater services. These practices can also reduce operating costs.
Recommendations: a. Provide funding for DOR/Division of Local Services to
adopt definitions, best management practices, and policies as needed for enterprise funds, asset management, and capital improvement plans
b. Increase funding to relevant agencies to provide technical assistance to communities adopting or interested in adopt-ing best management practices
c. Charge the WPAT to require these best management practices in any municipality, district, or authority that applies for SRF loans
d. Work with DEP and other agencies to require these best management practices prior to application for other state grants, subsidies, or loans
e. Provide accelerated water project permitting to communi-ties that have adopted certain best management practices in asset management, capital improvement plans, and enterprise accounting
f. Create an even playing field for enterprise fund communi-ties by passing legislation that provides for an income tax deduction for enterprise fund utility bills
g. Make it easier for communities, districts, and authorities to adopt enterprise funds by allowing local option without further legislative approval
h. Allow municipalities that have adopted best management
Encourage Best Practices

102 | Massachusetts’s Water Infrastructure: Toward Financial Sustainability
R e c o m m e n d a t i o n s
practices in asset management to utilize state procurement of GPS services
9.Encouragebestmanagementpracticesinstormwatermanagement
Encourage municipalities, districts, and authorities to adopt best practices in stormwater mitigation approaches and technology. Integrate stormwater mitigation best practices broadly into building codes, zoning bylaws, subdivision regulations, and other regulations, so that many stormwater impacts are dealt with on a site by site basis, and so that the costs of mitigation are shared with private owners.
Recommendations: a. Encourage municipalities, districts, and authorities to
finance the public costs of stormwater mitigation through local stormwater utilities meeting state-specified minimum requirements. After consultation with EOEEA, Division of Local Services (DOR) should issue minimum accounting standards for stormwater utilities. These include:
1. enterprise fund accounting 2. capital improvement plan3. integrated water management planning
b. Provide funding for technical assistance through appropri-ate agencies to assist communities wishing to establish stormwater utilities
c. Encourage consistency by making available model bylaws for local regulation of stormwater
d. DEP Encourage pilot projects for stormwater management
10.Improveenergyefficiencyinwaterinfrastructuresystems
a. Charge DEP, Mass Clean Energy Center and/or Green Communities Division to offer technical assistance to municipalities, districts, and authorities (particularly smaller systems) to help improve energy efficiency
b. Encourage DEP and other state agencies to prioritize state funding for energy best management practices
Encourage Best Practices

Massachusetts’s Water Infrastructure: Toward Financial Sustainability | 103
R e c o m m e n d a t i o n s
11.Encourageregionalizingandrightsizinga. Find efficiencies by encouraging inter-municipal and
regional agreements in situations where it will lead to more sustainable and natural use of water resources
b. In order to increase economies, consider the centralized management of decentralized infrastructure on a watershed or regional basis
c. Give funding priority to regional and watershed-based solutions
d. Offer technical assistance to municipalities, districts, and authorities wishing to explore such agreements. Provide funding as needed to Division of Local Services, RPAs, DEP, others.
12.Viewwater,energy,andnutrientsasassets a. Encourage wastewater treatment plants to generate
revenues through heating, cooling, the production of energy, and the possible sale of nutrient products
b. Encourage water re-use
13.Provideguidanceforcommunitiesconsideringpublic–privatepartnerships
Public-private partnership agreements can lead to important efficiencies, but should be structured to protect the public interest.
a. Provide information and guidance needed to negotiate and oversee contracts. Appropriate state agencies should offer assistance to municipal, district, or authority water and wastewater utilities considering or entering into operating contracts with private operators. Such assistance should include:
1. Provision of standard procurement protocols, including model agreements that protect the public’s investment in the system, allow for oversight of the private operator, specify appropriate penalties, and encourage monitoring by the municipality
2. Technical assistance as needed to review the finan-cial, capital, and rate plans of the operator
Encourage Best Practices

104 | Massachusetts’s Water Infrastructure: Toward Financial Sustainability
R e c o m m e n d a t i o n s
b. The possible transfer of ownership of municipal, district, or authority water and/or sewer assets (including pipes, treatment plants, pump stations, and land acquired and needed for water protection purposes) raises many concerns. A review of current regulatory and municipal governance protections that protect public access to these vital services should be completed with recommendations as to any additional safeguards.
14.Projectdelivery:considerchangestocurrentprocure-mentstatutesinordertoreduceimpedimentstocost-effectivewater,wastewater,andstormwatermanagement
Municipalities, districts, and authorities must meet many objec-tives when contracting for planning, design, construction, and operating services from the private sector. They need to assure honest practices, cost-effective use of taxpayer funds, and a fair, open, and competitive process for procuring goods and services.
Some current procurement statutes may provide impediments to the most efficient and cost-effective implementation of complex water and sewer system improvements with anticipated project costs of over 5 million dollars. The Commission urges the Inspector General and the Legislature to update current laws in the following areas:
a. Alternative Delivery: Develop new tools to facilitate new forms of procurement for public design and construction contracts, including design/build (DB), construction man-ager at risk (CMR), multi-factor competitive procurement, and Qualification Based Selection (QBS)
b. Adopt standardized procurement processes for alternate project delivery models that reduce uncertainty on both the public and private side
c. Develop procedures that assure a fair and objective review of competing proposals to seek the best outcome for the public, considering relevant factors such as performance, capital and operating cost, and risk allocation
d. Provide that cost shall not be the only determining factor in the selection of an alternative delivery contractor
Encourage Best Practices

Massachusetts’s Water Infrastructure: Toward Financial Sustainability | 105
R e c o m m e n d a t i o n s
e. Consider minimum requirements for labor agreements, project oversight, safety requirements, and project approval
f. Increase bid limit thresholds to save time and increase efficiency
g. Provide procurement training to municipal officials using model documents and procedures developed by the Inspec-tor General
h. In order to ensure a fair, open, and productive bidding for alternative project delivery methods, consider requiring municipalities to submit their proposed RFP packages and review procedures for approval by the Inspector General and the Attorney General
15.FacilitateuseoftheStateRevolvingFundApplication process:
a. Charge WPAT and DEP to review and amend application process for reductions in paperwork
Loan Administration: b. Encourage WPAT to equalize and distribute payments
throughout the year (monthly or quarterly for both princi-pal and interest)
c. Charge WPAT to work with municipalities, districts, authorities, and engineering firms to increase “user friendliness”
16.Simplifypermittinga. Charge DEP with evaluating the usefulness of extended
permit durationsb. Charge DEP to conduct a regulatory review to identify
ways to streamline permitting processes and identify pos-sible areas where fast track permitting could be effective
c. Encourage/Require early communication among applicants and regulatory parties
d. Allocate resources for a single project coordinator at DEP to provide assistance and coordination in the planning process of a project
e. Charge DEP with evaluating the usefulness of a joint application form among MADEP, USACE, and local conservation commission determinations
Encourage Best Practices
Streamline Administrative and Regulatory Processes

106 | Massachusetts’s Water Infrastructure: Toward Financial Sustainability
R e c o m m e n d a t i o n s
17.Encourageinvestmentsandregulationsthatarealignedwithenvironmentallysustainableprinciples
The Commonwealth must make strategic investments that make the best use of available resources, optimize environmental goals, and make economic sense. Cost benefit analyses should be uti-lized to determine how to achieve the maximum environmental benefit with the available resources. The cost of water treatment can be reduced by taking actions to preserve the quality and quantity of water resources in the Commonwealth.
The Commonwealth must encourage investments and regulations that are aligned with environmentally sustainable principles:
• Promote water conservation• Prioritize solutions that use technologies that are sustainable
environmentally and financially over the lifetime of the assets
• Encourage investments using watershed-based resource allocation
• Encourage more effective management of water resources through long term planning, optimization of resources, and management efficiencies
• Encourage integrated resource management, where “wastes” are viewed as resources from which revenues can be gener-ated
• Prioritize solutions that keep water within its basin while protecting water quality
• Eliminate the release of excessive nutrients in watersheds• Encourage non-structural, decentralized solutions where
appropriate and as part of integrated water management
Recommendations: a. Prioritize SRF funds toward projects that are aligned with
environmentally sustainable principles.b. Pass legislation to ban or limit the use of phosphorous in
products, including fertilizersc. Consider additional regulation to reduce the release of
nutrients
Promote Environmental Sustainability
Massachusetts’s Water Infrastructure: Toward Financial Sustainability | 107
R e c o m m e n d a t i o n s
d. Consider additional regulation of pharmaceutical product disposal and phosphorous disposal
e. Incorporate water sustainability into guidelines for state and municipal facilities, and publicly funded schools, affordable housing and hospitals
f. Review the interim DEP guidelines on reclaimed water to determine whether additional uses can be approved
g. Conduct a study of “decoupling” rates to better align regula-tory conservation goals with consumer incentives
h. Provide technical assistance and grants to support these efforts
18.Encourageinvestmentsusingwatershed-basedresourceallocation
River basin planning should be comprehensive and aimed toward setting affordable, prioritized goals that follow a logical sequence. Use hydrologic based boundaries rather than political ones as the basis for coordinated investments and management. Use a cost/benefit approach as part of watershed-based planning to determine how to achieve the maximum environmental gain with the available resources.
a. Fund a study of what would be required to integrate watershed-based decision-making regarding land use, water infrastructure permitting, and investment as envisioned in the Clean Water Act
b. Require agencies to integrate watershed-based planning into decision making for land use, water infrastructure permitting, and investments
c. Encourage agencies to prioritize programs that recognize the values of natural systems and open space as assets
d. Provide funding for DEP and/or regional planning agencies to enhance watershed planning and environmental reviews, in order to direct scare resources to the regulations and projects that will deliver the highest public value
e. Prioritize SRF funds toward projects with the greatest potential benefit for the watershed
f. Work with EPA to utilize watershed-based analysis, includ-ing cost benefit analysis, for NPDES permits to result in more efficient and more environmentally effective decisions
Promote Environmental Sustainability

108 | Massachusetts’s Water Infrastructure: Toward Financial Sustainability
R e c o m m e n d a t i o n s
19.Conductanupdatedcost/benefitanalysisonassum-ingprimacyfrom the federal government over NPDES permitting. The study should evaluate whether the state can more effectively manage its resources and achieve better outcomes over the long run, including the integration of watershed based planning, by assuming “primacy” over the administration of the federal Clean Water Act.
20.Increaseregulatoryflexibilitytobetterdirectfundingtoprojectsthatdeliverthehighestpublicbenefit
a. Prioritize and streamline permitting for repair, replacement, and maintenance projects to avoid further system damage or failure
b. Promote early collaboration between project proponents and all regulators to analyze competing program priorities and project benefits in order to maximize efficiency and deliver the greatest public benefit
c. Utilize the watershed framework to review the wider implication of site-specific solutions
d. Consider co-benefits such as energy conservation and carbon reduction
e. Consider extended permit durations for projects involving capital improvements and upgrades.
21.InvestinMassachusettsasahubofinnovationinthefieldofwater,wastewater,andstormwatermanage-mentandtechnology
Massachusetts is in an excellent position to be a leader in developing and utilizing innovative, sustainable solutions that improve water quality and provide cost effective ways to address our infrastructure needs. This is a sector with great promise for new jobs at different levels of expertise.
As a Commonwealth, we should build on our long tradition of leadership in technology, engineering, research, and development to keep Massachusetts in the forefront of innovation. Efforts should build on existing networks and collaborative efforts and utilize the academic, technical, and professional expertise of our universities, agencies, NGO’s, and the private sector. The Com-monwealth should invest in research and development.
Promote Environmental Sustainability
Promote Water Innovation

Massachusetts’s Water Infrastructure: Toward Financial Sustainability | 109
R e c o m m e n d a t i o n s
a. Support innovative research and collaboration among agencies, corporations, academic institutions, NGO’s, and others to promote water technology R&D
b. Charge a task force within the Executive Branch to develop a plan for making Massachusetts a hub of innovation in water resources
22.Reduceobstaclestoadoptionofinnovativetechnologies
Consider ways to manage and address the regulatory and financial risks faced by municipalities, authorities and the private sector to encourage the adoption of innovative solutions.
a. Allocate resources for programs that mitigate risk: º Pilot projects, case studies, demonstration projects º Proof of concept projects to support nascent technologies and new applications of current technologies
º New technology vetting procedures º Outreach and technical assistance programs, to advance innovative technologies and approaches, based on the Green Communities model
º Conduct a study of regulatory barriers to innovation, including possible obstacles in procurement laws
b. Implement a more robust alternatives analysis through the Comprehensive Water Management Planning process to ensure that innovative solutions are considered
c. Consider ways to facilitate regulatory compliance and reduce third party litigation to address the economic risk of pilot innovative projects
23.Harnessthestate’seducationalstrengthstotrainengineers,scientists,researchers,andworkerstobeattheforefrontofinnovativewatermanagementacrossthecountry.
Build on existing professional and academic collaborations. Encourage public/private partnerships with universities, colleges, and trade schools, NGOs, agencies, and the private sector.
Promote Water Innovation

110 | Massachusetts’s Water Infrastructure: Toward Financial Sustainability
R e c o m m e n d a t i o n s
a. Create public private partnerships with universities, col-leges, and trade schools to create training programs to “fill the pipeline” with future water management professional
b. Foster exchanges between industry, academia and regulators to increase awareness of developing technologies
Promote Water Innovation

Massachusetts’s Water Infrastructure: Toward Financial Sustainability | 111
A p p e n d i x AThe Water Infrastructure Finance Commission
SECTION 145. (a) There shall be a special water infrastructure finance commission to develop a comprehensive, long-range water infrastructure finance plan for the commonwealth and munici-palities. (b) The commission shall consist of the commissioner of environmental protection or his designee; the state treasurer or his designee; 2 people to be appointed by the president of the senate, 1 of whom shall be a member of the senate and 1 of whom shall be a representative of a planning organization, environmental consumer organization or other public interest organization; 2 people to be appointed by the speaker of the house of representatives, 1 of whom shall be a member of the house of representatives and 1 of whom shall be a representative of a planning orga-nization, environmental consumer organization or other public interest organization; 1 person to be appointed by the minority leader of the senate and 1 person to be appointed by the minority leader of the house of representatives, each of whom shall be from different geographic regions of the commonwealth and who shall be representatives of the business community; a representative of the Boston Water and Sewer Commission; and 9 persons to be appointed by the governor who shall not be employees of the executive branch and who shall reside in different geographic regions of the commonwealth, 1 of whom shall be a representa-tive of the American Council of Engineering Companies of Massachusetts, 1 of whom shall be a representative of the Utility Contractors’ Association of New England, 1 of whom shall be a representative of the Massachusetts Waterworks Association, 1 of whom shall be a representative of the Massachusetts Municipal Association, 1 of whom shall be a representative of Clean Water Action, 1 of whom shall be a representative of Associated Industries of Massachusetts, 1 of whom shall be a representative of the Environmental League of Massachusetts, 1 of whom shall be a
representative of the Conservation Law Founda-tion and 1 of whom shall be a representative of the Massachusetts Water Pollution Control Associa-tion. Each of those organizations shall provide a list of at least 3 but not more than 5 candidates for consideration by the governor. Each of the mem-bers shall be an expert or shall have experience in the field of law or public policy, water, wastewater or storm water planning, design and construction of water, wastewater or storm water projects, utility management, management consulting or organi-zational finance; provided, however, that at least 1 member shall have expertise in organizational finance. The governor shall designate a member to serve as the chairperson of the commission but the chairperson shall not be the commissioner of environmental protection, the state treasurer or their designees. The members of the commission shall be appointed not later 90 days after the effective date of this act and shall serve until the completion of the long-range infrastructure finance plan. (c) In the course of its deliberations, the commission shall make it a priority to examine the technical and financial feasibility of sustaining, integrating and expanding public water systems, conservation and efficiency programs, wastewater systems and storm water systems of municipalities and the commonwealth, including regional or district systems. Further, the commission shall: (1) examine the water infrastructure needs of the commonwealth for the next 25 years as they relate to the funding Gap between the water infrastructure needs of the commonwealth and the existing, available sources of funding; (2) develop mechanisms for additional funding for water infrastructure by increasing investment in critical water, wastewater, storm water and water conserva-tion infrastructure; (3) provide mechanisms for improvements in the handling and management of water programs; (4) examine the potential threats to public health and public safety from the existing
Section 145 Chapter 27 of the Acts of 2009

112 | Massachusetts’s Water Infrastructure: Toward Financial Sustainability
shortfalls in funding for water infrastructure; (5) examine and develop recommendations on ways in which the commonwealth and its municipalities may meet operation and maintenance and capital improvement and reconstruction needs for the next 25 years including, without limitation, recom-mendations regarding debt reduction, enhancing existing sources of revenues, developing new sources of revenues, establishing new incentives for public-private partnerships in the development of real property resources and funding resources; and (6) examine the expanded use of full accounting systems and enterprise funding, asset management systems and best management practices, compli-ance with chapter 21G of the General Laws, the Massachusetts water policy and current federal and state funding programs. (d) The commission shall examine the finances of the various municipalities and regional water districts, including state and federal aid levels, and make recommendations for improvements to financial policies and procedures. The commission shall identify areas where cost savings can be achieved across water agencies by consolidation, coordination and reorganization. The commission shall examine the projected federal funding, projected state funding, projected local funding, projected fee-based funding, debt financing and any other sources of projected funding to finance water infrastructure needs identified by the commission. (e) The commis-sion shall develop recommendations as to what funding or finance measures the commonwealth
or municipalities may pursue to satisfy any unmet funding needs identified by the commission. The recommendations shall also include any recommendation for interagency agreements, intermunicipal agreements, consolidations or mergers to enable the commonwealth and municipalities to make the most effective use of water funding resources. The recommendations shall identify fair and equitable means of financing water infrastructure investments through taxes, fees, user charges or other sources. (f ) The com-mission may hold public hearings to assist in the collection and evaluation of data and testimony. (g) The commission shall prepare a written report detailing its financials relative to identified funding sources and its recommendations, if any, together with drafts of legislation necessary to carry those recommendations into effect. The commission shall submit its initial report to the governor, the secretary of the executive office of energy and environmental affairs, the clerks of the senate and house of representatives, the chairs of the house and senate committees on ways and means and the joint committee on environment, natural resources and agriculture not later than 2 years after the effective date of this act. (h) Any research, analysis or other staff support that the commission reason-ably requires shall be provided by the executive office of energy and environmental affairs and its agencies, with assistance from the Massachusetts Water Resources Authority.
A p p e n d i x A

Massachusetts’s Water Infrastructure: Toward Financial Sustainability | 113
A p p e n d i x BWater Infrastructure Finance Commission Members
Senator James Eldridge, Chairman
Representative Carolyn Dykema
State Treasurer Timothy Cahill (designee: David Reidell)
Steven Grossman (designee: Enrique Zuniga)
DEP Commissioner Laurie Burt (designee: David Terry)
Kenneth Kimmell (designee: David Terry)
Norman (Ned) Bartlett
William Callahan
David Hanlon
Philip Jasset
Vincent Mannering
Michael Martin
Paul Niedzwiecki
Martin Pillsbury
Peter Shelley
Becky Smith
Thomas Tilas
Bruce Tobey
Thomas Walsh
Robert Zimmerman
Commission staff support provided by Sally Schnitzer, Office of State Senator Jamie Eldridge, and
Leah Robins, Office of Representative Carolyn Dykema

114 | Massachusetts’s Water Infrastructure: Toward Financial Sustainability
A p p e n d i x C Final Vote Of The Commission
On February 7th 2012 after meeting to discuss changes to this final report, the Commission formally voted to adopt the final report of the commission. Votes as recorded appear to the right.
Member Commission Appointment Vote
Senator James Eldridge Senate appointee yes
David Terry Appointee of Commissioner Department of Environmental Protection
abstain
Enrique Zuniga Appointee of the State Treasurer abstain
Paul Niedzwiecki Senate President appointee yes
Rep Carolyn Dykema Speaker appointee yes
Martin Pillsbury Speaker appointee from MAPC yes
Dave Hanlon House minority leader appointment from World Tech Engineering
yes
Tom Tilas Senate minority leader appointment from AECom
yes
William Callahan Governor appointee from American Council of Engineering Companies of MA
yes
Phil Jasset Governor appointee from Utility Contractors Association of New England
yes
Michael Martin Governor appointee from MA Waterworks Association
yes
Bruce Tobey Governor appointee—Mass Municipal Association
yes*
Robert Zimmerman Governor appointee—Environmental League of Massachusetts
yes*
Peter Shelley Governor appointee—Conservation Law Foundation
yes
Thomas Walsh Governor appointee—Mass Water Pollution Control Association
yes
Norman Bartlett (Ned) Governor appointee—Associated Industries of Massachusetts
no
Becky Smith Governor appointee—Clean Water Action yes
Vincent Mannering Boston Water and Sewer Commission –
*Bruce Tobey and Robert Zimmerman were present for the final meeting and indicated support for the final report; however they missed the vote due to scheduling issues. Letters indicating their support and vote had they been present are included.
While they participated fully in the commission process, Enrique Zuniga and David Terry abstained from the final vote, due to their positions within the Administration and Treasury.

Massachusetts’s Water Infrastructure: Toward Financial Sustainability | 115
A p p e n d i x C

116 | Massachusetts’s Water Infrastructure: Toward Financial Sustainability
A p p e n d i x C

Massachusetts’s Water Infrastructure: Toward Financial Sustainability | 117
A p p e n d i x DMeetings of the Water Infrastructure Finance Commission
COMMISSION MEETINGSMay 5, 2010June 15, 2010July 14, 2010
September 28, 2010October 26, 2010
November 30, 2010February 8, 2011March 1, 2011March 22, 2011April 12, 2011 June 15, 2011June 28, 2011July 20, 2011
October 3, 2011 November 9, 2011 December 13, 2011
February 7, 2012
PUBLIC HEARINGSOctober 13, 2010 – State House, Boston MA
October 20, 2010 – Forbes Municipal Bldg., Westborough MANovember 10, 2010 – Cape Cod Community College,
Barnstable MANovember15 – Pioneer Valley Planning Commission, Spring-
field MA
WORKING GROUP MEETINGSWorkingGroupOne
(Current water infrastructure needs and long term challenges)September 16, 2010October 20, 2010
November 30, 2010December 14, 2010
January 11, 2011February 3, 2011February 22, 2011
March 3, 2011March 31, 2011June 13, 3011 June 22, 2011
October 19, 2011
Working Group Two (Municipal utility and water district financing)
August 23, 2010September 14, 2010October 18, 2010December 8, 2010 January 11, 2011
February 14, 2011 August 29, 2011
September 12, 2011
WorkingGroupThree(Innovative water systems, technologies, and infrastructure)
September 15, 2010October 13, 2010December 7, 2010December 14, 2010
January 18, 2011March 1, 2011March 29, 2011
November 2, 2011
WorkingGroupFour(State and federal finance and investment practices)
September 13, 2010October 25, 2010January 20, 2011 January 24, 2011
February 24, 2011March 28, 2011
May 3, 2011 May 17, 2011 June 8, 2011
August 10, 2011 September 28, 2011

118 | Massachusetts’s Water Infrastructure: Toward Financial Sustainability
A p p e n d i x E Public Hearings
October13,2010–StateHouse,BostonMA
October20,2010–ForbesMunicipalBuilding,WestboroughMA
November10,2010–CapeCodCommunityCollege,BarnstableMA
November15–PioneerValleyPlanningCommission,SpringfieldMA
The Commission held four public hearings across the state, in Boston, Westborough, Barnstable, and Springfield. Local municipal officials, water department and water district officials, groups and agencies interested in water policy, environmental and consumer protection groups, professionals in the fields of water supply engineering and pricing, and other interested members of the public were invited to participate. The hearings were well attended, and the Com-mission received oral testimony on the following:
• Issues in identifying and understanding the water, waste water, and storm water infrastructure needs of the Commonwealth
• Issues with the current and potential capacity to finance these needs
• Recommendations on ways to meet operation, mainte-nance, and capital needs of municipal water systems in the Commonwealth
• Recommendations on potential changes in local, state, and federal approaches to water infrastructure financing
• Fair and equitable means of financing water infrastruc-ture investments, including the role of fees, rates, taxes, loans, grants, and other financial vehicles
• The technical and financial feasibility of sustaining public water systems, conservation and efficiency programs, wastewater systems and storm water systems of municipalities and the commonwealth
• Potential for cost savings through consolidation, coordination, reorganization, or regionalization
• Potential for cost savings through innovations in water technology
These hearings provided both general comments on the sta-tus of water related infrastructure in the Commonwealth and system-specific data about challenges facing municipalities and their publicly operated water and waste water systems.
The Commission also received written testimony from cities and towns across the state. A number of towns submitted detailed letters that outlined the alarming rise in investment needed by their communities in order to meet new environ-mental regulation, to repair aging systems, and to provide services to an expanding or growing community.
Representatives of water-related boards and systems attended the hearings, testified in person, or wrote to the Commission. Some of the towns whose water and sewer departments or public officials attended or contacted the Commission include: Acton, Attleboro, Barnstable, Buzzards Bay, Cam-bridge, Chicopee, Concord, Dennis, Fall River, Falmouth, Framingham, Gloucester, Grafton, Granby, Harwich, Holliston, Longmeadow, Medway, Monson, Natick, Norfolk, Orleans, Plainville, Spencer, Springfield, South Hadley, Southwick, Wareham, Westborough, Westport, Worcester, and Wrentham.
In addition, professional organizations and regional planning agencies attended the hearings or wrote to the Commission and spoke generally to the same issues on behalf of com-munities and water suppliers they represent.
The hearings were also attended by representatives from environmental and professional organizations, as well as water professionals, engineers, regional planners, water planners, consultants, attorneys, and entrepreneurs.
The Commission found that the testimony illustrated –perhaps even more powerfully than statistics—the kinds of financial challenges being faced in the Commonwealth. The hearings raised almost all the issues that the Commission ultimately studied, wrestled with, and included in their working agenda.
The Commission brought in experts from agencies, the private sector, and other states to share ideas and help the Commission frame the issues.
The Commission has received written testimony from groups and individuals throughout the process.

Massachusetts’s Water Infrastructure: Toward Financial Sustainability | 119
A p p e n d i x FEPA Clean Water and Drinking Water Infrastructure Gap Analysis
“With the again for the nation’s infrastructure, the clean water and drinking water industries face a significant challenge to sus-tain and advance their achievements in protecting public health and the environment. To gain a better understanding of the future challenges facing these industries, the U.S. Environmental Protection Agency (EPA) has conducted a study, The Clean Water and Drinking Water infrastructure Gap Analysis, to identify whether a funding Gap will develop between projected investment needs and projected spending. The study provides an important empirical bsis for discussions addressing the critical needs of our water infrastructure.” - USEPA
The EPA Gap Analysis is available at the following link: http://water.epa.gov/aboutow/ogwdw/upload/2005_02_03_Gapreport.pdf

120 | Massachusetts’s Water Infrastructure: Toward Financial Sustainability
A p p e n d i x G EPA 2007 Drinking Needs Survey Information
The EPA 2007 Drinking Water Needs Survey can be found at the following links:
http://water.epa.gov/infrastructure/drinkingwater/dwns/factsheet.cfm
http://www.epa.gov/safewater/needssurvey/pdfs/2007/report_needssurvey_2007.pdf
NATIONWIDE The 1996 Safe Drinking Water Act Amendments mandate that the EPA conduct a nationwide assessment of infrastruc-ture needs for public water supply systems every four years, and that these findings be used to allocate Drinking Water State Revolving Fund capitalization grants to the states.
According the most recent of these surveys, published in 2007, the national infrastructure need for drinking water is estimated to be $334.8 billion over the 20 year period from 2007 to 2027. These costs are for transmission and distribu-tion systems, source development and protection, treatment, storage, and miscellaneous other projects.
The Drinking Water Needs Assessment is conducted using a random sample survey of water systems. A questionnaire is mailed to all of the nation’s 584 large water systems (each serving more than 100,000 persons) and the 2266 medium systems (each serving between 3,301 and 100,000 persons). Approximately 97 percent of the large systems and 92 percent of the medium systems returned the questionnaire. In addition, EPA conducted in-person site visits to 600 small systems. In all, a total of 3,250 public water systems participated.
EPA notes that the scope of the survey is limited to infra-structure investments that are eligible to receive DWSRF assistance. These are capital improvement projects, only – not including operation and maintenance costs, debt service, or routine asset management. Some capital projects are also excluded because of DWSRF requirements: capital projects related solely to dams, raw water reservoirs, future growth, and fire protection.
Specifically, to be counted the project must be for a capital improvement, be eligible for SRF funding, must further the goals of the Safe Drinking Water Act, and must be submit-ted with very extensive supporting information to document the need.
When compared to the 20 year estimates published in 1995, 1999, and 2003, the estimates are steadily rising. However, the 2003 and 2004 estimates were comparable, indicating that with a similar statistical approach, surveys may be getting more accurate at reporting the longer term needs.
For the 2007 assessment, 16 percent of the need is associated directly with Safe Drinking Water Act regulations. In responding to the surveys, many systems reported that they are using asset management strategies to address rehabilita-tion and replacement of assets, but EPA acknowledges that “a significant Gap still exists between information about their inventory of infrastructure and their knowledge of that infrastructure’s condition or remaining useful life.”
The estimate includes need associated with “thousands of miles of pipe, thousands of treatment plant and source projects, and billions of gallons of storage.”
Since the September 11, 2011 attacks, there has been more investment in protecting the nation’s water systems from vulnerabilities. These costs may be incorporated into other investment projects underway, or reported separately, so it is difficult to estimate these costs. The projects include fencing, electronic or cyber securing, monitoring equipment, and other approaches.
MASSACHUSETTS In Massachusetts, the USEPA Drinking Water Needs Survey identified $6,790,000,000 dollars in Needs. These eligible projects include:
• $4,456,400,000 for transmission and distribution system needs
• $340,900,000 for source protection projects • $1,130,100,000 for treatment needs• $823,400,000 for storage projects; and
• $39,100,000 for miscellaneous eligible projects
The bulk of the documented need for Massachusetts drinking water investments is for medium sized systems ($4,469,700) while large systems are in need of $1,693,300 and small systems $424,000 and $32,900 other.

Massachusetts’s Water Infrastructure: Toward Financial Sustainability | 121
A p p e n d i x HEPA Clean Water and Drinking Water Infrastructure Gap Analysis
The EPA 2008 Clean Watersheds Needs Survey can be found at the following links:
http://water.epa.gov/scitech/datait/databases/cwns/index.cfm
http://epa.gov/owm/mtb/cwns/cwns2008rtc/cwns2008rtc.pdf
NATIONWIDE The Clean Watersheds Needs Survey (CWNS) 2008 Report to Congress summarizes the results of EPA’s 15th national survey of capital costs to address water quality or water quality related public health problems.
In 2008, EPA estimated the total wastewater and stormwater management needs for the entire nation to be approximately $298.1 billion, including:
• $192.2 for wastewater treatment plants, pipe repairs, and new pipes
• $63.6 billion for combined sewer overflow corrections
• $42.3 billion for stormwater management
In addition, the report estimated additional categories of need for :
• 22.8 billion for nonpoint source pollution prevention
• Decentralized wastewater (septic) systems
The Needs Survey estimated that $334.5 billion in needs were potentially eligible for assistance from EPA’s Clean Water State Revolving Fund and $81.5 billion in needs are poten-tially eligible for assistance from the Nonpoint Source Control Grant programs, respectively.
The EPA found a $43.4 billion (17 percent) increase (in constant 2008 dollars) in investment needs over the 2004 CWNS report. The increase is due to a combination of improved reporting, aging infrastructure, population growth, and more protective water quality standards.”
The report highlights that Coastal watersheds nationwide face particular pressures, supporting commerce, industry, tourism, and development. There is an effort underway (National Coastal Condition Report III) to create a benchmark of coastal conditions from which future progress can be mea-sured, and those indicators can be used in conjunction with the CWNS 2008 data to help prioritize projects or track progress in addressing needs.
WHAT IS COUNTED AND WHAT IS NOT Documented needs in the CWNS include the unfunded capital costs of projects as of January 1 that address a water quality or water quality-related health problem existing as of that date or expected to occur within the next 20 years, and meet the seven CWNS criteria, established by EPA in consultation with the CWNS 2008 National Workgroup, to document each need:
1. A description of the current or potential water quality impairment and information on its potential source. The problem description needed to include specific pollutant source information and/or specific threats to the waterbody.
2. The location of the problem. A single latitude/longitude point or an area (e.g., polygon, county, watershed) needed to be identified.
3. The solution to the problem. One or more specific pol-lution control measures or best management practices (BMPs) needed to be identified.
4. The cost for each solution. The cost to implement each pollution control measure or specified BMP needed to be provided.
5. The source of the cost. Documentation (e.g., engineer’s estimates, costs from comparable practices, estimates from equipment suppliers) for each solution needed to be identified.
6. The total cost. The total cost of all pollution control measures and BMPs documented for the facility or project needed to be provided.
7. Current documentation. For records with total needs greater than $20 million, the documentation date of all documents needed to be January 1, 2002, or more current. For all other needs, the documentation date needed to be January 1, 1998, or more current.
MASSACHUSETTS EPA estimated the total documented need for Massachusetts as listed in the 2008 CWNS is $7.95 billion. This is a 110% increase from the $3.8 billion in needs documented in 2004. Of the documented need, $7.8 billion is in documented wastewater treatment needs; and $41 million is in documented total stormwater management needs. The report states that need in the last category is difficult to document so actual needs may be higher. (continued on next page)

122 | Massachusetts’s Water Infrastructure: Toward Financial Sustainability
A p p e n d i x H
The report also lists at least $99 million in non point source control needs, but the figure is not included in the Official Needs Report to Congress. The report states that even this dollar amount is likely to be an underreporting of need, since documenting these needs is difficult.
NATIONAL ESTUARY PROGRAM The National Estuary Program was established in 1987 to identify estuaries of national importance through an integrated program that protects public water supplies, encourages the propagation of balanced, indigenous shellfish, fish, and wildlife, encourages recreational activities, and utilizes point and non-point pollution control. For each estuary, a Compre-
hensive Conservation and Management Program (CCMP) is established to provide a framework for coordinating efforts of various implementers.
The Massachusetts Bays, Narragansett Bay (MA and RI) and Buzzards Bay are individually included in this program. The 2008 CWNS reports $2.9 billion in documented needs for the Massachusetts Bays, $883 million for Naragansett Bay, and $484 million for Buzzards Bay. These needs are included (where applicable) in the overall Massachusetts survey. Additional nonpoint source needs exist and are largely undocumented.

Massachusetts’s Water Infrastructure: Toward Financial Sustainability | 123
A p p e n d i x IHistory – Sewer Rate Relief Fund
Fiscal Year
$ Appropriated
$ Expended
# of Recipients*
FY1994 $30,000,000 $20,457,587 33
FY1995 $40,000,000 $31,720,091 51
FY1996 $40,000,000 $37,928,997 57
FY1997 $54,858,000 $46,389,835 69
FY1998 $50,700,000 $49,035,727 81
FY1999 $53,914,000 $52,255,617 88
FY2000 $53,914,000 $58,948,685 98
FY2001 $53,914,000 $61,816,980 101
FY2002 $58,655,335 $60,528,339 104
FY2003 $0 $0 0
FY2004 $5,000,000 $5,028,412 68
FY2005 $10,000,000 $9,978,667 62
FY2006 $12,500,000 $12,491,301 92
FY2007 $25,000,000 $25,006,057 98
FY2008 $23,000,000 $23,025,406 101
FY2009 $0 $0 0
FY2010 $0 $0 0
FY2011 $0 $0 0
FY2012 $500,000
Source: Division of Local Services Department of Revenue
* # of recipients calculated as follows: MWRA communities for their own projects plus—Non-MWRA communities for their own projects plus—MWRA, Sewer District or Sewer Commission applicant as a single recipient

124 | Massachusetts’s Water Infrastructure: Toward Financial Sustainability
A p p e n d i x J Information on Rates and Rate Setting Practices
Tighe & Bond began collecting water and sewer rate data in Mas-sachusetts in 1997 and regularly updates and publishes this data for use by municipal government and private suppliers. The most recent data can be found at the following links: http://rates.tighebond.com/(S(5av145fb5gr3nl55p0b2xa45))/Downloads/2010%20MA%20Water%20Rates.pdfhttp://rates.tighebond.com/(S(5av145fb5gr3nl55p0b2xa45))/Downloads/2010%20MA%20Sewer%20Rates.pdf
The MWRA Advisory Board has, for 25 years, prepared an “Annual Water and Sewer Retail Rate Survey, “providing a comparative snapshot of water and sewer retail rates for each community in the MWRA service area” as well as comparable data for other Massa-chusetts communities and other cities in the nation. The most recent document can be found at the following link: http://mwraadvisoryboard.com/resources/publications/
Further information on rate structures, full cost pricing, and ways to approach rate setting can be found at the following links: The 2006 Massachusetts Water Conservation Standards establishes updated statewide goals for water conservation and water use efficiency, and provides guidance on the most current conservation measures, including full cost pricing and rate structures. http://www.mass.gov/eea/docs/eea/water/water-conservation-standards.pdf
Information to assist communities in rate setting was provided to the Commission by the Mass Water Works Association and can be found at the following link: http://mwwa.memberclicks.net/assets/documents/municipal%20rates%20information.pdf

Massachusetts’s Water Infrastructure: Toward Financial Sustainability | 125
A p p e n d i x KFunding Streams for Water Sustainability
A catalogue identifying and assembling information on the various funding streams available for innovative, decentralized, site-level water infrastructure and building technology through programs administered by the federal government, the govern-ment of the Commonwealth of Massachusetts, and the private and non-profit sectors was compiled by Clean Water Action for the Commission. The catalog can be found at the following link: http://www.cleanwateraction.org/files/images/smartcleangreen/Master%20Catalogue_0.pdf
The catalog is organized by building type in order to serve as a resource for developers, owners, and facility managers seeking to construct or retrofit their facilities to include features of sustainable water use as well as wastewater and stormwater management.

126 | Massachusetts’s Water Infrastructure: Toward Financial Sustainability
End Notes1 Urban Land Institute and Ernst and Young: Infrastructure 2011:
A Strategic Priority , http://www.uli.org/~/media/Documents/ResearchAndPublications/Reports/Infrastructure/Infrastruc-ture2011.ashx
2 USEPA Gap Analysis 2002 http://water.epa.gov/aboutow/ogwdw/upload/2005_02_03_Gapreport.pdf
3 “The term ‘eutrophic’ means well-nourished; thus, ‘eutrophica-tion’ refers to natural or artificial addition of nutrients to bodies of water and to the effects of the added nutrients….When the effects are undesirable, eutrophication may be considered a form of pollution.” - National Academy of Sciences, 1969
4 http://www.mass.gov/dcr/watersupply/intbasin/stressed_basins.htm
5 “Cranberry Water Use” information fact sheet; Cranberry Water-shed Education Initiative; Plymouth County Conservation District in conjunction with the Cape Cod Cranberry Growers’ Association http://www.cranberries.org/pdf/wateruse.pdf
6 “Report on Clean Water Investment and Job Creation” National Utility Contractors Association (NUCA) 1992
7 Source: DEP Drinking Water Program 8 Source: DEP Drinking Water Program9 Source: DEP Drinking Water Program 10 Tighe and Bond 2010 Water rate survey http://rates.tighebond.
com/(S(kphfco45z23ebd2v5zppaxus))/Downloads/2010%20MA%20Water%20Rates.pdf
11 USEPA The Clean Water and Drinking Water Infrastructure Gap Analysis http://water.epa.gov/aboutow/ogwdw/upload/2005_02_03_Gapreport.pdf
12 USEPA Clean Water and Drinking Water Infrastructure Gap Analysis http://water.epa.gov/aboutow/ogwdw/upload/2005_02_03_Gapreport.pdf
13 http://www.mwra.state.ma.us/02org/html/whatis.htm14 http://www.mwra.state.ma.us/02org/html/whatis.htm15 Such as the Upper Blackstone Water Pollution Abatement
District, the Greater Lawrence Sanitary District, and the South Essex Sanitary District
16 Tighe and Bond 2010 Sewer Rate Survey http://rates.tighebond.com/(S(kphfco45z23ebd2v5zppaxus))/Down-loads/2010%20MA%20Sewer%20Rates.pdf
17 USEPA 2008 Clean Watersheds Survey http://water.epa.gov/scitech/datait/databases/cwns/2008reportdata.cfm
18 USEPA Preliminary Data Summary of Urban Stormwater Best Management Practices (1999) Chapter 4 http://water.epa.gov/scitech/wastetech/guide/stormwater/index.cfm
19 EPA Preliminary Data Summary of Urban Stormwater Best Management Practices (1999); EPA National Water Quality Inventory of 1996 Report to Congress (1998)
20 EPA: Stormwater Phase II Final Rule Small MS4 Stormwater Program Overview http://cfpub.epa.gov/npdes/stormwater/swfinal.cfm
21 National Pollutant Discharge Elimination System (NPDES) Stormwater Menu of Best Management Practices http://cfpub.epa.gov/npdes/stormwater/menuofbmps/
22 http://www.mass.gov/dep/water/wastewater/csofaqs.htm23 USEPA Drinking Water Needs Survey http://water.epa.gov/
infrastructure/drinkingwater/dwns/index.cfm24 USEPA 2008 Clean Watersheds Survey http://water.epa.gov/
scitech/datait/databases/cwns/2008reportdata.cfm25 Creating a Sustainable Solution for Pennsylvania: Report of
the Governor’s Sustainable Infrastructure Task Force Report November 2008 http://pa.gov/portal/server.pt/community/sustainable_water_infrastructure_task_force/10565
26 USEPA Drinking Water Needs Survey http://water.epa.gov/infrastructure/drinkingwater/dwns/index.cfm
27 USEPA 2008 Clean Watersheds Survey http://water.epa.gov/scitech/datait/databases/cwns/2008reportdata.cfm
28 Estimate based on information provided by the Cape Cod Commission. Wastewater improvements on Cape Cod are necessary due to EPA requirements to address excess nitrogen from septic systems affecting coastal waterways.
29 USEPA The Clean Water and Drinking Water Infrastructure Gap Analysis http://water.epa.gov/aboutow/ogwdw/upload/2005_02_03_Gapreport.pdf
30 This is a modified version of a chart in USEPA The Clean Water and Drinking Water Infrastructure Gap Analysis http://water.epa.gov/aboutow/ogwdw/upload/2005_02_03_Gapreport.pdf
31 http://water.epa.gov/infrastructure/drinkingwater/pws/afford-ability.cfmgov/npdes/stormwater/munic.cfm
32 Bio mimicry is an emerging discipline that studies nature’s best ideas and then imitates these designs and processes to solve human problems http://www.biomimicryguild.com/guild_biomimicry.html
33 For example: Infrastructure 2011 A Strategic Priority Urban Land Institute and Ernst and Young 2011; and USEPA The Clean Water and Drinking Water Infrastructure Gap Analysis 2002
34 USEPA The Clean Water and Drinking Water Infrastructure Gap Analysis http://water.epa.gov/aboutow/ogwdw/upload/2005_02_03_Gapreport.pdf
35 John McNabb, Analysis of the Massachusetts Drinking Water Infrastructure Journal of the New England Water Works Asso-ciation December 2010 http://www.southshorepcservices.com/Analysis_Mass_Water_Infrastructure-NEWWA-Dec2010.pdf
36 American Water Works Association, Dawn of the Replacement Era: Reinvesting in Drinking Water Infrastructure (May 2001) p6.

Massachusetts’s Water Infrastructure: Toward Financial Sustainability | 127
E n d N o t e s
37 http://www.epa.gov/region1/npdes/pwtfgp.html38 “Technical Support of the Massachusetts DPDES Program
Delegation Initiative Final Report; The Cadmus Group, Waltham MA for the Department of Resource Protection, MA DEP 1997
39 http://water.epa.gov/infrastructure/watersecurity/40 http://www.mwra.state.ma.us/finance/ceb/fy12proposed/
CEB%20PFY12%20Document.pdf page 2441 Emergency Planning and Preparedness Tips for WWTP and
WTP Operators DEP http://www.mass.gov/dep/water/laws/eprepwtp.htm
42 http://www.mwra.state.ma.us/finance/ceb/fy12proposed/CEB%20PFY12%20Document.pdf page 24
43 http://www.mwra.state.ma.us/finance/ratefacts.htm 44 FY 2011 Integrated Comments and Recommendations on the
MWRA’s Proposed Capital Improvement Program and Current Expense Budget May 2010 updated by email correspondence with MWRA December 2011.
45 MWRA Advisory Board: FY 2011 Integrated Comments and Recommendations on the MWRA’s proposed Capital Improve-ment Program and Current Expense Budget May 2010 page 29
46 Source: Department of Revenue, Division of Local Services in communication dated December 6, 2011
47 DOR Division of Local Services by email to the Commission December 2011
48 Meeting with MWRA officials; confirmed by email to Commis-sion December 2011
49 DEP WMA POLICY # BRP/DWM/DW/PO4-1 (April 2, 2004) and subsequent revision (DEP GUIDANCE # BRP/DWM/DW/PO4-1 (April 2, 2004) and in July 2006 the Water Resources Commis-sion revised the Massachusetts Water Conservation Standards.
50 ”Asset Management – the U.S. Experience 10 Years and Counting” Presentation by Steve Albee, US EPA at the NEWEA Asset Management Conference April 26, 2011
51 “Water Sustainability in Buildings and Sites: Federal and Massachusetts Funding Streams and Informational Resources” Clean Water Action - Water Alliance May 2011- submitted to Commission by Becky Smith
52 Massachusetts Water Pollution Abatement Trust letter to the Commission dated August 2, 2011
53 MWPAT Comprehensive Annual Finance Report June 2010 and the Independent Auditor’s report
54 Letter to Commission from Water Pollution Abatement Trust Executive Director, Enrique Zuniga, Executive Director, dated Sept 23, 2011
55 Letter to Commission from Water Pollution Abatement Trust Executive Director, Enrique Zuniga, Executive Director, dated Sept 23, 2011
56 Letter to Commission from Water Pollution Abatement Trust Executive Director, Enrique Zuniga, Executive Director, dated Sept 23, 2011
57 Letter to Commission from Water Pollution Abatement Trust Executive Director, Enrique Zuniga, Executive Director, dated Sept 23, 2011
58 http://www.aarp.org/content/dam/aarp/research/pub-lic_policy_institute/cons_prot/2011/insight56.pdf
59 Congressional Budget office: Future Investment in Drinking Water and Wastewater Infrastructure 2002 http://www.cbo.gov/ftpdocs/39xx/doc3983/11-18-WaterSystems.pdf
60 Congressional Budget office: Future Investment in Drinking Water and Wastewater Infrastructure 2002 http://www.cbo.gov/ftpdocs/39xx/doc3983/11-18-WaterSystems.pdf
61 Creating a Sustainable Solution for Pennsylvania: Report of the Governor’s Sustainable Infrastructure Task Force Report November 2008 http://pa.gov/portal/server.pt/community/sustainable_water_infrastructure_task_force/10565
62 Christopher Woodcock presentation; Woodcock and Associates Northborough, MA
63 “Value of Water Survey” ITT Corporation White Plains, NY 2010 http://www.itt.com/valueofwater/
64 Summary: Closing the Gap: Innovative Solutions for America’s Water Infrastructure Forum; January 2003
65 http://water.epa.gov/infrastructure/sustain/upload/2009_05_26_waterinfrastructures_summary_si_water-infrastructureforum-2003.pdf
66 Letter to Commission from Water Pollution Abatement Trust Executive Director, Enrique Zuniga, Executive Director, dated Sept 23, 2011
67 Letter to Commission from Water Pollution Abatement Trust Executive Director, Enrique Zuniga, Executive Director, dated November 3, 2011
68 WPAT calculations provided December 5, 201169 Letter to Commission from Water Pollution Abatement Trust
Executive Director, Enrique Zuniga, Executive Director, dated November 3, 2011
70 Tighe and Bond water and sewer reports71 http://www.mass.gov/eea/docs/eea/wrc/water-conservation-
standards.pdf72 http://water.epa.gov/infrastructure/sustain/asset_manage-
ment.cfm73 http://water.epa.gov/infrastructure/sustain/asset_manage-
ment.cfm74 http://www.pogo.org/pogo-files/reports/contract-oversight/
bad-business/co-gp-20110913.html#Table%201:%20Cost%20Analyses)
75 Congressional Budget office: Future Investment in Drinking Water and Wastewater Infrastructure 2002 http://www.cbo.gov/ftpdocs/39xx/doc3983/11-18-WaterSystems.pdf
76 Massachusetts Energy Management Pilot Program for Drinking Water and Wastewater Case Study

128 | Massachusetts’s Water Infrastructure: Toward Financial Sustainability
77 http://water.epa.gov/aboutow/eparecovery/upload/2010_01_26_eparecovery_ARRA_Mass_EnergyCasyS-tudy_low-res_10-28-09.pdf
78 http://www.epa.gov/owm/waterinfrastructure/pdfs/guide-book_si_energymanagement.pdf
79 Consortium for Energy Efficiency Energy Efficiency RFP guidance quoting two studies by Dimitriou 2007 and MA DEP 2007). http://www.cee1.org/ind/mot-sys/ww/rfp/whattoknow.php3#Who
80 http://www.epa.gov/owm/waterinfrastructure/pdfs/guide-book_si_energymanagement.pdf
81 http://www.mass.gov/dep/water/wastewater/empilot.htm#sum
82 Massachusetts Energy Management Pilot Program for Drinking Water and Wastewater Case Study
83 http://water.epa.gov/aboutow/eparecovery/upload/2010_01_26_eparecovery_ARRA_Mass_EnergyCasyS-tudy_low-res_10-28-09.pdf
84 http://water.epa.gov/infrastructure/sustain/wec_wp.cfm85 http://water.epa.gov/infrastructure/sustain/wec_wp.cfm86 http://mwraadvisoryboard.com/wp-content/uploads/Publica-
tions/Rate_Survey/2010%20SURVEY.pdf
87 John McNabb, Analysis of the Massachusetts Drinking Water Infrastructure Journal of the New England Water Works Asso-ciation December 2010 http://www.southshorepcservices.com/Analysis_Mass_Water_Infrastructure-NEWWA-Dec2010.pdf
88 USEPA Watershed-based National Pollutant Discharge Elimina-tion System (NPDES) Permitting Policy Statement January 7, 2003 http://www.epa.gov/npdes/pubs/watershed-permitting-policy.pdf
89 USEPA Watershed-based National Pollutant Discharge Elimina-tion System (NPDES) Permitting Policy Statement January 7, 2003 http://www.epa.gov/npdes/pubs/watershed-permitting-policy.pdf
90 http://www.mass.gov/dep/service/fasttrack.htm91 John Todd Ecological Design, Inc. Woods Hole, Ma92 http://www.cleanwateraction.org/files/images/smartclean-
green/Master%20Catalogue_0.pdf93 http://www.cleanwateraction.org/files/images/smartclean-
green/Master%20Catalogue_0.pdf94 http://www.cleanwateraction.org/files/images/smartclean-
green/Master%20Catalogue_0.pdf
E n d N o t e s