massachusetts rps aps annual compliance r for 2015 rps-aps 2015... · 2015 class i recs, all of...
TRANSCRIPT
Massachusetts
Renewable & Alternative Energy
Portfolio Standards
MASSACHUSETTS RPS & APS ANNUAL COMPLIANCE REPORT
FOR 2015
October 10, 2017
Department of Energy Resources
Commonwealth of Massachusetts
Commonwealth of Massachusetts RPS & APS Annual Compliance Report for 2015
Department of Energy Resources October 10, 2017, page 2 of 41
TABLE OF CONTENTS PAGE
EXECUTIVE SUMMARY 3
SECTION One Introduction to the Renewable & Alternative Energy Portfolio Standards 5
Two RPS Class I Compliance in 2015 9
Three RPS Solar Carve-Out Compliance in 2015 16
Four RPS Solar Carve-Out II Compliance in 2015 19
Five RPS Class II Renewable Energy Compliance in 2015 20
Six RPS Class II Waste Energy Compliance in 2015 22
Seven APS Alternative Energy Compliance in 2015 23
Eight Projection of Future RPS & APS Compliance Obligations and Supply 24
Nine Uses of the Alternative Compliance Payment Funds 31
APPENDICES
One RPS and APS 2015 Compliance Filings, Review, and Verification 34
Two 2015 Massachusetts Retail Electricity Suppliers
Three 2015 RPS and APS Compliance Summaries 35
Four Data Tables for RPS and APS Compliance by Generation Location and Type 36
TABLES
One Aggregated Data from the RPS Class I Annual Compliance Filings, 2010-2015 (w/o the Solar Carve-Outs) 11
Two Aggregated Data from the RPS Solar Carve-Out (SCO) Annual Compliance Filings, 2010-2015 17
Three Aggregated Data from the RPS Solar Carve-Out II (SCO II) Annual Compliance Filings, 2014-2015 20
Four Aggregated Data from the RPS Class II Renewable Energy Compliance Filings, 2010-2015 21
Five Aggregated Data from the RPS Class II Waste Energy Compliance Filings, 2010-2015 22
Six Aggregated Data from the APS Compliance Filings, 2010-2015 24
Seven MA RPS Class I Annual Retail Load & Compliance Obligations, Actual (2010-2015) &
Projected (2016-2021) [including the Solar Carve-Outs] 25
Eight MA RPS Class II & APS Annual Retail Load & Compliance Obligations, Net of Exempt Load,
Actual (2009-2015) & Projected (2016-2021) 27
Nine MA Solar Carve-Out Loads Served under Pre-June 28, 2013 & More Recent Retail Contracts,
Actual (2015) & Projected (2016-2021) ) – NEW 29
Ten MA Solar Carve-Out II Loads Served under Pre-April 25, 2014 & More Recent Retail Contracts,
Actual (2014-2015) & Projected (2016-2021) 30
Eleven ACP Proceeds per Portfolio Standard, 2010-2015 32
A RPS Class I Compliance Summary, 2015 36
B RPS Solar Carve-Out Compliance Summary, 2015 36
C RPS Solar Carve-Out II Compliance Summary, 2015 37
D RPS Class II Renewable Energy Compliance Summary, 2015 37
E RPS Class II Waste Energy Compliance Summary, 2015 38
F APS Alternative Energy Compliance Summary, 2015 38
G RPS Class I Compliance by Generation Location, 2003-2015 39
H RPS Class I Compliance by Generation Type, 2003-2015 39
I RPS Class I Compliance by Generation Location & Type, 2015 40
J RPS Class II Renewable Energy Compliance by Generation Location, 2009-2015 40
K RPS Class II Renewable Energy Compliance by Generation Type, 2009-2015 40
L APS Compliance by Generation Type, 2009-2015 41
M Voluntary Renewable Energy Certificates Retired for RGGI by Generation Location & Type, 2015 41
FIGURES
One MA RPS Class I Compliance, 2003-2015 12
Two 2015 RPS Class I Compliance by Generator Location 13
Three RPS Class I Compliance by Generator Location, 2003-2015 14
Four 2015 RPS Class I Compliance by Generator Type 15
Five RPS Class I Compliance by Generator Type, 2003-2015 15
Six RPS Class I Solar Carve-Out Compliance, 2010-2015 18
Seven New England Premium RPS Compliance Obligations by State, Actual (2010-2015)
& Projected (2016-2021) 26

Commonwealth of Massachusetts RPS & APS Annual Compliance Report for 2015
Department of Energy Resources October 10, 2017, page 3 of 41
EXECUTIVE SUMMARY
2015 was another significant year for the Massachusetts Renewable and Alternative Energy Portfolio
Standards (RPS and APS). RPS Class I certificates (RECs and SRECs) sourced from Massachusetts renewable
generation rose by almost 38% over 2014, largely due to continued growth in solar installations, and in-state facilities
were once again the largest single source of those certificates.
RPS is a statutory obligation created by the Electricity Restructuring Act of 1997 and activated by regulations
in 2002. The statute was revised by the Green Communities Act of 2008 to add the APS and a second class of RPS,
and it was further modified by the Competitively Priced Electricity Act of 2012 and the Renewable Thermal Act of
2014. The statute requires Massachusetts Retail Electricity Suppliers to obtain from qualified sources certain
percentages of the electricity needed to supply their retail customers each year. Sources eligible for RPS Class I are
post-1997 renewable units located in New England and on adjacent electricity grids; for the RPS Class II Renewable
Energy subclass, pre-1998 renewable plants; for the RPS Class II Waste Energy subclass, pre-1998 Massachusetts
waste-to-energy plants; and for APS, Massachusetts plants using certain “alternative energy” technologies, mostly
Combined Heat & Power. RPS Class I succeeded the original RPS that had began in 2003 with an obligation of 1%
and increased by 0.5% annually until it reached 4% in 2009. After 2009, the Class I obligation has increased by 1%
annually and was 10% in 2015. Since 2010, the Class I standard has included a Solar Carve-Out (SCO) obligation for
in-state solar photovoltaic generation. The SCO and its 2014 successor Solar Carve-Out II each began at less than
0.1% and rises annually per a formula set in regulation. The Class II Renewable Energy obligation rises annually per a
schedule and formula set in regulation, while the 3.5% Class II Waste Energy obligation does not increase annually.
The APS obligation increases by a schedule set in regulation.
Sixty Retail Electricity Suppliers had RPS and APS obligations in 2015. Of the 60, 59 met their obligations
with a mix of (a) 2015 Certificates purchased from the owners of qualified Generation Units, (b) Attributes banked
from 2013 and 2014 surplus Certificates, (c) reminted Solar Auction SRECs, and (d) Alternative Compliance Payments
(ACPs) in lieu of Certificates. One Supplier that had filed for bankruptcy in 2014 completed its dissolution in July of
2015 and did not submit a Compliance Filing. Each RPS Class I and Class II Renewable Energy Certificate (REC),
Solar Carve-Out Renewable Energy Certificate (SREC), and Waste Energy Certificate (WEC) represents the
Generation Attributes of one megawatt hour (MWh)1 of electricity generated during the Compliance Year by a
Generation Unit qualified for the relevant standard. The MWh value of some SREC-IIs are discounted by SREC
Factors related to project size and type of location. Alternative Energy Certificates (AECs) represent the APS
Attributes of the energy from APS qualified facilities during the Compliance Year, as calculated in a manner prescribed
in the APS regulations for each specific alternative energy technology.
The supply of 2015 RPS Class I RECs exceeded demand by 0.4%. The total retail load obligation in 2015 was
48,010 gigawatt hours (GWh),2 of which the average 7.65% RPS Class I obligation (10% minus the average 2.09%
Solar Carve-Out and the average 0.26% Solar Carve-Out II obligations within Class I)3 was 3,673 GWh. This
obligation was met by 3,689 GWh of 2015 Class I RECs purchased by the Suppliers and 487 GWh of banked
Attributes from 2013 and 2014 surplus RECs, plus 8 GWh of ACPs (costing about $553 thousand) paid by Suppliers
that fell short of their REC obligations (versus about $378 thousand for 2014). The net result was 520 GWh surplus
2015 Class I RECs, all of whose Attributes were bankable for 2016 or 2017 compliance.
MA RPS operates within a regional network of incentive programs, and RECs qualified for MA RPS Class I
can also be used for other purposes. A number of the RECs documented in the 2015 Filings were used by several MA
Suppliers to meet “green product” claims, i.e., to acquire RECs for customers who voluntarily signed up for 50% or
100% renewable electricity. Also, some RECs were transferred into the NEPOOL GIS “Reserve Account” for
retirement by various entities in MA as “green” or for other purposes. RECs qualifed for MA RPS Class I can also
qualify for RPS in other states, and almost 30% of MA-qualified RECs (net of SRECs, which are a sub-set of Class I
RECs) were used for RPS compliance in other New England states (mostly Connecticut, New Hampshire, and Rhode
Island), while some might have been used to meet voluntary green product claims outside MA. Thus, many more MA-
qualifed RECs are created than are used for Massachusetts RPS compliance.
1 One megawatt hour (MWh) = one thousand kilowatt hours (kWh) = one million watt hours of electrical energy. 2 One gigawatt hour (GWh) = one thousand MWh = one million kWh = one billion (US) watt hours of electrical energy. 3 See footnote 50 for an explanation of this year’s use of “average” Minimum Standard obligations for Class I RECs and SRECs.

Commonwealth of Massachusetts RPS & APS Annual Compliance Report for 2015
Department of Energy Resources October 10, 2017, page 4 of 41
The supply of RECs, SRECs, and SREC-IIs from Class I renewable sources within Massachusetts in 2015
grew by 420 GWh (38%) from 2014, the highest GWh increase among all locations. Geographically, resources in
Massachusetts (mostly solar, wind, and landfills) supplied 32% of all RPS Class I RECs settled for compliance. Maine
resources (especially wind) supplied more than 24% of all RPS Class I RECs, while New York (wind and landfills)
supplied 14%, adjacent Canadian provinces (wind) 12%, and New Hampshire (mostly wind and biomass) more than
10%, with the remaining 7% coming from other New England states. Most RPS Class I RECs came from electricity
generated by wind turbines (53%), solar photovoltaic (PV) arrays (25%), landfill methane-fired plants (12%), and
biomass (7%). The remainder came from a combination of hydroelectric, anaerobic digester gas, and marine &
hydrokinetic facilities. Solar PV continued to be the fastest growing type of renewable generation source, surpassing
landfill methane in 2015 as the second largest source behind wind.
For the RPS Solar Carve-Out (SCO) within Class I, continued growth in PV output did not keep pace with the
increase in SREC obligation, but the use of SRECs from prior years’ Solar Credit Clearinghouse Auctions minimized
use of the ACP option for compliance. Despite a shortfall in the market, a few SRECs were deposited into and sold
from the Auction. The 757 GWh supply of 2015-generated SRECs was short of the 1,005 GWh required to meet the
RPS SCO obligation, which averaged 2.0934% in 2015. Of the 757 GWh, only 2 GWh were deposited into the
Auction, and 755 GWh were used for SCO compliance, along with 36 GWh banked from 2014 and 220 GWH of
reminted SRECs from prior years’ Solar Auctions, while 12 GWh of net surplus were banked forward. Some of the
obligation was met with 3 GWh worth of ACPs, totaling $1.53 million (versus under $554 thousand for 2014).
For the second year of the Solar Carve-Out II, the supply of SREC-IIs exceeded demand. After netting out the
retail load obligation under contracts that predated the April 25, 2014, regulatory change, the net retail load obligation
was almost 37,494 GWh, and the 0.3288% SREC-II obligation was about 123 GWh (which is 0.2569% of the total
retail load obligation). That obligation was met by almost 126 GWh of 2015 SREC-IIs, while more than 3 GWh
surplus was banked forward. Less than 1 GWh of shortfall by some Suppliers was met by ACPs, totaling less than
$236 thousand (versus over $2.11 million for 2014). An additional 67 GWh of surplus 2015 SCREC-IIs were
deposited into and sold from DOER’s Solar Auction.
The supply of Class II RECs in 2015 for the RPS Class II Renewable Energy obligation of 2.0% fell further
short of demand in 2015 than in 2014. The 960 GWh obligation was met with 539 GWh of RECs (mostly hydro) and
103 GWh of 2013 & 2014 banked RECs, from which 18 GWh were banked forward. A shortfall of 333 GWh was met
by ACPs of over $9.17 million (versus almost $7.29 million for 2014).
The supply of WECs for the RPS Class II Waste Energy requirement exceeded demand. However, although
almost 1,785 GWh of WECs were generated in 2015, Suppliers obtained only 1,620 GWh of WECs to meet the 3.5%
obligation, which totaled 1,679 GWh. In addition, Suppliers used 53 GWh banked from 2014 surplus. More than one-
third of the Suppliers also used about 17 GWh of ACPs, totaling over $188 thousand (versus just over $32 thousand for
2014).
The supply of almost 895 GWh of AECs for the Alternative Energy Portfolio Standard (APS), plus less than 1
GWh banked from 2014 surplus, was significantly short of the 1,799 GWh needed to meet the 3.75% obligation.
Consequently more than 902 GWh (over 50%) of the APS obligation were met by ACPs totaling more than $19.87
million (versus almost $18.15 million for 2014), and fewer than 3 GWh of surplus AECs were banked forward. Almost
all AECs came from combined heat and power (CHP) plants.
The total Alternative Compliance Payments (ACPs) for all classes of RPS and APS was more than $3 million
higher than for 2014, an increase of 11%.The compliance obligations accumulated by the one bankrupt Supplier before
its dissolution totaled $2,238,972.66 in unrealized Alternative Compliance Payments. (Details are in Appendix One.)
In sum, RPS Class I continued its intended role of incentivizing the accelerated development of new
Renewable Generation Units, while RPS Class II continued incentivizing ongoing and improved operation of older
renewable and waste energy facilities. The APS incentive has increased the financial viability of new and incremental
CHP projects, which generate large savings in net, source-fuel consumption when compared with conventional sources
of electricity and thermal energy. Finally, the Solar Carve-Out II in RPS Class I continued to provide incentives for the
growth of in-state PV installations. The robust response to this program will result in MA meeting its 2020 goal of
1,600 MW of installed capacity long before 2020.

Commonwealth of Massachusetts RPS & APS Annual Compliance Report for 2015
Department of Energy Resources October 10, 2017, page 5 of 41
SECTION ONE
INTRODUCTION TO THE RENEWABLE & ALTERNATIVE ENERGY
PORTFOLIO STANDARDS
This section describes the Massachusetts Renewable and Alternative Energy Portfolio Standards
(RPS and APS) as structured in 2015 pursuant to the Green Communities Act of 2008 (the “2008 Act”)
the Competitively Priced Electricity Act of 2012 (the “2012 Act”), and the 2014 Act Relative to Credit
for Thermal Energy Generated with Renewable Fuels (the “2014 Act”).4 The last two paragraphs briefly
summarize changes that took effect during and after 2015.
The Electricity Restructuring Act of 1997 mandated the Renewable Energy Portfolio Standard,
RPS, one of the earliest such mandates in the nation. The original RPS obligated Retail Electricity
Suppliers (“Suppliers”), both regulated distribution Utilities and licensed Competitive Suppliers, to
obtain for their retail customers a small but growing percentage of electricity (the “Minimum Standard”)
from sources that qualified as New Renewable Generation Units, namely generators that began
operation after 1997 and used eligible renewable resources and technologies – especially solar, wind,
landfill methane, and low-emission/advanced technology biomass5. The RPS began with an obligation
of one percent in 2003 and increased by a half percent annually through 2009, when it reached four
percent. Under the 2008 Act, the RPS was renamed RPS Class I and, since 2009, has increased by one
percent annually. The obligation was ten percent for 2015 and will be twenty percent in 2025, after
which it will continue rising.6 In addition to RPS Class I, as of 2009 the Suppliers must comply with
three new energy portfolio standards mandated by the 2008 Act, and, as of 2010, with a Solar Carve-Out
within Class I7. As of 2014, an additional Solar Carve-Out II within Class I went into effect. The 2008
statute also mandated a new RPS Class II for electricity from pre-1998 generation units, divided into
two subclasses – one for renewable energy and one for waste-to-energy – and a new Alternative Energy
Portfolio Standard (APS) for energy from combined heat & power (CHP) and some other technologies.
All of the Minimum Standards are structured as percentage obligations for Suppliers, but with each
Minimum Standard having different eligibility criteria and percentage obligations.
In 2009, the changes mandated by the 2008 Act were implemented in three Regulations,
respectively for RPS Class I, RPS Class II, and the Alternative Energy Portfolio Standard.8 The new
Regulations for RPS Class I continues to limit eligibility to post-1997 Generation Units, but with some
grandfathered Vintage Generation Units from RPS still partially qualified, and, as of 2010, with a
4 The RPS provisions of the ElectricUtility Industry Restructuring Act of 1997
(https://malegislature.gov/Laws/SessionLaws/Acts/1997/Chapter164), later replaced by provisions of the Green Communities Act of 2008
(http://www.malegislature.gov/Laws/SessionLaws/Acts/2008/Chapter169) and further amended by the Competitively Priced Electricity
Act of 2012 (https://malegislature.gov/Laws/SessionLaws/Acts/2012/Chapter209), are incorporated into law in M.G.L., c. 25A, §11F
(http://www.malegislature.gov/Laws/GeneralLaws/PartI/TitleII/Chapter25A/Section11F). APS provisions are in M.G.L., c. 25A, §11F½
(https://malegislature.gov/Laws/GeneralLaws/PartI/TitleII/Chapter25A/Section11F1~2), as amended by the 2014 Act, “An Act Relative to
Credit for Thermal Energy Generated with Renewable Fuels” (https://malegislature.gov/Laws/SessionLaws/Acts/2014/Chapter251). That
last amendment is addressed in the penultimate paragraph of this section of the Report. 5 In the case of woody biomass, the regulations since 2012 has included detailed fuel sourcing and energy conversion efficiency standards
based on forest sustainability and life-cycle carbon dioxide (CO2) emissions, informed by a DOER-commissioned, 2010 study on the
relative environmental impacts of woody biomass as a fuel supply. See the Biomass Sustainability and Carbon Policy Study (a.k.a. Manomet Study) webpage and the RPS Biomass Policy Regulatory Process webpage. 6 The RPS law and regulations do not include final limits or ending dates except for the Solar Carve-Out & Solar Carve-Out II regulations. 7 Each year’s Class I obligation equals the obligation scheduled in regulation, 225 CMR 14.07(1), minus the Solar Carve-Out obligations that are calculated per a method specified in regulation, 225 CMR 14.07(2). Also see the second paragraph of Section Two of this Report. 8 The Regulations – 225 CMR 14.00 (RPS Class I), 15.00 (Class II), and 16.00 (APS) – became effective on an “Emergency” basis on
January 1, 2009, and the subsequent rulemaking concluded with the promulgation of final revised Regulations effective on June 12, 2009.
The RPS Class I regulations were subsequently revised to include a Solar Carve-Out standard on an Emergency basis in January of 2010, launching a process that culminated in December of 2010, and was revised again in 2014 to add a follow-up Solar Carve-Out II standard.

Commonwealth of Massachusetts RPS & APS Annual Compliance Report for 2015
Department of Energy Resources October 10, 2017, page 6 of 41
“carve-out” for post-2007 solar photovoltaic projects. The list of RPS eligible resources was expanded
to include hydroelectricity plants of small size and low environmental impact9, as well as geothermal
and “marine and hydro-kinetic” facilities. In addition, as of 2009, Behind-the-Meter distributed
generation units, which formerly had to be located within Massachusetts, could be located anywhere in
the ISO New England (“ISO-NE”) control area (the New England grid), but all such generation now
must be reported to the NEPOOL Generation Information System (“GIS”)10
by independent Third Party
Meter Readers (a.k.a., “Independent Verifiers”).11
Under the Solar Carve-Out (“SCO”) Minimum Standard, each Supplier must demonstrate
annually that, within its Class I percentage obligation, it has obtained a specified, much smaller
percentage of its electricity from solar photovoltaic (“PV”) systems that are Massachusetts electric grid-
connected and were installed after 2008. The SCO percentage obligation rises annually through a
methodology detailed in the Class I Regulations (225 CMR 14.07(2)). On a dollar per MWh of energy
basis, PV is typically costlier to install than the other major Class I renewable technologies. That
expense is reflected in higher Alternative Compliance Payment (“ACP”) rates (see below), with the
original intent of providing sufficient incentive to bring 400 MW of new PV generating capacity on line
in Massachusetts by 2017. That goal was surpassed in 2013, and, following an interim extension by
Emergency regulations and then conventional rulemaking, DOER commenced on April 25, 2014, the
follow-up Solar Carve-Out II (“SCO II”, a.k.a., SREC-II) within Class I. The start of the SCO II marked
the end of the SCO, which eventually qualified a total of 653.3MW. 12
The Solar Carve-Out II (“SCO II”) is modeled on the SCO with regard to project eligibility,
except that installation has to have commenced after 2012. Within that model, SCO II has three major
differences: (1) the Clearinghouse Auction Account prices undergo scheduled reductions to reflect
declining development costs; (2) some types and sizes of projects are provided less incentive than
others, reflecting public policy priorities; and (3) certain types of large-scale projects are approved under
an annual cap within a system of “managed growth” intended to avoid any boom/bust pattern of
development. Approvals of PV systems under the SCO II were capped at 946.7 MW of installed
capacity, which was designed to meet the Commonwealth’s new capacity goal of 1,600 MW by 2020
minus 653.3 MW qualified under the original SCO. However, the market reacted robustly to SCO II,
and that goal of qualifying 1,600 MW was within sight by late in 2015. DOER’s response and further
new developments for PV incentives are recounted in the last paragraph of the SCO II section of the
report.
RPS Class II is limited to, and intended to support the continued operation of, two classes of
pre-1998 Generation Units. The RPS Class II Renewable Energy Minimum Standard is for Units that
meet the same technology, resource, and location criteria as Class I, but with a lower per-facility MW
9 Hydroelectric plants in Class I initially were limited to post-1997 facilities of no more than 25 MW or to incremental output at pre-1998
facilities attributable to added capacity or efficiency improvements amounting to no more than 25 MW, while the Class II per-facility
capacity limit was 5 MW. However, under the 2012 Act, the eligible hydroelectricity capacity limits were increased, effective as of
November 1, 2012, to 30 MW in Class I and 7.5 MW in Class II. In addition, statutory environmental criteria apply to facilities under both
Class I and Class II; these criteria normally are met through certification by the non-profit, Low Impact Hydropower Institute (LIHI). See the details for Class I hydropower in 225 CMR 14.05(1)(a)6 and for Class II hydropower in 225 CMR 15.05(1)(a)6. 10 See http://www.nepoolgis.com, as well as the Generation Certificates paragraph on page 7. 11 Another substantive change in RPS Class I was the addition of a provision that a qualified plant not commit its generation capacity to
Control Areas other than ISO-NE, with some exceptions. In addition, non-intermittent generators now must participate in the ISO-NE
Forward Capacity Market except to the extent that their capacity is previously committed elsewhere. For details, see 225 CMR 14.05(1)(e).
In the case of plants outside of ISO-NE, the import rules now also include a “round-tripping” prohibition, for which see 225 CMR 14.05(5)(d). 12 For more details about the Solar Carve-Out and Solar Carve-Out II, see footnote 47, and visit this page at the RPS/APS homepage.

Commonwealth of Massachusetts RPS & APS Annual Compliance Report for 2015
Department of Energy Resources October 10, 2017, page 7 of 41
capacity limit for hydropower13
. A 2014 Class II regulatory revision lowered the previously constant
Minimum Standard of 3.6% to 1.5% for 2013, 1.75% for 2014, 2.0% for 2015, and it provided a
methodology for subsequent annual adjustments. The RPS Class II Waste Energy Minimum Standard
of 3.5% provides incentives for pre-1998 Waste Energy generation. The Class II eligibility of Waste
Energy Generation Units – a.k.a., trash-to-energy or municipal solid waste plants – is conditioned on
recycling and other regulatory criteria specific to Massachusetts. The 2014 regulatory revision also
changed the WEC banking provisions, as noted in Section Six of this report.
The Alternative Energy Portfolio Standard (“APS”) is limited to, and intended to support,
certain “alternative,” largely non-renewable, technologies and resources whose development the
Legislature deemed worthy of incentives modeled on RPS.14
Two APS technologies are active to date:
Flywheel Storage and Combined Heat and Power (“CHP”, a.k.a., cogeneration).15
The Alternative
Energy Certificates (AECs) earned by a CHP Unit represent the energy saved (in MWh) by operating
the Unit as a CHP Unit instead of separately operating an on-site thermal plant while drawing electricity
from the grid.16
The quantity of AECs earned by a Flywheel Storage Unit is equal to 65% of the
electricity discharged by the Unit and represents a value placed upon the Unit’s reduction of peak power
generation and voltage regulation.
Generation Certificates are the means by which Retail Electricity Suppliers meet their annual
RPS and APS obligations. Each Supplier must acquire a sufficient quantity of MA RPS Class I and
Class II qualified Renewable Energy Certificates (RECs), Solar Carve-Out Renewable Energy
Certificates (SRECs), Solar Carve-Out II Renewable Energy Certificates (SREC-IIs), Class II Waste
Energy Certificates (WECs), and APS qualified Alternative Energy Certificates (AECs) to meet its six
Minimum Standards each year. These certificates are created, recorded, and tracked by the NEPOOL
Generation Information System (GIS).17
The GIS tracks all electricity generated within the ISO-NE
control area and/or fed onto the New England grid, as well as electricity exchanged between ISO-NE
and adjacent control areas.18
For each megawatt-hour (MWh) of electricity, whether renewable or not,
the GIS creates and deposits one serially-numbered, electronic certificate in the account of the entity that
generated the MWh in ISO-NE or imported the MWh from an adjacent control area. Any certificate for
energy output that qualifies for one or more of the New England states’ energy portfolio standards is
coded as such.19
A Supplier with a Massachusetts portfolio standard obligation purchases RECs,
13 See footnote 9 for details regarding the Hydroelectric MW limits. See footnote 5 for the Class I woody biomass eligibility standards that were extended to Class II woody biomass in a rulemaking during the first half of 2014. 14 The APS statute is at http://www.malegislature.gov/Laws/GeneralLaws/PartI/TitleII/Chapter25A/Section11F1~2. 15 Other technologies originally qualified under APS included (1) displacement of fossil fuels by certain paper-derived fuel cubes, (2) coal
gasification with permanent carbon sequestration, and (3) “efficient steam technology” (undefined in statute). Stringent carbon dioxide
emission reductions and other emission and efficiency criteria apply. However, regulations have not been developed for the third of the
three technologies listed here, and Chapter 251 of the Acts of 2014 both removed the first two technologies and added “renewable thermal”
to APS as of 2015. Regarding renewable thermal, see the penultimate paragraph in Section One and the last paragraph of Section Eight of this Report. 16 For how an AEC is calculated for CHP Units, see the APS Regulations in 225 CMR 16.05(1)(a)2 and the APS Guideline for CHP. 17 See www.nepoolgis.com. 18 The ISO-NE “control area”, covering most of New England, is a geographic region in which a common control system is used to
maintain scheduled interchange of electrical energy within the region and exchanged with adjacent control areas. ISO New England Inc. is
the “independent system operator” (ISO) for the ISO-NE control area, operating the New England electric power grid. It also qualifies as
the “regional transmission operator” (RTO) under the rules of the Federal Energy Regulatory Commission (FERC). See http://www.iso-ne.com/about. 19 Each REC is encoded with Attributes that indicate the Generation Unit name, location, and fuel, energy resource or technology, as well
as whether or not the Generation Unit and its RECs are qualified for each of the several New England state RPSs. A Massachusetts
qualified REC that is also qualified for RPS in another New England state can be sold, transferred, and used to meet either state’s RPS or
other energy portfolio standard obligation. However, by the end of each GIS Certificate trading year (midnight on June 15 of the year
following the Compliance Year), each REC can be located in only one state-specific Supplier sub-account at the NEPOOL GIS, which

Commonwealth of Massachusetts RPS & APS Annual Compliance Report for 2015
Department of Energy Resources October 10, 2017, page 8 of 41
SRECs, SREC-IIs, WECs, and AECs from qualified generators, either directly or via brokers, and they
are electronically transferred from the generators’ GIS accounts to the Supplier’s GIS account. Each
GIS certificate qualified for a Massachusetts portfolio standard can be used for compliance with only the
standard for which it is qualified; thus, for example, a Class I REC can be used only for Class I
compliance, a Class II WEC only for Class II Waste Energy compliance. However, since SRECs and
SREC-IIs are for “carve-outs” within Class I and are encoded at the GIS as types of Class I RECs, they
can be used for non-SCO, non-SCO II, Class I Renewable Energy compliance.
Transition provisions were required when each new Minimum Standard was added to the
original RPS. A major but temporary statutory difference between RPS Class I and the newer standards
(RPS Class II and APS) was a transition mechanism designed to mitigate for Competitive Suppliers the
price impact of adding the newer standards in 2009. Competitive Suppliers, unlike regulated Utilities,
were unable to pass the additional compliance costs along to retail customers with whom they already
had contracted to deliver electricity at prices that did not include the purchase of the newly-required
Class II RECs, WECs, and AECs. A Competitive Supplier, rather than having to comply with RPS
Class II or APS for its entire retail load, had to meet those standards only for the portion of its load that
is served under contracts that were executed or extended on or after January 1, 2009. Accordingly, each
such Supplier was required to report in its Filing to DOER the quantity of electricity delivered under
pre-2009 contracts (“Exempt Load”) and to subtract that amount from the total load reported for Class I,
in order to ascertain the net amount on which to base its RPS Class II and APS obligations. In addition,
each Supplier was required to project its Exempt Load for the next five years; these confidential data are
reported in the aggregate in Section Eight, Table Eight. This exemption has declined rapidly, and only
one Supplier still had a small Exempt Load in 2015, which will end sometime in 2016. Likewise, each
of the two Solar Carve-Outs has been provided with multiple contract date-based transition provisions.
Alternative Compliance Payments (“ACPs”) serve as an essential mechanism for RPS and
APS compliance, increasing its flexibility. If a Supplier does not acquire sufficient certificates to meet a
given Minimum Standard, then it can comply by making a payment to the Massachusetts Clean Energy
Center (“MassCEC”) in lieu of certificates and at a per-MWh rate specified for each Minimum Standard.
This is intended, not as a penalty, but as an alternative that acknowledges that sufficient certificates for a
given Minimum Standard may not always be available in the marketplace. The ACP Rate also
functions, in effect, as a cap each year on the value of certificates for each Minimum Standard.20
Banking provides another important mechanism for RPS and APS compliance flexibility. The
RPS or APS Attribute represented by a certificate that is in excess of the quantity that a Supplier needs
for compliance with one of the Minimum Standards in a given Compliance Year (the same as a calendar
year) can be “banked” for use towards that same Minimum Standard21
in one of the following two
Compliance Years. The total amount that a Supplier can bank is limited to no more than 30% of the
amount the Supplier needs for compliance in the Compliance Year in which the surplus generation
occurs, but only 10% in the case of the Solar Carve-Outs.22
prevents double-counting of RECs. Each state’s RPS statute and regulations define the RPS eligibility of generation a bit differently, and
those definitions can be changed over time by each state. Thus, not every GIS certificate that is termed a REC is qualified for MA RPS. 20 See the ACP webpage for additional details, and see the regulations in 225 CMR 14.07, 15.07, and 16.07. In addition, see Section Nine of this report for details about ACP collection and expenditure. 21 For example, banked Attributes from excess Class I and Class II certificates are not interchangeable, nor are Class II RECs and WECs. However, banked Attributes from excess Class I SRECs can be used towards either SCO or Class I compliance. 22 However, note that surplus Class II WECs from 2014 and 2015 Compliance Years cannot be banked, after which the banking limit for WECs will be 5%, instead of the former 30%, per a 2014 Class II regulatory change in 225 CMR 15.08(2)(b). Also see page 30.
Commonwealth of Massachusetts RPS & APS Annual Compliance Report for 2015
Department of Energy Resources October 10, 2017, page 9 of 41
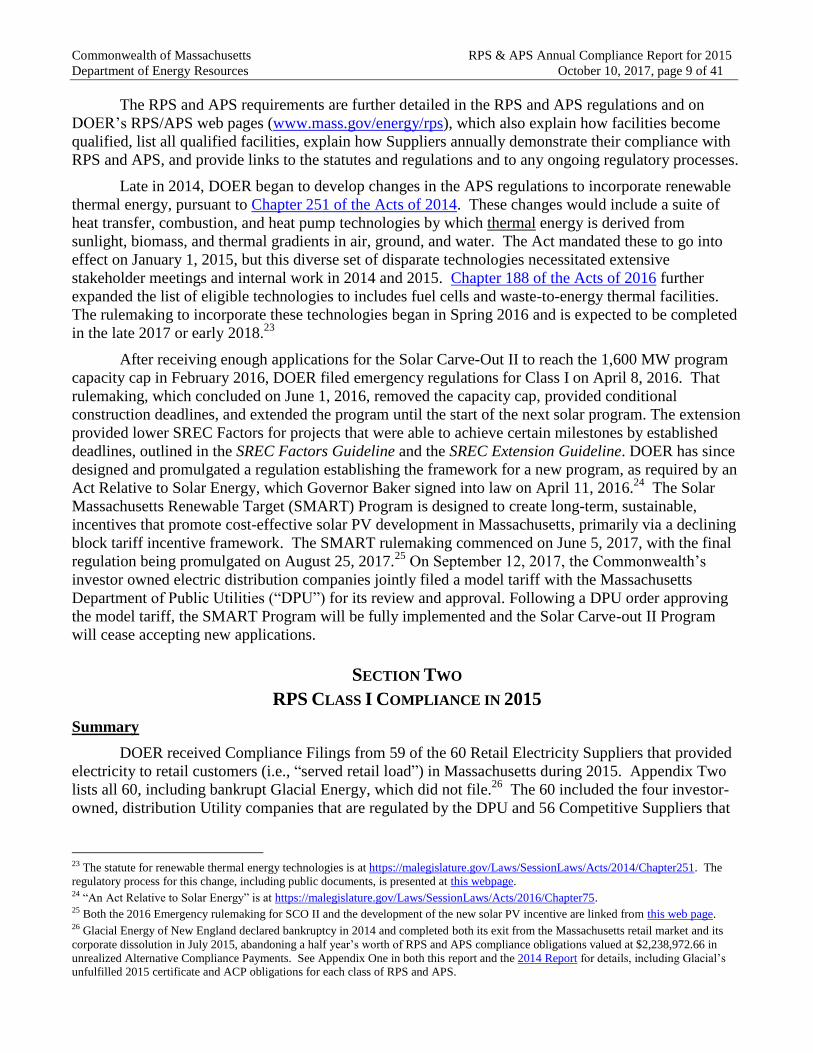
The RPS and APS requirements are further detailed in the RPS and APS regulations and on
DOER’s RPS/APS web pages (www.mass.gov/energy/rps), which also explain how facilities become
qualified, list all qualified facilities, explain how Suppliers annually demonstrate their compliance with
RPS and APS, and provide links to the statutes and regulations and to any ongoing regulatory processes.
Late in 2014, DOER began to develop changes in the APS regulations to incorporate renewable
thermal energy, pursuant to Chapter 251 of the Acts of 2014. These changes would include a suite of
heat transfer, combustion, and heat pump technologies by which thermal energy is derived from
sunlight, biomass, and thermal gradients in air, ground, and water. The Act mandated these to go into
effect on January 1, 2015, but this diverse set of disparate technologies necessitated extensive
stakeholder meetings and internal work in 2014 and 2015. Chapter 188 of the Acts of 2016 further
expanded the list of eligible technologies to includes fuel cells and waste-to-energy thermal facilities.
The rulemaking to incorporate these technologies began in Spring 2016 and is expected to be completed
in the late 2017 or early 2018.23
After receiving enough applications for the Solar Carve-Out II to reach the 1,600 MW program
capacity cap in February 2016, DOER filed emergency regulations for Class I on April 8, 2016. That
rulemaking, which concluded on June 1, 2016, removed the capacity cap, provided conditional
construction deadlines, and extended the program until the start of the next solar program. The extension
provided lower SREC Factors for projects that were able to achieve certain milestones by established
deadlines, outlined in the SREC Factors Guideline and the SREC Extension Guideline. DOER has since
designed and promulgated a regulation establishing the framework for a new program, as required by an
Act Relative to Solar Energy, which Governor Baker signed into law on April 11, 2016.24
The Solar
Massachusetts Renewable Target (SMART) Program is designed to create long-term, sustainable,
incentives that promote cost-effective solar PV development in Massachusetts, primarily via a declining
block tariff incentive framework. The SMART rulemaking commenced on June 5, 2017, with the final
regulation being promulgated on August 25, 2017.25
On September 12, 2017, the Commonwealth’s
investor owned electric distribution companies jointly filed a model tariff with the Massachusetts
Department of Public Utilities (“DPU”) for its review and approval. Following a DPU order approving
the model tariff, the SMART Program will be fully implemented and the Solar Carve-out II Program
will cease accepting new applications.
SECTION TWO
RPS CLASS I COMPLIANCE IN 2015
Summary
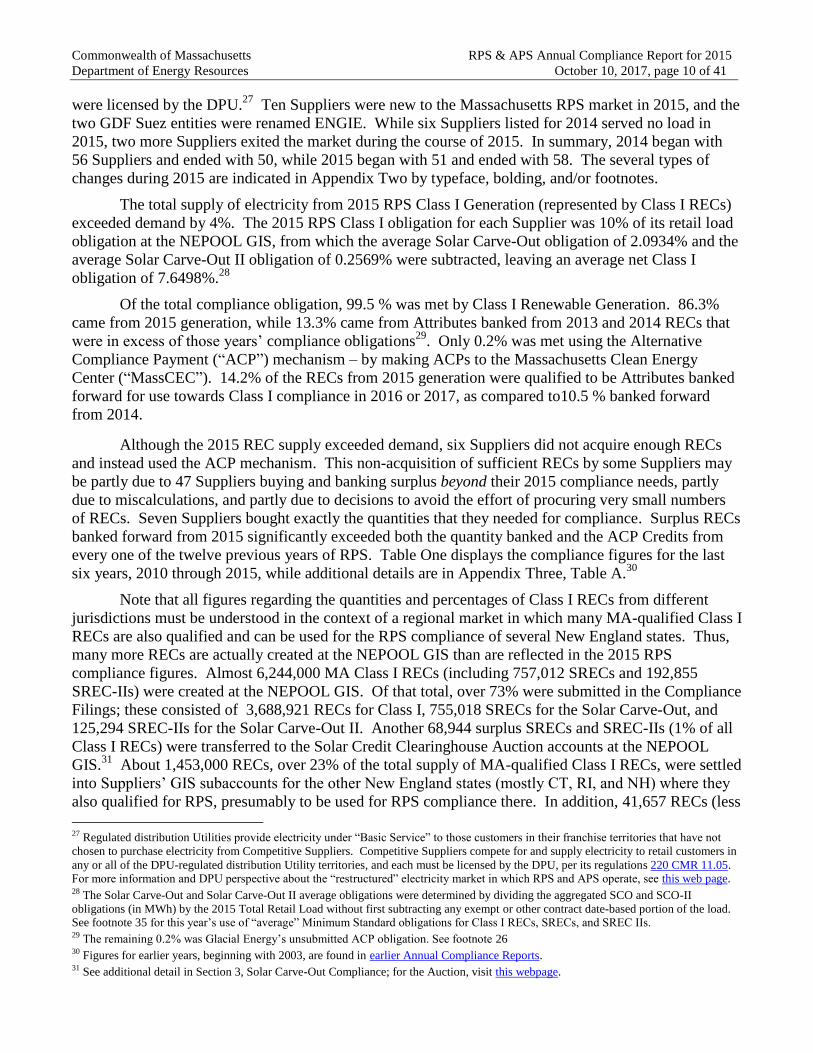
DOER received Compliance Filings from 59 of the 60 Retail Electricity Suppliers that provided
electricity to retail customers (i.e., “served retail load”) in Massachusetts during 2015. Appendix Two
lists all 60, including bankrupt Glacial Energy, which did not file.26
The 60 included the four investor-
owned, distribution Utility companies that are regulated by the DPU and 56 Competitive Suppliers that
23 The statute for renewable thermal energy technologies is at https://malegislature.gov/Laws/SessionLaws/Acts/2014/Chapter251. The
regulatory process for this change, including public documents, is presented at this webpage. 24 “An Act Relative to Solar Energy” is at https://malegislature.gov/Laws/SessionLaws/Acts/2016/Chapter75. 25 Both the 2016 Emergency rulemaking for SCO II and the development of the new solar PV incentive are linked from this web page. 26 Glacial Energy of New England declared bankruptcy in 2014 and completed both its exit from the Massachusetts retail market and its
corporate dissolution in July 2015, abandoning a half year’s worth of RPS and APS compliance obligations valued at $2,238,972.66 in
unrealized Alternative Compliance Payments. See Appendix One in both this report and the 2014 Report for details, including Glacial’s unfulfilled 2015 certificate and ACP obligations for each class of RPS and APS.
Commonwealth of Massachusetts RPS & APS Annual Compliance Report for 2015
Department of Energy Resources October 10, 2017, page 10 of 41
were licensed by the DPU.27
Ten Suppliers were new to the Massachusetts RPS market in 2015, and the
two GDF Suez entities were renamed ENGIE. While six Suppliers listed for 2014 served no load in
2015, two more Suppliers exited the market during the course of 2015. In summary, 2014 began with
56 Suppliers and ended with 50, while 2015 began with 51 and ended with 58. The several types of
changes during 2015 are indicated in Appendix Two by typeface, bolding, and/or footnotes.
The total supply of electricity from 2015 RPS Class I Generation (represented by Class I RECs)
exceeded demand by 4%. The 2015 RPS Class I obligation for each Supplier was 10% of its retail load
obligation at the NEPOOL GIS, from which the average Solar Carve-Out obligation of 2.0934% and the
average Solar Carve-Out II obligation of 0.2569% were subtracted, leaving an average net Class I
obligation of 7.6498%.28
Of the total compliance obligation, 99.5 % was met by Class I Renewable Generation. 86.3%
came from 2015 generation, while 13.3% came from Attributes banked from 2013 and 2014 RECs that
were in excess of those years’ compliance obligations29
. Only 0.2% was met using the Alternative
Compliance Payment (“ACP”) mechanism – by making ACPs to the Massachusetts Clean Energy
Center (“MassCEC”). 14.2% of the RECs from 2015 generation were qualified to be Attributes banked
forward for use towards Class I compliance in 2016 or 2017, as compared to10.5 % banked forward
from 2014.
Although the 2015 REC supply exceeded demand, six Suppliers did not acquire enough RECs
and instead used the ACP mechanism. This non-acquisition of sufficient RECs by some Suppliers may
be partly due to 47 Suppliers buying and banking surplus beyond their 2015 compliance needs, partly
due to miscalculations, and partly due to decisions to avoid the effort of procuring very small numbers
of RECs. Seven Suppliers bought exactly the quantities that they needed for compliance. Surplus RECs
banked forward from 2015 significantly exceeded both the quantity banked and the ACP Credits from
every one of the twelve previous years of RPS. Table One displays the compliance figures for the last
six years, 2010 through 2015, while additional details are in Appendix Three, Table A.30
Note that all figures regarding the quantities and percentages of Class I RECs from different
jurisdictions must be understood in the context of a regional market in which many MA-qualified Class I
RECs are also qualified and can be used for the RPS compliance of several New England states. Thus,
many more RECs are actually created at the NEPOOL GIS than are reflected in the 2015 RPS
compliance figures. Almost 6,244,000 MA Class I RECs (including 757,012 SRECs and 192,855
SREC-IIs) were created at the NEPOOL GIS. Of that total, over 73% were submitted in the Compliance
Filings; these consisted of 3,688,921 RECs for Class I, 755,018 SRECs for the Solar Carve-Out, and
125,294 SREC-IIs for the Solar Carve-Out II. Another 68,944 surplus SRECs and SREC-IIs (1% of all
Class I RECs) were transferred to the Solar Credit Clearinghouse Auction accounts at the NEPOOL
GIS.31
About 1,453,000 RECs, over 23% of the total supply of MA-qualified Class I RECs, were settled
into Suppliers’ GIS subaccounts for the other New England states (mostly CT, RI, and NH) where they
also qualified for RPS, presumably to be used for RPS compliance there. In addition, 41,657 RECs (less
27 Regulated distribution Utilities provide electricity under “Basic Service” to those customers in their franchise territories that have not
chosen to purchase electricity from Competitive Suppliers. Competitive Suppliers compete for and supply electricity to retail customers in
any or all of the DPU-regulated distribution Utility territories, and each must be licensed by the DPU, per its regulations 220 CMR 11.05. For more information and DPU perspective about the “restructured” electricity market in which RPS and APS operate, see this web page. 28 The Solar Carve-Out and Solar Carve-Out II average obligations were determined by dividing the aggregated SCO and SCO-II
obligations (in MWh) by the 2015 Total Retail Load without first subtracting any exempt or other contract date-based portion of the load. See footnote 35 for this year’s use of “average” Minimum Standard obligations for Class I RECs, SRECs, and SREC IIs. 29 The remaining 0.2% was Glacial Energy’s unsubmitted ACP obligation. See footnote 26 30 Figures for earlier years, beginning with 2003, are found in earlier Annual Compliance Reports. 31 See additional detail in Section 3, Solar Carve-Out Compliance; for the Auction, visit this webpage.
Commonwealth of Massachusetts RPS & APS Annual Compliance Report for 2015
Department of Energy Resources October 10, 2017, page 11 of 41
than 1%) were identified in voluntary “green power product” sales.32
Finally, just under 42,000 RECs
were minted but not transferred at the GIS, presumably not sold by the generators.
Table One
Aggregated Data from the RPS Class I Annual Compliance Filings, 2010-2015 (MWh)
(without the Solar Carve-Outs)33
2015 2014 2013 2012 2011 2010
CY Retail Sales (= Retail Load Obligation) 34 48,009,723 48,129,294 49,252,929 48,992,430 49,386,169 50,026,093
CY average net Minimum Standard (% obligation)35 7.6498% 8.0081% 7.714% 6.837% 5.8373% 4.9321%
CY aggregated compliance obligation36 3,672,667 3,854,245 3,799,402 3,349,611 2,882,823 2,467,336
Total RECs from CY generation 3,688,921 3,979,958 4,064,043 3,056,894 2,613,122 2,323,609
minus CY total surplus RECs (520,378) (404,133) (330,272) (70,022) (107,805) (241,062)
Net CY RECs for CY obligation 3,168,543 3,575,825 3,733,771 2,986,872 2,505,317 2,082,547
plus Banked from pre-CY surpluses 486,857 272,660 31,102 107,351 271,303 380,824
Total RECs used for CY obligation 3,655,400 3,848,485 3,764,873 3,094,223 2,776,620 2,463,371
plus Total ACP Credits 8,247 5,719 31,642 255,388 106,203 3,965
Total for compliance obligation37 3,663,647 3,854,204 3,796,515 3,349,611 2,882,823 2,467,336
Surplus Attributes banked forward38 520,378 403,976 328,984 69,916 107,804 241,061
ACP proceeds (rounded) $553,126 $378,369 $2,065,273 $16,350,132 $6,598,386 $241,551
32 These Class I RECs retired as “Voluntary Renewable Energy (VRE) purchases,” from both the 2015 Filings and NEPOOL GIS Reserved
Certificates Report, were reported to the Massachusetts Department of Environmental Protection (MassDEP), which, in turn, will retire a
calculated number of allowances for a future vintage year in the Regional Greenhouse Gas Initiative (RGGI). The retired allowances
represent the Greenhouse Gas emissions avoided by 41,657 MWh of renewable energy. That quantity will reduce the number of
allowances that can be sold in the RGGI Auction for that future year, which will, in turn, slightly reduce the regional allowance cap for
non-renewable thermal power plants for that year. DOER’s regulatory basis for this report is the CO2 Budget Trading Program Auction
Regulations, 225 CMR 13.14. More information about RGGI can be found at http://www.rggi.org/. The location and types of generation from which VRE was sourced in 2015 are listed in Table M in Appendix Four. 33 CY is the abbreviation for Compliance Year, coterminous with a calendar year. These are aggregated figures, with compliance
calculated separately for each Supplier, and with fractions always rounded upwards. Therefore, if one calculated the RPS Obligation using
the total “CY Retail Sales,” the result usually would be less than the “CY Aggregated Compliance Obligation” listed in this table and
elsewhere in the report. This is true for all RPS classes and for APS. For data from earlier years, see earlier Annual Compliance Reports. 34 DOER requires that each supplier use as its “retail electricity sales” the CY’s total of its “90 Day Resettlement figures” provided to the
Suppliers by the regulated utilities both directly and via DOER. For additional detail, see the 5/24/12 Guideline for Retail Electricity
Suppliers on the Determination of Sales to End-use Customers for Calculating the Annual RPS Obligation. DOER uses the term “retail load obligation” or just “load obligation” to refer to these figures. 35 The RPS Class I average net Minimum Standard obligation for each of the CYs after 2009 is calculated by subtracting from that CY’s
scheduled percentage the average Solar Carve-out and (starting with 2014) the average Solar Carve-out II Minimum Standards. The RPS
Class I Minimum Standard is stated as “average” because each Retail Supplier’s may differ due to the complications of the Minimum Standards for the two Solar Carve-Outs within Class I. See Sections Three and Four, as well as footnotes 49 and 62. 36 Note that the figures in this row usually are a bit higher than what one would obtain by multiplying the total Retail Sales by the Minimum Standard for each year, as explained in footnote 33. 37 A 920 MWh shortfall in the 2015 total resulted from Glacial Energy’s failure to make its required ACP. See footnote 26. 38 The annually varying differences between the quantity of surplus Attributes (RECs) and the quantity banked are due to some Suppliers
purchasing more RECs than the limit that they are permitted to bank. A Supplier cannot bank a quantity of RECs that is greater than 30%
of its total RPS compliance obligation for the year in which those RECs were generated (only 10% for SRECs and SREC IIs). Banked
RPS Class I RECs can be applied to compliance only with the RPS Class I obligation, not any other portfolio standard class or subclass and
not the Solar Carve-Outs. However, since SRECs and SREC IIs are a type of Class I REC, those that are banked can be used for Class I compliance.
Commonwealth of Massachusetts RPS & APS Annual Compliance Report for 2015
Department of Energy Resources October 10, 2017, page 12 of 41
Compliance Details
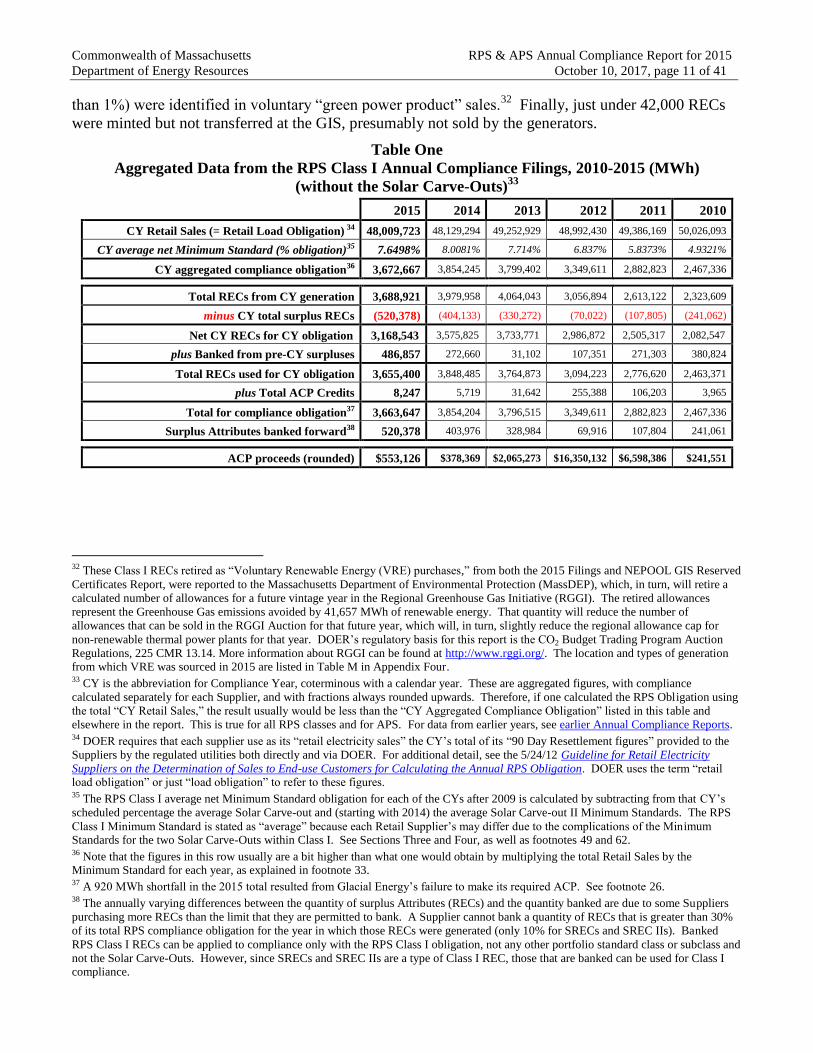
The total retail load obligation in 2015 was 48,009,723 MWh (0.25% fewer than in 2014), for
which the aggregated total of all 60 Suppliers’ average 7.6498% % obligation was 3,672,667 MWh.
The Class I REC supply totaled 3,688,921 RECs from 2015 generation plus 486,857 MWh of Attributes
banked from 2013 and 2014 surplus RECs. The combined total yielded an aggregated surplus of
520,378 RECs, which, when subtracted from that total gave a net total of 3,655,400 MWh presented for
compliance. Only six Suppliers lacked enough RECs and met some of their compliance though 8,247
MWh of ACPs, totaling $553,126 at the rate of $67.07 per MWh.39, 40
All of the 520,378 MWh surplus
was eligible to be banked by 47 Suppliers for compliance use in 2016 and 2017. Except for the unpaid
Glacial ACP, the aggregate figures are displayed in Table One, with more detail in Appendix Three,
Table A, and Appendix Four, Tables G, H, and I.41
Figure One
RPS Class I Compliance, 2003-2015
Changes in the manner of compliance during the first thirteen years of the program, 2003-15, are
shown in Figure One. The initial shortage of qualified generation and RECs was mitigated in 2003 by
the use of RECs bought in 2002, the so-called “Early Compliance Year”, during which generation
became qualified and earned RECs for their output, but when Suppliers did not have to meet compliance
obligations. After that jump-start, initial shortages are evident in the high reliance on ACPs for
39 Regarding the procedures for ACP and the use of ACP funds, see 225 CMR 14.08(3) and Section Nine of this report. See the Alternative Compliance Payment Rates webpage for additional details. 40 An additional 9,020 MWh of ACP, totaling $604,971.40, was not submitted by bankrupt Glacial. See footnote 26. 41
Note that the Class I tables in Appendix Four include all 2015 SRECs and SREC-IIs, including those used for Solar Carve-Out
compliance, as well as those transferred to the Auction. However, Table One and Figure One in this subsection, as well as Table A in
Appendix Three, do not include the Solar Carve-Outs.
0
500
1,000
1,500
2,000
2,500
3,000
3,500
4,000
4,500
5,000
GW
H
2003 2004 2005 2006 2007 2008 2009 2010 2011 2012 2013 2014 2015
Surplus Banked 61 20 1 9 81 211 386 241 108 70 329 404 520
ACP Compliance 0 265 368 323 11 1 0 4 106 255 32 6 8
Compliance from Banked 255 61 20 2 7 81 190 381 271 107 31 273 487
Compliance Year Generation 304 445 645 939 1600 1896 2130 2324 2613 3057 4064 3980 3689
ACP Compliance
Compliance from Banked
Surplus Banked for Future Compliance
Compliance Year Generation
Commonwealth of Massachusetts RPS & APS Annual Compliance Report for 2015
Department of Energy Resources October 10, 2017, page 13 of 41
compliance during 2004-06. Next came three years of REC surpluses, 2007-09, with little or no use of
ACPs for compliance. Supply was short in 2010, with Suppliers depending more heavily on the use of
previously banked Attributes to help met their compliance obligations, and further shortfalls in 2011 and
2012 required a return to ACP reliance. During the subsequent three years, 2013-15, surpluses again
have greatly reduced ACP reliance. Thus, the RPS obligation has succeeded in providing incentives for
accelerated development of new Renewable Generation Units and the growth of a robust market in
RECs in Massachusetts and the region since the original RPS regulations were issued in 2002.
Generation Sources by Location
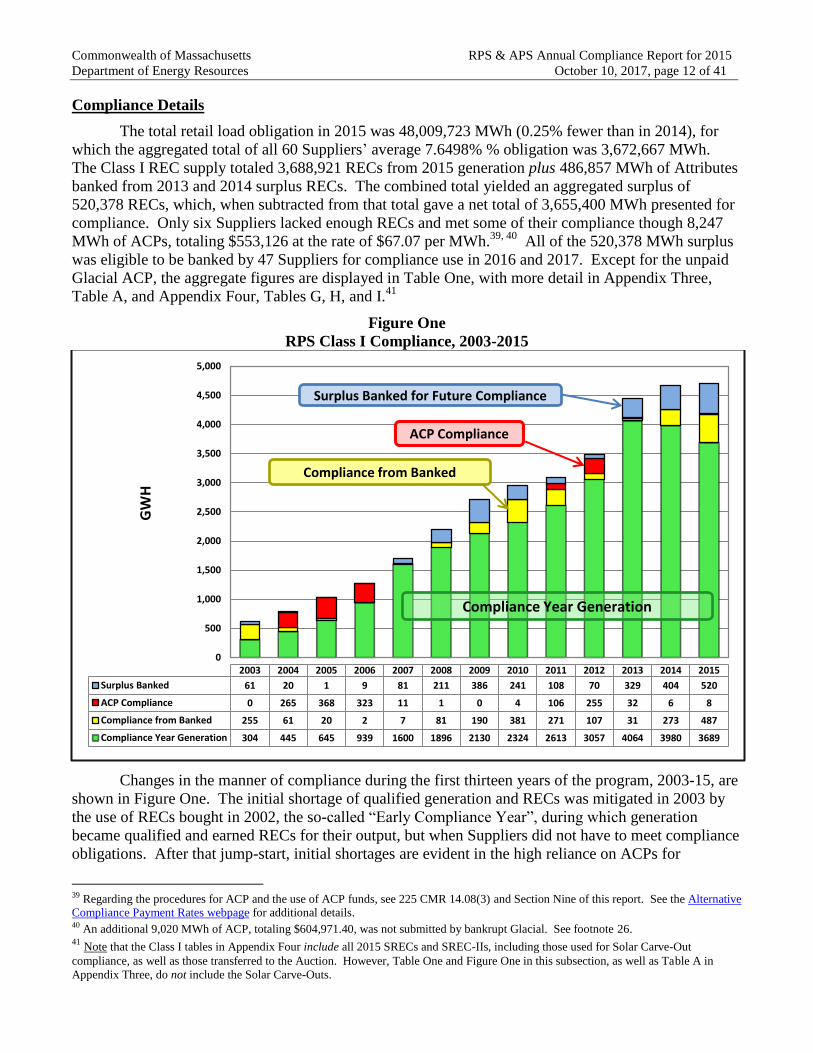
The percentages of 2015 RECs from the New England states, New York, and adjacent Canadian
provinces are illustrated in Figure Two.42
Figure Three illustrates the thirteen year trend in the location
of REC generation since 2003. Table F in Appendix Four lists the data from which these graphs were
generated.
Massachusetts supplied 32.1% of the 2015 RECs presented for MA RPS Class I compliance, up
from 24.1% in 2014, with almost all of the increase attributable to in-state PV projects. Although the
37.6% increase of Class I RECs and SRECs from Massachusetts projects between 2014 and 2015 is less
than the 41.4% increase between 2013 and 2014, that 37.6% is still among the highest year-to-year
increases since the early years of RPS. Moreover, the 2015 percentage of RECs from Massachusetts
was higher than those from any other state for the second year in a row, having reached that position in
2014 for only the first time in the thirteen years of RPS.
Figure Two
2015 RPS Class I Compliance by Generator Location*
* Includes the Solar Carve-Outs, all SRECs & SREC-IIs.
42 Note that the transmission grid in two northern Maine counties is outside of the ISO New England control area, is separately managed by
the Northern Maine Independent System Administrator (“NMISA”), and connects to the ISO-NE grid via the Maritime Areas grid, which is
managed by the New Brunswick System Operator. Therefore, the output of NMISA-located generators must be imported via Canada to ISO-NE in order to earn RECs, as must generation elsewhere in the Maritimes Area, as well as in the New York and Quebec control areas.
CT 0.1%
ME 24.4%
MA 32.1%
NH 10.3%
RI 0.2%
VT 7.1%
NMISA 0.0%
NY 13.9%
PEI 4.8%
QC 7.1%

Commonwealth of Massachusetts RPS & APS Annual Compliance Report for 2015
Department of Energy Resources October 10, 2017, page 14 of 41
The overall quantity of Class I RECs presented for compliance rose by 3.6% from 2014 to 2015.
RECs from within the ISO-NE control area rose by 25.2%, while those imported from the adjacent
control areas declined by 40.1%. Within ISO-NE, the REC supply from Vermont rose by 63.5%, from
Massachusetts 37.6%, and Maine 12.6%, while the supply from the other three states declined. Among
imports, only RECs from NMISA rose, while those from New York and Canada all declined.
Figure Three
RPS Class I Compliance by Generator Location, 2003-2015*
* Includes the Solar Carve-Outs, all SRECs & SREC-IIs.
Generation Sources by Type
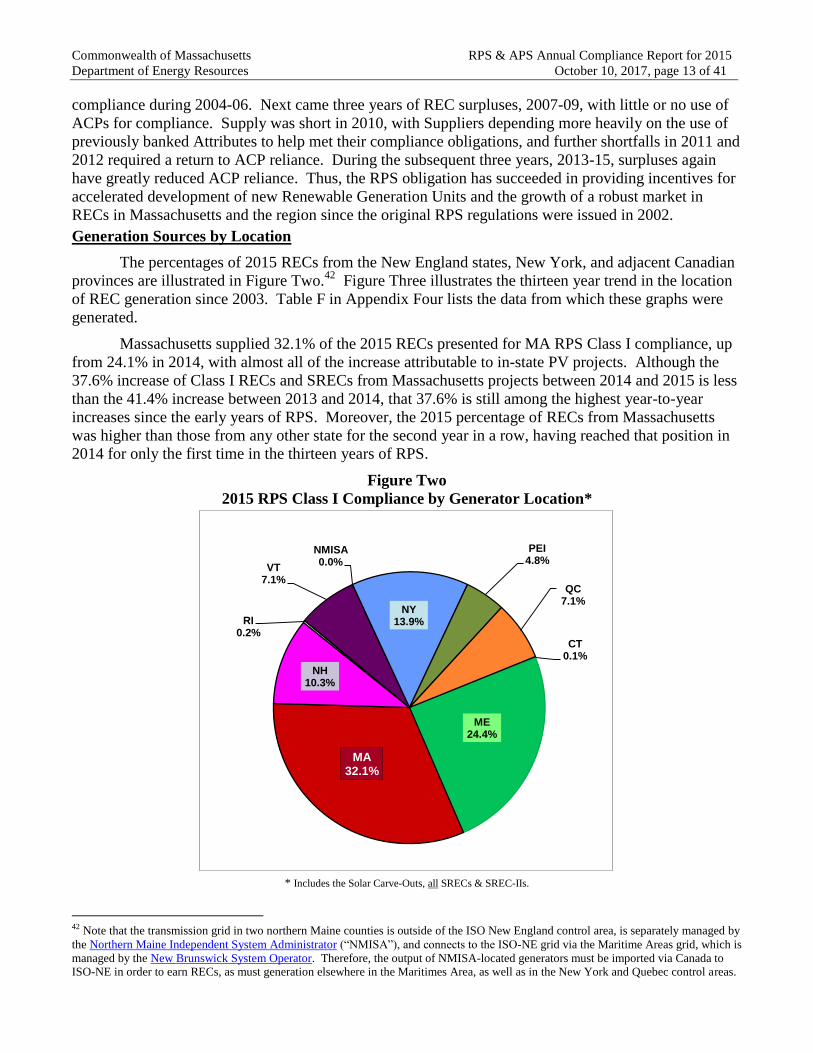
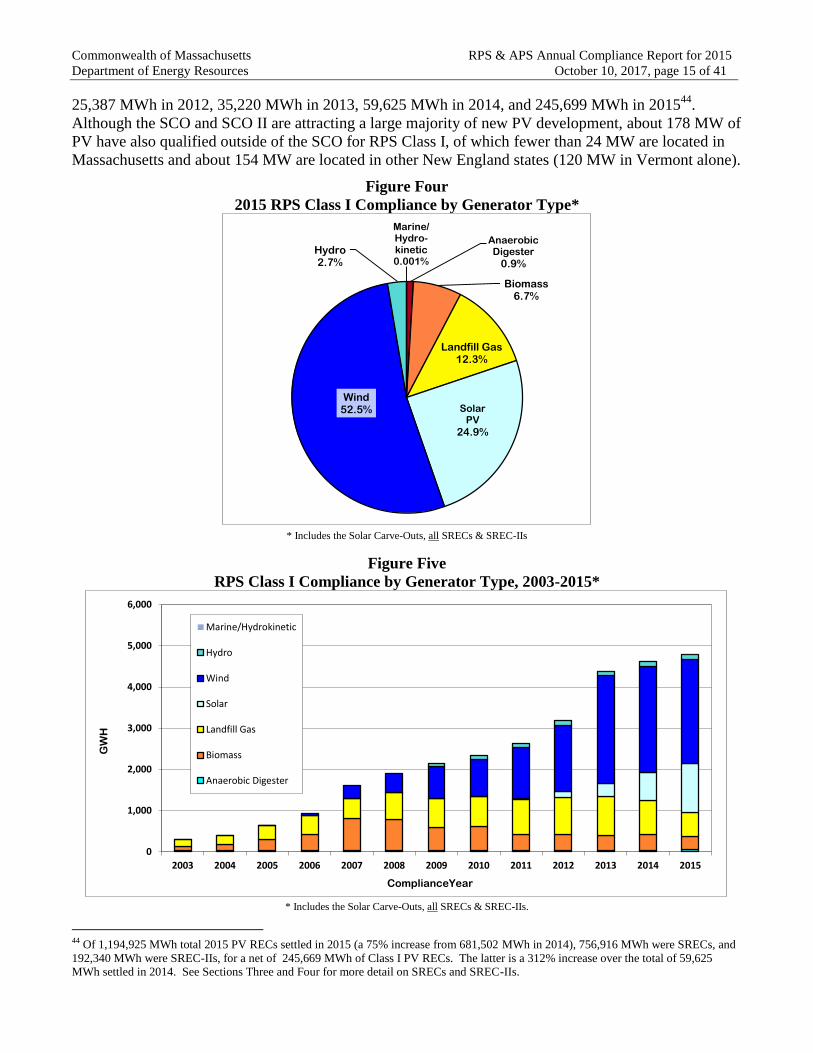
The percentages of 2015 RECs from the qualified types of renewable resources are illustrated in
Figure Four, while Figure Five illustrates the thirteen year trend of RECs by resource type. Table G in
Appendix Four lists the data from which these graphs were generated.
Wind power continues to be the largest source of RECs for RPS, at 52.5% of the 2015 supply.
35% of all wind RECs came from wind farms in Maine, 15% from New York, 13% from New
Hampshire, and 11% from Quebec. RECs for non-ISO-NE resources are earned only on electricity
actually transmitted into ISO-NE. Given the magnitude of the wind resource in New England and in
adjacent control areas – DOER expects wind to continue its leading market share in the RPS.
Solar photovoltaic arrays provide the most rapidly increasing share of RECs, amounting to
24.9% of total Class I RECs in 2015. This accelerating growth has been propelled by a number of
factors in the last few years, including declining equipment costs, federal and state tax incentives,
federal stimulus dollars, state “net metering” policies, and, most notably, the RPS Solar Carve-Out
(SCO) launched in January 2010 and SCO II launched in April 2014.43
Solar generation qualified for
RPS Class I (but not for the SCO or SCO II) rose from 4,120 MWh in 2010, to 10,108 MWh in 2011,
43 In addition to RPS, MA has other programs helping to drive PV development. See the Solar page at DOER’s website.
0
1,000
2,000
3,000
4,000
5,000
6,000
2003 2004 2005 2006 2007 2008 2009 2010 2011 2012 2013 2014 2015
GW
H
Compliance Year
QC
PEI
NY
NMISA
VT
RI
NH
MA
ME
CT
outside ISO-NE
Commonwealth of Massachusetts RPS & APS Annual Compliance Report for 2015
Department of Energy Resources October 10, 2017, page 15 of 41
25,387 MWh in 2012, 35,220 MWh in 2013, 59,625 MWh in 2014, and 245,699 MWh in 201544
.
Although the SCO and SCO II are attracting a large majority of new PV development, about 178 MW of
PV have also qualified outside of the SCO for RPS Class I, of which fewer than 24 MW are located in
Massachusetts and about 154 MW are located in other New England states (120 MW in Vermont alone).
Figure Four
2015 RPS Class I Compliance by Generator Type*
* Includes the Solar Carve-Outs, all SRECs & SREC-IIs
Figure Five
RPS Class I Compliance by Generator Type, 2003-2015*
* Includes the Solar Carve-Outs, all SRECs & SREC-IIs.
44 Of 1,194,925 MWh total 2015 PV RECs settled in 2015 (a 75% increase from 681,502 MWh in 2014), 756,916 MWh were SRECs, and
192,340 MWh were SREC-IIs, for a net of 245,669 MWh of Class I PV RECs. The latter is a 312% increase over the total of 59,625 MWh settled in 2014. See Sections Three and Four for more detail on SRECs and SREC-IIs.
Anaerobic Digester
0.9%
Biomass 6.7%
Landfill Gas 12.3%
Solar PV
24.9%
Wind 52.5%
Hydro 2.7%
Marine/ Hydro- kinetic 0.001%
0
1,000
2,000
3,000
4,000
5,000
6,000
2003 2004 2005 2006 2007 2008 2009 2010 2011 2012 2013 2014 2015
GW
H
ComplianceYear
Marine/Hydrokinetic
Hydro
Wind
Solar
Landfill Gas
Biomass
Anaerobic Digester

Commonwealth of Massachusetts RPS & APS Annual Compliance Report for 2015
Department of Energy Resources October 10, 2017, page 16 of 41
Landfill methane was overtaken in 2015 by Solar PV as a REC source, moving down to third
place at 12%. Most landfill methane RECs are from New York (51%), Massachusetts (24%), and 11%
from Quebec, with the remainder coming from the other five New England states.
Non-anaerobic digestion-based biomass generation provided less than 7% of Class I RECs in
2015, almost all from Maine (62%) and New Hampshire (38%). The qualification of all of the woody
biomass plants in Maine and New Hampshire ceased as of January 1, 2016 because they did not report
increased energy conversion efficiencies to meet the 2012 standards for which they heretofore had been
grandfathered.
Hydroelectricity was added to the qualified mix for RPS Class I in 2009, mostly from post-1997
increases in output at some older plants from capacity and efficiency upgrades. Hydroelectricity as a
source of RECs has risen very slowly, still amounting to less than 3% in 2015, mostly from Maine
(36%) and Vermont (32%), although hydroelectricity from Massachusetts (18%) has been increasing,
and 13% comes from New Hampshire.
In 2015, 82% of the anaerobic digester45
output was from Massachusetts (most from the Deer
Island Treatment Plant near Boston), and 16% from Maine. Maine was the primary source of increased
anaerobic digester RECs during the last two years.46
Anaerobic digester potential exists at wastewater
treatment plants and other facilities that generate organic wastes. DOER is collaborating with the
Massachusetts Department of Agricultural Resource (MDAR), Massachusetts Department of
Environmental Protection (MassDEP), and MassCEC to identify and encourage expanded production of
digester gas and its use for electricity generation at wastewater treatment plants, food processing and
food service facilities, and dairy farms.
Finally, note the slow trickle of REC supply from Marine and Hydrokinetic projects, which
began in 2013 with small turbines within Massachusetts water supply conduits, a technology that has
potential for future growth. One qualified tidal project on the far eastern coast of Maine generated RECs
during 2012 and 2013, but they were not used for Massachusetts RPS, and the project now has a
technology upgrade pending.
SECTION THREE
RPS SOLAR CARVE-OUT COMPLIANCE IN 2015
The Solar Carve-Out (SCO) is a sub-set of RPS Class I that commenced in 2010, pursuant to
the Green Communities Act of 2008, and was originally intended to provide incentives for 400 MW of
PV to be installed within Massachusetts by 2017.47
As a “carve-out”, the SCO Minimum Standard is
subtracted from each year’s overall Class I Minimum Standard.
The SCO succeeded beyond expectations in attracting solar business development to
Massachusetts. In fact, qualified installations surpassed the regulatory cap of 400 MW in 2013, four
years ahead of the date anticipated by DOER. This was caused by a rapid acceleration of applications in
the spring of 2013 as the 400 MW cap approached. In order to avoid penalizing a substantial amount of
investments made in good faith, DOER issued an Emergency revision of the Class I regulations in June
45 See footnote 137 regarding the relationship between anaerobic digester gas and biomass in the MA RPS regulations. 46 Please note that the anaerobic digester figures for 2013 and 2014 were erroneous in the original versions of the Annual Reports for those years, due to an externally-entered coding error for the Deer Island Treatment Plant. The figures have been corrected for this report. 47 The eligibility requirements for a PV system to qualify include the following: (a) interconnection with the Massachusetts electricity grid,
(b) at least a minimal use of some electricity on-site with the balance of the output connected to the grid, and (c) nameplate, direct current
capacity limited to no more than 6 MW on a single parcel of land. In addition, a system is not eligible if it had received funding by certain other government programs. See DOER’s Solar Carve-out/SREC-I webpages for additional information on the program.
Commonwealth of Massachusetts RPS & APS Annual Compliance Report for 2015
Department of Energy Resources October 10, 2017, page 17 of 41
of 2013 to set rules for raising the cap.48
Finally, in order to maintain the PV development momentum
going forward, DOER subsequently began a rulemaking for a successor Solar Carve-Out II, described
below in Section Four.
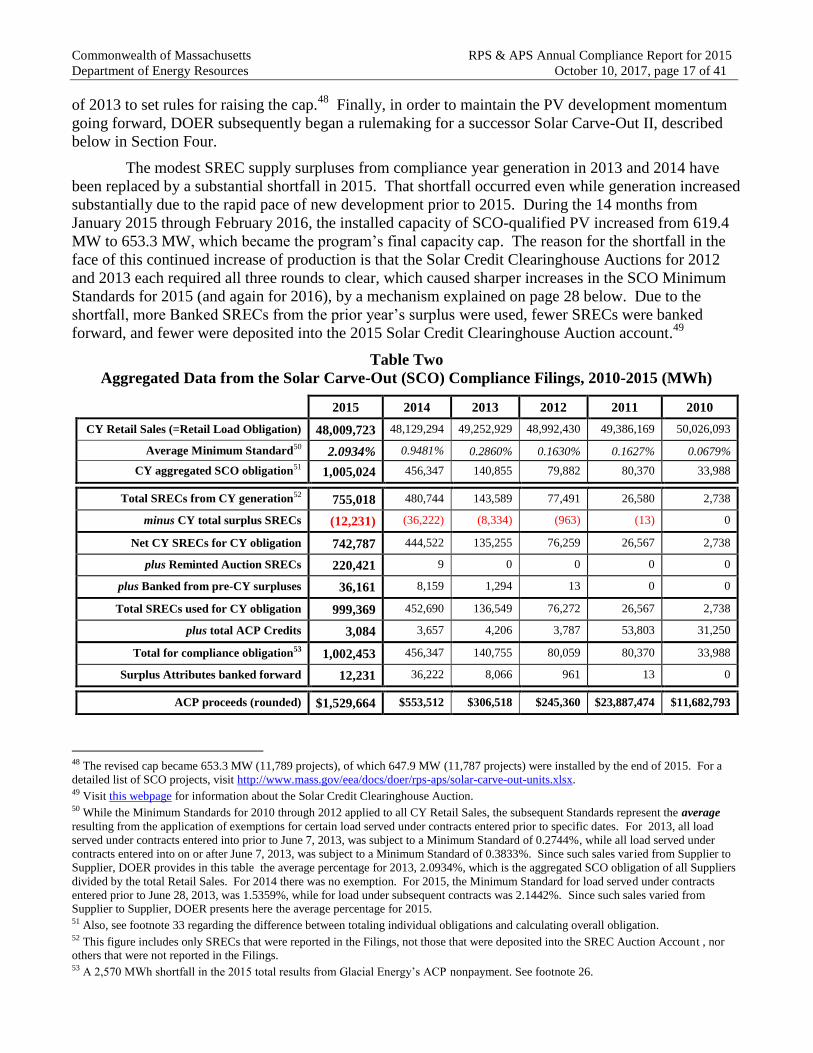
The modest SREC supply surpluses from compliance year generation in 2013 and 2014 have
been replaced by a substantial shortfall in 2015. That shortfall occurred even while generation increased
substantially due to the rapid pace of new development prior to 2015. During the 14 months from
January 2015 through February 2016, the installed capacity of SCO-qualified PV increased from 619.4
MW to 653.3 MW, which became the program’s final capacity cap. The reason for the shortfall in the
face of this continued increase of production is that the Solar Credit Clearinghouse Auctions for 2012
and 2013 each required all three rounds to clear, which caused sharper increases in the SCO Minimum
Standards for 2015 (and again for 2016), by a mechanism explained on page 28 below. Due to the
shortfall, more Banked SRECs from the prior year’s surplus were used, fewer SRECs were banked
forward, and fewer were deposited into the 2015 Solar Credit Clearinghouse Auction account.49
Table Two
Aggregated Data from the Solar Carve-Out (SCO) Compliance Filings, 2010-2015 (MWh)
2015 2014 2013 2012 2011 2010
CY Retail Sales (=Retail Load Obligation) 48,009,723 48,129,294 49,252,929 48,992,430 49,386,169 50,026,093
Average Minimum Standard50 2.0934% 0.9481% 0.2860% 0.1630% 0.1627% 0.0679%
CY aggregated SCO obligation51 1,005,024 456,347 140,855 79,882 80,370 33,988
Total SRECs from CY generation52 755,018 480,744 143,589 77,491 26,580 2,738
minus CY total surplus SRECs (12,231) (36,222) (8,334) (963) (13) 0
Net CY SRECs for CY obligation 742,787 444,522 135,255 76,259 26,567 2,738
plus Reminted Auction SRECs 220,421 9 0 0 0 0
plus Banked from pre-CY surpluses 36,161 8,159 1,294 13 0 0
Total SRECs used for CY obligation 999,369 452,690 136,549 76,272 26,567 2,738
plus total ACP Credits 3,084 3,657 4,206 3,787 53,803 31,250
Total for compliance obligation53 1,002,453 456,347 140,755 80,059 80,370 33,988
Surplus Attributes banked forward 12,231 36,222 8,066 961 13 0
ACP proceeds (rounded) $1,529,664 $553,512 $306,518 $245,360 $23,887,474 $11,682,793
48 The revised cap became 653.3 MW (11,789 projects), of which 647.9 MW (11,787 projects) were installed by the end of 2015. For a
detailed list of SCO projects, visit http://www.mass.gov/eea/docs/doer/rps-aps/solar-carve-out-units.xlsx. 49 Visit this webpage for information about the Solar Credit Clearinghouse Auction. 50 While the Minimum Standards for 2010 through 2012 applied to all CY Retail Sales, the subsequent Standards represent the average
resulting from the application of exemptions for certain load served under contracts entered prior to specific dates. For 2013, all load
served under contracts entered into prior to June 7, 2013, was subject to a Minimum Standard of 0.2744%, while all load served under
contracts entered into on or after June 7, 2013, was subject to a Minimum Standard of 0.3833%. Since such sales varied from Supplier to
Supplier, DOER provides in this table the average percentage for 2013, 2.0934%, which is the aggregated SCO obligation of all Suppliers
divided by the total Retail Sales. For 2014 there was no exemption. For 2015, the Minimum Standard for load served under contracts
entered prior to June 28, 2013, was 1.5359%, while for load under subsequent contracts was 2.1442%. Since such sales varied from Supplier to Supplier, DOER presents here the average percentage for 2015. 51 Also, see footnote 33 regarding the difference between totaling individual obligations and calculating overall obligation. 52 This figure includes only SRECs that were reported in the Filings, not those that were deposited into the SREC Auction Account , nor others that were not reported in the Filings. 53 A 2,570 MWh shortfall in the 2015 total results from Glacial Energy’s ACP nonpayment. See footnote 26.
Commonwealth of Massachusetts RPS & APS Annual Compliance Report for 2015
Department of Energy Resources October 10, 2017, page 18 of 41
The SCO Minimum Standard for 2015 required 1,005,024 MWh of SRECs54
, while the SCO-
qualified PV systems yielded 757,012 MWh of SRECs in 2015. Of that total, 755,018 MWh were
reported for SCO compliance, and 1,898 MWh were deposited into DOER’s Solar Credit Clearinghouse
Auction account at the NEPOOL GIS. That leaves 96 SRECs unaccounted for, likely not sold by
owners. Another 36,161 MWh banked from 2013 and 2014 surplus SRECs, and 220,421 Reminted
Auction SRECs from 2012, 2013, and 2014 were also used for 2015 compliance. 13 Suppliers
depended on ACPs to meet some or all of their SCO obligations. 12,231 MWh of SCO Attributes were
banked forward by 28 Suppliers. The Filing figures are displayed in Table Two, with more detail in
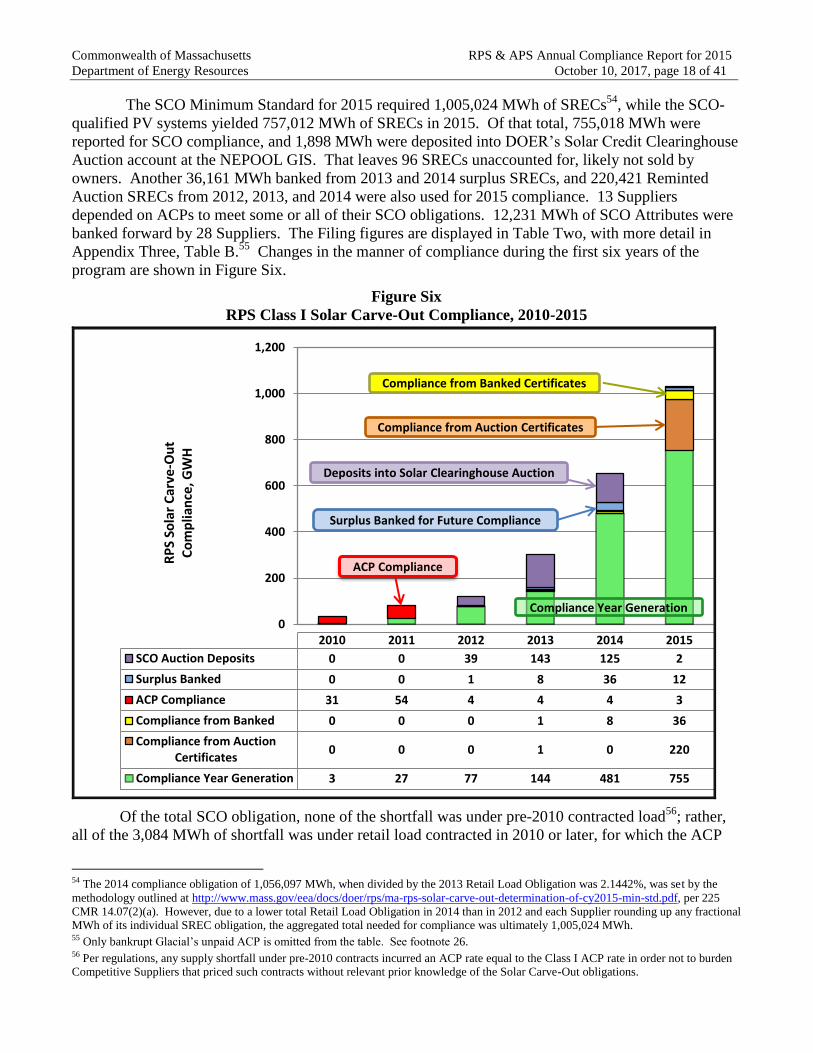
Appendix Three, Table B.55
Changes in the manner of compliance during the first six years of the
program are shown in Figure Six.
Figure Six
RPS Class I Solar Carve-Out Compliance, 2010-2015
Of the total SCO obligation, none of the shortfall was under pre-2010 contracted load56
; rather,
all of the 3,084 MWh of shortfall was under retail load contracted in 2010 or later, for which the ACP
54 The 2014 compliance obligation of 1,056,097 MWh, when divided by the 2013 Retail Load Obligation was 2.1442%, was set by the
methodology outlined at http://www.mass.gov/eea/docs/doer/rps/ma-rps-solar-carve-out-determination-of-cy2015-min-std.pdf, per 225
CMR 14.07(2)(a). However, due to a lower total Retail Load Obligation in 2014 than in 2012 and each Supplier rounding up any fractional MWh of its individual SREC obligation, the aggregated total needed for compliance was ultimately 1,005,024 MWh. 55 Only bankrupt Glacial’s unpaid ACP is omitted from the table. See footnote 26. 56 Per regulations, any supply shortfall under pre-2010 contracts incurred an ACP rate equal to the Class I ACP rate in order not to burden Competitive Suppliers that priced such contracts without relevant prior knowledge of the Solar Carve-Out obligations.
0
200
400
600
800
1,000
1,200
RP
S So
lar
Car
ve-O
ut
Co
mp
lian
ce, G
WH
2010 2011 2012 2013 2014 2015
SCO Auction Deposits 0 0 39 143 125 2
Surplus Banked 0 0 1 8 36 12
ACP Compliance 31 54 4 4 4 3
Compliance from Banked 0 0 0 1 8 36
Compliance from AuctionCertificates
0 0 0 1 0 220
Compliance Year Generation 3 27 77 144 481 755
ACP Compliance
Surplus Banked for Future Compliance
Compliance Year Generation
Deposits into Solar Clearinghouse Auction
Compliance from Banked Certificates
Compliance from Auction Certificates
Commonwealth of Massachusetts RPS & APS Annual Compliance Report for 2015
Department of Energy Resources October 10, 2017, page 19 of 41
totaled $1,529,664 at the $496/MWh rate. In addition, however, an ACP of $1,274,720 for 3,570 MWh
was not received from bankrupt Glacial.57
DOER administered its fourth Solar Carve-Out Clearinghouse Auction, for SRECs minted in
2015. The Auction required only one round, held on July 29, 2016, in which a total bid volume of
49,886 was received from 41 individual bidders, and all 1,898 deposited SRECs were sold to the bidders
by an apportionate method. All SRECs were sold to bidders at the $300/MWh auction price, and
depositors were paid $285/MWh for each SREC deposited. The 2015 Reminted Auction SRECs can be
used for SCO compliance through CY 2017.
SECTION FOUR
RPS SOLAR CARVE-OUT II COMPLIANCE IN 2015
2015 was the second year for compliance under the Solar Carve-Out II Minimum Standard
established by revised regulations for RPS Class I promulgated on April 25, 2014, following more than a
year of both internal and contracted analysis, stakeholder discussions, and a formal rulemaking. The
Solar Carve-Out II Minimum Standard within RPS Class I set a capacity cap for qualified solar carve-
out installations at 1,600 MW in the state, inclusive of the prior Solar Carve-Out capacity (653.3 MW),
with a goal of reaching that overall cap by 2020. The Solar Carve-Out II differs from the Solar Carve-
Out in the creation of “Market Sectors” and “SREC Factors” for qualifying projects. Under the Solar-
Carve-Out II, the highest incentive, namely an SREC Factor of one SREC-II per MWh of output, is
given to small (25 kW or less) projects, solar canopies, community shared solar, projects providing
100% of their power to low income housing, and emergency power sites. The Solar Carve-Out II gives
slightly lower SREC Factors to larger building-mounted projects, those that mostly serve an on-site load,
and those built on eligible landfills and qualified “brownfields”. “Greenfield” projects that are over 650
kW and export the majority of their power to the grid receive the lowest incentive (0.7 SREC per MWh
of output) and must be assigned capacity space in the “annual capacity blocks” in the Managed Growth
sector.58
As a result of these SREC Factors, the total number of SREC-IIs minted at the NEPOOL GIS
is lower than the total MWh actually generated by the SCO II PV systems. For additional details, see
the Solar Carve-Out II web pages especially the About the Solar Carve-Out II Program page.59
The new SCO II Minimum Standard applies only to retail load served under contracts on or after
its April 25, 2014, date of promulgation, exempting load served under prior contracts. This is consistent
with the Exempt Load provision in effect for RPS Class II and APS and is reflected in Section Eight’s
Table Ten.
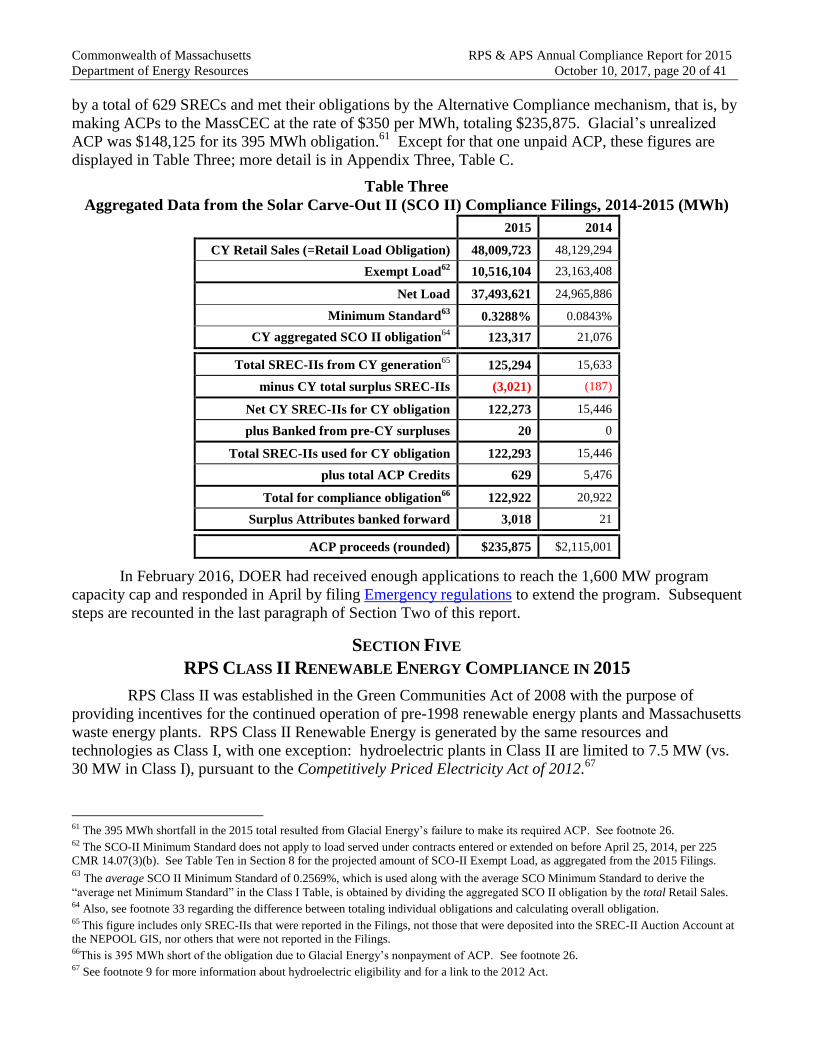
For 2015, the Minimum Standard was calculated60
to be 0.3288% of each Supplier’s non-exempt
Retail Load Obligation. As shown in Table Three, the net load for SCO II compliance in 2015 was
37,493,621, so 123,317 SREC-IIs were required for compliance. Due to rapid growth of installed
capacity since its 2014 start-up, the newly-qualified PV systems generated 192,855 SREC-IIs, of which
67,046 were deposited into the Solar Carve-Out Clearinghouse Auction. Of the remainder, 125,294
were presented for compliance, of which a modest 3,021 were surplus, and 515 are unaccounted for. Of
the 60 Suppliers, 43 met their full obligations by acquiring sufficient SREC-IIs, with 27 of them banking
forward a combined surplus of 3,018 SREC-IIs. The surplus notwithstanding, 16 Suppliers were short
57 See footnote 26 58 See Minimum Standard Adjustments, SREC Factors, and ACP Rates, as well as Current Status of the Solar Carve-Out II Program for more details. 59 More information on the SCO II stakeholder and rulemaking process is at the linked Historical Development of the Solar Carve-Out II webpage. The regulatory provisions specific to the SREC-II are mostly in 225 CMR 14.05(9) and 14.05(7)(3), here. 60 See 225 CMR 14.07(3), especially (3)(a) and (3)(c).
Commonwealth of Massachusetts RPS & APS Annual Compliance Report for 2015
Department of Energy Resources October 10, 2017, page 20 of 41
by a total of 629 SRECs and met their obligations by the Alternative Compliance mechanism, that is, by
making ACPs to the MassCEC at the rate of $350 per MWh, totaling $235,875. Glacial’s unrealized
ACP was $148,125 for its 395 MWh obligation.61
Except for that one unpaid ACP, these figures are
displayed in Table Three; more detail is in Appendix Three, Table C.
Table Three
Aggregated Data from the Solar Carve-Out II (SCO II) Compliance Filings, 2014-2015 (MWh)
2015 2014
CY Retail Sales (=Retail Load Obligation) 48,009,723 48,129,294
Exempt Load62
10,516,104 23,163,408
Net Load 37,493,621 24,965,886
Minimum Standard63
0.3288% 0.0843%
CY aggregated SCO II obligation64
123,317 21,076
Total SREC-IIs from CY generation65
125,294 15,633
minus CY total surplus SREC-IIs (3,021) (187)
Net CY SREC-IIs for CY obligation 122,273 15,446
plus Banked from pre-CY surpluses 20 0
Total SREC-IIs used for CY obligation 122,293 15,446
plus total ACP Credits 629 5,476
Total for compliance obligation66
122,922 20,922
Surplus Attributes banked forward 3,018 21
ACP proceeds (rounded) $235,875 $2,115,001
In February 2016, DOER had received enough applications to reach the 1,600 MW program
capacity cap and responded in April by filing Emergency regulations to extend the program. Subsequent
steps are recounted in the last paragraph of Section Two of this report.
SECTION FIVE
RPS CLASS II RENEWABLE ENERGY COMPLIANCE IN 2015
RPS Class II was established in the Green Communities Act of 2008 with the purpose of
providing incentives for the continued operation of pre-1998 renewable energy plants and Massachusetts
waste energy plants. RPS Class II Renewable Energy is generated by the same resources and
technologies as Class I, with one exception: hydroelectric plants in Class II are limited to 7.5 MW (vs.
30 MW in Class I), pursuant to the Competitively Priced Electricity Act of 2012.67
61 The 395 MWh shortfall in the 2015 total resulted from Glacial Energy’s failure to make its required ACP. See footnote 26. 62 The SCO-II Minimum Standard does not apply to load served under contracts entered or extended on before April 25, 2014, per 225 CMR 14.07(3)(b). See Table Ten in Section 8 for the projected amount of SCO-II Exempt Load, as aggregated from the 2015 Filings. 63
The average SCO II Minimum Standard of 0.2569%, which is used along with the average SCO Minimum Standard to derive the
“average net Minimum Standard” in the Class I Table, is obtained by dividing the aggregated SCO II obligation by the total Retail Sales. 64 Also, see footnote 33 regarding the difference between totaling individual obligations and calculating overall obligation. 65 This figure includes only SREC-IIs that were reported in the Filings, not those that were deposited into the SREC-II Auction Account at the NEPOOL GIS, nor others that were not reported in the Filings. 66This is 395 MWh short of the obligation due to Glacial Energy’s nonpayment of ACP. See footnote 26. 67 See footnote 9 for more information about hydroelectric eligibility and for a link to the 2012 Act.
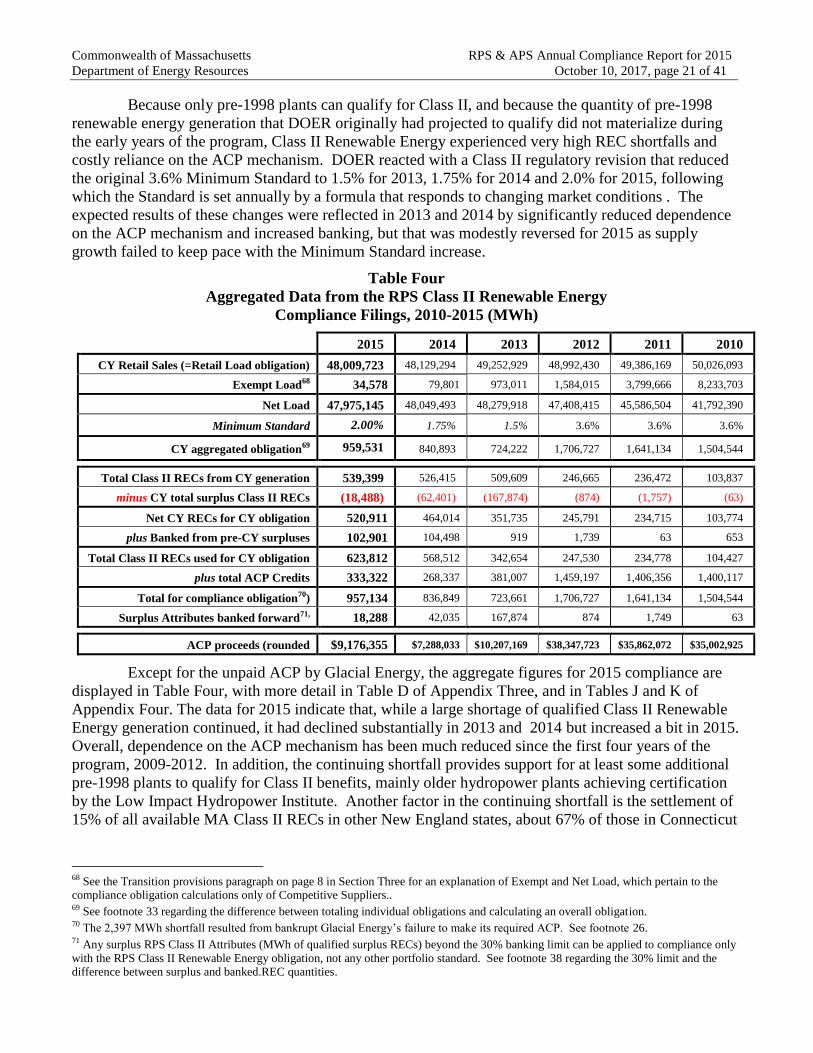
Commonwealth of Massachusetts RPS & APS Annual Compliance Report for 2015
Department of Energy Resources October 10, 2017, page 21 of 41
Because only pre-1998 plants can qualify for Class II, and because the quantity of pre-1998
renewable energy generation that DOER originally had projected to qualify did not materialize during
the early years of the program, Class II Renewable Energy experienced very high REC shortfalls and
costly reliance on the ACP mechanism. DOER reacted with a Class II regulatory revision that reduced
the original 3.6% Minimum Standard to 1.5% for 2013, 1.75% for 2014 and 2.0% for 2015, following
which the Standard is set annually by a formula that responds to changing market conditions . The
expected results of these changes were reflected in 2013 and 2014 by significantly reduced dependence
on the ACP mechanism and increased banking, but that was modestly reversed for 2015 as supply
growth failed to keep pace with the Minimum Standard increase.
Table Four
Aggregated Data from the RPS Class II Renewable Energy
Compliance Filings, 2010-2015 (MWh)
2015 2014 2013 2012 2011 2010
CY Retail Sales (=Retail Load obligation) 48,009,723 48,129,294 49,252,929 48,992,430 49,386,169 50,026,093
Exempt Load68 34,578 79,801 973,011 1,584,015 3,799,666 8,233,703
Net Load 47,975,145 48,049,493 48,279,918 47,408,415 45,586,504 41,792,390
Minimum Standard 2.00% 1.75% 1.5% 3.6% 3.6% 3.6%
CY aggregated obligation69 959,531 840,893 724,222 1,706,727 1,641,134 1,504,544
Total Class II RECs from CY generation 539,399 526,415 509,609 246,665 236,472 103,837
minus CY total surplus Class II RECs (18,488) (62,401) (167,874) (874) (1,757) (63)
Net CY RECs for CY obligation 520,911 464,014 351,735 245,791 234,715 103,774
plus Banked from pre-CY surpluses 102,901 104,498 919 1,739 63 653
Total Class II RECs used for CY obligation 623,812 568,512 342,654 247,530 234,778 104,427
plus total ACP Credits 333,322 268,337 381,007 1,459,197 1,406,356 1,400,117
Total for compliance obligation70) 957,134 836,849 723,661 1,706,727 1,641,134 1,504,544
Surplus Attributes banked forward71, 18,288 42,035 167,874 874 1,749 63
ACP proceeds (rounded $9,176,355 $7,288,033 $10,207,169 $38,347,723 $35,862,072 $35,002,925
Except for the unpaid ACP by Glacial Energy, the aggregate figures for 2015 compliance are
displayed in Table Four, with more detail in Table D of Appendix Three, and in Tables J and K of
Appendix Four. The data for 2015 indicate that, while a large shortage of qualified Class II Renewable
Energy generation continued, it had declined substantially in 2013 and 2014 but increased a bit in 2015.
Overall, dependence on the ACP mechanism has been much reduced since the first four years of the
program, 2009-2012. In addition, the continuing shortfall provides support for at least some additional
pre-1998 plants to qualify for Class II benefits, mainly older hydropower plants achieving certification
by the Low Impact Hydropower Institute. Another factor in the continuing shortfall is the settlement of
15% of all available MA Class II RECs in other New England states, about 67% of those in Connecticut
68 See the Transition provisions paragraph on page 8 in Section Three for an explanation of Exempt and Net Load, which pertain to the compliance obligation calculations only of Competitive Suppliers.. 69 See footnote 33 regarding the difference between totaling individual obligations and calculating an overall obligation. 70 The 2,397 MWh shortfall resulted from bankrupt Glacial Energy’s failure to make its required ACP. See footnote 26. 71 Any surplus RPS Class II Attributes (MWh of qualified surplus RECs) beyond the 30% banking limit can be applied to compliance only
with the RPS Class II Renewable Energy obligation, not any other portfolio standard. See footnote 38 regarding the 30% limit and the difference between surplus and banked.REC quantities.

Commonwealth of Massachusetts RPS & APS Annual Compliance Report for 2015
Department of Energy Resources October 10, 2017, page 22 of 41
and over 28% in New Hampshire, which reduced the quantity available for MA RPS Class II.72
In
2015, the net (non-Exempt) load73
for the Class II Renewable Energy obligation was 47,975,145 MWh,
and the total of all 60 Suppliers’ 2.0% Class II Renewable Energy obligations was 959,531 MWh. Class
II RECs available for Class II compliance, almost all from New England hydroelectric plants, were well
short of the demand. Eighteen Suppliers met their full obligations by acquiring RECs, with eleven of
them having a combined surplus of 18,488 (of which only 18,288 could be banked forward). The total
of 539,399 MWh of 2015 RECs, plus 102,901 RECs banked from 2013 and 2014 banked surplus, minus
the 18,488 surplus RECs, yielded 623,812 RECs for 2015 compliance. That net total amounted to 65%
of the total Class II Renewable Energy obligation. Of the remaining obligation, 333,322 MWh (34.7%)
was met by the Alternative Compliance mechanism, that is, by making ACPs to the MassCEC at the rate
of $27.53 per MWh, totaling $9,176,354.66. An additional 2,397 MWh of ACP, totaling $65,989, was
not received from bankrupt Glacial Energy.74
SECTION SIX
RPS CLASS II WASTE ENERGY COMPLIANCE IN 2015
RPS Class II Waste Energy is a separate sub-class within RPS Class II. This means that each
Supplier must comply separately with both the Renewable Energy subclass and the Waste Energy
subclass. Qualification is limited to plants that meet the MassDEP regulations for such facilities.75
The
MassDEP regulations, in addition to provisions for municipal solid waste handling, emissions, etc.,
provide for enhanced sorting and recycling and for the owner of each plant to remit to the MassDEP
50% of the proceeds from selling its RPS Class II WECs. The MassDEP uses those funds to help
finance municipal recycling programs.
In 2015, the net (non-Exempt) load for the Class II Waste Energy obligation was 47,975,145
MWh, and the total of the 60 Suppliers’ 3.5% Class II Waste Energy obligations was 1,679,161 MWh.
The Suppliers acquired 1,620,112 WECs, which, combined with the use of 53,440 Attributes banked
from 2013 surplus WECs, yielded for some of the Suppliers a surplus of 12,231 WECs and a shortfall of
17,120 WECs. Due to a temporary moratorium on WEC banking for 2014 and 2015, none of the
surplus could be banked towards future Class II Waste Energy compliance. Seven Suppliers acquired
no WECs, and 16 others failed to purchase enough WECs. 22 of those 23 Suppliers met their total
shortfall of 17,120 WECs by making ACPs to the MassCEC at the ACP rate of $11.01 per MWh, for
total payments of $188,491.20. An additional $46,186.95 for 4,195 MWh of ACP was not received
from bankrupt Glacial Energy76
. Except for that unpaid ACP, these figures are displayed in Table Five,
with more detail in Appendix Three, Table E.
Although these data appear to indicate a shortage of WECs, the actual WECs created at the NEPOOL
GIS during 2015 totaled 1,784,550.77
That means a WEC supply surplus existed, but 164,438 WECs
(9% of the available WECs) were not sold to Suppliers by the two generation owners. That is fewer
than the 343,090 WECs that had been left unsold for 2014 compliance.
72 The percentges of MA Class II RECs settled in other states are based on data in a confidential Regulator’s Report at the NEPOOL GIS. 73 See the discussion of Exempt Load for RPS Class II and APS above, on page 8. 74 See footnote 26 and Appendix One, 75 The MassDEP regulations are in 310 CMR 7.08(2) and 310 CMR 19.000. 76 See footnote 26 and Appendix One. 77 See the NEPOOL GIS public report, Number of Certificates by RPS Eligibility, annual ,2015
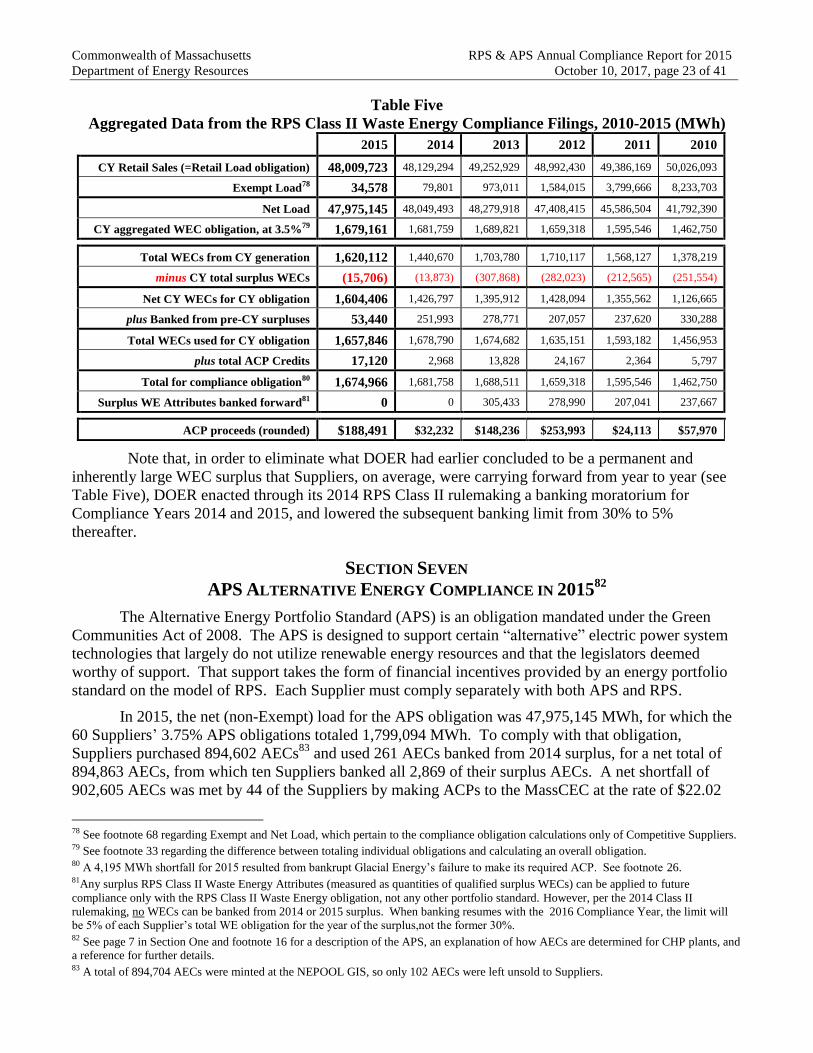
Commonwealth of Massachusetts RPS & APS Annual Compliance Report for 2015
Department of Energy Resources October 10, 2017, page 23 of 41
Table Five
Aggregated Data from the RPS Class II Waste Energy Compliance Filings, 2010-2015 (MWh)
2015 2014 2013 2012 2011 2010
CY Retail Sales (=Retail Load obligation) 48,009,723 48,129,294 49,252,929 48,992,430 49,386,169 50,026,093
Exempt Load78 34,578 79,801 973,011 1,584,015 3,799,666 8,233,703
Net Load 47,975,145 48,049,493 48,279,918 47,408,415 45,586,504 41,792,390
CY aggregated WEC obligation, at 3.5%79 1,679,161 1,681,759 1,689,821 1,659,318 1,595,546 1,462,750
Total WECs from CY generation 1,620,112 1,440,670 1,703,780 1,710,117 1,568,127 1,378,219
minus CY total surplus WECs (15,706) (13,873) (307,868) (282,023) (212,565) (251,554)
Net CY WECs for CY obligation 1,604,406 1,426,797 1,395,912 1,428,094 1,355,562 1,126,665
plus Banked from pre-CY surpluses 53,440 251,993 278,771 207,057 237,620 330,288
Total WECs used for CY obligation 1,657,846 1,678,790 1,674,682 1,635,151 1,593,182 1,456,953
plus total ACP Credits 17,120 2,968 13,828 24,167 2,364 5,797
Total for compliance obligation80 1,674,966 1,681,758 1,688,511 1,659,318 1,595,546 1,462,750
Surplus WE Attributes banked forward81 0 0 305,433 278,990 207,041 237,667
ACP proceeds (rounded) $188,491 $32,232 $148,236 $253,993 $24,113 $57,970
Note that, in order to eliminate what DOER had earlier concluded to be a permanent and
inherently large WEC surplus that Suppliers, on average, were carrying forward from year to year (see
Table Five), DOER enacted through its 2014 RPS Class II rulemaking a banking moratorium for
Compliance Years 2014 and 2015, and lowered the subsequent banking limit from 30% to 5%
thereafter.
SECTION SEVEN
APS ALTERNATIVE ENERGY COMPLIANCE IN 201582
The Alternative Energy Portfolio Standard (APS) is an obligation mandated under the Green
Communities Act of 2008. The APS is designed to support certain “alternative” electric power system
technologies that largely do not utilize renewable energy resources and that the legislators deemed
worthy of support. That support takes the form of financial incentives provided by an energy portfolio
standard on the model of RPS. Each Supplier must comply separately with both APS and RPS.
In 2015, the net (non-Exempt) load for the APS obligation was 47,975,145 MWh, for which the
60 Suppliers’ 3.75% APS obligations totaled 1,799,094 MWh. To comply with that obligation,
Suppliers purchased 894,602 AECs83
and used 261 AECs banked from 2014 surplus, for a net total of
894,863 AECs, from which ten Suppliers banked all 2,869 of their surplus AECs. A net shortfall of
902,605 AECs was met by 44 of the Suppliers by making ACPs to the MassCEC at the rate of $22.02
78 See footnote 68 regarding Exempt and Net Load, which pertain to the compliance obligation calculations only of Competitive Suppliers. 79 See footnote 33 regarding the difference between totaling individual obligations and calculating an overall obligation. 80 A 4,195 MWh shortfall for 2015 resulted from bankrupt Glacial Energy’s failure to make its required ACP. See footnote 26. 81Any surplus RPS Class II Waste Energy Attributes (measured as quantities of qualified surplus WECs) can be applied to future
compliance only with the RPS Class II Waste Energy obligation, not any other portfolio standard. However, per the 2014 Class II
rulemaking, no WECs can be banked from 2014 or 2015 surplus. When banking resumes with the 2016 Compliance Year, the limit will be 5% of each Supplier’s total WE obligation for the year of the surplus,not the former 30%. 82 See page 7 in Section One and footnote 16 for a description of the APS, an explanation of how AECs are determined for CHP plants, and a reference for further details. 83 A total of 894,704 AECs were minted at the NEPOOL GIS, so only 102 AECs were left unsold to Suppliers.

Commonwealth of Massachusetts RPS & APS Annual Compliance Report for 2015
Department of Energy Resources October 10, 2017, page 24 of 41
per MWh, for a total of $19,875,362.10. An additional 4,495 MWh of ACP, totaling $98,979.90, was
not paid by bankrupt Glacial84
. Except for that one unpaid ACP, these figures are displayed in Table
Six; more detail is in Appendix Three, Table F, and in Appendix Four, Table L.
Table Six
Aggregated Data from the APS Compliance Filings, 2010-2015 (MWh)
2015 2014 2013 2012 2011 2010
CY Retail Sales (=Retail Load Obligation) 48,009,723 48,129,294 49,252,929 48,992,430 49,386,169 50,026,093
Exempt Load85 34,578 79,801 973,011 1,584,015 3,799,666 8,233,703
Net Load 47,975,145 48,049,493 48,279,918 47,408,416 45,586,504 41,792,390
Minimum Standard86 3.75% 3.5% 3.0% 2.5% 2.0% 1.5%
Aggregated APS obligation 1,799,094 1,681,759 1,448,421 1,185,236 911,748 626,902
Total AECs from CY Generation 894,602 831,080 531,781 351,179 324,922 227,134
minus CY total surplus AECs (2,869) (261) (7,347) (1,239) (7,636) (520)
Net CY AECs for CY obligation 891,733 830,819 524,434 349,940 317,286 226,614
plus banked from pre-CY surpluses 261 7,347 1,239 7,635 515 8,818
Total AECs used for CY obligation 891,994 838,166 525,673 357,575 317,801 235,432
plus total ACP credits 902,605 835,505 921,626 827,661 593,947 391,470
Total for compliance obligation87 1,794,599 1,673,671 1,447,299 1,185,236 911,748 626,902
Surplus APS Attributes banked forward 2,869 261 7,347 1,239 7,636 515
ACP proceeds (rounded) $19,875,362 $18,147,169 $19,750,452 $17,397,429 $12,116,514 $7,829,400
SECTION EIGHT
PROJECTION OF FUTURE RPS AND APS COMPLIANCE OBLIGATIONS AND SUPPLY
DOER provides here one possible scenario for the future RPS and APS compliance obligations
through 2021. This scenario is based on the ISO-NE “reference case” for load growth in the 2016 CELT
Report,88
following the approach of the RPS/APS Annual Compliance Reports for 2009 through 2014.
However, the 2015 and 2016 CELT Reports have differed from earlier CELT Reports by their inclusion
of ISO-NE’s forecast of PV generation in the wholesale market and of generation imbedded behind the
meter. PV is now included, along with Energy Efficiency, in the forecast beyond the Forward Capacity
Market of 2019-20.89
The ISO-NE expects summer peak electricity demand over the 2016-25 period to
grow only 0.2% annually, while electricity consumption is expected to remain flat or decline. Note that
these forecasts always assume normal weather and economic drivers, so that the actual electricity
consumption for any given year may differ to the extent that the weather and the economy deviate from
those assumed norms.
In general, any scenario is determined by one’s choice of assumptions, which can be subject to
substantial uncertainty. Important variables affecting electricity consumption include (a) weather
84 See footnote26 and Appendix One. 85 See footnote 68 regarding Exempt and Net Load, which pertain to the compliance obligation calculations only of Competitive Suppliers. 86 See footnote 33 regarding the difference between totaling individual obligations and calculating an overall obligation. 87 A 4,495 MWh shortfall for 2015 resulted from Glacial Energy’s failure to make its required ACP. See footnote 26. 88 The ISO-NE figures are from Tab 2, column AM (“GROSS-PV- PDR”) in the 2016 CELT Report document titled “Forecast Data 2016”, dated 4/29/2016, which is listed at http://www.iso-ne.com/system-planning/system-plans-studies/celt. 89 This ISO forecast is the culmination of efforts by the ISO and stakeholders to develop an “Energy-Efficiency and PV Forecast” that recognizes increasing investment and penetration of these resources.
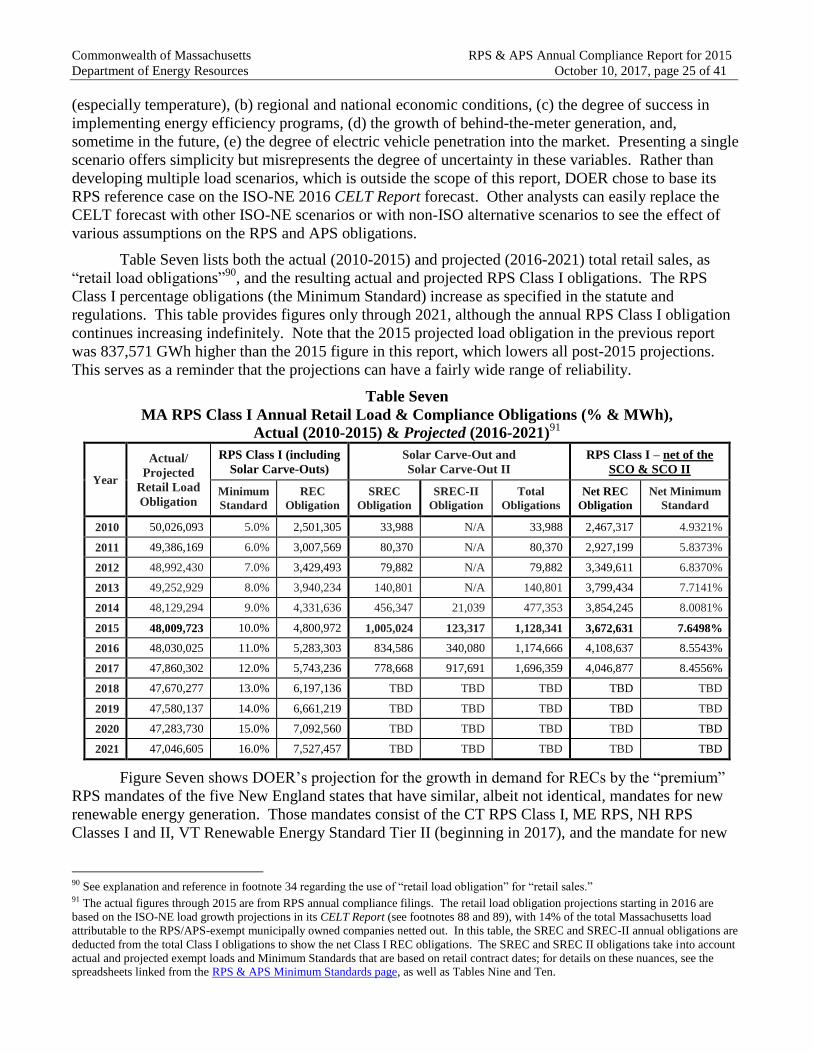
Commonwealth of Massachusetts RPS & APS Annual Compliance Report for 2015
Department of Energy Resources October 10, 2017, page 25 of 41
(especially temperature), (b) regional and national economic conditions, (c) the degree of success in
implementing energy efficiency programs, (d) the growth of behind-the-meter generation, and,
sometime in the future, (e) the degree of electric vehicle penetration into the market. Presenting a single
scenario offers simplicity but misrepresents the degree of uncertainty in these variables. Rather than
developing multiple load scenarios, which is outside the scope of this report, DOER chose to base its
RPS reference case on the ISO-NE 2016 CELT Report forecast. Other analysts can easily replace the
CELT forecast with other ISO-NE scenarios or with non-ISO alternative scenarios to see the effect of
various assumptions on the RPS and APS obligations.
Table Seven lists both the actual (2010-2015) and projected (2016-2021) total retail sales, as
“retail load obligations”90
, and the resulting actual and projected RPS Class I obligations. The RPS
Class I percentage obligations (the Minimum Standard) increase as specified in the statute and
regulations. This table provides figures only through 2021, although the annual RPS Class I obligation
continues increasing indefinitely. Note that the 2015 projected load obligation in the previous report
was 837,571 GWh higher than the 2015 figure in this report, which lowers all post-2015 projections.
This serves as a reminder that the projections can have a fairly wide range of reliability.
Table Seven
MA RPS Class I Annual Retail Load & Compliance Obligations (% & MWh),
Actual (2010-2015) & Projected (2016-2021)91
Year
Actual/
Projected
Retail Load
Obligation
RPS Class I (including
Solar Carve-Outs)
Solar Carve-Out and
Solar Carve-Out II
RPS Class I – net of the
SCO & SCO II
Minimum
Standard
REC
Obligation
SREC
Obligation
SREC-II
Obligation
Total
Obligations
Net REC
Obligation
Net Minimum
Standard
2010 50,026,093 5.0% 2,501,305 33,988 N/A 33,988 2,467,317 4.9321%
2011 49,386,169 6.0% 3,007,569 80,370 N/A 80,370 2,927,199 5.8373%
2012 48,992,430 7.0% 3,429,493 79,882 N/A 79,882 3,349,611 6.8370%
2013 49,252,929 8.0% 3,940,234 140,801 N/A 140,801 3,799,434 7.7141%
2014 48,129,294 9.0% 4,331,636 456,347 21,039 477,353 3,854,245 8.0081%
2015 48,009,723 10.0% 4,800,972 1,005,024 123,317 1,128,341 3,672,631 7.6498%
2016 48,030,025 11.0% 5,283,303 834,586 340,080 1,174,666 4,108,637 8.5543%
2017 47,860,302 12.0% 5,743,236 778,668 917,691 1,696,359 4,046,877 8.4556%
2018 47,670,277 13.0% 6,197,136 TBD TBD TBD TBD TBD
2019 47,580,137 14.0% 6,661,219 TBD TBD TBD TBD TBD
2020 47,283,730 15.0% 7,092,560 TBD TBD TBD TBD TBD
2021 47,046,605 16.0% 7,527,457 TBD TBD TBD TBD TBD
Figure Seven shows DOER’s projection for the growth in demand for RECs by the “premium”
RPS mandates of the five New England states that have similar, albeit not identical, mandates for new
renewable energy generation. Those mandates consist of the CT RPS Class I, ME RPS, NH RPS
Classes I and II, VT Renewable Energy Standard Tier II (beginning in 2017), and the mandate for new
90 See explanation and reference in footnote 34 regarding the use of “retail load obligation” for “retail sales.” 91 The actual figures through 2015 are from RPS annual compliance filings. The retail load obligation projections starting in 2016 are
based on the ISO-NE load growth projections in its CELT Report (see footnotes 88 and 89), with 14% of the total Massachusetts load
attributable to the RPS/APS-exempt municipally owned companies netted out. In this table, the SREC and SREC-II annual obligations are
deducted from the total Class I obligations to show the net Class I REC obligations. The SREC and SREC II obligations take into account
actual and projected exempt loads and Minimum Standards that are based on retail contract dates; for details on these nuances, see the spreadsheets linked from the RPS & APS Minimum Standards page, as well as Tables Nine and Ten.
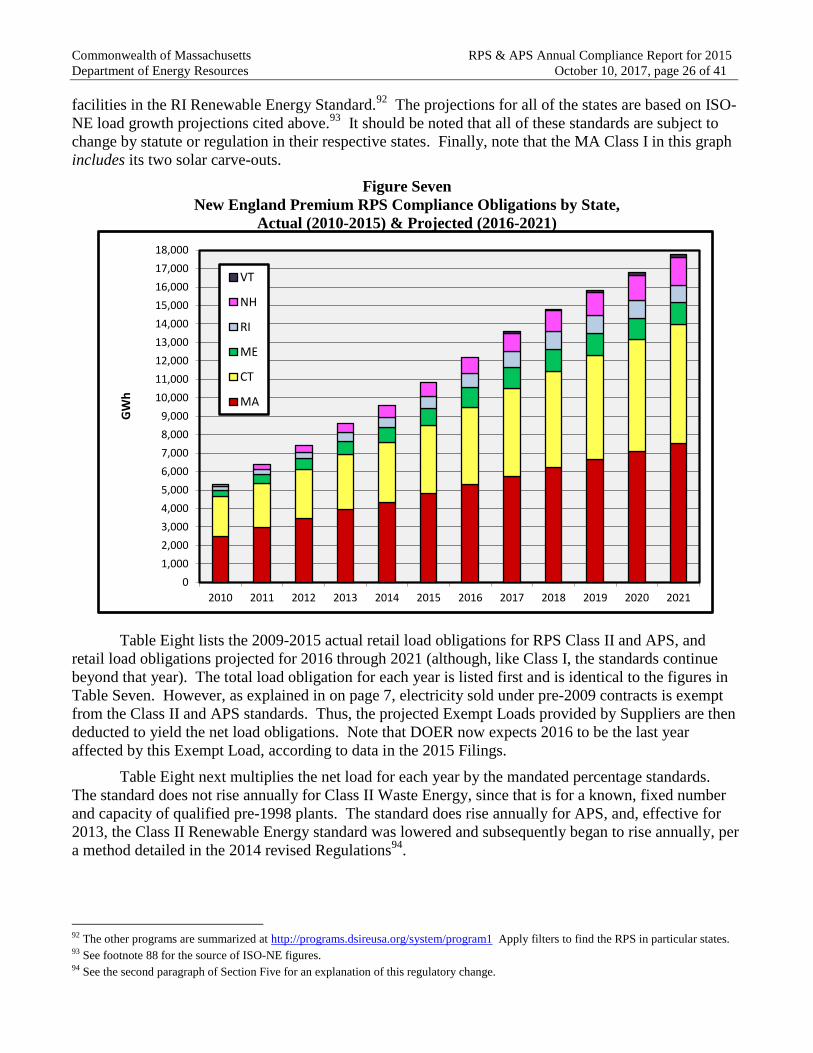
Commonwealth of Massachusetts RPS & APS Annual Compliance Report for 2015
Department of Energy Resources October 10, 2017, page 26 of 41
facilities in the RI Renewable Energy Standard.92
The projections for all of the states are based on ISO-
NE load growth projections cited above.93
It should be noted that all of these standards are subject to
change by statute or regulation in their respective states. Finally, note that the MA Class I in this graph
includes its two solar carve-outs.
Figure Seven
New England Premium RPS Compliance Obligations by State,
Actual (2010-2015) & Projected (2016-2021)
Table Eight lists the 2009-2015 actual retail load obligations for RPS Class II and APS, and
retail load obligations projected for 2016 through 2021 (although, like Class I, the standards continue
beyond that year). The total load obligation for each year is listed first and is identical to the figures in
Table Seven. However, as explained in on page 7, electricity sold under pre-2009 contracts is exempt
from the Class II and APS standards. Thus, the projected Exempt Loads provided by Suppliers are then
deducted to yield the net load obligations. Note that DOER now expects 2016 to be the last year
affected by this Exempt Load, according to data in the 2015 Filings.
Table Eight next multiplies the net load for each year by the mandated percentage standards.
The standard does not rise annually for Class II Waste Energy, since that is for a known, fixed number
and capacity of qualified pre-1998 plants. The standard does rise annually for APS, and, effective for
2013, the Class II Renewable Energy standard was lowered and subsequently began to rise annually, per
a method detailed in the 2014 revised Regulations94
.
92 The other programs are summarized at http://programs.dsireusa.org/system/program1 Apply filters to find the RPS in particular states. 93 See footnote 88 for the source of ISO-NE figures. 94 See the second paragraph of Section Five for an explanation of this regulatory change.
0
1,000
2,000
3,000
4,000
5,000
6,000
7,000
8,000
9,000
10,000
11,000
12,000
13,000
14,000
15,000
16,000
17,000
18,000
2010 2011 2012 2013 2014 2015 2016 2017 2018 2019 2020 2021
GW
h
VT
NH
RI
ME
CT
MA

Commonwealth of Massachusetts RPS & APS Annual Compliance Report for 2015
Department of Energy Resources October 10, 2017, page 27 of 41
Table Eight
MA RPS Class II & APS Annual Retail Load & Compliance Obligations, Net of Exempt Load,
Actual (2009-2015) & Projected (2016-2021), in MWh95
Year
Actual/
Projected
Load
Obligation96
Actual/
Projected
Exempt
Load
Obligation
Actual/
Projected
Net Load
Obligation
RPS Class
II REC
Minimum
Standard
RPS Class
II RECs as
% of
Net Load
Obligation
RPS Class
II WECs at
3.5% of
Net Load
Obligation
APS
Minimum
Standard
APS
AECs
Obligation
2009 48,301,821 31,918,771 16,383,050 3.6% 589,801 574,368 1.00% 163,844
2010 50,026,093 8,233,703 41,792,391 3.6% 1,504,526 1,462,734 1.50% 626,886
2011 49,386,169 3,799,666 45,586,504 3.6% 1,641,114 1,595,528 2.00% 911,730
2012 48,992,430 1,584,015 47,408,416 3.6% 1,706,727 1,659,318 2.50% 1,185,236
2013 49,252,929 973,011 48,279,918 1.50% 724,222 1,689,821 3.00% 1,448,421
2014 48,129,294 79,801 48,049,493 1.75% 840,866 1,681,732 3.50% 1,681,732
2015 48,009,723 34,578 47,975,145 2.00% 959,503 1,679,130 3.75% 1,799,068
2016 48,030,025 8,566 48,021,459 2.5319% 1,215,855 1,680,751 4.00% 1,920,858
2017 47,860,302 0 47,860,302 2.5909% 1,240,013 1,675,111 4.25% 2,034,063
2018 47,670,277 0 47,670,277 2.6155% 1,246,816 1,668,460 4.50% 2,145,162
2019 47,580,137 0 47,580,137 TBD TBD 1,665,305 4.75% 2,260,056
2020 47,283,730 0 47,283,730 TBD TBD 1,654,931 5.00% 2,364,187
2021 47,046,605 0 47,046,605 TBD TBD 1,646,631 5.25% 2,469,947
Projecting future RPS Class I REC supply is particularly difficult for various reasons. Much of
the uncertainty derives from forces external to the program itself, including but certainly not limited to
the following:
continued uncertainties in the broader national and global economies;
renewable energy and climate policies, regulations, and incentives at the federal level;
changes in the pipeline infrastructure, supply, and price of natural gas, which fuels most
conventional electricity generation that competes with generation from renewable resources;
generation installations resulting from the clean energy RFPs that have been or are expected to
be issued by certain New England States , especially solar farms, onshore and offshore wind
farms, and hydroelectric plants – both in-region and adjacent regions – which could include
large, RPS-ineligible hydropower;97
approval and installation of new electricity transmission lines to link large wind farms in
northern New England and adjacent Canadian provinces to load centers in southern New
England;
decisions by owners of New York windfarms, whose NYSERDA RPS contracts are scheduled to
end over the next ten years and are not supported during the next several years under Tier 2 of
the new NY Clean Energy Standard (subject to change), with regard to the option of exporting
power to ISO New England and earning RECs in the Massachusetts and other state RPS markets;
95 Each of the REC, WEC, and AEC obligations for each year is the total of all the individual obligations in that year and, due to consistent upward rounding, is greater than the result of multiplying the total load obligation by the Minimum Standard. 96 The Load Obligation projections here are the same those for RPS Class I in Table Seven. See explanation and reference in footnote 34 regarding the use of “load obligation” for “retail sales.” 97 The statutory authority for this long term clean energy RFP is Section 83A of the Green Communities Act of 2008 as amended by Chapter 209 of the Acts of 2012, Section 36. See the Clean Energy RFP website for more infiormation.

Commonwealth of Massachusetts RPS & APS Annual Compliance Report for 2015
Department of Energy Resources October 10, 2017, page 28 of 41
development of anaerobic digester gas projects supplied from agricultural, food processing, food
service, and wastewater treatment facilities, for which Massachusetts provides incentives;
the continued development of in-state solar PV under the SMART Program;98
and
interaction between the RPS Class I Minimum Standard and the Clean Energy Standard
regulation recently promulgated by the MassDEP.99
Accelerated solar PV development began to show up in the RPS market in 2010 and has been
increasing rapidly since then. DOER expects further strong growth in the years ahead, boosted by the
Solar Carve-Out II that commenced in 2014, the Solar Loan Program announced by Governor Charlie
Baker on December 17, 2015,100
the new SMART Program,101
and favorable equipment and installation
cost trends. The December 2015 extension of the federal Investment Tax Credit will also provide
additional incentives for solar PV into the next decade.
The 2012 changes in the RPS Class I eligibility of woody biomass fueled plants introduced
challenging, overall efficiency requirements on the development of new biomass projects and should
focus development activities on technologies such as CHP. Although the new standards did not apply to
already qualified plants until 2016 (except for sustainable fuel sourcing, which was effective as of
2013), several qualified plants in northern New England already had ceased operation or reduced output
well before 2013 in reaction to the decline in electricity prices from lower natural gas prices and
softening electricity demand. As expected, all except one of the biomass plants that were temporarily
grandfathered from the efficiency requirements of the new standards became unqualified at the end of
2015, which will further reduce the quantity of woody biomass-sourced RPS Class I RECs available to
the market in 2016 and probably for some time thereafter.
The Solar Carve-Out returned to an SREC supply shortfall in 2015 after three years of surplus
generation, 2012-2014, which had followed shortfalls in the two ramp-up years of the SCO, 2010-2011.
In 2011, 26,598 MWh of SRECs were generated, followed by 118,356 in 2012, 300,816 in 2013,
605,969 in 2014, and 757,012 in 2015. The dramatic increase in generation through 2014 was the result
of a rapid increase in installed capacity (12 MW installed in 2010, 39 MW in 2011, 135 MW in 2012,
and 230 MW in 2013) reacting to the attractive incentives of the program, but that ramp-up slowed when
the capacity cap was reached and then breached in 2013, and only another 215 MW were added in 2014,
27 MW in 2015, and the final 5.9 MW in February of 2016.
Although the output in 2015 was 25% higher than in 2014, the Minimum Standard more than
doubled. This was the result of two consecutive years (2012 & 2013) of the Solar Credit Clearinghouse
Auction requiring all three rounds before clearing. When that occurred, the volume of certificates
deposited into the auction were added to the following year’s compliance obligation twice. This
mechanism was designed to (a) ensure that there is adequate demand for the auction to clear and
(b) encourage retail Suppliers to place bids in earlier rounds of the auction to avoid a large demand
increase that exceeds available supply.
The price of SRECs and the cost of the Solar Carve-Out had been affected in the past by, among
other things, the relative amounts of the retail load that are under pre-2010 contracts and contracts
entered or revised on or after January 1, 2010, for SREC shortfalls under which different ACP rates
applied. However, that factor ended in 2015, when only one Supplier served a small remaining load of
98 See footnote 101. 99 See the MassDEP Clean Energy Standard webpage. 100 For information on the Solar Loan Program, visit these two pages: here and www.masssolarloan.com. 101 See Chapter 75 of the Acts of 2016 and DOER’s webpage, Development of the Next Solar Incentive.

Commonwealth of Massachusetts RPS & APS Annual Compliance Report for 2015
Department of Energy Resources October 10, 2017, page 29 of 41
34,577 MWh under pre-2010 contracts; that Supplier had no SREC shortfall and did not need to use the
ACP. Therefore, DOER is no longer presenting this data in a table and is no longer tracking this data.102
As of 2015, in addition to the supply/demand balance, the price of SRECs and the cost of the
SCO are affected, instead, by the relative amounts of the retail load that are under contracts prior to June
28, 2013, and contracts entered or revised on or after that date (see Table Nine), for SREC shortfalls
under which different Minimum Standard percentages apply. For 2015, those percentages were,
respectively 1.5359% & 2.1142%. Those percentages declined for 2016 to 0.9801% & 1.7568%,
0.9861% & 1.6313% for 2017, and will be 1.1411% & 1.7903% for 2018.103
Table Nine
MA Solar Carve-Out Loads Served under Pre-June 28, 2013 & More Recent Retail Contracts,
Actual (2015) & Projected (2016-2021), in MWh104
Year Actual/Projected
Total Load
Obligation
Load Served under
pre-6/28/13 Retail
Contracts,
Actual/Projected
Load Served under
later Retail
Contracts,
Actual/Projected
2015 48,009,723 4,019,550 43,990,173
2016 48,030,025 1,405,437 46,624,588
2017 47,860,302 456,458 47,403,843
2018 47,670,277 109,134 47,561,143
2019 47,580,137 26,585 47,553,552
2020 47,283,730 23,155 47,260,575
2021 48,030,025 TBD TBD
The Solar Carve-Out II commenced on April 25, 2014, providing the incentive for continued
PV development, and projects are getting qualified and implemented at a rapid pace. In 2014 and most
of 2015, the speed has been driven, in part, by the impending end of the federal Investment Tax Credit.
In 2014, 94.9 MW of qualified capacity came on line, while more than 286.9 MW came on line in 2015,
456.5 in 2016, and 257.6 in the first eight months of 2017, continuing the SCO’s PV development pace
of 2013-14. Further rapid supply growth is expected, especially with the late 2015 extension of the
federal investment tax credit and further extensions to the program. While only 15,908 SREC-IIs were
generated in 2014, the rapid installation rate in 2014 and 2015 led to the generation of 192,855 SREC-
IIs in 2015, which resulted in a significant market oversupply in 2015. Continued expansion of the
program led to another significant market oversupply in 2016.
Demand for SREC-IIs is affected over the next few years by the “exempt load” provisions in the
regulations, meant to avoid any undue penalty for Suppliers’ retail contracts already in force when this
Minimum Standard became effective. Since the program officially started on April 25, 2014, partway
into the Compliance Year, the regulations provided that all retail load under contracts on or before that
date would be exempt from Solar Carve-Out II compliance. Supplier-projected exempt load estimates
are shown in Table Ten.
102 See Table Ten in the RPS & APS Annual Complaince Report for 2014 for the pre-2015 data. 103 See SCO Minimum Standard calculations here: http://www.mass.gov/eea/energy-utilities-clean-tech/renewable-energy/solar/rps-solar-carve-out/current-status-of-the-rps-solar-carve-out-program.html. 104 Also see footnote 50 regarding ways in which the Minimum Standard may differ in relation to the amounts of retail load served under different contract dates.

Commonwealth of Massachusetts RPS & APS Annual Compliance Report for 2015
Department of Energy Resources October 10, 2017, page 30 of 41
Table Ten
MA Solar Carve-Out II Loads Served under Pre-April 25, 2014 and More Recent
Retail Contracts, Actual (2014-2015) & Projected (2016-2021), in MWh105
Year
Total Retail
Load
Obligation
Load served under
pre-4/25/14
Retail Contracts
Net Retail
Load
Obligation
2014 48,129,294 23,171,635 24,957,659
2015 48,847,294 10,516,104 37,493,619
2016 48,030,025 4,804,203 43,225,821
2017 47,860,302 2,563,914 45,296,387
2018 47,670,277 1,352,100 46,318,177
2019 47,580,137 972,225 46,607,912
2020 47,283,730 213,852 47,069,878
2021 47,046,605 TBD TBD
Emergency regulations on April 8, 2016, expanded the total size of the program. It also
provided, effective with Compliance Year 2017, for three Minimum Standards: one for load served
under contracts dated for contracts entered after April 25, 2014, and on or before May 8, 2016, and a
higher one for load served under contracts entered after May 8, 2016.106
Class II RECs have been in short supply since the beginning of this Minimum Standard in 2009.
The absolutely limiting fact is that the total pre-1998 installed capacity cannot rise, but some additional
portion of that capacity is expected to qualify for Class II over time. The unknown factors for future
supply are (a) how much of that capacity, mostly from hydroelectric plants, will succeed in the future to
meet the MA RPS Class II environmental criteria, and (b) how much of the MA Class II REC qualified
or qualifiable supply will be used for compliance with classes of RPS in other New England states for
which they are also qualified and some of which have higher ACP rates for pre-1998 capacity. The
percentage of such loss to other states, mostly Connecticut and New Hampshire, for 2010 through 2015
has been 19%, 24%, 28%, 16%, 19%, and 15% respectively.107
Class II WECs are likely to remain in surplus for another year or two, while the net load
obligation rises toward rough parity with the annual supply. The desired approach to parity has been
undermined heretofore by the effects of considerable banking forward of WECs prior to expiration of
the Exempt Load. By means of the Class II rulemaking that concluded on June 20, 2014, DOER
instituted a two year hiatus in banking (2014-2015), during which the quantity of already-banked WEC
attributes has become zero (by compliance use or expiration). When banking resumes as of 2016, it will
be limited to 5% of a Supplier’s WEC obligation, not the original 30%. Although DOER expects the
Exempt Load to reach zero by 2017 or earlier, the projected slow decline in total retail load after 2016
may result in a slowly growing surplus of potentially available WECs. While the two owners of the
Waste Energy facilities could limit the actual availability of WECs in the market, the new 5% banking
limit would prevent the total quantity of WECs available for each year’s compliance from rising to more
than a small fraction of its former amount.
APS AECs are supplied almost entirely by CHP systems. In 2015, the output of AECs was less
than 8% more than in 2014. However, the APS CHP program continues to experience a substantial
105 Also see footnote 50 regarding ways in which the Minimum Standard may differ in relation to the amounts of retail load served under different contract dates. 106See the Minimum Standards links from this web page. 107 The percentges of MA Class II RECs settled in other states are based on data in a confidential Regulator’s Report at the NEPOOL GIS..
Commonwealth of Massachusetts RPS & APS Annual Compliance Report for 2015
Department of Energy Resources October 10, 2017, page 31 of 41
growth in the number of large CHP projects that either were completed in late 2015 and began
generating AECs in 2016 or are now under construction and will be generating AECs some time in
2017. The growing supply of AECs will have to chase a load obligation that is also growing, the latter
due to the end of the Exempt Load in 2017 and the continuing annual increase in the Minimum
Standard, even though the latter has been rising by only 0.25% per year since 2014 instead of the former
0.5%.
Two developments will impact the future the AEC supply. One is that the actually used thermal
output of municipal solid waste fueled plants electricity and the used thermal energy generated by fuel
cells were recognized as eligible for APS qualification by Chapter 188 of the Acts of 2016. The other is
that Chapter 251 of the Acts of 2014 mandated DOER to add a suite of renewable thermal technologies
to the APS108
. DOER began in November of 2014 to develop what proved to be a technically
challenging new standard and expects to complete the process in late 2017 or early 2018.109
Thereafter,
DOER anticipates the generation of AECs from projects of a wide range of sizes utilizing solar thermal
systems, woody biomass thermal equipment, heat pumps, liquid biofuels, and other qualifying
technologies to provide heating or cooling energy to buildings, water, and industrial processes. AECs
from renewable thermal, waste-to-energy thermal, and fuel cell projects are expected to provide
increasing shares of the AEC supply demanded for the rising APS Minimum Standard during the years
ahead, even while CHP development continues.
SECTION NINE
USES OF THE ALTERNATIVE COMPLIANCE PAYMENT FUNDS
The Alternative Compliance mechanism for meeting RPS and APS obligations in CY 2015
resulted in total ACP proceeds of more than $31 million, as detailed in Table Eleven. This total is about
$3 million more than in 2014. Below are observations on this increase and on general ACP trends.
RPS Class I: After two years of undersupply and higher ACPs in 2011 and 2012, the supply rebounded
robustly in 2013 (especially from wind projects), and PV generation continued accelerating, which
reduced the use of ACPs during 2013 through 2015. DOER expects the use of ACP to continue to remain
fairly low as the two Solar Carve-Outs continue to cut into the overall Class I compliance obligation,
additional projects selected under the multi-state clean Energy RFP begin to come online, and as overall
electricity sales by the Suppliers is reduced by both (a) aggressive development of PV and other
distributed generation and (b) continued adoption of energy efficiency measures in Massachusetts and
other New England states.110
RPS Class I Solar-Carve Out: The high ACP total in 2010 and 2011 were due to the commencement of
this obligation in 2010 and the delay of supply emerging from the PV development pipeline. However,
rapidly accelerating development of PV arrays was more than enough to eliminate the shortfall and
resulted in a market oversupply and minimal use of ACP for 2012, a trend that continued through 2014,
meeting DOER’s expectations. However, for reasons noted on page 28, a small shortage developed in
2015, which is not expected to continue in 2016 and beyond as supply and demand should remain
relatively balanced going forward.
RPS Class I Solar-Carve Out II: While a significant ACP total was expected for the 2014 start-up year
of this obligation, the much reduced ACPs for 2015 resulted from a rapid acceleration of project
applications, qualifications, and installations. It is expected that the market will continue to be
significantly oversupplied in 2016 and there should be little reliance on ACP in the near future.
108 This statute is at (https://malegislature.gov/Laws/SessionLaws/Acts/2014/Chapter251). 109 The process for revising the APS Regulations, 225 CMR 16.00, is detailed at this web page. 110 See footnote 97 for information about the Clean Energy RFP.
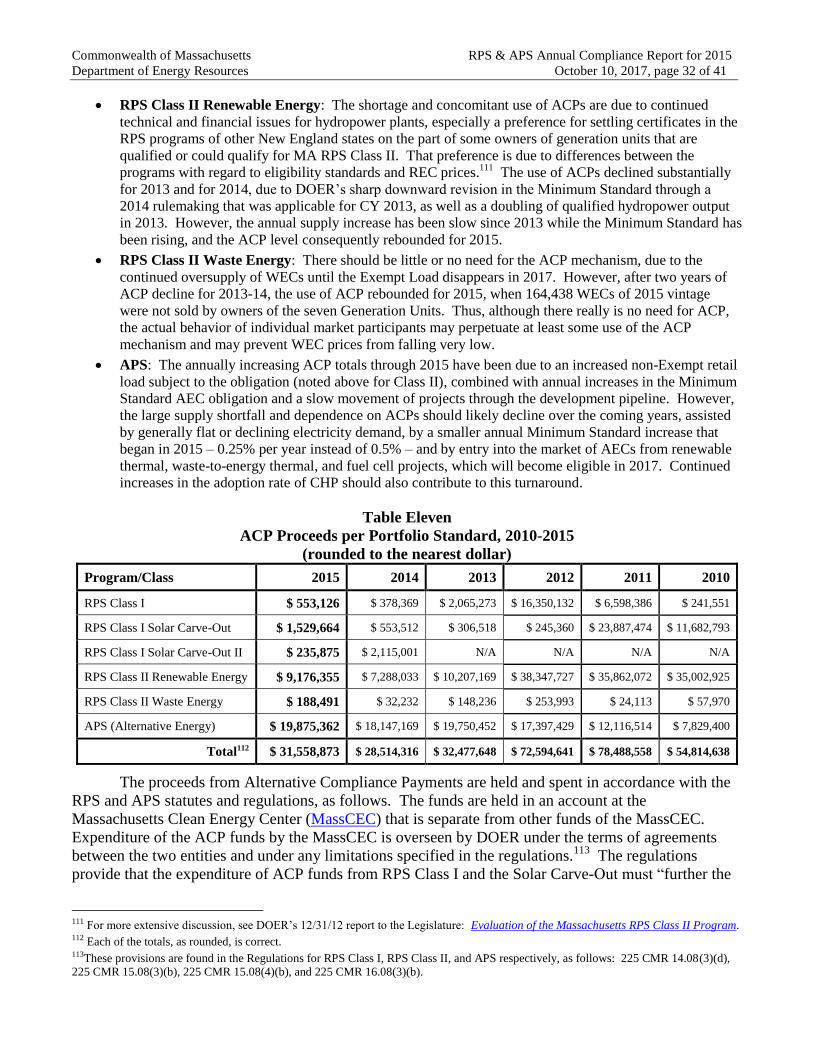
Commonwealth of Massachusetts RPS & APS Annual Compliance Report for 2015
Department of Energy Resources October 10, 2017, page 32 of 41
RPS Class II Renewable Energy: The shortage and concomitant use of ACPs are due to continued
technical and financial issues for hydropower plants, especially a preference for settling certificates in the
RPS programs of other New England states on the part of some owners of generation units that are
qualified or could qualify for MA RPS Class II. That preference is due to differences between the
programs with regard to eligibility standards and REC prices.111
The use of ACPs declined substantially
for 2013 and for 2014, due to DOER’s sharp downward revision in the Minimum Standard through a
2014 rulemaking that was applicable for CY 2013, as well as a doubling of qualified hydropower output
in 2013. However, the annual supply increase has been slow since 2013 while the Minimum Standard has
been rising, and the ACP level consequently rebounded for 2015.
RPS Class II Waste Energy: There should be little or no need for the ACP mechanism, due to the
continued oversupply of WECs until the Exempt Load disappears in 2017. However, after two years of
ACP decline for 2013-14, the use of ACP rebounded for 2015, when 164,438 WECs of 2015 vintage
were not sold by owners of the seven Generation Units. Thus, although there really is no need for ACP,
the actual behavior of individual market participants may perpetuate at least some use of the ACP
mechanism and may prevent WEC prices from falling very low.
APS: The annually increasing ACP totals through 2015 have been due to an increased non-Exempt retail
load subject to the obligation (noted above for Class II), combined with annual increases in the Minimum
Standard AEC obligation and a slow movement of projects through the development pipeline. However,
the large supply shortfall and dependence on ACPs should likely decline over the coming years, assisted
by generally flat or declining electricity demand, by a smaller annual Minimum Standard increase that
began in 2015 – 0.25% per year instead of 0.5% – and by entry into the market of AECs from renewable
thermal, waste-to-energy thermal, and fuel cell projects, which will become eligible in 2017. Continued
increases in the adoption rate of CHP should also contribute to this turnaround.
Table Eleven
ACP Proceeds per Portfolio Standard, 2010-2015
(rounded to the nearest dollar)
Program/Class 2015 2014 2013 2012 2011 2010
RPS Class I $ 553,126 $ 378,369 $ 2,065,273 $ 16,350,132 $ 6,598,386 $ 241,551
RPS Class I Solar Carve-Out $ 1,529,664 $ 553,512 $ 306,518 $ 245,360 $ 23,887,474 $ 11,682,793
RPS Class I Solar Carve-Out II $ 235,875 $ 2,115,001 N/A N/A N/A N/A
RPS Class II Renewable Energy $ 9,176,355 $ 7,288,033 $ 10,207,169 $ 38,347,727 $ 35,862,072 $ 35,002,925
RPS Class II Waste Energy $ 188,491 $ 32,232 $ 148,236 $ 253,993 $ 24,113 $ 57,970
APS (Alternative Energy) $ 19,875,362 $ 18,147,169 $ 19,750,452 $ 17,397,429 $ 12,116,514 $ 7,829,400
Total112 $ 31,558,873 $ 28,514,316 $ 32,477,648 $ 72,594,641 $ 78,488,558 $ 54,814,638
The proceeds from Alternative Compliance Payments are held and spent in accordance with the
RPS and APS statutes and regulations, as follows. The funds are held in an account at the
Massachusetts Clean Energy Center (MassCEC) that is separate from other funds of the MassCEC.
Expenditure of the ACP funds by the MassCEC is overseen by DOER under the terms of agreements
between the two entities and under any limitations specified in the regulations.113
The regulations
provide that the expenditure of ACP funds from RPS Class I and the Solar Carve-Out must “further the
111 For more extensive discussion, see DOER’s 12/31/12 report to the Legislature: Evaluation of the Massachusetts RPS Class II Program. 112 Each of the totals, as rounded, is correct. 113These provisions are found in the Regulations for RPS Class I, RPS Class II, and APS respectively, as follows: 225 CMR 14.08(3)(d), 225 CMR 15.08(3)(b), 225 CMR 15.08(4)(b), and 225 CMR 16.08(3)(b).
Commonwealth of Massachusetts RPS & APS Annual Compliance Report for 2015
Department of Energy Resources October 10, 2017, page 33 of 41
commercial development of RPS Class I Renewable Generation Units and Solar Carve-Out Renewable
Generation Units,” while the expenditure of ACP funds from APS must “further the commercial
development of Alternative Generation.” Although the statute and regulations for RPS Class II do not
place any restrictions, DOER generally uses Class II ACP funds to support or promote the development
of renewable and other clean energy, including, among other things, local and state-level clean energy
projects and activities of DOER’s Green Communities Division.
ACP Spending Plans for prior years dating back to 2010 have been made available at the Annual
Compliance Reports page, accessible via DOER’s RPS & APS homepage. Any future Plans also will
be posted there when they are ready.
Commonwealth of Massachusetts RPS & APS Annual Compliance Report for 2015
Department of Energy Resources October 10, 2017, page 34 of 41
APPENDIX ONE
RPS and APS 2015 Compliance Filings, Review, and Verification
All Suppliers that sold retail electricity to end-use customers in the territories of the four
Massachusetts regulated utilities during 2015 were required to submit their Annual Compliance Filings for
2015 by Friday, July 1, 2016. DOER had issued forms and instructions for the Filings on May 31, 2016, just
over two weeks before the June 15th end of the NEPOOL GIS trading period for the fourth quarter of 2015.
By the evening of July 1st DOER had received emailed Filings from all four regulated utilities and from 55 of
the 56 Competitive Suppliers. DOER did not receive a Filing from Glacial Energy of New England, a
complicated and serious matter that is discussed in the last paragraph, below.
The review encompassed both printed and electronic copies of Filers’ compliance tables and GIS
spreadsheet reports. The electronic files enabled DOER to aggregate, analyze, and summarize the
information in the Filings, while the printed versions of GIS reports were available to verify the electronic
versions of those reports. DOER contacted a bit over than half of the Suppliers for corrected or additional
information, documentation, explanations, and clarifications. The most common error was failure to
complete Tables 1B and 1C, and some did not complete some Tables in tabs 2 and 3; all of these relate to the
two Solar Carve-outs. Several Filers sent incorrectly formatted GIS reports, as usual, but immediately
replaced them upon notification. There was almost no confusion regarding what to do with surplus SRECs
and SREC-IIs; Suppliers now realize the value of transferring them to the SCC Auction Account at the GIS,
from which they were all sold in the first round as Reminted Auction SRECs with a two year shelf life.
However, the value difference notwithstanding, one Supplier did use 56 SREC-IIs for non-SCO Class I
compliance. The revised method for ascertaining annual compliance, introduced for 2011 and depending on
good cooperation from the regulated utilities, continues proving its value in simplifying the task of Suppliers
in calculating their obligations. Finally, the worksheet that calculates ACP obligations, introduced for 2014,
continues to prove its worth by preventing both miscalculations and improper rounding.
One Supplier, Glacial Energy of New England, Inc., had declared bankruptcy in the spring of 2014
and finally ceased to exist and to serve load on July 13, 2015. Glacial’s load had been sold to Agera Energy,
LLC, via Platinum Partners in June of 2014. Agera applied for competitive supplier licenses in some states
where Glacial operated, with the stated intention of assuming Glacial’s retail contracts. Its license
application for Massachusetts was submitted September 24, 2014, and approved April 3, 2015. Review of
the legal documents led DOER to concur with Agera that the new owner could not be held responsible for
the regulatory obligations of the Glacial retail load until the date that the load itself was transferred to Agera,
which did not occur until July 13, 2015. No longer in existence after that date, Glacial neither submitted a
Filing and nor remitted the required ACPs to cover its RPS and APS compliance obligations for 2015.
DOER found that Glacial’s retail load obligations (as obtained from the regulated utilities) held about steady
through July but then declined sharply in August. DOER determined that Agera was responsible for
Glacial’s load as of July 13. To avoid getting into the minutiae of daily and hourly load data, DOER
calculated 19/31 of Glacial’s July load and assigned it to Agera along with the August load in a letter on
May 17, with the option (not taken) for Agera to dispute the assignment. Agera incorporated that portion of
the Glacial load into its own, and fulfilled the resultant RPS and APS obligations that otherwise would not
have been met at all, since Glacial no longer existed. The following recounts Glacial’s unmet Certificate and
unpaid ACP obligations, which totaled $2,238,972.66:
RPS Class I RECs 9,020 MWh $ 604,971.40
Solar Carve-Out SRECs 2,570 MWh $1,274,720.00
Solar Carve-Out II SREC-IIs 395 MWh $ 148,125.00
RPS Class II Renewable Energy RECs 2,397 MWh $ 65,989.41
RPS Class II Waste-to-Energy WECs 4,195 MWh $ 46,186.95
APS AECs 4,495 MWh $ 98,979.90
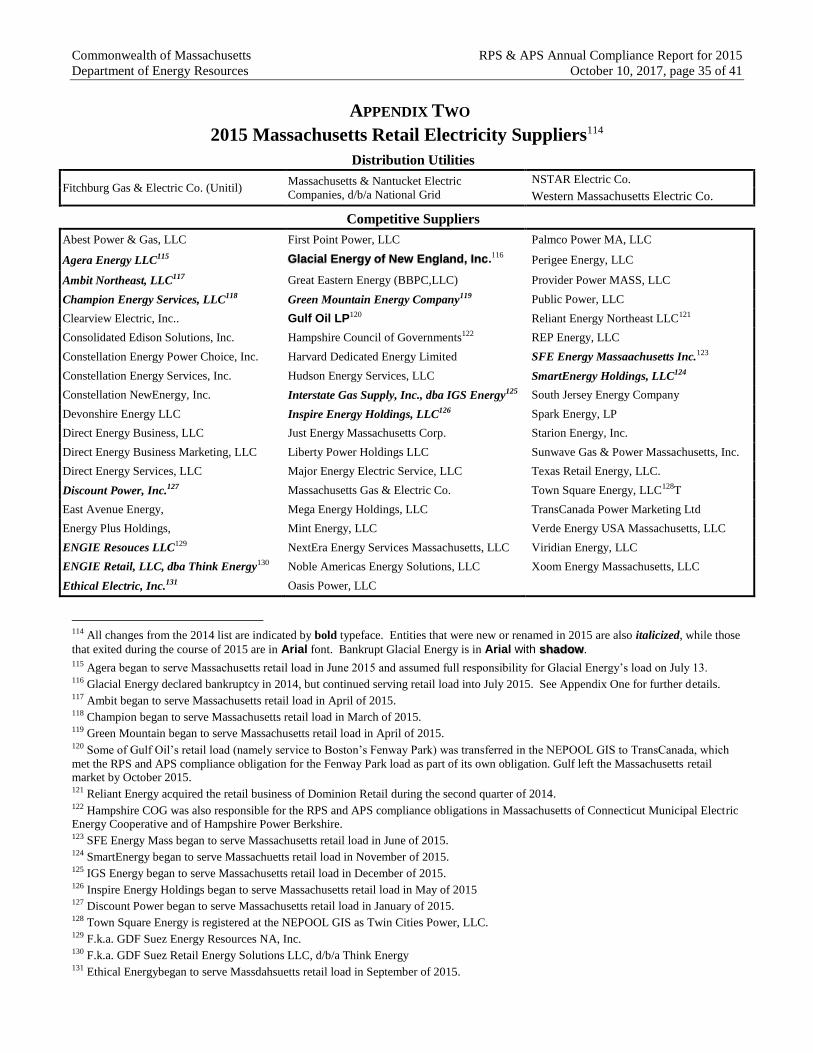
Commonwealth of Massachusetts RPS & APS Annual Compliance Report for 2015
Department of Energy Resources October 10, 2017, page 35 of 41
APPENDIX TWO
2015 Massachusetts Retail Electricity Suppliers114
Distribution Utilities
Fitchburg Gas & Electric Co. (Unitil) Massachusetts & Nantucket Electric
Companies, d/b/a National Grid
NSTAR Electric Co.
Western Massachusetts Electric Co.
Competitive Suppliers
Abest Power & Gas, LLC First Point Power, LLC Palmco Power MA, LLC
Agera Energy LLC115 .116 Glacial Energy of New England, Inc Perigee Energy, LLC
Ambit Northeast, LLC117 Great Eastern Energy (BBPC,LLC) Provider Power MASS, LLC
Champion Energy Services, LLC118 Green Mountain Energy Company119 Public Power, LLC
Clearview Electric, Inc.. Gulf Oil LP120 Reliant Energy Northeast LLC121
Consolidated Edison Solutions, Inc. Hampshire Council of Governments122 REP Energy, LLC
Constellation Energy Power Choice, Inc. Harvard Dedicated Energy Limited SFE Energy Massaachusetts Inc.123
Constellation Energy Services, Inc. Hudson Energy Services, LLC SmartEnergy Holdings, LLC124
Constellation NewEnergy, Inc. Interstate Gas Supply, Inc., dba IGS Energy125 South Jersey Energy Company
Devonshire Energy LLC Inspire Energy Holdings, LLC126 Spark Energy, LP
Direct Energy Business, LLC Just Energy Massachusetts Corp. Starion Energy, Inc.
Direct Energy Business Marketing, LLC Liberty Power Holdings LLC Sunwave Gas & Power Massachusetts, Inc.
Direct Energy Services, LLC Major Energy Electric Service, LLC Texas Retail Energy, LLC.
Discount Power, Inc.127 Massachusetts Gas & Electric Co. Town Square Energy, LLC128T
East Avenue Energy, Mega Energy Holdings, LLC TransCanada Power Marketing Ltd
Energy Plus Holdings, Mint Energy, LLC Verde Energy USA Massachusetts, LLC
ENGIE Resouces LLC129 NextEra Energy Services Massachusetts, LLC Viridian Energy, LLC
ENGIE Retail, LLC, dba Think Energy130 Noble Americas Energy Solutions, LLC Xoom Energy Massachusetts, LLC
Ethical Electric, Inc.131 Oasis Power, LLC
114 All changes from the 2014 list are indicated by bold typeface. Entities that were new or renamed in 2015 are also italicized, while those
that exited during the course of 2015 are in Arial font. Bankrupt Glacial Energy is in Arial with . shadow115 Agera began to serve Massachusetts retail load in June 2015 and assumed full responsibility for Glacial Energy’s load on July 13. 116 Glacial Energy declared bankruptcy in 2014, but continued serving retail load into July 2015. See Appendix One for further details. 117 Ambit began to serve Massachusetts retail load in April of 2015. 118 Champion began to serve Massachusetts retail load in March of 2015. 119 Green Mountain began to serve Massachusetts retail load in April of 2015. 120 Some of Gulf Oil’s retail load (namely service to Boston’s Fenway Park) was transferred in the NEPOOL GIS to TransCanada, which
met the RPS and APS compliance obligation for the Fenway Park load as part of its own obligation. Gulf left the Massachusetts retail market by October 2015. 121 Reliant Energy acquired the retail business of Dominion Retail during the second quarter of 2014. 122 Hampshire COG was also responsible for the RPS and APS compliance obligations in Massachusetts of Connecticut Municipal Electric Energy Cooperative and of Hampshire Power Berkshire. 123 SFE Energy Mass began to serve Massachusetts retail load in June of 2015. 124 SmartEnergy began to serve Massachuetts retail load in November of 2015. 125 IGS Energy began to serve Massachusetts retail load in December of 2015. 126 Inspire Energy Holdings began to serve Massachusetts retail load in May of 2015 127 Discount Power began to serve Massachusetts retail load in January of 2015. 128 Town Square Energy is registered at the NEPOOL GIS as Twin Cities Power, LLC. 129 F.k.a. GDF Suez Energy Resources NA, Inc. 130 F.k.a. GDF Suez Retail Energy Solutions LLC, d/b/a Think Energy 131 Ethical Energybegan to serve Massdahsuetts retail load in September of 2015.
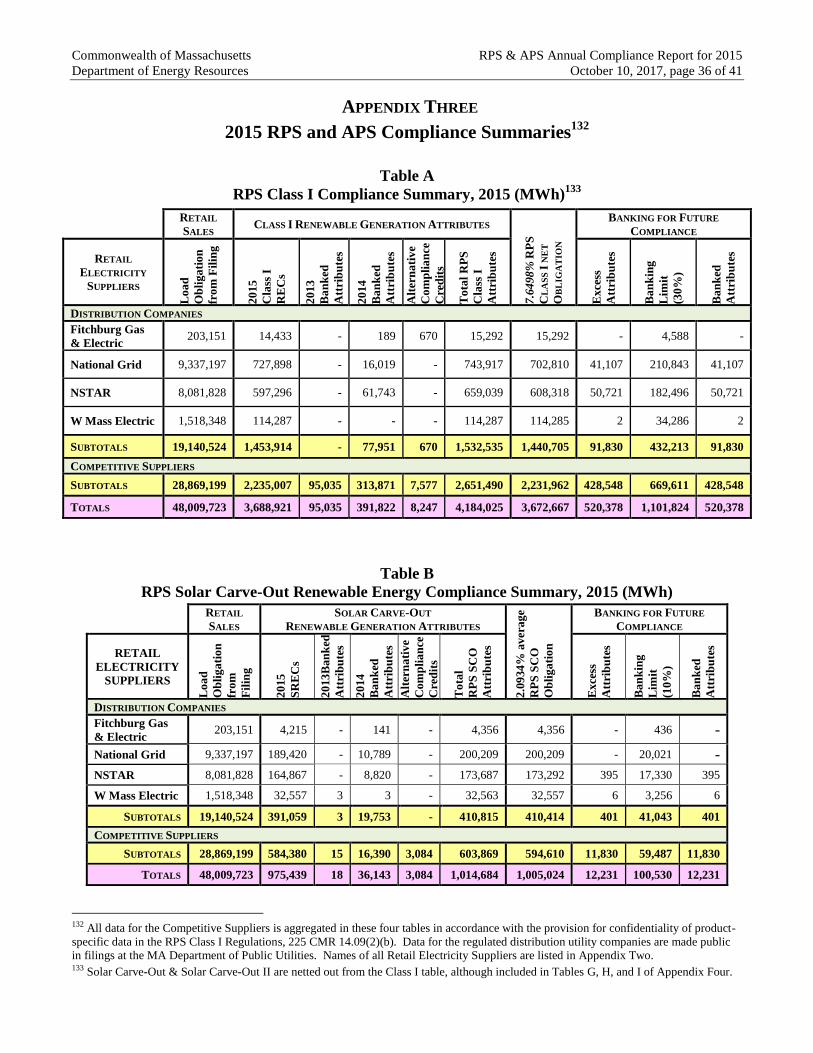
Commonwealth of Massachusetts RPS & APS Annual Compliance Report for 2015
Department of Energy Resources October 10, 2017, page 36 of 41
APPENDIX THREE
2015 RPS and APS Compliance Summaries132
Table A
RPS Class I Compliance Summary, 2015 (MWh)133
RETAIL
SALES CLASS I RENEWABLE GENERATION ATTRIBUTES
7.6
498
% R
PS
CL
AS
S I
NE
T
OB
LIG
AT
ION
BANKING FOR FUTURE
COMPLIANCE
RETAIL
ELECTRICITY
SUPPLIERS
Lo
ad
Ob
lig
ati
on
fro
m F
ilin
g
20
15
Cla
ss I
RE
Cs
20
13
Ba
nk
ed
Att
rib
ute
s
20
14
Ba
nk
ed
Att
rib
ute
s
Alt
ern
ati
ve
Co
mp
lia
nce
Cre
dit
s
To
tal
RP
S
Cla
ss I
Att
rib
ute
s
Ex
cess
Att
rib
ute
s
Ba
nk
ing
Lim
it
(30
%)
Ba
nk
ed
Att
rib
ute
s
DISTRIBUTION COMPANIES
Fitchburg Gas
& Electric 203,151 14,433 - 189 670 15,292 15,292 - 4,588 -
National Grid 9,337,197 727,898 - 16,019 - 743,917 702,810 41,107 210,843 41,107
NSTAR 8,081,828 597,296 - 61,743 - 659,039 608,318 50,721 182,496 50,721
W Mass Electric 1,518,348 114,287 - - - 114,287 114,285 2 34,286 2
SUBTOTALS 19,140,524 1,453,914 - 77,951 670 1,532,535 1,440,705 91,830 432,213 91,830
COMPETITIVE SUPPLIERS
SUBTOTALS 28,869,199 2,235,007 95,035 313,871 7,577 2,651,490 2,231,962 428,548 669,611 428,548
TOTALS 48,009,723 3,688,921 95,035 391,822 8,247 4,184,025 3,672,667 520,378 1,101,824 520,378
Table B
RPS Solar Carve-Out Renewable Energy Compliance Summary, 2015 (MWh)
RETAIL
SALES
SOLAR CARVE-OUT
RENEWABLE GENERATION ATTRIBUTES
2.0
934
% a
ver
ag
e
RP
S S
CO
Ob
lig
ati
on
BANKING FOR FUTURE
COMPLIANCE
RETAIL
ELECTRICITY
SUPPLIERS
Lo
ad
Ob
lig
ati
on
fro
m
Fil
ing
20
15
SR
EC
s
20
13
Ban
ked
Att
rib
ute
s
20
14
Ba
nk
ed
Att
rib
ute
s
Alt
ern
ati
ve
Co
mp
lia
nce
Cre
dit
s
To
tal
RP
S S
CO
Att
rib
ute
s
Ex
cess
Att
rib
ute
s
Ba
nk
ing
Lim
it
(10
%)
Ba
nk
ed
Att
rib
ute
s DISTRIBUTION COMPANIES
Fitchburg Gas
& Electric 203,151 4,215 - 141 - 4,356 4,356 - 436 -
National Grid 9,337,197 189,420 - 10,789 - 200,209 200,209 - 20,021 -
NSTAR 8,081,828 164,867 - 8,820 - 173,687 173,292 395 17,330 395
W Mass Electric 1,518,348 32,557 3 3 - 32,563 32,557 6 3,256 6
SUBTOTALS 19,140,524 391,059 3 19,753 - 410,815 410,414 401 41,043 401
COMPETITIVE SUPPLIERS
SUBTOTALS 28,869,199 584,380 15 16,390 3,084 603,869 594,610 11,830 59,487 11,830
TOTALS 48,009,723 975,439 18 36,143 3,084 1,014,684 1,005,024 12,231 100,530 12,231
132 All data for the Competitive Suppliers is aggregated in these four tables in accordance with the provision for confidentiality of product-
specific data in the RPS Class I Regulations, 225 CMR 14.09(2)(b). Data for the regulated distribution utility companies are made public in filings at the MA Department of Public Utilities. Names of all Retail Electricity Suppliers are listed in Appendix Two. 133 Solar Carve-Out & Solar Carve-Out II are netted out from the Class I table, although included in Tables G, H, and I of Appendix Four.

Commonwealth of Massachusetts RPS & APS Annual Compliance Report for 2015
Department of Energy Resources October 10, 2017, page 37 of 41
Table C
RPS Solar Carve-Out II Renewable Energy Compliance Summary, 2015 (MWh)
RETAIL SALES
SOLAR CARVE-OUT II RENEWABLE
GENERATION ATTRIBUTES
0.3
28
8%
RP
S S
CO
II
Ob
lig
ati
on
BANKING FOR FUTURE
COMPLIANCE
RETAIL
ELECTRI-
CITY
SUPPLI-
ERS
Loa
d
Ob
lig
ati
on
fro
m F
ilin
g
Exem
pt
Reta
il L
oa
d
(un
der
pre
-
4/2
5/1
4
con
tract
s)
Net
Reta
il L
oa
d
2015
SR
EC
-IIs
2013
Ba
nk
ed
2014
Ba
nk
ed
Alt
ern
ati
ve
Co
mp
lia
nce
Cred
its
To
tal
RP
S
SC
O I
I
Att
rib
ute
s
Excess
Att
rib
ute
s
Ba
nk
ing
Lim
it
(10
%)
Ba
nk
ed
Att
rib
ute
s
DISTRIBUTION COMPANIES
Fitchburg
Gas &
Electric
203,151 - 203,151 730 - - - 730 668 62 67 62
National
Grid 9,337,197 - 9,337,197 30,701 - - - 30,701 30,701 - 3,071 -
NSTAR 8,081,828 - 8,081,828 28,358 - - - 28,358 26,574 1,78 2,658 1,784
W. Mass
Electric 1,518,348 - 1,518,348 4,993 - - - 4,993 4,993 - 500 -
SUB-
TOTALS 19,140,524 - 19,140,524 64,782 - - - 64,782 62,936 1,846 6,296 1,846
COMPETITIVE SUPPLIERS
SUB-
TOTALS 28,869,199 10,516,104 18,353,097 60,512 - 20 629 61,161 60,381 1,175 6,064 1,172
TOTALS 48,009,723 10,516,104 37,493,621 125,294 - 20 629 125,943 123,317 3,021 12,360 3,018
Table D
RPS Class II Renewable Energy Compliance Summary, 2015 (MWh)
RETAIL SALES CLASS II RENEWABLE ENERGY ATTRIBUTES
2.0
0%
RP
S
Cla
ss I
I R
E
Ob
lig
ati
on
BANKING FOR FUTURE
COMPLIANCE
RETAIL
ELECTRI-
CITY
SUPPLI-
ERS
Loa
d
Ob
lig
ati
on
fro
m F
ilin
g
Exem
pt
Reta
il L
oa
d
Net
Reta
il L
oa
d
2015
Cla
ss I
I
RE
Cs
2013
Ba
nk
ed
2014
Ba
nk
ed
Att
rib
ute
s
Alt
ern
ati
ve
Co
mp
lia
nce
Cred
its
To
tal
RP
S
Cla
ss I
I R
E
Att
rib
ute
s
Excess
Att
rib
ute
s
Ba
nk
ing
Lim
it
(30
%)
Ba
nk
ed
Att
rib
ute
s
DISTRIBUTION COMPANIES
Fitchburg
Gas &
Electric
203,151 0 203,151 3,217 0 729 118 4,064 4,064 0 1,220 0
National
Grid 9,337,197 0 9,337,197 185,710 0 0 1,034 186,744 186,744 0 56,024 0
NSTAR 8,081,828 0 8,081,828 37,456 0 0 124,181 161,637 161,637 0 48,492 0
W. Mass
Electric 1,518,348 0 1,518,348 22,824 0 0 7,543 30,367 30,367 0 9,111 0
SUB-
TOTALS 19,140,524 0 19,140,524 249,207 0 729 132,876 382,812 382,812 0 114,847 0
COMPETITIVE SUPPLIERS
SUB-
TOTALS 28,869,199 34,578 28,834,621 290,192 62,616 39,556 200,446 592,810 576,719 18,488 173,042 18,288
TOTALS 48,009,723 34,578 47,975,145 539,399 62,616 40,285 333,322 975,622 959,531 18,488 287,889 18,288
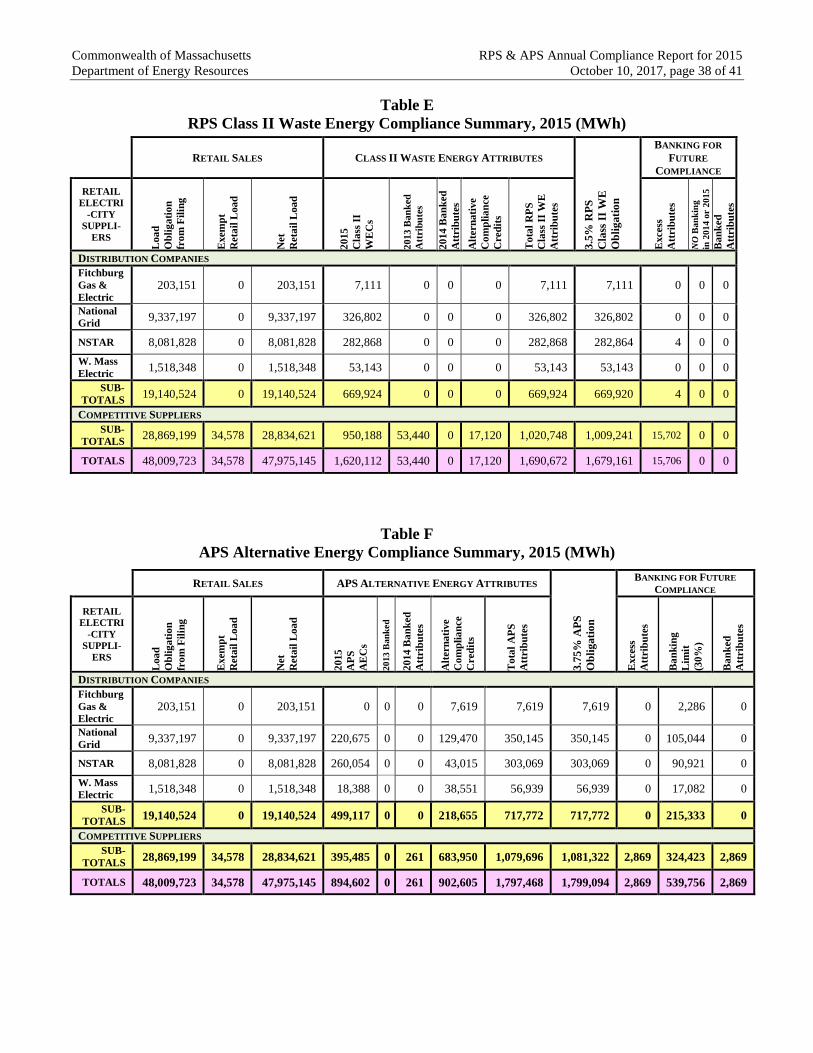
Commonwealth of Massachusetts RPS & APS Annual Compliance Report for 2015
Department of Energy Resources October 10, 2017, page 38 of 41
Table E
RPS Class II Waste Energy Compliance Summary, 2015 (MWh)
RETAIL SALES CLASS II WASTE ENERGY ATTRIBUTES
3.5
% R
PS
Cla
ss I
I W
E
Ob
lig
ati
on
BANKING FOR
FUTURE
COMPLIANCE
RETAIL
ELECTRI
-CITY
SUPPLI-
ERS
Loa
d
Ob
lig
ati
on
fro
m F
ilin
g
Exem
pt
Reta
il L
oa
d
Net
Reta
il L
oa
d
2015
Cla
ss I
I
WE
Cs
2013
Ban
ked
Att
rib
ute
s
2014
Ba
nk
ed
Att
rib
ute
s
Alt
ern
ati
ve
Co
mp
lia
nce
Cred
its
To
tal
RP
S
Cla
ss I
I W
E
Att
rib
ute
s
Excess
Att
rib
ute
s
NO
Ban
kin
g
in 2
014 o
r 2
015
Ba
nk
ed
Att
rib
ute
s
DISTRIBUTION COMPANIES
Fitchburg
Gas &
Electric
203,151 0 203,151 7,111 0 0 0 7,111 7,111 0 0 0
National
Grid 9,337,197 0 9,337,197 326,802 0 0 0 326,802 326,802 0 0 0
NSTAR 8,081,828 0 8,081,828 282,868 0 0 0 282,868 282,864 4 0 0
W. Mass
Electric 1,518,348 0 1,518,348 53,143 0 0 0 53,143 53,143 0 0 0
SUB-
TOTALS 19,140,524 0 19,140,524 669,924 0 0 0 669,924 669,920 4 0 0
COMPETITIVE SUPPLIERS
SUB-
TOTALS 28,869,199 34,578 28,834,621 950,188 53,440 0 17,120 1,020,748 1,009,241 15,702 0 0
TOTALS 48,009,723 34,578 47,975,145 1,620,112 53,440 0 17,120 1,690,672 1,679,161 15,706 0 0
Table F
APS Alternative Energy Compliance Summary, 2015 (MWh)
RETAIL SALES APS ALTERNATIVE ENERGY ATTRIBUTES
3.7
5%
AP
S
Ob
lig
ati
on
BANKING FOR FUTURE
COMPLIANCE
RETAIL
ELECTRI
-CITY
SUPPLI-
ERS
Loa
d
Ob
lig
ati
on
fro
m F
ilin
g
Exem
pt
Reta
il L
oa
d
Net
Reta
il L
oa
d
2015
AP
S
AE
Cs
20
13 B
an
ked
2014
Ba
nk
ed
Att
rib
ute
s
Alt
ern
ati
ve
Co
mp
lia
nce
Cred
its
To
tal
AP
S
Att
rib
ute
s
Excess
Att
rib
ute
s
Ba
nk
ing
Lim
it
(30
%)
Ba
nk
ed
Att
rib
ute
s
DISTRIBUTION COMPANIES
Fitchburg
Gas &
Electric 203,151 0 203,151 0 0 0 7,619 7,619 7,619 0 2,286 0
National
Grid 9,337,197 0 9,337,197 220,675 0 0 129,470 350,145 350,145 0 105,044 0
NSTAR 8,081,828 0 8,081,828 260,054 0 0 43,015 303,069 303,069 0 90,921 0
W. Mass
Electric 1,518,348 0 1,518,348 18,388 0 0 38,551 56,939 56,939 0 17,082 0
SUB-
TOTALS 19,140,524 0 19,140,524 499,117 0 0 218,655 717,772 717,772 0 215,333 0
COMPETITIVE SUPPLIERS
SUB-
TOTALS 28,869,199 34,578 28,834,621 395,485 0 261 683,950 1,079,696 1,081,322 2,869 324,423 2,869
TOTALS 48,009,723 34,578 47,975,145 894,602 0 261 902,605 1,797,468 1,799,094 2,869 539,756 2,869

Commonwealth of Massachusetts RPS & APS Annual Compliance Report for 2015
Department of Energy Resources October 10, 2017, page 39 of 41
APPENDIX FOUR
Data Tables for RPS and APS Compliance by Generation Location and Type134
The first three tables below provide the data from which the Class I graphs in Figures Two through
Five were generated. Those graphs and these tables include SREC data for the Solar Carve-Out (SCO), which
is within Class I. SREC data beginning in 2012 also includes SRECs that were transferred to the Auction
Account at the GIS, becoming Reminted Auction SRECs, which are available to use for SCO compliance in
the two or three years after their generation year. Note the 2013 arrival of Marine & Hydrokinetic.
Table G
RPS Class I Compliance by Generation Location, 2006-2015
2006 2007 2008 2009 2010 2011 2012 2013 2014 2015
MWh MWh MWh MWh MWh MWh MWh MWh MWh MWh %
CT 13,204 10,180 25,333 21,371 20,146 16,414 16,070 16,452 11,397 5,973 0.1
Maine 367,298 520,821 500,479 526,906 760,476 746,648 864,227 1,114,355 1,039,509 1,170,728 24.4
MASS 184,777 192,200 197,949 197,530 197,748 286,115 483,925 791,088 1,118,406 1,538,702 32.1
NH 53,556 265,062 261,468 307,909 282,308 331,996 531,430 640,808 508,841 495,212 10.3
RI 62,230 42,562 34,848 26,061 1,182 41,952 37,131 23,288 11,059 9,496 0.2
VT 26,595 46,915 49,207 112,670 108,849 149,505 173,191 364,691 407,497 342,023 7.1
NMISA135 455 54,079 66,418 66,071 89,405 22,742 49,144 64,629 67,369 353 0.0
NY 175,961 265,299 517,427 527,751 580,683 688,039 620,904 870,508 880,859 666,330 13.9
PEI 0 16,922 28,111 113,282 144,549 142,688 125,713 142,478 189,578 227,942 4.8
QC 54,696 85,493 215,835 230,367 138,263 213,713 278,794 356,139 397,130 339,366 7.1
Total 938,772 1,599,533 1,896,811 2,129,918 2,323,609 2,639,812 3,180,529 4,384,436 4,631,645 4,796,125 100
Table H
RPS Class I Compliance by Generation Type, 2006-2015136
2006 2007 2008 2009 2010 2011 2012 2013 2014 2015
Type137 MWh MWh MWh MWh MWh MWh MWh MWh MWh MWh %
Anaerobic
Digester Gas 27,115 27,511 26,328 28,204 24,292 25,115 27,373 29,662 38,782 43,837 0.9
Other
Biomass 395,856 782,315 743,882 571,757 584,505 392,629 394,754 357,575 375,109 320,801 6.7
Hydroelectric N/A N/A N/A 47,490 80,823 105,484 105,326 113,936 129,790 129,810 2.7
Landfill Gas 449,633 486,558 660,937 690,851 736,298 848,229 891,798 954,656 820,001 587,790 12.3
Marine &
Hydrokinetic N/A N/A N/A 0 0 0 0 28 45 47 0.0
Solar PV 216 803 1,799 2,420 4,116 36,688 138,159 323,164 681,502 1,194,925 24.9
Wind 65,952 302,346 463,865 789,196 893,575 1,231,667 1,623,119 2,605,415 2,586,416 2,518,915 52.5
Totals 938,772 1,599,533 1,896,811 2,129,918 2,323,609 2,639,812 3,180,529 4,384,436 4,631,645 4,796,125 100
134 Note that regularly updated tables listing all RPS and APS qualified Generation Units, including their locations and types, are available for viewing and downloading via DOER’s RPS/APS Qualified Generation Units webpage. 135 NMISA is the Northern Maine Independent System Administrator, regarding which see footnote 42. 136 The 2013 and 2014 figures for Anaerobic Digester Gas and Marine & Hydrokinetic have been corrected since the 2014 Report. 137 Note that the Massachusetts RPS statute and regulations include “biogas” (including anaerobic digestion gas) within the list of
Eligible Biomass Fuels. However, DOER tracks anaerobic digester generation separately. Landfill gas, which is included within
“biomass” in some state RPS programs, is listed separately from Biomass in the Massachusetts RPS statute and regulations. Note that,
as of 2012, the Solar PV figures include SRECs that were transferred to the Auction and became Reminted Auction SRECs. The latter were not included in this table of the original 2012 Report, but the 2012 data are updated here and in a corrected 2012 Report.
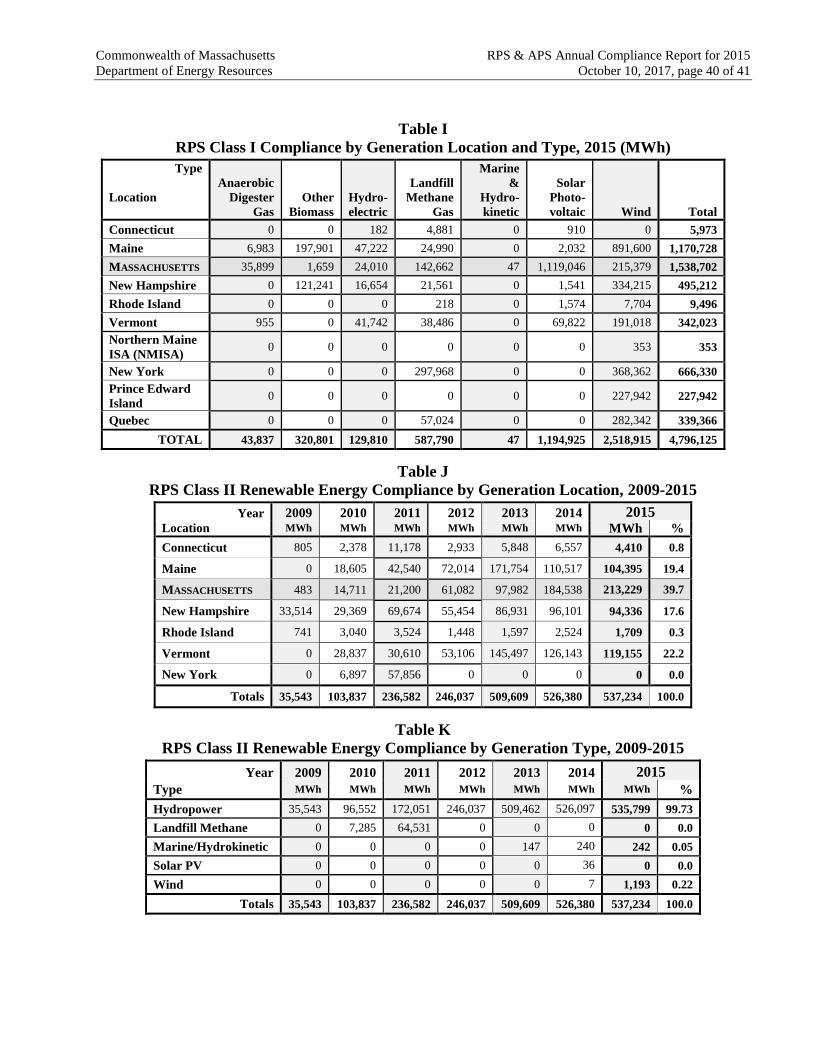
Commonwealth of Massachusetts RPS & APS Annual Compliance Report for 2015
Department of Energy Resources October 10, 2017, page 40 of 41
Table I
RPS Class I Compliance by Generation Location and Type, 2015 (MWh)
Type
Location
Anaerobic
Digester
Gas
Other
Biomass
Hydro-
electric
Landfill
Methane
Gas
Marine
&
Hydro-
kinetic
Solar
Photo-
voltaic Wind Total
Connecticut 0 0 182 4,881 0 910 0 5,973
Maine 6,983 197,901 47,222 24,990 0 2,032 891,600 1,170,728
MASSACHUSETTS 35,899 1,659 24,010 142,662 47 1,119,046 215,379 1,538,702
New Hampshire 0 121,241 16,654 21,561 0 1,541 334,215 495,212
Rhode Island 0 0 0 218 0 1,574 7,704 9,496
Vermont 955 0 41,742 38,486 0 69,822 191,018 342,023
Northern Maine
ISA (NMISA) 0 0 0 0 0 0 353 353
New York 0 0 0 297,968 0 0 368,362 666,330
Prince Edward
Island 0 0 0 0 0 0 227,942 227,942
Quebec 0 0 0 57,024 0 0 282,342 339,366
TOTAL 43,837 320,801 129,810 587,790 47 1,194,925 2,518,915 4,796,125
Table J
RPS Class II Renewable Energy Compliance by Generation Location, 2009-2015
Year 2009 2010 2011 2012 2013 2014 2015 Location MWh MWh MWh MWh MWh MWh MWh %
Connecticut 805 2,378 11,178 2,933 5,848 6,557 4,410 0.8
Maine 0 18,605 42,540 72,014 171,754 110,517 104,395 19.4
MASSACHUSETTS 483 14,711 21,200 61,082 97,982 184,538 213,229 39.7
New Hampshire 33,514 29,369 69,674 55,454 86,931 96,101 94,336 17.6
Rhode Island 741 3,040 3,524 1,448 1,597 2,524 1,709 0.3
Vermont 0 28,837 30,610 53,106 145,497 126,143 119,155 22.2
New York 0 6,897 57,856 0 0 0 0 0.0
Totals 35,543 103,837 236,582 246,037 509,609 526,380 537,234 100.0
Table K
RPS Class II Renewable Energy Compliance by Generation Type, 2009-2015
Year 2009 2010 2011 2012 2013 2014 2015
Type MWh MWh MWh MWh MWh MWh MWh %
Hydropower 35,543 96,552 172,051 246,037 509,462 526,097 535,799 99.73
Landfill Methane 0 7,285 64,531 0 0 0 0 0.0
Marine/Hydrokinetic 0 0 0 0 147 240 242 0.05
Solar PV 0 0 0 0 0 36 0 0.0
Wind 0 0 0 0 0 7 1,193 0.22
Totals 35,543 103,837 236,582 246,037 509,609 526,380 537,234 100.0

Commonwealth of Massachusetts RPS & APS Annual Compliance Report for 2015
Department of Energy Resources October 10, 2017, page 41 of 41
No table is provided for RPS Class II Waste Energy because all of the seven qualified units
are of the same type, and all are located in Massachusetts.
Table L
APS Compliance by Generation Type, 2009-2015
(all located in Massachusetts)
Year 2009 2010 2011 2012 2013 2014 2015
Type138
MWh MWh MWh MWh MWh MWh MWh %
CHP – Biomass 0 0 0 0 2,689 2,797 3,138 0.35
CHP – Natural Gas 128,922 225,104 324,619 347,993 529,462 826,966 890,835 99.58
CHP – Waste to Energy 0 0 0 0 0 855 531 0.06
Flywheel Storage 1,003 2,030 303 3,186 489 377 98 0.01
Totals 129,925 227,134 324,922 351,179 532,640 830,995 894,602 100.0
Table M
Voluntary Renewable Energy Certificates Retired for RGGI
by Generation Location & Type, 2015 (MWh)139
Type
Location
Anaerobic
Digester
Gas
Other
Biomass
Hydro-
electric
Landfill
Methane
Gas
Marine
& Hydro-
kinetic
Solar
Photo-
voltaic Wind Total
Connecticut 0 0 0 0 0 0 0 0
Maine 0 0 0 0 0 0 15,086 15,086
MASSACHUSETTS 1,937 0 1,000 0 0 2,323 16,423 21,683
New Hampshire 0 0 0 0 0 0 0 0
Rhode Island 0 0 0 0 0 0 0 0
Vermont 0 0 0 0 0 0 0 0
No. Maine ISA
(NMISA) 0 0 0 0 0 0 0 0
New York 0 0 0 0 0 0 4,888 4,888
Prince Edward
Island 0 0 0 0 0 0 0 0
Quebec 0 0 0 0 0 0 0 0
TOTAL 1,937 0 1,000 0 0 2,323 36,397 41,657
138 CHP = Combined Heat and Power. 139 These RPS Class I RECs were documented in the Filings and/or NEPOOL GIS reports and are qualified to be retired by the MassDEP for the Regional Greenhouse Gas Initiative. For additional details, see footnote 32.