mass transfer efficiency of a vacuum airlift - …archimer.ifremer.fr/doc/00072/18324/16001.pdf ·...
TRANSCRIPT

1
Aquacultural Engineering Volume 46, January 2012, Pages 18–26 http://dx.doi.org/10.1016/j.aquaeng.2011.10.004 © 2011 Elsevier B.V. All rights reserved
Archimer http://archimer.ifremer.fr
Mass transfer efficiency of a vacuum airlift - Application to water recycling in aquaculture systems
Bertrand Barruta, Jean-Paul Blanchetonb,*, Jean-Yves Champagnec, Alain Grasmickd
a ARDA, Station Marine du Port, Port Ouest, Hangar 10, 97420 Le Port, Reunion Island (France) b IFREMER, Station d’Aquaculture Expérimentale, Laboratoire de Recherche Piscicole de
Méditerranée. Chemin de Maguelone, 34250 Palavas-les-Flots, France c LMFA, UMR CNRS 5509, Université de Lyon, Ecole Centrale de Lyon, Université Lyon 1, INSA
de Lyon, ECL, 20, avenue Albert Einstein - 69621, Villeurbanne Cedex, France d Institut Européen des Membranes (UMR–CNRS 5635), Université Montpellier II, CC005, Place
Eugène Bataillon, 34095 Montpellier Cedex 05, France
* Corresponding author. Tel.: +33 4 67 13 04 12; fax: +33 4 67 13 04 58. E-mail address: [email protected] (J.-P. Blancheton).
Abstract:
In aquaculture, oxygen transfer and carbon dioxide stripping are the first limiting factors to fish rearing intensification. In this study we measured the O2 and CO2 mass transfer coefficient (KLa) for a vacuum airlift in fresh (<1 ‰ salinity) and sea water (35 ‰ salinity) Recirculating Aquaculture Systems (RAS). The airlift was composed of two concentric tubes: an inner riser tube and an external downcomer tube and can be adjusted at three different heights: 2, 4 or 6 m. Several types of air injectors were tested, delivering different sizes of bubble swarms depending on their porosity and functioning conditions (low or high injection pressure), with air flows varying from 0 to 80 L min-1. Experiments were also carried out at different water circulation velocities and with cold (7°C) and warm water (22°C). The best transfer coefficient (KLa) value was obtained at a high air flow rate, a high temperature and with reduced bubble size. Results showed that KLa was not affected by water salinity, but it was slightly affected by water flow (Qw), airlift inner pipe length and vacuum. The presence of vacuum reduces gas solubility in water and facilitates CO2 stripping. The comparison between O2 and CO2 transfers showed that higher KLa values were obtained for O2 than for CO2 in fresh and sea water, probably due to chemical reactions between the CO2 and water. For RAS, the vacuum airlift provides a Standard Aeration Efficiency (SAE) of 1.13 KgO2 KW h-1 and a Standard Stripping Efficiency (SSE) of 1.8 KgO2 KW h-1 or 0.023 KgCO2 KW h-1. In rearing water, CO2 and O2 transfers were negatively affected when feed was added. An empirical model for CO2 mass transfer coefficient prediction was developed and calibrated. Simulation shows a good correlation between predicted and measured values (R²=0.87).
Keywords: Mass transfer ; Airlift ; Vacuum ; Aquaculture ; RAS ; Aeration ; Degasification ; Salinity

2
1. Introduction In aquaculture, gas exchange is essential to keep the fish alive. It is important to maintain oxygen
concentrations above a safe level and to strip the carbon dioxide produced by the respiration of fish and heterotrophic bacteria. Several pathologies are caused by excessive CO2 concentrations in the rearing tank. Toxic CO2 concentrations differ among fish species. For Tilapia, concentrations of CO2 as high as 60 mg L-1 have shown no adverse effect (Timmons and Ebeling, 2010). For Atlantic salmon, values up to 26 mg L-1 of CO2 have no significant effect on growth or health (Fivelstad et al., 1998) while spotted wolffish are unaffected by values as high as 33.5 mg L-1 (Foss et al., 2003). However, CO2 concentrations over than 55 mg L-1 have a significant effect on European seabass mortality (Grøttum and Sigholt, 1996). An excess of CO2 is the second limiting factor for aquaculture finfish growth (Grøttum and Sigholt, 1996; Fivelstad, 1998; Cecchini et al., 2001; Blancheton et al., 2007; Moran, 2010a).
Most recirculating aquaculture systems (RAS) are therefore equipped with (1) a system for oxygen transfer in order to maintain a sufficient oxygen concentration in the water and (2) a specific exchange column to strip the excess CO2 and N2. These conventional exchangers are being replaced by airlifts or air bubbling in recent aquaculture systems (Mozes et al., 2004; Blancheton et al., 2007; Mamane et al., 2010). Airlifts are widely used for mass transfer in chemical and biochemical processes because they are easy and economical to set up and use (Chaumat et al., 2007b; Yu et al., 2008). They are also less energy-consuming than cascade columns, which require energy to lift water to the top of the column (Watten and Boyd, 1990; Colt and Orwicz, 1991; Grace and Piedrahita, 1994). Moreover, airlifts can combine different functions such as water transport, aeration, CO2 stripping and foam fractionation in the same treatment device, which may decrease the occurrence of breakdown, facilitate technical supervision and reduce the space used (Roque d’orbcastel et al., 2009). The exchange system has to maximize air/water specific surface area and to reduce mass transfer resistance. When physical transfer is insufficient for CO2 stripping, a base can be added to the water to decrease the free CO2 concentration. The addition of a base (NaOH, or bicarbonates) is frequently used to maintain a stable pH and decrease dissolved CO2 concentrations in water (Bisogni and Timmons, 1994; Grace and Piedrahita, 1994; Summerfelt, 1996; Piedrahita, 1997; Piedrahita, 1998; Loyless and Malone, 1998). However, the use of chemicals is increasingly discouraged because of quality standards (Summerfelt et al., 2000).
Most studies on airlifts focus on diffuser porosity, gas holdup, lift height, water flow rates (or liquid circulation velocity), air flow rates (or superficial gas velocity) and temperature (Loyless and Malone, 1998; Kang et al., 1999; Letzel et al., 1999; Vandu and Krishna, 2004; Chaumat et al., 2007b; Moran, 2010b; Singh and Majumder, 2011). All these parameters directly affect airlift mass transfer performance. Few studies have been carried out on combined variations of the parameters, probably because of the large number of experiments required and the difficulties involved in carrying them out. Loyless and Malone (1998) investigated the use of airlifts to solve aeration and CO2 stripping problems in RAS. However, all the results were obtained in fresh water and there is very little information available in research literature on airlift efficiency for CO2 stripping and aeration in sea water. Recently, Moran (2010b), completed the work of Loyless and Malone by comparing results obtained in fresh (0‰ salinity) and saline water (35‰ salinity). In their study, salinity was not found to have a significant effect on the CO2 mass transfer characteristics of the airlift. The aim of this study was to quantify the gas exchange capacity of a vacuum airlift (in fresh water, sea water and fish-rearing sea water) and to compare its performances with other mass transfer systems currently used in RAS.
The vacuum airlift technology consists in (1) a vertical tube at the top of which a controlled vacuum is created by a vacuum pump to keep the water level stable, and at the bottom of which gas is injected similarly to a standard airlift, and (2) a downcomer tube to drive the water back to the pumping tank. The addition of a vacuum should have a positive effect on gas stripping (Henry’s law). The vacuum reduces air injection energy requirements while maintaining a significant length of the pipe above water level, thereby increasing the submergence ratio without the need for deep zones in the pumping area (Fig. 1). In addition, the risk of gas oversaturation is avoided by low air injection depths (Loyless and Malone, 1998) and the gas injected or removed from the fluid can be collected for storage before treatment in the case of off-gas.
3
2. Materials and methods 2.1. Experimental setup and parameters tested
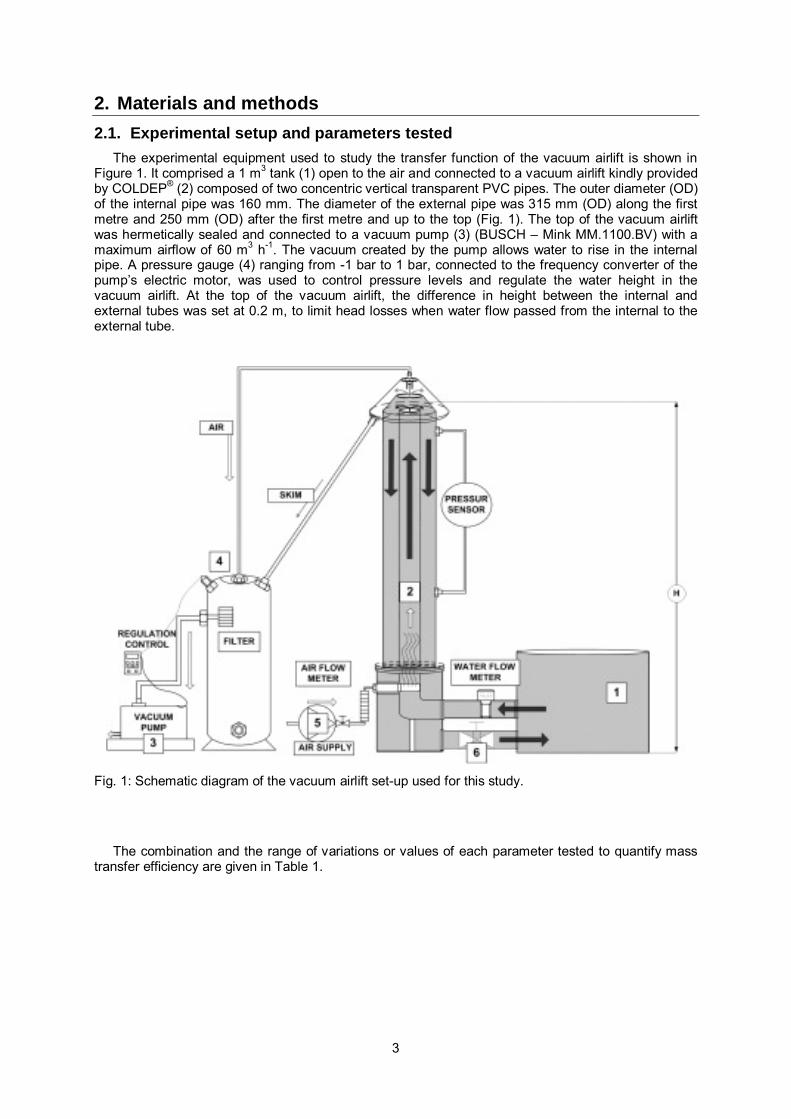
The experimental equipment used to study the transfer function of the vacuum airlift is shown in Figure 1. It comprised a 1 m3 tank (1) open to the air and connected to a vacuum airlift kindly provided by COLDEP® (2) composed of two concentric vertical transparent PVC pipes. The outer diameter (OD) of the internal pipe was 160 mm. The diameter of the external pipe was 315 mm (OD) along the first metre and 250 mm (OD) after the first metre and up to the top (Fig. 1). The top of the vacuum airlift was hermetically sealed and connected to a vacuum pump (3) (BUSCH – Mink MM.1100.BV) with a maximum airflow of 60 m3 h-1. The vacuum created by the pump allows water to rise in the internal pipe. A pressure gauge (4) ranging from -1 bar to 1 bar, connected to the frequency converter of the pump’s electric motor, was used to control pressure levels and regulate the water height in the vacuum airlift. At the top of the vacuum airlift, the difference in height between the internal and external tubes was set at 0.2 m, to limit head losses when water flow passed from the internal to the external tube.
Fig. 1: Schematic diagram of the vacuum airlift set-up used for this study.
The combination and the range of variations or values of each parameter tested to quantify mass
transfer efficiency are given in Table 1.

4
Table 1 : Combination of all parameters tested to quantify the mass transfer efficiency of the vacuum airlift.
Air was injected near the bottom of the inner tube using an electric compressor (5) (BECKER DT4.40K), which delivers a maximum of 40 m3 h-1 at a pressure of 1 bar. Different types of injectors were used for air injection: an open tube diffuser which creates a swarm of large bubbles (>3 mm), an injector working at a pressure of 0.5 bar which creates fine bubbles (1 mm) and an injector working at a pressure of 1 bar which creates tiny bubbles (<1 mm). Injected air pressure was controlled by a pressure gauge and airflow was measured using a rotameter (Key Instrument MR 3000 Series Flowmeter ±5 L min-1).
The effect of water flow on mass transfer efficiency was tested for three different flow rates: respectively 5, 10 and 15 m3 h-1. As water flow is dependent on air flow rates, a valve was placed at the outlet of the vacuum airlift to control the water flow (6). Water flow rate was measured using an electromagnetic flowmeter (Bürkert, France) (±0.01 m3 h-1) positioned at the inlet of the vacuum airlift.
2.2. Method for mass transfer coefficient assessment The determination of the mass transfer coefficient KLa depends on the hydrodynamics and
configuration of the system. In batch reactors, the value of KLa can be deduced from an instantaneous mass balance of solute as follows:
( )LSLL CCaK
dtdC
−= * (1)
where CL = dissolved CO2 (or O2) molar or mass concentration in the liquid phase at time t (mg L-1),
CS = saturated dissolved CO2 (or O2) molar or mass concentration in the liquid (mg L-1), KLa* = mass transfer coefficient of the system i.e. the rearing tank plus the vacuum airlift (s-1). The “a*” value directly depends on the specific area of bubbles, ag, and on gas holdup, εg*, in the total volume: a* = ag.εg*.
Integration of Eq. (1) allows the calculation of the global mass transfer coefficient KLa* relative to the total volume of liquid in the system:
taKCCCC
LLS
S *ln 0 =
−−
(2)
where Co= dissolved CO2 (or O2) concentration in the liquid phase at the beginning of the
experiment (mg L-1). The slope of the regression line obtained from the relationship between the logarithmic function and time corresponds to the coefficient value KLa*.
The actual mass transfer coefficient KLa of the vacuum airlift relative to its volume may be assessed by a first approximation using the following relation:

5
( ) *aKVVaK LiTL = (3)
where VT and Vi respectively represent the total volume of liquid in the system (i.e 1100 L) and the
volume of liquid inside the inner tube of the vacuum airlift (i.e 100 L) where effective contact occurs between the air and liquid phases as measurements showed that the gas exchange between the liquid surface in the tank and the air was insignificant during the duration of the experiments.
KLa can be converted to a standard reference temperature of 20°C ((KLa)20) using the Arrhenius temperature relation:
( ) 2020
−= TLL aKaK θ (4)
where θ is the temperature correction factor (= 1.024) and T is the water temperature during the
experiment (°C).
The Standard Oxygen Transfer Rate (SOTR) for absorption or desorption and the Standard Carbon dioxide Transfer Rate (SCTR) in Kg m-3 s-1 are obtained using the following relations:
sLaCKSOTR = (5)
sLaCKSCTR = (6)
where KLa = mass transfer coefficient of the vacuum airlift in standard condition (s-1) and Cs =
water saturation concentration (10-3 mg L-1). The saturated dissolved concentrations of O2 were obtained from Benson and Krause (1984). The saturated dissolved concentrations of CO2 have increased significantly (by around 30 % over the past thirty years) but using the Physical and Engineering Data (1978) values do not significantly alter the KLa values for CO2 mass transfer. The saturated dissolved concentrations of O2 and CO2 are provided in Table 2.
Table 2 : Concentration of dissolved O2 and CO2 in fresh and sea water in equilibrium with the atmosphere for different temperatures used in this study.
The Standard Aeration Efficiency (SAE) for O2 and the Standard Stripping Efficiency (SSE) for O2 and CO2 in Kg KWh-1 may then be determined using the following relations:
( )SPSOTRSAE 6610.3= (7) ( )SPSCTRorSOTRSSE 6610.3= (8)

6
where PS = specific power required (W m-3), defined as the pressure loss ΔP (Pa) needed to inject the air flow rate Qg (m3 s-1) in the inner volume Vi (m3) of the vacuum airlift:
( ) igS VQPP ∆= (9)
2.3. CO2 stripping measurement The concentration of dissolved CO2 in water can be measured using an OxyGuard CO2 Analyzer (±
1 mg L-1). The probe of the gas analyzer measures the partial pressure of CO2 (pCO2) in the water via infrared absorption. However, as the probe takes a few minutes to reach 95 % of the pCO2 value, it was decided to measure dissolved CO2 by following changes in pH. A standard curve of CO2 concentration at equilibrium versus pH was established in the laboratory for the different types of water used in this study (Fig. 2). The curves were used to determine the equilibrate CO2 values correlated to pH levels during the decreased kinetic of CO2. The rise in pH levels in the tank was measured using a pH-meter (Eutech instruments Ecoscan pH 5 ± 0.01). The measurements obtained with the pH-meter at the beginning and at the end of each experiment were checked with the CO2 probe until the value reached its equilibrium.
Fig. 2 : Relationship between CO2 concentration in water and pH for different types of water and different temperatures. Alkalinities for fresh and sea water are 1.95 and 2.36 mmol L-1 respectively.
For all the experiments, the experimental tank water was enriched in CO2 up to a concentration of 50 mg L-1. The pH levels were measured in the tank every two minutes for one hour. A submersible pump was placed in the tank to circulate the water to maintain a homogenous concentration of CO2. To assess the effect of water temperature and salinity on mass transfer, the experiments were carried out in cold (7°C) fresh and sea water and in warm sea water (22°C) (Table 1). Seawater was derived from the sea and filtered (40 µm filtration) and subjected to UV sterilization before use. Bubble size
7
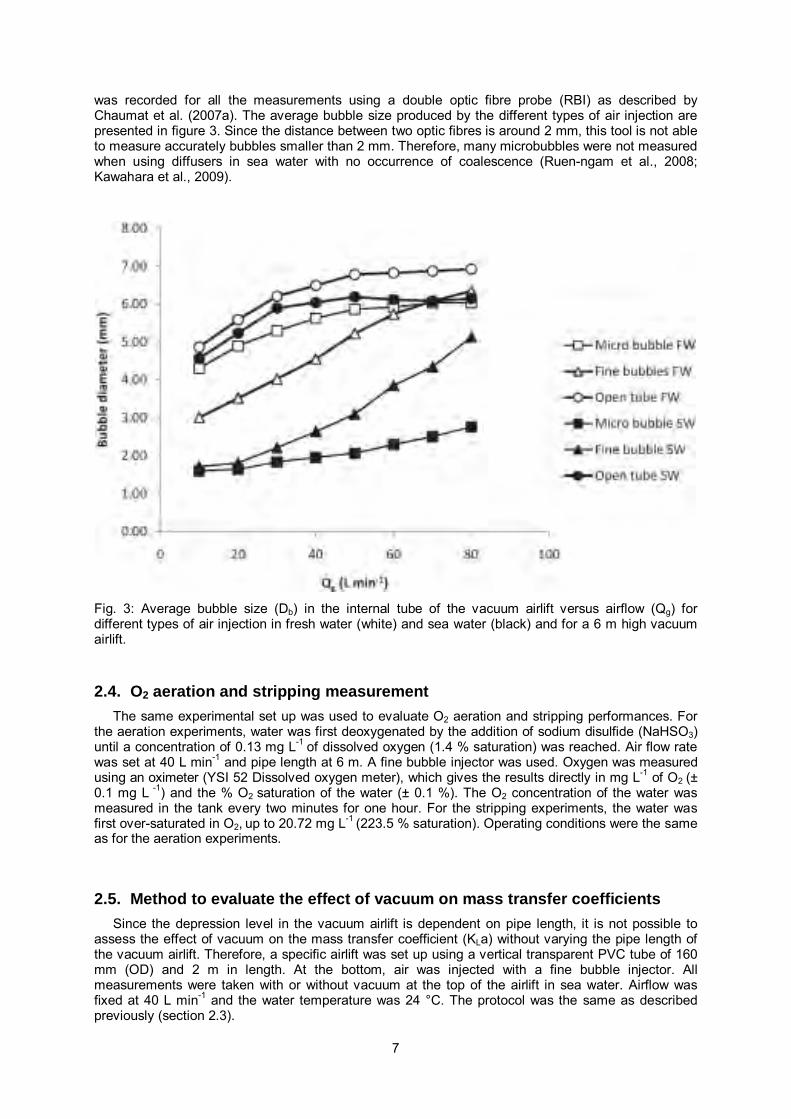
was recorded for all the measurements using a double optic fibre probe (RBI) as described by Chaumat et al. (2007a). The average bubble size produced by the different types of air injection are presented in figure 3. Since the distance between two optic fibres is around 2 mm, this tool is not able to measure accurately bubbles smaller than 2 mm. Therefore, many microbubbles were not measured when using diffusers in sea water with no occurrence of coalescence (Ruen-ngam et al., 2008; Kawahara et al., 2009).
Fig. 3: Average bubble size (Db) in the internal tube of the vacuum airlift versus airflow (Qg) for different types of air injection in fresh water (white) and sea water (black) and for a 6 m high vacuum airlift.
2.4. O2 aeration and stripping measurement The same experimental set up was used to evaluate O2 aeration and stripping performances. For
the aeration experiments, water was first deoxygenated by the addition of sodium disulfide (NaHSO3) until a concentration of 0.13 mg L-1 of dissolved oxygen (1.4 % saturation) was reached. Air flow rate was set at 40 L min-1 and pipe length at 6 m. A fine bubble injector was used. Oxygen was measured using an oximeter (YSI 52 Dissolved oxygen meter), which gives the results directly in mg L-1 of O2 (± 0.1 mg L -1) and the % O2 saturation of the water (± 0.1 %). The O2 concentration of the water was measured in the tank every two minutes for one hour. For the stripping experiments, the water was first over-saturated in O2, up to 20.72 mg L-1 (223.5 % saturation). Operating conditions were the same as for the aeration experiments.
2.5. Method to evaluate the effect of vacuum on mass transfer coefficients Since the depression level in the vacuum airlift is dependent on pipe length, it is not possible to
assess the effect of vacuum on the mass transfer coefficient (KLa) without varying the pipe length of the vacuum airlift. Therefore, a specific airlift was set up using a vertical transparent PVC tube of 160 mm (OD) and 2 m in length. At the bottom, air was injected with a fine bubble injector. All measurements were taken with or without vacuum at the top of the airlift in sea water. Airflow was fixed at 40 L min-1 and the water temperature was 24 °C. The protocol was the same as described previously (section 2.3).

8
2.6. Method to evaluate the mass transfer coefficients in rearing conditions To study the mass transfer modification in fish rearing conditions, the vacuum airlift was connected
to a 15 m3 rearing tank operated with an hourly water renewal rate of 100 %. The vacuum airlift and all the analysis devices were the same as described previously (sections 2.1 and 2.3). The livestock consisted of 200 Kg of red drums (Sciaenops ocellata) with an average weight of 15 g. Feed consisted of fish pellets with a diameter of 2 mm (LE GOUESSANT - OMBRINE GROWER EXT-coul 2, 47 % protein and 13 % lipids) and the daily feeding rate was 5% of total biomass. Dissolved CO2, pH and O2 concentrations were measured every 10 to 30 minutes at the inlet and outlet of the vacuum airlift, when testing the influence of feeding on the airlift mass transfer performance. The CO2 concentration is not at equilibrium at the outlet of the vacuum airlift. It takes less than 10 minutes before the equilibrium is reached at these temperature (27°) and water velocity (around 0.3 m s-1) as described by Moran et al. (2010), but this difference was taken in account as the time between two measurements was more than sufficient for the CO2 concentration to reach its equilibrium and the variation was below the precision of the CO2 probes. KLa was calculated using the following equation resulting from an instantaneous mass balance on the inner airlift tube:
i
effS
inS
L HRTCCCC
aK
−−
=
ln (10)
where Cin = dissolved CO2 (or O2) concentration in the liquid at the inlet of the vacuum airlift (mg L-
1), Ceff = dissolved CO2 (or O2) concentration in the liquid at the outlet of the vacuum airlift (mg L-1) and HRTi = Hydraulic Residence Time in the inner tube of the vacuum airlift (Vi/Qw).
3. Results and discussion 3.1. CO2 desorption kinetics in the vacuum airlift 3.1.1. 3.1.1 Effect of air bubble size and air flow rates
For all types of air injectors, increases in air flow rates from 20 to 40 L min-1 or from 40 to 60 L min-1 resulted in CO2 stripping velocity increases of about 19 % (namely a decrease in CO2 concentration between 4.5 and 7.8 mg L-1) after 30 minutes (Fig. 4). For all air flow rates, use of fine bubble and micro bubble diffusers instead of open tube injectors increased CO2 stripping velocity by about 11 % (namely a decrease in CO2 concentration between 3 and 4.2 mg L-1) and 21 % (namely a decrease in CO2 concentration between 4.9 and 8.5 mg L-1), respectively after 30 minutes (Fig. 4). Diffusers produce smaller bubbles and therefore more efficient CO2 stripping compared to the larger bubbles generated with open tube injectors. Figure 5 shows the log deficit ratio obtained from the decrease in CO2 concentration (Fig. 4) and using Eq. (1). The linearity of the curves makes it possible to estimate the value of KLa for the different parameters tested using Eq. (2).

9
Fig. 4 : CO2 concentration in water versus time for different flow rates (20, 40 and 60 L min-1) and for different type of injectors (open tube, fine bubble, micro bubble) in sea water with a 6 m high vacuum airlift.
Fig. 5: Log deficit ratio versus time for different flow rates (20, 40 and 60 L min-1) and for different types of injectors (open tube, fine bubble, micro bubble) in sea water with a 6 m high vacuum airlift. The regression equations for the log deficit ratio are as follows: Micro bubble 60 L.min-1, y = 8.31E-4x + 0.005, R² = 0.99; Micro bubble 40 L min-1, y = 6E-4x - 0.07, R² = 0.99; Micro bubble 20 L min-1, y = 3.1E-4x + 0.038, R² = 0.99; Fine bubble 60 L min-1, y = 6.7E-4x - 0.047, R² = 0.99; Fine bubble 40 L min-1, y = 5.1E-4x + 0.008, R² = 0.99; Fine bubble 20 L min-1, y = 3.1E-4x - 0.005, R² = 0.99; Open tube 60 L min-1, y = 4.8E-4x - 0.007, R² = 0.99; Open tube 40 L min-1, y = 3.7E-4x - 0.021, R² = 0.99; Open tube 20 L min-1, y = 1.8E-4x + 0.058, R² = 0.99.

10
There was a linear increase in the calculated values of KLa with air flow rates (Fig. 6). At 0 L min-1
of air injected, the KLa was 0.000024 s-1 irrespective of the type of injector. An increase from 20 to 40 L min-1 of injected air increased KLa values ranging between 0.0015 and 0.004 s-1 to between 0.004 and 0.007 s-1, depending on the type of injector used. An increase from 40 to 60 L min-1 of injected air produced KLa values ranging between 0.005 and 0.01 s-1 (Fig. 6). Irrespective of air flow rate, KLa, values were higher when diffusers were used. Small air bubbling increases the specific surface area of the bubbles and the gas holdup inside the system. These results are consistent with those of many other studies (Letzel et al., 1999; Vandu and Krishna, 2004; Chaumat et al., 2005a; Chaumat et al., 2007b; Contreras, 2007). However, bubbles with diameters of less than 1 mm are dragged into the downcomer tube (their upward velocity is low). Consequently, the smallest bubbles flow back to the pumping tank, which may be detrimental to the fish and result in a decrease in bubble gas, as described by Hussenot (1987).
Fig. 6 : CO2 mass transfer coefficient (KLa) versus air flow (20, 40 and 60 L min-1) for different types of injectors (open tube, fine bubble, micro bubble) in sea water (35 ‰) at 7°C with a 6 m high vacuum airlift. The regression equations are as follows: Micro bubble, y = 1.46E-4x + 3.87E-4, R² = 0.96; Fine bubble, y = 1.11E-4x + 7.93E-4, R² = 0.94; Open tube, y = 8.8E-5x + 2.35E-4, R² = 0.95.
An empirical model for predicting the mass transfer coefficient of a 6 m high vacuum airlift with airflow injection rates of 20 to 60 L min-1 was developed by integration of all the results obtained from the experiments on mass transfer in fresh and sea water for different bubble sizes and airflow rates. The empirical equation of the model is as follows:
( ) gbL QDaK 629.0 −= (11)
where KLa = mass transfer coefficient (s-1); Db = average bubble diameter (m) and Qg = air flow rate
(m3 s-1). The predicted values were compared with the experimental data in figure 7.

11
Fig. 7: Empirical model versus experimental data for the mass transfer coefficient in the vacuum airlift of different average bubble sizes and different air flows. The regression equation is as follows: y = 0.99x – 2.25E-4, R² = 0.87.
3.1.2. Effect of water flow When operating, the air flow rate was fixed and water flow was varied using a specific valve. As
widely described with multiphasic reactors, water flow rate has a minor effect on KLa compared to the effect of air flow rates. However, it was noticed that the mass transfer coefficient increased slightly with water flow, especially when air was injected at 60 L min-1 (Fig. 8). This can be correlated with the accumulation of air bubbles in the downcomer tube of the vacuum airlift with high water flow, which increases gas holdup and gas/liquid specific surface area.
Fig. 8 : Relationship between the mass transfer coefficient KLa and water flow (Qw) for different air flows (20, 40 and 60 L min-1) in sea water with fine bubble air injection and a 6 m high vacuum vacuum airlift. The regression equations are as follows: 20 L min-1, y = 8.3E-5x – 3E-3, R² = 0.22; 40 L min-1, y = 1.2E-4x – 5.2E-3, R² = 0.2; 60 L min-1, y = 3.7E-4x – 4.8E-3, R² = 0.73.

12
3.1.3. Effect of vacuum The effect of vacuum was studied with two types of experiments. The first involved variations in
vacuum airlift height (Table 3) and the second, variations in the depression value at the top of a defined 2 m high static airlift.
In the first experiment, three different vacuum airlift heights were tested, i.e. 2, 4 and 6 m. Results show that height had no effect on mass transfer coefficients (Table 3, Fig. 9): average KLa values were relatively similar and ranged from 0.0072 to 0.0075 s-1. These results were surprising because theoretically, stripping should increase when operating pressure decreases. Moreover, when vacuum and airlift height were increased, the injection depth and water flow also increased (Barrut et al., submitted). An increase in injection depth should result in an increase in mass transfer efficiency (Jensen et al., 1989) and an increase in water circulation velocity generally leads to a slight increase of the transfer coefficient by more bubbles being carried into the downcomer and by an increase in bubble residence time (Fig. 8).
Table 3 : KLa value for different pipe lengths (2, 4 and 6 m) with an air flow of 40 L min-1 and fine bubble injection in sea water.
Fig. 9 : CO2 concentration in water versus time for different pipe lengths (2, 4 and 6 m) with a fine bubble injection and an air flow of 40 L min-1 in sea water.
13
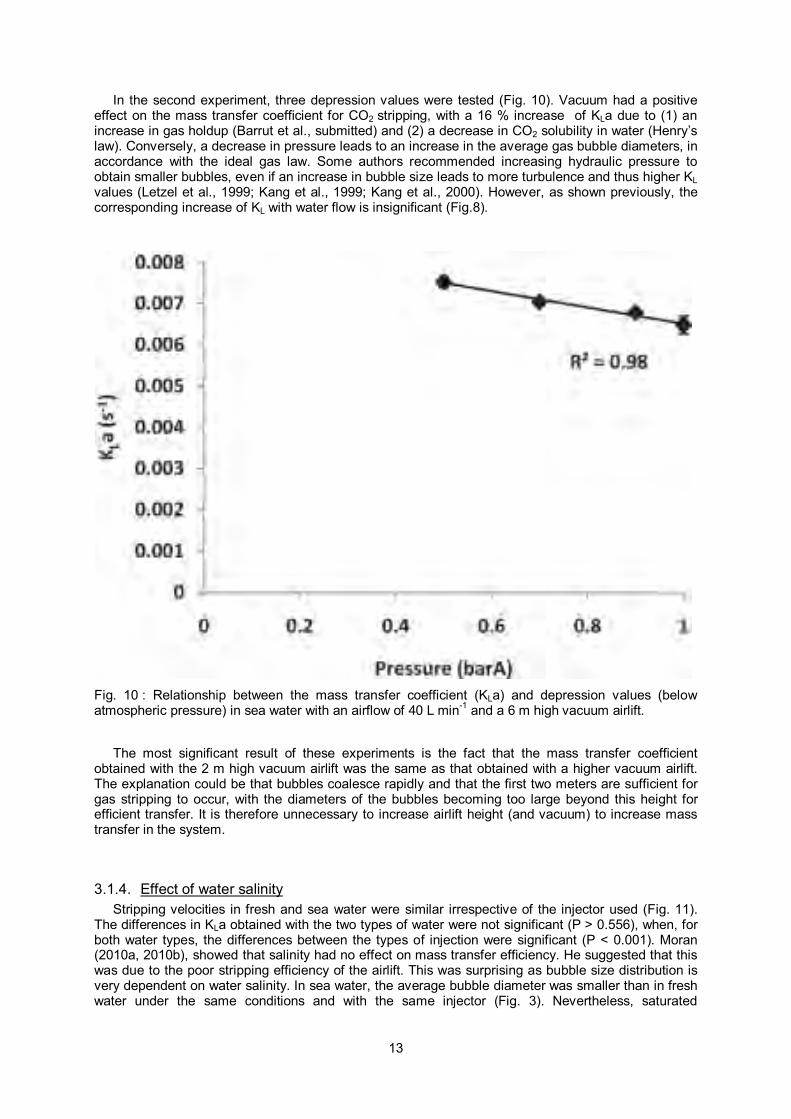
In the second experiment, three depression values were tested (Fig. 10). Vacuum had a positive effect on the mass transfer coefficient for CO2 stripping, with a 16 % increase of KLa due to (1) an increase in gas holdup (Barrut et al., submitted) and (2) a decrease in CO2 solubility in water (Henry’s law). Conversely, a decrease in pressure leads to an increase in the average gas bubble diameters, in accordance with the ideal gas law. Some authors recommended increasing hydraulic pressure to obtain smaller bubbles, even if an increase in bubble size leads to more turbulence and thus higher KL values (Letzel et al., 1999; Kang et al., 1999; Kang et al., 2000). However, as shown previously, the corresponding increase of KL with water flow is insignificant (Fig.8).
Fig. 10 : Relationship between the mass transfer coefficient (KLa) and depression values (below atmospheric pressure) in sea water with an airflow of 40 L min-1 and a 6 m high vacuum airlift.
The most significant result of these experiments is the fact that the mass transfer coefficient obtained with the 2 m high vacuum airlift was the same as that obtained with a higher vacuum airlift. The explanation could be that bubbles coalesce rapidly and that the first two meters are sufficient for gas stripping to occur, with the diameters of the bubbles becoming too large beyond this height for efficient transfer. It is therefore unnecessary to increase airlift height (and vacuum) to increase mass transfer in the system.
3.1.4. Effect of water salinity Stripping velocities in fresh and sea water were similar irrespective of the injector used (Fig. 11).
The differences in KLa obtained with the two types of water were not significant (P > 0.556), when, for both water types, the differences between the types of injection were significant (P < 0.001). Moran (2010a, 2010b), showed that salinity had no effect on mass transfer efficiency. He suggested that this was due to the poor stripping efficiency of the airlift. This was surprising as bubble size distribution is very dependent on water salinity. In sea water, the average bubble diameter was smaller than in fresh water under the same conditions and with the same injector (Fig. 3). Nevertheless, saturated

14
concentrations of solutes in seawater are significantly lower than in fresh water (Table 2) and transfer intensity may be modified, which indirectly modifies the value of KLa. It is also important to take into account the specificity of CO2 that reacts with water as free CO2. These reactions are dependent on temperature and the ionic composition of the water (Moran, 2010a). The differences in the ionic composition of fresh and sea water could explain why we obtained equivalent mass transfer coefficients.
Fig. 11 : KLa value for different types of injectors (open tube, fine bubble and micro bubble) in fresh and sea water with an air flow of 40 L min-1 and a 6 m high vacuum airlift. Letters correspond to the pairwise comparison results.
3.1.5. Effect of water temperature Increases in temperature significantly improved mass transfer kinetics (P < 0.002). Consequently,
stripping velocity was higher in warm water (22°C) than in cold water (7°C). The average KLa value is 0.0075 s-1 at 22°C whereas it is 0.0055 s-1 at 7°C (Fig. 12). When converted to a standard reference temperature of 20°C using Eq. 4, similar (KLa)20 results of about 0.007 s-1 were obtained (P > 0.671), which confirms the single effect of temperature.
Water temperature affects mass transfer efficiency because the Henry constant and the diffusion coefficient increase with temperature. Gas solubility therefore decreases with increasing temperature (at 7°C, the Henry constant is about 94 MPa whereas at 20°C, it is about 142 MPa ).

15
Fig. 12: KLa value for different water temperatures (7°C and 22°C) in sea water with an air flow of 40 L min-1 and a 6 m high vacuum airlift. Letters correspond to the statistical analysis results.
3.2. Oxygen transfer Quantification of oxygen mass transfer was carried out either starting from oxygen-oversaturated
water or starting from oxygen-desaturated water. The system was considered as a batch reactor and the dissolved oxygen concentration was plotted versus time (Fig. 13a).

16
Fig 13a-b : O2 saturation (%) versus time in absorption and desorption experiments in seawater (a) and in fresh and sea water stripping experiments (b) with an airflow of 40 L min-1 and a 6 m high vacuum airlift.
In both cases, an asymptotic value was reached after 30 minutes of operation at 80 % of the saturation concentration (i.e. 7.5 mg L-1 of dissolved oxygen). Under the same working conditions, the average KLa values were 0.0233 s-1 for absorption and 0.0319 s-1 for desorption (Table 4). The
17
stripping kinetics for oxygen transfer are about 20 % higher because of an additional stripping effect due to the partial vacuum (it was 16 % with CO2).
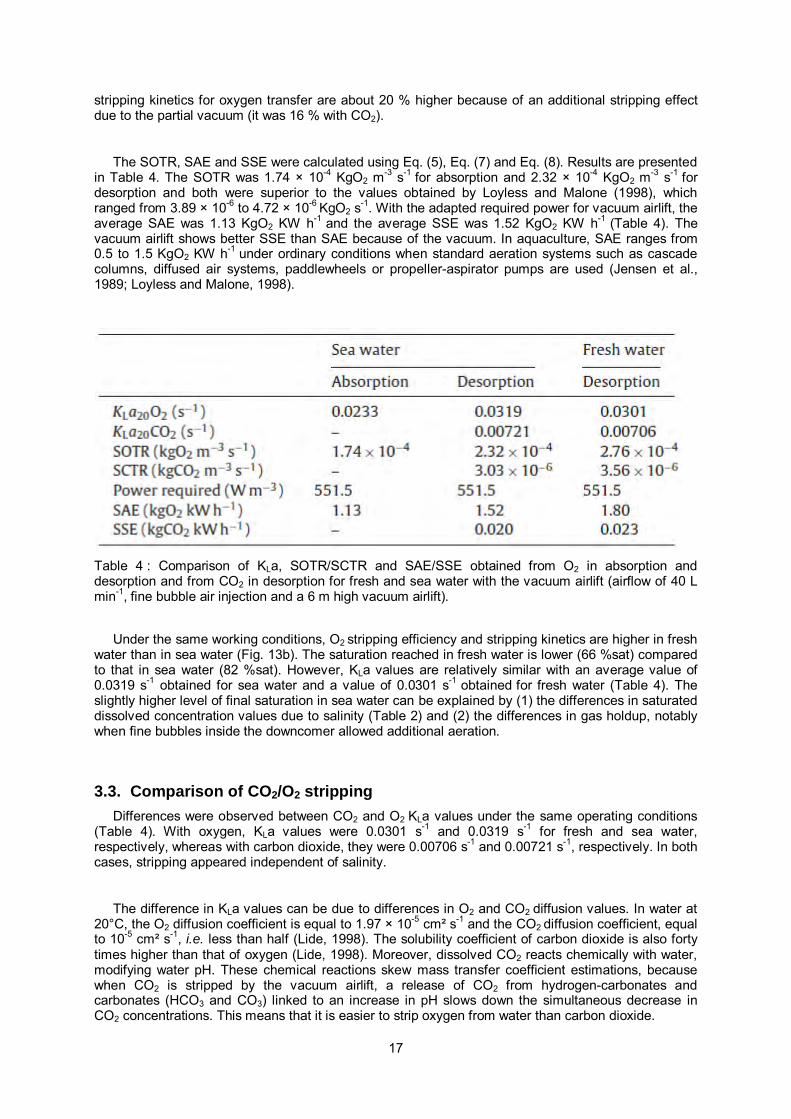
The SOTR, SAE and SSE were calculated using Eq. (5), Eq. (7) and Eq. (8). Results are presented in Table 4. The SOTR was 1.74 × 10⁻⁴ KgO2 m-3 s-1 for absorption and 2.32 × 10⁻⁴ KgO2 m-3 s-1 for desorption and both were superior to the values obtained by Loyless and Malone (1998), which ranged from 3.89 × 10⁻⁶ to 4.72 × 10⁻⁶ KgO2 s-1. With the adapted required power for vacuum airlift, the average SAE was 1.13 KgO2 KW h-1 and the average SSE was 1.52 KgO2 KW h-1 (Table 4). The vacuum airlift shows better SSE than SAE because of the vacuum. In aquaculture, SAE ranges from 0.5 to 1.5 KgO2 KW h-1 under ordinary conditions when standard aeration systems such as cascade columns, diffused air systems, paddlewheels or propeller-aspirator pumps are used (Jensen et al., 1989; Loyless and Malone, 1998).
Table 4 : Comparison of KLa, SOTR/SCTR and SAE/SSE obtained from O2 in absorption and desorption and from CO2 in desorption for fresh and sea water with the vacuum airlift (airflow of 40 L min-1, fine bubble air injection and a 6 m high vacuum airlift).
Under the same working conditions, O2 stripping efficiency and stripping kinetics are higher in fresh water than in sea water (Fig. 13b). The saturation reached in fresh water is lower (66 %sat) compared to that in sea water (82 %sat). However, KLa values are relatively similar with an average value of 0.0319 s-1 obtained for sea water and a value of 0.0301 s-1 obtained for fresh water (Table 4). The slightly higher level of final saturation in sea water can be explained by (1) the differences in saturated dissolved concentration values due to salinity (Table 2) and (2) the differences in gas holdup, notably when fine bubbles inside the downcomer allowed additional aeration.
3.3. Comparison of CO2/O2 stripping Differences were observed between CO2 and O2 KLa values under the same operating conditions
(Table 4). With oxygen, KLa values were 0.0301 s-1 and 0.0319 s-1 for fresh and sea water, respectively, whereas with carbon dioxide, they were 0.00706 s-1 and 0.00721 s-1, respectively. In both cases, stripping appeared independent of salinity.
The difference in KLa values can be due to differences in O2 and CO2 diffusion values. In water at 20°C, the O2 diffusion coefficient is equal to 1.97 × 10⁻⁵ cm² s-1 and the CO2 diffusion coefficient, equal to 10-5 cm² s-1, i.e. less than half (Lide, 1998). The solubility coefficient of carbon dioxide is also forty times higher than that of oxygen (Lide, 1998). Moreover, dissolved CO2 reacts chemically with water, modifying water pH. These chemical reactions skew mass transfer coefficient estimations, because when CO2 is stripped by the vacuum airlift, a release of CO2 from hydrogen-carbonates and carbonates (HCO3 and CO3) linked to an increase in pH slows down the simultaneous decrease in CO2 concentrations. This means that it is easier to strip oxygen from water than carbon dioxide.

18
The SCTRs obtained with the vacuum airlift for CO2 stripping, i.e. 3.56 × 10⁻⁶ KgCO2 m-3 s-1 in fresh water and 3.03 × 10⁻⁶ KgCO2 m-3 s-1 in sea water (Table 4), are higher than those obtained with other airlifts. Loyless and Malone (1998) found SCTRs ranging between 0.1 × 10⁻⁶ and 0.2 × 10⁻⁶ KgCO2 m-3 s-1 and Moran (2010b) found SCTRs ranging between 0.03 × 10⁻⁶ and 0.2 × 10⁻⁶ KgCO2 m-3 s-1, with both results being dependant on lift height and obtained with the same air flow rate as that used in our study. The differences are certainly due to the larger airlift volume of the vacuum airlift, the addition of vacuum and the smaller average bubble sizes obtained with fine bubble injectors.
3.4. Test in rearing conditions In a recirculating aquaculture system, it appears that mass transfer coefficients for O2 and CO2 vary
widely throughout the day, in particular when fish feed is added to the system (Fig. 14a). For O2, KLa values ranged from 0.05 s-1 to 0.02 s-1 according to water quality. For CO2, the values ranged from 0.02 s-1 to 0.01 s-1.
Addition of fish feed changes the quality of the water because of the fat content of the feed. The presence of lipids reduces sea water surface tension and facilitates bubble coalescence (Guyon et al., 2001), thereby decreasing gas holdup. These successive phenomena significantly decrease mass transfer coefficient KLa values. Moreover, bubble coalescence increases water circulation velocity in the vacuum airlift, which leads to lower instantaneous residence time (Barrut et al., submitted). Gas/liquid exchanges are thus reduced and the O2 and CO2 inlet/outlet concentration differential was found to decrease from around 2 to 0.5 mg L-1 (Fig. 14b).
Fig. 14a-b : Mass transfer coefficients (KLaO2 and KLaCO2) (a) and gas differential concentrations (O2 and CO2) and residence time (b) versus day time after feeding in a rearing tank (feeding started at Hour 0 and lasted for 4 hours, the airflow rate was 80 L min-1 with fine bubble air injection in rearing sea water and with a 6 m high vacuum airlift).

19
4. Conclusion Mass transfer with vacuum airlifts is not sensitive to salinity but increases significantly with airflow,
temperature and average bubble size reduction. Vacuum, pipe length and water flow have little effect on mass transfer efficiency. The effects of bubble size and air flow on the mass transfer coefficient (KLa) for CO2 were summarized using an empirical equation that allowed CO2 mass transfer to be predicted accurately. Stripping efficiency is higher with O2 than with CO2 under the same working conditions due to differences in diffusivity and solubility coefficients and because of chemical reactions between CO2 and water that impact pH. The SAE values obtained with the vacuum airlift are close to those obtained with other air diffusion systems. SSE is always higher than SAE due to vacuum. In RAS, the addition of feed has a negative effect on KLa. After feeding, the retention time in the vacuum airlift decreases and mass transfer efficiency is reduced. Finally, the SCTR and SOTR results obtained in fresh and sea water make the vacuum airlift a promising tool for CO2 stripping and O2 aeration in RAS. However, additional work is required to accurately predict mass transfer in the vacuum airlift and to adapt its geometry to various RAS rearing conditions.
5. Acknowledgements
We would like to thank Pierre Bosc from ARDA and the Réunion Region as well as the French National Association for Research and Technology (ANRT) for their financial support for this project. This study was made possible thanks to the cooperation of François René (IFREMER). We also wish to thank Julien Jacquety from COLDEP® for all his assistance and hard work, and for kindly providing the vacuum airlift.
6. Nomenclature a* interfacial area in the total volume (m² m-3) ag specific area of bubble (m² m-3) C0 dissolved CO2 (or O2) concentration in the liquid phase at the beginning of the experiment (mg L-1) Ceff dissolved CO2 (or O2) concentration in the liquid at the outlet of the vacuum airlift (mg L-1) Cin dissolved CO2 (or O2) concentration in the liquid at the inlet of the vacuum airlift (mg L-1) CL dissolved CO2 (or O2) concentration in the liquid phase (mg L-1) CS dissolved CO2 (or O2) concentration in the liquid phase in equilibrium with atmosphere (mg L-1) Db bubble diameter (m) ΔP pressure loss necessary to inject the air (Pa) εg* gas holdup in the total volume (%) H pipe length (m) HRTi hydraulic residence time (s) KLa mass transfer coefficient of liquid (s-1) KLa* mass transfer coefficient in the total volume of liquid (s-1) Qg gas flow rate (m3 s-1) Qw water flow rate (m3 s-1) Vi volume of liquid in the inner tube of the vacuum airlift (m3) VT total volume of liquid (m3)

20
7. References Barrut, B., Blancheton, J.P., Champagne, J.Y., Grasmick, A., Aquacultural Engineering, Submitted.
Water delivery capacity of a vacuum airlift – Application to water recycling in aquaculture systems.
Benson, B.B., Krause, D.Jr., 1984. The concentration and isotopic fractionation of oxygen dissolved in freshwater and seawater in equilibrium with atmosphere. Limnol. Oceanogr. 29, 620–632.
Bisogni, J.J., Timmons, M.B., 1994. Control of pH in closed cycle aquaculture systems. In:Timmons, M.B., Losordo, T.M., (Eds), Aquaculture Water Reuse Systems : Engineering Design and Management. Elsevier, New York, p. 235–246.
Blancheton, J.P., Piedrahita, R., Eding, E.H., Roque d’orbcastel, E., Lemarié, G., Bergheim, A., Fivelstad, S., 2007. Intensification of land based aquaculture production in single pass and reuse systems. Chapter 2. In: Aquaculture Engineering and Environment, p. 21–47.
Cecchini, S., Saroglia, M., Caricato, G., Terova, G., Sileo, L., 2001. Effects of graded environmental hypercapnia on sea bass (Dicentrarchus labrax) feed intake and acid base balance. Aquacult. Res. 32, 499–502.
Chaumat, H., Billet-Duquenne, A.M., Augier, F., Mathieu, C., Delmas, H., 2005a. Mass transfer in bubble column for industrial conditions - effect of organic medium, gas and liquid flow rates and column design. Chem. Eng. Sci. 60, 5930–5936.
Chaumat, H., Billet-Duquenne, A.M., Augier, F., Mathieu, C., Delmas, H., 2007a. On the reliability of an optical fibre probe in bubble column under industrial relevant operating conditions. Exp. Therm. Fluid. Sci. 31, 495–504.
Chaumat, H., Billet-Duquenne, Delmas, H., 2007b. Hydrodynamics and mass transfer in bubble column: Influence of liquid phase surface tension. Chem. Eng. Sci. 62, 7378–7390.
Colt, J.E., Orwicz, K., 1991. Aeration in intensive culture. In: Brune, D.E., Tomasso, J.R., (Eds.), Aquaculture and Water Quality. Word Aquaculture Society, Louisiana State University, Baton Rouge, LA, p. 198–271.
Contreras, E.M., 2007. Carbon Dioxide Stripping In Bubbled Columns. Ind. Eng. Chem. Res. 46, 6332–6337.
Fivelstad, S., Haavik, H., Løvik, G., Olsen, A.B., 1998. Sublethal effects and safe levels of carbon dioxide in seawater for Atlantic salmon postsmolts (Salmo salar) : ion regulation and growth. Aquaculture 160, 305–316.
Foss, A., Røsnes, B.A., Øiestad, V., 2003. Graded environmental hypercapnia in juvenile spotted wolffish (Anarhichas minor Olafsen): effects on growth, food conversion efficiency and nephrocalcinosis. Aquaculture 220, 607–617.
Grace, G.R., Piedrahita, R.H., 1994. Carbon dioxide control. In: Timmons, M.B., Losordo, T.M. (Eds), Aquaculture Water Reuse Systems: Engineering Design and Management. Elsevier, New York, p. 209–234.
Grøttum, J.A., Sigholt, T., 1996. Acute toxicity of carbon dioxide on European seabass (Dicentrarchus labrax) : mortality and effects on plasma ions. Comp. Biochem. Physiol. 115, 323–327.
Guyon, E., Hulin, J.P., Petit, L., 2001. Hydrodynamique physique, EDP Sciences, 674 p.
Hussenot, J., 1987. Le contrôle des gaz dissous en aquaculture marine. In : Le traitement de l’eau de mer. Rapport du groupe de travail Ifremer, 2, 27 p.
Jensen, G.L., Bankston, J.D., Jensen, J.W., 1989. Pond aeration types and uses of aeration equipment. Texas Cooperative Extension. Southern Regional Aquaculture Center Publication SRAC 371, 5 p.
Kang, Y., Cho, Y.J., Woo, K.J., Kim, S.D., 1999. Diagnosis of bubble distribution and mass transfer in pressurized bubble columns with viscous liquid medium. Chem. Eng. Sci. 54, 4887–4893.
Kang, Y., Cho, Y.J., Woo, K.J., Kim, K.I., Kim, S.D., 2000. Bubble properties and pressure fluctuations in pressurized bubble columns. Chem. Eng. Sci. 55, 411–419.

21
Kawahara, A., Sadatomi, M., Matsuyama, F., Matsuura, H., Tominaga, M., Noguchi, M., 2009. Prediction of micro-bubble dissolution characteristics in water and seawater. Exp. Therm. Fluid. Sci. 33, 883–894.
Letzel, H.M., Schouten, J.C., Krishna, R., Van den Bleek, C.M., 1999. Gas holdup and mass transfer in bubble column reactors operated at elevated pressure. Chem. Eng. Sci. 54, 2237–2246.
Lide, D.R., (ed) 1998. CRC Handbook of Chemistry and Physics 79th edition, CRC Press, Inc., New York (1998-1999).
Loyless, J.C., Malone, R.F., 1998. Evaluation of air-lift pump capabilities for water delivery, aeration, and degasification for application to recirculating aquaculture systems. Aquacult.Eng. 18, 117–133.
Mamane, H., Colorni, A., Bar, I., Ori, I., Mozes, N., 2010. The use of an open channel, low pressure UV reactor for water treatment in low head recirculating aquaculture systems (LH-RAS). Aquacult. Eng. 42, 103–111.
Moran, D., 2010a. Carbon dioxide degassing in fresh and saline water. I: Degassing performance of a cascade column. Aquacult. Eng. 43, 29–36.
Moran, D., Tirsgård, B., Steffensen, J.F., 2010. The accuracy and limitations of a new meter used to measure aqueous carbon dioxide. Aquacult. Eng. 43, 101–107.
Moran, D., 2010b. Carbon dioxide degassing in fresh and saline water. II: Degassing performance of an air-lift. Aquacult. Eng. 43, 120–127.
Mozes, N., Haddas, I., Conijeski, D., Eshchar, M., 2004. The Low-Head Mega-Flow air driven Recirculating system - minimizing biological and operational risks. Proc. Aquacult. Eur. Conf., Barcelona, Spain, 598–599.
Physical and Engineering Data, January 1978 ed. The Hague: Shell International Petroleum Maatschappij BV, 1978.
Piedrahita, R.H., 1997. Control of oxygen, CO2, and pH in intensive aquaculture systems. In: Presentation Handout from Aquacultural Engineering Workshop, Seattle, WA. Aquacultural Engineering Society, Shepherdstown, WV.
Piedrahita, R.H., 1998. Carbon dioxide in recirculation systems: special problems in extreme climates. In: Presentation Handout from Aquacultural Engineering Workshop, Las Vegas, NV. Aquacultural Engineering Society, Shepherdstown, WV.
Roque d’orbcastel, E., Blancheton, J.P., Belaud, A., 2009. Water quality and rainbow trout performance in a Danish Model Farm recirculating system: Comparison with a flow through system. Aquacult. Eng. 40, 135–143.
Ruen-ngam, D., Wongsuchoto, P., Limpanuphap, A., Charinpanitkul, T., Pavasant, P., 2008. Influence of salinity on bubble size distribution and gas–liquid mass transfer in airlift contactors. Chem. Eng. J. 141, 222–232.
Singh, M.K., Majumder, S.K., 2011. Co- and counter-current mass transfer in bubble column. Int. J. Heat Mass Transfer 54, 2283–2293.
Summerfelt, S.T., 1996. Engineering design of a water reuse system. In: Summerfelt, R.C. (Ed.), Walleye Culture Manual. NCRAC Culture Series 101, North Central Regional Aquaculture Center Publications Office, Iowa State University, Ames, IA, p. 277–309.
Summerfelt S.T., Vinci, B.J., Piedrahita, R.H., 2000. Oxygenation and carbon dioxide control in water reuse systems. Aquacult. Eng. 22, 87–108.
Timmons, M.B., Ebeling, J.M., 2010. Recirculating Aquaculture 2nd Ed. Cayuga Aquaculture Ventures, Ithaca, NY, USA, 948 p.
Vandu, C.O., Krishna, R., 2004. Influence of scale on the volumetric mass transfer coefficients in bubble columns. Chem. Eng. Process. 43, 575–579.
Watten, B.J., Boyd, C.E., 1990. Gas transfer within a multi-stage packed column oxygen absorber: Model development and application. Aquacult. Eng. 9, 33–59.

22
Yu, W., Wang, T.F., Liu, M., Wang, Z.W., 2008. Bubble Circulation Regimes in a Multi-Stage Internal-Loop Airlift Reactor. Chem. Eng. J. 142, 301–30.