mass spectrometry protein expression profiles in colorectal...
TRANSCRIPT

RESEARCH ARTICLE Open Access
Mass spectrometry protein expression profilesin colorectal cancer tissue associated withclinico-pathological features of diseaseChristopher CL Liao1,2, Nicholas Ward1,2, Simon Marsh2, Tan Arulampalam2, John D Norton1*
Abstract
Background: Studies of several tumour types have shown that expression profiling of cellular protein extractedfrom surgical tissue specimens by direct mass spectrometry analysis can accurately discriminate tumour fromnormal tissue and in some cases can sub-classify disease. We have evaluated the potential value of this approachto classify various clinico-pathological features in colorectal cancer by employing matrix-assisted laser desorptionionisation time of-flight-mass spectrometry (MALDI-TOF MS).
Methods: Protein extracts from 31 tumour and 33 normal mucosa specimens were purified, subjected to MALDI-TofMS and then analysed using the ‘GenePattern’ suite of computational tools (Broad Institute, MIT, USA). ComparativeGene Marker Selection with either a t-test or a signal-to-noise ratio (SNR) test statistic was used to identify and rankdifferentially expressed marker peaks. The k-nearest neighbours algorithm was used to build classification modelseither using separate training and test datasets or else by using an iterative, ‘leave-one-out’ cross-validation method.
Results: 73 protein peaks in the mass range 1800-16000Da were differentially expressed in tumour verses adjacentnormal mucosa tissue (P ≤ 0.01, false discovery rate ≤ 0.05). Unsupervised hierarchical cluster analysis classifiedmost tumour and normal mucosa into distinct cluster groups. Supervised prediction correctly classified the tumour/normal mucosa status of specimens in an independent test spectra dataset with 100% sensitivity and specificity(95% confidence interval: 67.9-99.2%). Supervised prediction using ‘leave-one-out’ cross validation algorithms fortumour spectra correctly classified 10/13 poorly differentiated and 16/18 well/moderately differentiated tumours(P = < 0.001; receiver-operator characteristics - ROC - error, 0.171); disease recurrence was correctly predicted in 5/6cases and disease-free survival (median follow-up time, 25 months) was correctly predicted in 22/23 cases(P = < 0.001; ROC error, 0.105). A similar analysis of normal mucosa spectra correctly predicted 11/14 patients with,and 15/19 patients without lymph node involvement (P = 0.001; ROC error, 0.212).
Conclusions: Protein expression profiling of surgically resected CRC tissue extracts by MALDI-TOF MS has potentialvalue in studies aimed at improved molecular classification of this disease. Further studies, with longer follow-uptimes and larger patient cohorts, that would permit independent validation of supervised classification models,would be required to confirm the predictive value of tumour spectra for disease recurrence/patient survival.
BackgroundColorectal cancer (CRC) is the second commonestmalignancy and has a five-year survival rate of approxi-mately 50% [1,2]. The majority of patients, particularlywith early stage disease (Dukes’ A, Stage I), are treatedwith surgery [3]. For more advanced disease (Dukes’
C and D, Stage III or IV) surgery combined with adju-vant chemotherapy has proven survival benefits [4-6].However, the disease outcome is very variable and prog-nosis and prediction of treatment response based onconventional disease staging criteria is not reliable [6,7].There has therefore been considerable interest in thedevelopment of more robust prognostic and predictivedisease markers for patient stratification with the ulti-mate aim of tailoring treatment to the individual patient[8,9].
* Correspondence: [email protected] of Biological Sciences, University of Essex, Wivenhoe Park,Colchester, Essex CO4 3SQ UKFull list of author information is available at the end of the article
Liao et al. BMC Cancer 2010, 10:410http://www.biomedcentral.com/1471-2407/10/410
© 2010 Liao et al; licensee BioMed Central Ltd. This is an Open Access article distributed under the terms of the Creative CommonsAttribution License (http://creativecommons.org/licenses/by/2.0), which permits unrestricted use, distribution, and reproduction inany medium, provided the original work is properly cited.

Markers based on circulating carcinoembryonic anti-gen (CEA) levels and various tumour-associated genemutations including microsatellite instability (MSI), lossof heterozygosity of 18q, deleted in colorectal cancer(DCC), mutations in KRAS, BRAF and PIK3CA geneshave all been shown to be of some prognostic or predic-tive value (reviewed in [8,10]). In particular, the muta-tional status of KRAS, BRAF and PIK3CA genes hasrecently been proposed as a reliable marker for predict-ing responders to new targeted agents for the epidermalgrowth factor receptor (EGFR) [11,12]. In addition, geneexpression profiling studies of both mRNA [13] andmicroRNA [14] have revealed tumour-associated geneexpression signatures that form the basis for a molecularclassification of disease sub-types that define diseasecourse and treatment response (reviewed in [8]). Thesestudies on gene mutations and RNA expression havebeen paralleled by analysis of the tumour cell proteome,most commonly employing the technique of two-dimen-sional difference gel electrophoresis (2D-DIGE) to iden-tify proteins that are differentially expressed in tumourverses normal mucosa tissue (reviewed in [15]). Anexpanding list of candidate prognostic markers haveemerged from these studies including for example,cathepsin D, S100A4 and APAF-1 [15].As an alternative to 2D-DIGE, studies of other tumour
types have also employed the technique of direct proteinexpression profiling of tumour/normal tissue by surfaceenhanced laser desorption ionisation time-of-flight massspectrometry (SELDI-TOF) or by matrix-assisted laserdesorption ionisation time of-flight-mass spectrometry(MALDI-TOF) mass spectrometry [16,17]. Thisapproach, which is most commonly associated with thedevelopment of serum-based diagnostic markers, offersa number of advantages over 2D-DIGE. Although thetechnique yields no information on the actual identitiesof proteins, the reproducible spectral profiles that arerelatively simple to generate in high throughput studiesallow robust classification models of different proteomepopulations to be built. For example, studies of lung[18], breast [19], head and neck cancer [20] have allshown that the spectral profiles of tumour and normaltissue can be accurately discriminated and in some casessub-classified by direct protein profiling using SELDI/MALDI-TOF mass spectrometry. Only one previousstudy has reported on the detection of differencesbetween normal mucosa, adenoma and colorectal carci-noma by using SELDI-TOF MS [21].In the present study, we have evaluated the potential
value of protein expression profiling of CRC tissue byMALDI-TOF mass spectrometry. In addition to compar-ing tumour with adjacent normal mucosa, we haveinvestigated whether spectral profiles of tumour tissuecan be used to classify various clinico-pathological
features of disease. Since previous 2D-DIGE studieshave reported abnormalities of protein expression pro-files in tumour-adjacent normal tissue [22], we have alsoextended this analysis to normal mucosa tissue.
MethodsClinical specimensTissue samples were collected from a total of 36patients with confirmed CRC at the time of surgicalresection at Colchester General Hospital, Essex UK. Allspecimens were obtained following informed consent inaccordance with local UK NHS Ethics Committeeapproval (protocol reference: MH 528). Surgicallyexcised specimens were washed extensively in ice-cold150 mM NaCl and samples of normal colonic mucosa(>10 cm from tumour margin) and tumour tissues wereexcised using a scalpel and then snap frozen and trans-ferred to a - 80°C freezer. The total time from surgicalresection to snap freezing of specimens was <30 mins.
Protein extraction and purificationFrozen tissue samples (approximately 250 mg) were groundusing a mortar and pestle and then lysed for 30 mins at 4°Cin 1.0 ml of 10 mM Tris-HCl pH 7.5, 200 mM NaCl con-taining Protease inhibitor cocktail (Roche Pharmaceuticals)and 1% N-octyl-b-D-glucopyranoside (Sigma Aldrich). Thecell lysate was then centrifuged at 12,000 × g for 30 minsand the supernatant representing the solubilised fractionwas removed. Protein was further purified by reversedphase hydrophobic interaction chromatography using acommercially available super-paramagnetic microparticlekit (MB-HIC-C8, Bruker Daltonics). Briefly, 10 μl of 30-35mg/ml protein solution was adsorbed to 10 μl of beads afteraddition of 20 μl kit binding buffer. After three washes with200 μl 0.1% trifluoroacetic acid, protein was eluted in 20 μlof 50% (v/v) acetonitrile (Fisher Scientific) Eluted proteinwas stored at 4°C for no more than 1 hr prior to matrix co-crystallisation.
MALDI-TOF mass spectrometryTo facilitate reproducible co-crystallisation of proteinwith matrix solution, a modification of the slow crystal-lisation method [23] was used. Briefly, 20 ul of purifiedprotein was mixed with 20 μl of acetonitrile containing0.1% trifluoroacetic acid, saturated with sinapic acid(Sigma Aldrich). A 20 μl aqueous solution containingdiammonium citrate (200 mM) and nitrotetracetic acid(0.1%) was added and crystal formation was allowed toproceed for 2-3 hrs. Crystallised matrix-protein sampleswere spotted onto a stainless steel MALDI target plateand spectra were acquired using a MALDI-TOF massspectrometer (Reflex IV; Bruker Daltonics) with the fol-lowing instrument settings: ion source 1, 20 kV; ionsource 2, 16.65 kV; lens voltage, 9.5 kV; pulsed ion
Liao et al. BMC Cancer 2010, 10:410http://www.biomedcentral.com/1471-2407/10/410
Page 2 of 11
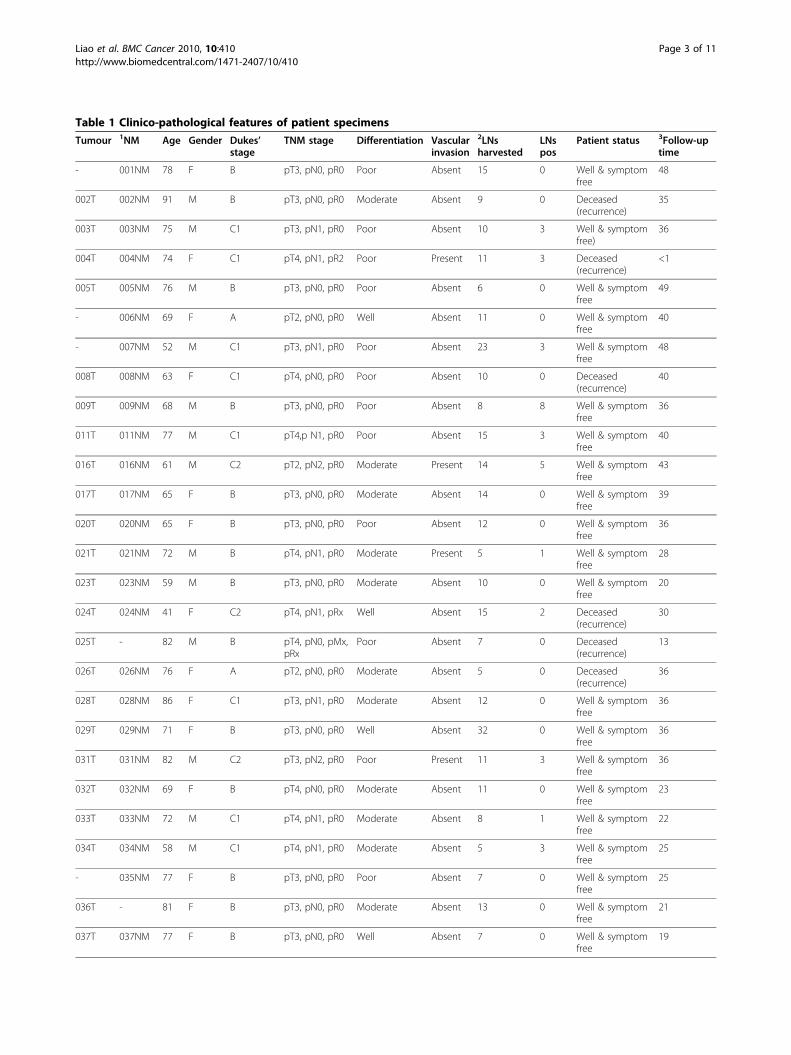
Table 1 Clinico-pathological features of patient specimens
Tumour 1NM Age Gender Dukes’stage
TNM stage Differentiation Vascularinvasion
2LNsharvested
LNspos
Patient status 3Follow-uptime
- 001NM 78 F B pT3, pN0, pR0 Poor Absent 15 0 Well & symptomfree
48
002T 002NM 91 M B pT3, pN0, pR0 Moderate Absent 9 0 Deceased(recurrence)
35
003T 003NM 75 M C1 pT3, pN1, pR0 Poor Absent 10 3 Well & symptomfree)
36
004T 004NM 74 F C1 pT4, pN1, pR2 Poor Present 11 3 Deceased(recurrence)
<1
005T 005NM 76 M B pT3, pN0, pR0 Poor Absent 6 0 Well & symptomfree
49
- 006NM 69 F A pT2, pN0, pR0 Well Absent 11 0 Well & symptomfree
40
- 007NM 52 M C1 pT3, pN1, pR0 Poor Absent 23 3 Well & symptomfree
48
008T 008NM 63 F C1 pT4, pN0, pR0 Poor Absent 10 0 Deceased(recurrence)
40
009T 009NM 68 M B pT3, pN0, pR0 Poor Absent 8 8 Well & symptomfree
36
011T 011NM 77 M C1 pT4,p N1, pR0 Poor Absent 15 3 Well & symptomfree
40
016T 016NM 61 M C2 pT2, pN2, pR0 Moderate Present 14 5 Well & symptomfree
43
017T 017NM 65 F B pT3, pN0, pR0 Moderate Absent 14 0 Well & symptomfree
39
020T 020NM 65 F B pT3, pN0, pR0 Poor Absent 12 0 Well & symptomfree
36
021T 021NM 72 M B pT4, pN1, pR0 Moderate Present 5 1 Well & symptomfree
28
023T 023NM 59 M B pT3, pN0, pR0 Moderate Absent 10 0 Well & symptomfree
20
024T 024NM 41 F C2 pT4, pN1, pRx Well Absent 15 2 Deceased(recurrence)
30
025T - 82 M B pT4, pN0, pMx,pRx
Poor Absent 7 0 Deceased(recurrence)
13
026T 026NM 76 F A pT2, pN0, pR0 Moderate Absent 5 0 Deceased(recurrence)
36
028T 028NM 86 F C1 pT3, pN1, pR0 Moderate Absent 12 0 Well & symptomfree
36
029T 029NM 71 F B pT3, pN0, pR0 Well Absent 32 0 Well & symptomfree
36
031T 031NM 82 M C2 pT3, pN2, pR0 Poor Present 11 3 Well & symptomfree
36
032T 032NM 69 F B pT4, pN0, pR0 Moderate Absent 11 0 Well & symptomfree
23
033T 033NM 72 M C1 pT4, pN1, pR0 Moderate Absent 8 1 Well & symptomfree
22
034T 034NM 58 M C1 pT4, pN1, pR0 Moderate Absent 5 3 Well & symptomfree
25
- 035NM 77 F B pT3, pN0, pR0 Poor Absent 7 0 Well & symptomfree
25
036T - 81 F B pT3, pN0, pR0 Moderate Absent 13 0 Well & symptomfree
21
037T 037NM 77 F B pT3, pN0, pR0 Well Absent 7 0 Well & symptomfree
19
Liao et al. BMC Cancer 2010, 10:410http://www.biomedcentral.com/1471-2407/10/410
Page 3 of 11

extraction, 200 ns. Ionisation was achieved by irradiationwith a nitrogen laser (e = 337 nm) operating at 25 Hzand 20% laser power. For matrix suppression, we used ahigh gating factor with signal suppression up to 1500Da. Mass spectra were detected in linear positive mode.Detector gain was set at 1600 V, sample rate at 1.0 andelectronic gain at 100 mV with real-time smoothing.Spectra were acquired in duplicate from 500 laser shotsdelivered as 5 × 100 pulses and were internally cali-brated using ‘FlexAnalysis’ spectral processing software(Version 2.0; Bruker Daltonics) with reference markerpeaks at 2426.9Da, 6109.5 Da and 12471.6 Da. Externalcalibration used the following reference standards: bom-besin (1620.86 Da), somatostatin (3149.57 Da), insulin(5734.51 Da), ubiquitin I (8565.76 Da), cytochrome c(12,360.97 Da) and myoglobin (16,952.30 Da).
Spectral processing and analysisCalibrated spectra were exported as ASCII files and weredigitally processed by smoothing, de-noising, baselinesubtraction and normalisation (by total ion current)using the ‘SpecAlign’ suite of spectral computationaltools [24,25]. Validation of the reproducibility of theresulting mass spectrometry profiles and elimination of‘outliers’ was accomplished as described elsewhere [26].Duplicate spectra with a cross-correlation function of< 0.950 were discarded. From the initial cohort of speci-mens, representing matched tumour and adjacent normalmucosa from 36 patients, a total of 64 spectra represent-ing 31 tumours and 33 normal mucosa were obtained(see Table 1). Of the 5 tumour and 3 mucosa specimensthat were excluded from analysis, 2 tumour and onemucosa failed to yield reproducible spectra on repeated
protein preparations. The remaining 3 tumour and 2mucosa specimens consistently gave spectra of poorquality (outliers), presumably as a result of specimendeterioration. Matching peaks were aligned across spec-tra by using the combined Fast Fourier Transform/Peakmatching method [25] and modelled peak areas for theentire set of spectra were exported as a single csv file.Subsequent spectral analysis was implemented in the
‘GenePattern’ suite of software tools (Broad Institute,MIT, USA) [27]. Hierarchical clustering used Euclideancorrelation as the column distance measure with pair-wise average linkage as the clustering method. Compara-tive Gene Marker Selection [28,29] with either a t-testor a signal-to-noise ratio (SNR) test statistic was used toidentify and rank differentially expressed marker peaksand to assign Bonferroni-corrected P and false discoveryrate (FDR) values [28-30]. The k-nearest neighbours(kNN) algorithm [29] was used to build a classificationmodel for tumour vs normal using separate training andtest datasets. For this purpose, two thirds of the spectra,comprised of a representative proportion of tumour andnormal spectra, were randomly assigned to a trainingdataset, with the remaining third being used as an inde-pendent test dataset. Spectra were randomly assignedusing the GenePattern ‘SplitDatasetTrainTest’ module[27]. Alternatively the kNN algorithm was used in aniterative, ‘leave-one-out’ cross-validation mode. Otherstatistical analysis used the SPSS software.
ResultsSpectral profiles in tumour and normal mucosa tissuesTable 1 summarises the clinico-pathological data for the36 CRC patients from whom specimens were obtained.
Table 1 Clinico-pathological features of patient specimens (Continued)
038T 038NM 76 F A pT2, pN1, pR0 Poor Absent 5 1 Well & symptomfree
20
039T 039NM 75 F B pT3, pN0, pR0 Moderate Absent 16 0 Well & symptomfree
23
2012T 2012NM 62 M C1 pT3, pN1, pR0 Poor Present 18 3 Well & symptomfree
20
2018T 2018NM 83 F A pT1, pN0, pR0 Moderate Absent 6 0 Deceased(unrelated)
2
2022T 2022NM 56 M B pT3, pN0, pR0 Well Present 20 0 Well & symptomfree
20
2044T 2044NM 82 M A pT2, pN0, pR0 Moderate Absent 10 0 Well & symptomfree
21
- 2080NM 72 F A pT2, pN0, pR0 Moderate Absent 5 0 Well & symptomfree
21
2084T - 38 M B ypT3, ypN0,ypR0
Poor Absent 10 0 Well & symptomfree
20
2085T 2085NM 78 F C1 pT3, pN1, pR0 Moderate Absent 11 1 Deceased(unrelated)
<1
1NM = normal mucosa; 2LN = lymph node; 3follow-up time in months
Liao et al. BMC Cancer 2010, 10:410http://www.biomedcentral.com/1471-2407/10/410
Page 4 of 11

Figure 1 Unsupervised hierarchical cluster analysis of tumour and normal mucosa spectra. The dendrogram and heatmap show theclustering of Tumour (T) and normal mucosa (NM) spectra using Euclidean correlation as the column distance measure with pair-wise averagelinkage as the clustering method. Row clustering (not shown) used Spearman’s rank correlation as distance measure with pair-wise completelinkage as the clustering method. Specimens are colour-coded as green (NM) and red (T).
Liao et al. BMC Cancer 2010, 10:410http://www.biomedcentral.com/1471-2407/10/410
Page 5 of 11

In most cases, spectra of adequate quality from match-ing pairs of tumour and adjacent normal mucosa wereobtained. However, some tissue protein preparationsconsistently yielded spectra of poor quality or that werepoorly reproducible (see Methods section); these wereexcluded from the analysis. The resulting 64 spectra,representing 31 tumour and 33 normal mucosa speci-mens, generated a total of 265 protein peaks in themass range 1800-16000Da. Illustrative examples of rawMALDI-TOF spectral profiles are shown in additionalfile 1. Although the overall intensity profile of individualprotein peaks was very heterogeneous across differentspecimens, unsupervised hierarchical cluster analysisclassified most tumour and normal mucosa into distinctcluster groups (Figure 1) consistent with major differ-ences in the tumour verses normal protein expressionprofiles.To quantitatively evaluate the differences between the
protein expression profiles of tumour verses normal tis-sue, the Comparative Gene Marker Selection algorithm[28] was applied to the spectral data-set to determine thelevel of significance of difference between tumour andnormal for each protein peak. Figure 2 shows the fre-quency distribution (occurrences) of protein peakP values (Feature P) that were binned in increments of0.05. Above P = 0.05, the representation of protein peakswas fairly evenly distributed. However, nearly 100 peaksgave a P value < 0.05, indicating that a sizable fraction ofproteins detected by MALDI-TOF mass spectrometrydiscriminate between tumour and normal colonic tissue.Applying a threshold of P ≤ 0.01, FDR ≤ 0.05, the expres-sion profile of a total of 73 protein peaks was significantly
different between tumour and normal tissue with 57being up-regulated in normal tissue and 16 being up-regulated in tumour tissue. Figure 3 shows a heat-mapprofile of these ‘marker peaks’ and additional file 2 sum-marises their statistical features.To rigorously demonstrate that tumour and normal
mucosa tissue could be distinguished using their proteinspectral profiles, the 64 spectra were randomly split intoseparate training and test datasets. The training spectradataset was used to optimise a kNN algorithm [29] forpredicting tumour or normal status. As summarised inadditional file 3, the model correctly predicted the statusof specimens in the independent test spectra datasetwith 100% sensitivity and specificity (95% confidenceinterval: 67.9-99.2%).
Classification of clinico-pathological characteristics fromtumour spectraTo determine whether the protein expression profilesof tumour tissue could be used to predict individualclinico-pathological characteristics of patients (Table1), the kNN algorithm was used to optimise a series ofclassification models. Since the limited numbers ofdatasets precluded analysis by using independent trainand test spectra, the kNN algorithm was used in aniterative, ‘leave-one-out’ cross-validation mode. Table 2summarises the results of this analysis. The predictivemodel for distinguishing poorly differentiated fromwell/moderately differentiated tumours gave a recei-ver-operator characteristics (ROC) error of 0.171, cor-rectly classifying 10/13 poorly differentiated and 16/18well/moderately differentiated tumours (P = < 0.001).Additional file 4 summarises the kNN algorithmresults and Figure 4A shows the expression profiles ofthe top two ranked discriminating peaks. The kNNmodel for disease recurrence also gave a low ROCerror (0.105 - see Table 2A). As summarised in addi-tional file 5, the model correctly predicted 5/6 patientswith recurrent disease and 22/23 who are disease-free(P = < 0.001). Figure 4A shows the expression profilesof the top two ranked marker peaks for classifying dis-ease outcome.
Classification of clinico-pathological characteristics fromnormal mucosa spectraIn a similar analysis of normal mucosa spectra (Table 3),only the characteristic of lymph node involvement gavea low ROC error (0.212). As shown in Table 3 and inadditional file 6, the kNN algorithm correctly predicted11/14 patients with, and 15/19 patients without lymphnode involvement (P = 0.001). Figure 4B shows theexpression profiles of the top two ranked marker peaksfor classifying the characteristic of lymph nodeinvolvement.
Figure 2 Probability distribution of marker peaksdistinguishing tumour from normal mucosa. Spectra from all 64tumour and normal tissue samples were analysed by ComparativeGene Marker Selection [28] using the SNR test statistic to identifypeaks (features) that discriminate tumour from normal tissue. Thefeature P histogram shows the number of peaks (occurrences) thatfall within binned P values.
Liao et al. BMC Cancer 2010, 10:410http://www.biomedcentral.com/1471-2407/10/410
Page 6 of 11

Figure 3 Heat map profile of marker peaks discriminating tumour from normal mucosa. The expression profiles and m/z values of the top73 ranked peaks identified by Comparative Gene Marker Selection [28] (P = ≤ 0.01, FDR = ≤ 0.05) are depicted for all 64 tissue specimens.
Liao et al. BMC Cancer 2010, 10:410http://www.biomedcentral.com/1471-2407/10/410
Page 7 of 11

DiscussionAlthough previous studies employing 2D-DIGE analysisof CRC tissues have documented a number of proteinsthat are either up- or down-regulated in tumour versesnormal mucosa [15], the extent to which protein expres-sion profile differences can be detected by directMALDI-TOF analysis in CRC was not previously known.Analysis of complex protein mixtures by MALDI-TOFMS is inherently limited by the resolution afforded bythis type of instrument. Also, only a minor fraction ofprotein species are efficiently ionisable and thereforedetectable. However, our results show that, in commonwith similar studies in some other solid tumour types[18-20], MALDI-TOF MS readily detects a sizable frac-tion of protein marker peaks whose expression level issignificantly different between tumour and normalmucosa. By using an optimised kNN training model, theclassification of tumour and normal tissue was correctlypredicted with 100% sensitivity and specificity (95% con-fidence interval: 0.679-0.992) in an independent test data-set. This performance compares favourably with otherstudies, for example in head and neck squamous cell car-cinoma, in which supervised prediction using SELDI-TOF spectral data correctly classified healthy mucosaand tumour tissue with an accuracy of 94.5% and 92.9%respectively [20].In further evaluating the potential value of spectra
generated from tumour tissue for classifying variousclinic-pathological characteristics of disease, we observedlow ROC errors with the kNN predictive models for dif-ferentiation (0.171) and disease recurrence (0.105). Since
histological differentiation stage is a characteristic that isintrinsic to the tumour tissue (and would most closelyreflect the actual tumour cell proteome), the ability ofthe spectra to discriminate well/moderately differen-tiated from poorly differentiated histologies is perhapsunsurprising. The good performance of the predictivemodel for disease recurrence is consistent with datafrom several microarray expression profiling studies thathave clearly demonstrated associations between patternsof tumour-associated gene expression and prognosis/treatment response [8,13,14]. However, given that in ourstudy, only six patients had succumbed to recurrent dis-ease at the time of data analysis (median follow-up timefor recurrent disease patients: 33 months; median fol-low-up time for disease-free patient: 27 months), ourresults should be interpreted with caution. It is alsoimportant to emphasise that because of the relativelysmall number of tumour specimens, rigorous validationof correlations with disease recurrence and histologicaldifferentiation stage in an independent ‘test’ datsasetwas not possible in our study.Several lines of evidence indicate that the normal
mucosa from surgically resected CRC tumour specimensdisplay abnormalities in gene and protein expression.These abnormalities have been attributed to precancer-ous ‘field effect’ changes in tumour-adjacent mucosaand have been reported to affect protein expression[22], CpG island gene methylation [31] and gene micro-array expression profiles [32]. Indeed one study hasreported that gene expression profiling of non-neoplas-tic mucosa may predict clinical outcome of CRC
Table 2 Performance of predictive models for classification of clinico-pathological characteristics in tumour tissue
CHARACTERISTICS 1Advanced Dukes’stage
Poorly differentiated Lymph nodeinvolvement
Invasiveness 2Disease recurrence
Number of features 5 2 4 9 10
Positive prediction rate 6/12 10/13 5/13 3/7 5/6
Sensitivity 0.500 0.769 0.385 0.429 0.8333CI 0.223-0.777 0.460-0.938 0.151-0.677 0.118-0.798 0.364-0.991
Positive predictive value 0.750 0.833 0.625 0.750 0.833
CI 0.356-0.955 0.509-0.971 0.259-0.898 0.219-0.986 0.364-0.991
Negative prediction rate 17/19 16/18 15/18 23/24 22/23
Specificity 0.894 0.889 0.833 0.958 0.957
CI 0.654-0.981 0.639-0.981 0.577-0.956 0.768-0.998 0.760-0.998
Negative predictive value 0.739 0.842 0.652 0.852 0.957
CI 0.513-0.889 0.585-0.958 0.428-0.828 0.654-0.951 0.760-0.998
Absolute error 0.258 0.161 0.355 0.161 0.0694ROC error 0.302 0.171 0.391 0.307 0.105
Fisher’s exact test P = 0.020 P = < 0.001 P = 0.133 P = 0.027 P = < 0.0011Includes Dukes’ C1 and C2; 2 Median follow-up time for recurrent disease patients: 33 months; median follow-up time for disease-free patient: 27 months(analysis excludes patients who died through surgical complications - see Table 1); 3CI = 95% confidence interval; 4ROC = receiver-operator characteristics
The KNN algorithm [29] was used in ‘leave-one-out’ cross-validation prediction with the number of features (marker peaks) specified. Marker peaks were selectedusing a t-test statistic except for lymph node involvement and invasiveness characteristics of tumour tissue where the SNR test statistic was used.
Liao et al. BMC Cancer 2010, 10:410http://www.biomedcentral.com/1471-2407/10/410
Page 8 of 11

Figure 4 Relative ion intensity profiles of marker peaks used in predictive algorithms of tumour/mucosa clinico-pathological features.The peak intensity profiles of the top two-ranked scoring peaks are shown for tumour spectra (A) for classifying differentiation and diseaserecurrence and for normal mucosa spectra (B) for classifying lymph node involvement (see Table 2). The performance of predictive models forthese clinico-pathological features are shown in additional file 4 (differentiation), in additional file 5 (disease recurrence) and in additional file 6(lymph node involvement). The t-test P value is given for each marker peak.
Liao et al. BMC Cancer 2010, 10:410http://www.biomedcentral.com/1471-2407/10/410
Page 9 of 11

patients [32]. These findings are reminiscent of reportsfrom studies of other solid tumour types, most strikinglyin hepatocellular carcimoma in which gene expressionpatterns of non-neoplastic liver tissue were predictive ofpatient survival, whereas tumour tissue gene expressionsignatures were of no prognostic value [33]. It wastherefore of interest in our study to determine whetherthe protein expression profiles of normal mucosa couldbe used to classify any clinico-patholgical characteristics.Although we found no evidence for predictive value fordisease relapse (ROC error, 0.519), the kNN model ofnormal mucosa spectra for lymph node involvement didgive a low ROC error (0.212); the corresponding kNNmodel for tumour spectra did not show predictive value(0.391). One plausible scenario to explain the predictivevalue of normal mucosa spectra for lymph node involve-ment is that paracrine/inflammatory mechanisms, invol-ving proximal affected lymph nodes, may inducechanges to the microenvironment of tumour-adjacentmucosa.As an essential pre-requisite for marker validation, it
would be highly desirable in future studies to determinethe identities of candidate marker peaks in tumour tis-sue that discriminate different histological differentiationstages and predict disease recurrence. Our findings alsoindicate that similar studies using the alternativeapproach of liquid chromatography coupled to tandemmass spectrometry (LC-MS/MS) in CRC are warranted.
ConclusionsIn summary, our study has shown that direct proteinexpression profiling of surgically resected CRC tissue byMALDI-TOF mass spectrometry has potential value instudies aimed at improved molecular classification ofthis disease. Further studies, with longer follow-up timesand larger patient cohorts, that would permit indepen-dent validation of predictive models, would be requiredto confirm the predictive value of tumour spectra fordisease recurrence/patient survival.
Additional material
Additional file 1: Examples of raw MALDI-TOF spectral profiles.Illustrative examples shown for 2012NM and 020T
Additional file 2: Summary of marker peaks discriminating tumourfrom normal mucosa. Compilation of m/z values, ranking and statisticsfor 73 marker peaks.
Additional file 3: Performance of predictive model fordiscriminating tumour and normal mucosa. Summary of results ofoptimised k-NN algorithm on an independent test dataset.
Additional file 4: Performance of model for predicting poordifferentiation based on tumour spectra. Summary of results of ‘leave-one-out’ cross-validation k-NN algorithm.
Additional file 5: Performance of model for predicting diseaserecurrence based on tumour spectra. Summary of results of ‘leave-one-out’ cross-validation k-NN algorithm.
Additional file 6: Performance of model for predicting lymph nodeinvolvement based on mucosa spectra. Summary of results of ‘leave-one-out’ cross-validation k-NN algorithm.
Table 3 Performance of predictive models for classification of clinico-pathological characteristics in normal mucosa tissue
CHARACTERISTICS 1Advanced Dukes’stage
Poorly differentiated Lymph nodeinvolvement
Invasiveness 2Disease recurrence
Number of features 7 5 3 6 7
Positive prediction rate 8/13 8/14 11/14 3/7 0/5
Sensitivity 0.615 0.571 0.786 0.429 0.0003CI 0.322-0.849 0.296-0.812 0.488-0.943 0.116-0.798 0.000-0.537
Positive predictive value 0.500 0.444 0.733 0.500 0.000
CI 0.255-0.749 0.224-0.686 0.448-0.911 0.139-0.860 0.000-0.945
Negative prediction rate 12/20 9/19 15/19 23/26 25/26
Specificity 0.600 0.474 0.789 0.885 0.962
CI 0.364-0.800 0.252-0.705 0.539-0.930 0.687-0.970 0.784-0.998
Negative predictive value 0.706 0.600 0.833 0.852 0.833
CI 0.440-0.886 0.329-0.825 0.577-0.956 0.654-0.951 0.645-0.937
Absolute error 0.394 0.485 0.212 0.212 0.1944ROC error 0.392 0.477 0.212 0.343 0.519
Fisher’s exact test P = 0.139 P = 0.267 P = 0.001 P = 0.082 P = 0.8391Includes Dukes’ C1 and C2; 2 Median follow-up time for recurrent disease patients: 33 months; median follow-up time for disease-free patient: 27 months(analysis excludes patients who died through surgical complications - see Table 1); 3CI = 95% confidence interval; 4ROC = receiver-operator characteristics
The KNN algorithm [29] was used in ‘leave-one-out’ cross-validation prediction with the number of features (marker peaks) specified. Marker peaks were selectedusing a t-test statistic except for lymph node involvement and invasiveness characteristics of tumour tissue where the SNR test statistic was used.
Liao et al. BMC Cancer 2010, 10:410http://www.biomedcentral.com/1471-2407/10/410
Page 10 of 11

AcknowledgementsThe authors acknowledge the financial support of the Royal College ofSurgeons of England for this work and the contribution of Mr James Wrightin preliminary experiments and of Mr Nikhil Pawa for assistance in collatingpatient follow-up data.
Author details1Department of Biological Sciences, University of Essex, Wivenhoe Park,Colchester, Essex CO4 3SQ UK. 2ICENI Centre, Department of Surgery,Colchester Hospital University NHS Foundation Trust, Turner Road,Colchester, Essex CO4 5JL UK.
Authors’ contributionsCCLL collected specimens, processed all samples and collated and analyseddata. NW collected specimens and collated data. SM and TA contributed tothe study design and in arrangements for specimen collection. JDNcontributed to the study design, mass spectrometry and data analysis andwrote the manuscript. All authors have read and approved the finalmanuscript.
Competing interestsThe authors declare that they have no competing interests.
Received: 2 December 2009 Accepted: 6 August 2010Published: 6 August 2010
References1. Weitz J, Koch M, Debus J, Hohler T, Galle PR, Buchler MW: Colorectal
cancer. Lancet 2005, 365:153-165.2. Jemel A, Seigel R, Ward E, Murray T, Xu J, Thun MJ: Cancer statistics 2007.
CA Cancer J Clin 2007, 57:43-46.3. Hind R, Rew DR, Johnson CD: Surgical excision alone is adequate for
treatment for primary colorectal cancer. Annals of the Royal College ofSurgeons of England 1992, 74:63-67.
4. Andre T, Boni C, Mounedji-Boudiaf J, Navarro M, Tabernero J, Topham C,Zaninelli M, Clingan P, Bridgewater J, Tabah-Fisch I, Gramont A: Oxaliplatin,fluorouracil and leucovorin as adjuvant treatment for colon cancer. NewEngland Journal of Medicine 2004, 350:2343-2351.
5. Goldberg RM, Rothenberg ML, Can Cutsem E, Benson AB, Blanke CD,Diasio RB, Grothey A, Ramanathan RK, Wickham R, Armstrong D, Viele C:The continuum of care: a paradigm for the management of metastaticcolorectal cancer. Oncologist 2007, 12:38-50.
6. Doillard JY, Bennouna J: Adjuvant chemotherapy for colon cancer: aconfusing arena! Annals of Oncology 2005, 16:1853-1854.
7. Compton CC, Greene FL: The staging of colorectal cancer: 2004 andbeyond. CA Cancer J Clin 2004, 54:295-308.
8. Walther A, Johnstone E, Swanton C, Midgley R, Tomlinson I, Kerr D: Geneticprognostic and predictive markers in colorectal cancer. Nat Rev Cancer2009, 7:489-499.
9. Duffy MJ, Van Dalen A, Haglund C, Hansson L, Holinski-Feder E, Klapdor R,Peltomaki P, Sturgeon C, Topolcan O: Tumour markers in colorectalcancer: European Group on Tumour Markers (EGTM) guidelines forclinical use. Eur J Cancer 2007, 43:1348-1360.
10. Shankaran V, Wisinski KB, Mulcahy MF, Benson AB: The role of molecularmarkers in predicting response to therapy in patients with colorectalcancer. Mol Diag Ther 2008, 12:87-98.
11. Philips J, Wang R, Marwah S, Silver M, Tzardi M, Silver J, Ogino S,Hooshmand S, Kwak E, Freed E, Meyerhardt JA, Saridaki Z, Georgoulias V,Finkelstein D, Fuchs CS, Kulke MH, Shivdasani RA: Common mutationslinked to adverse colorectal cancer outcomes. Br J Cancer 2009,101:465-472.
12. Sartore-Bianchi A, Di Nicolantonio F, Nichelatti M, Molinari F, De Dosso S,Saletti P, Martini M, Cipani T, Marrapese G, Mazzucchelli L, Lamba S,Veronese S, Frattini M, Bardelli A, Siena S: Multi-determinants analysis ofmolecular alterations for predicting clinical benefit to EGFR-targetedmonoclonal antibodies in colorectal cancer. PLoS One 2009, 4:e7287.
13. Nannini M, Pantaleo MA, Maleddu A, Astolfi A, Formica S, Biasco G: Geneexpression profling in colorectal cancer using microarray technologies:Results and perspectives. Cancer Treatment Reviews 2009, 35:201-209.
14. Leung SY, Sohn JJ, Zanetti KA, Bowman ED, Yanaihara N, Yuen ST, Chan TL,Kwong DLW, Au GKH, Liu CG, Calin GA, Croce CM, Harris CC: MicroRNA
expression profiles associated with prognosis and therapeutic outcomein colon adenocarcinoma. JAMA 2008, 299:425-436.
15. Derijks-Engwegen JYMN, Cats A, Smits ME, Schellens JHM, Neijnen JH:Improving colorectal cancer management: the potential of proteomics.Biomarkers in Medicine 2008, 2:253-289.
16. Kuramitsu Y, Nakamura K: Proteomic analysis of cancer tissues: sheddinglight on carcinogenesis and possible biomarkers. Proteomics 2006,6:5650-5661.
17. Palmblad M, Tiss A, Cramer R: Mass spectrometry in clinical proteomics -from the present to the future. Proteomics Clin Appl 2009, 3:6-17.
18. Au JSK, Cho WCS, Yip T-T, Law SCK: Proteomic approach to biomarkerdiscovery in cancer tissue from lung adenocarcinoma among non-smoking Chinese women in Hong Kong. Cancer Invest 2008, 26:128-135.
19. Sanders ME, Dias EC, Xu BJ, Mobley JA, Billheimer D, Roder H, Grigorieva J,Dowset M, Arteaga CL, Caprioli RM: Differentiating proteomic biomarkersin breast cancer by laser capture microdissection and MALDI MS. JProteome Research 2008, 7:1500-1507.
20. Roesch-Ely M, Nees M, Karsai S, Ruess A, Bogumil R, Warnken U,Schnolzer M, Dietz A, Plinkert PK, Hofele C, Bosch FX: Proteomic analysisreveals successive aberrations in protein expression from healthymucosa to invasive head and neck cancer. Oncogene 2007, 26:54-64.
21. Melle C, Ernst G, Schimmel B, Bleul A, Mothes H, Kaufmann R,Settmacher U, Von Eggeling F: Different expression of calgizzarin(S100A11) in normal colonic epithelium, adenoma and colorectalcarcinoma. Int J Oncol 2006, 28:195-200.
22. Polley ACJ, Mulholland F, Pin C, Williams EA, Bradburn DM, Mills SJ,Mathers JC, Johnson IT: Proteomic analysis reveals field-wide changes inprotein expression in the morphologically normal mucosa of patientswith colorectal cancer. Cancer Res 2006, 66:6553-6562.
23. Xiang F, Beavis RC: Growing protein-doped sinapic acid crystals for laserdesorption: an alternative preparation method for difficult samples.Organic Mass Spectrom 1993, 28:1424-1429.
24. Wong JWH, Cagney G, Cartwright HM: SpecAlign - processing andalignment of mass spectra datasets. Bioinformatics 2005, 21:2088-2090.
25. Wong JWH, Durante C, Cartwright HM: Application of fast FourierTransform Cross-Correlation for the alignment of large chromatographicand spectral datasets. Anal Chem 2005, 77:5655-5661.
26. Whistler T, Rollin D, Vernon SD: A method for improving SELDI-TOF massspectrometry data quality. Proteome Science 2007, 5:14.
27. Reich M, Liefeld T, Gould J, Lerner J, Tamayo P, Mesirov JP: GenePattern2.0. Nat Genet 2006, 38:500-501.
28. Gould J, Getz G, Monti S, Reich M, Mesirov JP: Comparative gene markerselection suite. Bioinformatics 2006, 22:1924-1925.
29. Golub TR, Slonim DK, Tamayo P, Huard C, Gaasenbeek M, Mesirov JP,Coller H, Loh ML, Downing JR, Calgiuri MA, Bloomfield CD, Lander ES:Molecular classification of Science: class discovery and class predictionby gene expression profiling. Science 1999, 286:531-537.
30. Benjamini Y, Hochberg Y: Controlling the false discovery rate: a practicaland powerful approach to multiple testing. Journal of the Royal StatisticalSociety: Series B (Methodological) 1995, 57:289-300.
31. Belshaw NJ, Elliot GO, Foxall RJ, Dainty JR, Pal N, Coupe A, Garg D,Bradburn DM, Mathers JC, Johnson IT: Profiling CpG island fieldmethylation in both morphologically normal and neoplastic humancolonic mucosa. Br J Cancer 2008, 99:136-142.
32. Barrier A, Boelle P-Y, Lemoine A, Tse C, Brault D, Chiappini F, Lacaine F,Houry S, Huguier M, Flahault A, Dudoit S: Gene expression profiling ofnonneoplastic mucosa may predict clinical outcome of colon cancerpatients. Dis Colon Rectum 2005, 48:2238-2248.
33. Hoshida Y, Villanueva A, Kobayashi M, Peix J, Chiang DY, Camargo A,Gupta S, Moore J, Wrobel MJ, Lerner J, Reich M, Chan JA, Glickman JN,Ikeda K, Hashimoto M, Watanabe G, Daidone MG, et al: Gene expression infixed tissues and outcome in hepatocellular carcinoma. New Eng J Med2008, 359:1995-2004.
Pre-publication historyThe pre-publication history for this paper can be accessed here:http://www.biomedcentral.com/1471-2407/10/410/prepub
doi:10.1186/1471-2407-10-410Cite this article as: Liao et al.: Mass spectrometry protein expressionprofiles in colorectal cancer tissue associated with clinico-pathologicalfeatures of disease. BMC Cancer 2010 10:410.
Liao et al. BMC Cancer 2010, 10:410http://www.biomedcentral.com/1471-2407/10/410
Page 11 of 11