masers associated with high-mass star formation regions in the
TRANSCRIPT

arX
iv:1
001.
2169
v1 [
astr
o-ph
.GA
] 1
3 Ja
n 20
10
Mon. Not. R. Astron. Soc. 000, 000–000 (0000) Printed 13 January 2010 (MN LATEX style file v2.2)
Masers associated with high-mass star formation regions in
the Large Magellanic Cloud
S. P. Ellingsen,1,2⋆ S. L. Breen,1,3 J. L. Caswell,3 L. J. Quinn,4 G. A. Fuller4
1 School of Mathematics and Physics, University of Tasmania, Private Bag 37, Hobart, Tasmania 7001, Australia2 Max Planck Institut fur Radioastronomie, Auf dem Hugel 69, 53121 Bonn, Germany3 Australia Telescope National Facility, CSIRO, PO Box 76, Epping, NSW 1710, Australia4 Jodrell Bank Centre for Astrophysics, Alan Turing Building, School of Physics and Astronomy, The University of Manchester,
Oxford Road, Manchester M13 9PL
13 January 2010
ABSTRACT
We report the results of a sensitive search for 12.2-GHz methanol maser emissiontowards a sample of eight high-mass star formation regions in the Large MagellanicClouds which have been detected in other maser transitions. We detected one sourcetowards the star formation region N105a. This is the first detection of a 12.2-GHzmethanol maser outside our Galaxy. We also made near-contemporaneous observationsof the 6.7-GHz methanol and 22-GHz water masers towards these sources, resultingin the detection of water maser emission in six new sources, including one associatedwith the strongest 6.7-GHz maser in the Magellanic Clouds IRAS05011-6815. Themajority of the maser sources are closely associated with objects identified as likelyYoung Stellar Objects (YSO) on the basis of Spitzer Space Telescope observations.We find that the YSOs associated with masers tend to be more luminous and haveredder infrared colours than the sample as a whole. SED modeling of the YSOs showsthat the masers are associated with sources of higher central mass, total luminosityand ambient density than the majority of YSOs in the LMC. This is consistent withthe well-established relationship between luminous methanol and water masers andyoung, high-mass objects observed in the Galaxy.
Key words: masers – stars:formation – galaxies:Magellanic Clouds – ISM: molecules
1 INTRODUCTION
The Magellanic Clouds represent a unique laboratory forstudying star formation in an environment which differsfrom that of our Galaxy. They are nearby (in comparisonto most other galaxies), at distances of approximately 50and 60 kpc respectively for the Large and Small Magel-lanic Clouds (Feast 1999; Walker 1999). This enables themto be studied with intrinsically high sensitivity and resolu-tion. The relative star formation rates in both the LargeMagellanic Cloud (LMC) and the Small Magellanic Cloud(SMC) are greater than in the Milky Way, but the metal-licity is significantly lower (Russell & Dopita 1992). Theseconditions are thought to be similar to those in larger galax-ies earlier in the history of the Universe. Hence studies ofstar formation in the Magellanic Clouds can yield insightsinto star formation at redshifts of z > 1.
⋆ Email: [email protected]
Interstellar masers are excellent signposts of high-massstar formation in the Milky Way. They are intense and oc-cur at wavelengths that are not significantly absorbed byintervening clouds of gas and dust (Green et al. 2009). Thefirst complete survey of the LMC and SMC was recentlyundertaken in the 6.7-GHz transition of methanol and the6.035-GHz transition of OH (Green et al. 2008). The survey,made with the methanol multibeam receiver on the Parkestelescope, had a 1-σ sensitivity of 0.13 Jy and 0.09 Jy overthe entire SMC and LMC respectively (the extent of bothClouds, as defined by the CO and/or Hi emission). The re-gion of the LMC containing the bulk of the CO emission andall the previously known masers were surveyed to a better1-σ sensitivity of approximately 60 mJy. Despite this com-prehensive and sensitive search only four 6.7-GHz methanolmasers have been discovered in the LMC (Sinclair et al.1992; Ellingsen et al. 1994; Beasley et al. 1996; Green et al.2008). Taking into account the relative rates of high-massstar formation in the two systems, this is a factor of 4–5 lower
2 Ellingsen et al.
than expected on the basis of the observed luminosity dis-tribution of Galactic 6.7-GHz methanol masers (Green et al.2008). In contrast, the number of detected ground-state OHand water masers is roughly consistent with the difference inthe star formation rates between the Milky Way and LMC.This discrepancy has been attributed to the lower metallic-ity of the LMC.
The current rate of high-mass star formation withinthe Magellanic clouds, and its relationship to the dynamicalinteraction of the clouds with the Milky Way, are a topicof active investigation. The Spitzer Space Telescope Legacyprogram SAGE (Surveying the Agents of a Galaxy’s Evolu-tion) has made observations of a number of nearby galaxies(including the LMC) to examine the current star forma-tion rate (Meixner et al. 2006). The unique association of6.7- and 12.2-GHz methanol masers with young, high-massstar forming regions has made them very useful signpostsof such regions within our Galaxy. A recent comparativestudy of 6.7- and 12.2-GHz methanol masers in the MilkyWay has shown that 12.2-GHz masers are preferentially as-sociated with more luminous 6.7-GHz sources (Breen et al.2009). Breen et al. also used their observations and com-parisons with published 1.2-mm dust continuum and mid-infrared data to start to quantify the maser evolutionaryscheme proposed by Ellingsen et al. (2007). They found thatthe 12.2-GHz methanol masers are associated with a laterevolutionary phase than those sources which show emissionfrom only the 6.7-GHz transition. The median ratio of thepeak flux density of the 12.2- to the 6.7-GHz transitionswas found to be 1:5.9, similar to previous studies. It wasalso shown that the ratio depends on luminosity (and henceage), increasing as the luminosity of the 6.7-GHz emissionincreases (see Fig. 4 of Breen et al.)
In order to investigate whether the properties of 12.2-GHz methanol masers in the LMC differ from their Galacticcounterparts we have undertaken new, sensitive observationstowards known 6.7-GHz methanol and OH maser sourcesin the LMC. Ellingsen et al. (1994) searched for 12.2-GHzmethanol masers towards the two sources known at the timeN11 (MC18) and N105a (MC23), with 3-σ detection upperlimits of 0.1 and 0.3 Jy respectively. There are no publishedobservations at 12.2-GHz towards the two more recently dis-covered 6.7-GHz methanol masers in the LMC IRAS 05011-6815 and N160a (MC76), nor at the locations of any of theknown OH or water masers.
In contrast to methanol masers, the abundance of 22-GHz water masers in the Magellanic clouds appears to beconsistent with that observed in the Milky Way. This sug-gests that water masers may be more useful signposts ofyoung high-mass star formation regions within the LMC.In order to better characterize the properties of methanoland water masers in the LMC we have also made observa-tions of the 6.7-GHz methanol and 22-GHz water masersin the LMC which were nearly contemporaneous with our12.2-GHz search.
2 OBSERVATIONS & DATA REDUCTION
We have searched a sample of eight known maser regionsin the LMC for the presence of 12.2-GHz methanol masers.The sample included all known ground and excited-state OH
masers, 6.7-GHz methanol masers and 22-GHz masers in theMagellanic Clouds. Observations were carried out with theAustralia Telescope National Facility (ATNF) Parkes 64-mradio telescope during 2008 June 20–25. The observationswere made with the Ku-band receiver which detected twoorthogonal linear polarizations. It had typical system tem-peratures of 205 and 225 Jy for the respective polarizationsthroughout the observations. The Parkes multibeam correla-tor was configured to record 8192 spectral channels across a16-MHz bandwidth for each polarization. This correspondsto a velocity coverage of ∼290 km s−1 and after Hanningsmoothing, a spectral resolution of 0.08 km s−1. The Parkesradio telescope has RMS pointing errors of ∼10 arcsec andat 12.2-GHz the telescope has a half-power beam-width of1.9 arcmin.
All sources were observed at a fixed frequency of 12167-MHz (i.e. with no Doppler tracking), which alleviated therequirement for a unique reference observation to be madefor each of the source positions. The data were processedusing the same method as described in Breen et al. (2009),except that a running median of 50 channels (as opposedto 100 channels) was used to correct the spectrum baseline.The data were reduced using the ASAP (ATNF SpectralAnalysis Package). Alignment of velocity channels was car-ried out during processing. Absolute flux density calibrationwas achieved by observing PKSB1934-638 each day whichhas an assumed flux density of 1.825 Jy at 12167-MHz (Sault2003). Each of the fields was observed for 160–170 minutes,resulting in a typical RMS in the final spectrum (after Han-ning smoothing and averaging over polarizations and time)of 27 mJy and a corresponding 5-σ limit of 0.135 Jy. Theadopted rest frequency was 12.178597 GHz (Muller et al.2004).
The 6.7-GHz observations reported by Green et al.(2008) were made in 2006 June and September, approxi-mately 2 years prior to the 12.2-GHz observations reportedhere. As masers are known to be variable we undertook ad-ditional 6.7-GHz observations using the Parkes 64-m radiotelescope in 2008 August (< 2 months after the 12.2-GHzobservations) using the methanol multibeam receiver. Theobservations were made in MX mode, with 10 minutes per-beam on source toward each of the four known 6.7-GHzmethanol maser sites (see Green et al. (2009) for a detaileddescription of the system parameters). We recorded a 4 MHzbandpass for each beam, for each of two circular polariza-tions for both the 6.7-GHz methanol and the 6.035 MHzOH transitions. The spectra were produced by an autocor-relation spectrometer with 2048 spectral channels. The datawere not Hanning smoothed and the resulting velocity res-olution for the 6.7-GHz observations was 0.11 km s−1. Thisis very similar to the velocity resolution of the 12.2-GHz ob-servations. A fault with one of the beams (beam 3) meantthat its data had to be excluded, resulting in an on-sourceintegration time of 60 minutes per source.
The 22-GHz water maser observations were made withthe Australia Telescope Compact Array (ATCA) during2008 August 18,19, with the array in the 6B configuration.The observations were made in Director’s time allocationsand spanned approximately 7 hours on the first day and 5hours on the second day. A total of eight different pointingcentres were observed. These covered the locations of all the11 previously known star-formation maser sites in the LMC.

Masers in the LMC 3
The observing band was centred at a fixed frequency of22213 MHz. The correlator was configured with 1024 chan-nels across a 16 MHz bandwidth recording a single linearpolarization and also allowing measurement of continuumemission. The data were not smoothed, giving a velocityresolution of approximately 0.25 km s−1 and a usable veloc-ity range of approximately 195 km s−1. PKSB1934-638 wasused as the primary flux calibrator, which at this frequencyis assumed to have a flux density of 0.83 Jy (Sault 2003).Observations of PKSB0537-441 were used to calibrate thebandpass and PKSB0637-752 was used as the phase cali-brator. The observations were made as a series of 90 secondintegrations. These were regularly interleaved with obser-vations of the phase calibrator. In total, each source wasobserved 9 or 10 times over the two observing sessions re-sulting in an onsource time of 13.5 or 15 minutes per source.We also used the line-free spectral channels from the watermaser observations to search for continuum emission associ-ated with the star formation regions. The observations hadonly a 16-MHz bandwidth and thus were not very sensitive;however they do have higher spatial resolution than previousstudies of these regions. The typical RMS for the continuumimages was 0.2–0.3 mJy beam−1.
3 RESULTS
3.1 12.2-GHz methanol masers
The known LMC masers are contained in eight distinct fieldswhich were targets for a 12.2-GHz methanol maser search.Table 1 lists either the detected peak flux density and veloc-ity, or the 5-σ noise level in the final spectrum. A heliocen-tric velocity range of 120 – 450 km s−1 was observed for eachsource. The only source detected was N105a (MC23), whichcoincidentally was also the first 6.7-GHz methanol maserdetected in the LMC. The 12.2 GHz spectrum of N105a isshown in the upper panel of Fig. 1. The peak of the 12.2-GHz emission is 0.12 Jy (4.6-σ). As it is within the velocityrange of the 6.7-GHz emission, and is also apparent whenthe total 12.2-GHz dataset is split in half, or when the twopolarizations are examined independently, we are confidentthat it is a genuine detection.
Comparing our 12.2-GHz spectrum of N105a with the6.7-GHz emission observed in 2006 June (Green et al. 2008)shows that the 12.2-GHz peak coincides with the secondstrongest spectral peak in this source. Breen et al. (2009)found that for approximately 75 per cent of the sourceswhere they detected both 12.2- and 6.7-GHz emission thepeak of the two spectra occurred at the same velocity. Forthe remaining 25 per cent the 12.2-GHz peak coincidedwith a secondary 6.7-GHz feature. Although the associa-tion of the 12.2-GHz methanol maser with a secondary 6.7-GHz spectral feature is not unusual, it is also possible thatthe 6.7-GHz maser may have varied in the period betweenthe observations reported by Green et al. (June 2006) andthese observations. Comparison of the August 2008 6.7-GHzmethanol maser spectrum, with that shown in Fig. 3 ofGreen et al. (2008) shows no detectable variation over thetwo-year period between the observations. The observationsof the other known 6.7-GHz methanol masers in the LMCand the 6.035-GHz OH maser in N160a also show no sig-nificant changes in the absolute, or relative intensity of the
Figure 1. The top plot shows the 12.2-GHz emission in N105a.The maser peak is at 250.8 km s−1 (Heliocentric velocity frame),with a peak 4.6 times than of the RMS noise in the spectrum.The 12.2-GHz peak coincides in velocity with a secondary peakin the 6.7-GHz spectrum and a comparison of the two spectra isshown in the bottom plot with the 12.2-GHz emission shown asa solid line and the 6.7-GHz as a dashed line (NOTE: a reducedvelocity range is shown on the comparison plot to allow greaterdetail to be seen).
maser features compared to those published by Green et al.(see Figure 2).
3.2 Water maser observations
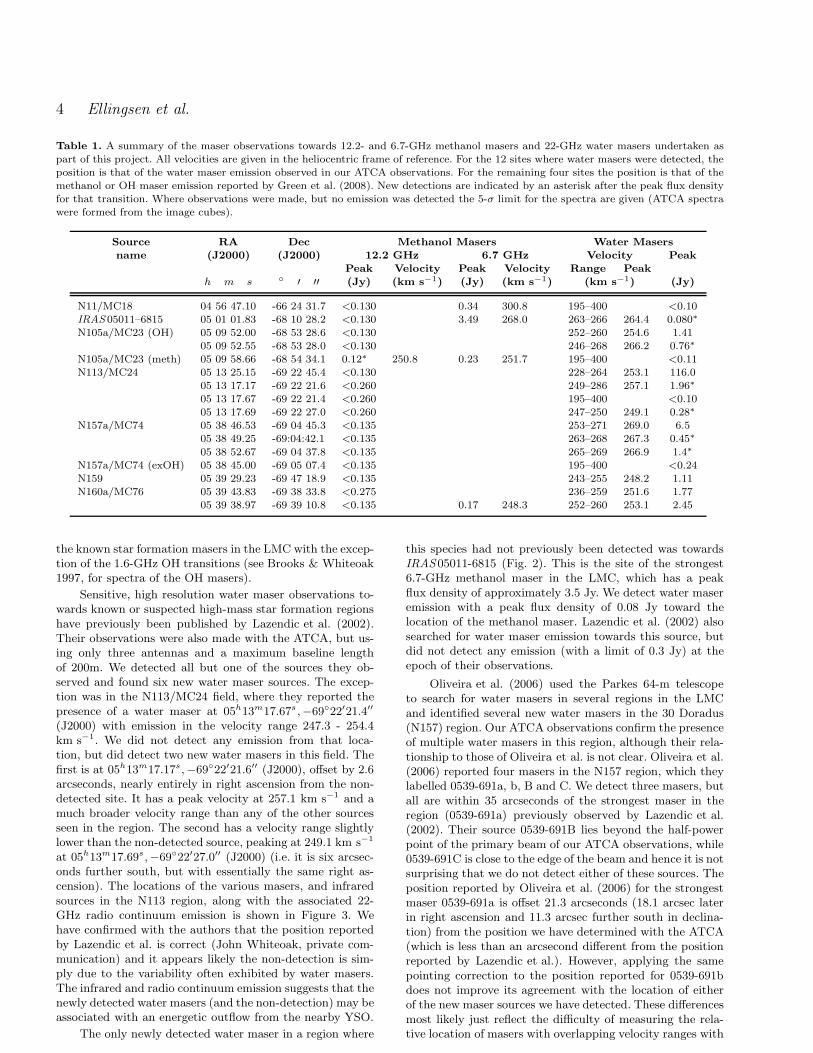
The current water maser observations are summarized in Ta-ble 1. The previously published searches for OH, water andmethanol masers in star formation regions in the LMC spana period of more than 25 years. As all the maser observationsreported in this paper were made within a 10 week periodbetween mid-June and the end of August 2008, they pro-vide the first near-contemporaneous observations of the ma-jority of star formation maser transitions in the LMC (onlythe ground-state OH masers were not observed). Figure 2shows the emission from the 6.7-GHz methanol, 6.035-GHzOH and 22-GHz water masers detected towards the knownstar formation maser sites in the LMC. This represents all
4 Ellingsen et al.
Table 1. A summary of the maser observations towards 12.2- and 6.7-GHz methanol masers and 22-GHz water masers undertaken aspart of this project. All velocities are given in the heliocentric frame of reference. For the 12 sites where water masers were detected, theposition is that of the water maser emission observed in our ATCA observations. For the remaining four sites the position is that of themethanol or OH maser emission reported by Green et al. (2008). New detections are indicated by an asterisk after the peak flux densityfor that transition. Where observations were made, but no emission was detected the 5-σ limit for the spectra are given (ATCA spectrawere formed from the image cubes).
Source RA Dec Methanol Masers Water Masersname (J2000) (J2000) 12.2 GHz 6.7 GHz Velocity Peak
Peak Velocity Peak Velocity Range Peakh m s ◦ ′ ′′ (Jy) (km s−1) (Jy) (km s−1) (km s−1) (Jy)
N11/MC18 04 56 47.10 -66 24 31.7 <0.130 0.34 300.8 195–400 <0.10IRAS 05011–6815 05 01 01.83 -68 10 28.2 <0.130 3.49 268.0 263–266 264.4 0.080∗
N105a/MC23 (OH) 05 09 52.00 -68 53 28.6 <0.130 252–260 254.6 1.4105 09 52.55 -68 53 28.0 <0.130 246–268 266.2 0.76∗
N105a/MC23 (meth) 05 09 58.66 -68 54 34.1 0.12∗ 250.8 0.23 251.7 195–400 <0.11N113/MC24 05 13 25.15 -69 22 45.4 <0.130 228–264 253.1 116.0
05 13 17.17 -69 22 21.6 <0.260 249–286 257.1 1.96∗
05 13 17.67 -69 22 21.4 <0.260 195–400 <0.1005 13 17.69 -69 22 27.0 <0.260 247–250 249.1 0.28∗
N157a/MC74 05 38 46.53 -69 04 45.3 <0.135 253–271 269.0 6.505 38 49.25 -69:04:42.1 <0.135 263–268 267.3 0.45∗
05 38 52.67 -69 04 37.8 <0.135 265–269 266.9 1.4∗
N157a/MC74 (exOH) 05 38 45.00 -69 05 07.4 <0.135 195–400 <0.24N159 05 39 29.23 -69 47 18.9 <0.135 243–255 248.2 1.11N160a/MC76 05 39 43.83 -69 38 33.8 <0.275 236–259 251.6 1.77
05 39 38.97 -69 39 10.8 <0.135 0.17 248.3 252–260 253.1 2.45
the known star formation masers in the LMC with the excep-tion of the 1.6-GHz OH transitions (see Brooks & Whiteoak1997, for spectra of the OH masers).
Sensitive, high resolution water maser observations to-wards known or suspected high-mass star formation regionshave previously been published by Lazendic et al. (2002).Their observations were also made with the ATCA, but us-ing only three antennas and a maximum baseline lengthof 200m. We detected all but one of the sources they ob-served and found six new water maser sources. The excep-tion was in the N113/MC24 field, where they reported thepresence of a water maser at 05h13m17.67s ,−69◦22′21.4′′
(J2000) with emission in the velocity range 247.3 - 254.4km s−1. We did not detect any emission from that loca-tion, but did detect two new water masers in this field. Thefirst is at 05h13m17.17s,−69◦22′21.6′′ (J2000), offset by 2.6arcseconds, nearly entirely in right ascension from the non-detected site. It has a peak velocity at 257.1 km s−1 and amuch broader velocity range than any of the other sourcesseen in the region. The second has a velocity range slightlylower than the non-detected source, peaking at 249.1 km s−1
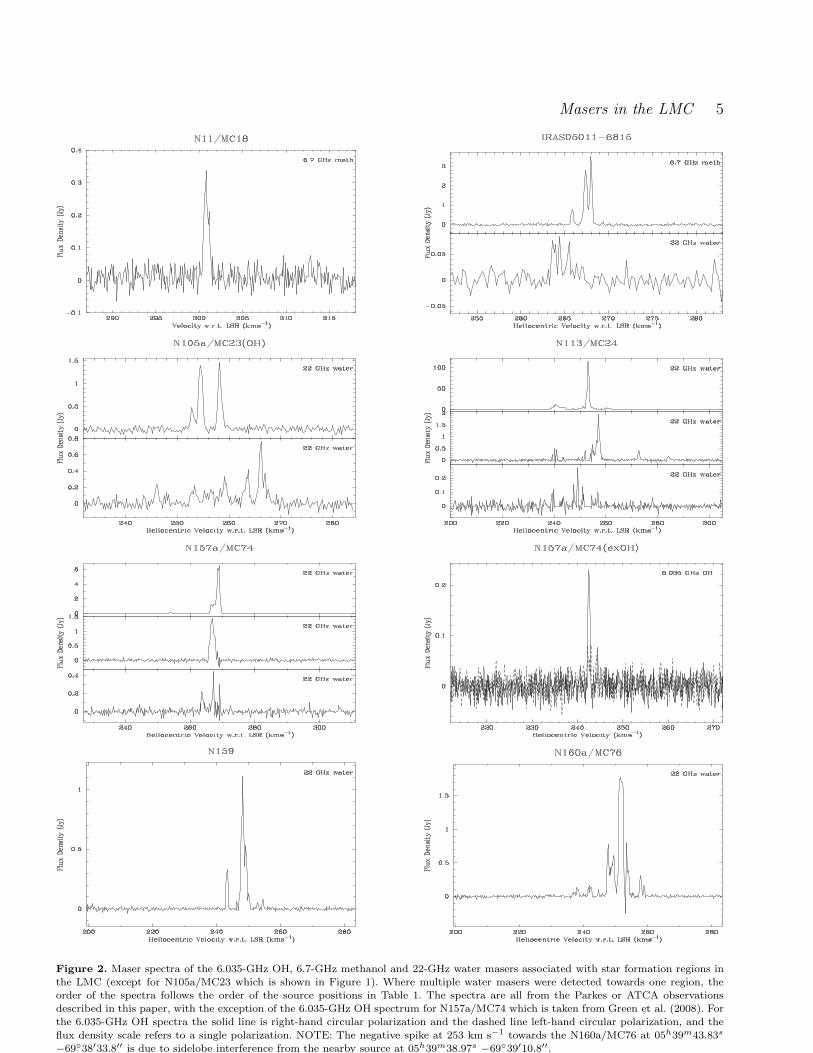
at 05h13m17.69s,−69◦22′27.0′′ (J2000) (i.e. it is six arcsec-onds further south, but with essentially the same right as-cension). The locations of the various masers, and infraredsources in the N113 region, along with the associated 22-GHz radio continuum emission is shown in Figure 3. Wehave confirmed with the authors that the position reportedby Lazendic et al. is correct (John Whiteoak, private com-munication) and it appears likely the non-detection is sim-ply due to the variability often exhibited by water masers.The infrared and radio continuum emission suggests that thenewly detected water masers (and the non-detection) may beassociated with an energetic outflow from the nearby YSO.
The only newly detected water maser in a region where
this species had not previously been detected was towardsIRAS 05011-6815 (Fig. 2). This is the site of the strongest6.7-GHz methanol maser in the LMC, which has a peakflux density of approximately 3.5 Jy. We detect water maseremission with a peak flux density of 0.08 Jy toward thelocation of the methanol maser. Lazendic et al. (2002) alsosearched for water maser emission towards this source, butdid not detect any emission (with a limit of 0.3 Jy) at theepoch of their observations.
Oliveira et al. (2006) used the Parkes 64-m telescopeto search for water masers in several regions in the LMCand identified several new water masers in the 30 Doradus(N157) region. Our ATCA observations confirm the presenceof multiple water masers in this region, although their rela-tionship to those of Oliveira et al. is not clear. Oliveira et al.(2006) reported four masers in the N157 region, which theylabelled 0539-691a, b, B and C. We detect three masers, butall are within 35 arcseconds of the strongest maser in theregion (0539-691a) previously observed by Lazendic et al.(2002). Their source 0539-691B lies beyond the half-powerpoint of the primary beam of our ATCA observations, while0539-691C is close to the edge of the beam and hence it is notsurprising that we do not detect either of these sources. Theposition reported by Oliveira et al. (2006) for the strongestmaser 0539-691a is offset 21.3 arcseconds (18.1 arcsec laterin right ascension and 11.3 arcsec further south in declina-tion) from the position we have determined with the ATCA(which is less than an arcsecond different from the positionreported by Lazendic et al.). However, applying the samepointing correction to the position reported for 0539-691bdoes not improve its agreement with the location of eitherof the new maser sources we have detected. These differencesmost likely just reflect the difficulty of measuring the rela-tive location of masers with overlapping velocity ranges with
Masers in the LMC 5
Figure 2. Maser spectra of the 6.035-GHz OH, 6.7-GHz methanol and 22-GHz water masers associated with star formation regions inthe LMC (except for N105a/MC23 which is shown in Figure 1). Where multiple water masers were detected towards one region, theorder of the spectra follows the order of the source positions in Table 1. The spectra are all from the Parkes or ATCA observationsdescribed in this paper, with the exception of the 6.035-GHz OH spectrum for N157a/MC74 which is taken from Green et al. (2008). Forthe 6.035-GHz OH spectra the solid line is right-hand circular polarization and the dashed line left-hand circular polarization, and the
flux density scale refers to a single polarization. NOTE: The negative spike at 253 km s−1 towards the N160a/MC76 at 05h39m43.83s
−69◦38′33.8′′ is due to sidelobe interference from the nearby source at 05h39m38.97s −69◦39′10.8′′.
6 Ellingsen et al.
Figure 2 – continued
Figure 3. The distribution of four water masers (crosses) in the N113 region. The strongest water maser in the LMC is located in thebottom left of this image, while the asterisk marks the location of the maser detected by Lazendic et al. (2002) which we did not detect.The three black circles mark the location of YSOs identified by Gruendl & Chu (2009). The greyscale image and contours both show the22 GHz radio continuum emission, the contours are at 3, 6 mJy beam−1.
Masers in the LMC 7
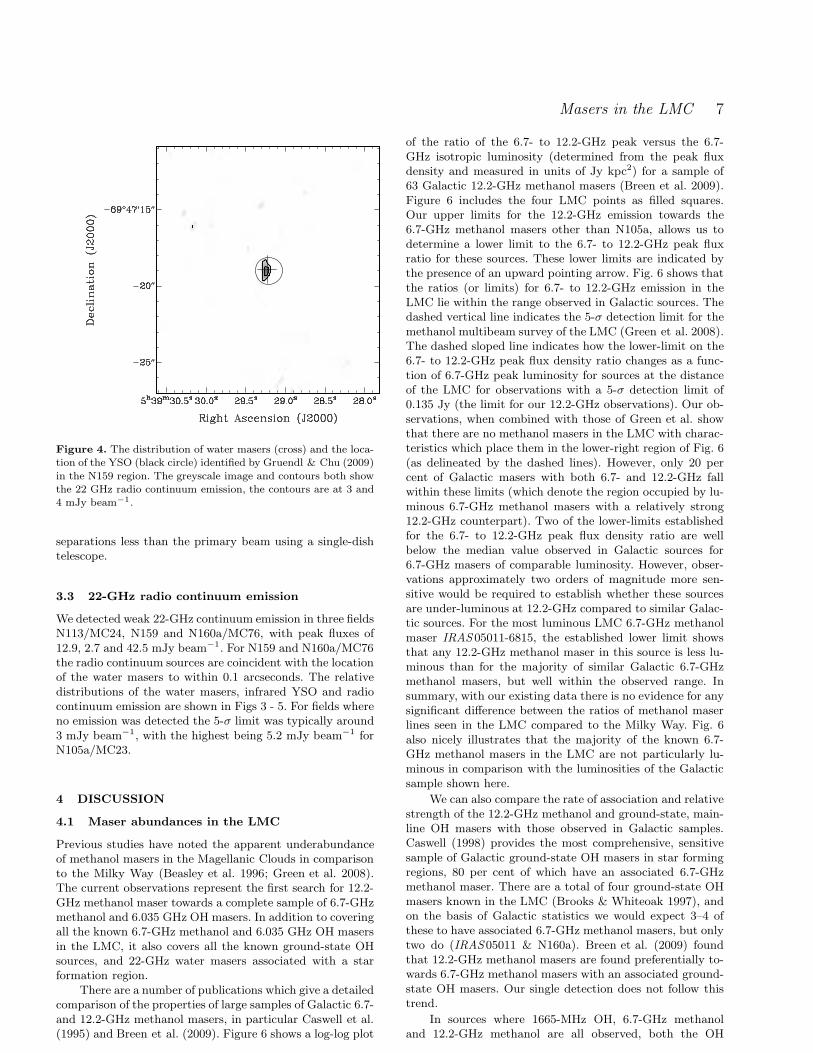
Figure 4. The distribution of water masers (cross) and the loca-tion of the YSO (black circle) identified by Gruendl & Chu (2009)
in the N159 region. The greyscale image and contours both showthe 22 GHz radio continuum emission, the contours are at 3 and4 mJy beam−1.
separations less than the primary beam using a single-dishtelescope.
3.3 22-GHz radio continuum emission
We detected weak 22-GHz continuum emission in three fieldsN113/MC24, N159 and N160a/MC76, with peak fluxes of12.9, 2.7 and 42.5 mJy beam−1. For N159 and N160a/MC76the radio continuum sources are coincident with the locationof the water masers to within 0.1 arcseconds. The relativedistributions of the water masers, infrared YSO and radiocontinuum emission are shown in Figs 3 - 5. For fields whereno emission was detected the 5-σ limit was typically around3 mJy beam−1, with the highest being 5.2 mJy beam−1 forN105a/MC23.
4 DISCUSSION
4.1 Maser abundances in the LMC
Previous studies have noted the apparent underabundanceof methanol masers in the Magellanic Clouds in comparisonto the Milky Way (Beasley et al. 1996; Green et al. 2008).The current observations represent the first search for 12.2-GHz methanol maser towards a complete sample of 6.7-GHzmethanol and 6.035 GHz OH masers. In addition to coveringall the known 6.7-GHz methanol and 6.035 GHz OH masersin the LMC, it also covers all the known ground-state OHsources, and 22-GHz water masers associated with a starformation region.
There are a number of publications which give a detailedcomparison of the properties of large samples of Galactic 6.7-and 12.2-GHz methanol masers, in particular Caswell et al.(1995) and Breen et al. (2009). Figure 6 shows a log-log plot
of the ratio of the 6.7- to 12.2-GHz peak versus the 6.7-GHz isotropic luminosity (determined from the peak fluxdensity and measured in units of Jy kpc2) for a sample of63 Galactic 12.2-GHz methanol masers (Breen et al. 2009).Figure 6 includes the four LMC points as filled squares.Our upper limits for the 12.2-GHz emission towards the6.7-GHz methanol masers other than N105a, allows us todetermine a lower limit to the 6.7- to 12.2-GHz peak fluxratio for these sources. These lower limits are indicated bythe presence of an upward pointing arrow. Fig. 6 shows thatthe ratios (or limits) for 6.7- to 12.2-GHz emission in theLMC lie within the range observed in Galactic sources. Thedashed vertical line indicates the 5-σ detection limit for themethanol multibeam survey of the LMC (Green et al. 2008).The dashed sloped line indicates how the lower-limit on the6.7- to 12.2-GHz peak flux density ratio changes as a func-tion of 6.7-GHz peak luminosity for sources at the distanceof the LMC for observations with a 5-σ detection limit of0.135 Jy (the limit for our 12.2-GHz observations). Our ob-servations, when combined with those of Green et al. showthat there are no methanol masers in the LMC with charac-teristics which place them in the lower-right region of Fig. 6(as delineated by the dashed lines). However, only 20 percent of Galactic masers with both 6.7- and 12.2-GHz fallwithin these limits (which denote the region occupied by lu-minous 6.7-GHz methanol masers with a relatively strong12.2-GHz counterpart). Two of the lower-limits establishedfor the 6.7- to 12.2-GHz peak flux density ratio are wellbelow the median value observed in Galactic sources for6.7-GHz masers of comparable luminosity. However, obser-vations approximately two orders of magnitude more sen-sitive would be required to establish whether these sourcesare under-luminous at 12.2-GHz compared to similar Galac-tic sources. For the most luminous LMC 6.7-GHz methanolmaser IRAS 05011-6815, the established lower limit showsthat any 12.2-GHz methanol maser in this source is less lu-minous than for the majority of similar Galactic 6.7-GHzmethanol masers, but well within the observed range. Insummary, with our existing data there is no evidence for anysignificant difference between the ratios of methanol maserlines seen in the LMC compared to the Milky Way. Fig. 6also nicely illustrates that the majority of the known 6.7-GHz methanol masers in the LMC are not particularly lu-minous in comparison with the luminosities of the Galacticsample shown here.
We can also compare the rate of association and relativestrength of the 12.2-GHz methanol and ground-state, main-line OH masers with those observed in Galactic samples.Caswell (1998) provides the most comprehensive, sensitivesample of Galactic ground-state OH masers in star formingregions, 80 per cent of which have an associated 6.7-GHzmethanol maser. There are a total of four ground-state OHmasers known in the LMC (Brooks & Whiteoak 1997), andon the basis of Galactic statistics we would expect 3–4 ofthese to have associated 6.7-GHz methanol masers, but onlytwo do (IRAS 05011 & N160a). Breen et al. (2009) foundthat 12.2-GHz methanol masers are found preferentially to-wards 6.7-GHz methanol masers with an associated ground-state OH masers. Our single detection does not follow thistrend.
In sources where 1665-MHz OH, 6.7-GHz methanoland 12.2-GHz methanol are all observed, both the OH

8 Ellingsen et al.
Figure 5. The distribution of two water masers (crosses), and the methanol masers (square) in the N160a region. The six black circlesmark the location of YSO identified by Gruendl & Chu (2009). The greyscale image and contours both show the 22 GHz radio continuumemission, the contours are at 9 and 26 mJy beam−1.
and 12.2-GHz methanol are, typically, significantly weakerthan the 6.7-GHz methanol masers (Caswell et al. 1995).Caswell et al. (1993) studied the relative intensity of 12.2-GHz methanol and ground-state OH lines in a sample of 173OH masers. They found a large scatter in the observed ratio,with a 12.2-GHz:OH median ratio of 5:1 for the 53 sourceswhere both transitions were detected, falling to 1:1 if 12.2-GHz non-detections were included in the sample. This sug-gests that where both transitions are observed the 12.2-GHzmethanol masers will usually be stronger.
The small sample size for all the different maser tran-sitions observed in the LMC, along with the wide range ofintensity ratios observed in Galactic samples does not allowus to draw any firm conclusions as to whether the proper-ties of the LMC masers differ from those seen our Galaxy.However, the absence of 12.2-GHz methanol masers towardssources with both 6.7-GHz methanol and ground-state OHmasers, and the rate of detected 6.7-GHz methanol towards
OH masers in the LMC are both consistent with the estab-lished trend for the Magellanic Clouds to have an under-abundance of methanol masers compared to the Galaxy.
Comparison of the relative rates of association betweenmethanol and water masers is more difficult because lesswork has been done on this in the Milky Way. At presentthere are no published large-scale unbiased water masersurveys to compare to the methanol maser surveys. How-ever, we note that this will change in the relatively nearfuture when the results of the H2O galactic Plane Survey(HOPS) are published (Walsh et al. 2008). However, un-til the results of HOPS are available, the only informationwe have comes from targeted searches of one transition to-wards the other (e.g. Szymczak et al. 2005; Xu et al. 2008).Szymczak et al. (2005) found a detection rate of approxi-mately 50 per cent for water masers towards known 6.7-GHzmethanol masers. Conversely Xu et al. (2008) detected 6.7-GHz methanol masers towards approximately 30 per cent of

Masers in the LMC 9
1 2 3 4
0.0
0.5
1.0
1.5
2.0
log(6.7−GHz peak luminosity)
log(
6.7−
GH
z/12
.2−
GH
z)
Figure 6. A plot of the ratio of the 6.7- to 12.2-GHz peakflux density versus the peak luminosity of the 6.7-GHz methanolmaser. The open circles are Galactic sources from Breen et al.(2009), the filled squares are the LMC measurements, with thosewhich are lower limits (i.e. all but N105a), indicated by upwardarrows. The solid line is the linear regression relationship between6.7-GHz peak luminosity and 6.7- to 12.2-GHz peak ratio deter-mined by Breen et al. for Galactic sources. The dashed verticalline represents the 5-σ detection limit for the methanol multi-beam survey of the LMC (assuming a distance of 50 kpc). Thedashed sloped line shows the lower-limit on 6.7- to 12.2-GHz fluxdensity ratio for these observations computed using the detectionlimit of the 12.2-GHz observations.
a sample of water masers. Our observations show that of thefour 6.7-GHz methanol masers in the LMC, two have an as-sociated water maser (IRAS 05011-6815 and N160a/MC76),a detection rate of 50 per cent. Including the six new watermasers we have detected, there are a total of thirteen watermasers associated with star formation in the LMC. Hencethe detection rate of 6.7-GHz methanol masers towards wa-ter masers is 15 per cent for the LMC, significantly lowerthan in the Galaxy and again consistent with the observedunder-abundance of methanol masers in the LMC.
4.2 Masers as star formation tracers
We have searched the Spitzer SAGE Infrared Array Cam-era (IRAC) point source catalogue and archive for sourceswithin 5 arcseconds of the maser positions. Four of the masersources were associated (separation less than 5 arcsec) withsources in the SAGE IRAC catalogue. These are listed inTable 2. Somewhat surprisingly none of these sources wereidentified as YSO candidates by Whitney et al. (2008) intheir catalogue of candidate young stellar objects. We haveexamined the Multiband Imaging Photometer (MIPS) 24-µm images from the SAGE program and find that all themaser sources are associated either with a point source(listed in Table 2), or are projected against more extendedmid-infrared emission.
Gruendl & Chu (2009) have independently searched forYSO candidates in the LMC. Their analysis, likewise, usedthe SAGE data, but also included a large amount of pub-lished and archival data from other wavelengths. We havecompared the positions of the interstellar masers in the LMCwith their catalogue and find that 11 of the 16 locationsare within 2 arcseconds of an object they have classified asa “definite” YSO. The sources without an associated YSOcandidate all lie in regions where there is a complex back-ground, or a bright source nearby (Robert Gruendl, privatecommunication). It is striking that the methods used byWhitney et al. (2008) and Gruendl & Chu (2009) to iden-tify YSOs in the LMC (with the bulk of the observationaldata in common) produce such very different results. ClearlyGruendl & Chu (2009) have been much more successful inidentifying the young, high-mass objects with which masersare associated.
We have compared the infrared properties of the maser-associated sources to those of the whole sample of definiteYSOs identified by Gruendl & Chu (2009) (their Table 9).Our initial examination of infrared colour-colour and colour-magnitude diagrams suggested that the maser-associatedYSOs tended to be brighter in all near and mid-infraredwavelength bands and generally have redder colours than thebulk of YSO candidates (Figure 7). This is consistent withthe maser-associated sources being more luminous and moredeeply embedded than the bulk of YSO candidates, and maybe useful for identifying regions of parameter space associ-ated with the rare, and highly sought youngest high-massstars. The discrimination of the maser-associated sources ismost clearly seen in the colour-magnitude diagrams, whichexplains why similar investigations undertaken with samplesof Galactic masers typically produce less conclusive results.For Galactic sources the broad range of distances to thesources adds additional scatter to the observed magnitudes,an effect which is difficult to correct for when the distances tomost sources are poorly known. For the [8.0] versus [4.5]-[8.0]colour-magnitude diagram the masers-associated sources allsatisfy the criteria [4.5]-[8.0] ≥ 2.5 and [8.0] ≤ 12.5-([4.5]-[8.0]). A total of 352 of the 855 YSOs meet these criteria.For the [3.6] versus [3.6]-[4.5] colour-magnitude diagram themaser-associated sources (with one exception) satisfy thecriteria [3.6]-[4.5] ≥ 0.5 and [3.6] ≥ 12.2+([3.6]-[4.5]) and atotal of 251 of the 855 YSOs in the LMC meet these crite-ria. The dashed lines in Fig. 7 indicate these criteria for eachcolour-magnitude diagram. Taking the union of the two setsresults in a total of 195 YSOs satisfying both sets of criteria(22 percent of the sample as a whole).
Recent statistical investigations of millimetre dustclumps with and without associated masers has enabled thedevelopment of models which predict the presence of a maseron the basis of the dust-clump properties (Breen et al. 2007,2009). These models also allowed some inferences to be madeabout the critical physical properties which determine thepresence of a maser. Motivated by the apparent differencesbetween those YSOs with, and those without masers in thecolour-magnitude diagrams we decided to undertake a sim-ilar investigation using the infrared photometric data com-piled by Gruendl & Chu (2009) for the sample of YSOs inthe LMC. We constructed boxplots for each of the nine wave-length bands available (J, H, K from the Two Micron AllSky Survey, 3.6, 4.5, 5.8 and 8.0 µm from IRAC and 24 and

10 Ellingsen et al.
Table 2. The association of known interstellar masers in the LMC with infrared sources from SAGE. NOTE: In the N113/MC24field 051317.69-692225.0 is more than 2 arcseconds away from two of the masers, and we have given these separations merely as usefulinformation.
Source Green SAGE Associations Gruendl & Chuname et al. IRAC MIPS Dist. YSO Association Dist. YSO
name ′′ Cand. ′′ Cand.
N11/MC18 LMCm01 j045647.25-662433.6 2.1 NIRAS 05011–6815 LMCm02 j050101.79-681028.8 j050101.83-681028.5 0.7,0.3 N 050101.80-681028.5 0.3 YN105a/MC23 (OH) LMCm03 j050952.04-685327.1 1.5 N 050952.26-685327.3 1.9 Y
j050952.04-685327.1 2.9 N 050952.26-685327.3 1.7 YN105a/MC23 (meth) LMCm04 j050958.51-685435.2 j050958.77-685436.6 1.3, 2.5 N 050958.52-685435.5 1.6 YN113/MC24 LMCm05 051325.09-692245.1 0.4 Y
051317.69-692225.0 4.4 YLMCm06 051317.69-692225.0 3.6 Y
051317.69-692225.0 2.0 YN157a/MC74 LMCm07
053849.27-690444.4 2.3 Y
053852.67-690437.5 0.3 YLMCm08 053845.15-690507.9 0.9 Y
N159 LMCm09 j053930.06-694720.5 j053929.45-694718.6 4.6, 1.2 N 053929.21-694719.0 0.1 YN160a/MC76 LMCm10 j053943.77-693833.4 0.5 N 053943.82-693834.0 0.2 Y
LMCm11 053939.02-693911.4 0.7 Y
−1 0 1 2 3 4 5
1412
108
64
[4.5]−[8.0]
[8.0
]
−1 0 1 2 3 4 5
1412
108
64
[4.5]−[8.0]
[8.0
]
x
x
x
xxxxxx
xx
−1 0 1 2 3 4 5
1412
108
64
[4.5]−[8.0]
[8.0
]
−1 0 1 2 3
1510
5
[3.6]−[4.5]
[3.6
]
−1 0 1 2 3
1510
5
[3.6]−[4.5]
[3.6
]
x
xx
xxx xx x
xx
−1 0 1 2 3
1510
5
[3.6]−[4.5]
[3.6
]
Figure 7. Colour-magnitude diagrams comparing the sample of definite YSOs in the LMC from Gruendl & Chu (2009) (black points),with the sub-sample of sources with an associated interstellar maser (red cross) and those sources within the maser fields withoutan associated maser (blue squares). The tendency for the maser-associated sources to be associated with more luminous and reddersources can clearly be seen. Gruendl & Chu (2009) used a [4.5]-[8.0] versus [8.0] colour-magnitude diagram as the initial basis for theirinvestigations. All the sources in their sample meet the criteria [4.5]-[8.0] > 2 and [8.0] < 14 - ([4.5]-[8.0]). The dashed lines in each plotindicate the region where most of the maser sources lie. For the left-hand plot this is [4.5]-[8.0] ≥ 2.5 and [8.0] ≤ 12.5-([4.5]-[8.0]) andfor the right-hand plot this is [3.6]-[4.5] ≥ 0.5 and [3.6] ≥ 12.2+([3.6]-[4.5]).
70 µm from MIPS) which show that in each of these wave-length bands the YSOs associated with masers tend to bemore luminous than the sample as a whole (Figure 8). Thephotometric data in Gruendl & Chu (2009) is only completefor the 4.5- and 8.0-µm bands, as these were used in the ini-tial selection of YSO candidates. While most sources have
measurements for all of the IRAC wavelength bands, thisis not the case for the 2MASS and MIPS data, especiallyfor the maser-associated YSOs. In order to objectively testwhether the maser-associated YSOs are more luminous thanthe sample as a whole we performed a t-test for each wave-length band to determine if the two groups have a different
Masers in the LMC 11
mean. The t-test returned a statistically significant result(> 95 per cent probability that the means of the two sam-ples are different) for each of the K-, 3.6-, 4.5-, 5.8-, 8.0- and24-µm bands which gave p-values of 0.03, 0.0003, 0.0004,0.0001, 0.0004 and 0.02 respectively. For the other wave-length bands the number of maser-associated YSO with ameasurement was in all but one case, less than half the sam-ple (of 11 sources), which prevented meaningful statisticalcomparisons from being undertaken.
We also investigated the infrared colours formed fromthe IRAC data. From the four wavelength bands six indepen-dent colours can be formed. The three colours which includedata from the 3.6-µm band all have a statistically differ-ent mean (as measured by a t-test) for the maser-associatedsources compared with the rest of the sample. The p-valuesfor the difference in the mean for the [3.6]-[8.0], [3.6]-[5.8]and [3.6]-[4.5] colours are 0.03, 0.03 and 0.01 respectively. Ineach case the maser-associated sources have a larger meancolour (they are “redder”), than the rest of the sample .
It would be desirable to fit a Binomial generalised linearmodel (GLM) to the infrared data to predict the propertiesof sources likely to be associated with a maser. However, inorder to undertake such modeling the only sources which canbe used are those where the presence or absence of a maseris well established, and which have data for all the parame-ters. For this reason, it was only practical to consider usingthe IRAC data for the GLM fitting as the data for the otherwavelength bands are much less complete. Of the 855 definiteYSO sources identified by Gruendl & Chu (2009) 814 haveobservations for all four IRAC wavelength bands. Unfortu-nately, the small number of detected methanol masers andthe targeted/incomplete nature of the water maser searchesmeant that for neither transition was GLM modeling prac-tical due to the small sample sizes.
Fig. 7 uses blue squares to represent those YSO within amaser field which do not have an associated maser. It is clearthat the majority of these sources have similar infrared prop-erties to the maser associated sources. This is in contrast toour findings when we compared the maser-associated YSOsto the rest of the sample. When we perform t-tests compar-ing those YSOs which fall within a maser field with the restof the sample we find a statistically significant difference be-tween the means of the two samples for all the infrared bandswith the exception of the MIPS 70 µm band (where there isinsufficient data in the YSO near a maser sample). In addi-tion to this, the p-values from the t-tests are in all cases lowerthan when comparing the masers associated YSOs with therest of the maser sample. This is likely to be because thepresence of a strong water maser signposts a young high-mass star formation region and since they form in clustersthere are likely to be other similar sources nearby. This isin contrast with most of the YSO sources, which differ sig-nificantly in their infrared properties from those associatedwith masers. They are likely to either be from more-evolvedregions or associated with low- or intermediate-mass starformation.
In summary, while we have established that there is astatistically significant difference between the infrared prop-erties of maser-associated YSOs compared to the whole sam-ple, the information we have on the presence or absence ofmasers is insufficient to enable us to undertake predictivestatistical modeling at the present time.
4.3 SED modeling
Colour-colour and colour-magnitude diagrams are useful foridentifying regions of parameter space which favour cer-tain types of objects. They are always subject to a de-gree of confusion however, due to overlaps in the colourranges of different types of objects (as nicely demonstratedby Gruendl & Chu 2009). In addition, they are often incom-plete (sources need measurements in each of three or fourwavelength bands to be included), or they do not utilize allthe available information (for sources where there are mea-surements in other wavebands). Fitting the spectral energydistribution (SED) of a source has the advantage that it canutilize all the available information for a particular source.We have used the online fitting SED tool of Robitaille et al.(2007) to investigate the SED’s of those YSOs associatedwith masers and also the properties of the other LMC YSOs.The SED’s are fitted to a grid of two-dimensional radiativetransfer models of YSOs consisting of a central star sur-rounded by an accreting disk and envelope (Robitaille et al.2006). The limitations inherent in the assumptions, imple-mentation and results of the model have been extensivelydiscussed in the literature (see for example Robitaille 2008;Grave & Kumar 2009) and we will not repeat them here.
In order to fit each of the 855 definite YSO sourcesof Gruendl & Chu (2009), we used an automated script topopulate the online fitting form with the infrared data anddownload the best-fit model parameters for each source. Wehave used the photometric measurements of Gruendl & Chu(2009) for each of the bands where they are available. Whenthere was no reported measurement for a particular wave-band we have assumed upper limits of 17.6, 16.9 and 16.1magnitudes for the J-, H- and Ks-band deep 2MASS ob-servations towards the LMC (Cutri et al. 2002) and upperlimits of 19.3 and 16.1 magnitudes for the IRAC 3.6- and 5.8-µm bands (the observations are complete in the other IRACbands due to the selection criteria) (Sewilo 2008). Whereno measurement was available for the MIPS 24- and 70-µmbands we chose not to use the upper limit values in the fit,as in many cases the sources are in regions of extended orsaturated emission at these wavelengths, rather than regionswith no emission. Following Robitaille et al. (2007) we haveassumed aperture sizes of 3 arcseconds for the 2MASS obser-vations, 5 arcseconds for IRAC observations, 10 arcsecondsfor MIPS 24 µm and 20 arcseconds for MIPS 70 µm. Weallowed the distance to vary between 48 and 52 kpc and thevisual extinction (along the line of sight) to vary between 0and 2 magnitudes (the mean value for the interstellar extinc-tion towards the LMC measured by Imara & Blitz (2007) is0.3 magnitudes). Fig. 9 shows some examples of the resultingSED fits for maser and non-maser associated YSOs.
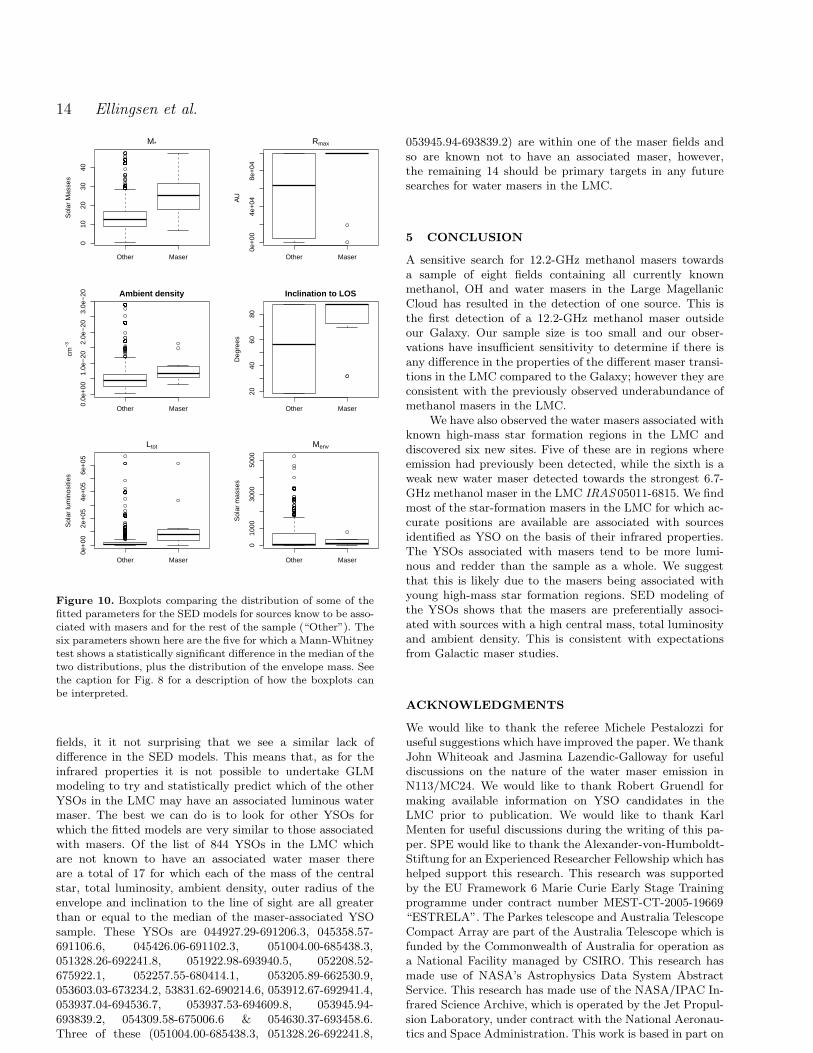
There are between seven and nine infrared intensitiesor upper limits available for each source and in most casesthe chi-squared for the resulting SED fits are reasonable.However, because of the large number of sources modeledwe have made no attempt to remove sources where this wasnot the case. Figure 10 shows the distribution of some ofthe SED model fit parameters for the YSOs associated withmasers compared to the other YSOs in the Gruendl & Chu(2009) sample. For most of the parameters there is a largerange present in both categories of YSO and in many casesthe distributions are highly skewed (e.g. the envelope mass

12 Ellingsen et al.
Other Maser
1715
1311
1.25 µm
Other Maser16
1412
1.65 µm
Other Maser
1513
11
2.2 µm
Other Maser
1412
108
3.6 µm
Other Maser
1412
108
4.5 µm
Other Maser12
108
6
5.8 µm
Other Maser
1210
86
4
8.0 µm
Other Maser
86
42
0
24 µm
Other Maser
42
0−
2
70 µm
Figure 8. Boxplots comparing the distribution of infrared intensity (magnitude) for various wavelength bands for sources known to beassociated with masers and for the rest of the sample (“Other”). The y-axis for each box plot gives the intensity in magnitudes. The solidline in the boxplot shows the median, the box shows the range between the 25th and 75th percentile, the vertical line from the top of thebox shows the range from the 75th percentile to the maximum value and the vertical line from the bottom of the box shows the rangefrom the 25th percentile to the minimum. Extreme values (outliers) are represented by dots and are defined as points that are separatedfrom the 25th or 75th percentiles by more than 1.5 times the interquartile range. We observe a statistically significant difference in themean of the maser and other distributions for all wavelength bands except 1.25 µm (J), 1.65 µm (H) and 70 µm.
shown in Fig. 10). For skewed distributions it is more ap-propriate to use the Mann-Whitney test to determine if thetwo samples have a different median, rather than the t-test(which compares the means). The Mann-Whitney test re-turns statistically significant results (p-value < 0.05) for fiveof the model parameters, the mass of the central star (0.001),the outer radius of the envelope (0.05), the ambient density
(0.01), the inclination to the line of sight (0.01) and the to-tal luminosity (0.0008). The inferences which can be drawnfrom these results is clear. The masers are associated withhigh-mass, luminous YSOs where the SED is dominated by alarge envelope and are located in regions where the ambientdensity is higher than in the vicinity of most YSOs.
The outer radius of the envelope and the inclination

Masers in the LMC 13
(a) (b)
(c) (d)
Figure 9. The SED and fitted models for two maser associated sources (a & b), a source with colours different from maser-associatedYSOs (c) and a YSO within a maser field (d). The circles represent measurements taken from Table 9 of Gruendl & Chu (2009), thetriangles are upper limits for 2MASS 6x and SAGE observations of the LMC. The best fit model is the solid black line and the grey
lines show other acceptable models (chi-squared values within 3 of the best fit model). The dashed line shows the spectrum of the stellarphotosphere as it would appear in the absence of circumstellar dust, but including interstellar extinction. The fitted mass of the centralobject and bolometric luminosity for each of these sources are (a) M=35.8M⊙ ; L = 1.26 × 10⁵L⊙ (b) M=28.9M⊙ ; L = 1.16 × 10⁵L⊙
(c) M=8.4M⊙ ; L = 3.45× 10³L⊙ (d) M=18.4M⊙ ; L = 9.34× 10⁴L⊙.
to the line of sight the results appear to be influenced bydetails of the modeling process. The maximum outer ra-dius of the envelope used by the model is 105 AU, and thatis the fitted value for 9 of the 11 maser-associated YSOs(compared to 360 of the other 844 sources). Essentially thisresult is consistent with the masers being associated withhigher mass objects, which would be expected to arise fromthe largest clumps/envelopes of gas and dust. Similarly forthe inclination angle the maximum value available in themodels is 87.13◦, and that is the fitted value for 7 of the11 maser-associated YSOs (compared to 252 of the other844 sources). Naively, it seems unlikely that geometry of thestar forming region should play a significant role in whetherwe see a luminous water maser associated with a particularsource and such a result is likely to be an artifact of themodeling process. However, water masers are typically asso-ciated with outflows and an outflow-axis near perpendicularto the line of sight will produce the maximum line-of-sightvelocity coherent path length and hence the most luminouswater masers. Robitaille et al. (2006) suggest that the in-clination angle is one of the most important parameters in
determining the SED for young objects, as it controls thecontribution from the inner, hotter regions of the envelopedue to orientation of the bipolar cavity. The preference forthe maser-associated YSOs to best fit models with high in-clination angles then means that there is little or no contri-bution from the inner regions in these SEDs. An alternativeinterpretation of these results would be that additional ob-scuring material is present for the highest mass YSOs incomparison to lower-mass objects.
We have compared the SED model parameters of themaser-associated YSOs with other YSOs in the maserfields. We applied the Mann-Whitney test for all of themodel parameters to compare these two samples and theonly statistically significant result (p-value 0.03) was for theinclination to the line of sight. The fact that the inclinationangle again shows a statistically significant difference war-rants further future investigation to determine whether itis an artifact of the modeling process, or if it has a physicalbasis. Since the SED model fits are based on the sameinfrared data for which we found no significant differencebetween the maser-associated YSOs and those in the maser
14 Ellingsen et al.
Other Maser
010
2030
40
M*
Sol
ar M
asse
s
Other Maser0e
+00
4e+
048e
+04
Rmax
AU
Other Maser
0.0e
+00
1.0e
−20
2.0e
−20
3.0e
−20 Ambient density
cm−3
Other Maser
2040
6080
Inclination to LOS
Deg
rees
Other Maser
0e+
002e
+05
4e+
056e
+05
Ltot
Sol
ar lu
min
ositi
es
Other Maser
010
0030
0050
00
Menv
Sol
ar m
asse
s
Figure 10. Boxplots comparing the distribution of some of thefitted parameters for the SED models for sources know to be asso-ciated with masers and for the rest of the sample (“Other”). Thesix parameters shown here are the five for which a Mann-Whitneytest shows a statistically significant difference in the median of thetwo distributions, plus the distribution of the envelope mass. Seethe caption for Fig. 8 for a description of how the boxplots canbe interpreted.
fields, it it not surprising that we see a similar lack ofdifference in the SED models. This means that, as for theinfrared properties it is not possible to undertake GLMmodeling to try and statistically predict which of the otherYSOs in the LMC may have an associated luminous watermaser. The best we can do is to look for other YSOs forwhich the fitted models are very similar to those associatedwith masers. Of the list of 844 YSOs in the LMC whichare not known to have an associated water maser thereare a total of 17 for which each of the mass of the centralstar, total luminosity, ambient density, outer radius of theenvelope and inclination to the line of sight are all greaterthan or equal to the median of the maser-associated YSOsample. These YSOs are 044927.29-691206.3, 045358.57-691106.6, 045426.06-691102.3, 051004.00-685438.3,051328.26-692241.8, 051922.98-693940.5, 052208.52-675922.1, 052257.55-680414.1, 053205.89-662530.9,053603.03-673234.2, 53831.62-690214.6, 053912.67-692941.4,053937.04-694536.7, 053937.53-694609.8, 053945.94-693839.2, 054309.58-675006.6 & 054630.37-693458.6.Three of these (051004.00-685438.3, 051328.26-692241.8,
053945.94-693839.2) are within one of the maser fields andso are known not to have an associated maser, however,the remaining 14 should be primary targets in any futuresearches for water masers in the LMC.
5 CONCLUSION
A sensitive search for 12.2-GHz methanol masers towardsa sample of eight fields containing all currently knownmethanol, OH and water masers in the Large MagellanicCloud has resulted in the detection of one source. This isthe first detection of a 12.2-GHz methanol maser outsideour Galaxy. Our sample size is too small and our obser-vations have insufficient sensitivity to determine if there isany difference in the properties of the different maser transi-tions in the LMC compared to the Galaxy; however they areconsistent with the previously observed underabundance ofmethanol masers in the LMC.
We have also observed the water masers associated withknown high-mass star formation regions in the LMC anddiscovered six new sites. Five of these are in regions whereemission had previously been detected, while the sixth is aweak new water maser detected towards the strongest 6.7-GHz methanol maser in the LMC IRAS 05011-6815. We findmost of the star-formation masers in the LMC for which ac-curate positions are available are associated with sourcesidentified as YSO on the basis of their infrared properties.The YSOs associated with masers tend to be more lumi-nous and redder than the sample as a whole. We suggestthat this is likely due to the masers being associated withyoung high-mass star formation regions. SED modeling ofthe YSOs shows that the masers are preferentially associ-ated with sources with a high central mass, total luminosityand ambient density. This is consistent with expectationsfrom Galactic maser studies.
ACKNOWLEDGMENTS
We would like to thank the referee Michele Pestalozzi foruseful suggestions which have improved the paper. We thankJohn Whiteoak and Jasmina Lazendic-Galloway for usefuldiscussions on the nature of the water maser emission inN113/MC24. We would like to thank Robert Gruendl formaking available information on YSO candidates in theLMC prior to publication. We would like to thank KarlMenten for useful discussions during the writing of this pa-per. SPE would like to thank the Alexander-von-Humboldt-Stiftung for an Experienced Researcher Fellowship which hashelped support this research. This research was supportedby the EU Framework 6 Marie Curie Early Stage Trainingprogramme under contract number MEST-CT-2005-19669“ESTRELA”. The Parkes telescope and Australia TelescopeCompact Array are part of the Australia Telescope which isfunded by the Commonwealth of Australia for operation asa National Facility managed by CSIRO. This research hasmade use of NASA’s Astrophysics Data System AbstractService. This research has made use of the NASA/IPAC In-frared Science Archive, which is operated by the Jet Propul-sion Laboratory, under contract with the National Aeronau-tics and Space Administration. This work is based in part on
Masers in the LMC 15
observations made with the Spitzer Space Telescope, whichis operated by the Jet Propulsion Laboratory, under contractwith the National Aeronautics and Space Administration.
REFERENCES
Beasley A. J., Ellingsen S. P., Claussen M. J., Wilcots E.,1996, ApJ, 459, 600
Breen S. L., Ellingsen S. P., Johnston-Hollitt M., Wother-spoon S., Bain I., Burton M. G., Cunningham M., Lo N.,Senkbeil C. E., Wong T., 2007, MNRAS, 377, 491
Breen S. L., Ellingsen S. P., Caswell J. L., Lewis B. E.,2009, MNRAS in press
Brooks K. J., Whiteoak J. B., 1997, MNRAS, 291, 395Caswell J. L., 1998, MNRAS, 297, 215Caswell J. L., Gardner F. F., Norris R. P., Wellington K. J.B., McCutcheon W. H., Peng R. S., 1993, MNRAS, 260,425
Caswell J. L., Vaile R. A., Ellingsen S. P., Norris R. P.,1995, MNRAS, 274, 1126
Cutri R. M. et al., 2002,“2MASS Explanitory Supplement”,(http://www.ipac.caltech.edu/2mass/releases/second/doc/explsup.html)
Ellingsen S. P., Whiteoak J. B., Norris R. P., Caswell J. L.,Vaile R. A., 1994, MNRAS, 269, 1019
Ellingsen S. P., Voronkov M. A., Cragg D. M., Sobolev A.M., Breen S. L., Godfrey P. D., 2007, IAU Symposium242, 213
Feast M., 1999, PASP, 111, 775Grave J. M. C., Kumar M. S. N., 2009, A&A, 498, 147Green J. A. et al., 2008, MNRAS, 385, 948Green J. A. et al., 2009, MNRAS, 392, 783Gruendl R. A., Chu Y.-H., 2009, ApJSS, in pressImara N., Blitz L., 2007, ApJ, 662, 969Lazendic J. S., Whiteoak J. B., Klamer I., Harbison P. D.,Kuiper T. B. H., 2002, MNRAS, 331, 969
Meixner, M. et al., 2006, AJ, 132, 2268Muller H. S. P., Menten K. M., Mader H., 2004, A&A, 428,1019
Oliveira J. M., van Loon J. Th., Stanomirvic S., Zijlstra A.A., 2006, MNRAS, 372, 1509
Robitaille T. P., 2008, ASPC, 387, 290Robitaille T. P., Whitney B. A., Indebetouw R., Wood K.,Denzmore P., 2006, ApJS, 167, 256
Robitaille T. P., Whitney B. A., Indebetouw R., Wood K.,2007, ApJS, 169, 328
Russell S. C., Dopita M. A., 1992, ApJ, 384, 508Sault R. J., 2003, “ATCA flux density scale at 12mm”,(http://www.atnf.csiro.au/observers/memos/AT39.3 124.pdf)
Sewilo M., 2008, “SAGE Data Description: Delivery 2”,(http://sage.stsci.edu/SAGE-LMC-deliv2.pdf)
Sinclair M. W., Carrad G. J., Caswell J. L., Norris R. P.,Whiteoak J. B., 1992, MNRAS, 256, 33
Szymczak M., Pillai T., Menten K. M., 2005, A&A, 434,613
Walker A., 1999, in Heck A., Caputo F., eds, Astrophys.Space Sci. Library, Vol 237, Post-Hipparcos Cosmic Can-dles. Kluwer Academic Publishers, Dordrecht, p. 125
Walsh A. J., Lo N., Burton M. G., White G. L., PurcellC. R., Longmore S. N., Phillips C. J., Brooks K. J., 2008,PASA, 25, 105
Whiteoak J. B., Gardner F. F., 1986, MNRAS, 222, 513Whitney B. A. et al., 2008, AJ, 136, 18Wong T., Whiteoak J. B., Ott J., Chin Y.-N., CunninghamM. R., 2006, ApJ, 649, 224
Xu Y., Reid M. J., Zheng X. W., Menten K. M., 2006, Sci,311, 54
Xu Y., Li J. J., Hachisuka K., Pandian J. D., Menten K.M., Henkel C., 2008, A&A, 485, 729