an extensive, sensitive search for sio masers in high-and
TRANSCRIPT

arX
iv:0
808.
3190
v1 [
astr
o-ph
] 2
3 A
ug 2
008
An Extensive, Sensitive Search for SiO Masers in High- and
Intermediate-Mass Star-Forming Regions
Luis A. Zapata1, Karl Menten1, Mark Reid2 and Henrik Beuther3
Received ; accepted
1Max-Planck-Institut fur Radioastronomie, Auf dem Hugel 69, 53121 Bonn, Germany
lzapata, [email protected]
2Harvard-Smithsonian Center for Astrophysics, 60 Garden Street, MS-42, Cambridge,
MA 02138 USA
3Max-Planck-Institut fur Astronomie, Konigstuhl 17, 69117 Heidelberg, Germany
– 2 –
ABSTRACT
We present sensitive Very Large Array observations with an angular resolution
of a few arcseconds of the J = 1 − 0 line of SiO in the v=1 and 2 vibrationally
excited states toward a sample of 60 Galactic regions in which stars of high or
intermediate mass are currently forming and/or have recently formed. We report
the detection of SiO maser emission in both vibrationally excited transitions
toward only three very luminous regions: Orion-KL, W51N and Sgr B2(M).
Toward all three, SiO maser emission had previously been reported, in Orion-KL
in both lines, in W51N only in the v = 2 line and in Sgr B2(M) only in the
v = 1 line. Our work confirms that SiO maser emission in star-forming regions
is a rare phenomenon, indeed, that requires special, probably extreme, physical
and chemical conditions not commonly found. In addition to this SiO maser
survey, we also present images of the simultaneously observed 7 mm continuum
emission from a subset of our sample of star-forming regions where such emission
was detected. This is in most cases likely to be free-free emission from compact-
and ultracompact-HII regions.
Subject headings: techniques: interferometric — techniques: spectroscopic — ISM:
molecules — radio continuum: ISM — radio lines: ISM
– 3 –
1. INTRODUCTION – HISTORY AND MOTIVATION
SiO maser emission has been detected toward more than a thousand asymptotic giant
branch (AGB) stars and a few red supergiants (RSGs; see, e.g., Benson et al. 1990; Habing
1996). These objects have luminosities larger than a few thousand of L⊙ (AGB stars) to
> 105 L⊙ (RSGs), which are comparable to the luminosities of intermediate- and high-mass
protostellar and young stellar objects. Nevertheless, toward forming and young stars SiO
maser emission seems to be very rarely observable.
Orion Kleinmann-Low (Orion-KL) was the first source in the sky toward which
SiO maser emission was found (in the v = 1, J = 2 − 1 line) by Snyder & Buhl (1974).
Subsequently, the first detections of the J = 1−0 line in the v = 1 and 2 states, also toward,
among others, Orion-KL, were made by Thaddeus et al. (1974) and by Buhl et al. (1974),
respectively. Toward the Orion-KL region, maser emission was also found in other SiO
lines (v = 1, J = 3− 2, Davis et al. 1974), including transitions from the vibrational ground
state (Tsuboi et al. 1996), but, at least to our knowledge, not from states with v > 2,
contrary to M-type stars. Moreover, maser lines from the 29SiO and 30SiO isotopomers
(Olofsson et al. 1981), and even the very rare 28Si18O were found (Cho et al. 2005). Never
detected, however, was the v = 2, J = 2 − 1 line. The latter line also remains undetected
in oxygen-rich (M-type) evolved stars, although it is found in S-type stars (in which O and
C abundances are equal). This behavior is explainable by the line’s pumping mechanism
(Olofsson et al. 1981). Since the discovery of SiO maser emission in the Orion-KL region
(Snyder & Buhl 1974), only two more high mass star-forming regions, W51N (= W51-IRS2)
and Sgr B2(M) (Hasegawa et al. 1986; Ukita et al. 1987) have been found to show this kind
of emission.
In the past, a number of surveys have been undertaken with the goal of finding SiO
masers in a larger number of star-forming regions. The number of sources surveyed for
– 4 –
which upper limits have been published is less than two dozen and these upper limits are
in the several Jy range (Jewell et al. 1985; Barvainis & Clemens 1984), barely sensitive
enough to potentially detect the W51N maser, and much too shallow to detect the ∼ 1
Jansky-strength maser in Sgr B2(M) (Hasegawa et al. 1986; Ukita et al. 1987).
Around luminous AGB stars/RSGs, SiO maser emission arises from a region of density
around a few times 108 and 109 cm−3 and temperature above 1000 K, which is within a
few stellar radii of the photosphere (Lockett & Elitzur 1992; Bujarrabal 1994). Given these
extreme requirements, one expects this emission to pinpoint in star-forming regions the
exact location of the embedded high-mass protostar that is exciting it, which frequently
is not easy to determine by other means (see discussion in Menten & Reid 1995). This
is certainly borne out by the best-studied SiO maser associated with a star formation
region, that in Orion-KL. Menten & Reid (1995), using simultanenous high resolution VLA
observations of the 43.2 GHz Orion-KL SiO maser and weak continuum emission (from
source-I), which they accurately register with a 3.8 µm speckle image, clearly showed that
at the position of “source-I” no infrared source is detected. Thus, all that is observed at
infrared wavelengths (i.e. the famous IRc2) is reprocessed radiation, while the position of
the continuum emission, which almost certainly comes from an ionized disk surrounding
the protostar, is right at the center of the SiO maser distribution (Reid et al. 2007). While
source-I clearly is self-luminous, as argued by Reid et al. (2007), it is unlikely to contribute
a significant faction of ∼ 105 L⊙ of the KL region.
The SiO maser in W51N seems to be different from that in Orion-KL, since it only
appeared to show maser emission in the 42.8 GHz v = 2, J = 1 − 0 line, while that in
Orion-KL shows emission in the v = 1 and 2 lines at comparable intensities. Morita et al.
(1992) located the W51N SiO maser in a dense compact molecular core mapped in NH3
emission by Ho et al. (1983) and Zhang & Ho (1997). Very Long Baseline Array (VLBA)
– 5 –
radio observations by Eisner et al. (2002) reveal a comparable linear extent to that observed
in Orion-KL. It is clear from the latter data that, while H2O masers (also imaged by Eisner
et al. 2002) trace a highly luminous region on a few arcsecond (few tenths of a parsec)
scales, only the SiO maser marks, as in Orion, the exact location of a self-luminous power
source.
Sub-milliarcsecond resolution VLBA observations show that the W51N SiO masers
may be tracing the limbs of an accelerating bipolar outflow close to the “dominant center”
(where are located most of the H2O, OH and SiO masers) (Eisner et al. 2002). No radio
continuum emission is detected toward this SiO maser. However, the radio emission from
Source-I would be completely undetectable at the distance of W51 (∼ 7 kpc).
Finally, little is known about the Sgr B2(M) SiO maser, from which only the v = 1
line had been found, except for the fact that it is located close to (but not coincident
with) the radio source F, which at high resolution splits into several compact sub-sources
(Gaume et al. 1995). As in W51N, the SiO maser is close to a compact clump of NH3
emission imaged by Vogel et al. (1987).
In this work, we present a sensitive search for SiO maser emission toward a sample of
60 high-mass star-forming regions using the Very Large Array. We report the detection
of such emission in both vibrationally exited transitions (v=1 and 2) and only toward
Orion-KL, W51N, and Sgr B2(M). This suggests that SiO maser emission is indeed a very
special physical phenomenon possibly only occurring within a short time period during the
formation of high-mass stars. Simultaneously, we obtained moderate sensitivity data of
those sources at 7 mm.
In §2 we introduce our sample and in §3 discuss the observations undertook in this
study. In §4 we present and discuss our SiO data and also our 7 mm continuum data.
– 6 –
2. THE SAMPLE
The 60 massive star-forming regions observed were selected from the sample of
69 high-mass protostellar objects of Sridharan et al. (2002) and the classical sample of
mid-infrared selected star-forming regions studied by Willner et al. (1982). The luminosities
of these sources mostly range from several times 103 to a few times 105 L⊙, which is
comparable to the range from Mira variable to the RSG that are commonly found in the
host stars of strong SiO masers. We note that the luminosities of the SiO masers in the
supergiants, i. e. VX Sgr or VY CMa, are typically 1 or 2 orders higher than those of
Miras and comparable or even higher than those of the Orion-KL SiO maser. In Table 1,
we summarize the main properties of the 60 objects selected.
3. OBSERVATIONS
The observations were made with the NRAO1 Very Large Array (VLA) between
2003 April 14 and May 1. Two intermediate frequency (IF) bands were employed: one
detecting right circular polarization, centered at 42.820555 GHz, the rest frequency of the
J = 1 − 0, v = 2 28SiO line; the other, detecting left circular polarization, was centered at
43.122039 GHz, the rest frequency of the J = 1− 0, v = 1 28SiO line. These rest frequencies
were calculated using the high accuracy molecular constants determined by Molla et al.
(1991).
Both IF bands of the VLA correlator were configured in line mode with 32 channels
covering 12.5 MHz, which provided 391 kHz (2.72 km s−1) resolution.
1The National Radio Astronomy Observatory is a facility of the National Science
Foundation operated under cooperative agreement by Associated Universities, Inc.

– 7 –
The integration time on each source was about 5 minutes. At this epoch, the VLA was
in its D configuration. The absolute flux density calibrator was 1331+305, for which we
adopted a flux density of 1.47 Jy. Amplitudes and phases were calibrated by observations
of compact extragalactic radio sources close in position to our program sources. In Table 2,
we present the list of the compact extragalactic radio sources used as secondary calibrators
and their bootstrapped flux densities.
The data were edited and calibrated in the standard manner using the software
packages AIPS and MIRIAD developed by the NRAO and BIMA2. Maps were obtained
using the AIPS task IMAGR and the MIRIAD tasks INVERT, CLEAN, and RESTORE.
For sources free of line emission, continuum maps were produced from “channel 0” data,
i.e., pseudo-continuum (u, v)-databases containing the inner 75% of the bandpass. For
the sources showing maser emission, the (u, v)-data channels free of line emission and not
affected by band edge were averaged and imaged. For most of the 7 mm continuum maps,
we used the ROBUST weighting parameter set to 0, for an optimal compromise between
sensitivity and angular resolution. However, for fainter sources we use ROBUST=5, which
corresponds to natural weighting, to achieve maximum sensitivity in each continuum image.
Finally, the strongest 7 mm continuum sources were self-calibrated in phase and amplitude.
The resulting rms noise of the line images was better than about 10 mJy beam−1 per
channel. In a few sources, it was higher due to unfavorable weather conditions and/or low
declinations. The results of the continuum imaging are discussed in §4.4.
2The Berkeley Illinois Maryland Association
– 8 –
4. RESULTS AND DISCUSSION
4.1. The SiO Maser Emission
In Table 1, we present the main results of our search for SiO masers in both
vibrationally excited (v=1 and 2) transitions toward the 60 high- and intermediate-mass
star forming regions. We detected SiO J = 1 − 0 maser emission in both the v = 1 and 2
lines above the 5-σ levels (or about 50 mJy) only toward Orion-KL, W51N, and Sgr B2(M).
4.2. Source-I
The SiO maser emission from both vibrationally excited transitions associated with
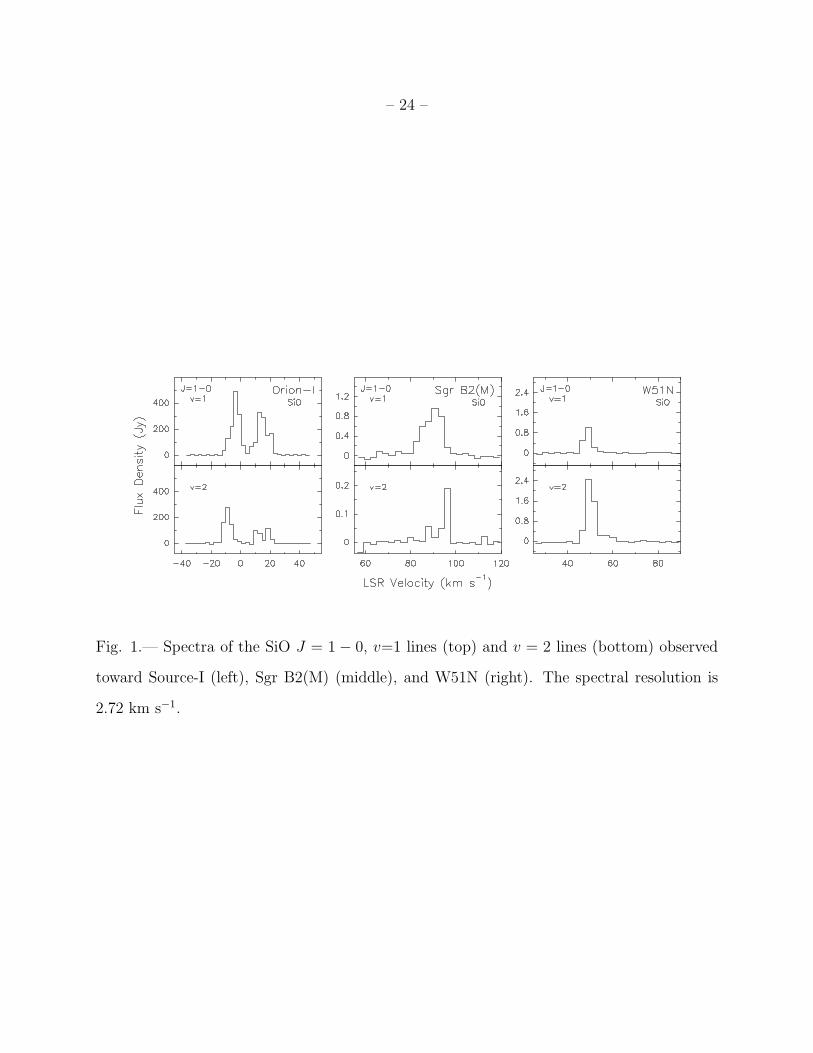
Orion-KL shows its characteristic double-peak profile centered near 6 km s−1 (the systemic
velocity of the molecular cloud core, see Figure 1). As already found in many previous
studies dating back to Snyder & Buhl (1974), two groups of features are observed, in the
[−14, +3] km s−1 and [+8, 23] km s−1 intervals, with little emission in between.
It is interesting to note that the flux density of the SiO maser emission toward the
sources Sgr B2(M) and Orion-KL in the v=1 vibrationally excited transition is stronger
than that in the v=2 transition, while in W51N the reverse is true (see Figure 1).
Finally, comparing the flux densities of the SiO maser emission in the Orion-KL, W51N
and Sgr B2(M), we have calculated that the SiO masers in Orion-KL are approximately one
order of magnitude more luminous than those in W51N and Sgr B2(M) (see Table 3).
– 9 –
4.2.1. The Nature of the SiO Emission
The SiO maser emission toward high-mass star forming regions has been associated
with powerful bipolar protostellar outflows (Greenhill et al. 1998; Eisner et al. 2002). VLBA
radio observations (with ∼ 1 mas resolution) of the Orion-KL SiO masers were consistent
with an origin in a wide-angle biconical flow (with a “X”-like pattern) with the SiO masers
outlining the limbs of the outflow cavity and centered on the source-I (Greenhill et al.
1998). More recent data, however, suggests that the SiO masers originate in the material
expelled from a rotating disk around “source I” (Greenhill et al. 2004; Reid et al. 2007).
4.3. W51N, Sgr B2(M), and Source-I
We found SiO J = 1−0 maser emission in both vibrationally excited transitions toward
W51N and Sgr B2(M) (see Figure 1).
Toward Sgr B2(M) the v=1 SiO maser emission shows a single peak that is redshifted
from the cloud systemic velocity (about 60 km s−1), has a linewidth of about 13 km s−1and
is centered at a vLSR of 87 km s−1. The v=2 transition only shows one redshifted very
narrow line centered at a vLSR of 96 km s−1. The latter line is unresolved with our 2.72
km s−1 resolution, and is atypically narrow for an SiO maser line. We are nevertheless
convinced of its reality as the emission arises from the same position as the v = 1 emission.
Toward W51N the v=1 SiO maser line is spread over 12 km s−1 and is centered near
vLSR = 50 km s−1, close to the systemic velocity of the molecular cloud core associated with
W51. The v=2 transition shows emission over 20 km s−1, centered at a similar velocity of
vLSR = 49 km s−1. Neither lines exhibit a double peak appearance.
In the W51N region, the SiO maser emission is tracing a high velocity (∼ 80 km s−1)
bipolar protostellar outflow with a size of about 104 AU that emanates from a molecular

– 10 –
core observed in NH3 (Morita et al. 1992) as discussed before. We note that in the case of
Sgr B2(M) the SiO maser emission only shows high velocity redshifted emission (∼ 30 km
s−1) emanating from a molecular NH3 core (Morita et al. 1992).
4.3.1. Variability
Toward two of our SiO maser associated with SFRs (Source-I and W51N) we see clear
signs of variability, but only for Source-I do extensive monitoring data exist. Comparing
the flux density of the SiO v = 1, J = 1 − 0 transition reported by Menten and Reid (1995)
toward Source-I with that measured by us (Figure 1 and Table 3) we found a ∼ 3 times
lower value.
Long term monitoring of the Orion-KL J = 1 − 0 SiO maser lines generally shows
the v = 1 line stronger then the v = 2 line (Martinez et al. 1988; Alcolea et al. 1999;
Pardo et al. 2004) with the ratio varying between > 4 and < 2. The ratio we measure (∼ 2)
is in line with this behavior and our flux densities are at the low end of the values found
during the monitoring.
4.3.2. Comparison with Red Giant and Supergiant Stars
The long timerange monitoring of SiO J = 1− 0 masers with the Yebes 14 m telescope
(Martinez et al. 1988; Pardo et al. 2004) reveals that both the v=1 and the v=2 lines
exhibit dramatic variability in some Mira stars. In o Ceti, for example, the SiO luminosity
may vary by a factor > 500 over a 332 d variability cycle, with a maximum SiO luminosity
near the same time as the infrared radiation. Higher luminosity/higher mass-loss RSGs
show longer term SiO variability and higher SiO maser luminosities. Both SiO lines toward
the supergiants VY CMa and VX Sgr show a long-term decline with a drop to half intensity
– 11 –
over ∼ 1500 days, longer than the infrared variability cycles of these objects.
Towards µ Cep the intensity in both lines increased > 5 fold over an 800 day period
and then declined by an even larger factor over a similar interval and has been at a low
level for years. Finally, a number of well-known RSGs (e.g. α Ori, α Sco, and α Her) do no
show any maser emission at all.
It is interesting to compare the luminosities of the SiO masers in SFR with the typical
luminosity ranges of Mira and RSG SiO masers that we have added to Table 3. It looks
like as if the SFR SiO maser luminosities are higher than the luminosities of Mira stars
but lower than that of the RSGs. The same appears to be true for the luminosities of the
exciting stars.
4.4. 7 mm Continuum Emission
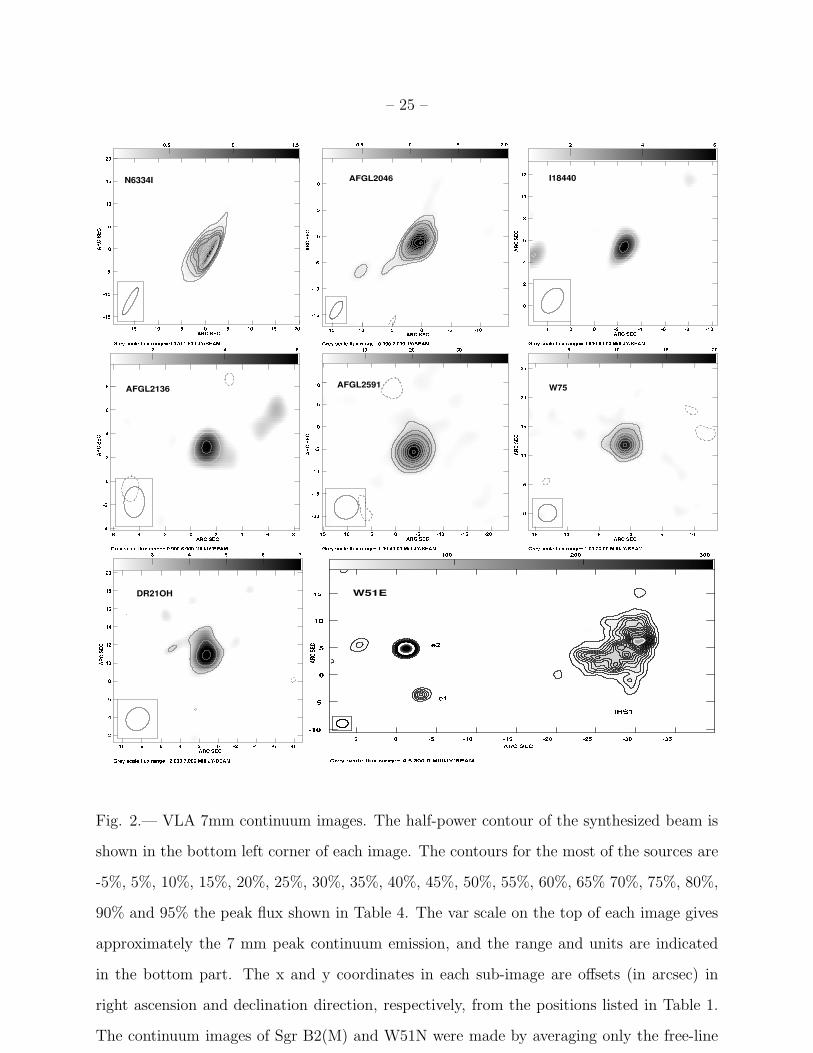
Of the 60 massive star-forming regions observed in our survey, 7 mm continuum
emission was only detected toward 17 above a 4-σ level. Continuum maps of these sources
are shown in Figure 1 and flux densities and source sizes are given in Table 4. The continuum
emission is most likely free-free emission from compact and ultracompact HII regions.
However in a few sources, there are indications that it might originate from ionized jets,
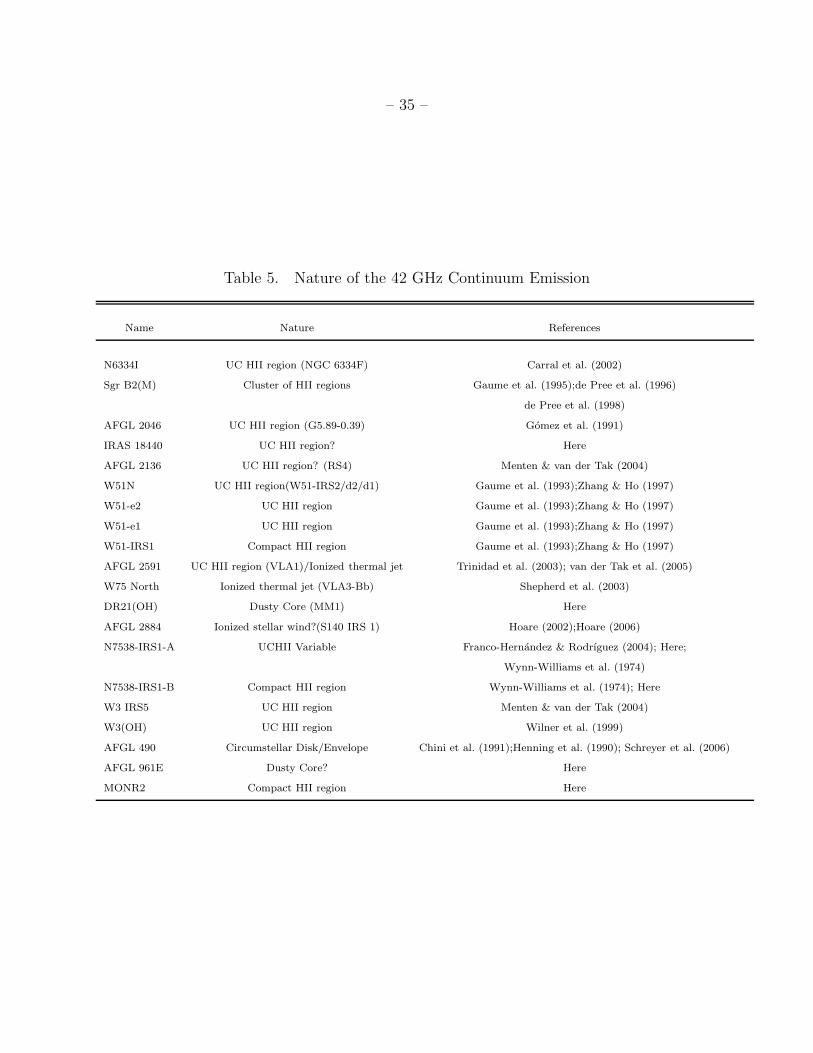
dusty envelopes and/or disks. In Table 5 we give a tentative interpretation for the nature of
these sources, based mostly on other centimeter/millimeter continuum observations at high
angular resolution and, in some cases, on their spectral energy distributions (SEDs).
We detected 14 ultracompact and compact H II regions: N6334I, Sgr B2(M), AFGL
2046, AFGL 2136, W51N, W51e1, W51e2, W51IRS1, AFGL 2591, NGC7538 IRS1-A,
NGC7538-IRS1-B, W3 IRS5, W3(OH), and MonR2. For all of these sources, data taken at
other wavelength have been reported earlier (see Table 5). The sources show three different

– 12 –
type of morphologies: cometary, unresolved, or irregular (see Figure 1), with the cometary
morphology dominating.
It is interesting to note that out of 32 objects selected from the sample of high-
mass protostellar objects of Sridharan et al. (2002), only one was detected at 7 mm
(I18440−0148). This could be explained if these objects are young (proto)stars with no or
very faint free-free emission (less than a few mJy) as selected by Sridharan et al. (2002).
Dust emission at 7 mm wavelength is expected to be very faint and not detectable with our
integration times. Moreover, Zapata et al. (2006) using observations of the VLA found that
the 7 mm continuum emission from 10 massive dusty objects of this sample is less than a
few mJy.
At a 4-σ level (> 2 mJy), we do not detect the arcsec-sized hypercompact HII
regions located in the NGC7538 IRS9, W33A, and AFGL 2591 and that one reported by
van der Tak & Menten (2005) toward W3IRS5. Neither do we detect source-I in Orion,
the continuum source associated with the SiO masers (Menten & Reid 1995; Reid et al.
2007). Note, however, that the noise level in our Orion continuum image is particularly
high, mainly as our bandwidth provided not enough channels free of line emission to make
the continuum image. Also, we do detect the hypercompact HII region RS4 discussed by
Menten & van der Tak (2004). Finally, we note that the continuum flux density at this
wavelength for W3(OH) is low compared to those fluxes reported at 1.3 cm and 3 mm by
Wilner et al. (1995); Wilson et al. (1991). It could be explained if the source is varible in
time as reported at 1.3 cm by Guilloteau et al. (1983).

– 13 –
4.4.1. Comments on Selected Individual Sources
Sgr B2(M)
As shown in Figure 2, we found two strong 7 mm continuum sources in Sgr B2(M) (A in
the west and B in the east). These two sources are the counterpart of the compact objects
F1–F4 and the compact HII region “I” reported by Gaume et al. (1995) at 1.3 cm, but due
to our poor angular resolution (∼ 5′′ × 1′′ at P.A.=150◦) we could not resolved them.
The F1–F4 objects have been already imaged at 7 mm with much higher angular
resolution (0.′′06), with the VLA (de Pree et al. 1998) and were resolved into a total of ∼ 20
separate HC HII regions.
Kuan et al. (1996) have compiled continuum flux densities for Sgr B2(M) at frequencies
between 4.9 to 8.3 GHz and between 78.5 to 109.9 GHz. Our 43 GHz observations bridge
an important frequency gap, and the total flux density we measure for Sgr B2(M) indicates
a fairly flat spectrum with dust only contributing significantly at higher frequencies. While
the numerous UC HII regions present in Sgr B2(M) are expected to have rising or falling
spectra, the effective spectral index is likely the result of more extended (flatter spectral
index) emission dominating the integrated emission analyzed by Kuan et al. (1996) and us.
I18440−0148
I18440−0148 was the only one from the sample of Sridharan et al. (2002) detected at 7
mm. From the 3.6 cm continuum flux ≤ 1 mJy (Sridharan et al. 2002) and the 7 mm flux
measured by us (see Table 4), we calculated a spectral index of α ≥ 1.1. We, thus, suggest
that the 7 mm continuum emission of this source is moderately optically thick free-free
emission from an ultra-compact HII region.
– 14 –
DR21(OH)
DR21(OH) (or W75S) is a very young high mass star forming region with a bolometric
luminosity of 1 × 10³ L⊙ showing very faint centimeter continuum emission (Argon et al.
2000). It also shows strong compact millimeter continuum emission (Woody et al. 1989;
Padin et al. 1989) and H2O, OH and class I as well as class II CH3OH maser emission
(Argon et al. 2000; Mangum et al. 1992; Plambeck & Menten 1990; Menten 1991). Class
I CH3OH masers trace a powerful east-west bipolar outflow almost perpendicular to the
plane of sky Kogan & Slysh (1998). Toward this region we detect a compact source that
is the 7 mm counterpart of the millimeter source MM1 (Woody et al. 1989; Padin et al.
1989). This source is found to be resolved at this wavelength (see Table 4).
From the 3.6 cm continuum peak flux density value (∼ 0.31 mJy) reported by
Argon et al. (2000) of this region and our 7 mm value (Table 4), we calculate a spectral
index of α=1.98±0.2 that suggests that its cm continuum emission maybe optically-thick
free-free emission from a ultra-compact HII region. However, if we take the 2.7 mm
continuum flux density (∼ 0.3 Jy) reported by Woody et al. (1989) for MM1, we find a
much steeper spectral index of α=3.6±0.4, very close to that derived by Woody et al.
(1989) from the 1.4 and 2.7 mm continuum measurements. We think that the emission at 7
mm might be partially optically thin dust emission from either a dusty envelope or disk, or
both.
AFGL 490
The AFGL 490 region is located at about 1 kpc distance (Snell et al. 1984), has a mass of
490 M⊙, a bolometric luminosity of 2× 10³ L⊙ and is still embedded in its parent molecular
cloud (AV ∼ 40 mag, Alonso-Costa & Kwan 1989). Its central object drives a high-velocity
outflow (Mitchell et al. 1995). Very recently Schreyer et al. (2006) by using 17CO line and
– 15 –
1.3 mm continuum observations with an angular resolution of about 1′′ found evidence of
rotating dusty disk driving the molecular outflow.
In this region we found a compact (∼ 2000 AU size) source that is the 7 mm counterpart
of the millimeter source reported by Schreyer et al. (2006).
AFGL 961
AFGL 961 is also a relatively close-by high-mass star forming region with a bolometric
luminosity of about 104 L⊙. This region is composed of two near-IR objects (E and W),
separated by about 5′′ (8000 AU). Castelaz et al. (1985) show that the spectral energy
distribution of GL 961-E dominates at wavelengths longer than 2.2 µm, while the western
object is brighter at shorter wavelengths. This binary system is located at the center of
a parsec scale molecular outflow oriented in the N-S direction with the approaching lobe
towards the north (Lada & Gautier 1982). Very recently Alvarez et al. (2004) found a third
faint infrared object associated with the western source.
We found a faint and unresolved 7 mm continuum source that is the millimeter
counterpart of the infrared source GL 961-E. Single-dish (sub)millimeter 350, 870, and 1300
µm data all taken with beam sizes of 30′′ or larger cannot discriminate between AFGL
961W and E (Guertler et al. 1991). If we assume that all the (sub)millimeter flux and the
radio emission arise from the same source (AFGL 961E) we can construct the SED, shown
in Figure 3. It shows a spectrum in which the emission is dominated by a component that
rises rapidly with frequency with a spectral index of α = 3.0. A simple interpretation would
be that the 7 mm continuum emission from GL 961-E is associated with dust emission from
a core or disk. Clearly, however, more high resolution radio and (sub)mm observations are
needed to test this interpretation.
– 16 –
5. SUMMARY
We report the detection of SiO maser emission in both vibrationally excited transitions
from massive star forming regions only towards three very luminous regions (Orion-KL,
W51N and SgrB2(M)) out of the 60 observed galactic star-forming regions. Toward all
three, SiO maser emission had previously been reported, in Orion-KL in both lines, in
W51N only in the v = 2 line and in Sgr B2(M) only in the v = 1 line. Since we do not
detect either SiO line in 57 other regions of intermediate- and high-mass star formation,
our work confirms that such emission in star-forming regions is a rare phenomenon, indeed,
that requires special, probably extreme, physical and chemical conditions not commonly
found. In addition to this SiO data, we also present images of the simultaneously observed
7 mm continuum emission from a subset of our sample of star-forming regions where such
emission was detected. This is in most cases likely to be free-free emission from compact-
and ultracompact-HII regions.
We thank the anonymous referee for many valuable suggestions. This research has
made extensive use of the SIMBAD database, operated at CDS, Strasbourg, France, and
NASA’s Astrophysics Data System.
– 17 –
REFERENCES
Alcolea, J. et al. 1999, A&AS, 139, 461
Alonso-Costa, J. L., & Kwan, J. 1989, ApJ, 338, 403
Alvarez, C., Hoare, M., Glindemann, A., & Richichi, A. 2004, A&A, 427, 505, arXiv:astro-
ph/0407079
Alvarez, C., & Hoare, M. G. 2005, A&A, 440, 569
Argon, A. L., Reid, M. J., & Menten, K. M. 2000, ApJS, 129, 159
Barvainis, R., & Clemens, D. P. 1984, AJ, 89, 1833
Benson, P. J., Little-Marenin, I. R., Woods, T. C., Attridge, J. M., Blais, K. A., Rudolph,
D. B., Rubiera, M. E., & Keefe, H. L. 1990, ApJS, 74, 911
Beuther, H., Schilke, P., Menten, K. M., Motte, F., Sridharan, T. K., & Wyrowski, F. 2002,
ApJ, 566, 945, astro-ph/0110370
Boonman, A. M. S., & van Dishoeck, E. F. 2003, A&A, 403, 1003
Buhl, D., Snyder, L. E., Lovas, F. J., & Johnson, D. R. 1974, ApJ, 192, L97+
Bujarrabal, V. 1994, A&A, 285, 953
Carral, P., Kurtz, S. E., Rodrıguez, L. F., Menten, K., Canto, J., & Arceo, R. 2002, AJ,
123, 2574
Chini, R., Henning, T., & Pfau, W. 1991, A&A, 247, 157
Cho, S.-H., Kim, H.-G., Park, Y.-S., Choi, C.-H., & Ukita, N. 2005, ApJ, 622, 390
Crampton, D., Georgelin, Y. M., & Georgelin, Y. P. 1978, A&A, 66, 1
– 18 –
Davis, J. H., Blair, G. N., van Till, H., & Thaddeus, P. 1974, ApJ, 190, L117+
de Pree, C. G., Gaume, R. A., Goss, W. M., & Claussen, M. J. 1996, ApJ, 464, 788
de Pree, C. G., Goss, W. M., & Gaume, R. A. 1998, ApJ, 500, 847
de Vicente, P., Martın-Pintado, J., Neri, R., & Colom, P. 2000, A&A, 361, 1058,
astro-ph/0009195
Eisner, J. A., Greenhill, L. J., Herrnstein, J. R., Moran, J. M., & Menten, K. M. 2002, ApJ,
569, 334, astro-ph/0112093
Erickson, E. F., & Tokunaga, A. T. 1980, ApJ, 238, 596
Franco-Hernandez, R., & Rodrıguez, L. F. 2004, ApJ, 604, L105, arXiv:astro-ph/0402467
Gaume, R. A., Claussen, M. J., de Pree, C. G., Goss, W. M., & Mehringer, D. M. 1995,
ApJ, 449, 663
Gaume, R. A., Johnston, K. J., & Wilson, T. L. 1993, ApJ, 417, 645
Gomez, Y., Rodrıguez, L. F., Garay, G., & Moran, J. M. 1991, ApJ, 377, 519
Greenhill, L. J., Gwinn, C. R., Schwartz, C., Moran, J. M., & Diamond, P. J. 1998, Nature,
396, 650, astro-ph/9811318
Greenhill, L. J., Reid, M. J., Chandler, C. J., Diamond, P. J., & Elitzur, M. 2004, in IAU
Symposium, ed. M. Burton, R. Jayawardhana, & T. Bourke, 155–+
Guertler, J., Henning, T., Kruegel, E., & Chini, R. 1991, A&A, 252, 801
Guilloteau, S., Stier, M. T., & Downes, D. 1983, A&A, 126, 10
Habing, H. J. 1996, A&A Rev., 7, 97
– 19 –
Hasegawa, T., Morita, K., Okumura, S., Kaifu, N., Suzuki, H., Ohishi, M., Hayashi, M., &
Ukita, N. 1986, in Masers, Molecules, and Mass Outflows in Star Formation Regions,
275–+
Henning, T., Pfau, W., & Altenhoff, W. J. 1990, A&A, 227, 542
Ho, P. T. P., Das, A., & Genzel, R. 1983, ApJ, 266, 596
Hoare, M. G. 2002, in ASP Conf. Ser. 267: Hot Star Workshop III: The Earliest Phases of
Massive Star Birth, ed. P. Crowther, 137–+
Hoare, M. G. 2006, ApJ, 649, 856, astro-ph/0605662
Humphreys, R. M. 1978, ApJS, 38, 309
Jewell, P. R., Walmsley, C. M., Wilson, T. L., & Snyder, L. E. 1985, ApJ, 298, L55
Klein, R., Posselt, B., Schreyer, K., Forbrich, J., & Henning, T. 2005, ApJS, 161, 361,
astro-ph/0508191
Kogan, L., & Slysh, V. 1998, ApJ, 497, 800
Kuan, Y.-J., Mehringer, D. M., & Snyder, L. E. 1996, ApJ, 459, 619
Kurtz, S., Churchwell, E., & Wood, D. O. S. 1994, ApJS, 91, 659
Ladd, E. F., Deane, J. R., Sanders, D. B., & Wynn-Williams, C. G. 1993, ApJ, 419, 186
Lockett, P., & Elitzur, M. 1992, ApJ, 399, 704
Mangum, J. G., Wootten, A., & Mundy, L. G. 1992, ApJ, 388, 467
Martinez, A., Bujarrabal, V., & Alcolea, J. 1988, A&AS, 74, 273
Menten, K. M. 1991, ApJ, 380, L75
– 20 –
Menten, K. M., & Reid, M. J. 1995, ApJ, 445, L157
Menten, K. M., & van der Tak, F. F. S. 2004, A&A, 414, 289, astro-ph/0310630
Mitchell, G. F., Lee, S. W., Maillard, J.-P., Matthews, H., Hasegawa, T. I., & Harris, A. I.
1995, ApJ, 438, 794
Morita, K.-I., Hasegawa, T., Ukita, N., Okumura, S. K., & Ishiguro, M. 1992, PASJ, 44, 373
Neckel, T. 1978, A&A, 69, 51
Olofsson, H., Hjalmarson, A., & Rydbeck, O. E. H. 1981, A&A, 100, L30
Padin, S. et al. 1989, ApJ, 337, L45
Pardo, J. R., Alcolea, J., Bujarrabal, V., Colomer, F., del Romero, A., & de Vicente, P.
2004, A&A, 424, 145
Peretto, N., Andre, P., & Belloche, A. 2006, A&A, 445, 979, astro-ph/0508619
Plambeck, R. L., & Menten, K. M. 1990, ApJ, 364, 555
Reid, M. J., Menten, K. M., Greenhill, L. J., & Chandler, C. J. 2007, ApJ, 664, 950,
arXiv:0704.2309
Reid, M. J., Schneps, M. H., Moran, J. M., Gwinn, C. R., Genzel, R., Downes, D., &
Roennaeng, B. 1988, ApJ, 330, 809
Rudolph, A., Welch, W. J., Palmer, P., & Dubrulle, B. 1990, ApJ, 363, 528
Sandell, G. 2000, A&A, 358, 242
Schneps, M. H., Moran, J. M., Genzel, R., Reid, M. J., Lane, A. P., & Downes, D. 1981,
ApJ, 249, 124
– 21 –
Schreyer, K., Henning, T., van der Tak, F. F. S., Boonman, A. M. S., & van Dishoeck, E. F.
2002, A&A, 394, 561
Schreyer, K., Semenov, D., Henning, T., & Forbrich, J. 2006, ApJ, 637, L129, arXiv:astro-
ph/0601270
Shepherd, D. S., Borders, T., Claussen, M., Shirley, Y., & Kurtz, S. 2004, ApJ, 614, 211,
astro-ph/0406383
Shepherd, D. S., Testi, L., & Stark, D. P. 2003, ApJ, 584, 882, astro-ph/0210555
Snell, R. L., Scoville, N. Z., Sanders, D. B., & Erickson, N. R. 1984, ApJ, 284, 176
Snyder, L. E., & Buhl, D. 1974, ApJ, 189, L31+
Sridharan, T. K., Beuther, H., Schilke, P., Menten, K. M., & Wyrowski, F. 2002, ApJ, 566,
931, astro-ph/0110363
Thaddeus, P., Mather, J., Davis, J. H., & Blair, G. N. 1974, ApJ, 192, L33+
Torrelles, J. M., Gomez, J. F., Rodriguez, L. F., Ho, P. T. P., Curiel, S., & Vazquez, R.
1997, ApJ, 489, 744
Trinidad, M. A. et al. 2003, ApJ, 589, 386
Trinidad, M. A., Curiel, S., Torrelles, J. M., Rodrıguez, L. F., Migenes, V., & Patel, N.
2006, AJ, 132, 1918
Tsuboi, M., Ohta, E., Kasuga, T., Murata, Y., & Handa, T. 1996, ApJ, 461, L107+
Ukita, N., Hasegawa, T., Kaifu, N., Morita, K. I., Okumura, S., Suzuki, H., Ohishi, M.,
& Hayashi, M. 1987, in IAU Symp. 115: Star Forming Regions, ed. M. Peimbert &
J. Jugaku, 178–+

– 22 –
van der Tak, F. F. S., & Menten, K. M. 2005, A&A, 437, 947, astro-ph/0504026
van der Tak, F. F. S., Tuthill, P. G., & Danchi, W. C. 2005, A&A, 431, 993, astro-ph/0411142
van der Tak, F. F. S., van Dishoeck, E. F., Evans, II, N. J., Bakker, E. J., & Blake, G. A.
1999, ApJ, 522, 991, astro-ph/9905035
van der Tak, F. F. S., van Dishoeck, E. F., Evans, II, N. J., & Blake, G. A. 2000, ApJ, 537,
283, astro-ph/0001527
Vogel, S. N., Genzel, R., & Palmer, P. 1987, ApJ, 316, 243
Werner, M. W., Becklin, E. E., Gatley, I., Matthews, K., Neugebauer, G., & Wynn-Williams,
C. G. 1979, MNRAS, 188, 463
Willner, S. P. et al. 1982, ApJ, 253, 174
Wilner, D. J., Reid, M. J., & Menten, K. M. 1999, ApJ, 513, 775
Wilner, D. J., Welch, W. J., & Forster, J. R. 1995, ApJ, 449, L73+
Wilson, T. L., Johnston, K. J., & Mauersberger, R. 1991, A&A, 251, 220
Woody, D. P., Scott, S. L., Scoville, N. Z., Mundy, L. G., Sargent, A. I., Padin, S., Tinney,
C. G., & Wilson, C. D. 1989, ApJ, 337, L41
Wright, M. M., Gray, M. D., & Diamond, P. J. 2004, MNRAS, 350, 1253
Wynn-Williams, C. G., Becklin, E. E., & Neugebauer, G. 1974, ApJ, 187, 473
Zapata, L. A., Rodrıguez, L. F., Ho, P. T. P., Beuther, H., & Zhang, Q. 2006, AJ, 131, 939,
astro-ph/0510761
Zavagno, A., Deharveng, L., Nadeau, D., & Caplan, J. 2002, A&A, 394, 225

– 23 –
Zhang, Q., & Ho, P. T. P. 1997, ApJ, 488, 241
This manuscript was prepared with the AAS LATEX macros v5.2.
– 24 –
Fig. 1.— Spectra of the SiO J = 1 − 0, v=1 lines (top) and v = 2 lines (bottom) observed
toward Source-I (left), Sgr B2(M) (middle), and W51N (right). The spectral resolution is
2.72 km s−1.
– 25 –
Fig. 2.— VLA 7mm continuum images. The half-power contour of the synthesized beam is
shown in the bottom left corner of each image. The contours for the most of the sources are
-5%, 5%, 10%, 15%, 20%, 25%, 30%, 35%, 40%, 45%, 50%, 55%, 60%, 65% 70%, 75%, 80%,
90% and 95% the peak flux shown in Table 4. The var scale on the top of each image gives
approximately the 7 mm peak continuum emission, and the range and units are indicated
in the bottom part. The x and y coordinates in each sub-image are offsets (in arcsec) in
right ascension and declination direction, respectively, from the positions listed in Table 1.
The continuum images of Sgr B2(M) and W51N were made by averaging only the free-line

– 26 –
Fig. 2.— Continuation.

– 27 –
100 1000
0.001
0.01
0.1
1
10
100
1000
Fig. 3.— Spectral energy distribution of the source AFGL 961E combining data obtained
with the VLA (7 mm, this paper) and millimeter telescopes (Guertler et al. 1991)). The line
is a least-squares power-law fit of the form (Sν ∝ να) to the spectrum.
– 28 –
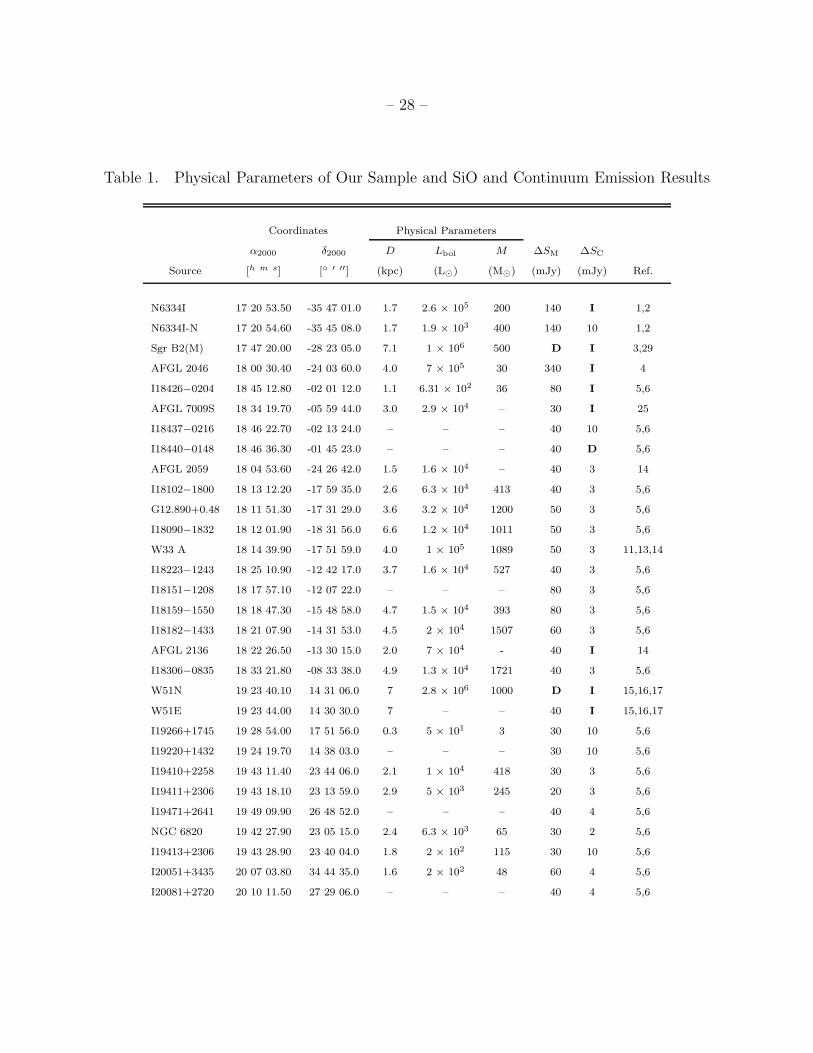
Table 1. Physical Parameters of Our Sample and SiO and Continuum Emission Results
Coordinates Physical Parameters
α2000 δ2000 D Lbol M ∆SM ∆SC
Source [h m s] [◦ ′ ′′] (kpc) (L⊙) (M⊙) (mJy) (mJy) Ref.
N6334I 17 20 53.50 -35 47 01.0 1.7 2.6 × 10⁵ 200 140 I 1,2
N6334I-N 17 20 54.60 -35 45 08.0 1.7 1.9 × 10³ 400 140 10 1,2
Sgr B2(M) 17 47 20.00 -28 23 05.0 7.1 1 × 10⁶ 500 D I 3,29
AFGL 2046 18 00 30.40 -24 03 60.0 4.0 7 × 10⁵ 30 340 I 4
I18426−0204 18 45 12.80 -02 01 12.0 1.1 6.31 × 10² 36 80 I 5,6
AFGL 7009S 18 34 19.70 -05 59 44.0 3.0 2.9 × 10⁴ – 30 I 25
I18437−0216 18 46 22.70 -02 13 24.0 – – – 40 10 5,6
I18440−0148 18 46 36.30 -01 45 23.0 – – – 40 D 5,6
AFGL 2059 18 04 53.60 -24 26 42.0 1.5 1.6 × 10⁴ – 40 3 14
I18102−1800 18 13 12.20 -17 59 35.0 2.6 6.3 × 10⁴ 413 40 3 5,6
G12.890+0.48 18 11 51.30 -17 31 29.0 3.6 3.2 × 10⁴ 1200 50 3 5,6
I18090−1832 18 12 01.90 -18 31 56.0 6.6 1.2 × 10⁴ 1011 50 3 5,6
W33 A 18 14 39.90 -17 51 59.0 4.0 1 × 10⁵ 1089 50 3 11,13,14
I18223−1243 18 25 10.90 -12 42 17.0 3.7 1.6 × 10⁴ 527 40 3 5,6
I18151−1208 18 17 57.10 -12 07 22.0 – – – 80 3 5,6
I18159−1550 18 18 47.30 -15 48 58.0 4.7 1.5 × 10⁴ 393 80 3 5,6
I18182−1433 18 21 07.90 -14 31 53.0 4.5 2 × 10⁴ 1507 60 3 5,6
AFGL 2136 18 22 26.50 -13 30 15.0 2.0 7 × 10⁴ - 40 I 14
I18306−0835 18 33 21.80 -08 33 38.0 4.9 1.3 × 10⁴ 1721 40 3 5,6
W51N 19 23 40.10 14 31 06.0 7 2.8 × 10⁶ 1000 D I 15,16,17
W51E 19 23 44.00 14 30 30.0 7 – – 40 I 15,16,17
I19266+1745 19 28 54.00 17 51 56.0 0.3 5 × 101 3 30 10 5,6
I19220+1432 19 24 19.70 14 38 03.0 – – – 30 10 5,6
I19410+2258 19 43 11.40 23 44 06.0 2.1 1 × 10⁴ 418 30 3 5,6
I19411+2306 19 43 18.10 23 13 59.0 2.9 5 × 10³ 245 20 3 5,6
I19471+2641 19 49 09.90 26 48 52.0 – – – 40 4 5,6
NGC 6820 19 42 27.90 23 05 15.0 2.4 6.3 × 10³ 65 30 2 5,6
I19413+2306 19 43 28.90 23 40 04.0 1.8 2 × 10² 115 30 10 5,6
I20051+3435 20 07 03.80 34 44 35.0 1.6 2 × 10² 48 60 4 5,6
I20081+2720 20 10 11.50 27 29 06.0 – – – 40 4 5,6
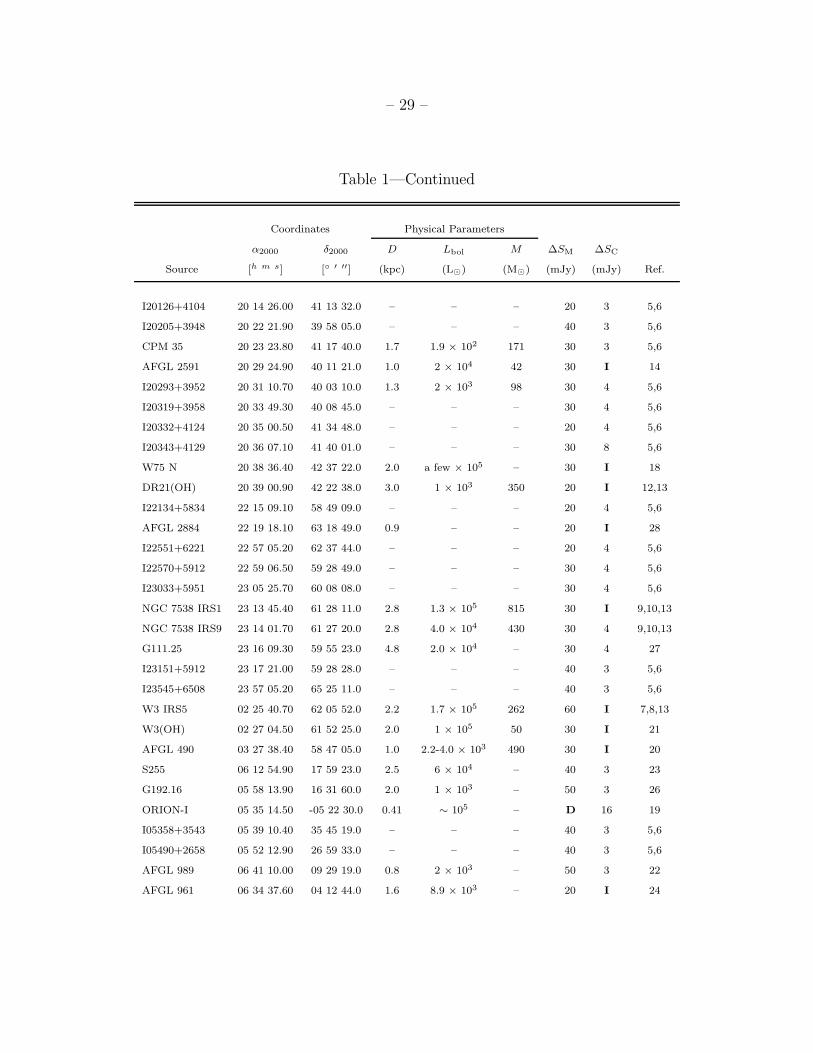
– 29 –
Table 1—Continued
Coordinates Physical Parameters
α2000 δ2000 D Lbol M ∆SM ∆SC
Source [h m s] [◦ ′ ′′] (kpc) (L⊙) (M⊙) (mJy) (mJy) Ref.
I20126+4104 20 14 26.00 41 13 32.0 – – – 20 3 5,6
I20205+3948 20 22 21.90 39 58 05.0 – – – 40 3 5,6
CPM 35 20 23 23.80 41 17 40.0 1.7 1.9 × 10² 171 30 3 5,6
AFGL 2591 20 29 24.90 40 11 21.0 1.0 2 × 10⁴ 42 30 I 14
I20293+3952 20 31 10.70 40 03 10.0 1.3 2 × 10³ 98 30 4 5,6
I20319+3958 20 33 49.30 40 08 45.0 – – – 30 4 5,6
I20332+4124 20 35 00.50 41 34 48.0 – – – 20 4 5,6
I20343+4129 20 36 07.10 41 40 01.0 – – – 30 8 5,6
W75 N 20 38 36.40 42 37 22.0 2.0 a few × 105 – 30 I 18
DR21(OH) 20 39 00.90 42 22 38.0 3.0 1 × 10³ 350 20 I 12,13
I22134+5834 22 15 09.10 58 49 09.0 – – – 20 4 5,6
AFGL 2884 22 19 18.10 63 18 49.0 0.9 – – 20 I 28
I22551+6221 22 57 05.20 62 37 44.0 – – – 20 4 5,6
I22570+5912 22 59 06.50 59 28 49.0 – – – 30 4 5,6
I23033+5951 23 05 25.70 60 08 08.0 – – – 30 4 5,6
NGC 7538 IRS1 23 13 45.40 61 28 11.0 2.8 1.3 × 10⁵ 815 30 I 9,10,13
NGC 7538 IRS9 23 14 01.70 61 27 20.0 2.8 4.0 × 10⁴ 430 30 4 9,10,13
G111.25 23 16 09.30 59 55 23.0 4.8 2.0 × 10⁴ – 30 4 27
I23151+5912 23 17 21.00 59 28 28.0 – – – 40 3 5,6
I23545+6508 23 57 05.20 65 25 11.0 – – – 40 3 5,6
W3 IRS5 02 25 40.70 62 05 52.0 2.2 1.7 × 10⁵ 262 60 I 7,8,13
W3(OH) 02 27 04.50 61 52 25.0 2.0 1 × 10⁵ 50 30 I 21
AFGL 490 03 27 38.40 58 47 05.0 1.0 2.2-4.0 × 10³ 490 30 I 20
S255 06 12 54.90 17 59 23.0 2.5 6 × 10⁴ – 40 3 23
G192.16 05 58 13.90 16 31 60.0 2.0 1 × 10³ – 50 3 26
ORION-I 05 35 14.50 -05 22 30.0 0.41 ∼ 105 – D 16 19
I05358+3543 05 39 10.40 35 45 19.0 – – – 40 3 5,6
I05490+2658 05 52 12.90 26 59 33.0 – – – 40 3 5,6
AFGL 989 06 41 10.00 09 29 19.0 0.8 2 × 10³ – 50 3 22
AFGL 961 06 34 37.60 04 12 44.0 1.6 8.9 × 10³ – 20 I 24
– 30 –
Table 1—Continued
Coordinates Physical Parameters
α2000 δ2000 D Lbol M ∆SM ∆SC
Source [h m s] [◦ ′ ′′] (kpc) (L⊙) (M⊙) (mJy) (mJy) Ref.
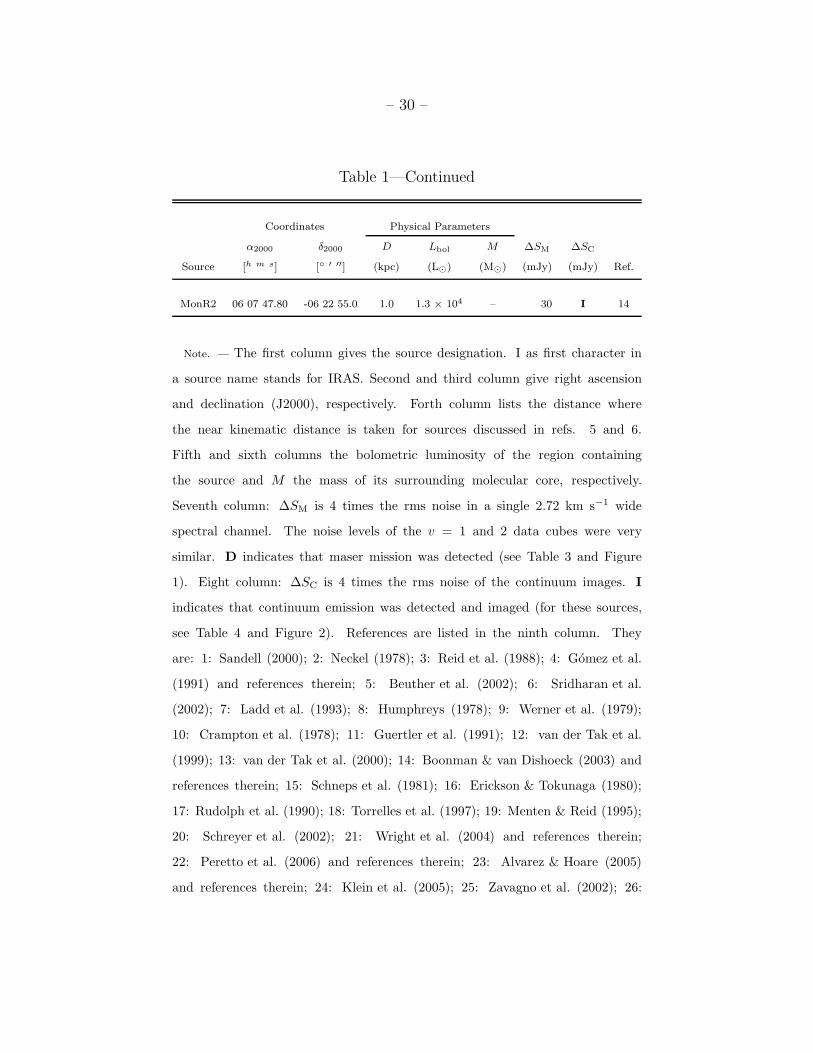
MonR2 06 07 47.80 -06 22 55.0 1.0 1.3 × 10⁴ – 30 I 14
Note. — The first column gives the source designation. I as first character in
a source name stands for IRAS. Second and third column give right ascension
and declination (J2000), respectively. Forth column lists the distance where
the near kinematic distance is taken for sources discussed in refs. 5 and 6.
Fifth and sixth columns the bolometric luminosity of the region containing
the source and M the mass of its surrounding molecular core, respectively.
Seventh column: ∆SM is 4 times the rms noise in a single 2.72 km s−1 wide
spectral channel. The noise levels of the v = 1 and 2 data cubes were very
similar. D indicates that maser mission was detected (see Table 3 and Figure
1). Eight column: ∆SC is 4 times the rms noise of the continuum images. I
indicates that continuum emission was detected and imaged (for these sources,
see Table 4 and Figure 2). References are listed in the ninth column. They
are: 1: Sandell (2000); 2: Neckel (1978); 3: Reid et al. (1988); 4: Gomez et al.
(1991) and references therein; 5: Beuther et al. (2002); 6: Sridharan et al.
(2002); 7: Ladd et al. (1993); 8: Humphreys (1978); 9: Werner et al. (1979);
10: Crampton et al. (1978); 11: Guertler et al. (1991); 12: van der Tak et al.
(1999); 13: van der Tak et al. (2000); 14: Boonman & van Dishoeck (2003) and
references therein; 15: Schneps et al. (1981); 16: Erickson & Tokunaga (1980);
17: Rudolph et al. (1990); 18: Torrelles et al. (1997); 19: Menten & Reid (1995);
20: Schreyer et al. (2002); 21: Wright et al. (2004) and references therein;
22: Peretto et al. (2006) and references therein; 23: Alvarez & Hoare (2005)
and references therein; 24: Klein et al. (2005); 25: Zavagno et al. (2002); 26:
– 31 –
Shepherd et al. (2004); 27: Trinidad et al. (2006) and references therein; 28:
Kurtz et al. (1994); 29: de Vicente et al. (2000)

– 32 –
Table 2. Parameters of the Phase Calibrators
Phase Center Bootstrapped Synthesized Beam
α2000 δ2000 Flux Density Size P.A.
Calibrator [h m s] [◦ ′ ′′] [Jy] [arcsec] [deg.]
1717-337 17 17 36.03 -33 42 08.7 8.9 5.44 × 1.46 -25.3
1733-130 17 33 02.70 -13 04 49.5 7.9 2.53 × 1.62 -22.5
1833-210 18 33 39.91 -21 03 40.0 16.2 2.48 × 1.42 -11.7
1851+005 18 51 46.72 00 35 32.4 1.8 2.03 × 1.60 -30.0
1832-105 18 32 20.83 -10 35 11.2 2.0 1.99 × 1.44 -1.60
1743-038 17 43 58.85 -03 50 04.6 6.6 2.13 × 1.47 -23.8
1925+211 19 25 59.60 21 06 26.1 2.1 1.47 × 1.34 0.0
2015+371 20 15 28.73 37 10 59.5 3.8 1.51 × 1.42 -45.3
22250+558 22 50 42.85 55 50 14.5 1.1 1.63 × 1.43 -29.3
0228+673 02 28 50.05 67 21 03.0 5.2 1.89 × 1.42 -49.0
0613+131 06 13 57.69 13 06 45.4 1.7 1.57 × 1.48 -3.4
0541-056 05 41 38.08 -05 41 49.4 1.5 1.92 × 1.49 0.3
0555+398 05 55 30.80 39 48 49.1 3.5 1.54 × 1.38 -10.6
Note. — Positional accuracy is estimated to be 0.01′′
– 33 –
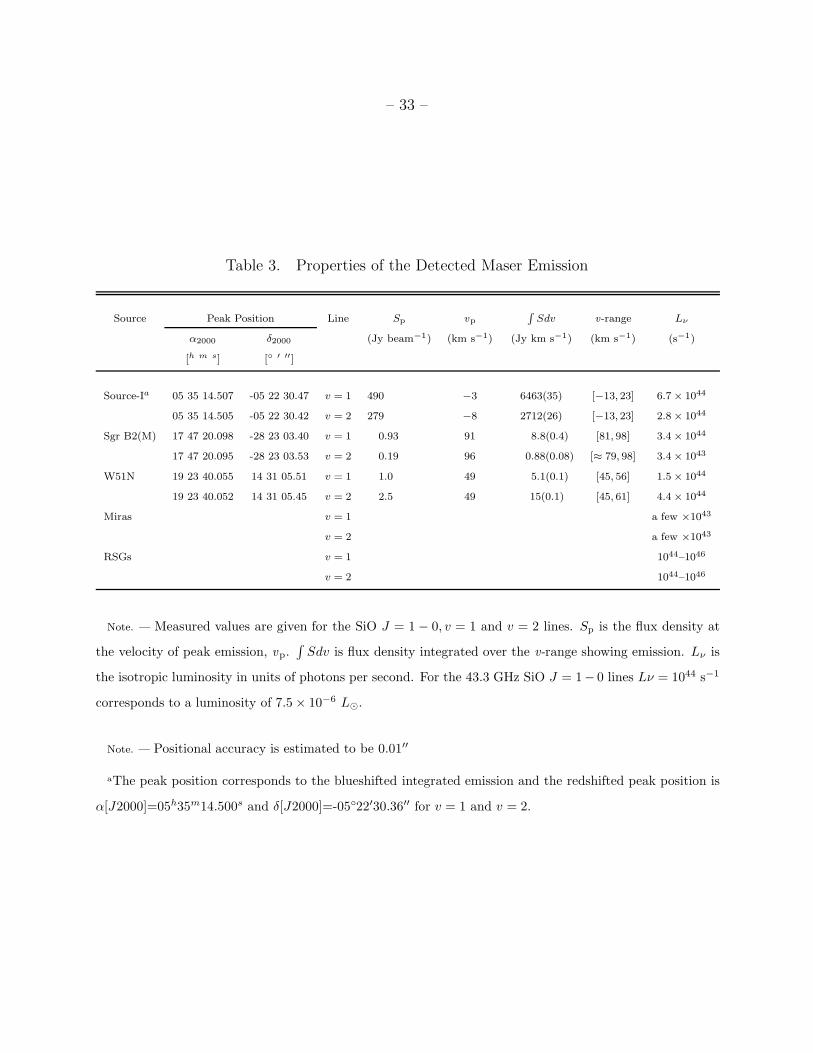
Table 3. Properties of the Detected Maser Emission
Source Peak Position Line Sp vp
R
Sdv v-range Lν
α2000 δ2000 (Jy beam−1) (km s−1) (Jy km s−1) (km s−1) (s−1)
[h m s] [◦ ′ ′′]
Source-Ia 05 35 14.507 -05 22 30.47 v = 1 490 −3 6463(35) [−13, 23] 6.7 × 1044
05 35 14.505 -05 22 30.42 v = 2 279 −8 2712(26) [−13, 23] 2.8 × 1044
Sgr B2(M) 17 47 20.098 -28 23 03.40 v = 1 0.93 91 8.8(0.4) [81, 98] 3.4 × 1044
17 47 20.095 -28 23 03.53 v = 2 0.19 96 0.88(0.08) [≈ 79, 98] 3.4 × 1043
W51N 19 23 40.055 14 31 05.51 v = 1 1.0 49 5.1(0.1) [45, 56] 1.5 × 1044
19 23 40.052 14 31 05.45 v = 2 2.5 49 15(0.1) [45, 61] 4.4 × 1044
Miras v = 1 a few ×1043
v = 2 a few ×1043
RSGs v = 1 1044–1046
v = 2 1044–1046
Note. — Measured values are given for the SiO J = 1 − 0, v = 1 and v = 2 lines. Sp is the flux density at
the velocity of peak emission, vp.∫
Sdv is flux density integrated over the v-range showing emission. Lν is
the isotropic luminosity in units of photons per second. For the 43.3 GHz SiO J = 1− 0 lines Lν = 1044 s−1
corresponds to a luminosity of 7.5 × 10⁻⁶ L⊙.
Note. — Positional accuracy is estimated to be 0.01′′
aThe peak position corresponds to the blueshifted integrated emission and the redshifted peak position is
α[J2000]=05h35m14.500s and δ[J2000]=-05◦22′30.36′′ for v = 1 and v = 2.
– 34 –
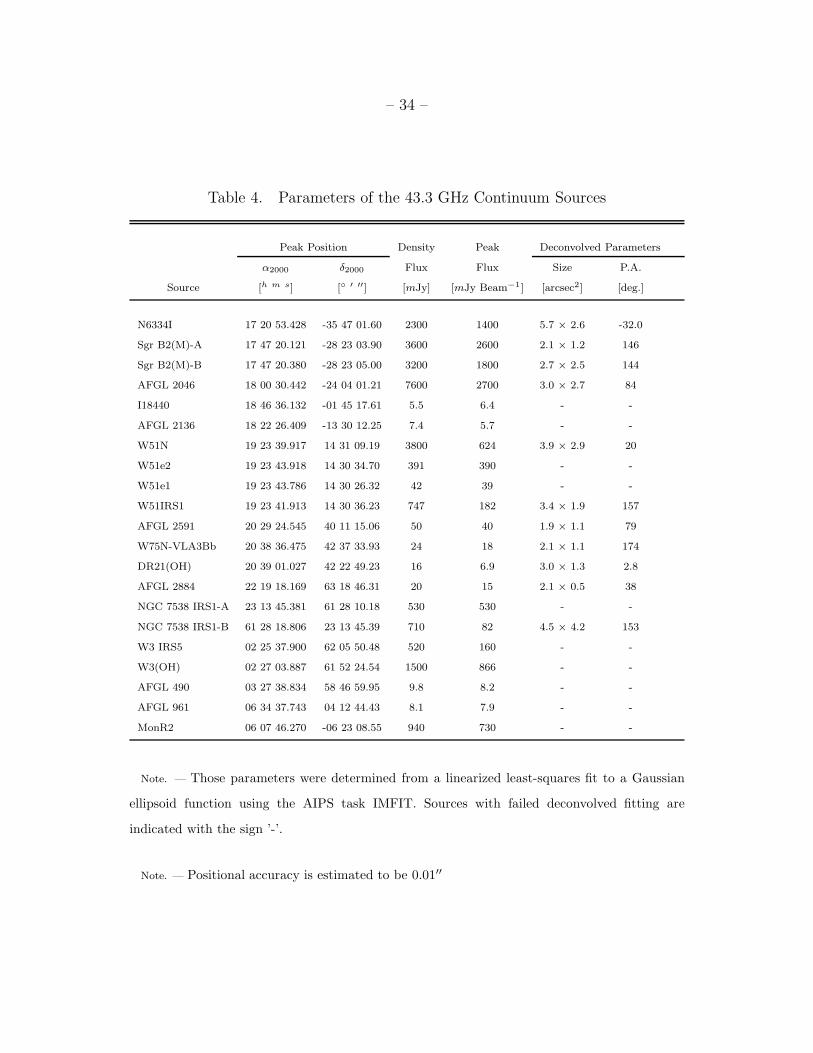
Table 4. Parameters of the 43.3 GHz Continuum Sources
Peak Position Density Peak Deconvolved Parameters
α2000 δ2000 Flux Flux Size P.A.
Source [h m s] [◦ ′ ′′] [mJy] [mJy Beam−1] [arcsec2] [deg.]
N6334I 17 20 53.428 -35 47 01.60 2300 1400 5.7 × 2.6 -32.0
Sgr B2(M)-A 17 47 20.121 -28 23 03.90 3600 2600 2.1 × 1.2 146
Sgr B2(M)-B 17 47 20.380 -28 23 05.00 3200 1800 2.7 × 2.5 144
AFGL 2046 18 00 30.442 -24 04 01.21 7600 2700 3.0 × 2.7 84
I18440 18 46 36.132 -01 45 17.61 5.5 6.4 - -
AFGL 2136 18 22 26.409 -13 30 12.25 7.4 5.7 - -
W51N 19 23 39.917 14 31 09.19 3800 624 3.9 × 2.9 20
W51e2 19 23 43.918 14 30 34.70 391 390 - -
W51e1 19 23 43.786 14 30 26.32 42 39 - -
W51IRS1 19 23 41.913 14 30 36.23 747 182 3.4 × 1.9 157
AFGL 2591 20 29 24.545 40 11 15.06 50 40 1.9 × 1.1 79
W75N-VLA3Bb 20 38 36.475 42 37 33.93 24 18 2.1 × 1.1 174
DR21(OH) 20 39 01.027 42 22 49.23 16 6.9 3.0 × 1.3 2.8
AFGL 2884 22 19 18.169 63 18 46.31 20 15 2.1 × 0.5 38
NGC 7538 IRS1-A 23 13 45.381 61 28 10.18 530 530 - -
NGC 7538 IRS1-B 61 28 18.806 23 13 45.39 710 82 4.5 × 4.2 153
W3 IRS5 02 25 37.900 62 05 50.48 520 160 - -
W3(OH) 02 27 03.887 61 52 24.54 1500 866 - -
AFGL 490 03 27 38.834 58 46 59.95 9.8 8.2 - -
AFGL 961 06 34 37.743 04 12 44.43 8.1 7.9 - -
MonR2 06 07 46.270 -06 23 08.55 940 730 - -
Note. — Those parameters were determined from a linearized least-squares fit to a Gaussian
ellipsoid function using the AIPS task IMFIT. Sources with failed deconvolved fitting are
indicated with the sign ’-’.
Note. — Positional accuracy is estimated to be 0.01′′
– 35 –
Table 5. Nature of the 42 GHz Continuum Emission
Name Nature References
N6334I UC HII region (NGC 6334F) Carral et al. (2002)
Sgr B2(M) Cluster of HII regions Gaume et al. (1995);de Pree et al. (1996)
de Pree et al. (1998)
AFGL 2046 UC HII region (G5.89-0.39) Gomez et al. (1991)
IRAS 18440 UC HII region? Here
AFGL 2136 UC HII region? (RS4) Menten & van der Tak (2004)
W51N UC HII region(W51-IRS2/d2/d1) Gaume et al. (1993);Zhang & Ho (1997)
W51-e2 UC HII region Gaume et al. (1993);Zhang & Ho (1997)
W51-e1 UC HII region Gaume et al. (1993);Zhang & Ho (1997)
W51-IRS1 Compact HII region Gaume et al. (1993);Zhang & Ho (1997)
AFGL 2591 UC HII region (VLA1)/Ionized thermal jet Trinidad et al. (2003); van der Tak et al. (2005)
W75 North Ionized thermal jet (VLA3-Bb) Shepherd et al. (2003)
DR21(OH) Dusty Core (MM1) Here
AFGL 2884 Ionized stellar wind?(S140 IRS 1) Hoare (2002);Hoare (2006)
N7538-IRS1-A UCHII Variable Franco-Hernandez & Rodrıguez (2004); Here;
Wynn-Williams et al. (1974)
N7538-IRS1-B Compact HII region Wynn-Williams et al. (1974); Here
W3 IRS5 UC HII region Menten & van der Tak (2004)
W3(OH) UC HII region Wilner et al. (1999)
AFGL 490 Circumstellar Disk/Envelope Chini et al. (1991);Henning et al. (1990); Schreyer et al. (2006)
AFGL 961E Dusty Core? Here
MONR2 Compact HII region Here