maryland statewide transportation...
TRANSCRIPT
Maryland Statewide Transportation Model (MSTM)
TRB Meeting Federal Surface Transportation Requirements in Statewide and Metropolitan Transportation Planning: A Conference
September 3 ‐ 5, 2008
Maryland State Highway Administration (MD SHA)

2
MSTM
OutlineAbout Maryland and MD SHA
Project Background
MSTM Summary
Model Structure and Components3‐Level Model Approach
Zones & Networks
Person Models
Freight Models
System wide Assignment
Validation
Economic and Land Use Model Summary
Next Steps

3
MSTM
About Maryland and MD State Highway Administration

4
MSTM
About MarylandArea ‐ 10,467 square miles [Maryland is the 42nd biggest state in the USA]
Population ‐ 5,296,486(as of 2000) [Maryland is the 19th most populous state in the USA]

5
MSTM
About MD State Highway Administration (SHA)
SHA owns, operates and maintains the Interstate, U.S. and Maryland numbered roads.
SHA roads carry 67% of traffic in the state by approx: 16,731 lane‐miles of road and 2,500 bridges

6
MSTM
Project Background

7
MSTM
Objectives
travel demand in non‐MPO regions
corridor studies spanning across multiple MPOs
modeling freight

8
MSTM
Objectives Contd..
regional what‐if scenarios due toland use (BRAC, Rezoning etc.)network changes (ICC, Tolling in VA, DE facilities etc.)policy changes in/ around MD (Managed Lanes, Climate Change)
provide “relatively quick” and “reasonable” answers on an aggregate level for regional policy impacts
intercity transit modeling (commuter rail, intracity bus services etc.)
assist MPO modeling efforts with inputs “external” to their model
tool that connects all the available MPO models together

Model Structure and Components

MSTM
The model works at three levels

11
MSTM
Three‐Level Approach

12
MSTM
Model Zones (Regional & Statewide)
&Networks
13
MSTM
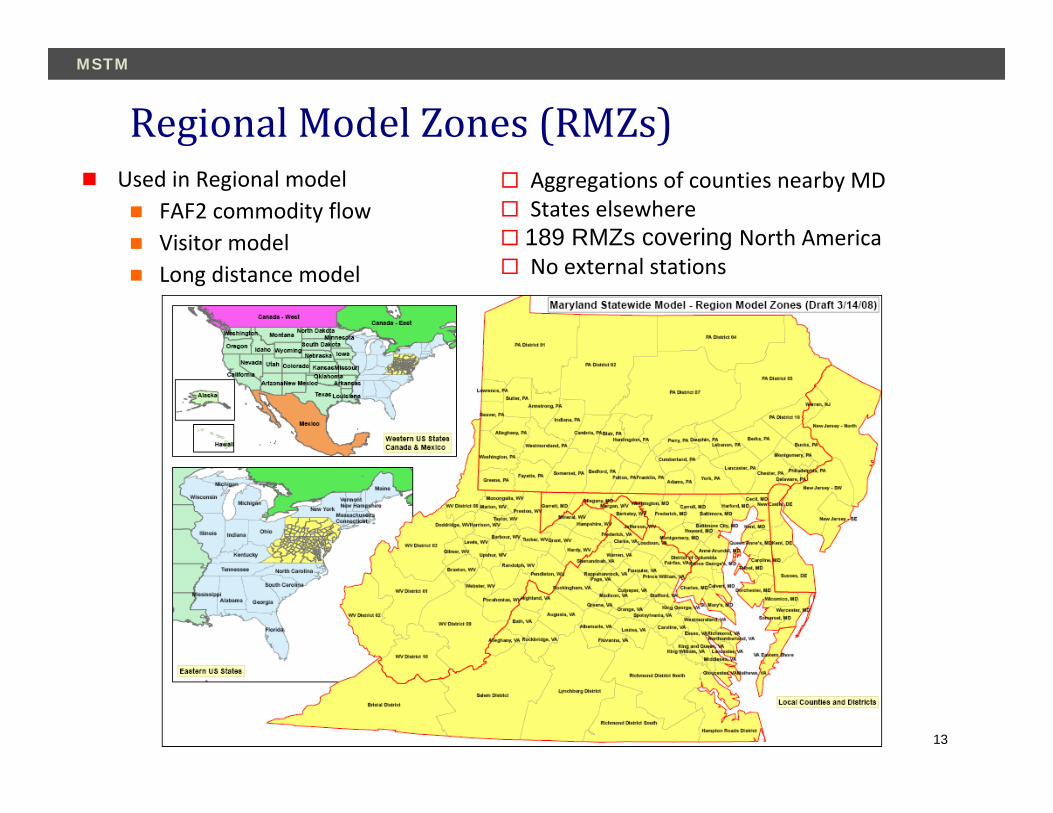
Regional Model Zones (RMZs)Used in Regional model
FAF2 commodity flowVisitor modelLong distance model
Aggregations of counties nearby MD States elsewhere189 RMZs covering North AmericaNo external stations

14
MSTM
Three levels of nested model zones1607 Statewide (SMZs) – Used in assignment3056 Urban (UMZs) – link to MPO TAZs
Statewide Model Zones (SMZ)

15
MSTM
Roadway NetworkSingle network
Gradual transition from detailed to coarse network representations outside of the statewide level area
Sources:MPO networks
Caliper national network
Other (SHA centerline data)
DelDOT statewide model network

16
MSTM
Model Framework

17
MSTM
Model Components
VPS T2T
PMC
PTD
TAP
UMR
PLDIER
PTG
TTD
TTG
MCA
FAF2 forecast
IE personflows
Internalperson flows
Internaltruck flows
Revised IE+EItruck flows
EE truckflows
For three time of dayperiods (AM, PM, OP)
Dailyassignment
IE+EItrucks
NHTS longdistance survey
Socioeconomicdata
MCA
ETV
IE+EItrucks
Localvisitors
LD visitors
Regional level
Statewidelevel
ETV: External trip variegatorIER: Internal‐external reconciliationMCA: Multiclass assignmentPLD: Person long distancePMC: Person mode choicePTD: Person trip distributionPTG: Person trip generationT2T: Tons to truck conversionTAP: Temporal allocation processorTTD: Truck trip distributionTTG: Truck trip generationUMR: Urban model reconciliationVPS: Visitor population synthesizer
Component models:

18
MSTM
Person Travel Models
‐ Regional Level* Visitor Model* Long Distance Model
‐ Statewide Level

19
MSTM
Regional Level Person Travel
VPS: Visitor population synthesis(non‐residents)
Identify place of residence/stay & attributes
(trip purpose, party size, primary mode of arrival, visit duration)
PLD: Long distance model (trips over 50 miles)Base year trip table: sample from NHTS survey records
Trip generation rates for long distance trips
Allocate trip ends (SMZ internal, RMZ external)
Produce trip table for assignment (EE trips ignored)

20
MSTM
Statewide Level Person TravelPTG: Trip Generation
Based on BMC/MWCOG structure, uses BMC‐COG HH survey Vary motorized rates by area type 3 work and 3 non‐work‐related trip purposes by 5 income groups
PTD: Trip DistributionGravity modelExponential impedance functionusing mode choice logsums
Market segments by HH incomeRecalibration for SMZ system
.PMC: Mode Choice
Nested logit structureExpanded, consolidated transit networkRecalibration of mode‐specific constants
MCA:Multi‐Class Assignment in CUBE Voyager

21
MSTM
Freight ModelsRegional Level Statewide Level
140 FAF2 Zones 3,241 Counties
1,607 SMZ
132 RMZdisaggregate
disaggregate
aggregate

22
MSTM
Figure 2: FAF2 zones near Maryland
Regional Level Freight Model
FAF2 Commodity flow Forecasts Flows between 130 US FAF zones
41 SCTG commodities by mode
Domestic and Foreign flows
2002, 2006, 2010‐2035 in 5 year intervals
T2T: Tons to trucksConversion based on CFS & VIUS
Only truck mode assigned to network
MCA: Multi‐class assignmentInitial assignment of daily truck flows to RMZs
Using I/O make/use factors + employment by industry sector
Disaggregate internal end to SMZs

23
MSTM
Statewide Level Freight Model
Hybrid of BMC, MWCOG, QRFM2 methodologies
TTG: Truck trip generation
SMZ trip ends: employment by type, households, and area type
RMZ trip ends obviate need for external stations
Apply shares to split into light, medium, heavy trucks
TTD: Truck trip distributionGravity model using vehicle time/cost impedance and segmented distance terms
Off‐peak auto and truck time/cost (including tolls)
IER: Internal‐external reconciliationReconcile Regional‐Statewide I‐E/E‐I truck flows
Match base year observed counts
For the statewide model, these county-to-county flows are disaggregated to zones using employment. Outside the statewide model area, these flows are aggregated to regional zones.

24
MSTM
Transit NetworkIntegrated urban‐intercity transit network
No easy solutions
Have to reflect system access and connectivity
Proposed approachAdopt BMC transit route structure as starting point
Incorporate selected routes from MWCOG network
Add intercity bus and rail components
Rebuild access structures
Adapt fare systems to new network and zones
Refine approach as development proceeds

25
MSTM
Systemwide Assignment
VPS T2T
PMC
PTD
TAP
UMR
PLDIER
PTG
TTD
TTG
MCA
FAF2 forecast
IE personflows
Internalperson flows
Internaltruck flows
Revised IE+EItruck flows
EE truckflows
For three time of dayperiods (AM, PM, OP)
Dailyassignment
IE+EItrucks
NHTS longdistance survey
Socioeconomicdata
MCA
ETV
IE+EItrucks
Localvisitors
LD visitors
Regional level
Statewidelevel
ETV: External trip variegatorIER: Internal‐external reconciliationMCA: Multiclass assignmentPLD: Person long distancePMC: Person mode choicePTD: Person trip distributionPTG: Person trip generationT2T: Tons to truck conversionTAP: Temporal allocation processorTTD: Truck trip distributionTTG: Truck trip generationUMR: Urban model reconciliationVPS: Visitor population synthesizer
Component models:
26
MSTM
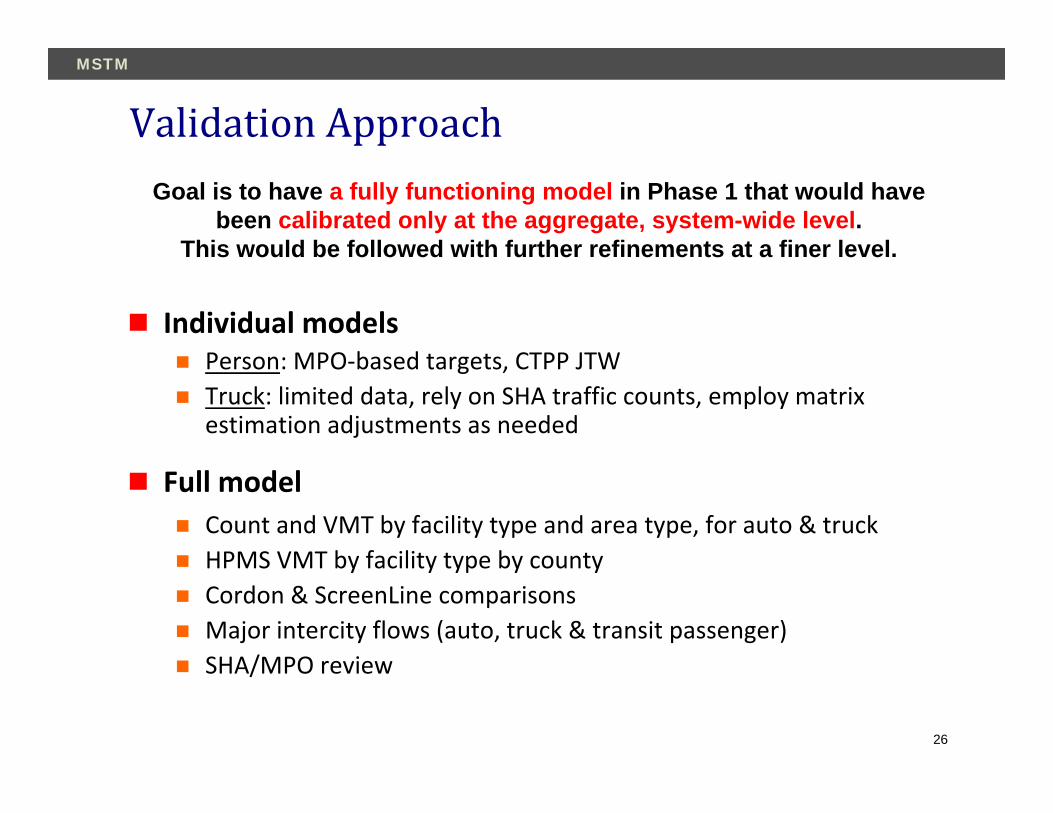
Validation Approach
Individual modelsPerson: MPO‐based targets, CTPP JTWTruck: limited data, rely on SHA traffic counts, employ matrix estimation adjustments as needed
Full modelCount and VMT by facility type and area type, for auto & truckHPMS VMT by facility type by countyCordon & ScreenLine comparisonsMajor intercity flows (auto, truck & transit passenger)SHA/MPO review
Goal is to have a fully functioning model in Phase 1 that would have been calibrated only at the aggregate, system-wide level.
This would be followed with further refinements at a finer level.

Concurrent & Future Efforts
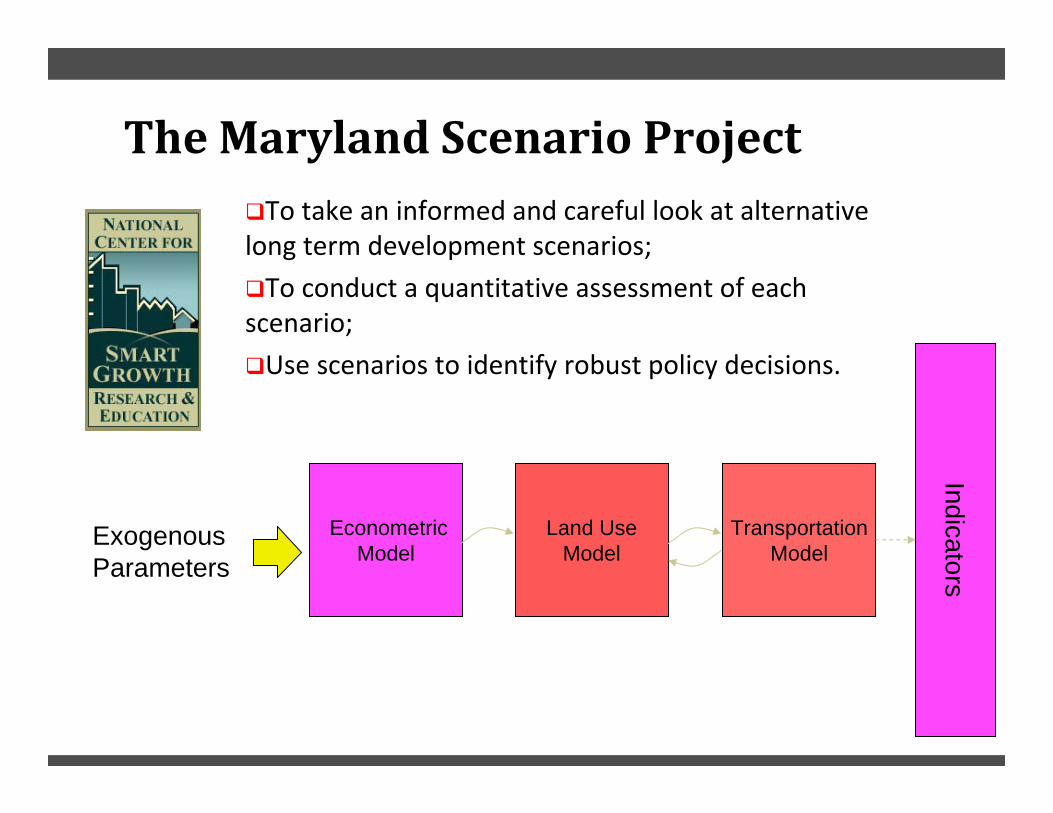
The Maryland Scenario ProjectTo take an informed and careful look at alternative
long term development scenarios;
To conduct a quantitative assessment of each scenario;
Use scenarios to identify robust policy decisions.
EconometricModel
Land UseModel
TransportationModel
Exogenous Parameters
Indicators

Deliverables
Regional Planning ApplicationsTravel demand for non‐MPO regionsRefine MPO models with external station data inputsLong Range Plans, Highway Needs & Project Prioritization
Corridor studies spanning across multiple regions
Study changes in land use and networks
Intermodal Components
Freight Model Applications – Freight Plan Scenarios
Study of Highway Performance Measures

Maintenance & Upkeepupdate the model with latest socio‐economic data
review of statewide model zones and networks
add GIS based visualization and query tools
develop in‐house capabilities to use statewide model
extensive validation of MPO forecasts/ studying the similaritiesand differences for future step
study feasibility to add special generators, distribution centers etc.

31
MSTM
Thank you from our team !!
Univ. of
MD
PB SHA- Office of PlanningSHA-Travel Forecasting