maryland state department of education€¦ · mary kay finan s. james gates, jr. madhu sidhu...
TRANSCRIPT

THE
FACT
BO
OK
2009 - 2010
MARYLAND STATE DEPARTMENTof EDUCATION

THE FACTBOOK2009-2010
A Statistical Handbook
Maryland State Department of Education200 West Baltimore StreetBaltimore, Maryland 21201
www.marylandpublicschools.org
410-767-0100
Maryland State Board of Education
Nancy S. Grasmick State Superintendent of Schools
Secretary-Treasurer of the Board
John E. Smeallie Deputy State Superintendent for Administration
Stephen A. Brooks
Deputy State Superintendent for Finance
Maryland State Department of Education
Martin O’MalleyGovernor
State of Maryland
Mary Kay Finan S. James Gates, Jr. Madhu Sidhu Guffrie M. Smith, Jr.Donna Hill Staton
Sayed M. NavedLuisa Montero-DiazIvan C. A. Walks Kate Walsh Gayon M. Sampson, Student Member
James H. DeGraffenreidt, Jr., PresidentCharlene M. Dukes, Vice President
The Maryland State Department of Education does not discriminate on the basis of race, color, sex, age, national origin, sexual orientation, religion, or disability in matters affecting employment or in providing access to programs. For inquiries related to Departmental policy, please contact:
Equity Assurance and Compliance BranchMaryland State Department of Education200 West Baltimore StreetBaltimore, Maryland 21201-2595410-767-0433 (voice) 410-333-6442 (TTY/TDD)410-767-0431 (fax)

Contents
Demographic Data Student Data 1 School Data 7 Staff Data 8 Salary Data 12
Accountability DataMaryland School Assessment Results 14High School Assessment Results 15 Graduates and Post-Graduation Plans 16 Scholastic Aptitude Test Results 18Dropout and Retention Data 19
Financial DataFinancial Resources 20Maintenance of Effort 21 Major State Aid Programs 22Per Pupil Data 24Education Effort Index 28
Special PopulationsTitle I Program 29English Language Learners 30 Special Education 31Career and Technology Education 36
Other ProgramsSchool Library Media Centers 38Food Services 40Pupil Transportation 44Public Library Statistics 46Vocational Rehabilitation Services 48
General InformationSelected Statistics 51Maryland’s Rank Among the States 52Education Superlatives 53Local School System Superintendents 54MSDE Publications 55
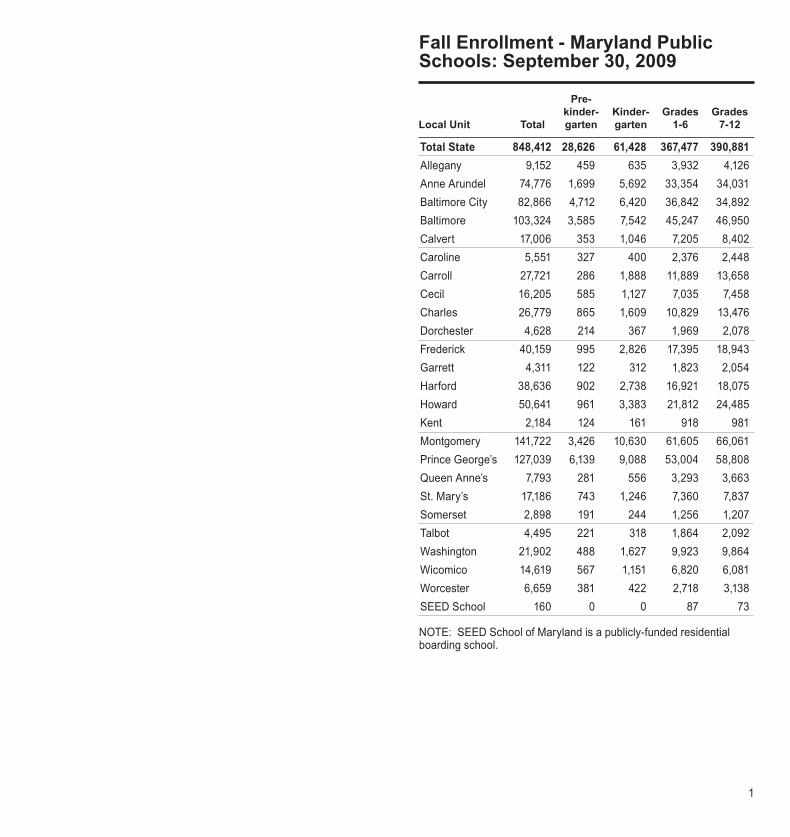
Fall Enrollment - Maryland Public Schools: September 30, 2009
1
Local Unit Total
Pre-kinder-garten
Kinder- garten
Grades 1-6
Grades 7-12
Total State 848,412 28,626 61,428 367,477 390,881Allegany 9,152 459 635 3,932 4,126Anne Arundel 74,776 1,699 5,692 33,354 34,031Baltimore City 82,866 4,712 6,420 36,842 34,892Baltimore 103,324 3,585 7,542 45,247 46,950Calvert 17,006 353 1,046 7,205 8,402Caroline 5,551 327 400 2,376 2,448Carroll 27,721 286 1,888 11,889 13,658Cecil 16,205 585 1,127 7,035 7,458Charles 26,779 865 1,609 10,829 13,476Dorchester 4,628 214 367 1,969 2,078Frederick 40,159 995 2,826 17,395 18,943Garrett 4,311 122 312 1,823 2,054Harford 38,636 902 2,738 16,921 18,075Howard 50,641 961 3,383 21,812 24,485Kent 2,184 124 161 918 981Montgomery 141,722 3,426 10,630 61,605 66,061Prince George’s 127,039 6,139 9,088 53,004 58,808Queen Anne’s 7,793 281 556 3,293 3,663St. Mary’s 17,186 743 1,246 7,360 7,837Somerset 2,898 191 244 1,256 1,207Talbot 4,495 221 318 1,864 2,092Washington 21,902 488 1,627 9,923 9,864Wicomico 14,619 567 1,151 6,820 6,081Worcester 6,659 381 422 2,718 3,138SEED School 160 0 0 87 73
NOTE: SEED School of Maryland is a publicly-funded residential boarding school.

Maryland Public School Studentsby Race: September 30, 2009
2 3
American Indian/Alaskan
NativeAsian/Pacific
Islander
Region/Local UnitTotal
Students NumberPer-cent Number
Per-cent
African American
Hispanic White
NumberPer-cent Number
Per-cent
Number
Per-cent
Total State 848,412 3,671 0.4 52,156 6.1Baltimore Metropolitan 378,124 1,710 0.5 20,425 5.4Anne Arundel 74,776 344 0.5 3,155 4.2Baltimore City 82,866 253 0.3 754 0.9Baltimore 103,324 647 0.6 6,409 6.2Carroll 27,721 86 0.3 575 2.1Harford 38,636 213 0.6 1,270 3.3Howard 50,641 167 0.3 8,262 16.3SEED School 160 0 0.0 0 0.0National Capital 268,761 958 0.4 26,171 9.7Montgomery 141,722 432 0.3 22,176 15.6Prince George’s 127,039 526 0.4 3,995 3.1Western Maryland 75,524 307 0.4 2,549 3.4Allegany 9,152 55 0.6 81 0.9Frederick 40,159 160 0.4 1,992 5.0Garrett 4,311 5 0.1 18 0.4Washington 21,902 87 0.4 458 2.1Upper Shore 36,228 148 0.4 485 1.3Caroline 5,551 24 0.4 48 0.9Cecil 16,205 58 0.4 213 1.3Kent 2,184 8 0.4 10 0.5Queen Anne’s 7,793 42 0.5 130 1.7Talbot 4,495 16 0.4 84 1.9Lower Shore 28,804 100 0.3 705 2.4Dorchester 4,628 19 0.4 53 1.1Somerset 2,898 6 0.2 28 1.0Wicomico 14,619 39 0.3 500 3.4Worcester 6,659 36 0.5 124 1.9Southern Maryland 60,971 448 0.7 1,821 3.0Calvert 17,006 104 0.6 354 2.1Charles 26,779 243 0.9 940 3.5St. Mary’s 17,186 101 0.6 527 3.1
NOTE: SEED School of Maryland is a publicly-funded residential boarding school.
321,650 37.9 85,153 10.0 385,782 45.5152,352 40.3 17,782 4.7 185,855 49.2
17,216 23.0 5,204 7.0 48,857 65.372,783 87.8 2,584 3.1 6,492 7.841,922 40.6 4,863 4.7 49,483 47.9
1,179 4.3 718 2.6 25,163 90.87,905 20.5 1,498 3.9 27,750 71.8
11,193 22.1 2,913 5.8 28,106 55.5154 96.3 2 1.3 4 2.5
124,535 46.3 57,164 21.3 59,933 22.332,864 23.2 32,215 22.7 54,035 38.191,671 72.2 24,949 19.6 5,898 4.68,808 11.7 4,530 6.0 59,330 78.6
537 5.9 113 1.2 8,366 91.45,078 12.6 3,493 8.7 29,436 73.3
25 0.6 13 0.3 4,250 98.63,168 14.5 911 4.2 17,278 78.94,877 13.5 1,682 4.6 29,036 80.11,060 19.1 384 6.9 4,035 72.71,782 11.0 603 3.7 13,549 83.6
517 23.7 126 5.8 1,523 69.7622 8.0 236 3.0 6,763 86.8896 19.9 333 7.4 3,166 70.4
10,092 35.0 1,396 4.8 16,511 57.31,834 39.6 207 4.5 2,515 54.31,285 44.3 169 5.8 1,410 48.75,456 37.3 766 5.2 7,858 53.81,517 22.8 254 3.8 4,728 71.0
20,986 34.4 2,599 4.3 35,117 57.62,890 17.0 438 2.6 13,220 77.7
14,594 54.5 975 3.6 10,027 37.43,502 20.4 1,186 6.9 11,870 69.1

Fall Enrollment Trends - Prekindergarten through Grade 12: 2004, 2008, 2009
Fall Enrollment Trends - Public and Nonpublic Schools: 2004, 2008, 2009
4 5
Percent ChangeLocal Unit 2004 2008 2009 Five-Yr. One-Yr.
Percent Change 2004 2008 2009 Five-Yr. One-Yr.
Total State 865,561 843,861 848,412 -2.0 0.5Allegany 9,840 9,232 9,152 -7.0 -0.9Anne Arundel 73,991 73,653 74,776 1.1 1.5Baltimore City 88,401 82,266 82,866 -6.3 0.7Edison Schools 2,276 0 0 -100.0 n/aBaltimore 107,701 103,180 103,324 -4.1 0.1Calvert 17,451 17,052 17,006 -2.5 -0.3Caroline 5,412 5,513 5,551 2.6 0.7Carroll 28,792 27,964 27,721 -3.7 -0.9Cecil 16,535 16,209 16,205 -2.0 -0.0Charles 26,026 26,727 26,779 2.9 0.2Dorchester 4,788 4,560 4,628 -3.3 1.5Frederick 39,489 40,070 40,159 1.7 0.2Garrett 4,737 4,425 4,311 -9.0 -2.6Harford 40,294 38,610 38,636 -4.1 0.1Howard 48,219 49,905 50,641 5.0 1.5Kent 2,514 2,219 2,184 -13.1 -1.6Montgomery 139,393 139,282 141,722 1.7 1.8Prince George’s 136,095 127,977 127,039 -6.7 -0.7Queen Anne’s 7,713 7,859 7,793 1.0 -0.8St. Mary’s 16,567 16,752 17,186 3.7 2.6Somerset 2,952 2,912 2,898 -1.8 -0.5Talbot 4,505 4,419 4,495 -0.2 1.7Washington 20,807 21,734 21,902 5.3 0.8Wicomico 14,387 14,590 14,619 1.6 0.2Worcester 6,676 6,671 6,659 -0.3 -0.2SEED School 0 80 160 100.0 100.0
NOTES: 1. In 2008 and 2009, the three Edison Schools are included in the Baltimore City count.
2. SEED School of Maryland is a publicly-funded residential boarding school.
Total Pub/Nonpub 1,053,378 975,176 984,134 -6.6 0.9Total Public 865,561 843,861 848,412 -2.0 0.5Prekindergarten 23,380 26,821 28,626 22.4 6.7Kindergarten 54,838 60,530 61,428 12.0 1.5Grade 1 60,854 61,447 62,691 3.0 2.0Grade 2 61,152 59,409 62,079 1.5 4.5Grade 3 62,144 60,620 60,064 -3.3 -0.9Grade 4 63,776 59,512 61,183 -4.1 2.8Grade 5 65,688 60,905 60,168 -8.4 -1.2Grade 6 66,799 61,227 61,292 -8.2 0.1Grade 7 69,219 62,363 61,664 -10.9 -1.1Grade 8 69,567 63,639 62,590 -10.0 -1.6Grade 9 81,270 75,743 74,731 -8.0 -1.3Grade 10 68,249 67,829 68,025 -0.3 0.3Grade 11 61,193 62,900 62,598 2.3 -0.5Grade 12 57,432 60,916 61,273 6.7 0.6Total Nonpublic 187,817 131,315 135,722 -27.7 3.4Prekindergarten* 46,495 27,285 29,290 -37.0 7.3Kindergarten 14,686 8,560 8,377 -43.0 -2.1Grade 1 11,372 7,281 7,503 -34.0 3.0Grade 2 10,709 7,149 7,386 -31.0 3.3Grade 3 10,824 7,267 7,405 -31.6 1.9Grade 4 10,706 7,186 7,445 -30.5 3.6Grade 5 10,451 7,262 7,445 -28.8 2.5Grade 6 11,300 7,809 8,072 -28.6 3.4Ungraded Elementary 653 1,703 n/a n/a n/aGrade 7 11,370 8,302 8,360 -26.5 0.7Grade 8 11,092 8,421 8,831 -20.4 4.9Grade 9 10,784 8,667 9,196 -14.7 6.1Grade 10 9,475 8,406 8,851 -6.6 5.3Grade 11 8,715 7,690 8,873 1.8 15.4Grade 12 8,352 7,581 8,688 4.0 14.6Ungraded Secondary 833 746 n/a n/a n/a
* 2008 and 2009 prekindergarten data includes ages 2, 3, and 4.NOTE: Nonpublic school enrollment is self reported data from Maryland Nonpublic Schools.

Preschool Enrollment byLocation: 2009-2010
Number of Public and Nonpublic Schools in Maryland: 2009-2010
6 7
Local UnitJudy
Centers*Head Start
Accredi-tations**
Public Schools
Local UnitEle-
mentaryMid-dle
Sr. High
Com-bined Other
Total Public
Schools
Non-public
Schools
Total State 792 220 185 90 163 1,450 1,483Allegany 14 4 3 0 6 27 10Anne Arundel 79 19 12 0 15 125 143Baltimore City 49 11 23 64 46 193 151Baltimore 105 27 21 0 19 172 224Calvert 13 6 4 0 3 26 15Caroline 5 2 2 0 1 10 5Carroll 24 9 8 0 7 48 30Cecil 17 6 5 0 1 29 20Charles 21 8 6 0 2 37 31Dorchester 6 2 2 1 2 13 8Frederick 36 13 9 0 6 64 45Garrett 10 2 2 1 1 16 7Harford 32 9 9 0 3 53 47Howard 39 18 12 1 3 73 90Kent 4 0 1 3 0 8 7Montgomery 131 38 25 0 11 205 336Prince George’s 124 24 22 11 25 206 185Queen Anne’s 8 4 2 0 0 14 11St. Mary’s 17 4 3 0 4 28 37Somerset 4 1 0 3 1 9 3Talbot 5 1 1 1 0 8 12Washington 27 7 7 1 4 46 37Wicomico 16 3 3 2 1 25 19Worcester 6 1 3 2 2 14 10SEED School 0 1 0 0 0 1 n/a
NOTE: SEED School of Maryland is a publicly-funded residential boarding school.
Total State 11,751 11,029 491Allegany 372 319 16Anne Arundel 0 441 28Baltimore City 1,710 3,419 35Baltimore 631 891 45Calvert 563 139 15Caroline 257 237 3Carroll 525 191 17Cecil 477 148 6Charles 484 261 14Dorchester 260 207 3Frederick 822 314 38Garrett 370 300 19Harford 0 217 11Howard 585 264 22Kent 198 34 1Montgomery 1,036 865 102Prince George’s 598 1,107 53Queen Anne’s 339 120 8St. Mary’s 725 193 15Somerset 0 221 1Talbot 401 111 10Washington 446 451 14Wicomico 618 364 10Worcester 334 215 5
* Includes children in prekindergarten plus other children being served by the Judy Centers and their partnerships. The 3,145 children in kindergarten and the 1,519 children in Head Start at the Judy Centers are not included.** Number of accreditations for prekindergarten, Head Start, and child care centers. Kindergarten accreditations are not included.

Full-Time Equivalent StaffMaryland Public Schools: 2009-2010
8 9
Instructional
Local UnitGrand Total
Total Instruc-tional
Teacher &
Thera-pist
Media, Guid-
ance, & Psych.
Personnel
Other Profes- sional* Aide
Non-Instructional
Total Non- Instruc-tional
Central Office
Leader-ship**
Direct., Coord., Super-visor***
Principal, Vice Prin., Other Sch.
Admin.
Other Profes-sional^
Support Staff ^^
36,780 147 2,289 3,773 3,883 26,688406 2 34 43 14 313
2,821 6 124 529 249 1,9143,316 18 369 501 511 1,9175,032 23 243 435 524 3,807
654 3 52 75 64 460228 3 20 21 21 164
1,084 3 97 100 147 738629 3 48 69 49 460880 5 72 111 62 630226 4 18 28 17 159
1,627 8 117 150 57 1,295200 1 20 18 17 144
1,377 6 114 147 113 9971,845 6 171 183 214 1,271
111 3 10 13 4 816,665 17 270 490 888 5,0006,504 13 204 551 603 5,133
266 2 29 24 44 168650 3 66 69 67 445129 2 18 14 10 85225 3 31 19 23 150937 6 86 93 63 689639 3 51 59 63 463290 3 25 30 30 202
40 1 2 1 32 4
** Includes Superintendents and Assistant Superintendents.*** Also includes pupil personnel workers, school social workers, and other administrators.^ Includes nurses, admission officers, research specialists, etc.^^ Includes technicians, service workers, secretaries and clerks, drivers, crafts and trades personnel, laborers, non-instructional aides, etc.
Total State 116,598 79,818 59,773 4,345 2,623 13,078Allegany 1,392 986 711 57 40 178Anne Arundel 9,414 6,593 5,031 380 228 953Baltimore City 11,282 7,966 5,757 376 429 1,404Baltimore 14,352 9,320 7,636 541 88 1,055Calvert 2,209 1,555 1,123 79 29 324Caroline 791 562 412 34 9 107Carroll 3,594 2,509 1,965 140 33 371Cecil 2,247 1,618 1,184 82 74 277Charles 3,378 2,498 1,772 142 136 448Dorchester 688 462 365 23 6 68Frederick 5,354 3,727 2,709 189 79 750Garrett 646 446 354 15 7 70Harford 5,228 3,852 2,789 189 110 763Howard 7,560 5,716 3,983 296 208 1,229Kent 353 241 179 16 3 43Montgomery 20,285 13,620 9,893 755 651 2,322Prince George’s 17,196 10,693 8,511 630 217 1,335Queen Anne’s 966 700 530 38 27 105St. Mary’s 2,157 1,507 1,079 81 75 273Somerset 459 330 227 17 18 68Talbot 601 376 304 27 2 43Washington 2,952 2,015 1,543 103 76 293Wicomico 2,268 1,629 1,101 95 38 396Worcester 1,167 877 599 36 40 203SEED School 61 21 16 4 0 1
* Includes staff developers, teacher trainers, athletic coaches, remedial specialists, and other school-level instructional professionals.
NOTE: SEED School of Maryland is a publicly-funded residential boarding school.

Maryland Public School Teachers by Race and Gender: 2009-2010
10 11
African American
Local UnitGrand Total Total
Per-cent Male Female
White Other*
TotalPer-cent Male Female Total
Per-cent Male Female
45,018 76.1 10,197 34,821 3,613 6.1 704 2,909679 99.0 185 494 0 0.0 0 0
4,393 89.6 788 3,605 82 1.7 16 662,394 41.9 730 1,664 839 14.7 182 6576,630 87.0 1,454 5,176 202 2.7 51 1511,028 92.9 215 813 10 0.9 0 10
379 92.7 84 295 3 0.7 1 21,901 97.9 419 1,482 17 0.9 2 151,100 94.6 247 853 20 1.7 2 181,472 84.6 405 1,067 31 1.8 9 22
329 88.9 69 260 9 2.4 4 52,571 95.2 583 1,988 58 2.1 13 45
350 100.0 85 265 0 0.0 0 02,588 94.2 565 2,023 30 1.1 8 223,267 84.7 750 2,517 171 4.4 37 134
162 91.5 34 128 2 1.1 0 27,735 78.6 1,651 6,084 932 9.5 173 7593,028 35.8 800 2,228 1,145 13.5 197 948
490 93.5 105 385 7 1.3 0 7974 90.9 206 768 27 2.5 6 21197 87.6 47 150 0 0.0 0 0286 94.7 60 226 3 1.0 1 2
1,523 98.8 375 1,148 8 0.5 1 7981 89.5 219 762 12 1.1 1 11549 93.4 117 432 4 0.7 0 4
12 75.0 4 8 1 6.3 0 1
* Includes American Indian/Alaskan Native, Asian/Pacific Islander, and Hispanic.
Total State 59,142 10,511 17.8 2,323 8,188Allegany 686 7 1.0 1 6Anne Arundel 4,902 427 8.7 89 338Baltimore City 5,713 2,480 43.4 522 1,958Baltimore 7,621 789 10.4 196 593Calvert 1,107 69 6.2 17 52Caroline 409 27 6.6 9 18Carroll 1,941 23 1.2 6 17Cecil 1,163 43 3.7 14 29Charles 1,740 237 13.6 44 193Dorchester 370 32 8.6 8 24Frederick 2,702 73 2.7 12 61Garrett 350 0 0.0 0 0Harford 2,746 128 4.7 28 100Howard 3,855 417 10.8 87 330Kent 177 13 7.3 3 10Montgomery 9,844 1,177 12.0 252 925Prince George’s 8,452 4,279 50.6 977 3,302Queen Anne’s 524 27 5.2 10 17St. Mary’s 1,071 70 6.5 6 64Somerset 225 28 12.4 7 21Talbot 302 13 4.3 1 12Washington 1,542 11 0.7 5 6Wicomico 1,096 103 9.4 23 80Worcester 588 35 6.0 6 29SEED School 16 3 18.8 0 3
NOTE: SEED School of Maryland is a publicly-funded residential boarding school.

Salary Range for Ten-Month Teachers in Public Schools: 2009-2010
Average Salaries for Instructional Positions in Public Schools: 2009-2010
12 13
Local Unit
Professional Instructional
Staff PrincipalAssistant Principal Teacher*
Salary AnnualPercentage
IncreaseBeginning
(Bach-elor’s
Step 1)
Mid-level (Master’s & APC - Step 11)Local Unit
Maxi-mum*
Begin-ning
Mid-level
State Average $66,930 $115,362 $97,554 $65,022Allegany 61,575 95,113 80,760 60,165Anne Arundel 68,417 121,997 103,629 66,273Baltimore City 61,626 105,206 91,707 59,350Baltimore 62,887 117,088 92,747 60,866Calvert 73,247 116,595 96,966 71,641Caroline 57,103 101,873 84,227 55,445Carroll 61,757 109,059 91,008 60,057Cecil 59,147 101,160 86,834 57,315Charles 62,907 117,466 92,861 60,868Dorchester 57,276 95,630 74,459 55,370Frederick 65,607 113,156 95,176 63,761Garrett 59,350 82,963 66,972 58,333Harford 59,910 109,410 88,815 58,139Howard 69,207 129,544 103,866 67,304Kent 59,530 91,952 79,452 57,838Montgomery 78,728 132,276 116,941 76,865Prince George’s 68,655 116,989 98,201 66,720Queen Anne’s 60,806 114,226 95,004 58,957St. Mary’s 65,682 120,043 102,368 63,137Somerset 56,731 88,401 68,932 55,331Talbot 58,983 99,412 86,653 57,097Washington 60,075 103,899 84,107 58,403Wicomico 59,099 92,897 79,013 57,824Worcester 62,948 110,921 92,544 61,128SEED School 57,775 95,000 n/a 56,002
* Includes classroom and other teachers, therapists, librarians, guidance counselors, and school psychologists.
NOTE: SEED School of Maryland is a publicly-funded residential boarding school.
State Average $42,760 $58,933 $82,987 0.5 -0.0Allegany 41,511 58,347 75,357 2.0 2.0Anne Arundel 43,452 63,161 90,520 0.0 0.0Baltimore City 44,820 59,687 80,596 0.0 0.0Baltimore 42,000 55,536 80,762 0.0 0.0Calvert 44,600 70,633 102,425 0.0 0.0Caroline 41,310 54,211 73,911 0.0 0.0Carroll 40,400 56,176 81,355 0.0 -3.1Cecil 42,132 57,010 76,003 1.1 1.1Charles 43,724 58,262 84,842 0.0 -3.4Dorchester 40,640 53,876 74,630 0.0 0.0Frederick 40,706 55,965 94,846 0.0 -3.4Garrett 42,043 55,515 71,220 0.0 0.0Harford 41,171 58,699 80,188 0.0 0.0Howard 45,061 64,503 92,619 1.2 -1.9Kent 41,448 54,261 78,567 0.5 0.5Montgomery 46,410 73,038 103,634 0.0 0.0Prince George’s 44,799 63,793 91,752 1.0 1.0Queen Anne’s 43,860 56,550 83,340 2.0 2.0St. Mary’s 44,018 60,866 90,520 1.8 1.8Somerset 41,300 55,277 73,862 0.0 0.0Talbot 42,800 57,000 76,500 0.9 1.1Washington 43,662 60,306 76,409 2.0 2.0Wicomico 42,140 54,700 76,750 0.0 0.0Worcester 42,222 57,022 81,073 0.0 0.0
* Educational level and years of experience required to reach maximum vary among local units.
NOTE: The SEED School follows the Baltimore City Public Schools terms of compensation for teachers.

Maryland High School AssessmentResults: 2010
Maryland School AssessmentResults: 2008, 2009, 2010
14 15
Reading Mathematics(percent scoring at each level)
2010 BasicProfi-cient
Ad-vanced Basic
Profi-cient
Ad-vanced
Grade 3 16.0 62.8 21.2 14.0 51.9 34.1Grade 4 12.6 57.9 29.5 9.8 43.6 46.6Grade 5 10.6 36.1 53.3 16.9 57.9 25.3Grade 6 13.9 42.8 43.3 20.2 50.1 29.7Grade 7 18.2 36.8 45.1 27.4 49.2 23.4Grade 8 19.6 35.5 44.8 34.6 35.9 29.5
2009 BasicProfi-cient
Ad-vanced Basic
Profi-cient
Ad-vanced
Grade 3 15.1 63.0 21.9 15.7 55.5 28.8Grade 4 13.4 59.9 26.8 10.8 44.3 44.9Grade 5 10.5 39.9 49.6 18.8 56.1 25.1Grade 6 16.6 43.3 40.2 24.0 47.0 29.0Grade 7 18.3 38.1 43.7 28.0 49.0 23.0Grade 8 19.8 43.3 36.9 34.2 37.1 28.6
2008 BasicProfi-cient
Ad-vanced Basic
Profi-cient
Ad-vanced
Grade 3 17.0 66.1 16.9 17.4 55.9 26.7Grade 4 11.5 60.5 27.9 11.4 46.2 42.4Grade 5 13.3 35.7 51.0 19.5 55.1 25.4Grade 6 18.2 38.8 42.9 24.2 44.0 31.8Grade 7 18.8 38.3 42.9 31.8 46.5 21.7Grade 8 27.2 38.7 34.1 38.1 32.8 29.0
NOTES: 1. The end of course High School Assessment exams in English 2 and Algebra/Data Analysis satisfy the federal NCLB requirement to test students once in High School. Students in Maryland are required to pass the four High School Assessment Exams as a graduation requirement. The pass rates for students are reported based on a status model on page 15.
2. For disaggregated test scores at the State, local school system, and local school levels, please visit the Maryland Public Schools Report Card website at www.mdreportcard.org. NOTE: HSA status shows the number of students by grade and
subgroup who have taken all four HSA tests—Algebra/Data Analysis, Biology, Government, and English—and met the Maryland High School Assessment requirement for graduation. Please note that to graduate, students must also meet additional state and local requirements.
Percent of HSA Requirement Met by
Students Who Have Taken all Four Tests
Grade 12 All Students 99.9American Indian/Alaskan Native 99.5African American 99.8Asian/Pacific Islander 100.0White (non-Hispanic) 99.9Hispanic 99.5Special Education 99.2Limited English Proficient (LEP) 99.1Free and Reduced Meals (FARMS) 99.8
Grade 11 All Students 88.7American Indian/Alaskan Native 90.9African American 77.6Asian/Pacific Islander 96.4White (non-Hispanic) 95.9Hispanic 83.6Special Education 57.4Limited English Proficient (LEP) 52.4Free and Reduced Meals (FARMS) 76.4
Grade 10All Students 84.1American Indian/Alaskan Native 84.3African American 69.7Asian/Pacific Islander 95.5White (non-Hispanic) 92.9Hispanic 79.2Special Education 44.3Limited English Proficient (LEP) 51.2Free and Reduced Meals (FARMS) 68.3

Post-Graduation Plans - Maryland Public School Graduates: 2010
16 17
Number of Graduates
Local Unit TotalHigh School
Diploma
Special Education
Completion
Early College
Admission
Graduation Plans
TotalGradu-ates*
CollegeFull-time
CollegePart-time
Trade/Bus.
SchoolFull-time
WorkFull-time
MilitaryFull-time
Other/NR**
Total State 59,774 58,953 694 127Allegany 671 658 13 0Anne Arundel 5,161 5,114 47 0Baltimore City 4,494 4,421 73 0Baltimore 7,399 7,350 47 2Calvert 1,378 1,374 2 2Caroline 381 372 3 6Carroll 2,321 2,288 26 7Cecil 1,153 1,135 16 2Charles 2,134 2,110 24 0Dorchester 309 300 9 0Frederick 3,103 3,076 27 0Garrett 331 322 8 1Harford 2,730 2,699 31 0Howard 3,896 3,850 37 9Kent 160 158 2 0Montgomery 10,528 10,342 181 5Prince George’s 8,325 8,246 75 4Queen Anne’s 562 555 7 0St. Mary’s 1,154 1,145 9 0Somerset 176 170 6 0Talbot 376 370 6 0Washington 1,539 1,425 27 87Wicomico 962 948 13 1Worcester 531 525 5 1
52,131 37,457 6,505 2,248 6,885 2,244 2,214639 380 83 21 116 42 64
4,649 3,142 667 193 696 227 2602,719 1,785 503 153 413 75 1535,963 4,113 812 264 804 203 3401,320 976 146 57 234 68 33
358 212 42 21 81 25 132,115 1,465 234 67 366 93 1091,161 686 159 69 255 70 511,935 1,342 257 104 246 129 78
281 155 47 29 56 18 172,861 2,143 332 89 380 127 97
314 204 26 17 77 13 252,642 1,869 327 144 447 132 953,674 3,142 277 65 260 96 56
146 73 28 9 29 16 98,678 7,255 806 181 627 205 2517,788 5,433 1,003 561 901 375 313
543 352 62 15 91 27 331,037 666 169 48 208 94 25
182 109 36 10 27 11 14239 166 29 11 28 13 15
1,464 889 233 48 286 93 98905 544 169 48 174 61 46518 356 58 24 83 31 19
* Number of students who responded to the MSDE Class of 2010 High School Graduate Questionnaire.
** Students’ survey responses include “other” or no response.

Scholastic Aptitude Test Results* Trends: 2007 to 2010
18
Critical Reading Math WritingYear MD US MD US MD US2010 501 501 506 516 495 492
2009 500 501 502 515 495 493
2008 499 502 502 515 497 494
2007 500 502 502 515 496 494
High School Dropouts and Retentions, Grades 9-12: 2009-2010
19
Local UnitNumber of Dropouts*
Dropout Rate
2010 MD Results by Gender/Ethnic Group (Average Scores)Gender/Ethnic Group Critical Reading Math WritingMale 497 521 481Female 493 486 494American Indian/Alaskan Native 489 473 465Asian/Pacific Islander 548 598 553African American 426 417 418Hispanic 480 484 477White 536 548 528
2010 MD Results Compared to Nearby States (Average Scores)State Critical Reading Math WritingMaryland 501 506 495Delaware 493 495 481Pennsylvania 492 501 480District of Columbia 474 464 466Virginia 512 512 497New York 484 499 478New Jersey 495 514 497
* Scores range from 200 to 800.NOTE: Includes public and nonpublic test-takers.Source: College Board
Total/Average State 7,579 2.50Allegany 69 2.22Anne Arundel 713 2.79Baltimore City 1,147 4.07Baltimore 1,195 3.03Calvert 105 1.57Caroline 63 3.51Carroll 95 0.94Cecil 200 3.40Charles 195 1.81Dorchester 34 2.10Frederick 173 1.18Garrett 26 1.60Harford 284 2.13Howard 257 1.39Kent 11 1.52Montgomery 1,034 1.98Prince George’s 1,275 2.64Queen Anne’s 47 1.69St. Mary’s 175 2.91Somerset 43 4.56Talbot 37 2.17Washington 149 1.83Wicomico 219 4.52Worcester 33 1.32
* Excludes re-entries.

Financial ResourcesMaryland Public Schools: FY 2009
Where the Money Comes From
Where the Money Goes
20
* Includes Office of the Principal and Instructional Supervision.
** Includes Student Personnel and Health Services, Adult Education, Community Services, Net Food Service, and current equipment.
Administration
Instructional Salaries
Operation/Maintenance
Mid-levelAdministration*
SpecialEducation
Other Sources
LocalGovernmentState
Other**
Other InstructionalCosts
StudentTransportation
Fixed Charges
Federal
Maintenance of Effort (MOE)Maryland Public Schools: FY 2010
21
Local Unit
Net Local Appro-
priation*MOE
Required Differ- ence
Percent Over
Required MOE
Allegany 28,200,000 27,702,592 497,408 1.80Anne Arundel 554,026,500 553,103,842 922,658 0.17Baltimore City 199,427,631 199,427,631 0 0.00Baltimore 659,978,426 629,418,307 30,560,119 4.86Calvert 103,264,617 98,287,497 4,977,120 5.06Caroline 12,145,724 12,145,724 0 0.00Carroll 165,793,857 155,271,417 10,522,440 6.78Cecil 68,385,625 68,368,269 17,356 0.03Charles 145,093,200 145,091,628 1,572 0.00Dorchester 17,034,817 17,034,817 0 0.00Frederick 228,942,398 228,631,147 311,251 0.14Garrett 23,159,000 22,610,922 548,078 2.42Harford 210,914,800 208,250,169 2,664,631 1.28Howard 450,473,114 450,473,111 3 0.00Kent 17,329,706 16,648,957 680,749 4.09Montgomery 1,450,017,125 1,529,565,696 (79,548,571) -5.20Prince George’s 526,405,800 538,104,085 (11,698,285) -2.17Queen Anne’s 48,215,625 47,595,619 620,006 1.30St. Mary’s 74,139,685 74,139,685 0 0.00Somerset 8,624,324 8,589,510 34,814 0.41Talbot 34,219,073 34,211,041 8,032 0.02Washington 87,829,920 86,213,678 1,616,242 1.87Wicomico 50,781,711 50,781,711 0 0.00Worcester 71,954,064 71,954,064 0 0.00
* Net Local Appropriation equals operating budget appropriation plus supplemental appropriations, less approved nonrecurring costs, less program shifts between county and board budgets, and less other reconciling items.
Local Government $5,465,793,868 47.42%State $5,340,712,544 46.34%Federal $681,345,051 5.91%Other Sources $37,917,930 0.33%
Administration $299,812,090 2.6%Instructional Salaries $4,125,991,221 36.0%Other Instructional Costs $372,647,575 3.3%Special Education $1,420,023,411 12.4%Mid-level Administration* $742,486,623 6.5%Student Transportation $499,247,569 4.4%Operation/Maintenance $942,000,957 8.2%Fixed Charges $2,581,624,020 22.5%Other** $469,408,234 4.1%

Major State Aid Programs for Maryland Public Schools: FY 2010 (Thousands of Dollars)
22
Bridge to Excellence (BTE) *
Local Unit
Total Major State Aid Programs
Total BTE Funds
Foundation Program
Compen-satory
Education
23
Bridge to Excellence (BTE) *Limited English
Proficient
Special Education Formula
Transpor-tationAid
Guar-anteed
Tax Base
Supple-mental Grant
Teacher Retire-ment
Total State $5,324,840 $4,565,764 $2,853,049 $940,183Allegany 91,907 83,886 43,060 21,962Anne Arundel 327,334 264,705 181,683 41,572Baltimore City 882,408 808,629 403,191 269,495Baltimore 574,276 488,277 328,873 93,820Calvert 99,510 84,346 65,569 7,925Caroline 46,193 41,743 24,180 10,454Carroll 160,041 136,636 107,532 10,359Cecil 108,097 94,846 64,367 16,505Charles 168,459 146,914 106,694 21,116Dorchester 33,420 29,480 17,037 6,963Frederick 233,609 200,592 151,893 20,776Garrett 28,388 24,530 14,446 4,850Harford 233,359 201,781 146,645 26,666Howard 243,783 192,225 146,715 16,186Kent 11,493 9,371 3,874 2,179Montgomery 605,882 455,901 254,550 90,997Prince George’s 992,769 878,870 534,368 186,308Queen Anne’s 35,483 29,704 21,175 3,231St. Mary’s 104,395 91,363 62,125 12,317Somerset 26,100 23,357 12,315 6,603Talbot 13,651 10,341 4,277 3,372Washington 154,437 137,857 88,158 30,613Wicomico 125,959 113,642 63,977 30,097Worcester 23,886 16,767 6,344 5,819
* Excludes funding for aging schools. Totals may not sum due to rounding.
NOTE: Major State Aid Programs in fiscal year 2010 are fully-funded with American Recovery and Reinvestment (ARRA), State Fiscal Stabilization (SFSF), Education Stabilization Fund funds.
$148,627 $267,404 $241,547 $63,754 $51,200 $759,077147 5,735 4,310 8,227 444 8,021
5,363 15,873 20,213 0 0 62,62910,595 55,421 18,335 33,281 18,311 73,78011,026 28,280 26,278 0 0 85,999
761 4,708 5,384 0 0 15,163854 1,944 2,421 563 1,327 4,450682 8,272 9,289 0 502 23,405545 6,126 4,772 2,009 520 13,251818 6,367 9,706 2,213 0 21,545273 1,307 2,229 8 1,662 3,941
5,181 11,427 11,316 0 0 33,01710 1,247 2,776 0 1,201 3,859
1,942 13,950 11,607 0 972 31,5785,720 8,923 14,681 0 0 51,558
172 680 1,463 0 1,003 2,12244,132 32,669 33,554 0 0 149,98154,098 40,107 36,619 6,796 20,574 113,899
398 1,805 3,094 0 0 5,778501 5,608 6,129 0 4,683 13,031640 1,299 1,741 760 0 2,744512 723 1,458 0 0 3,310
1,901 7,569 6,478 3,137 0 16,5811,853 6,047 4,908 6,759 0 12,317
504 1,316 2,785 0 0 7,119

Cost per Pupil Belonging* Maryland Public Schools: FY 2009
24
* Inc
lude
s th
e fo
llow
ing
expe
nditu
re c
ateg
orie
s: a
dmin
istra
tion,
mid
-leve
l adm
inis
tratio
n, in
stru
ctio
nal s
alar
ies
and
wage
s, te
xtbo
oks
and
othe
r ins
truct
iona
l
mat
eria
ls, o
ther
inst
ruct
iona
l cos
ts, s
peci
al e
duca
tion,
stu
dent
per
sonn
el s
ervi
ces,
hea
lth s
ervi
ces,
stu
dent
tran
spor
tatio
n, o
pera
tion
of p
lant
, mai
nten
ance
of
plan
t, fix
ed c
harg
es, a
nd s
tate
-pai
d te
ache
rs’ r
etire
men
t. E
xpen
ditu
res
for e
quip
men
t, tu
ition
pay
men
ts, a
nd in
terfu
nd tr
ansf
ers
are
excl
uded
.
NO
TE:
Cos
t per
pup
il re
flect
s th
e av
erag
e co
st o
f pro
vidi
ng e
duca
tiona
l and
rela
ted
serv
ices
to th
e st
uden
ts in
eac
h lo
cal s
choo
l sys
tem
.
25

State Foundation Aid Per Pupil and Local Wealth* Per Pupil: FY 2010
26 27
* Loc
al w
ealth
incl
udes
adj
uste
d re
al p
rope
rty a
sses
smen
t, pu
blic
utilit
y op
erat
ing
prop
erty
, and
net
taxa
ble
inco
me.
Sour
ce: F
Y 20
10 S
tate
Aid
Cal
cula
tion,
whi
ch in
clud
es fu
ndin
g fo
r the
Geo
grap
hic
Cos
t of E
duca
tion
Inde
x (G
CEI
).

Title I Statistics, Maryland Public Schools: 2009-2010
29
Number of Schools and Program Types Operated
Local Unit
Total Title I Alloca-tions
Number of Partici-
pants TotalSchool-
wide
Targeted Assis-tance
Education Effort Index: FY 2010
28
Local UnitLocal
Appropriation Local
WealthEducation
Effort
FY 2010 Index
Total State $5,345,579,117 $424,121,819,616 0.013 1.00Allegany 28,200,000 2,368,718,561 0.012 0.94Anne Arundel 554,026,500 47,283,394,662 0.012 0.93Baltimore City 210,018,415 22,597,543,501 0.009 0.74Baltimore 670,737,639 52,282,847,504 0.013 1.02Calvert 103,615,515 7,530,858,697 0.014 1.09Caroline 12,145,724 1,694,536,303 0.007 0.57Carroll 167,700,000 12,415,094,627 0.014 1.07Cecil 68,385,625 6,113,584,940 0.011 0.89Charles 145,414,200 10,714,794,139 0.014 1.08Dorchester 17,034,817 1,821,329,170 0.009 0.74Frederick 228,942,398 17,766,754,495 0.013 1.02Garrett 23,159,000 2,269,239,054 0.010 0.81Harford 210,914,800 16,413,946,864 0.013 1.02Howard 457,560,424 28,138,108,641 0.016 1.29Kent 17,329,706 1,614,202,463 0.011 0.85Montgomery 1,450,017,125 102,296,995,910 0.014 1.12Prince George’s 597,689,400 52,100,740,002 0.011 0.91Queen Anne’s 47,465,625 4,618,968,485 0.010 0.82St. Mary’s 79,945,102 7,085,213,781 0.011 0.90Somerset 8,743,774 917,190,718 0.010 0.76Talbot 34,219,073 4,879,778,885 0.007 0.56Washington 89,578,480 8,191,648,335 0.011 0.87Wicomico 50,781,711 4,416,144,536 0.011 0.91Worcester 71,954,064 8,590,185,343 0.008 0.66
NOTES:1. Education effort is calculated by dividing local education appropriation by local wealth and indexing to State average.
2. Local education appropriations reflect actual numbers reported to MSDE by the LEAs in their Annual Budget reports in accordance with Appendix B of the Financial Reporting Manual, Maryland Public Schools. The appropriations include monies received out of funds set aside for school purposes, but do not include funds received by the LEA from other sources, such as gifts and bequests or funds generated by the LEA through rental of LEA facilities, user fees, tuition, earnings from investments, loans, debt proceeds or sale of assets.
3. Local wealth is the amount used in the current expense formula (Section 5-202 of the Education Article) and includes county assessable base for fiscal year 2010 (July 1, 2009) and net taxable income for tax year 2008 (September 1, 2009).
Total State $311,884,185 143,517 409 304 105Allegany 3,930,841 3,212 10 10 0Anne Arundel 16,169,313 4,944 21 11 10Baltimore City 118,218,365 45,552 140 102 38Baltimore 36,835,053 17,985 44 38 6Calvert 1,885,641 355 6 0 6Caroline 1,614,732 2,770 5 5 0Carroll 1,261,142 277 4 0 4Cecil 4,035,127 3,277 7 6 1Charles 4,318,526 2,491 6 6 0Dorchester 2,098,093 1,637 4 4 0Frederick 5,353,825 2,442 8 3 5Garrett 1,888,953 1,485 8 7 1Harford 6,823,228 3,203 6 6 0Howard 2,041,815 589 10 0 10Kent 714,076 833 4 4 0Montgomery 31,861,281 14,837 30 30 0Prince George’s 49,660,350 24,707 60 46 14Queen Anne’s 1,052,432 534 3 1 2St. Mary’s 3,498,158 2,055 4 4 0Somerset 2,081,869 1,498 4 4 0Talbot 1,051,762 1,118 3 1 2Washington 6,474,597 2,778 6 6 0Wicomico 6,530,308 3,699 12 7 5Worcester 2,344,496 1,200 3 3 0SEED School 140,201 39 1 0 1
NOTE: SEED School of Maryland is a publicly-funded residential boarding school.
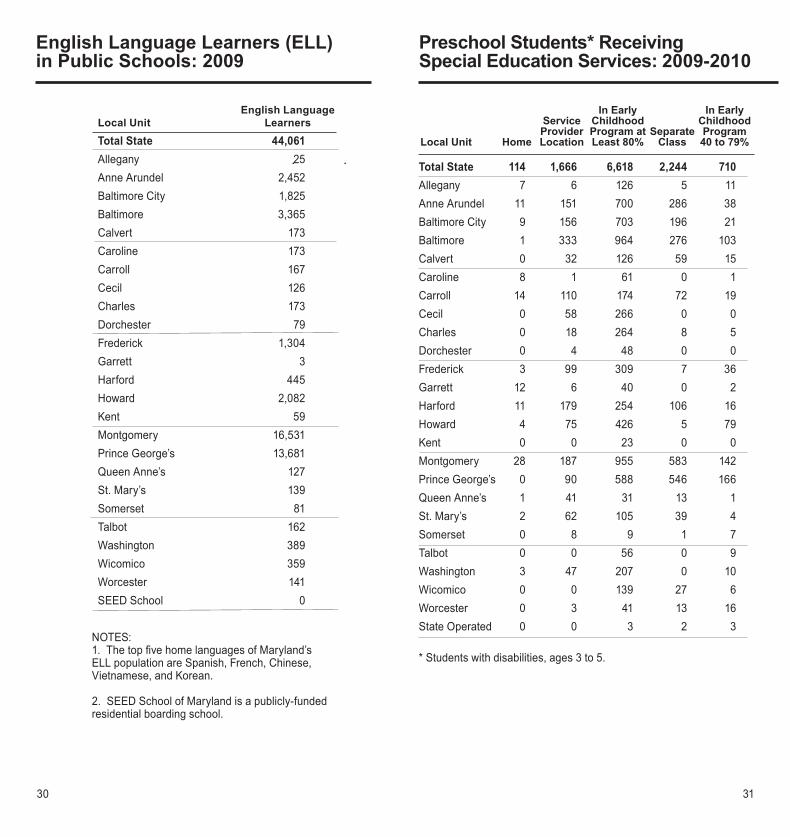
English Language Learners (ELL)in Public Schools: 2009
30
Preschool Students* Receiving Special Education Services: 2009-2010
31
Local Unit Home
Service Provider Location
In Early Childhood Program at Least 80%
SeparateClass
In Early Childhood Program 40 to 79%
Total State 114 1,666 6,618 2,244 710Allegany 7 6 126 5 11Anne Arundel 11 151 700 286 38Baltimore City 9 156 703 196 21Baltimore 1 333 964 276 103Calvert 0 32 126 59 15Caroline 8 1 61 0 1Carroll 14 110 174 72 19Cecil 0 58 266 0 0Charles 0 18 264 8 5Dorchester 0 4 48 0 0Frederick 3 99 309 7 36Garrett 12 6 40 0 2Harford 11 179 254 106 16Howard 4 75 426 5 79Kent 0 0 23 0 0Montgomery 28 187 955 583 142Prince George’s 0 90 588 546 166Queen Anne’s 1 41 31 13 1St. Mary’s 2 62 105 39 4Somerset 0 8 9 1 7Talbot 0 0 56 0 9Washington 3 47 207 0 10Wicomico 0 0 139 27 6Worcester 0 3 41 13 16State Operated 0 0 3 2 3
* Students with disabilities, ages 3 to 5.
Local UnitEnglish Language
LearnersTotal State 44,061 Allegany 25 Anne Arundel 2,452 Baltimore City 1,825 Baltimore 3,365 Calvert 173 Caroline 173 Carroll 167 Cecil 126 Charles 173 Dorchester 79 Frederick 1,304 Garrett 3 Harford 445 Howard 2,082 Kent 59 Montgomery 16,531 Prince George’s 13,681 Queen Anne’s 127 St. Mary’s 139 Somerset 81 Talbot 162 Washington 389 Wicomico 359 Worcester 141 SEED School 0
NOTES: 1. The top five home languages of Maryland’s ELL population are Spanish, French, Chinese, Vietnamese, and Korean.
2. SEED School of Maryland is a publicly-funded residential boarding school.

33
Special School**
Day Residential Other Location
Public Private Public Private Home Hospital
Students Receiving Special Education Services by Location: 2009-2010
32
Local Unit
Total Special
Education
In the Regular
Education Classroom
80% or More
In the Regular
Education Classroom 40 to 79%
In the Regular
Education Classroom Under 40%
Regular School*
Total State 90,486 58,635 10,779 13,170Allegany 1,166 963 29 109Anne Arundel 6,605 4,423 874 796Baltimore City 12,662 6,359 1,917 2,972Baltimore 11,484 7,386 1,415 1,509Calvert 1,557 858 479 115Caroline 484 400 26 49Carroll 2,899 2,165 324 238Cecil 1,804 1,628 55 39Charles 2,053 1,286 328 369Dorchester 402 288 91 16Frederick 4,022 3,231 319 265Garrett 472 362 45 47Harford 4,655 3,807 309 205Howard 3,785 2,886 468 209Kent 321 250 36 28Montgomery 14,734 9,816 2,004 1,871Prince George’s 12,985 6,373 1,536 3,704Queen Anne’s 832 767 24 34St. Mary’s 1,732 1,350 158 163Somerset 364 312 9 36Talbot 305 228 52 16Washington 2,172 1,752 106 184Wicomico 1,531 1,166 154 188Worcester 634 561 20 4State Operated 808 1 1 3SEED School 18 17 0 1
* Students with disabilitites, ages 6 to 21.
NOTE: SEED School of Maryland is a publicly-funded residential boarding school.
2,806 3,815 11 184 195 151 48 0 2 1 1
172 306 0 7 6 2624 744 4 18 24 3372 484 0 7 60 156 36 0 1 9 1
0 2 0 3 4 027 129 0 1 6 0
1 67 0 1 6 07 47 1 2 1 00 3 0 2 2 0
82 94 0 4 14 10 14 0 0 4 0
110 84 1 5 15 078 125 3 3 2 00 1 0 2 2 0
404 513 0 15 2 1394 934 2 12 7 1
2 4 0 0 1 05 20 0 5 10 03 1 0 0 2 00 2 0 0 2 0
35 80 0 0 8 11 8 0 1 1 3
39 0 0 0 4 0393 69 0 93 2 0
0 0 0 0 0 0
** Students with disabilities, ages 3 to 21.NOTES:1. Special School - students receiving special education services more than 50% of the school day in a separate facility.2. Home/Hospital - students receiving special education services in hospital programs or homebound programs.

Conditions of Students* Receiving Special Education Services: 2009-2010
34
Local Unit
Total Special
Education
Intellec-tual Dis-ability
Deaf/ Hearing Impaired
Trau-matic Brain Injury
Au-tism
Speech/ Lan-
guage
35
Visu- ally Im-paired
Emo-tional Dis-
ability
Orthope-dically
Im-paired
Other Health
Im-paired
Specific Learning Disability
Mul-tiple Dis-
abilitiesDeaf/ Blind
Devel-op-
mental Delay
Total State 103,018 5,472 1,202 287 8,186 21,107Allegany 1,337 76 4 3 62 377Anne Arundel 7,881 415 51 28 789 1,582Baltimore City 13,888 1,162 84 39 630 2,586Baltimore 13,307 549 94 39 1,167 2,746Calvert 1,808 76 21 3 170 597Caroline 555 44 2 1 42 185Carroll 3,312 111 15 8 232 1,002Cecil 2,128 95 9 12 91 506Charles 2,365 175 9 10 153 704Dorchester 454 69 5 0 30 107Frederick 4,569 152 41 11 477 1,257Garrett 532 42 3 0 16 142Harford 5,276 193 31 14 381 1,319Howard 4,419 202 34 10 644 1,146Kent 344 17 1 2 19 42Montgomery 16,898 652 264 27 1,501 3,613Prince George’s 14,500 949 124 46 1,196 1,294Queen Anne’s 927 19 6 1 59 143St. Mary’s 1,990 73 19 8 135 470Somerset 404 27 0 0 27 56Talbot 370 32 2 1 22 131Washington 2,459 196 14 10 164 515Wicomico 1,709 117 13 10 132 376Worcester 709 25 5 3 46 205State Operated 859 3 351 1 0 4SEED School 18 1 0 0 1 2
* Students with disabilities, ages 3 to 21.
NOTE: SEED School of Maryland is a publicly-funded residential boarding school.
388 8,047 402 15,613 32,891 2,938 23 6,4621 85 1 235 378 37 0 788 630 15 1,011 2,210 510 0 632
52 1,994 66 2,694 3,922 252 0 40727 1,078 38 1,897 4,304 399 1 968
4 88 1 286 479 26 0 573 26 2 33 195 19 0 3
14 207 13 401 1,007 87 1 2144 81 18 286 868 55 0 1035 202 5 346 539 61 0 1566 49 1 25 135 13 0 14
24 309 12 659 1,397 137 0 933 96 1 44 178 7 0 0
28 299 17 1,163 1,456 184 2 18919 204 24 672 978 164 1 3211 15 0 50 159 8 0 30
63 684 59 2,755 5,608 256 1 1,41540 1,361 106 1,688 5,833 422 4 1,437
1 41 1 105 479 20 1 515 111 2 269 765 20 0 1130 12 4 69 167 13 0 290 18 5 37 110 10 0 29 247 2 405 791 37 1 688 84 9 303 568 20 0 693 10 0 126 243 31 0 12
60 116 0 47 115 150 11 10 0 0 7 7 0 0 0

Career and Technology Education Programs in Public Schools: 2009-2010
36
Local Unit
Total Career & Tech-nology
Education
Consumer Services, Hosp. & Tourism
Health & Bio Sci-ences
Business Mgmt., Mktg. & Finance
Arts, Media, & Com-muni-cation
37
Human Re-
sources Services
Environ-mental & Natural
Resource Systems
Manufac-turing, Engi-
neering & Tech-nology
Trans-por-
tation Tech-
nologies
Con-struction
& Develop-
ment
Infor-mation Tech-
nology Co-op
Total State 111,366 12,572 3,948 33,106 3,344Allegany 1,073 290 15 146 29Anne Arundel 11,916 4,056 332 1,070 78Baltimore City 5,323 616 652 1,139 520Baltimore 11,572 1,074 430 3,803 703Calvert 3,086 626 112 1,325 92Caroline 889 94 45 172 70Carroll 4,914 202 116 1,103 664Cecil 2,731 418 143 703 0Charles 2,667 104 85 770 28Dorchester 413 33 31 12 0Frederick 6,864 206 85 1,965 39Garrett 1,432 30 31 374 0Harford 7,216 1,724 239 2,371 50Howard 4,090 330 159 1,010 100Kent 342 64 35 0 33Montgomery 20,838 1,025 1,143 4,710 356Prince George’s 16,823 696 50 10,343 39Queen Anne’s 1,340 39 72 350 214St. Mary’s 1,655 94 0 453 77Somerset 165 25 25 14 0Talbot 994 173 0 65 190Washington 3,259 473 55 514 42Wicomico 985 87 29 433 0Worcester 779 93 64 261 20
21,060 5,185 10,073 2,151 4,249 7,495 8,183141 55 41 49 76 231 0
2,250 31 836 264 387 1,391 1,221762 0 178 122 395 719 220
3,215 127 447 131 583 228 831541 0 73 57 188 38 34
71 109 174 82 72 0 0558 1,132 128 170 743 73 25528 27 534 33 92 123 130506 14 313 100 38 307 402
0 20 0 76 95 146 01,548 1,305 482 84 101 423 626
67 146 394 87 217 86 01,642 339 112 70 174 140 355
533 0 766 20 19 519 6341 24 80 73 32 0 0
4,520 772 4,496 302 30 2,669 8153,016 0 196 113 146 88 2,136
10 124 335 26 93 77 0353 43 73 93 38 135 296
34 0 0 25 28 14 051 82 70 38 120 0 205
500 788 238 48 356 36 209121 19 29 62 136 25 4492 28 78 26 90 27 0

School Library Media Centers inMaryland Public Schools: 2009-2010
38
Percent of Schools Meeting Staffing
Standards*Number ofLibrary Media
Centers
CentralOffice
Profes-sionals**Local Unit
Profes-sional
Clerical/Technical
39
Materials Collection *** Technology Services
Centers MeetingOnline
Databases-Average
Per School^
Percent ofCenters with
Public Access
Catalogs (PAC)
Percent of Centers with Home PAC Access for Students
Collection
Number
Guidelines
Percent
Total State 1,346 70.5 41.5 14.60Allegany 20 80.0 0.0 0.40Anne Arundel 117 89.7 38.5 1.00Baltimore City 173 46.2 2.9 1.00Baltimore 158 83.5 12.6 1.00Calvert 21 95.2 76.1 0.20Caroline 9 88.9 11.1 0.20Carroll 47 91.5 44.6 1.00Cecil 27 59.2 11.1 0.80Charles 35 91.4 91.4 1.00Dorchester 8 25.0 12.5 0.80Frederick 63 90.5 55.6 1.00Garrett 16 12.5 75.0 0.80Harford 49 91.8 79.6 1.00Howard 72 98.6 97.2 0.40Kent 8 25.0 75.0 0.00Montgomery 199 98.5 68.3 1.00Prince George’s 192 70.8 15.6 1.00Queen Anne’s 14 78.6 14.3 0.40St. Mary’s 25 88.0 52.0 0.20Somerset 7 42.8 14.3 0.40Talbot 9 7.8 11.1 0.20Washington 45 88.9 22.2 0.40Wicomico 20 55.0 70.0 0.20Worcester 12 91.7 45.4 0.20
* The full report, Facts about Maryland’s School Library Media Programs 2009-2010, will be available online December 2010 at: http://www. marylandpublicschools.org/MSDE/programs/technology/library_media.
** Full-time equivalent; 58.3% of the system level school library media administrators are certified educational media administrators.
456 33.9 15.3 97.2 87.13 15.0 9 100.0 100.0
47 40.2 28 100.0 100.012 6.9 32 100.0 100.048 30.4 15 100.0 100.0
7 33.3 12 100.0 81.05 55.6 17 100.0 100.0
15 31.9 14 100.0 95.75 18.5 17 100.0 77.7
21 60.0 15 100.0 100.01 12.5 9 100.0 75.0
35 55.6 20 100.0 100.00 0.0 9 100.0 100.0
17 34.7 16 100.0 87.847 65.3 14 100.0 100.00 0.0 10 37.5 0.0
110 55.3 29 100.0 100.037 19.3 15 100.0 99.55 35.7 9 100.0 100.0
21 84.0 9 100.0 92.01 14.3 10 100.0 100.01 11.1 12 100.0 77.87 15.6 23 100.0 100.09 45.0 14 95.0 5.02 16.7 11 100.0 100.0
*** Includes print and nonprint materials; i.e., books, periodicals, videocassettes/DVDs, CDs, etc.
^ The MDK12 Digital Library, a purchasing consortium made up of all 24 school systems and a number of non-publics in the state of Maryland, has made the purchase of digital resources affordable for even our smallest districts. For 2009-2010, all schools had access to 8 databases through SIRS/ProQuest, purchased by each school district as part of the master agreement, and middle/high schools had access to the Gale Science Resource Center through an agreement with the State Library Resource Center and SAILOR.

Meals Served in Maryland Public Schools: 2009-2010
40
School Lunch
Local Unit Total Paid FreeReduced
Price
41
School Breakfast After
Total Paid FreeReduced
PriceSummer
Food
School Care
Snacks
Total State 68,765,548 27,283,452 34,659,877 6,822,219 Allegany 1,059,933 423,244 518,458 118,231Anne Arundel 4,359,006 2,126,372 1,780,791 451,843Baltimore City 8,078,440 376,250 7,247,881 454,309Baltimore 8,134,470 2,795,700 4,220,506 1,118,264Calvert 870,682 520,575 279,248 70,859Caroline 586,461 197,089 315,104 74,268Carroll 1,723,059 1,216,704 396,145 110,210Cecil 1,341,444 601,167 622,144 118,133Charles 2,518,410 1,550,183 763,826 204,401Dorchester 513,010 149,644 320,525 42,841Frederick 2,665,743 1,603,200 834,937 227,606Garrett 461,701 174,571 213,582 73,548Harford 3,585,643 2,255,072 1,044,049 286,522Howard 2,988,768 1,933,054 827,756 227,958Kent 226,975 86,645 120,417 19,913Montgomery 9,342,001 3,986,978 4,165,237 1,189,786Prince George’s 13,502,667 4,312,584 7,730,977 1,459,106Queen Anne’s 562,730 358,127 164,911 39,692St. Mary’s 1,484,825 897,597 483,057 104,171Somerset 265,581 45,203 201,088 19,290Talbot 393,108 194,703 166,844 31,561Washington 2,266,848 1,000,680 1,040,224 225,944Wicomico 1,280,451 275,055 900,288 105,108Worcester 529,999 193,923 291,254 44,822SEED School 23,593 9,132 10,628 3,833
NOTE: SEED School of Maryland is a publicly-funded residential boarding school.
24,811,813 6,093,330 16,161,771 2,556,712 931,650 1,783,073 515,855 169,659 291,383 54,813 4,402 25,027
1,414,648 424,603 842,774 147,271 28,839 34,8844,053,283 611,123 3,071,366 370,794 4,473 749,7492,840,231 538,236 1,935,532 366,463 158,492 75,717
169,125 44,755 108,730 15,640 0 0193,565 22,621 152,761 18,183 0 25,011234,500 70,657 142,808 21,035 0 0657,903 248,908 360,910 48,085 7,798 957550,894 202,214 294,462 54,218 56,034 44,825327,388 81,526 222,115 23,747 1,584 2,679652,842 183,186 403,959 65,697 0 0230,004 78,178 119,686 32,140 4,714 6,139959,941 331,666 528,485 99,790 47,654 80,808218,928 19,897 179,026 20,005 0 13,790173,550 66,611 92,176 14,763 8,279 24,805
3,206,746 843,908 1,936,833 426,005 334,703 272,8414,900,433 942,106 3,478,024 480,303 180,995 153,186
135,759 51,345 72,698 11,716 5,668 51,277556,419 232,104 277,835 46,480 5,372 48,835262,579 77,249 169,188 16,142 14,471 11,192176,120 75,033 87,962 13,125 0 0
1,380,167 506,028 728,472 145,667 16,005 20,159692,746 161,921 488,316 42,509 31,080 67,627283,745 100,602 165,107 18,036 21,087 50,16524,442 9,194 11,163 4,085 0 23,400

Food Service Revenue in Maryland Public Schools: FY 2009
42
Local Revenue
Local Unit Sales* Other*State
Revenue
43
Federal Revenue
SnacksFresh
Fruits & Veg. Prog.
School Lunch
School Breakfast
Summer
Food
U.S.D.A. Commod- ities Issued
Total State $120,010,044 $20,552,371 $7,309,643Allegany 1,159,865 429,884 194,325Anne Arundel 11,427,294 258,419 447,249Baltimore City 1,810,750 1,422,054 862,946Baltimore 14,834,018 1,561,111 837,040Calvert 1,357,358 2,754,364 36,214Caroline 871,947 18,137 47,042Carroll 3,852,713 263,336 58,457Cecil 2,874,652 55,537 241,016Charles 5,514,320 564,349 183,006Dorchester 659,278 23,305 98,826Frederick 6,973,100 155,271 198,833Garrett 1,193,168 1,990 89,716Harford 8,058,809 159,323 283,470Howard 8,059,229 720,300 102,227Kent 458,069 21,476 78,617Montgomery 22,191,730 156,999 985,094Prince George’s 17,681,174 8,859,509 1,453,804Queen Anne’s 855,533 792,272 47,083St. Mary’s 3,363,874 6,219 199,705Somerset 309,002 2,053 84,469Talbot 432,699 423,766 87,852Washington 3,713,452 632,318 437,616Wicomico 1,828,165 751,369 190,264Worcester 529,845 519,011 64,774SEED School 0 0 0
* Local sales & local revenue are from school year 2008-2009.
NOTES: 1. Information for nonprofit private schools and State institutions are excluded.
2. Special Milk - Queen Anne’s served half-pints in value of $3,337.00
3. SEED School of Maryland is a publicly-funded residential boarding school.
$1,137,706 $708,676 $104,218,378 $29,876,787 $1,769,334 $15,426,32724,195 0 1,704,657 603,829 5,929 297,47225,604 85,904 5,724,081 1,620,387 884 1,085,086
529,698 86,899 18,879,320 5,790,174 0** 1,572,68746,205 39,067 12,884,378 3,595,295 317,905 1,850,239
0 0 935,126 162,836 4,886 250,65115,589 0 944,441 267,194 0 119,398
0 0 1,471,319 210,372 0 473,3711,954 36,886 1,846,429 641,254 0 245,971
23,302 5,152 2,634,006 535,137 45,224 503,4691,305 0 910,699 411,393 4,195 93,908
0 47,507 2,851,673 708,438 0 670,3494,356 81,829 691,650 238,858 976 129,722
69,726 28,497 3,600,971 973,011 81,233 864,2791,390 0 2,785,628 266,695 0 870,210
12,032 21,320 362,865 163,631 13,785 72,925109,418 29,226 13,541,174 3,723,447 696,677 2,268,310125,725 61,265 22,608,947 6,222,339 400,097 2,679,32414,722 21,245 551,580 124,712 899 127,18526,500 0 1,571,674 554,144 0 322,990
8,789 0 578,600 292,941 20,445 58,2160 0 521,104 186,326 4,451 71,193
17,809 104,013 3,130,384 1,343,976 43,816 248,83748,184 31,869 2,608,356 906,497 84,422 438,40426,327 27,997 866,351 324,894 43,510 112,130
4,876 0 12,965 9,007 0 0
** In 2008-2009, the Summer Food Program was operated by the Housing Authority of Baltimore City, which is not affiliated with Baltimore City Public Schools.

Maryland Pupil Transportation: 2009-2010
44
Number of Vehicles Total Miles Traveled
Local UnitPublicly-Owned Contract Regular Disabled
45
Pupils Eligible for Transportation Funding
RegularDis-
abled* TotalPer-
cent** ExpendituresPer
Pupil
State Aid
Total State 3,898 3,296 78,298,400 42,698,873Allegany 30 100 1,184,094 313,012Anne Arundel 54 451 6,027,790 3,410,407Baltimore City 34 264 297,000 2,707,200Baltimore 770 81 8,224,400 5,245,751Calvert 0 143 2,446,243 775,812Caroline 11 43 952,380 192,060Carroll 7 295 3,433,231 1,950,519Cecil 10 148 1,949,327 436,917Charles 0 272 4,667,705 1,456,991Dorchester 7 49 814,228 143,500Frederick 352 0 4,810,329 1,913,910Garrett 0 72 1,093,764 60,835Harford 97 341 5,440,060 2,242,339Howard 0 431 3,062,704 1,823,949Kent 0 29 508,826 158,141Montgomery 1,134 0 10,082,792 8,942,434Prince George’s 1,202 14 11,892,457 8,115,432Queen Anne’s 12 77 1,628,331 447,358St. Mary’s 14 180 3,135,273 982,117Somerset 0 35 695,874 123,480Talbot 42 0 629,460 66,780Washington 122 68 2,340,000 650,340Wicomico 0 130 1,682,172 328,140Worcester 0 73 1,299,960 211,449
593,390 23,726 617,116 73 $588,732,491 $949 $225,078,351 5,850 222 6,072 66 6,455,281 1,050 4,009,175
55,033 1,602 56,635 76 40,159,703 719 18,719,08824,975 3,030 28,005 34 36,151,960 1,284 17,240,72267,557 3,027 70,584 68 61,825,912 991 24,518,52016,598 321 16,919 99 12,807,527 912 4,993,731
4,512 67 4,579 82 4,118,382 877 2,263,54026,145 607 26,752 97 19,577,183 706 8,633,89714,807 226 15,033 93 9,269,017 626 4,432,39323,435 480 23,915 89 21,432,176 848 8,990,194
4,195 74 4,269 92 3,048,730 705 2,065,56428,709 872 29,581 74 22,253,374 703 10,582,1114,223 46 4,269 99 4,105,217 945 2,572,615
33,484 752 34,236 89 30,338,683 898 10,815,13539,079 1,343 40,422 80 31,673,051 755 13,505,9691,865 45 1,910 87 2,042,658 1,040 1,367,039
92,376 4,724 97,100 69 112,358,940 1,162 31,481,94981,581 5,019 86,600 68 121,023,958 1,251 34,236,967
7,706 87 7,793 100 6,213,041 795 2,858,95816,755 383 17,138 100 14,045,096 838 5,700,6822,809 63 2,872 99 2,766,059 950 1,617,3514,254 12 4,266 95 3,095,265 735 1,344,708
19,046 368 19,414 89 10,272,525 538 5,978,81812,201 280 12,481 85 8,136,168 653 4,568,133
6,195 76 6,271 94 5,562,585 886 2,581,092
* Count includes disabled students in nonpublic schools as of 2009.
** Percent of 2009 enrollment.
NOTE: Funding data reflects FY 2009 expenditures (inlcuding equipment and fixed charges), school year 2008-2009 ridership data, and FY 2009 State Aid for Transportation.

Public Library Statistics: 2009-2010
46
Staff
Librarians
Local UnitTotal Staff
Pro-fessional
Asso-ciate
Other Profes-sional
Clerical and
Other*
47
Operating Income
Amount SourceTotal
IncomePer
Capita** Federal Special*** State Local
Total State 3,506 692 643 224 1,956 Allegany 47 2 15 4 27Anne Arundel 292 59 52 9 172Baltimore City 476 121 24 65 266Baltimore 485 78 89 43 275Calvert 51 10 31 1 9Caroline 25 5 11 0 10Carroll 163 22 44 5 93Cecil 75 11 28 6 30Charles 54 3 22 5 24Dorchester 15 4 4 0 7Frederick 143 27 50 4 63Garrett 23 3 4 2 14Harford 252 45 33 21 153Howard 365 38 71 13 244Kent 15 4 3 0 8Montgomery 439 138 39 12 250Prince George’s 340 82 65 15 180Queen Anne’s 24 9 0 0 15St. Mary’s 40 4 11 3 22Somerset 14 3 0 2 10Talbot 22 6 4 1 11Washington 59 11 12 3 34Wicomico 45 5 13 5 22Worcester 42 2 18 5 17
All personnel figures are rounded to the nearest whole number.
* Includes clerical and circulation staff.
263,846,608 46.17 2,771,697 31,165,318 34,556,807 198,033,005 2,074,645 28.38 8,054 392,047 769,544 905,000
18,159,720 35.53 61,985 2,025,536 1,991,199 14,081,00030,808,973 48.12 427,700 7,357,543 6,585,530 16,438,20043,995,838 55.21 521,206 5,587,940 5,421,822 34,464,870
3,943,623 43.85 49,600 491,729 446,167 2,956,1272,010,342 60.58 34,300 246,369 279,673 1,450,000
10,801,339 62.26 201,110 1,391,681 1,038,377 8,170,1716,328,545 63.41 18,566 1,152,769 731,603 4,425,6073,796,309 26.21 116,298 470,453 853,129 2,356,429
988,266 30.98 8,429 161,486 248,416 569,93411,697,324 52.30 37,100 1,446,385 1,134,855 9,078,9841,421,926 47.27 10,500 264,585 164,141 982,700
19,046,431 81.25 85,865 1,850,672 1,627,197 16,135,91718,248,593 65.94 282,469 1,649,904 762,866 15,553,354
858,449 41.73 24,500 156,380 103,569 574,00043,099,655 46.13 99,000 1,634,850 2,609,967 38,755,83828,167,192 32.91 482,386 2,754,218 6,522,188 18,408,4001,755,963 37.80 8,000 258,438 133,027 1,356,4983,388,549 34.04 24,000 480,973 685,777 2,224,7991,073,860 40.99 17,500 272,846 263,278 520,2361,363,598 37.23 20,984 264,161 100,974 977,4794,324,676 28.66 204,500 453,692 1,135,274 2,531,2102,618,705 28.36 10,400 148,419 811,409 1,648,4773,874,087 78.93 17,245 252,242 136,825 3,467,775
** Excludes federal revenue.
*** Includes State contributions to retirement.

Rehabilitation Services: 2009-2010
48
Number of Persons
Local Unit Served Rehabilitated
Characteristics of Persons Served in theVocational Rehabilitation Program: 2010
49
Total State 23,021 2,410Allegany 512 75Anne Arundel 1,677 150Baltimore City 4,325 504Baltimore 3,211 292Calvert 375 44Caroline 161 13Carroll 885 90Cecil 496 58Charles 547 58Dorchester 163 9Frederick 1,178 119Garrett 151 24Harford 642 52Howard 863 84Kent 84 7Montgomery 2,201 255Prince George’s 2,717 226Queen Anne’s 133 17St. Mary’s 451 67Somerset 100 16Talbot 161 13Washington 910 88Wicomico 763 104Worcester 176 23Unknown, Out-of-State 139 22
GenderMale 12,773 55Female 10,248 45Not Identified 0 0RaceWhite 11,172 47African American 11,248 47Other 1,320 5Not Identified 136 1Age at ReferralYounger than 20 6,154 2720 to 21 1,476 622 to 34 4,642 2035 to 44 4,030 1845 to 64 6,467 2865 and older 252 1Years of Education Attained at Referral1 - 8 950 49 - 11 6,202 2712 8,248 3613 - 15 4,083 1716 or more 1,713 8Special Education 1,773 8Not Identified 52 0Referral SourcesIndividual Self Referral 7,755 33Educational Institutions 4,880 21Community Rehabilitation Programs 2,939 13Physicians, Other Medical Personnel 1,394 6Federal/State Public Assistance 1,113 5One-Stop Centers 608 3Other Sources, Unknown 4,332 19
NOTE: The MSDE Division of Vocational Rehabilitation’s Workforce Technology Center (WTC) provides multi-disciplinary services to address the needs of persons who require multiple rehabilitation services over an extended period of time to achieve independence and employment.
Number Percent

Rehabilitated Persons Served:2009-2010
50
Number Rehabilitated
Persons Rehabilitated by Primary Disability
Psychiatric DisabilityCognitive DisabilityOrthopedicDeaf & Hard of HearingOther Physical DisabilitiesBlind & Visual ImpairmentsCommunication DisabilitiesRespiratory ImpairmentsTotal
Persons Rehabilitated by Occupation at Case ClosureServiceClerical, SalesProfessional, Technical, ManagerialProduction, Construction, Operating, Materials HandlingHomemakerFarming, Fishery, & ForestryUnpaid Family WorkerVending Operator/WorkerMiscellaneous, NECTotal
NOTES: 1. “Persons Rehabilitated” refers to those individuals who have achieved gainful employment as a result of DORS services.
2. The Division of Rehabilitation Services (DORS) provides statewide rehabilitative services to assist disabled Maryland citizens in becoming employed.
Selected Statistics About Maryland’s Educational Community: 2009-2010
51
Population of Maryland, July 1, 2009 (estimated) 5,699,478
Local operating budget from federal, state, and local sources (includes state-paid retirement)
$11.8 Billion
Cost per pupil belonging $13,013
Average 10-month teacher salary $63,971
Percent of teachers with: 5 years or less experience 34.2 6-10 years of experience 22.7 11-15 years of experience 15.2 16-20 years of experience 9.2 more than 20 years of experience 18.7
Standard Professional Certificate (SPC) 30.1 Advanced Professional Certificate (APC) 63.1
Less than Bachelor’s Degree 0.5 Bachelor’s Degree 47.6 Master’s or Master’s Equivalent 34.8 Master’s Degree + 30 hours or more 17.1
Minimum number of required school days 175*
Average Daily Membership (ADM) 846,969.9
Average Daily Attendance (ADA) 795,576.9
Percent Promoted, PreK-12 96.4
Average Percent Attending 93.9
* Due to extreme weather, the minimum number of required school days was reduced from 180 to 175 for the 2009-2010 school year only.
903677152187286166
2811
2,410
1,18345734419718634
630
2,410

Maryland’s Rank Among the States
52
CategoryMD
AmountU. S. Avg. Rank
Population per Square Mile of Land Area, 2007
575 85 6
Population Age 5-17 as Percent of Total Population, 2007
17.5 17.6 23
Average Daily Attendance as Percent of Fall Enrollment 2008-2009
93.3 94.9 25
Pupils Enrolled per Teacher in Public Elementary and Secondary Schools, Fall 2008
14.1 15.2 30
Average Salaries of Public School Teachers, 2008-2009
$62,849 $54,319 6
Percent Change in Average Salaries of Public School Teachers, 2007-2008 to 2008-2009
4.6 2.9 7
Per Capita Personal Income, 2007 $47,050 $39,430 6
Percent of Revenue, by Source, for Public Elementary/Secondary Schools, 2008-2009 Local Government 54.0 43.5 11 State Government 39.4 47.1 37 Federal Government 6.6 9.4 45*
Per Capita State Government Expenditures for all Education, 2006-2007
$1,593 $1,666 32
Per Capita Expenditures of State and Local Government for all Education, 2006-2007
$2,611 $2,514 18
Current Expenditures for Public Elementary/Secondary Schools per pupil in: Average Daily Attendance, 2008-2009 $12,584 $10,736 14
Fall Enrollment, 2008-2009 $11,743 $10,190 14
*Tied with other states.Source: National Education Association
Education Superlatives
53
• Education Week’s 2010 Quality Counts ranked Maryland’s public schools #1 in the nation again. Maryland has been recognized as the nation’s number one public school system for the past two years in a row, consistently placing at the top of its class in the report’s 6 determining categories and scored no lower than a B in any given area. Education Week is the nation’s leading education newspaper.
• In 2010, College Board ranked Maryland #1 for the second year in a row for percentage of public school students scoring 3 or higher on at least one AP exam: a score of 3 through 5 is considered mastery of college-level work. Maryland has also dramatically increased AP participation among minority students, with Hispanic student representation among test-takers earning a score of 3 or higher (7.5%) actually exceeded the group’s overall school enrollment (6.8%). Another 9.6% of Maryland test-takers scoring a 3 or higher were African-American; the fourth highest percentage in the nation.
• In August 2010, Maryland received $250 million in the competitive federal Race to the Top (RTTT) program. The Maryland State Department of Education’s RTTT program will build on three decades of school reform with a five-prong strategy that will provide the appropriate challenges and supports to students, educators, and administrators. Maryland’s goal is to help our students to not only compete with their peers across the nation but globally. This means recognizing and acting on the new reality that a high school diploma is just the starting point; every student must be prepared to succeed in college or the workplace.
• The 2010 Newsweek Magazine’s Top High Schools List says Maryland has the highest percentage of rigorous high schools in the nation for the second straight year. Over half of Maryland’s public high schools (98 of 185) placed on the 2010 list, representing 15 of Maryland’s 24 local school systems and covering the five Maryland regions—Eastern Shore, Metro Baltimore, Metro D.C., Southern, and Western.
• Over 4.2 million Maryland public school students engaged in 14,534 service-learning projects during the 2009-2010 school year. The graduating Class of 2009 amassed over 4 million hours of service-learning activities, which is a conservative estimate since many students volunteer well over the required 75 hours (59,000 students x 75 hours = 4,425,000). Maryland is the only state with a service learning requirement for high school graduates.
• In 2009, 78 percent of entering kindergarteners were fully ready for school, according to their teachers. While that overall readiness figure is up 29 percentage points since 2001, important domains show even greater growth: Readiness in Language and Literacy has risen 31 points and Mathematical Thinking has climbed 32 points.

Maryland Local School System Superintendents
Local Unit Superintendent Telephone
Allegany Dr. David Cox 301-759-2037Anne Arundel Dr. Kevin M. Maxwell 410-222-5303Baltimore City Dr. Andrés Alonso 410-396-8803Baltimore Dr. Joe A. Hairston 410-887-4281Calvert Dr. Jack R. Smith 410-535-7804Caroline Dr. Edward W. Shirley 410-479-1460Carroll Mr. Stephen H. Guthrie 410-751-3128Cecil Dr. D’Ette W. Devine 410-996-5499Charles Mr. James E. Richmond 301-934-7223Dorchester Mr. Henry V. Wagner, Jr. 410-221-1111 Frederick Dr. Linda D. Burgee 301-696-6910Garrett Dr. Wendell D. Teets 301-334-8901Harford Dr. Robert M. Tomback 410-588-5204Howard Dr. Sydney L. Cousin 410-313-6677Kent Dr. A. Barbara Wheeler 410-778-7113Montgomery Dr. Jerry D. Weast 301-279-3383Prince George’s Dr. William R. Hite 301-952-6008Queen Anne’s Dr. Carol A. Williamson 410-758-2403St. Mary’s Dr. Michael J. Martirano 301-475-5511Somerset Dr. Karen-Lee Brofee 410-621-6226Talbot Dr. Karen Salmon 410-822-0330Washington Dr. Elizabeth M. Morgan 301-766-2815Wicomico Dr. John Fredericksen 410-677-4596Worcester Dr. Jon Andes 410-632-5020
54
Maryland State Department of Education Publications
Division of Certification and Accreditation Maryland Teacher Staffing Report
Division of Instruction Facts About Maryland’s School Library Media Programs
Division of Library Development and Services Maryland Public Library Statistics
Division of Accountability and Assessment Analysis of Professional Salaries Characteristics of Professional Staff Grade Organization: Enrollment by Race/Ethnicity and Professional Staff at School Levels Maryland Adolescent Survey Maryland Public School Enrollment by Race/Ethnicity and Gender and Number of Schools Maryland School Performance Report Nonpublic School Enrollment Professional Salary Schedules Professional Staff by Assignment, Race and Gender Staff Employed at School and Central Office Levels Summary of Attendance Suspensions, Expulsions, and Health-Related Exclusions
Division of Special Education/Early Intervention Services Maryland Special Education Census Data
Division of Business Services Selected Financial Data, Part 1 - Revenue, Wealth, & Effort Selected Financial Data, Part 2 - Expenditures Selected Financial Data, Part 3 - Analysis of Costs Selected Financial Data, Part 4 - Ten-Year Summary
Other publications can be found at marylandpublicschools.org
55
This Fact Book contains the latest data available as of December 2, 2010. For updated data, please visit the Maryland State Department of Education’s website at www.marylandpublicschools.org. Click on Newsroom, Publications, then the Fact Book icon.

Notes
This page is intentionally blank.
56
State of Maryland by Local Unit

Division of Business Services200 W
est Baltimore Street
Baltimore M
D 21201