maruti suzuki india (maruti) - open online trading...
TRANSCRIPT

April 28, 2015
ICICI Securities Ltd | Retail Equity Research
Result Update
Margins drive the growth..!! • MSIL reported revenues of |13,625 crore vs. our estimate of |13,733
crore (up ~12.6% YoY) led by 6.7% YoY increase in volumes • EBITDA margins at 15.9% came in ~558 bps higher YoY, much
higher than our estimate of 13.1% owing to lower input cost, favourable foreign exchange and lower sales promotion expense.
• Higher margins boosted the profitability with PAT at |1,284 crore vs our estimate of |1,124 crore. (60.5% YoY higher)
• Management expects volumes to grow ~10% in FY16E outpacing the industry while lower discounts coupled with new launches (better product mix) & stable input cost could drive margins going forward.
Market leader to benefit from domestic passenger vehicle up cycle! A recovery in the overall economy would have a multiplier effect on the passenger vehicle up cycle, which would benefit MSIL, the largest carmaker in India. We believe MSIL’s largely petrol denominated small car portfolio is likely to benefit the most as the industry comes off a lean patch of about five years with overall volumes growing at merely ~5.9% CAGR in FY10-15. In the next five years, we expect penetration levels to increase from current lowly levels of ~15 cars per 1000 and march towards peer penetration levels (China: ~60/1000, Brazil: ~200/1000). New launches help withstand competition onslaught, retain market share MSIL has seen a major challenge to its dominant market share position as global carmakers launched products aimed to gain market share. However, it still stands at an impressive ~45% on the back of its vast distribution network (~1200 dealerships in ~800 cities) and strong service network (~3000 workshops in ~1400 cities). Launch of “S-Cross” and compact SUV will help MSIL create presence in the SUV segment. Diesel variant of Celerio & AMT based Swift model would help improve market share. Hence strong product pipeline of new launches and facelifts of some of its existing models coupled with further enhancement of distribution network & production capacity will help MSIL to maintain its leadership position in passenger vehicle even as competition intensifies. Leverage benefits, reducing discounts, forex to aid margin expansion! MSIL is likely to benefit with strong operating leverage benefits which would accrue as volumes pick up. With higher discretionary spending coupled new launches and higher contribution from the premium segment is likely to lever margins going forward. With demand likely to pick-up, we expect a reduction in average discounts from |19,625 in FY15 to |17,000 in FY16E and |15,000 in FY17E. Another factor that has aided margins has been JPY depreciation as well as localisation drive. Considering all factors, we have built in ~160 bps increase in margin over FY15-17E. Preferred “domestic recovery play”; earnings on strong growth wicket We prefer four-wheeler auto segment to the two-wheeler segment as low penetration levels still provide headroom for sustained growth. We continue to remain bullish on longer-term growth prospects of the car segment, especially MSIL, considering its dominant market share at ~45%. Rationalisation of the diesel-petrol price gap is also expected to aid MSIL’s petrol-dominated product portfolio. Currency also continues to aid MSIL. We believe earnings growth trajectory would be strong (~32% CAGR in FY15-17E). Thus, we ascribe a multiple of 20x its FY17E EPS of |213 and recommend Buy with target of |4,266.
Rating matrix Rating : BuyTarget : | 4266Target Period : 12 monthsPotential Upside : 11%
What’s Changed?
Target Changed from | 3700 to | 4266EPS FY16E Changed from | 155.1 to | 176.4EPS FY17E Changed from | 200.0 to | 213.3Rating Changed from Hold to Buy
Quarterly Performance (| Crore) Q4FY15 Q4FY14 YoY (%) Q3FY15 QoQ (%)Revenue 13,624.8 12,101.4 12.6 12,575.8 8.3EBITDA 2,164.3 1,247.5 73.5 1,592.6 35.9EBITDA (%) 15.9 10.3 558 bps 12.7 322 bpsReported PAT 1,284.2 800.0 60.5 802.2 60.1
Key Financials | Crore FY14 FY15E FY16E FY17ENet Sales 42,645 48,606 54,771 63,597 EBITDA 5,089.9 6,605.9 8,223.4 9,638.2 Net Profit 2,783.0 3,711.2 5,328.6 6,443.7 EPS (|) 92.1 122.9 176.4 213.3
Valuation summary
FY14 FY15E FY16E FY17EP/E (x) 41.5 31.2 21.7 17.9 Target P/E (x) 46.3 34.7 24.2 20.0 EV/EBITDA (x) 21.2 17.1 13.5 11.2 P/BV (x) 5.5 4.9 4.1 3.5 RoNW (%) 13.3 15.6 19.1 19.6 RoCE (%) 13.3 17.2 20.1 20.3
Stock data Particular AmountMarket Capitalization (| Crore) | 115606 CroreTotal Debt (FY14) (| Crore) | 1685.1 CroreCash and Investments (FY14) (| Crore) | 9442.8 CroreEV (| Crore) | 107848.3 Crore52 week H/L (|) 3704 / 1540Equity capital (| crore) | 151 CroreFace value (|) | 5
Price performance (%)
1M 3M 6M 12MMaruti Suzuki India Ltd 1.1 -1.1 15.1 86.5M&M Ltd -1.9 -12.0 -7.2 8.9Tata Motors Ltd -2.4 -13.6 3.7 23.4
Maruti Suzuki India (MARUTI) | 3823
Research Analyst’s name
Nishit Zota
Vidrum Mehta

ICICI Securities Ltd | Retail Equity Research Page 2
Variance analysis Q4FY15 Q4FY15E Q4FY14 YoY (Chg %) Q3FY15 QoQ (Chg %) Comments
Total Operating Income 13,625 13,733 12,101 12.6 12,576 8.3 Topline marginally below estimates due to lower than expected ASP Raw Material Expenses 9,223 9,617 8,878 3.9 8,826 4.5 Lower input cost coupled with yen depreciation benefit resulted in lower raw
material expensesEmployee Expenses 508 442 401 26.7 375 35.5 Higher staff expenses as it incorporated some bonus componentOther expenses 1,730 1,881 1,575 9.8 1,782 -2.9 Lower advertisement expense coupled with currency benfit in royaltyEBITDA 2,164 1,793 1,248 73.5 1,593 35.9EBITDA Margin (%) 15.9 13.1 10.3 558 bps 12.7 322 bps Higher than estimate mainly due to gross margin expansionOther Income 320 339 407 -21.3 129 148.1Depreciation 660 620 564 17.1 628 5.1Interest 103 32 43 136.4 30 242.0Total Tax 437.3 355.1 247.0 77.1 262 67.2PAT 1,284 1,124 800 60.5 802 60.1EPS 42.5 37.2 26.5 60.5 27 60.1Key MetricsASP (|) 382,812 386,435 363,780 5.2 378,596 1.1 Higher ASPs due to better product mix led by CiazProvision for Royalty(| cr) 717 715 709 1.1 699 2.5Discounts (|) 15,500 21,000 17,500 -11.4 21,000 -26.2 Discount levels have reduced due to recent fresh launches & facelifts
Source: Company, ICICIdirect.com Research Change in estimates
(| Crore) Old New % Change Old New % Change CommentsRevenue 54,864 56,167 2.4 62,350 65,219 4.6 Estimates have been raised on improved demand sentiment & newer product
launchesEBITDA 7,677 8,223 7.1 9,474 9,638 1.7EBITDA Margin (%) 14.0 14.6 65 bps 15.2 14.8 -42 bpsPAT 4,685 5,329 13.7 6,042 6,444 6.6EPS (|) 156 176 13.1 200 213 6.7
FY16E FY17E
Source: Company, ICICIdirect.com Research Assumptions
Current Earlier CommentsFY14E FY15E FY16E FY17E FY16E FY17E
Total Volumes (nos) 1155041 1292414 1428198 1652967 1454600 1664000 Volume growth of ~13% CAGR in FY14-17E on expectation of strong economic recovery, demand pick-up & new product launches
Average ASPs (|) 369,205 376,083 383,496 384,746 374,980 378,843 ASPs increase assumed on change in product mix with expected launches in premium hatchbacks, sedan & compact UV segment
RMC/Unit (|) 271,069 270,873 269,085 271,098 271,312 272,599 Raw material like steel and plastics likely to remain favourable but aluminium seems to be going up
Royalty rates (%) 6.0 5.7 5.6 5.6 5.8 5.3 Change in royalty rate assumed on the basis of future projections of US$/JPY rates and management commentary regarding royalty rates
Discount (|) 16,950 19,625 17,000 15,000 20,125 18,500 Discounts assumption based on management commentary, market feedback Company, ICICIdirect.com Research

ICICI Securities Ltd | Retail Equity Research Page 3
Key conference call takeaways • The management targets ~10% volume growth for FY16E and is
likely to outpace the overall industry growth of 6%-8% projected by SIAM.
• According to the management excise duty sops, rationalization of
diesel prices, stable government and new product launches helped the domestic passenger vehicle industry which grew 3.9% YoY in FY15 as against a drop of 6% in FY14.
• For the industry, the share of diesel vehicles as a percentage of all
new vehicles has declined to 45% in Q4FY15. For MSIL, the petrol segment grew ~15% in line with the industry while diesel segment grew by 2.8% against industry diesel sales which declined by 6.2%.
• According to the management, raw material prices are likely to
remain stable going forward. Weakening of Euro (has a lag effect) would be positive for MSIL in Q1FY16E; however dollar strengthening against the rupee could offset some of these benefits. Hence most of the benefits in terms of currency fluctuation and soften of raw material have been seen Q4FY15, except if Yen depreciates further from current level.
• For the quarter, average discounts stood at | 15,000, much lower
compared to |21,000 in Q3FY15. This was due to better product mix, with new launches are offered with without discounts.
• Bulk of the localisation benefit has been made by the company, with
direct and indirect import currently ~16% of sales while the royalty rate stands at ~5.7%.
• The management has guided for a capex of ~| 4,000 crore in FY16 as
against capex of |3,000 in FY15. This is mainly towards new product launches, R&D and enhancing the marketing infrastructure and for annual maintenance capital expenditure.
• Exports for Q4FY15 stood at |1203 crore. Popular models like Swift,
Dzire, Ertiga, and Ciaz were introduced in Africa and Latin America in FY15. The share of non-European market crossed 100,000 units with total exports volume growing by 20% during FY15. Management expects export volumes to remain flat in FY16E.
• On buyer segmentation, the management highlighted the fact that the
first time car buyer class is ~44% much higher compared to ~35%-40% and has scope for improvement up to ~50% going forward. The current rural urban mix for the MSIL stand at ~34% and ~66% respectively. For FY15, rural volumes grew by 23% YoY
• MSIL declared dividend of |25 per share in FY15 (with dividend
payout of 24.5%) as against |12 per share in FY14. Management has guided that company is likely to maintain its payout ratio in the range of 18%-30% going forward.

ICICI Securities Ltd | Retail Equity Research Page 4
Company Analysis Unique position of dominance in spite of competition…
MSIL has maintained its market leadership despite the increase in competitive intensity. Despite ~18 players being in the fray fighting for the 2.5 million large market, MSIL has managed to hold ~45% market share. The financial performance has been strong over the past years with operating margins maintained at decent levels (over 10% in the recent past). On the business levers side, all factors range from cost of car ownership to demographics to new product launches led by S-Cross. Allied to this, on the financial levers side, better operating leverage and FX benefits are also in place to benefit MSIL. We expect revenue growth at ~14% CAGR in FY15-17E reaching ~| 65219 crore in FY17E. Margins are likely to remain on an uptrend and clock 14.6%, 14.8% in FY16E, FY17E, respectively, as industry demand improves, leading to better operating leverage and also reduction in discounting levels. Also, increased traction in newer products in premium categories would lead to better ASPs and, consequently, better margins and is likely to aid profitability. We expect the bottomline to grow at ~32% CAGR in FY15-17E and reach ~| 6444 crore in FY17E.
Exhibit 1: Topline and bottomline trends
3558
7
4358
8
4370
1
4987
4
5616
7
6521
9
1635
23922783
3711
5329
6444
0
1000
2000
3000
4000
5000
6000
7000
0
10000
20000
30000
40000
50000
60000
70000
FY12 FY13 FY14 FY15E FY16E FY17E
(| c
rore
)
(| c
rore
)
Topline Bottomline
Source: Company press release, ICICIdirect.com Research
Exhibit 2: Margins to trend higher as volumes aid operating leverage
4,22
9.6
5,08
9.9
6,60
5.9
8,22
3.4
9,63
8.2
9.7
11.6 13.2
14.6 14.8
-
2
4
6
8
10
12
14
16
-
2,000
4,000
6,000
8,000
10,000
12,000
FY13 FY14 FY15E FY16E FY17E
(%)
(| c
rore
)
EBITDA Margins (%)
Source: Company press release, ICICIdirect.com Research
ICICI Securities Ltd | Retail Equity Research Page 5
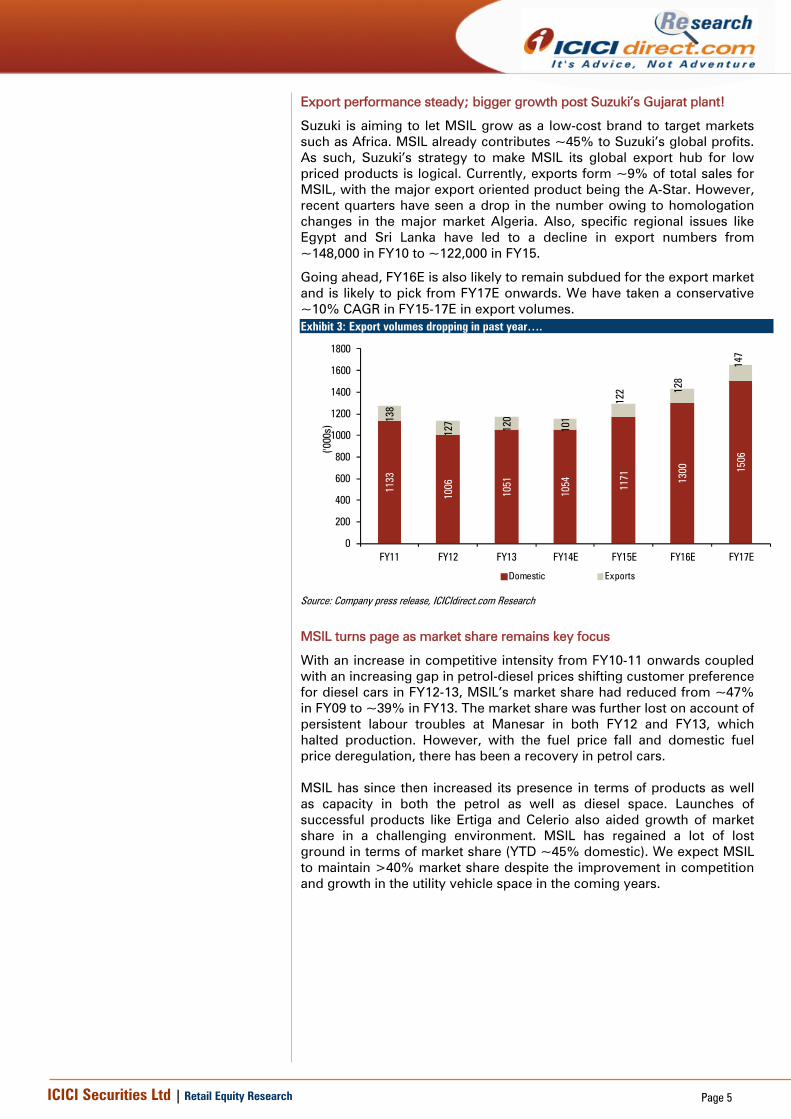
Export performance steady; bigger growth post Suzuki’s Gujarat plant!
Suzuki is aiming to let MSIL grow as a low-cost brand to target markets such as Africa. MSIL already contributes ~45% to Suzuki’s global profits. As such, Suzuki’s strategy to make MSIL its global export hub for low priced products is logical. Currently, exports form ~9% of total sales for MSIL, with the major export oriented product being the A-Star. However, recent quarters have seen a drop in the number owing to homologation changes in the major market Algeria. Also, specific regional issues like Egypt and Sri Lanka have led to a decline in export numbers from ~148,000 in FY10 to ~122,000 in FY15.
Going ahead, FY16E is also likely to remain subdued for the export market and is likely to pick from FY17E onwards. We have taken a conservative ~10% CAGR in FY15-17E in export volumes.
MSIL turns page as market share remains key focus
With an increase in competitive intensity from FY10-11 onwards coupled with an increasing gap in petrol-diesel prices shifting customer preference for diesel cars in FY12-13, MSIL’s market share had reduced from ~47% in FY09 to ~39% in FY13. The market share was further lost on account of persistent labour troubles at Manesar in both FY12 and FY13, which halted production. However, with the fuel price fall and domestic fuel price deregulation, there has been a recovery in petrol cars. MSIL has since then increased its presence in terms of products as well as capacity in both the petrol as well as diesel space. Launches of successful products like Ertiga and Celerio also aided growth of market share in a challenging environment. MSIL has regained a lot of lost ground in terms of market share (YTD ~45% domestic). We expect MSIL to maintain >40% market share despite the improvement in competition and growth in the utility vehicle space in the coming years.
Exhibit 3: Export volumes dropping in past year….
1133
1006
1051
1054 11
71 1300 15
06
138
127 120
101
122 12
8
147
0
200
400
600
800
1000
1200
1400
1600
1800
FY11 FY12 FY13 FY14E FY15E FY16E FY17E
('000
s)
Domestic Exports
Source: Company press release, ICICIdirect.com Research

ICICI Securities Ltd | Retail Equity Research Page 6
Exhibit 4: Domestic PV market share for MSIL
4745 45
38 3942
44 45 45 45
20
25
30
35
40
45
50
FY09 FY10 FY11 FY12 FY13 FY14 Q1FY15 Q2FY15 Q3FY15 Q4FY15
(%)
Domestic Market Share
Source: Company, ICICIdirect.com Research YTD for Q3FY15
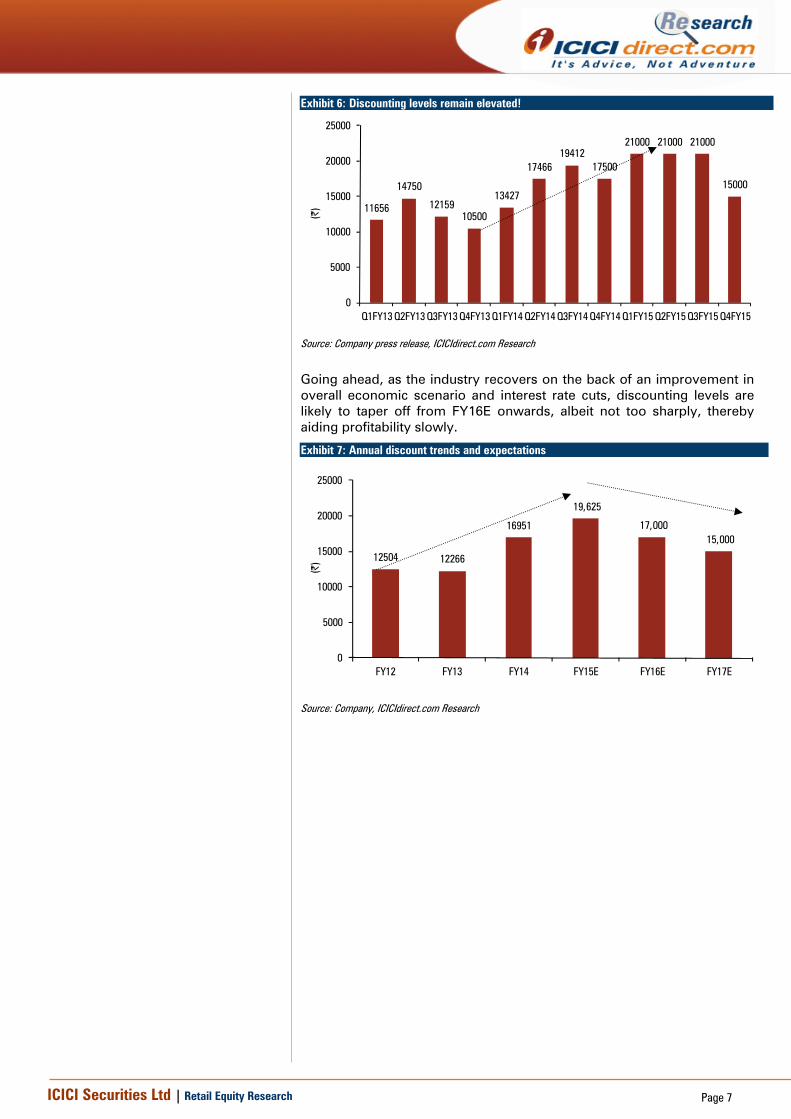
Discounting levels on the rise as overall demand scenario remains muted
In an intensely competitive industry struggling with demand slowdown, the increase in discounting levels to gain volumes is to be expected. As the market leader, MSIL has also been forced to give incentives to ward off competition and retain market share. However, we believe the new products launches (which do not offer any discounts) and improved product mix has been effective in reducing the impact of the demand slowdown. From the higher discount levels of |21,000 in Q3FY15, the same has substantially reduced to |15,000 in Q4FY15. We expect a reduction in average discounts from |19,625 in FY15 to |17,000 in FY16E and |15,000 in FY17E.
Exhibit 5: Passenger car market share crosses 50% as demand for petrol cars revives
44.7
40.938.7
35.3
44.1
37.6
47.3
36.4
47.9 48.851.0 51.4 51.0
53.1 52.2 51.3
30
34
38
42
46
50
54
58
Q1FY
12
Q2FY
12
Q3FY
12
Q4FY
12
Q1FY
13
Q2FY
13
Q3FY
13
Q4FY
13
Q1FY
14
Q2FY
14
Q3FY
14
Q4FY
14
Q1FY
15
Q2FY
15
Q3FY
15
Q4FY
15
(%)
MSIL's domestic share
Source: Company press release, ICICIdirect.com Research
ICICI Securities Ltd | Retail Equity Research Page 7
Going ahead, as the industry recovers on the back of an improvement in overall economic scenario and interest rate cuts, discounting levels are likely to taper off from FY16E onwards, albeit not too sharply, thereby aiding profitability slowly.
Exhibit 7: Annual discount trends and expectations
12504 12266
16951
19,625
17,000 15,000
0
5000
10000
15000
20000
25000
FY12 FY13 FY14 FY15E FY16E FY17E
(|)
Source: Company, ICICIdirect.com Research
Exhibit 6: Discounting levels remain elevated!
11656
14750
1215910500
13427
1746619412
17500
21000 21000 21000
15000
0
5000
10000
15000
20000
25000
Q1FY13 Q2FY13 Q3FY13 Q4FY13 Q1FY14 Q2FY14 Q3FY14 Q4FY14 Q1FY15 Q2FY15 Q3FY15 Q4FY15(|
)
Source: Company press release, ICICIdirect.com Research

ICICI Securities Ltd | Retail Equity Research Page 8
Outlook and Valuation We prefer the four-wheeler auto segment to the two-wheeler segment as low penetration levels still provide headroom for sustained growth. We continue to remain bullish on the longer-term growth prospects of the car segment, especially MSIL, considering its dominant market share at ~45%. The rationalisation of the diesel-petrol price gap is also expected to aid MSIL’s petrol-dominated product portfolio. Currency also continues to aid MSIL. We believe earnings growth trajectory would be strong (~32% CAGR in FY15-17E). Thus, we ascribe a multiple of 20x its FY17E EPS of |213 and recommend Buy with target of |4,266. Exhibit 8: Valuation
Sales Growth EPS Growth PE EV/EBITDA RoNW RoCE (| cr) (%) (|) (%) (x) (x) (%) (%)
FY14 42644.7 0.1 92.1 16.3 41.5 21.2 13.3 13.3FY15E 48605.5 14.0 122.9 33.4 31.2 17.1 15.6 17.2FY16E 54770.8 12.7 176.4 43.6 21.7 13.5 19.1 20.1FY17E 63597.2 16.1 213.3 20.9 17.9 11.2 19.6 20.3
Source: Company, ICICIdirect.com Research

ICICI Securities Ltd | Retail Equity Research Page 9
Company snapshot
Target Price: 4265
0
500
1,000
1,500
2,000
2,500
3,000
3,500
4,000
4,500
Dec-
10
Mar
-11
Jun-
11
Sep-
11
Dec-
11
Mar
-12
Jun-
12
Sep-
12
Dec-
12
Mar
-13
Jun-
13
Sep-
13
Dec-
13
Mar
-14
Jun-
14
Sep-
14
Dec-
14
Mar
-15
Jun-
15
Sep-
15
Dec-
15
(|)
Source: Bloomberg, Company, ICICIdirect.com Research
Key events Date EventFeb-08 Government announces across the board excise duty cuts for the automotive spaceSep-08 Stock market plunges on account of Lehmann crisisJan-09 Maruti launches all new global product "A-star" May-09 Maruti defies global slowdown with stronger demand from first time buyers and exports driven by A-starJul-09 Company's strong Q1FY10 results push stock to record high Feb-10 Largest recall in Maruti's history for 1 lakh A-star's for faulty parts. Maruti plans to double petrol capacity and investments to ~| 2,500 croreJul-10 Q1FY10 marks the change in royalty rates for Maruti from 3.3% to 5.9%, market disappointedMar-11 Auto stocks rebound as Union Budget witnesses no change of excise duties. Manesar workers go on strike for first time in May for two weeksAug-11 Labour trouble again brews up, production halted. Maruti Q2FY12 skids due to labour problems and high forex impacts as JPY unfavourableJan-12 Maruti witnesses strong valuation based bargain hunting as management expects worst to be overApr-12 Maruti launches the much awaited MPV product "Ertiga". Maruti announces merger with SPIL to consolidate business on the diesel side Jul-12 Maruti stock tumbles as workers in Manersar facility turn violent, causes tragic death of HR manager Awanish Kumar DevAug-12 Management lifts lockout post violence receding; production starts albeit slowlyApr-13 Yen moving beyond 100 vis-à-vis US$ aids Q4FY13 profits as EBIDTA margins rise to 10.4%Oct-13 Localisation and cost reduction initiatives Maruti surprise on Q2FY14 financials as margins surpriseJan-14 MSIL board approves Gujarat plant expansion by way of 100% subsidiary of Suzuki Motor Corporation; institutional investors perturbed; stock fallsMar-14 Management alleviates concerns of minority shareholders and removes uncertainty over the "mark-up" issueOct-14 Maruti launches a new product in the sedan segment "Ciaz"Apr-15 MSIL reports bumper margins of 15.9% in Q4FY15. Announces dividend of | 25 per share
Source: Company, ICICIdirect.com Research
Top 10 Shareholders Shareholding Pattern Rank Name Latest Filing Date % O/S Position (m) Change (m)1 Suzuki Motor Corp 31-Dec-14 56.21 169.8 0.002 Life Insurance Corporation of India 31-Dec-14 6.77 20.5 -0.083 HDFC Asset Management Co., Ltd. 31-Mar-15 1.96 5.9 0.574 ICICI Prudential Life Insurance Company Ltd. 31-Dec-14 1.24 3.7 -0.195 Reliance Capital Asset Management Ltd. 31-Mar-15 0.96 2.9 -0.176 HSBC Global Asset Management (Hong Kong) Limited 28-Feb-15 0.91 2.8 -0.157 UTI Asset Management Co. Ltd. 28-Feb-15 0.88 2.7 0.158 Schroder Investment Management Ltd. (SIM) 28-Feb-15 0.7 2.1 0.049 ICICI Prudential Asset Management Co. Ltd. 31-Mar-15 0.65 2.0 -0.0510 APG Asset Management 31-Dec-13 0.64 1.9 0.22
(in %) Mar-14 Jun-14 Sep-14 Dec-14 Mar-15Promoter 56.2 56.2 56.2 56.2 56.2FII 22.4 22.0 21.7 22.0 21.8DII 13.6 14.0 14.5 14.9 14.7Others 7.8 7.8 7.6 6.9 7.3
Source: Reuters, ICICIdirect.com Research
Recent Activity
Investor name Value Shares Investor name Value SharesCapital World Investors 46.01m 0.78m Carmignac Gestion -73.85m -2.11m FIL Investment Management (Hong Kong) Limited 36.00m 0.61m Investec Asset Management Ltd. -61.68m -1.26m HDFC Asset Management Co., Ltd. 34.09m 0.57m William Blair & Company, L.L.C. -45.88m -1.17m Birla Sun Life Asset Management Company Ltd. 15.80m 0.27m Genesis Investment Management, LLP -43.41m -0.81m APG Asset Management 6.16m 0.22m T. Rowe Price Hong Kong Limited -39.06m -0.74m
Buys Sells

ICICI Securities Ltd | Retail Equity Research Page 10
.
Financial summary
Profit and loss statement | Crore(Year-end March) FY14 FY15E FY16E FY17ETotal operating Income 43,701 49,874 56,167 65,219Growth (%) 0 14 13 16Raw Material Expenses 31,310 35,008 38,431 44,812Employee Expenses 1,368 1,607 1,807 2,049Marketing Expenses 0 0 0 0Administrative Expenses 0 0 0 0Other expenses 5,933 6,654 7,706 8,720Total Operating Expenditure 38,611 43,268 47,944 55,581EBITDA 5,090 6,606 8,223 9,638Growth (%) 20 30 24 17Depreciation 2,084 2,470 2,567 2,896Interest 176 206 20 27Other Income 829 939 1,284 1,653PBT 3,659 4,868 6,920 8,368Others 0 0 0 0Total Tax 876 1,157 1,592 1,925PAT 2,783 3,711 5,329 6,444Growth (%) 16 33 44 21EPS (|) 92 123 176 213
Source: Company, ICICIdirect.com Research
Cash flow statement | Crore (Year-end March) FY14 FY15E FY16E FY17EProfit after Tax 2,783 3,711 5,329 6,444Add: Depreciation 2,084 2,470 2,567 2,896(Inc)/dec in Current Assets 191 -453 56 -2,341Inc/(dec) in CL and Provisions 868 1,939 -56 1,858Others - - - -CF from operating activities 5,926 7,668 7,896 8,856(Inc)/dec in Investments -3,583 5,817 -1,000 -1,000(Inc)/dec in Fixed Assets -3,756 -3,201 -4,000 -3,000Others 1,355 -8,403 -1,230 -1,037CF from investing activities -5,985 -5,787 -6,230 -5,037Issue/(Buy back) of Equity 0 0 0 0Inc/(dec) in loan funds 0 0 0 0Dividend paid & dividend tax -424 -881 -1,233 -1,479Inc/(dec) in Sec. premium 0 0 0 0Others 336 -1,505 100 100CF from financing activities -88 -2,385 -1,133 -1,379Net Cash flow -147 -505 533 2,439Opening Cash 776 630 125 659Closing Cash 630 125 659 3,098
Source: Company, ICICIdirect.com Research
Balance sheet | Crore(Year-end March) FY14 FY15E FY16E FY17ELiabilitiesEquity Capital 151 151 151 151Reserve and Surplus 20,827 23,658 27,753 32,718Total Shareholders funds 20,978 23,809 27,904 32,869Total Debt 1,685 180 280 380Deferred Tax Liability 587 481 491 501Others Liabilties 437 398 438 478Total Liabilities 23,686 24,868 29,114 34,228AssetsGross Block 22,702 25,636 29,936 32,936Less: Acc Depreciation 11,912 14,115 16,682 19,578Net Block 10,790 11,521 13,253 13,357Capital WIP 2,621 2,621 2,321 2,321Total Fixed Assets 13,412 14,142 15,575 15,679Investments 10,118 12,814 14,814 16,814Inventory 1,706 2,615 1,587 3,397Debtors 1,414 1,069 1,876 2,178Loans and Advances 1,251 1,172 1,120 1,414Other Current Assets 358 326 544 478Cash 630 125 659 3,098Total Current Assets 5,359 5,307 5,785 10,565Creditors 4,898 5,561 5,627 6,447Provisions 678 1,361 1,433 1,706Other current Liabilities 1,274 1,867 1,673 2,437Total Current Liabilities 6,849 8,789 8,733 10,590Net Current Assets -1,491 -3,481 -2,948 -25Other Assets 1,647 1,393 1,673 1,761Application of Funds 23,686 24,868 29,114 34,228
Source: Company, ICICIdirect.com Research
Key ratios (Year-end March) FY14 FY15E FY16E FY17EPer share data (|)EPS 92.1 122.9 176.4 213.3Cash EPS 161.1 204.6 261.4 309.2BV 694.4 788.2 923.7 1,088.1DPS 12.0 25.0 35.0 42.0Cash Per Share 20.8 4.1 21.8 102.5Operating RatiosEBITDA Margin (%) 11.6 13.2 14.6 14.8PBT / Net sales (%) 8.6 10.0 12.6 13.2PAT Margin (%) 6.4 7.4 9.5 9.9Inventory days 15.2 16.2 14.0 14.3Debtor days 12.1 8.0 12.5 12.5Creditor days 41.9 41.8 37.5 37.0Return Ratios (%)RoE 13.3 15.6 19.1 19.6RoCE 13.3 17.2 20.1 20.3RoIC 25.9 21.6 25.5 28.3Valuation Ratios (x)P/E 41.5 31.2 21.7 17.9EV / EBITDA 21.2 17.1 13.5 11.2EV / Net Sales 2.5 2.3 2.0 1.7Market Cap / Sales 2.7 2.4 2.1 1.8Price to Book Value 5.5 4.9 4.1 3.5Solvency RatiosDebt/EBITDA 0.3 0.0 0.0 0.0Debt / Equity 0.1 0.0 0.0 0.0Current Ratio 0.8 0.6 0.7 1.0Quick Ratio 0.7 0.6 0.6 0.7
Source: Company, ICICIdirect.com Research

ICICI Securities Ltd | Retail Equity Research Page 11
ICICIdirect.com coverage universe (Auto & Auto Ancillary) CMP M Cap(|) TP(|) Rating (| Cr) FY15E FY16E FY17E FY15E FY16E FY17E FY15E FY16E FY17E FY15E FY16E FY17E FY15E FY16E FY17E
Amara Raja (AMARAJ) 800 932 Hold 13,666 25.1 34.0 42.3 31.9 23.5 18.9 20.9 16.5 13.1 33.9 34.0 33.0 25.0 26.4 25.6Apollo Tyre (APOTYR) 173 228 Buy 8,718 19.5 21.4 22.8 8.9 8.1 7.6 5.5 5.5 5.3 19.3 16.6 15.3 17.9 16.5 15.1Ashok Leyland (ASHLEY) 68 68 Hold 19,337 1.2 2.1 3.5 55.4 32.6 19.8 21.9 15.3 11.6 6.7 11.0 14.9 6.6 10.8 16.0Bajaj Auto (BAAUTO) 1,990 2,833 Buy 57,589 111.8 155.5 180.0 17.8 12.8 11.1 11.8 9.1 7.3 38.0 39.4 40.4 29.9 34.8 33.7Balkrishna Ind. (BALIND) 739 750 Hold 7,143 48.0 52.7 62.5 13.8 12.5 10.6 8.6 7.4 6.1 15.6 16.4 19.2 20.0 15.6 16.4Bharat Forge (BHAFOR) 1,216 1,178 Hold 28,322 33.9 43.3 52.9 35.8 28.0 23.0 16.5 13.6 11.5 25.2 25.8 26.7 24.5 25.0 25.1Bosch (MICO) 21,723 24,000 Hold 68,209 341.2 463.0 600.0 73.0 53.8 41.5 49.6 36.2 27.9 15.0 17.5 19.1 15.7 18.8 21.2Eicher Motors (EICMOT) 15,175 18,800 Buy 40,988 228.0 393.8 703.9 66.6 38.5 21.6 40.7 25.5 14.6 23.9 31.0 38.6 24.2 30.8 36.8Escorts (ESCORT) 123 131 Hold 1,463 6.9 12.9 22.4 18.5 9.8 5.7 9.0 6.6 3.7 5.3 8.1 12.7 4.3 7.6 11.8Exide Industries (EXIIND) 176 220 Buy 14,969 6.0 8.4 11.4 29.2 20.9 15.4 18.8 14.0 10.4 17.8 21.9 25.8 12.7 15.8 18.6Hero Mototcorp (HERHON) 2,356 3,036 Hold 47,040 128.8 166.2 202.4 18.3 14.2 11.6 14.6 16.3 15.1 46.8 52.5 52.4 39.4 42.8 42.8JK Tyre & Ind (JKIND) 108 171 Buy 2,457 15.2 22.9 26.3 7.1 4.7 4.1 5.3 4.1 3.4 19.9 22.8 24.1 26.7 30.9 28.1M&M (MAHMAH) 1,182 1,457 Buy 69,788 53.2 67.8 83.8 22.2 17.4 14.1 15.8 9.4 7.5 14.9 18.2 20.7 18.1 18.2 19.3Mahindra CIE (MAHAUT) 200 260 Buy 6,445 5.3 9.9 13.2 37.6 20.2 15.2 13.5 10.1 8.2 6.9 12.6 15.7 6.9 11.4 15.3Maruti Suzuki (MARUTI) 3822.6 4266 Buy 115519 122.9 176.4 213.3 31.1 21.7 17.9 17.1 13.5 11.2 17.2 20.1 20.3 15.6 19.1 19.6Motherson (MOTSUM) 463 512 Buy 40872 9.1 16.9 27.3 50.9 27.4 17.0 14.5 10.7 7.3 22.2 27.6 35.8 24.8 36.3 41.6Wabco India (WABTVS) 5284.8 5999.6 Buy 10041 67.2 117.8 166.7 78.6 44.9 31.7 47.0 31.1 22.1 14.7 20.9 23.2 18.5 24.3 27.6
Sector / CompanyRoE (%)EPS (|) P/E (x) EV/EBITDA (x) RoCE (%)
Source: Company, ICICIdirect.com Research

ICICI Securities Ltd | Retail Equity Research Page 12
RATING RATIONALE ICICIdirect.com endeavours to provide objective opinions and recommendations. ICICIdirect.com assigns ratings to its stocks according to their notional target price vs. current market price and then categorises them as Strong Buy, Buy, Hold and Sell. The performance horizon is two years unless specified and the notional target price is defined as the analysts' valuation for a stock. Strong Buy: >15%/20% for large caps/midcaps, respectively, with high conviction; Buy: >10%/15% for large caps/midcaps, respectively; Hold: Up to +/-10%; Sell: -10% or more;
Pankaj Pandey Head – Research [email protected]
ICICIdirect.com Research Desk, ICICI Securities Limited, 1st Floor, Akruti Trade Centre, Road No 7, MIDC, Andheri (East) Mumbai – 400 093

ICICI Securities Ltd | Retail Equity Research Page 13
ANALYST CERTIFICATION
We /I, Nishit Zota, MBA & Vidrum Mehta, MBA research analysts, authors and the names subscribed to this report, hereby certify that all of the views expressed in this research report accurately reflect our views about the subject issuer(s) or securities. We also certify that no part of our compensation was, is, or will be directly or indirectly related to the specific recommendation(s) or view(s) in this report.
Terms & conditions and other disclosures: ICICI Securities Limited (ICICI Securities) is a full-service, integrated investment banking and is, inter alia, engaged in the business of stock brokering and distribution of financial products. ICICI Securities is a wholly-owned subsidiary of ICICI Bank which is India’s largest private sector bank and has its various subsidiaries engaged in businesses of housing finance, asset management, life insurance, general insurance, venture capital fund management, etc. (“associates”), the details in respect of which are available on www.icicibank.com. ICICI Securities is one of the leading merchant bankers/ underwriters of securities and participate in virtually all securities trading markets in India. We and our associates might have investment banking and other business relationship with a significant percentage of companies covered by our Investment Research Department. ICICI Securities generally prohibits its analysts, persons reporting to analysts and their relatives from maintaining a financial interest in the securities or derivatives of any companies that the analysts cover. The information and opinions in this report have been prepared by ICICI Securities and are subject to change without any notice. The report and information contained herein is strictly confidential and meant solely for the selected recipient and may not be altered in any way, transmitted to, copied or distributed, in part or in whole, to any other person or to the media or reproduced in any form, without prior written consent of ICICI Securities. While we would endeavour to update the information herein on a reasonable basis, ICICI Securities is under no obligation to update or keep the information current. Also, there may be regulatory, compliance or other reasons that may prevent ICICI Securities from doing so. Non-rated securities indicate that rating on a particular security has been suspended temporarily and such suspension is in compliance with applicable regulations and/or ICICI Securities policies, in circumstances where ICICI Securities might be acting in an advisory capacity to this company, or in certain other circumstances. This report is based on information obtained from public sources and sources believed to be reliable, but no independent verification has been made nor is its accuracy or completeness guaranteed. This report and information herein is solely for informational purpose and shall not be used or considered as an offer document or solicitation of offer to buy or sell or subscribe for securities or other financial instruments. Though disseminated to all the customers simultaneously, not all customers may receive this report at the same time. ICICI Securities will not treat recipients as customers by virtue of their receiving this report. Nothing in this report constitutes investment, legal, accounting and tax advice or a representation that any investment or strategy is suitable or appropriate to your specific circumstances. The securities discussed and opinions expressed in this report may not be suitable for all investors, who must make their own investment decisions, based on their own investment objectives, financial positions and needs of specific recipient. This may not be taken in substitution for the exercise of independent judgment by any recipient. The recipient should independently evaluate the investment risks. The value and return on investment may vary because of changes in interest rates, foreign exchange rates or any other reason. ICICI Securities accepts no liabilities whatsoever for any loss or damage of any kind arising out of the use of this report. Past performance is not necessarily a guide to future performance. Investors are advised to see Risk Disclosure Document to understand the risks associated before investing in the securities markets. Actual results may differ materially from those set forth in projections. Forward-looking statements are not predictions and may be subject to change without notice. ICICI Securities or its associates might have managed or co-managed public offering of securities for the subject company or might have been mandated by the subject company for any other assignment in the past twelve months. ICICI Securities or its associates might have received any compensation from the companies mentioned in the report during the period preceding twelve months from the date of this report for services in respect of managing or co-managing public offerings, corporate finance, investment banking or merchant banking, brokerage services or other advisory service in a merger or specific transaction. ICICI Securities or its associates might have received any compensation for products or services other than investment banking or merchant banking or brokerage services from the companies mentioned in the report in the past twelve months. ICICI Securities encourages independence in research report preparation and strives to minimize conflict in preparation of research report. ICICI Securities or its analysts did not receive any compensation or other benefits from the companies mentioned in the report or third party in connection with preparation of the research report. Accordingly, neither ICICI Securities nor Research Analysts have any material conflict of interest at the time of publication of this report. It is confirmed that Nishit Zota, MBA & Vidrum Mehta, MBA, research Analyst of this report have not received any compensation from the companies mentioned in the report in the preceding twelve months. Compensation of our Research Analyst is not based on any specific merchant banking, investment banking or brokerage service transactions. ICICI Securities or its subsidiaries collectively or Research Analysts do not own 1% or more of the equity securities of the Company mentioned in the report as of the last day of the month preceding the publication of the research report. Since associates of ICICI Securities are engaged in various financial service businesses, they might have financial interests or beneficial ownership in various companies including the subject company/companies mentioned in this report. It is confirmed that Nishit Zota, MBA & Vidrum Mehta, MBA, research Analyst do not serve as an officer, director or employee of the companies mentioned in the report. ICICI Securities may have issued other reports that are inconsistent with and reach different conclusion from the information presented in this report. Neither the Research Analyst nor ICICI Securities have been engaged in market making activity for the companies mentioned in the report. We submit that no material disciplinary action has been taken on ICICI Securities by any Regulatory Authority impacting Equity Research Analysis activities. This report is not directed or intended for distribution to, or use by, any person or entity who is a citizen or resident of or located in any locality, state, country or other jurisdiction, where such distribution, publication, availability or use would be contrary to law, regulation or which would subject ICICI Securities and affiliates to any registration or licensing requirement within such jurisdiction. The securities described herein may or may not be eligible for sale in all jurisdictions or to certain category of investors. Persons in whose possession this document may come are required to inform themselves of and to observe such restriction.