march 30, 2011 sasken communication ltd...
TRANSCRIPT
March 30, 2011
ICICIdirect.com | Equity Research
Initiating Coverage
ICICI Securities Limited
Buy the cash; IT business complimentary… Sasken Communication Tech (Sasken) is a focused software company helping businesses across the telecom value chain to accelerate their product development cycles. The outlook on Sasken was impacted by a variety of reasons including lack of risk mitigation (focus on telecom vertical), Nortel’s bankruptcy, shift in Nokia’s (30% of revenues) platform strategy to Windows from Symbian and high attrition. However, Sasken has cash/share of | 67.8, pays dividend and is likely to generate free cash flow per share (FCF) of | 24.2. This translates to an attractive FCF yield of ~15%. Though a majority of these arguments are known, we feel the operating metrics are likely to improve from H2FY12 led in part by the rebound in semiconductor sales, modest revival in network equipment spending and the rise of Android platform. Consequently, we are initiating coverage on Sasken with an ADD rating. Modelling modest revenue growth in FY12E; boost in FY13E We are modelling Sasken’s revenues will grow 1.7% and 11.6% YoY in FY12E and FY13E, respectively. The modest FY12E revenue growth assumes a demand pick-up in the back half of FY12. Further, EDITDA margins are likely to improve by 370 bps during FY10-FY13E led by utilisation improvements, moderating attrition and a modest increase in billing rates. Finally, we are modelling net profit will grow 26.5% in FY13E driven by EBITDA margin improvements. Rebound in semiconductor sales bodes well for Sasken CY10 semiconductor sales grew 34.9% YoY to $295.3 billion vs. $218.9 billion in CY09. Further, January sales stood at $25.5 billion. This implies that were sales to remain at these levels for the remainder of the year, annual CY11 semiconductor sales could top $306 billion, translating to 4% YoY growth. This bodes well for Sasken.
Valuations Sasken is currently trading at compelling multiples of 6x its FY10 diluted EPS of | 26.6; 0.77x on Mcap/FY10 sales and provides an attractive FCF and dividend yield of ~15% and ~4%, respectively. The rationale for PE discount is the likely anaemic growth and poor demand visibility. However, we believe this is likely to change post H1FY12. Consequently, we have valued Sasken’s core IT business ex-cash at 4.7x its FY12E EPS estimate of | 21.7 plus cash/share of | 67.8 to arrive at our price target of | 170. Exhibit 1: Valuation Metrics (| Crore) FY09 FY10 FY11E FY12E FY13ENet Sales (| crore) 697.8 574.2 549.8 559.2 624.0EBITDA (| crore) 163.8 101.9 104.3 110.6 134.1Net profit (| crore) 42.3 75.5 69.0 61.7 78.0EPS (|) 14.9 26.6 24.3 21.7 27.6PE (x) 10.7 6.0 6.6 7.4 5.8EV to EBITDA(x) 1.7 2.8 2.7 2.6 2.1Price to book (x) 0.9 0.8 0.8 0.7 0.7RoNW (%) 8.8 14.4 12.5 11.0 13.4RoCE (%) 30.0 18.3 18.1 19.7 23.1
Source: Company, ICICIdirect.com Research
Sasken Communication Ltd (SASCOM) | 160
Rating Matrix
Rating : Add
Target : | 170
Target Period : 12 months
Potential Upside : 6%
YoY Growth (%) (YoY Growth) FY10 FY11E FY12E FY13ENet Sales -17.7 -4.3 1.7 11.6EBITDA -37.8 2.4 6.0 21.3Net Profit 78.5 -8.7 -10.6 26.5EPS (|) 78.5 -8.7 -10.5 27.0
Current & target multiple
FY10 FY11E FY12E FY13EPE (x) 6.0 6.6 7.4 5.8EV to EBITDA(x) 2.8 2.7 2.6 2.1Price to book (x) 0.8 0.8 0.7 0.7Target PE 6.4 7.0 7.8 6.2Target EV/EBITDA 5.0 4.8 4.6 3.8Target P/BV 1.2 1.2 1.1 1.1
Stock Data
Bloomberg/Reuters Code SACT.IN/SKCT.BOSensex 19290.2Average Volumes (yearly) 184679Market cap (| crore) 454.4Debt (Dec-10) 23.1Cash (Dec-10) 192.6EV 284.952 week H/L (|) 237 / 147Equity capital 27.56Face value | 10DII Holding (%) 9.6FII Holding (%) 6.7
Comparative return matrix (%)
Returns (%) 1M 3M 6M 12MSasken 4.3 (7.9) (15.5) (7.0) Geometric (4.7) (17.3) (9.9) (2.2) Mastek (12.4) (34.6) (50.2) (63.0) KPIT 13.3 16.9 (0.8) 42.2
Price movement
0
60
120
180
240
Jan-
09
Apr-0
9
Jul-0
9
Oct-0
9
Jan-
10
Apr-1
0
Jul-1
0
Oct-1
0
Jan-
11
1000
2500
4000
5500
7000
SASCOM NIFTY (RHS)
Analyst name
Abhishek Shindadkar [email protected]
ICICIdirect.com | Equity Research Page 2
ICICI Securities Limited
Company background Established in 1989 at San Jose by Rajiv Mody and two other co-founders, Sasken is a focused communications software company helping businesses across the telecom value chain to accelerate their product development cycles. With its deep domain skills, the company provides both research and development (R&D) services and software product solutions using a hybrid model. Sasken provides R&D services in the telecom infrastructure and semiconductor segments while product solutions are for handset manufacturers and include basic communication software along with multimedia codecs and applications software.
Business Description
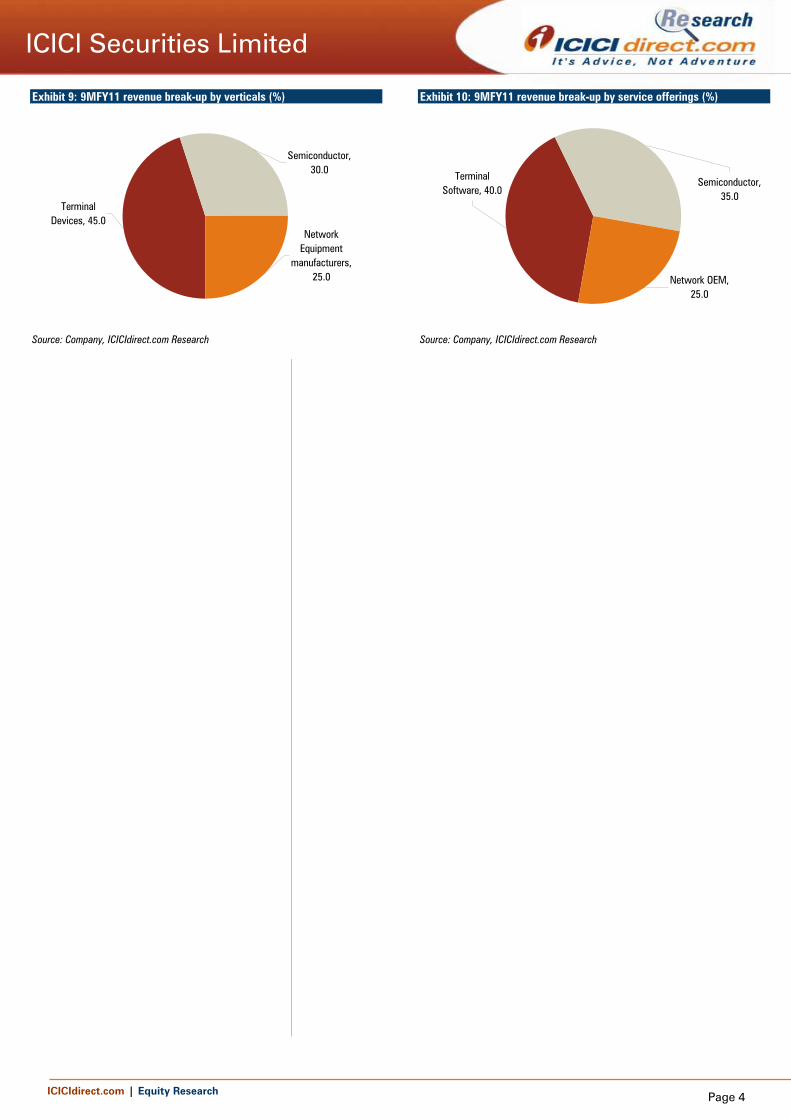
Sasken generates services revenues (88% of 9MFY11 revenues) in three industry segments: 1) network original equipment manufacturers (OEM, ~25% of 9MFY11 revenues), 2) semiconductor vendors (30%) and 3) terminal devices (handset vendors, ~45%).
Network OEMs – Sasken primarily offers R&D services (30% of network revenues) to equipment manufacturers such as Kapsch. Services include 1) radio access network services for 2G and Universal Mobile Telecommunications System (UMTS) technologies, 2) network management - includes element management solution and 3) network engineering services. Typically, R&D spend constitutes 10-15% of OEMs annual revenues of which 10% is outsourced and 25-30% of outsourced is offshored.
Semiconductor vendors – Sasken offers chip design services, OS related software services, multimedia codecs and protocol stacks pre-integrated on semiconductor platforms. The company works with six of the top 10 vendors including, Texas Instruments (TI), Qualcomm, Intel, Infineon, NEC and NXP. R&D budgets typically constitute 10-15% of annual revenues and are likely to remain at elevated levels given the proliferation of open source platforms. Exhibit 2: Semiconductor offerings
Semiconductor Offerings Services % RevenueHardware Design IC design 40.0Software Design chipsets, OS related, multimedia codecs 60.0
Source: Company, ICICIdirect.com Research
Terminal devices - Sasken offers development and testing services for handset manufacturers such as Samsung, LG, Kyocera and Dell as well as integration and porting for the Android and Symbian platform. The terminal devices portfolio was enhanced and complemented by the Botnia acquisition, which brought in radio frequency, hardware and mechanical design services and gave access to Nokia. Exhibit 3: Terminal device offerings
Terminal Devices offerings Services % RevenueHardware Design Mechanical desgin 20.0Software Design Product design, testing, validation and support 80.0
Source: Company, ICICIdirect.com Research
Software products
The products business, 11% of Q3FY11 revenues, offers wireless embedded software with pre-integrated solutions and design flexibility. Sasken’s solution is portable across silicon platforms and operating systems increasing their reusability over phone models through customisation. The company’s key offerings include (1) wireless protocol
Share holding pattern (February 18, 2011)
Shareholder Holding (%)Promoters 28.3Institutional Investors 16.3Other Investors 11.8General Public 43.6
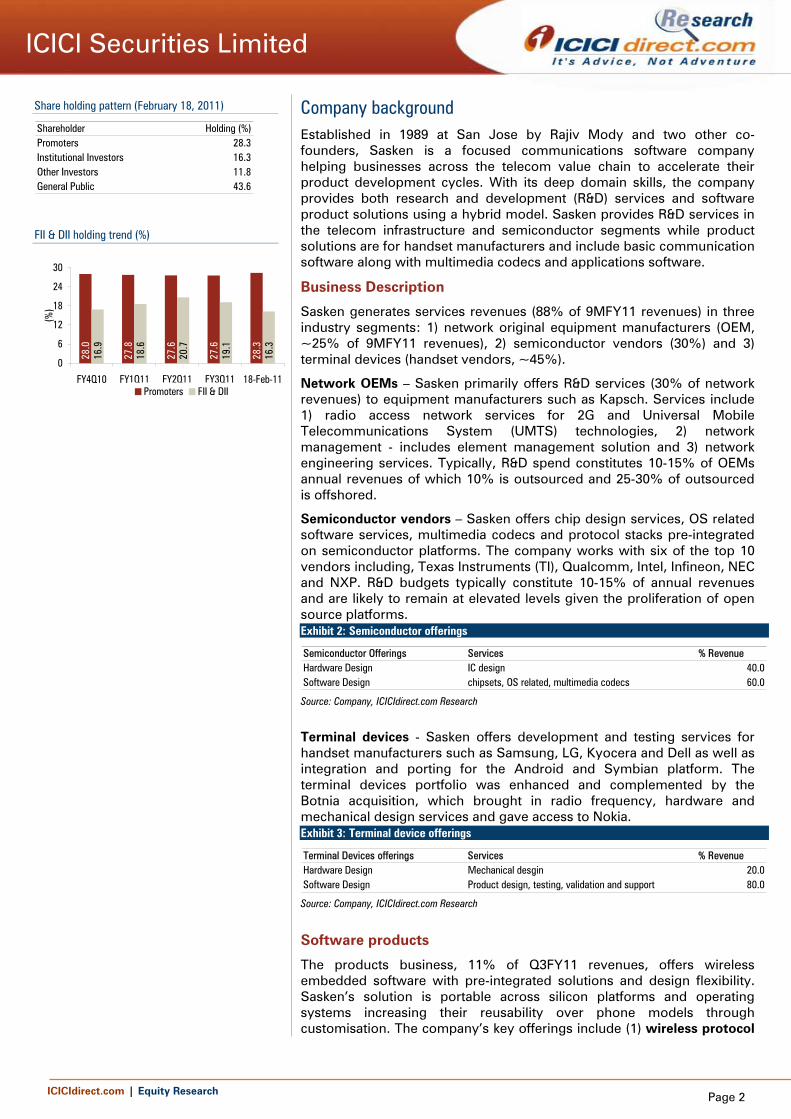
FII & DII holding trend (%)
28.0
27.8
27.6
27.6
28.3
16.9
18.6
20.7
19.1
16.3
0
6
12
18
24
30
FY4Q10 FY1Q11 FY2Q11 FY3Q11 18-Feb-11
(%)
Promoters FII & DII
ICICIdirect.com | Equity Research Page 3
ICICI Securities Limited
stacks: GSM/GPRS/EDGE and WCDMA protocol stacks that are pre-integrated on semiconductor platforms; (2) application framework: Multimedia codecs and applications; and (3) multimedia subsystems: Full featured application bundles for smart phones. Exhibit 4: Product offerings
Product line Solution Target phone categoryM-series Protocol stacks, modem software All phones with baseband processorS-series multimedia, messaging solutions smartphonesAndroid platform full phone design phones with android platform
Source: Company, ICICIdirect.com Research
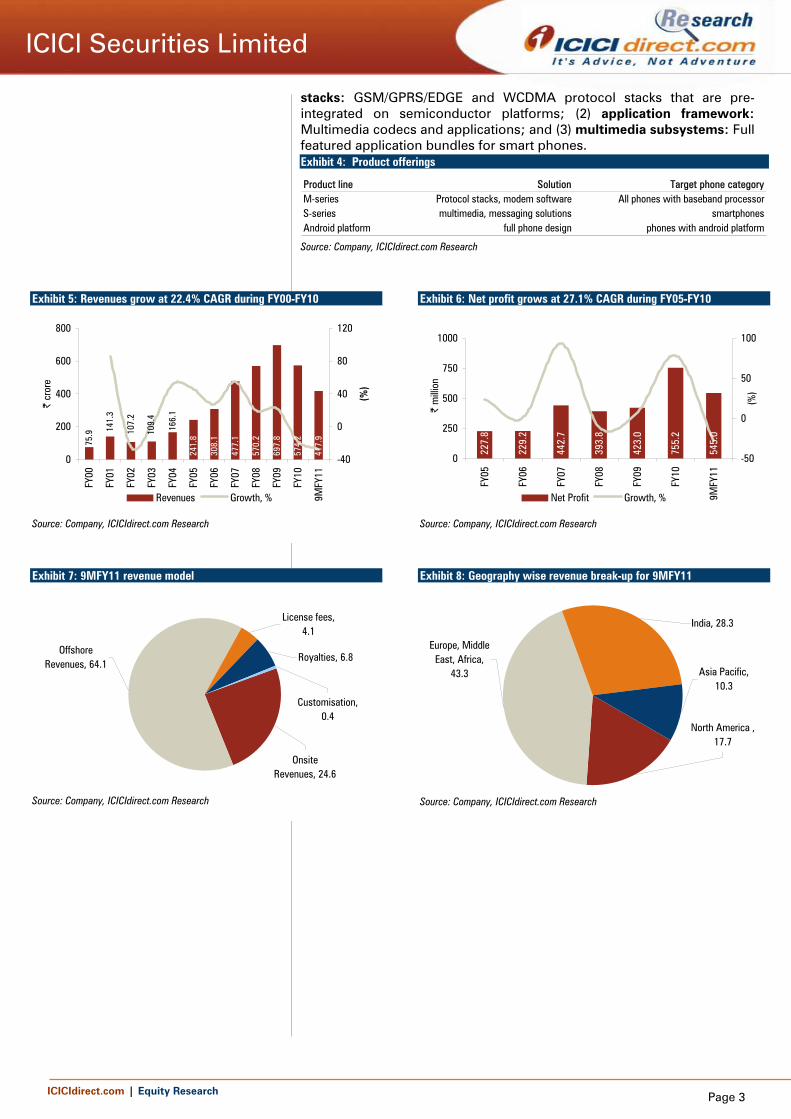
Exhibit 5: Revenues grow at 22.4% CAGR during FY00-FY10
308.
1
477.
1
570.
2
697.
8
574.
2
241.
8
166.
1
109.
4
107.
2
141.
3
75.9
417.
9
0
200
400
600
800
FY00
FY01
FY02
FY03
FY04
FY05
FY06
FY07
FY08
FY09
FY10
9MFY
11
| cr
ore
-40
0
40
80
120
(%)
Revenues Growth, %
Source: Company, ICICIdirect.com Research
Exhibit 6: Net profit grows at 27.1% CAGR during FY05-FY10
227.
8
229.
2
442.
7
393.
8
423.
0
755.
2
545.
0
0
250
500
750
1000
FY05
FY06
FY07
FY08
FY09
FY10
9MFY
11
| m
illion
-50
0
50
100
(%)
Net Profit Growth, %
Source: Company, ICICIdirect.com Research
Exhibit 7: 9MFY11 revenue model
Customisation, 0.4
Royalties, 6.8
License fees, 4.1
Offshore Revenues, 64.1
Onsite Revenues, 24.6
Source: Company, ICICIdirect.com Research
Exhibit 8: Geography wise revenue break-up for 9MFY11
North America , 17.7
Europe, Middle East, Africa,
43.3
India, 28.3
Asia Pacific, 10.3
Source: Company, ICICIdirect.com Research
ICICIdirect.com | Equity Research Page 4
ICICI Securities Limited
Exhibit 9: 9MFY11 revenue break-up by verticals (%)
Terminal Devices, 45.0
Semiconductor, 30.0
Network Equipment
manufacturers, 25.0
Source: Company, ICICIdirect.com Research
Exhibit 10: 9MFY11 revenue break-up by service offerings (%)
Network OEM, 25.0
Semiconductor, 35.0
Terminal Software, 40.0
Source: Company, ICICIdirect.com Research
ICICIdirect.com | Equity Research Page 5
5 Error! Reference source not found.
ICICI Securities Limited
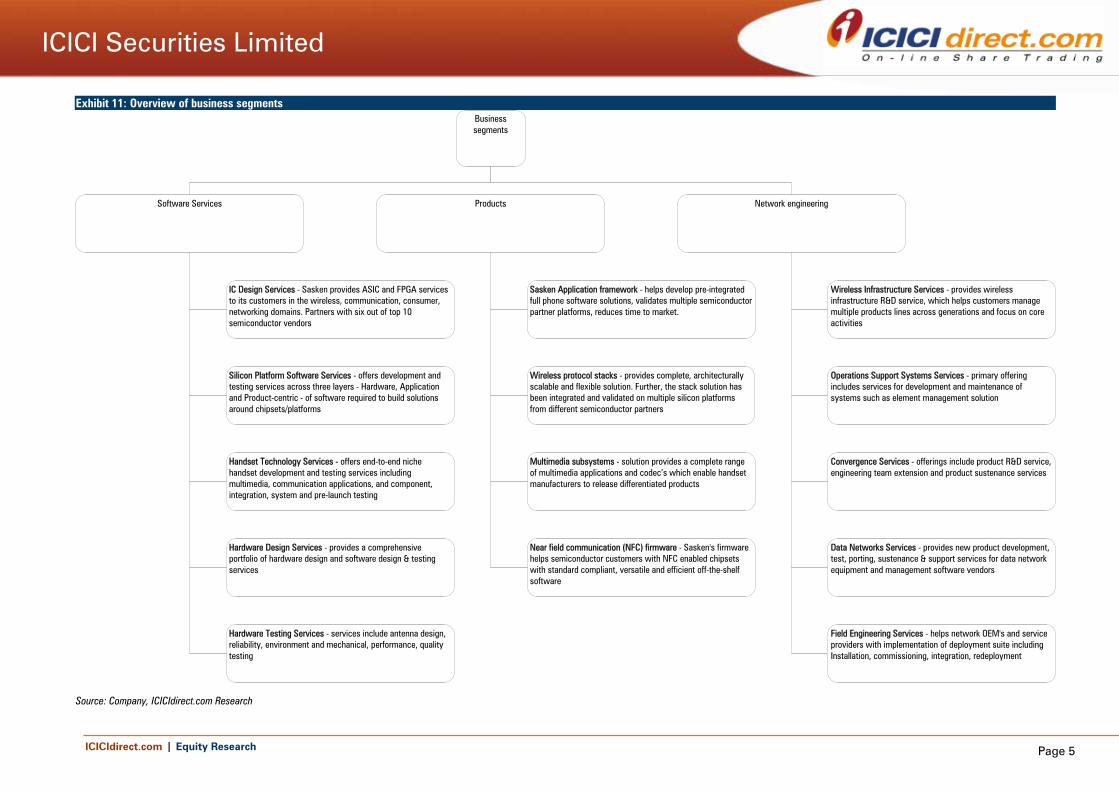
Exhibit 11: Overview of business segments
Source: Company, ICICIdirect.com Research
Business segments
Software Services Products Network engineering
IC Design Services - Sasken provides ASIC and FPGA services to its customers in the wireless, communication, consumer, networking domains. Partners with six out of top 10 semiconductor vendors
Silicon Platform Software Services - offers development and testing services across three layers - Hardware, Application and Product-centric - of software required to build solutions around chipsets/platforms
Handset Technology Services - offers end-to-end niche handset development and testing services including multimedia, communication applications, and component, integration, system and pre-launch testing
Hardware Design Services - provides a comprehensive portfolio of hardware design and software design & testing services
Hardware Testing Services - services include antenna design, reliability, environment and mechanical, performance, quality testing
Sasken Application framework - helps develop pre-integrated full phone software solutions, validates multiple semiconductorpartner platforms, reduces time to market.
Wireless protocol stacks - provides complete, architecturally scalable and flexible solution. Further, the stack solution has been integrated and validated on multiple silicon platforms from different semiconductor partners
Multimedia subsystems - solution provides a complete range of multimedia applications and codec’s which enable handset manufacturers to release differentiated products
Near field communication (NFC) firmware - Sasken's firmware helps semiconductor customers with NFC enabled chipsets with standard compliant, versatile and efficient off-the-shelf software
Wireless Infrastructure Services - provides wireless infrastructure R&D service, which helps customers manage multiple products lines across generations and focus on core activities
Operations Support Systems Services - primary offering includes services for development and maintenance of systems such as element management solution
Convergence Services - offerings include product R&D service, engineering team extension and product sustenance services
Data Networks Services - provides new product development, test, porting, sustenance & support services for data network equipment and management software vendors
Field Engineering Services - helps network OEM's and service providers with implementation of deployment suite including Installation, commissioning, integration, redeployment
ICICIdirect.com | Equity Research Page 6
ICICI Securities Limited
Management profile
Governing council
Rajiv Mody, an industry veteran who co-founded Sasken, continues to be the Chairman and CEO. Rajiv has worked with corporations like AMD, Seattle Tech Inc and VLSI Technology Inc and was awarded Technovator of the year in 2007. He has also served as an executive council member of Nasscom during 2001-2008.
G Venkatesh, CTO head of world wide delivery has been with the company since 1995. He graduated in Electronics from IIT-Madras and was a professor of Computer Science at IIT-Mumbai before joining Sasken. At Sasken, he has served different roles including head of the product division.
Neeta Revankar has been with the company since 1995 and heads the finance, HR and business operations. She is a qualified chartered accountant (CA) and company secretary (CS) and serves as a whole time director on the Sasken board. In 2005, IMA India conferred her with the India CFO award.
Board of directors
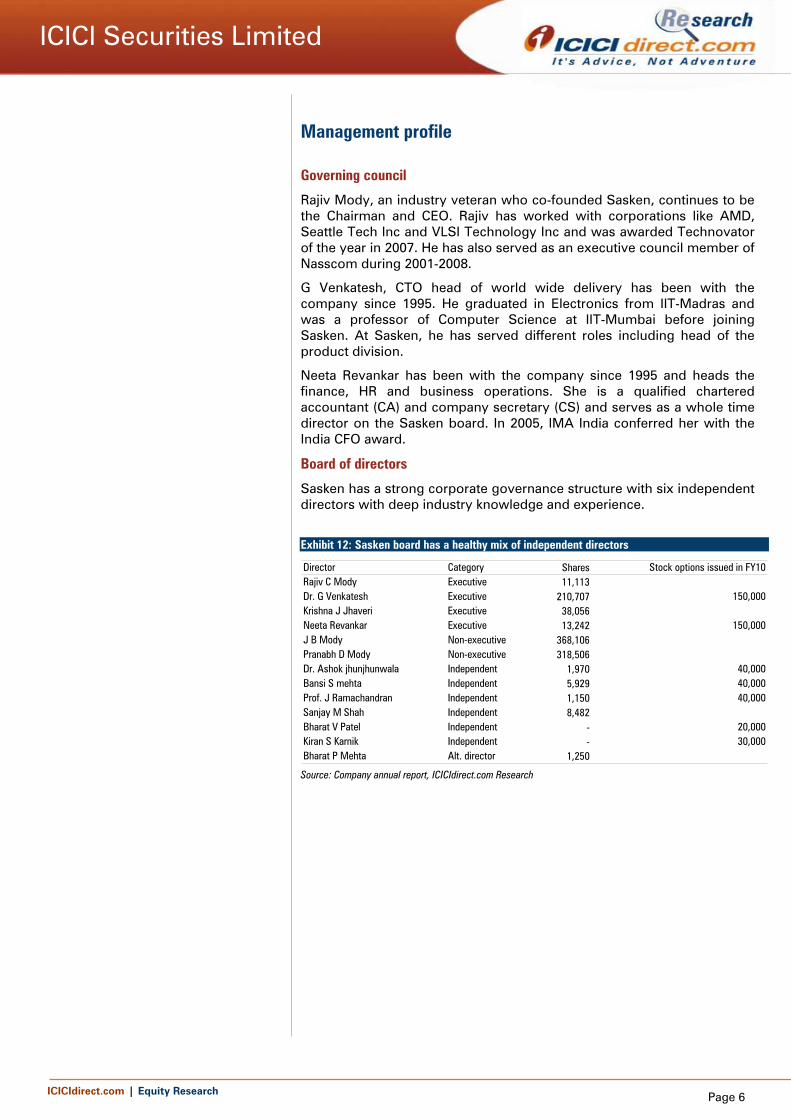
Sasken has a strong corporate governance structure with six independent directors with deep industry knowledge and experience.
Exhibit 12: Sasken board has a healthy mix of independent directors
Director Category Shares Stock options issued in FY10Rajiv C Mody Executive 11,113Dr. G Venkatesh Executive 210,707 150,000Krishna J Jhaveri Executive 38,056Neeta Revankar Executive 13,242 150,000J B Mody Non-executive 368,106Pranabh D Mody Non-executive 318,506Dr. Ashok jhunjhunwala Independent 1,970 40,000Bansi S mehta Independent 5,929 40,000Prof. J Ramachandran Independent 1,150 40,000Sanjay M Shah Independent 8,482Bharat V Patel Independent - 20,000Kiran S Karnik Independent - 30,000Bharat P Mehta Alt. director 1,250
Source: Company annual report, ICICIdirect.com Research
ICICIdirect.com | Equity Research Page 7
ICICI Securities Limited
Investment rationale
We expect a demand pick-up from the semiconductor industry and the rise of the Android platform to be the core contributors for revenue growth. From an operating metric perspective, we expect utilisation to bottom out in H1FY12 while attrition could moderate modestly. Consequently, we are modelling conservative revenue growth of 1.7% and 11.6% YoY in FY12E and FY13E respectively, while EDITDA margins are likely to improve by 370 bps during FY10-FY13E. Finally, our investment thesis acknowledges the attractive valuations at which the stock is available, i.e. at 4.7x its FY12E EPS estimate of | 21.7, coupled with a 4% dividend yield and | 67.8 cash/share.
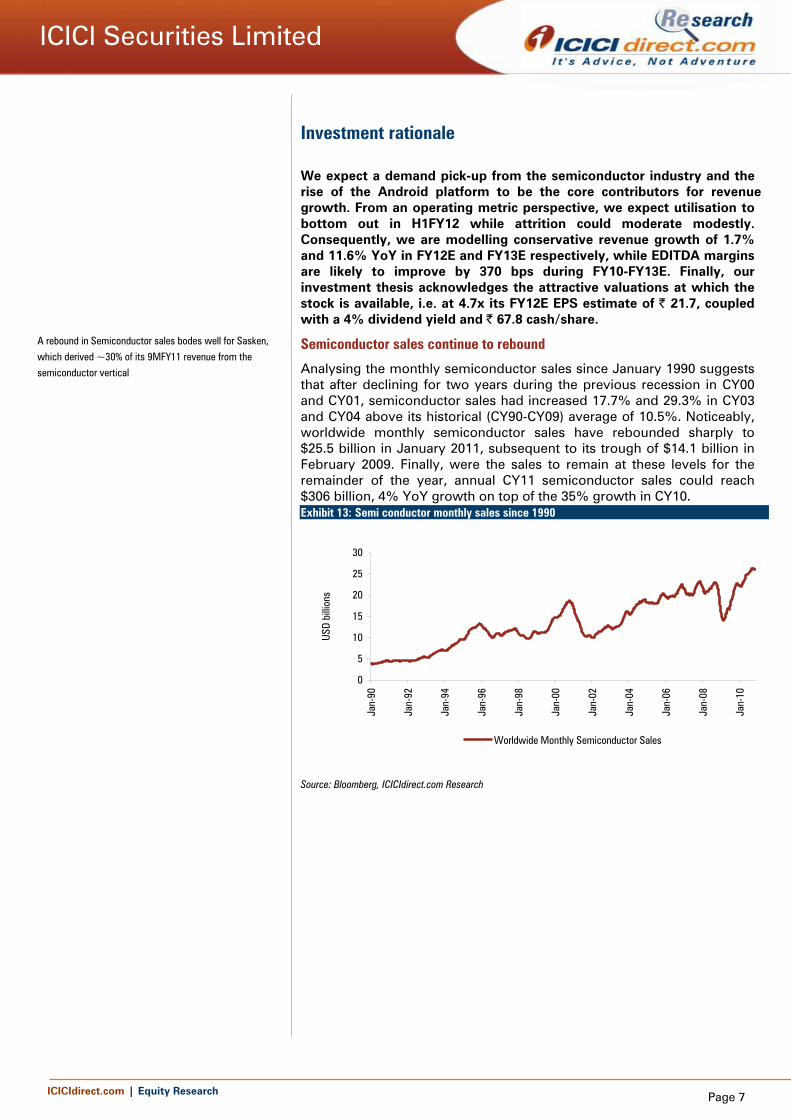
Semiconductor sales continue to rebound
Analysing the monthly semiconductor sales since January 1990 suggests that after declining for two years during the previous recession in CY00 and CY01, semiconductor sales had increased 17.7% and 29.3% in CY03 and CY04 above its historical (CY90-CY09) average of 10.5%. Noticeably, worldwide monthly semiconductor sales have rebounded sharply to $25.5 billion in January 2011, subsequent to its trough of $14.1 billion in February 2009. Finally, were the sales to remain at these levels for the remainder of the year, annual CY11 semiconductor sales could reach $306 billion, 4% YoY growth on top of the 35% growth in CY10. Exhibit 13: Semi conductor monthly sales since 1990
0
5
10
15
20
25
30
Jan-
90
Jan-
92
Jan-
94
Jan-
96
Jan-
98
Jan-
00
Jan-
02
Jan-
04
Jan-
06
Jan-
08
Jan-
10
USD
billi
ons
Worldwide Monthly Semiconductor Sales
Source: Bloomberg, ICICIdirect.com Research
A rebound in Semiconductor sales bodes well for Sasken,
which derived ~30% of its 9MFY11 revenue from the
semiconductor vertical
ICICIdirect.com | Equity Research Page 8
ICICI Securities Limited
Exhibit 14: Semiconductor sales trends
0
70
140
210
280
350
CY19
90
CY19
91
CY19
92
CY19
93
CY19
94
CY19
95
CY19
96
CY19
97
CY19
98
CY19
99
CY20
00
CY20
01
CY20
02
CY20
03
CY20
04
CY20
05
CY20
06
CY20
07
CY20
08
CY20
09
CY20
10E
CY20
11E
$ bi
llions
-45
-30
-15
0
15
30
45
60
%
Worldwide semiconductor sales Growth %, YoY
Source: Bloomberg, ICICIdirect.com Research
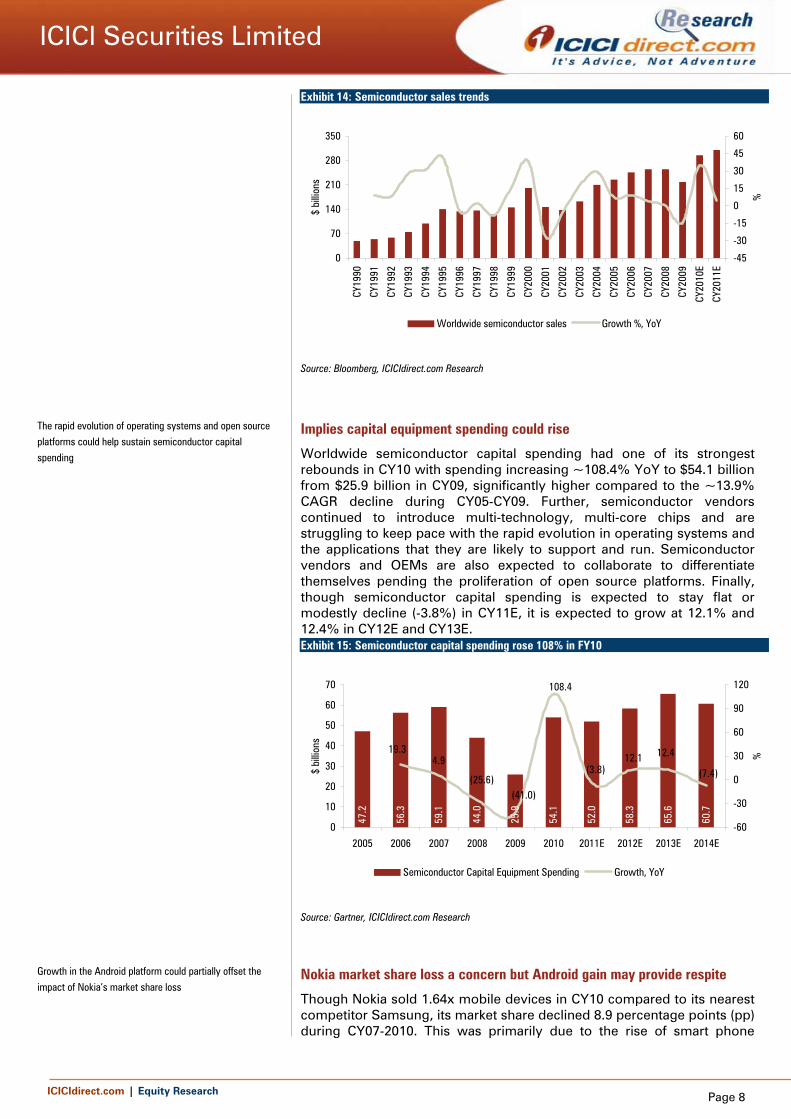
Implies capital equipment spending could rise
Worldwide semiconductor capital spending had one of its strongest rebounds in CY10 with spending increasing ~108.4% YoY to $54.1 billion from $25.9 billion in CY09, significantly higher compared to the ~13.9% CAGR decline during CY05-CY09. Further, semiconductor vendors continued to introduce multi-technology, multi-core chips and are struggling to keep pace with the rapid evolution in operating systems and the applications that they are likely to support and run. Semiconductor vendors and OEMs are also expected to collaborate to differentiate themselves pending the proliferation of open source platforms. Finally, though semiconductor capital spending is expected to stay flat or modestly decline (-3.8%) in CY11E, it is expected to grow at 12.1% and 12.4% in CY12E and CY13E. Exhibit 15: Semiconductor capital spending rose 108% in FY10
47.2
56.3
59.1
44.0
25.9
54.1
52.0
58.3
65.6
60.7
19.34.9
(25.6)(41.0)
(3.8)
108.4
12.1 12.4
(7.4)
0
10
20
30
40
50
60
70
2005 2006 2007 2008 2009 2010 2011E 2012E 2013E 2014E
$ bi
llions
-60
-30
0
30
60
90
120
%
Semiconductor Capital Equipment Spending Growth, YoY
Source: Gartner, ICICIdirect.com Research
Nokia market share loss a concern but Android gain may provide respite
Though Nokia sold 1.64x mobile devices in CY10 compared to its nearest competitor Samsung, its market share declined 8.9 percentage points (pp) during CY07-2010. This was primarily due to the rise of smart phone
The rapid evolution of operating systems and open source
platforms could help sustain semiconductor capital
spending
Growth in the Android platform could partially offset the
impact of Nokia’s market share loss
ICICIdirect.com | Equity Research Page 9
ICICI Securities Limited
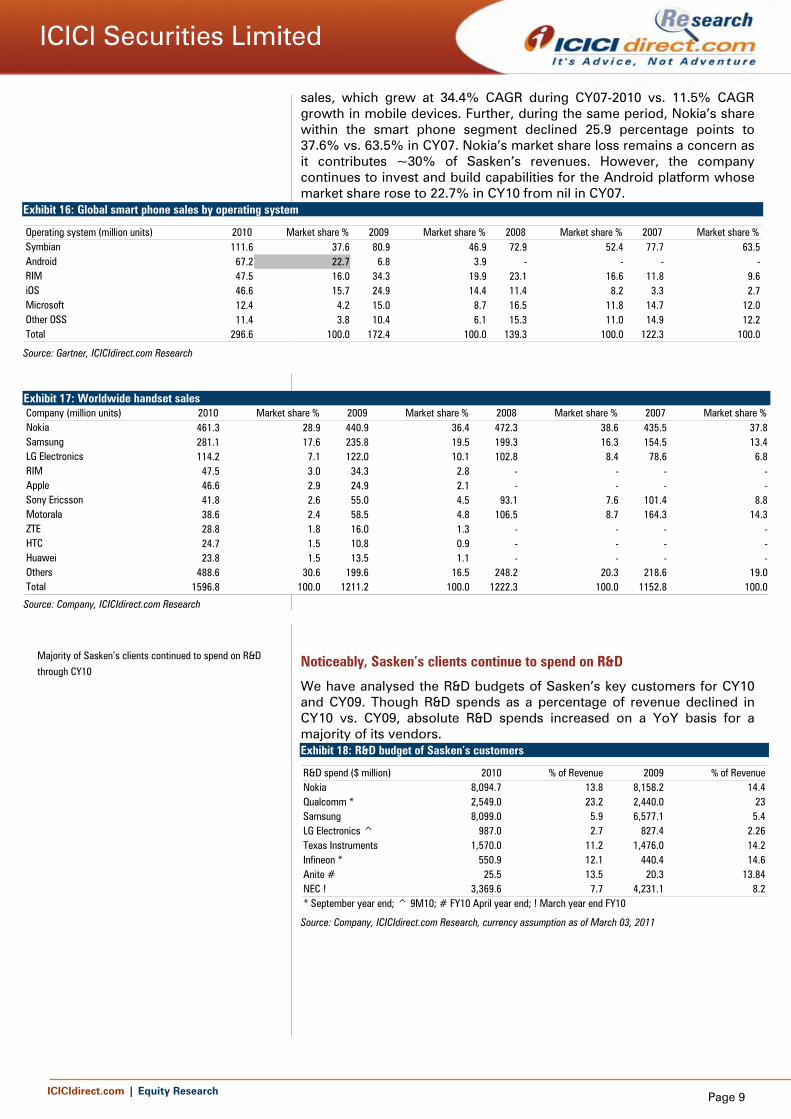
sales, which grew at 34.4% CAGR during CY07-2010 vs. 11.5% CAGR growth in mobile devices. Further, during the same period, Nokia’s share within the smart phone segment declined 25.9 percentage points to 37.6% vs. 63.5% in CY07. Nokia’s market share loss remains a concern as it contributes ~30% of Sasken’s revenues. However, the company continues to invest and build capabilities for the Android platform whose market share rose to 22.7% in CY10 from nil in CY07.
Exhibit 16: Global smart phone sales by operating system
Operating system (million units) 2010 Market share % 2009 Market share % 2008 Market share % 2007 Market share %Symbian 111.6 37.6 80.9 46.9 72.9 52.4 77.7 63.5Android 67.2 22.7 6.8 3.9 - - - -RIM 47.5 16.0 34.3 19.9 23.1 16.6 11.8 9.6iOS 46.6 15.7 24.9 14.4 11.4 8.2 3.3 2.7Microsoft 12.4 4.2 15.0 8.7 16.5 11.8 14.7 12.0Other OSS 11.4 3.8 10.4 6.1 15.3 11.0 14.9 12.2Total 296.6 100.0 172.4 100.0 139.3 100.0 122.3 100.0
Source: Gartner, ICICIdirect.com Research
Exhibit 17: Worldwide handset sales Company (million units) 2010 Market share % 2009 Market share % 2008 Market share % 2007 Market share %Nokia 461.3 28.9 440.9 36.4 472.3 38.6 435.5 37.8Samsung 281.1 17.6 235.8 19.5 199.3 16.3 154.5 13.4LG Electronics 114.2 7.1 122.0 10.1 102.8 8.4 78.6 6.8RIM 47.5 3.0 34.3 2.8 - - - -Apple 46.6 2.9 24.9 2.1 - - - -Sony Ericsson 41.8 2.6 55.0 4.5 93.1 7.6 101.4 8.8Motorala 38.6 2.4 58.5 4.8 106.5 8.7 164.3 14.3ZTE 28.8 1.8 16.0 1.3 - - - -HTC 24.7 1.5 10.8 0.9 - - - -Huawei 23.8 1.5 13.5 1.1 - - - -Others 488.6 30.6 199.6 16.5 248.2 20.3 218.6 19.0Total 1596.8 100.0 1211.2 100.0 1222.3 100.0 1152.8 100.0
Source: Company, ICICIdirect.com Research
Noticeably, Sasken’s clients continue to spend on R&D
We have analysed the R&D budgets of Sasken’s key customers for CY10 and CY09. Though R&D spends as a percentage of revenue declined in CY10 vs. CY09, absolute R&D spends increased on a YoY basis for a majority of its vendors. Exhibit 18: R&D budget of Sasken’s customers
R&D spend ($ million) 2010 % of Revenue 2009 % of RevenueNokia 8,094.7 13.8 8,158.2 14.4Qualcomm * 2,549.0 23.2 2,440.0 23Samsung 8,099.0 5.9 6,577.1 5.4LG Electronics ^ 987.0 2.7 827.4 2.26Texas Instruments 1,570.0 11.2 1,476.0 14.2Infineon * 550.9 12.1 440.4 14.6Anite # 25.5 13.5 20.3 13.84NEC ! 3,369.6 7.7 4,231.1 8.2* September year end; ^ 9M10; # FY10 April year end; ! March year end FY10
Source: Company, ICICIdirect.com Research, currency assumption as of March 03, 2011
Majority of Sasken’s clients continued to spend on R&D
through CY10
ICICIdirect.com | Equity Research Page 10
ICICI Securities Limited
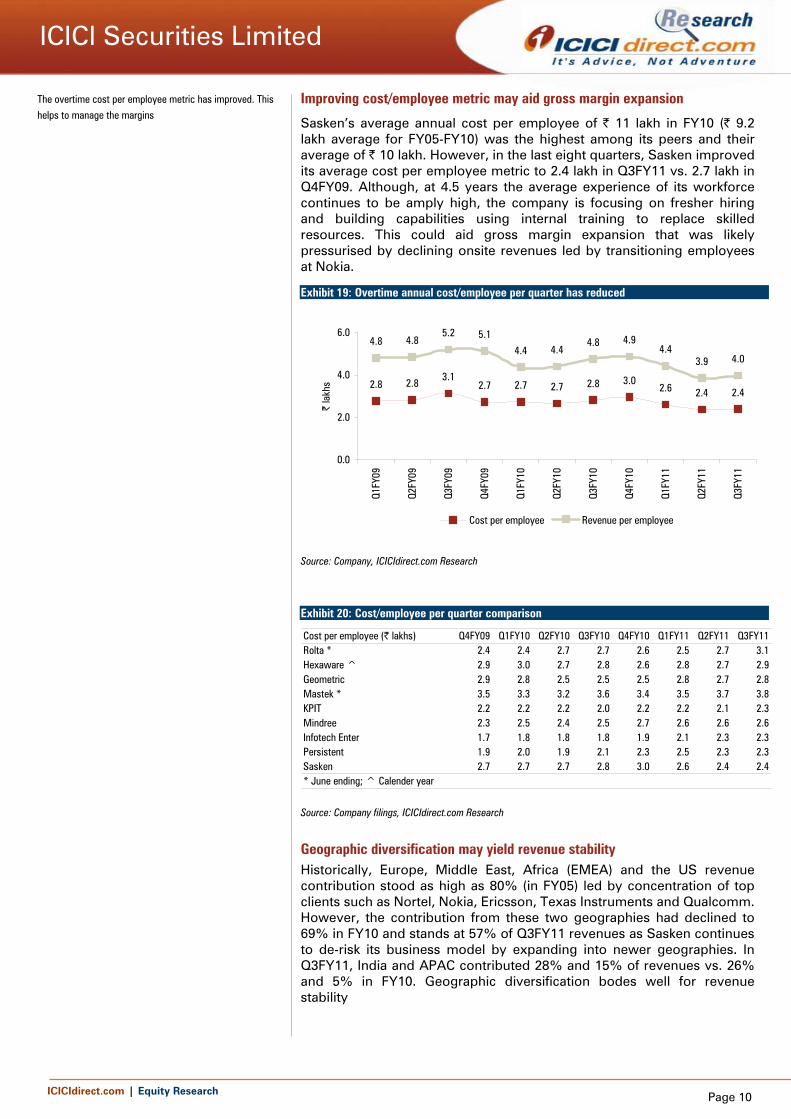
Improving cost/employee metric may aid gross margin expansion
Sasken’s average annual cost per employee of | 11 lakh in FY10 (| 9.2 lakh average for FY05-FY10) was the highest among its peers and their average of | 10 lakh. However, in the last eight quarters, Sasken improved its average cost per employee metric to 2.4 lakh in Q3FY11 vs. 2.7 lakh in Q4FY09. Although, at 4.5 years the average experience of its workforce continues to be amply high, the company is focusing on fresher hiring and building capabilities using internal training to replace skilled resources. This could aid gross margin expansion that was likely pressurised by declining onsite revenues led by transitioning employees at Nokia.
Exhibit 19: Overtime annual cost/employee per quarter has reduced
2.8 2.83.1
2.7 2.7 2.7 2.8 3.02.6 2.4 2.4
4.8 4.85.2 5.1
4.4 4.44.8 4.9
4.43.9 4.0
0.0
2.0
4.0
6.0
Q1FY
09
Q2FY
09
Q3FY
09
Q4FY
09
Q1FY
10
Q2FY
10
Q3FY
10
Q4FY
10
Q1FY
11
Q2FY
11
Q3FY
11
| la
khs
Cost per employee Revenue per employee
Source: Company, ICICIdirect.com Research
Exhibit 20: Cost/employee per quarter comparison
Cost per employee (| lakhs) Q4FY09 Q1FY10 Q2FY10 Q3FY10 Q4FY10 Q1FY11 Q2FY11 Q3FY11Rolta * 2.4 2.4 2.7 2.7 2.6 2.5 2.7 3.1Hexaware ^ 2.9 3.0 2.7 2.8 2.6 2.8 2.7 2.9Geometric 2.9 2.8 2.5 2.5 2.5 2.8 2.7 2.8Mastek * 3.5 3.3 3.2 3.6 3.4 3.5 3.7 3.8KPIT 2.2 2.2 2.2 2.0 2.2 2.2 2.1 2.3Mindree 2.3 2.5 2.4 2.5 2.7 2.6 2.6 2.6Infotech Enter 1.7 1.8 1.8 1.8 1.9 2.1 2.3 2.3Persistent 1.9 2.0 1.9 2.1 2.3 2.5 2.3 2.3Sasken 2.7 2.7 2.7 2.8 3.0 2.6 2.4 2.4* June ending; ^ Calender year
Source: Company filings, ICICIdirect.com Research
Geographic diversification may yield revenue stability Historically, Europe, Middle East, Africa (EMEA) and the US revenue contribution stood as high as 80% (in FY05) led by concentration of top clients such as Nortel, Nokia, Ericsson, Texas Instruments and Qualcomm. However, the contribution from these two geographies had declined to 69% in FY10 and stands at 57% of Q3FY11 revenues as Sasken continues to de-risk its business model by expanding into newer geographies. In Q3FY11, India and APAC contributed 28% and 15% of revenues vs. 26% and 5% in FY10. Geographic diversification bodes well for revenue stability
The overtime cost per employee metric has improved. This
helps to manage the margins

ICICIdirect.com | Equity Research Page 11
ICICI Securities Limited
Exhibit 21: Geography wise revenue break-up
34 35 29 28 20 20 19 18 16
47 37 44 5052 49 45 44 41
9 22 21 19 23 26 28 2928
11 7 7 3 5 5 8 8 15
0102030405060708090
100
FY05 FY06 FY07 FY08 FY09 FY10 Q1FY11 Q2FY11 Q3FY11
(%)
North America Europe, Middle East, Africa India Asia Pacific
s
Source: Company operating metric, ICICIdirect.com Research
Buyback should support share price in near term; improve financial ratios over medium term
On October 21, 2010, the Sasken board approved a share buyback through (starting December 2, 2010) open market transactions at a price not exceeding | 260/- per equity share for an amount not exceeding | 34.54 crore. The offer would close either on October 20, 2011 or in case the maximum offer shares (~2.755 million) have been bought. At | 260/share, 13,28,461 shares could have to be bought representing ~4.90% of the paid-up equity share capital. However, the average share price since December 3, 2010 stood at of | 167.08. This suggests, Sasken would acquire ~7,55,023 shares higher compared to what it would have acquired at | 260. This implies that apart from supporting near term share price volatility, the buyback announced would improve its financial ratios upon extinguishing higher number of acquired shares. Finally, till date, the company has spent | 18.6 crore to buy back ~1.2 million shares at an average price of | 155. Exhibit 22: Buyback should support near term price volatility
Buyback DetailsBuyback Amount (| cr) 34.54 Maximum Price (|) 260 Maximum shares bought 1,328,461 Average Share price (|) 165.78 Maximum shares bought 2,083,484 Incremental shares that could be bought 755,023 Shares bought back till date at an average price of |155 1,200,000
Source: Company, ICICIdirect.com Research
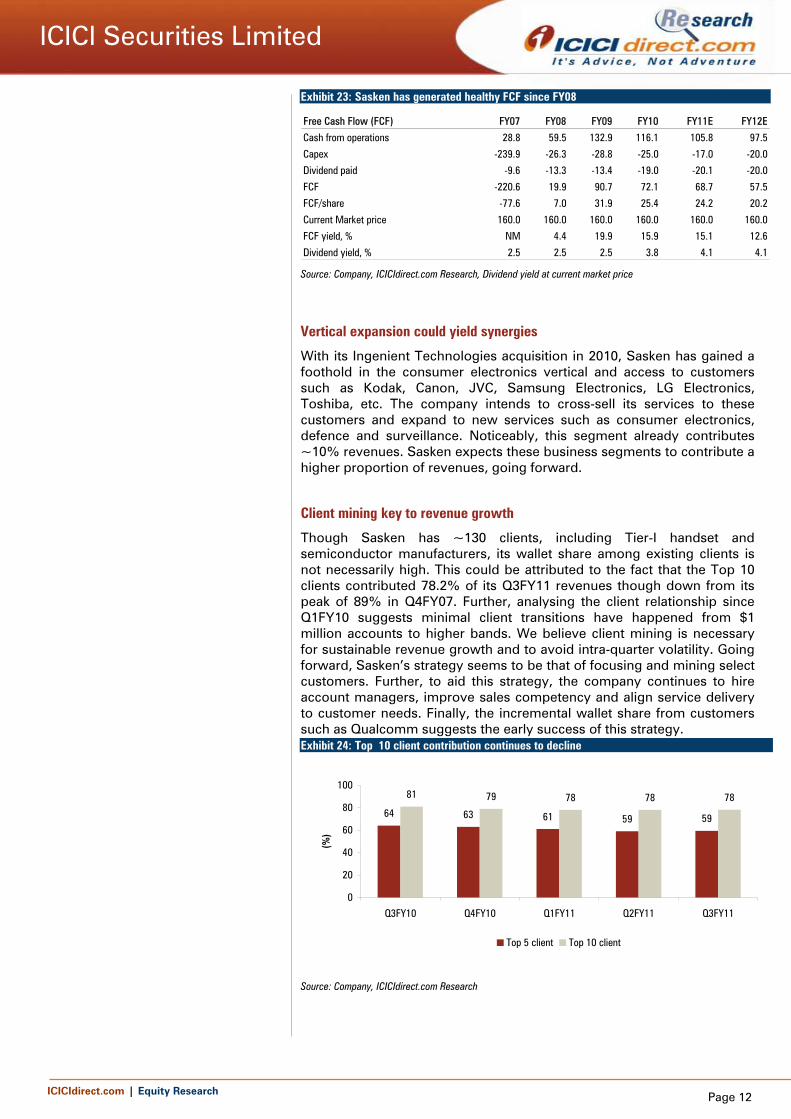
Healthy cash balance & free cash flow yield should comfort investors
Sasken continues to generate healthy operating and free cash flow. In FY10, Sasken generated cash flow from operations (CFO) of | 116.1 crore compared to | 132.9 crore in FY09. Further, we are modelling FY11E and FY12E CFO of | 105.8 crore and |97.5 crore, respectively. Adjusting for capex and dividend payment of | 17 crore and | 20.1 crore in FY11E and | 20 crore each in FY12E yields a free cash flow per share of | 24.2 and | 20.2 or an FCF yield of 15.1% and 12.6% for FY11E and FY12E, respectively. Finally, a healthy cash balance of | 192.6 crore (| 67.8/share) should comfort investors.
The buyback should support near term share price volatility
and improve financial ratios, going forward. Till date,
Sasken has bought back ~12 lakh shares at an average
price of | 155
Sasken has a healthy cash/share of | 67.8 and attractive
FCF yield of 15.1%
ICICIdirect.com | Equity Research Page 12
ICICI Securities Limited
Exhibit 23: Sasken has generated healthy FCF since FY08
Free Cash Flow (FCF) FY07 FY08 FY09 FY10 FY11E FY12E
Cash from operations 28.8 59.5 132.9 116.1 105.8 97.5
Capex -239.9 -26.3 -28.8 -25.0 -17.0 -20.0
Dividend paid -9.6 -13.3 -13.4 -19.0 -20.1 -20.0
FCF -220.6 19.9 90.7 72.1 68.7 57.5
FCF/share -77.6 7.0 31.9 25.4 24.2 20.2
Current Market price 160.0 160.0 160.0 160.0 160.0 160.0
FCF yield, % NM 4.4 19.9 15.9 15.1 12.6
Dividend yield, % 2.5 2.5 2.5 3.8 4.1 4.1
Source: Company, ICICIdirect.com Research, Dividend yield at current market price
Vertical expansion could yield synergies
With its Ingenient Technologies acquisition in 2010, Sasken has gained a foothold in the consumer electronics vertical and access to customers such as Kodak, Canon, JVC, Samsung Electronics, LG Electronics, Toshiba, etc. The company intends to cross-sell its services to these customers and expand to new services such as consumer electronics, defence and surveillance. Noticeably, this segment already contributes ~10% revenues. Sasken expects these business segments to contribute a higher proportion of revenues, going forward.
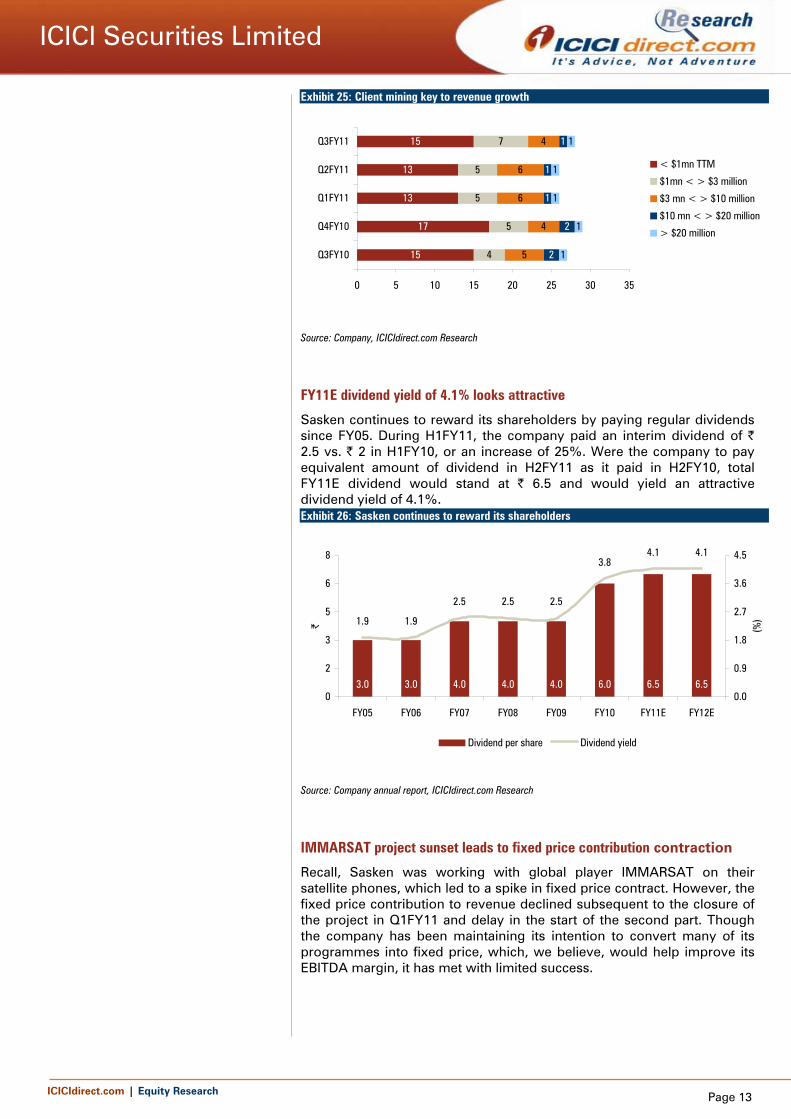
Client mining key to revenue growth
Though Sasken has ~130 clients, including Tier-I handset and semiconductor manufacturers, its wallet share among existing clients is not necessarily high. This could be attributed to the fact that the Top 10 clients contributed 78.2% of its Q3FY11 revenues though down from its peak of 89% in Q4FY07. Further, analysing the client relationship since Q1FY10 suggests minimal client transitions have happened from $1 million accounts to higher bands. We believe client mining is necessary for sustainable revenue growth and to avoid intra-quarter volatility. Going forward, Sasken’s strategy seems to be that of focusing and mining select customers. Further, to aid this strategy, the company continues to hire account managers, improve sales competency and align service delivery to customer needs. Finally, the incremental wallet share from customers such as Qualcomm suggests the early success of this strategy. Exhibit 24: Top 10 client contribution continues to decline
64 63 61 59 59
81 79 78 78 78
0
20
40
60
80
100
Q3FY10 Q4FY10 Q1FY11 Q2FY11 Q3FY11
(%)
Top 5 client Top 10 client
Source: Company, ICICIdirect.com Research
ICICIdirect.com | Equity Research Page 13
ICICI Securities Limited
Exhibit 25: Client mining key to revenue growth
15
17
13
13
15
4
5
5
5
7
5
4
6
6
4
2
2
1
1
1
1
1
1
1
1
0 5 10 15 20 25 30 35
Q3FY10
Q4FY10
Q1FY11
Q2FY11
Q3FY11
< $1mn TTM
$1mn < > $3 million
$3 mn < > $10 million
$10 mn < > $20 million
> $20 million
Source: Company, ICICIdirect.com Research
FY11E dividend yield of 4.1% looks attractive
Sasken continues to reward its shareholders by paying regular dividends since FY05. During H1FY11, the company paid an interim dividend of | 2.5 vs. | 2 in H1FY10, or an increase of 25%. Were the company to pay equivalent amount of dividend in H2FY11 as it paid in H2FY10, total FY11E dividend would stand at | 6.5 and would yield an attractive dividend yield of 4.1%. Exhibit 26: Sasken continues to reward its shareholders
3.0 3.0 4.0 4.0 4.0 6.0 6.5 6.5
1.9 1.9
2.5 2.5 2.5
3.84.1 4.1
0
2
3
5
6
8
FY05 FY06 FY07 FY08 FY09 FY10 FY11E FY12E
|
0.0
0.9
1.8
2.7
3.6
4.5
(%)
Dividend per share Dividend yield
Source: Company annual report, ICICIdirect.com Research
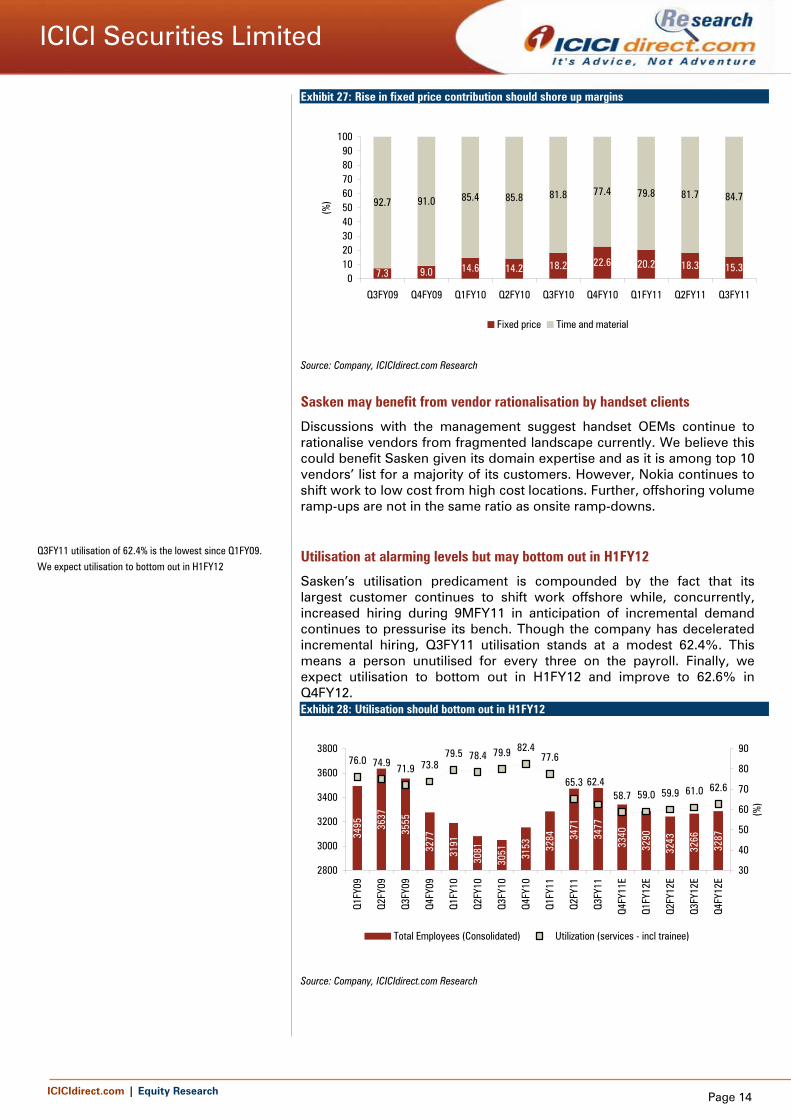
IMMARSAT project sunset leads to fixed price contribution contraction
Recall, Sasken was working with global player IMMARSAT on their satellite phones, which led to a spike in fixed price contract. However, the fixed price contribution to revenue declined subsequent to the closure of the project in Q1FY11 and delay in the start of the second part. Though the company has been maintaining its intention to convert many of its programmes into fixed price, which, we believe, would help improve its EBITDA margin, it has met with limited success.
ICICIdirect.com | Equity Research Page 14
ICICI Securities Limited
Exhibit 27: Rise in fixed price contribution should shore up margins
7.3 9.0 14.6 14.2 18.2 22.6 20.2 18.3 15.3
92.7 91.0 85.4 85.8 81.8 77.4 79.8 81.7 84.7
0102030405060708090
100
Q3FY09 Q4FY09 Q1FY10 Q2FY10 Q3FY10 Q4FY10 Q1FY11 Q2FY11 Q3FY11
(%)
Fixed price Time and material
Source: Company, ICICIdirect.com Research
Sasken may benefit from vendor rationalisation by handset clients
Discussions with the management suggest handset OEMs continue to rationalise vendors from fragmented landscape currently. We believe this could benefit Sasken given its domain expertise and as it is among top 10 vendors’ list for a majority of its customers. However, Nokia continues to shift work to low cost from high cost locations. Further, offshoring volume ramp-ups are not in the same ratio as onsite ramp-downs.
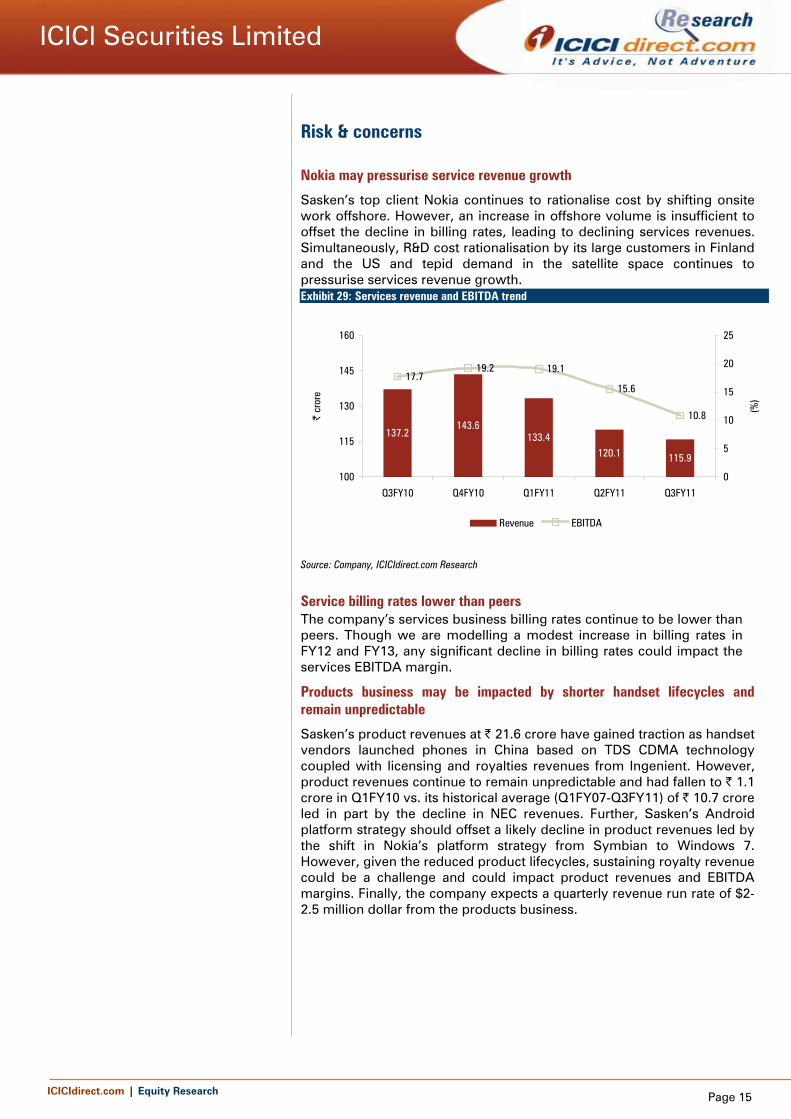
Utilisation at alarming levels but may bottom out in H1FY12
Sasken’s utilisation predicament is compounded by the fact that its largest customer continues to shift work offshore while, concurrently, increased hiring during 9MFY11 in anticipation of incremental demand continues to pressurise its bench. Though the company has decelerated incremental hiring, Q3FY11 utilisation stands at a modest 62.4%. This means a person unutilised for every three on the payroll. Finally, we expect utilisation to bottom out in H1FY12 and improve to 62.6% in Q4FY12. Exhibit 28: Utilisation should bottom out in H1FY12
3495 36
37
3555
3277
3191
3081
3051 31
53 3284 34
71
3477
3340
3290
3243
3266
3287
76.0 74.9 71.9 73.879.5 78.4 79.9 82.4
77.6
65.358.7 59.0 59.9 61.0 62.662.4
2800
3000
3200
3400
3600
3800
Q1FY
09
Q2FY
09
Q3FY
09
Q4FY
09
Q1FY
10
Q2FY
10
Q3FY
10
Q4FY
10
Q1FY
11
Q2FY
11
Q3FY
11
Q4FY
11E
Q1FY
12E
Q2FY
12E
Q3FY
12E
Q4FY
12E
30
40
50
60
70
80
90(%
)
Total Employees (Consolidated) Utilization (services - incl trainee)
Source: Company, ICICIdirect.com Research
Q3FY11 utilisation of 62.4% is the lowest since Q1FY09.
We expect utilisation to bottom out in H1FY12
ICICIdirect.com | Equity Research Page 15
ICICI Securities Limited
Risk & concerns
Nokia may pressurise service revenue growth
Sasken’s top client Nokia continues to rationalise cost by shifting onsite work offshore. However, an increase in offshore volume is insufficient to offset the decline in billing rates, leading to declining services revenues. Simultaneously, R&D cost rationalisation by its large customers in Finland and the US and tepid demand in the satellite space continues to pressurise services revenue growth. Exhibit 29: Services revenue and EBITDA trend
137.2143.6
133.4120.1 115.9
17.719.2 19.1
15.6
10.8
100
115
130
145
160
Q3FY10 Q4FY10 Q1FY11 Q2FY11 Q3FY11
| cr
ore
0
5
10
15
20
25
(%)
Revenue EBITDA
Source: Company, ICICIdirect.com Research
Service billing rates lower than peers The company’s services business billing rates continue to be lower than peers. Though we are modelling a modest increase in billing rates in FY12 and FY13, any significant decline in billing rates could impact the services EBITDA margin.
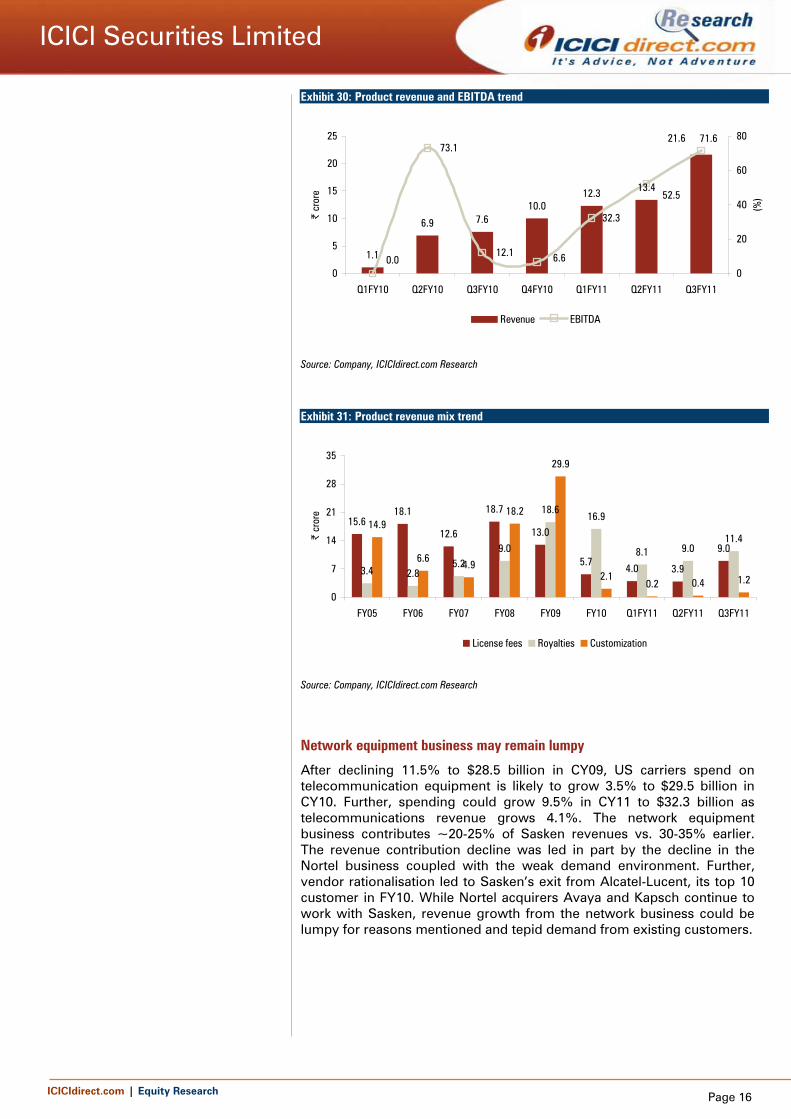
Products business may be impacted by shorter handset lifecycles and remain unpredictable
Sasken’s product revenues at | 21.6 crore have gained traction as handset vendors launched phones in China based on TDS CDMA technology coupled with licensing and royalties revenues from Ingenient. However, product revenues continue to remain unpredictable and had fallen to | 1.1 crore in Q1FY10 vs. its historical average (Q1FY07-Q3FY11) of | 10.7 crore led in part by the decline in NEC revenues. Further, Sasken’s Android platform strategy should offset a likely decline in product revenues led by the shift in Nokia’s platform strategy from Symbian to Windows 7. However, given the reduced product lifecycles, sustaining royalty revenue could be a challenge and could impact product revenues and EBITDA margins. Finally, the company expects a quarterly revenue run rate of $2-2.5 million dollar from the products business.
ICICIdirect.com | Equity Research Page 16
ICICI Securities Limited
Exhibit 30: Product revenue and EBITDA trend
1.1
6.9 7.610.0
12.3 13.4
21.6 71.6
12.1
73.1
0.0
52.5
32.3
6.60
5
10
15
20
25
Q1FY10 Q2FY10 Q3FY10 Q4FY10 Q1FY11 Q2FY11 Q3FY11
| cr
ore
0
20
40
60
80
(%)
Revenue EBITDA
Source: Company, ICICIdirect.com Research
Exhibit 31: Product revenue mix trend
15.618.1
12.6
18.7
13.0
5.74.0 3.9
9.0
3.4 2.85.2
9.0
18.616.9
8.1 9.011.4
14.9
6.64.9
18.2
29.9
2.10.2 0.4 1.2
0
7
14
21
28
35
FY05 FY06 FY07 FY08 FY09 FY10 Q1FY11 Q2FY11 Q3FY11
| cr
ore
License fees Royalties Customization
Source: Company, ICICIdirect.com Research
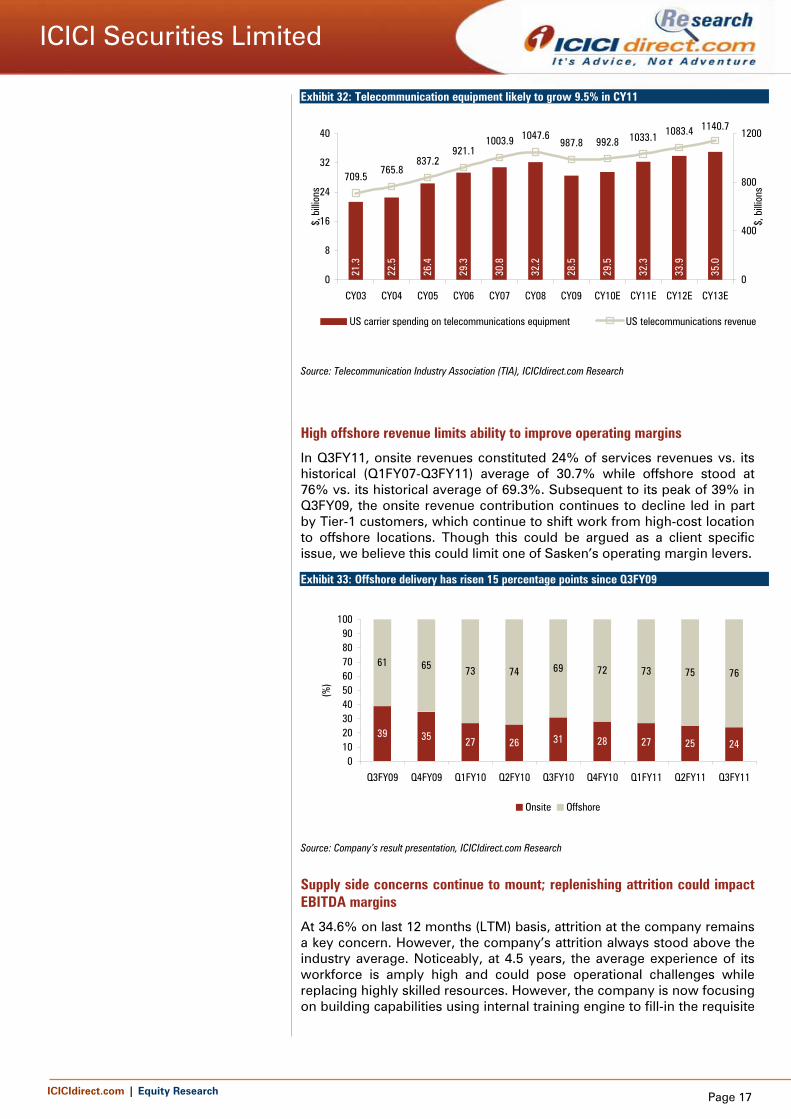
Network equipment business may remain lumpy
After declining 11.5% to $28.5 billion in CY09, US carriers spend on telecommunication equipment is likely to grow 3.5% to $29.5 billion in CY10. Further, spending could grow 9.5% in CY11 to $32.3 billion as telecommunications revenue grows 4.1%. The network equipment business contributes ~20-25% of Sasken revenues vs. 30-35% earlier. The revenue contribution decline was led in part by the decline in the Nortel business coupled with the weak demand environment. Further, vendor rationalisation led to Sasken’s exit from Alcatel-Lucent, its top 10 customer in FY10. While Nortel acquirers Avaya and Kapsch continue to work with Sasken, revenue growth from the network business could be lumpy for reasons mentioned and tepid demand from existing customers.
ICICIdirect.com | Equity Research Page 17
ICICI Securities Limited
Exhibit 32: Telecommunication equipment likely to grow 9.5% in CY11
21.3
22.5
26.4
29.3
30.8
32.2
28.5
29.5
32.3
33.9
35.0
1140.71083.41033.1992.8987.81047.61003.9
921.1837.2
765.8709.5
0
8
16
24
32
40
CY03 CY04 CY05 CY06 CY07 CY08 CY09 CY10E CY11E CY12E CY13E
$, b
illion
s
0
400
800
1200
$, b
illion
s
US carrier spending on telecommunications equipment US telecommunications revenue
Source: Telecommunication Industry Association (TIA), ICICIdirect.com Research
High offshore revenue limits ability to improve operating margins
In Q3FY11, onsite revenues constituted 24% of services revenues vs. its historical (Q1FY07-Q3FY11) average of 30.7% while offshore stood at 76% vs. its historical average of 69.3%. Subsequent to its peak of 39% in Q3FY09, the onsite revenue contribution continues to decline led in part by Tier-1 customers, which continue to shift work from high-cost location to offshore locations. Though this could be argued as a client specific issue, we believe this could limit one of Sasken’s operating margin levers.
Exhibit 33: Offshore delivery has risen 15 percentage points since Q3FY09
39 35 27 26 31 28 27 25 24
61 65 73 74 69 72 73 75 76
0102030405060708090100
Q3FY09 Q4FY09 Q1FY10 Q2FY10 Q3FY10 Q4FY10 Q1FY11 Q2FY11 Q3FY11
(%)
Onsite Offshore
Source: Company’s result presentation, ICICIdirect.com Research
Supply side concerns continue to mount; replenishing attrition could impact EBITDA margins
At 34.6% on last 12 months (LTM) basis, attrition at the company remains a key concern. However, the company’s attrition always stood above the industry average. Noticeably, at 4.5 years, the average experience of its workforce is amply high and could pose operational challenges while replacing highly skilled resources. However, the company is now focusing on building capabilities using internal training engine to fill-in the requisite
ICICIdirect.com | Equity Research Page 18
ICICI Securities Limited
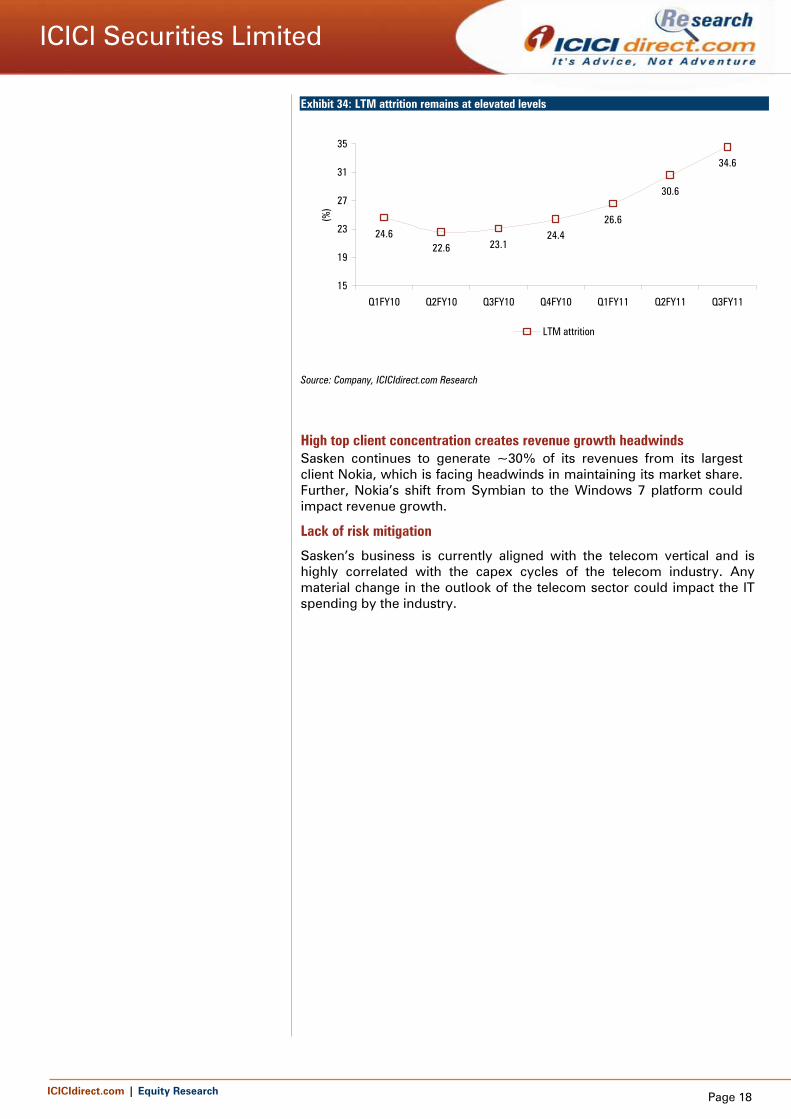
Exhibit 34: LTM attrition remains at elevated levels
24.622.6 23.1
24.426.6
30.6
34.6
15
19
23
27
31
35
Q1FY10 Q2FY10 Q3FY10 Q4FY10 Q1FY11 Q2FY11 Q3FY11
(%)
LTM attrition
Source: Company, ICICIdirect.com Research
High top client concentration creates revenue growth headwinds Sasken continues to generate ~30% of its revenues from its largest client Nokia, which is facing headwinds in maintaining its market share. Further, Nokia’s shift from Symbian to the Windows 7 platform could impact revenue growth.
Lack of risk mitigation
Sasken’s business is currently aligned with the telecom vertical and is highly correlated with the capex cycles of the telecom industry. Any material change in the outlook of the telecom sector could impact the IT spending by the industry.
ICICIdirect.com | Equity Research Page 19
ICICI Securities Limited
Financials
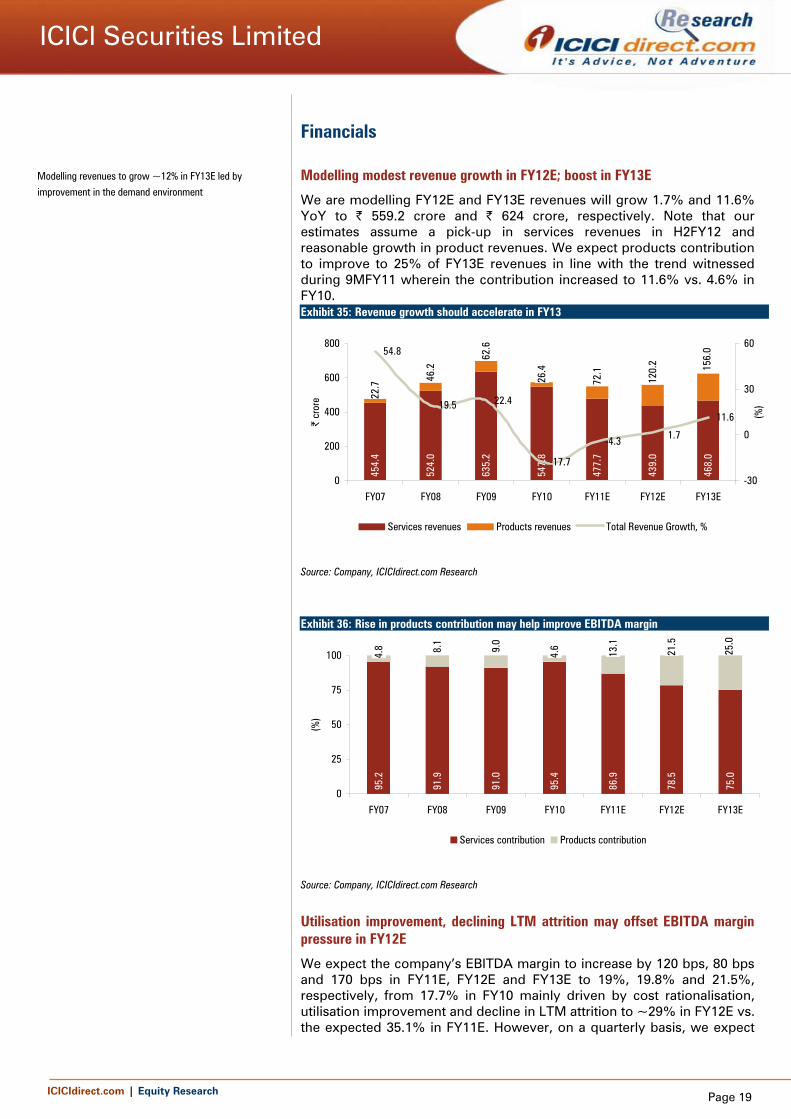
Modelling modest revenue growth in FY12E; boost in FY13E
We are modelling FY12E and FY13E revenues will grow 1.7% and 11.6% YoY to | 559.2 crore and | 624 crore, respectively. Note that our estimates assume a pick-up in services revenues in H2FY12 and reasonable growth in product revenues. We expect products contribution to improve to 25% of FY13E revenues in line with the trend witnessed during 9MFY11 wherein the contribution increased to 11.6% vs. 4.6% in FY10. Exhibit 35: Revenue growth should accelerate in FY13
454.
4
524.
0
635.
2
547.
8
477.
7
439.
0
468.
0
26.4 15
6.0
120.
2
72.1
62.6
46.2
22.7
54.8
19.5 22.4
-17.7
-4.3
11.6
1.7
0
200
400
600
800
FY07 FY08 FY09 FY10 FY11E FY12E FY13E
| cr
ore
-30
0
30
60
(%)
Services revenues Products revenues Total Revenue Growth, %
Source: Company, ICICIdirect.com Research
Exhibit 36: Rise in products contribution may help improve EBITDA margin
95.2
91.9
91.0
95.4
86.9
78.5
75.0
4.6
4.8 8.
1
9.0
13.1
21.5
25.0
0
25
50
75
100
FY07 FY08 FY09 FY10 FY11E FY12E FY13E
(%)
Services contribution Products contribution
Source: Company, ICICIdirect.com Research
Utilisation improvement, declining LTM attrition may offset EBITDA margin pressure in FY12E
We expect the company’s EBITDA margin to increase by 120 bps, 80 bps and 170 bps in FY11E, FY12E and FY13E to 19%, 19.8% and 21.5%, respectively, from 17.7% in FY10 mainly driven by cost rationalisation, utilisation improvement and decline in LTM attrition to ~29% in FY12E vs. the expected 35.1% in FY11E. However, on a quarterly basis, we expect
Modelling revenues to grow ~12% in FY13E led by
improvement in the demand environment
ICICIdirect.com | Equity Research Page 20
ICICI Securities Limited
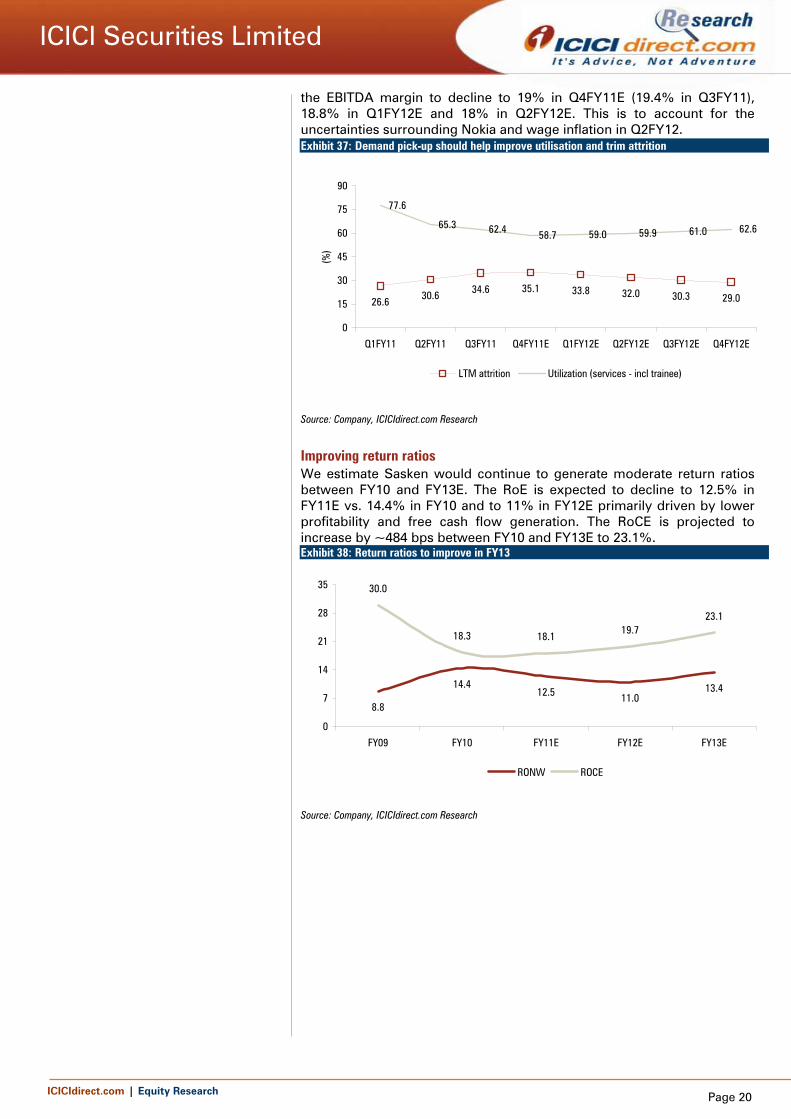
the EBITDA margin to decline to 19% in Q4FY11E (19.4% in Q3FY11), 18.8% in Q1FY12E and 18% in Q2FY12E. This is to account for the uncertainties surrounding Nokia and wage inflation in Q2FY12. Exhibit 37: Demand pick-up should help improve utilisation and trim attrition
26.6 30.6 34.6 35.1 33.8 32.0 30.3 29.0
77.6
65.3 62.4 58.7 59.0 59.9 61.0 62.6
0
15
30
45
60
75
90
Q1FY11 Q2FY11 Q3FY11 Q4FY11E Q1FY12E Q2FY12E Q3FY12E Q4FY12E
(%)
LTM attrition Utilization (services - incl trainee)
Source: Company, ICICIdirect.com Research
Improving return ratios We estimate Sasken would continue to generate moderate return ratios between FY10 and FY13E. The RoE is expected to decline to 12.5% in FY11E vs. 14.4% in FY10 and to 11% in FY12E primarily driven by lower profitability and free cash flow generation. The RoCE is projected to increase by ~484 bps between FY10 and FY13E to 23.1%. Exhibit 38: Return ratios to improve in FY13
8.8
14.412.5 11.0
13.4
30.0
18.3 18.119.7
23.1
0
7
14
21
28
35
FY09 FY10 FY11E FY12E FY13E
RONW ROCE
Source: Company, ICICIdirect.com Research
ICICIdirect.com | Equity Research Page 21
ICICI Securities Limited
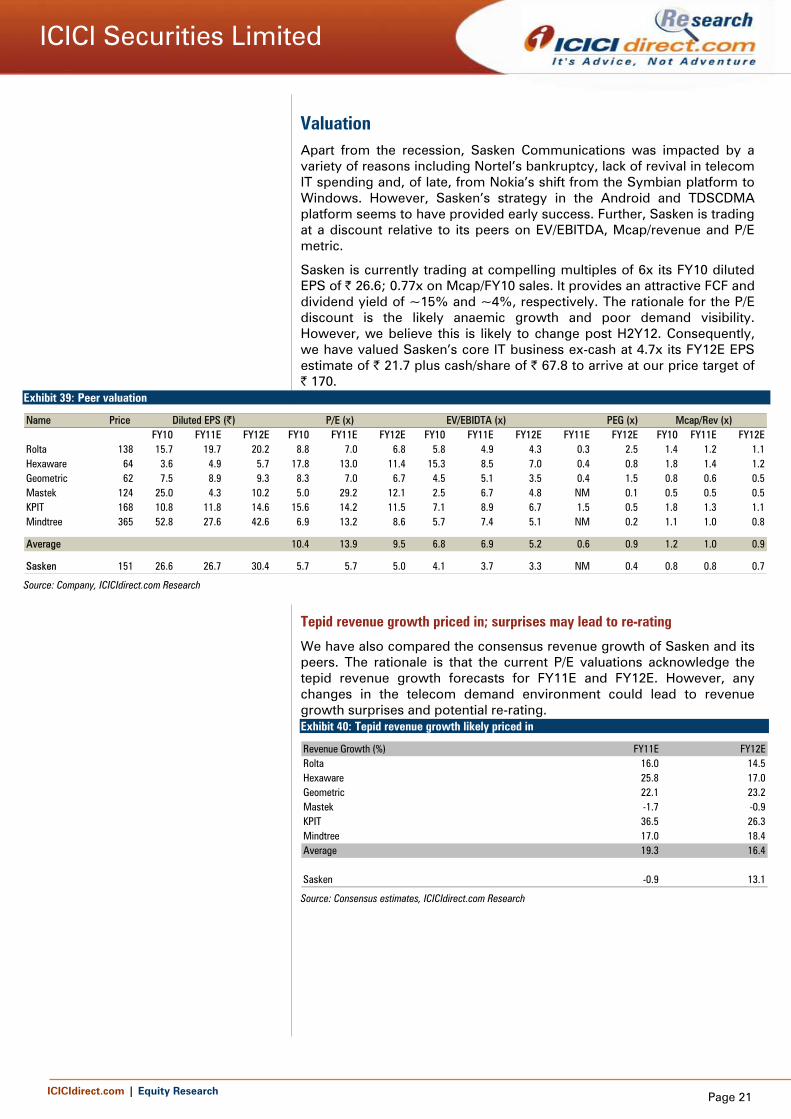
Valuation Apart from the recession, Sasken Communications was impacted by a variety of reasons including Nortel’s bankruptcy, lack of revival in telecom IT spending and, of late, from Nokia’s shift from the Symbian platform to Windows. However, Sasken’s strategy in the Android and TDSCDMA platform seems to have provided early success. Further, Sasken is trading at a discount relative to its peers on EV/EBITDA, Mcap/revenue and P/E metric.
Sasken is currently trading at compelling multiples of 6x its FY10 diluted EPS of | 26.6; 0.77x on Mcap/FY10 sales. It provides an attractive FCF and dividend yield of ~15% and ~4%, respectively. The rationale for the P/E discount is the likely anaemic growth and poor demand visibility. However, we believe this is likely to change post H2Y12. Consequently, we have valued Sasken’s core IT business ex-cash at 4.7x its FY12E EPS estimate of | 21.7 plus cash/share of | 67.8 to arrive at our price target of | 170.
Exhibit 39: Peer valuation
Name Price FY10 FY11E FY12E FY10 FY11E FY12E FY10 FY11E FY12E FY11E FY12E FY10 FY11E FY12E
Rolta 138 15.7 19.7 20.2 8.8 7.0 6.8 5.8 4.9 4.3 0.3 2.5 1.4 1.2 1.1Hexaware 64 3.6 4.9 5.7 17.8 13.0 11.4 15.3 8.5 7.0 0.4 0.8 1.8 1.4 1.2Geometric 62 7.5 8.9 9.3 8.3 7.0 6.7 4.5 5.1 3.5 0.4 1.5 0.8 0.6 0.5Mastek 124 25.0 4.3 10.2 5.0 29.2 12.1 2.5 6.7 4.8 NM 0.1 0.5 0.5 0.5KPIT 168 10.8 11.8 14.6 15.6 14.2 11.5 7.1 8.9 6.7 1.5 0.5 1.8 1.3 1.1Mindtree 365 52.8 27.6 42.6 6.9 13.2 8.6 5.7 7.4 5.1 NM 0.2 1.1 1.0 0.8
Average 10.4 13.9 9.5 6.8 6.9 5.2 0.6 0.9 1.2 1.0 0.9
Sasken 151 26.6 26.7 30.4 5.7 5.7 5.0 4.1 3.7 3.3 NM 0.4 0.8 0.8 0.7
Mcap/Rev (x)Diluted EPS (|) P/E (x) EV/EBIDTA (x) PEG (x)
Source: Company, ICICIdirect.com Research
Tepid revenue growth priced in; surprises may lead to re-rating
We have also compared the consensus revenue growth of Sasken and its peers. The rationale is that the current P/E valuations acknowledge the tepid revenue growth forecasts for FY11E and FY12E. However, any changes in the telecom demand environment could lead to revenue growth surprises and potential re-rating. Exhibit 40: Tepid revenue growth likely priced in
Revenue Growth (%) FY11E FY12ERolta 16.0 14.5Hexaware 25.8 17.0Geometric 22.1 23.2Mastek -1.7 -0.9KPIT 36.5 26.3Mindtree 17.0 18.4Average 19.3 16.4
Sasken -0.9 13.1
Source: Consensus estimates, ICICIdirect.com Research
ICICIdirect.com | Equity Research Page 22
ICICI Securities Limited
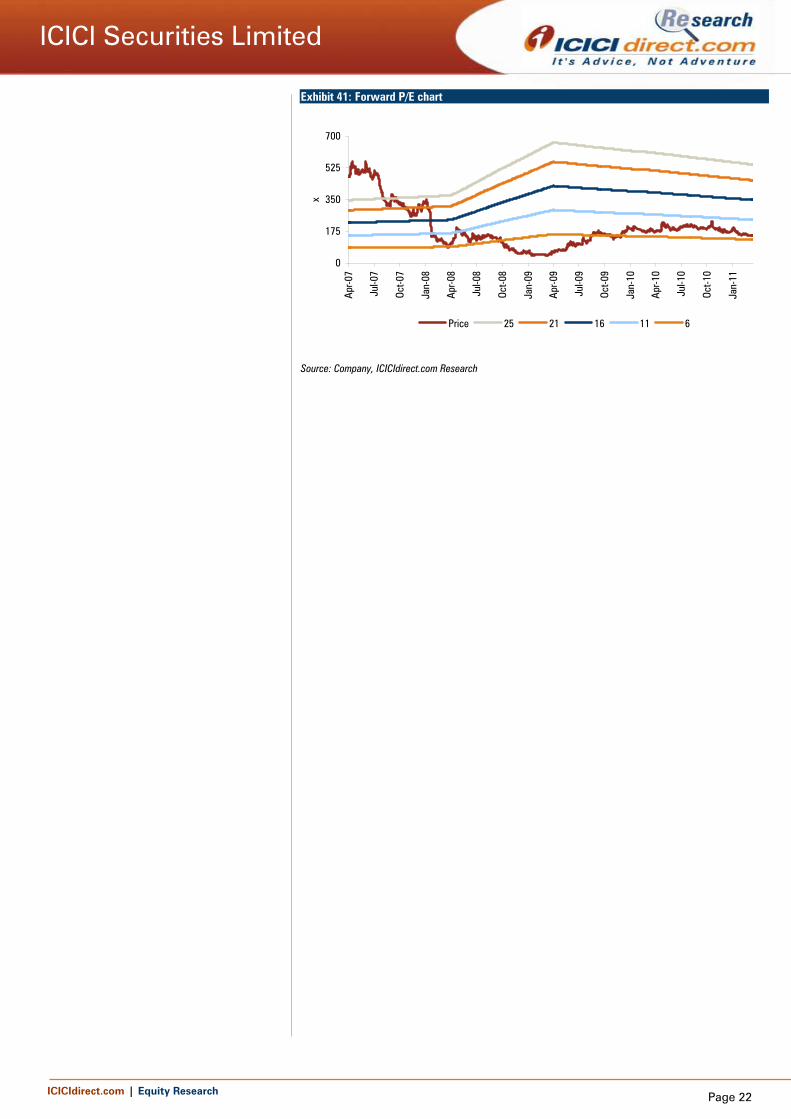
Exhibit 41: Forward P/E chart
0
175
350
525
700
Apr-0
7
Jul-0
7
Oct-0
7
Jan-
08
Apr-0
8
Jul-0
8
Oct-0
8
Jan-
09
Apr-0
9
Jul-0
9
Oct-0
9
Jan-
10
Apr-1
0
Jul-1
0
Oct-1
0
Jan-
11
xPrice 25 21 16 11 6
Source: Company, ICICIdirect.com Research
ICICIdirect.com | Equity Research Page 23
ICICI Securities Limited
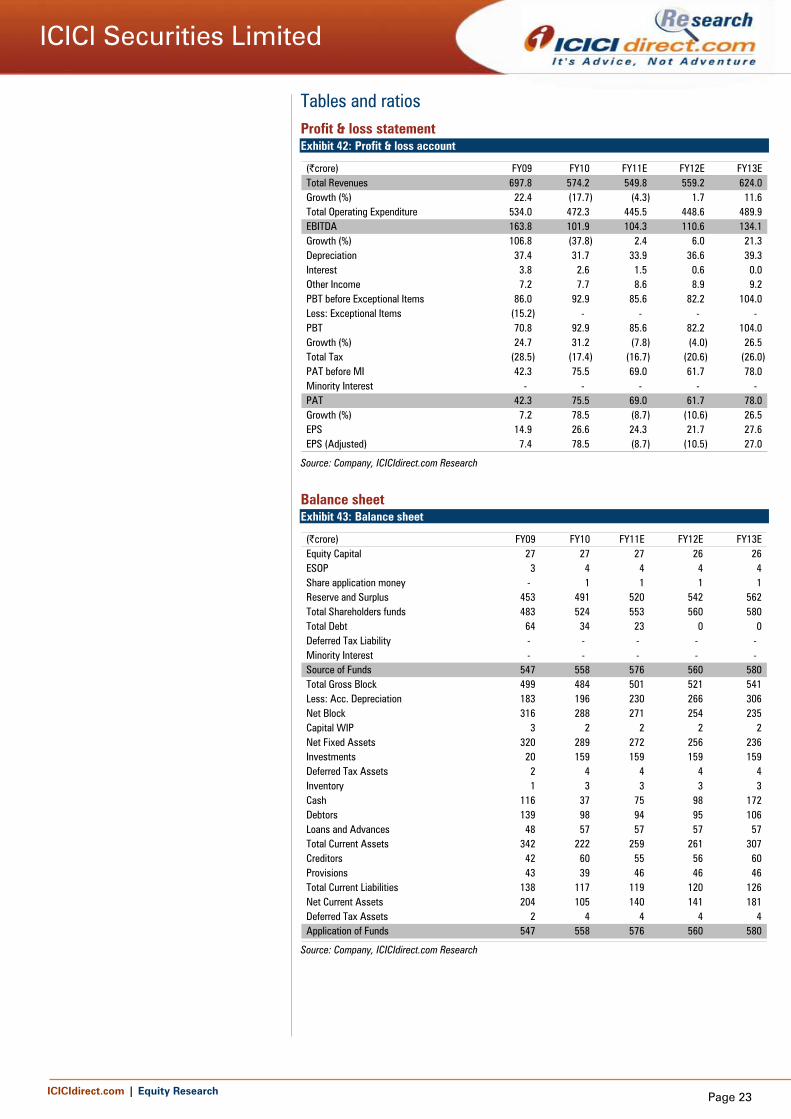
Tables and ratios Profit & loss statement Exhibit 42: Profit & loss account
(|crore) FY09 FY10 FY11E FY12E FY13ETotal Revenues 697.8 574.2 549.8 559.2 624.0 Growth (%) 22.4 (17.7) (4.3) 1.7 11.6 Total Operating Expenditure 534.0 472.3 445.5 448.6 489.9 EBITDA 163.8 101.9 104.3 110.6 134.1 Growth (%) 106.8 (37.8) 2.4 6.0 21.3 Depreciation 37.4 31.7 33.9 36.6 39.3 Interest 3.8 2.6 1.5 0.6 0.0 Other Income 7.2 7.7 8.6 8.9 9.2 PBT before Exceptional Items 86.0 92.9 85.6 82.2 104.0 Less: Exceptional Items (15.2) - - - - PBT 70.8 92.9 85.6 82.2 104.0 Growth (%) 24.7 31.2 (7.8) (4.0) 26.5 Total Tax (28.5) (17.4) (16.7) (20.6) (26.0) PAT before MI 42.3 75.5 69.0 61.7 78.0 Minority Interest - - - - - PAT 42.3 75.5 69.0 61.7 78.0 Growth (%) 7.2 78.5 (8.7) (10.6) 26.5 EPS 14.9 26.6 24.3 21.7 27.6 EPS (Adjusted) 7.4 78.5 (8.7) (10.5) 27.0
Source: Company, ICICIdirect.com Research
Balance sheet Exhibit 43: Balance sheet
(|crore) FY09 FY10 FY11E FY12E FY13EEquity Capital 27 27 27 26 26 ESOP 3 4 4 4 4 Share application money - 1 1 1 1 Reserve and Surplus 453 491 520 542 562 Total Shareholders funds 483 524 553 560 580 Total Debt 64 34 23 0 0 Deferred Tax Liability - - - - - Minority Interest - - - - - Source of Funds 547 558 576 560 580 Total Gross Block 499 484 501 521 541 Less: Acc. Depreciation 183 196 230 266 306 Net Block 316 288 271 254 235 Capital WIP 3 2 2 2 2 Net Fixed Assets 320 289 272 256 236 Investments 20 159 159 159 159 Deferred Tax Assets 2 4 4 4 4 Inventory 1 3 3 3 3 Cash 116 37 75 98 172 Debtors 139 98 94 95 106 Loans and Advances 48 57 57 57 57 Total Current Assets 342 222 259 261 307 Creditors 42 60 55 56 60 Provisions 43 39 46 46 46 Total Current Liabilities 138 117 119 120 126 Net Current Assets 204 105 140 141 181 Deferred Tax Assets 2 4 4 4 4 Application of Funds 547 558 576 560 580
Source: Company, ICICIdirect.com Research
ICICIdirect.com | Equity Research Page 24
ICICI Securities Limited
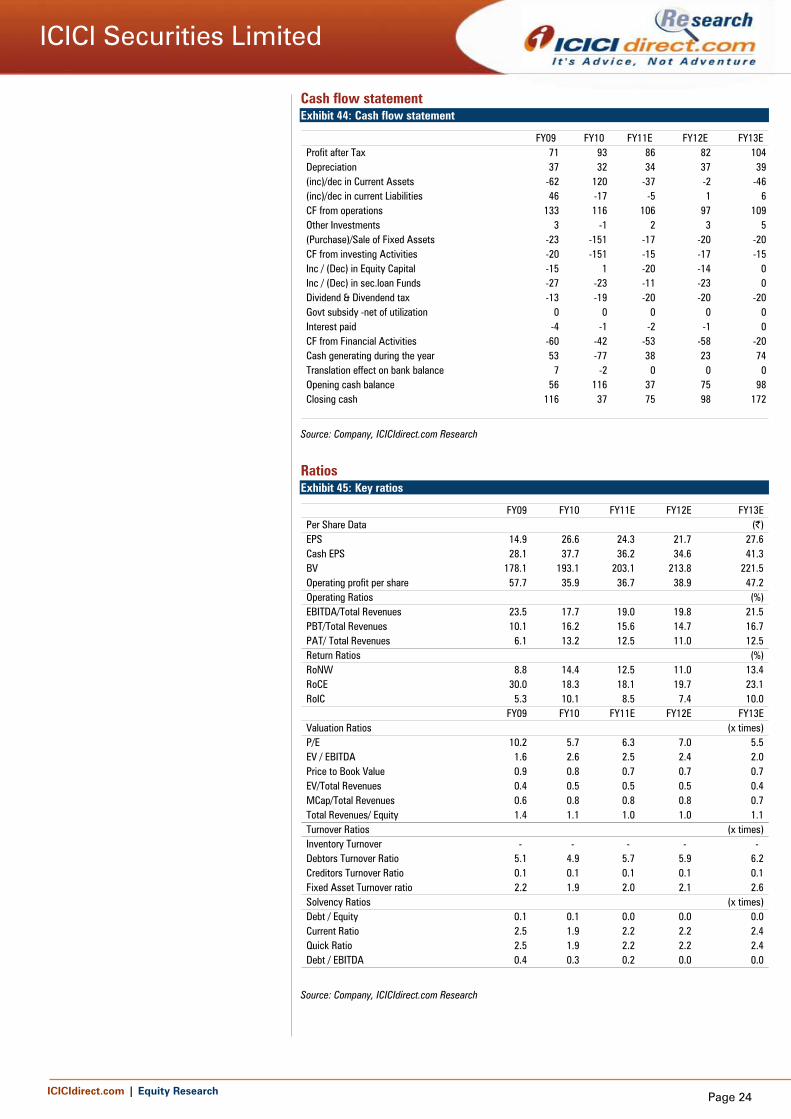
Cash flow statement Exhibit 44: Cash flow statement
FY09 FY10 FY11E FY12E FY13EProfit after Tax 71 93 86 82 104Depreciation 37 32 34 37 39(inc)/dec in Current Assets -62 120 -37 -2 -46(inc)/dec in current Liabilities 46 -17 -5 1 6CF from operations 133 116 106 97 109Other Investments 3 -1 2 3 5(Purchase)/Sale of Fixed Assets -23 -151 -17 -20 -20CF from investing Activities -20 -151 -15 -17 -15Inc / (Dec) in Equity Capital -15 1 -20 -14 0Inc / (Dec) in sec.loan Funds -27 -23 -11 -23 0Dividend & Divendend tax -13 -19 -20 -20 -20Govt subsidy -net of utilization 0 0 0 0 0Interest paid -4 -1 -2 -1 0CF from Financial Activities -60 -42 -53 -58 -20Cash generating during the year 53 -77 38 23 74Translation effect on bank balance 7 -2 0 0 0Opening cash balance 56 116 37 75 98Closing cash 116 37 75 98 172
Source: Company, ICICIdirect.com Research
Ratios Exhibit 45: Key ratios
FY09 FY10 FY11E FY12E FY13EPer Share Data (|)EPS 14.9 26.6 24.3 21.7 27.6 Cash EPS 28.1 37.7 36.2 34.6 41.3 BV 178.1 193.1 203.1 213.8 221.5 Operating profit per share 57.7 35.9 36.7 38.9 47.2 Operating Ratios (%)EBITDA/Total Revenues 23.5 17.7 19.0 19.8 21.5 PBT/Total Revenues 10.1 16.2 15.6 14.7 16.7 PAT/ Total Revenues 6.1 13.2 12.5 11.0 12.5 Return Ratios (%)RoNW 8.8 14.4 12.5 11.0 13.4 RoCE 30.0 18.3 18.1 19.7 23.1 RoIC 5.3 10.1 8.5 7.4 10.0
FY09 FY10 FY11E FY12E FY13EValuation Ratios (x times)P/E 10.2 5.7 6.3 7.0 5.5 EV / EBITDA 1.6 2.6 2.5 2.4 2.0 Price to Book Value 0.9 0.8 0.7 0.7 0.7 EV/Total Revenues 0.4 0.5 0.5 0.5 0.4 MCap/Total Revenues 0.6 0.8 0.8 0.8 0.7 Total Revenues/ Equity 1.4 1.1 1.0 1.0 1.1 Turnover Ratios (x times)Inventory Turnover - - - - - Debtors Turnover Ratio 5.1 4.9 5.7 5.9 6.2 Creditors Turnover Ratio 0.1 0.1 0.1 0.1 0.1 Fixed Asset Turnover ratio 2.2 1.9 2.0 2.1 2.6 Solvency Ratios (x times)Debt / Equity 0.1 0.1 0.0 0.0 0.0 Current Ratio 2.5 1.9 2.2 2.2 2.4 Quick Ratio 2.5 1.9 2.2 2.2 2.4 Debt / EBITDA 0.4 0.3 0.2 0.0 0.0
Source: Company, ICICIdirect.com Research
ICICIdirect.com | Equity Research Page 25
ICICI Securities Limited
RATING RATIONALE ICICIdirect.com endeavours to provide objective opinions and recommendations. ICICIdirect.com assigns ratings to its stocks according to their notional target price vs. current market price and then categorises them as Strong Buy, Buy, Add, Reduce and Sell. The performance horizon is two years unless specified and the notional target price is defined as the analysts' valuation for a stock. Strong Buy: 20% or more; Buy: Between 10% and 20%; Add: Up to 10%; Reduce: Up to -10% Sell: -10% or more;
Pankaj Pandey Head – Research [email protected]
ICICIdirect.com Research Desk, ICICI Securities Limited, 7th Floor, Akruti Centre Point, MIDC Main Road, Marol Naka, Andheri (East) Mumbai – 400 093
ANALYST CERTIFICATION We /I, Abhishek Shindadkar research analysts, authors and the names subscribed to this report, hereby certify that all of the views expressed in this research report accurately reflect our personal views about any and all of the subject issuer(s) or securities. We also certify that no part of our compensation was, is, or will be directly or indirectly related to the specific recommendation(s) or view(s) in this report. Analysts aren't registered as research analysts by FINRA and might not be an associated person of the ICICI Securities Inc.
Disclosures: ICICI Securities Limited (ICICI Securities) and its affiliates are a full-service, integrated investment banking, investment management and brokerage and financing group. We along with affiliates are leading underwriter of securities and participate in virtually all securities trading markets in India. We and our affiliates have investment banking and other business relationship with a significant percentage of companies covered by our Investment Research Department. Our research professionals provide important input into our investment banking and other business selection processes. ICICI Securities generally prohibits its analysts, persons reporting to analysts and their dependent family members from maintaining a financial interest in the securities or derivatives of any companies that the analysts cover.
The information and opinions in this report have been prepared by ICICI Securities and are subject to change without any notice. The report and information contained herein is strictly confidential and meant solely for the selected recipient and may not be altered in any way, transmitted to, copied or distributed, in part or in whole, to any other person or to the media or reproduced in any form, without prior written consent of ICICI Securities. While we would endeavour to update the information herein on reasonable basis, ICICI Securities, its subsidiaries and associated companies, their directors and employees (“ICICI Securities and affiliates”) are under no obligation to update or keep the information current. Also, there may be regulatory, compliance or other reasons that may prevent ICICI Securities from doing so. Non-rated securities indicate that rating on a particular security has been suspended temporarily and such suspension is in compliance with applicable regulations and/or ICICI Securities policies, in circumstances where ICICI Securities is acting in an advisory capacity to this company, or in certain other circumstances.
This report is based on information obtained from public sources and sources believed to be reliable, but no independent verification has been made nor is its accuracy or completeness guaranteed. This report and information herein is solely for informational purpose and may not be used or considered as an offer document or solicitation of offer to buy or sell or subscribe for securities or other financial instruments. Though disseminated to all the customers simultaneously, not all customers may receive this report at the same time. ICICI Securities will not treat recipients as customers by virtue of their receiving this report. Nothing in this report constitutes investment, legal, accounting and tax advice or a representation that any investment or strategy is suitable or appropriate to your specific circumstances. The securities discussed and opinions expressed in this report may not be suitable for all investors, who must make their own investment decisions, based on their own investment objectives, financial positions and needs of specific recipient. This may not be taken in substitution for the exercise of independent judgment by any recipient. The recipient should independently evaluate the investment risks. The value and return of investment may vary because of changes in interest rates, foreign exchange rates or any other reason. ICICI Securities and affiliates accept no liabilities for any loss or damage of any kind arising out of the use of this report. Past performance is not necessarily a guide to future performance. Investors are advised to see Risk Disclosure Document to understand the risks associated before investing in the securities markets. Actual results may differ materially from those set forth in projections. Forward-looking statements are not predictions and may be subject to change without notice.
ICICI Securities and its affiliates might have managed or co-managed a public offering for the subject company in the preceding twelve months. ICICI Securities and affiliates might have received compensation from the companies mentioned in the report during the period preceding twelve months from the date of this report for services in respect of public offerings, corporate finance, investment banking or other advisory services in a merger or specific transaction. ICICI Securities and affiliates expect to receive compensation from the companies mentioned in the report within a period of three months following the date of publication of the research report for services in respect of public offerings, corporate finance, investment banking or other advisory services in a merger or specific transaction. It is confirmed that Abhishek Shindadkar research analysts and the authors of this report have not received any compensation from the companies mentioned in the report in the preceding twelve months. Our research professionals are paid in part based on the profitability of ICICI Securities, which include earnings from Investment Banking and other business.
ICICI Securities or its subsidiaries collectively do not own 1% or more of the equity securities of the Company mentioned in the report as of the last day of the month preceding the publication of the research report.
It is confirmed that Abhishek Shindadkar research analysts and the authors of this report or any of their family members does not serve as an officer, director or advisory board member of the companies mentioned in the report.
ICICI Securities may have issued other reports that are inconsistent with and reach different conclusion from the information presented in this report. ICICI Securities and affiliates may act upon or make use of information contained in the report prior to the publication thereof.
This report is not directed or intended for distribution to, or use by, any person or entity who is a citizen or resident of or located in any locality, state, country or other jurisdiction, where such distribution, publication, availability or use would be contrary to law, regulation or which would subject ICICI Securities and affiliates to any registration or licensing requirement within such jurisdiction. The securities described herein may or may not be eligible for sale in all jurisdictions or to certain category of investors. Persons in whose possession this document may come are required to inform themselves of and to observe such restriction.