market values and transfers of milk quotas
TRANSCRIPT

BULLETIN 366
MARKET VALUES AND
TRANSFERS OF
MILKIN ALABAMA
QUOTAS
RN U/
16, C) A[
, li.- NY/ . ,- : /.;
u N
Agricultural Experiment StationAUBURN UNIVERSITYE. V. Smith, Director Auburn, Alabama
MARCH 1966
CONTENTSPage
STUDY OBJECTIVES AND PROCEDURE 5
QUOTA PROVISIONS IN ALABAMA 5
CHARACTERISTICS OF BUYERS ANDNONBUYERS OF QUOTA 6ADJUSTMENTS IN SIZE 6VOLUME OF SALES IN 1963 OF DAIRYMEN WHO BEGAN
PRODUCTION AFTER 1959 7OTHER CHARACTERISTICS 8
QUOTA TRANSACTIONS IN ALABAMA 9NUMBER OF TRANSACTIONS 9SEASONALITY OF QUOTA SALES 10PRICES PAID FOR QUOTA ..... .10
Plant Usage Method 12Alternative Quota Plan ....- 16
CASE STUDIES OF FOUR PURCHASES OF QUOTA 19RELATED FACTORS ASSOCIATED WITH PURCHASE OF QUOTA 21
Purchase of Cows 21
Reasons for Purchase 21
Sources of Assistance in Calculating Price to
Pay for Quota 22
ESTIMATION OF QUOTA VALUE 23METHODS USED BY ALABAMA DAIRYMEN TO CALCULATE
QUOTA VALUE 23AN ALTERNATIVE METHOD OF CALCULATING QUOTA VALUE 24BUILDING VERSUS BUYING QUOTA 24
Plant Usage Method 25Alternative Quota Plan 26
STEPS IN ESTIMATING QUOTA VALUE 27
SUMMARY AND CONCLUSIONS 29FINDINGS OF THE STUDY_ 29CONCLUSIONS 81
LITERATURE CITED 33
APPENDIX 85QUOTA PROVISIONS IN ALABAMA 35
Types of Quota Plans 35Allocation of Producer Receipts 39Transfer Provisions 40Effect of Purchase of Quota on Allocation of
Producer Receipts 41
FIRST PRINTING 3M, MARCH 1966
Market Values and Transfers ofMilk Quotas In Alabama*
HAROLD M. HARRIS, JR., Instructor of Agricultural Economics
LOWELL E. WILSON, Professor of Agricultural Economics
SEASONAL MILK PRICING PLANS have been used for many yearsas incentives for producers to reduce seasonal fluctuations of milkdeliveries. Since the 1980's, the Alabama Milk Control Boardhas utilized a series of base-excess plans as encouragement fordairy farmers to supply quantities of milk that more nearly matchthe demand for fluid milk.
The theory behind any base-excess plan is that each producerestablishes a "base" by his milk deliveries made during the fallor winter months, or both, when markets tend to be in shortsupply. Farmers who establish large bases during this period ofshortage gain a greater claim to the market in succeeding monthsthan farmers who sell less milk in the base-forming period.
In Alabama, bases are transferable. They have a monetaryvalue because they serve, to a degree, as a license to sell milk inthe fluid market, and because base milk is priced much higherthan surplus milk, which is all deliveries in excess of the pro-ducer's base.
Since 1960, approximately 80 per cent of the Grade A milk pro-ducers in Alabama have purchased base or quota,1 mostly fromdairymen who were ceasing Grade A production. This fits thechanging pattern of dairying during that time, when numbers of
*The study reported, supported with funds provided by the Agricultural and
Marketing Act of 1946 and by State research funds, was carried out as HatchResearch Project 609.
1 Technically, "base" plans are related to production, while "quota" plans arebased on sales. In this report, quota and base are used synonymously. This usageis implied in the rules of fair trade practices of the Alabama Milk Control Board,and is accepted terminology of personnel connected with the dairy industry in theState. Actually there are in use in Alabama one base plan and two base-quotaplans.
4 ALABAMA AGRICULTURAL EXPERIMENT STATION
Number of Grade Ar- Milk Producers
O Number of QuotaTransactions
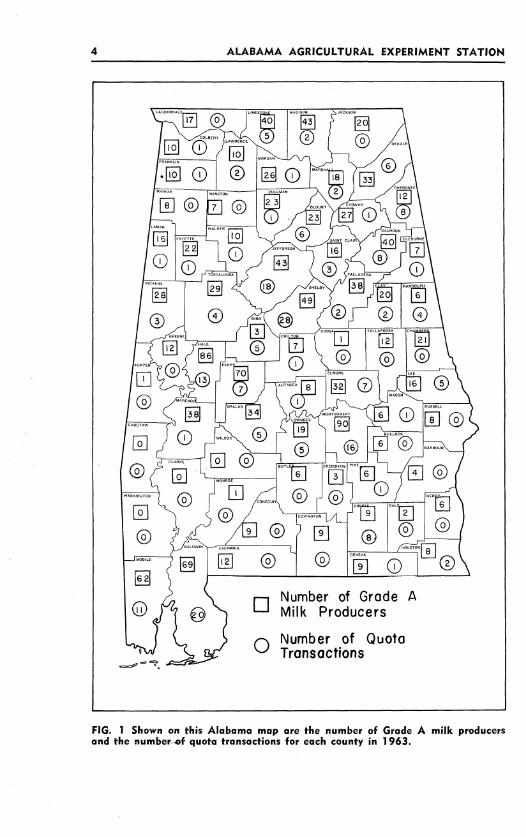
FIG. 1 Shown on this Alabama map are the number of Grade A milk producersand the number of quota transactions for each county in 1963.

MARKET VALUES and TRANSFERS of MILK QUOTAS 5
dairymen were decreasing and remaining producers were in-creasing volume of sales. (Number of Grade A producers droppedfrom 1,656 in 1959 to 1,201 in 1964. Most small producers in1959 either discontinued production or increased sales.) Almostall producers who left Grade A production sold their quotas,either to other producers who were attempting to increase sizeor gain price advantage, or to persons entering Grade A produc-tion. Location of Alabama dairymen in 1963 and numbers ofquota transactions in each county are shown in Figure 1.
There was a wide range in prices that producers paid forquota, according to information from the Alabama Milk ControlBoard and data from a 1964 survey. This variation was observedeven in the case of transactions among producers shipping to thesame plant.
STUDY OBJECTIVES AND PROCEDURE
Specific objectives of this study were: (1) to determine theconditions of transfer, number and volume of transactions, pricespaid, and factors affecting the value of quotas transferred in Ala-bama; and (2) to develop procedures for estimating marketvalue of quota in the State under alternative market situations.
A list of producers who had bought and sold quota since 1960was assembled from records made available by the Alabama MilkControl Board. Other data gathered included dates of purchase,volume purchased, and class utilization of producer deliveries.The study period selected was January 1961 through August 1964.Of the producers in business in 1964, a total of 887 purchasedbase during the 44-month study period. A systematic sample wasdrawn, consisting of six quota purchasers shipping to each ofeight plants. The criteria for selecting the sample plants werenumber of quota transfers, market area, and type of quota planused. A questionnaire was developed and personal interviewswere obtained from 39 dairymen to determine prices paid forquota and factors related to purchase of quota. Other character-istics of producers were obtained from a 1964 survey of 800 dairyfarmers.
QUOTA PROVISIONS IN ALABAMA
Two main quota plans are used in Alabama. (See Appendixfor detailed information on quota provisions.) Under the "plant
6 ALABAMA AGRICULTURAL EXPERIMENT STATION
usage method" all milk delivered by a producer to a distributorduring the base-building period, September through February,is used in calculating his quota. Each producer's quota is theratio that his deliveries of milk during the base-building monthsare to total deliveries during that period. The quota remainseffective for 1 year beginning the first day of March. Rapid ad-justments are possible under this plan.
Under the "alternative quota plan," quotas are related moreclosely to plant sales. Although base-building and base-usingperiods are the same under this plan, the quantity of a producer'smilk used in calculating his new quota cannot exceed 115 percent of his share of plant Class I and II sales. 2 Because of therelative ease of maintaining quota under this plan, it can beproperly referred to as a "semi-frozen" base plan.
In 1960 the Milk Control Board eased restrictions on transfer ofquotas. In general, a quota is deemed to be the personal propertyof a producer and may be sold or transferred in almost any man-ner incident to the sale of the producer's herd. The base may bedivided and sold to several persons. Purchase of a seller's cattleis not a requirement for buying quota.
CHARACTERISTICS OF BUYERS AND NONBUYERSOF QUOTA
ADJUSTMENTS IN SIZE
Additional investment required for the purchase of base maybe a deterring factor to potential new producers and to producersdesiring to expand deliveries (4). Producer sales records for the1959 and 1964 base-building periods were obtained from theAlabama Milk Control Board for analysis of adjustments. Recordswere obtained on 1,656 dairymen in 1959 and 1,201 dairymenin 1964.3 Between the two periods, 667 producers ceased pro-duction and there were 212 new producers; thus, 989 dairymenwere in business during both base-building periods.
2 This figure was reduced to 110 per cent for the 1965-1966 base-buildingperiod.
SThese figures include all Alabama Grade A dairymen in business in 1959 and1964 except those shipping to one producer cooperative not under State regula-tion and one plant that was nonregulated in 1958-1959. Also excluded are someAlabama producers selling milk to out-of-state distributors. Included, however, area number of out-of-state producers shipping milk to regulated Alabama plants.
MARKET VALUES and TRANSFERS of MILK QUOTAS 7
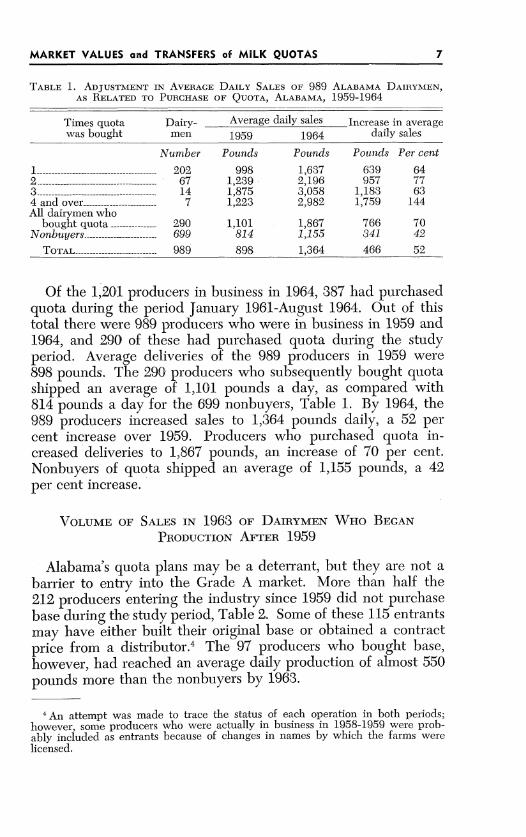
TABLE 1. ADJUSTMENT IN AVERAGE DAILY SALES OF 989 ALABAMA DAIRYMEN,
AS RELATED TO PURCHASE OF QUOTA, ALABAMA, 1959-1964
Times quota Dairy- Average daily sales Increase in averagewas bought men 1959 1964 daily sales
Number Pounds Pounds Pounds Per cent
1 202 998 1,637 639 642 .------------------------------------- 67 1,239 2,196 957 773 14 1,875 3,058 1,183 634 and over- 7 1,223 2,982 1,759 144All dairymen who
bought quota .----------- 290 1,101 1,867 766 70Nonbuyers 699 814 1,155 341 42
TOTAL---------------------------- 989 898 1,364 466 52
Of the 1,201 producers in business in 1964, 387 had purchasedquota during the period January 1961-August 1964. Out of thistotal there were 989 producers who were in business in 1959 and1964, and 290 of these had purchased quota during the studyperiod. Average deliveries of the 989 producers in 1959 were898 pounds. The 290 producers who subsequently bought quotashipped an average of 1,101 pounds a day, as compared with814 pounds a day for the 699 nonbuyers, Table 1. By 1964, the989 producers increased sales to 1,364 pounds daily, a 52 percent increase over 1959. Producers who purchased quota in-creased deliveries to 1,867 pounds, an increase of 70 per cent.Nonbuyers of quota shipped an average of 1,155 pounds, a 42per cent increase.
VOLUME OF SALES IN 1963 OF DAIRYMEN WHO BEGAN
PRODUCTION AFTER 1959
Alabama's quota plans may be a deterrant, but they are not abarrier to entry into the Grade A market. More than half the212 producers entering the industry since 1959 did not purchasebase during the study period, Table 2. Some of these 115 entrantsmay have either built their original base or obtained a contractprice from a distributor.4 The 97 producers who bought base,however, had reached an average daily production of almost 550pounds more than the nonbuyers by 1963.
SAn attempt was made to trace the status of each operation in both periods;however, some producers who were actually in business in 1958-1959 were prob-ably included as entrants because of changes in names by which the farms werelicensed.

8 ALABAMA AGRICULTURAL EXPERIMENT STATION
TABLE 2. AVERAGE DAILY SALES OF 212 ALABAMA DAIRYMEN WHO ENTEREDPRODUCTION AFTER 1958, AS RELATED TO PURCHASE OF QUOTA, 1963-1964
Times quota was bought
4 and over ----------------- ----All dairymen who bought quota ---N onbuyers------------------ ----
T O TA L -- --- ---- ------ ---- ----
Dairymen Average daily salesin 1963-1964
Number Pounds
64 1,34921 .2,001
7 1,8595 2,038
97 1,563115 1,017
212 1,266
OTHER CHARACTERISTICS
Information presented about other characteristics of buyersand nonbuyers was obtained through a survey schedule mailedto 1,348 Grade A milk producers in Alabama. An analysis of 800usable returns was made using the responses to the question,"Did you purchase base during past year?" Responses of the 778producers who answered this question were as follows:
Number Per cent
Bought base 137 18Did not buy base 641 82
TOTAL--------------------- -- 778 100
Of the 137 producers who bought base in 1963, 99 purchasedplant usage quota and 38 bought base built on the alternativequota plan.
Farmers who purchased base in 1963 tended to have largerherds than those who did not, Table 3. About 84 per cent of the137 dairymen who bought base had herds of 50, or more cows,as compared with 62 per cent of the nonbuyers. These figures
include dry and milking cows.
TABLE 3. SELECTED CHARACTERISTICS OF 778 DAIRYMEN, AS RELATED TOPURCHASE OF QUOTA, 1963
Characteristic
Under 45 years of age- -- -Farmed 200 acres or moreMilked more than 50 cowsIncreased herd size in 1963.___________Had predominately Holstein herds ._____More than 70 per cent of sales as Class I.Used production testing _______________Used artificial insemination____________
Proportion reporting
Buyers Nonbuyersof quota of quota
Per cent Per cent
48 3746 3784 6262 3766 5774 6453 4271 66

MARKET VALUES and TRANSFERS of MILK QUOTAS 9
Most responding dairymen who bought base increased herdsize during 1963. Almost two-thirds of the buyers reportedmore cattle than in 1962, but only a third of the nonbuyers hadexpanded herd size. Farmers who bought quota were youngerthan the group who did not purchase quota. Slightly less thanhalf who bought base were under 45 years old, as compared with37 per cent of the nonpurchasing group. Predominately Holsteinherds were reported by 66 per cent of the quota buyers and 57per cent of the nonbuyers.
Seventy-four per cent of the farmers who bought quota soldmore than 70 per cent of their October 1963 deliveries at the ClassI price. Of the producers who did not purchase quota in 1963,only 64 per cent were able to obtain this level of Class I utiliza-tion. Production testing and artificial insemination were used bya higher proportion of the 137 producers who purchased base thanof the 641 nonpurchasers.
QUOTA TRANSACTIONS IN ALABAMA
NUMBER OF TRANSACTIONS
During the period beginning January 1, 1961, and endingAugust 31, 1964, 466 dairymen sold Grade A milk quotas. Therewere 387 buyers of quota in this period who were still in businessin August 1964, 5 and they made 568 quota purchases. Manydairymen bought quota two or more times, as shown by thefollowing table:
Number of purchases Number of producers
1 - - - - - - - - - - - - - - - - - - - - - - - - - - - - - - - - - - - - - - - -2 6 62 -- ---------------------------. 8 83 - - - - - - - - - - - - - - - - - - - - - - - - - - - - - - - - - - - - - - - -2 14 an d ov er .- - - --- - -- - - - - - --- - -- -- - - - --- - - - - 12Total purchasers 387N onpurchasers ------------------------ ----- 814
TOTAL PRODUCERS ................ -------- 1201
There were 516 quotas sold during the 4-year period begin-ning January 1, 1961. Of these, 95 were determined by the al-ternative quota plan and 420 by the plant usage plan. There was
SThere was no accurate count made of producers who bought quota and sub-sequently ceased Grade A production. Inspection of the records available identi-fied few former producers in this category, probably 20 to 30. These producersare included in the 466 sales of base, but not in the 887 buyers of quota.
one sale of base occurring under the "winter production is sum-mer base" plan. The 516 sales, by years, are as follows:
Year Number of sales
1961 911 9 6 2 - - - - - - - - - - - - - - - - - - - - - - - - - - - - - - - 1 4 11963 1481964 136
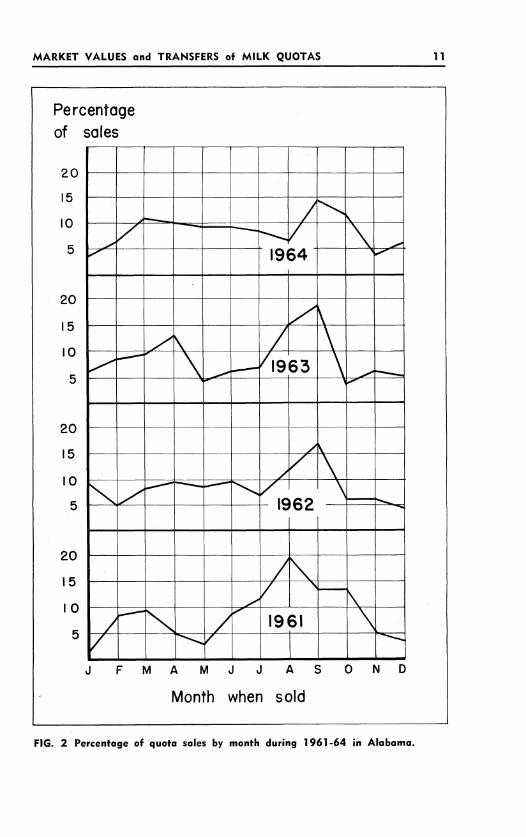
SEASONALITY OF QUOTA SALES
A fairly high degree of seasonality was found in the sale ofbase. In 3 of the 4 years, more sales occurred in September thanin any other month. August was high the other year, 1961, Figure2. It is doubtful, however, that sale of quota, per se, had muchinfluence on the seasonality of producers quitting Grade A pro-duction. Occasionally, particularly under the alternative quotaplan, the sale of quota provides a large percentage of a seller'sreceipts from dispersal of his herd and other assets, but generallythis has not been the case.
PRICES PAID FOR QUOTA
Personal interviews were obtained from 21 purchasers of quotawho shipped to four plants that calculated quotas by the alterna-tive quota plan, and 18 purchasers who shipped to four plantsthat used the plant usage plan. The 18 plant usage buyersbought quota 26 times and the 21 alternative quota buyers made27 quota purchases. One quota purchaser at a plant under thealternative plan bought plant usage quota since the date ofpurchase was more than 1 year prior to adoption of the new planat his plant. Five buyers purchased plant usage quota, yet re-ceived the benefit of the alternative plan. Because the new planwas approved by producers shipping to their plants shortly afterthe quota transactions, the quota was considered to be under thealternative plan.
Prices paid for quota can be expressed in a number of ways.For quota under plant usage, a common expression is price per100 pounds of daily base. There are two drawbacks in usingprice per 100 pounds of daily base in this report. First, there canbe no direct comparison between prices paid for quota underthe two plans. Base can be maintained with reasonable certaintyfor more than one base period under alternative quota, andpounds of Class I per day will change if plant sales change.
10 ALABAMA AGRICULTURAL EXPERIMENT STATION
MARKET VALUES and TRANSFERS of MILK QUOTAS
Percentageof sales
20
15
I0
5
20
15
I0
5
20
15
10
5
20
15
I0
5
when sold
FIG. 2 Percentage of quota sales by month during 1961-64 in Alabama.
A M
Month
I ITVLUSadTANFR C~ML U
11
Second, only 11 of the 39 producers interviewed recalled thenumber of pounds a day they purchased. All but 3 of the 11overestimated amount purchased, some by a considerable margin.
Price paid for quota in plants under the alternative quota planwas often quoted as "price per point," which is dollars per 1per cent of the plant's quota. This form of price quotation alsopresented a problem in comparing with prices paid for plantusage quota. A flat price per point under the plant usage planis illogical, since 1 per cent of quota is worth more at the begin-ning of the base-using period than toward the end.
A relative price that is comparable between the two plans isprice per 100 pounds of Class I eligibility. Quota expressed as apercentage is meaningless until it is converted to pounds ofhigher class milk that the quota enables its owner to sell. Forplant usage transactions, price per 100 pounds of Class I eligibilitywas determined by dividing amount paid for the quota by theestimated Class I sales during the months remaining in the baseusing period. For purchases of alternative quota, a price was alsocalculated per 100 pounds of Class I eligibility acquired within a1-year span from date of purchase. This price was computed be-cause of the likelihood of quota being maintained for longerperiods.
Plant Usage Method
Total dollar amounts paid for plant usage quota ranged from$160 to $8,900. The 19 purchasers who made 25 transactionspaid $29,417 for base. Average expenditure per buyer was $1,548and each transaction averaged $1,177.
Price Per Hundredweight of Class I Eligibility. Prices paid perhundredweight of Class I eligibility ranged from $0.89 to $1.96,with most being in the $0.75 to $1.50 range, Table 4. The aver-ages were $0.78, $0.95, $1.23, and $1.00 for plants W, X, Y, andZ, respectively.
Plant usage transactions were further subdivided into largeand small, with 100,000 pounds of Class I selected as the dividingpoint between the two groups. The nine large transactions ac-counted for 72 per cent of the total volume of quota purchasedby the sample group. Average price per hundredweight of ClassI eligibility was $0.85 for the 9 large transactions and $1.21 forthe 16 small transactions.
12 ALABAMA AGRICULTURAL EXPERIMENT STATION

MARKET VALUES and TRANSFERS of MK QUOTS1
The key figure to be used in comparison with the prices shownin Table 4 is $3.44 per hundredweight. This is the gain buyersreceived from moving 100 pounds of milk from Class III to ClassI, assuming the Class III price was $3.12 and the Class I price was
TABLE 4. PRICES PAID PER HUNDREDWEIGHT OF CLASS I ELIGIBILITY, 19 ALABAMADAIRYMEN WHO PURCHASED QUOTA AT PLANTS UNDER THE PLANT
USAGE PLAN, JANUARY 1961-AUGUST 1964'
Producer
Plant W1 P -- _---------------------
2P---3 P - - - - - - - - - - - - - - - -4P----------------
Plant total- - - - -
Plant X5P .- - - - - - - - - - - - -6 P - -- - - - - - - - - - - -7 P - - - - - - - - - - - -
8 P - - - - - - - - - - - - - - -
9 P -- - - - - - - - - - - - - -
Plant total- - - -
Plant Ylo p -- --------------l i p ----------------12 P -- - - - - - - - - - -Plant total------ ----.
Plant Z1 3 P -- - - - - - - - - - - - - - -1 4 P - - - - - - - - - - - - - - - -
16P1 7 P -- - - - - - - - - - - - - - -1 8 P .- - - - -- - - - - - - - - -Plant total .---------Plant A
TOTAL--------- --
9 large transactions3 _16 small transactions-_
1 Producers were dZ. Producer 5A boug
2 Purchase occurrectransferred to applytperiod.'Over 100,000 por.
Class Ieligibility
Cwt.
902756
2,4284,7948,880
2,5802935604403035636985882932942587
7,199
1,456286
1,3913,133
2,3647675486432
4,5771,344
10,243
Total costof quota
Dol.
900570
2,0003,5006,970
1,000500730555400700940715385160777
6,862
2,220290
1,3503,860
1,2001,500
52570
3,9002,400
10,225
Cost per cwt.
Dol.
1.00.75.82.73.78
.391.711.301.261.321.241.351.221.32
.541.32
.95
1.521.01
.971.23
.511.96
.961.09
.851.781.00
1,563 1,500 .9631,018 29,417 .95
22,497 19,070 .858,521 10,347 1.21
.signated 1P-21P and plants were designated W, X, Y, andght plant usage quota (see text).d during base-building period. Production of seller wasto building the buyer's quota for the subsequent base-using
nds of Class I equivalent purchased.
MARKET VALUES and TRANSFERS of MILK QUOTAS 13
ALABAMA AGRICULTURAL EXPERIMENT STATION
$6.56 at 4 per cent butterfat. The $3.44 difference between ClassI and Class III prices remains constant regardless of butterfatcontent, however. Any purchaser listed in Table 4 who movedthe entire amount of milk from surplus to Class I made an ex-cellent buy regardless of whether he was already producing sur-plus or was increasing production that would have gone intosurplus had he not purchased base.
In some special cases where none of a producer's milk isused in Class III products, a large percentage of his deliveriesmay be purchased as Government Contract Milk. Under this con-dition, an additional hundred pounds of Class I eligibility wouldresult in a gain of $1.81 if the milk were moved up from theGovernment Class. 6 For the State as a whole, use of milk in thisclass is relatively small, accounting for about 5 per cent of totalproducer receipts in 1963. Other gains may occur as the result ofmoving small amounts of milk from Class II into Class I and ClassIII into Class II. Gains of this nature are of lesser importance,hence the major emphasis is on the difference between Class I andsurplus prices.
Minimum Number of Months to Recover Investment. Dairy-men who buy quotas under the plant usage method receive bene-fit from it only to the end of the current base-using period, thelast day of February. At that time the producer changes to thenew quota he has just earned. A producer who purchases quotaon March 1 has a full year to regain his investment, whereas onewho buys on September 1 has only 6 months. Purchases madeduring the base-building period usually have an income-produc-ing value beyond the last day of February. For example, one whobuys base on November 1 gets the benefit of the purchased quotafor 4 months. In addition, he is credited with his prorata shareof milk sales of the seller during September and October in de-termining his new quota.
The minimum number of months required to regain purchaseprice was computed, based on pounds of Class I quota equivalentper month and the spread between Class I and surplus price, Table5. It is not implied that the purchaser did repay his investment inthis period. In most instances, however, a producer could have re-
6 Prior to November 1, 1963, the Government Contract price was $4.15. Thus,those who purchased base prior to that date would have had a potential gainof $2.41 per hundredweight for milk moved from Government Contract Milk toClass I uses.
14
MARKET VALUES and TRANSFERS of MILK QUOTAS 1
TABLE 5. MINIMUM NUMBER OF MONTHS TO RECOVER INVESTMENT IN QUOTA,
19 ALABAMA DAIRYMEN WHO PURCHASED QUOTA AT PLANTS UNDER THEPLANT USAGE PLAN, JANUARY 1961-AUGUST 1964
Producer
Plant W1 P --- -- --- -- --- -- --- -- --- --
2 P -- - - - - - - - - - - - -3P______4 P - - - - - - - - - - - - - -
Plant X5 P - - - - - - - - - - - - - -6 P -- - - - - - - - - - - - -7 P - - - - - - - - - - - - - -
8 P -- - - - - - - - - - - - - - - -
9 P - - - - - - - - - - - - - -
Plant Ylo p -- ------------
1 2 P -- - - - - - - - - - - - - - -- -Plant Z1 3 P - - - - - - - - - - - - - - - - -1 4 P -- - - - - - - - - - - - - - - - -
1 6 P -- - - - - - - - - - - - - - - - -1 7 P -- - - - - - - - - - - - - - - - -1 8 P -- - - - - - - - - - - - - - - - -Plant A
5 A - - -- - - - - - - - - - - - - - -AVERAGE-----------
13 purchases, under 9months use, average--12 purchases, 9 or moremonths use, average--'Only seven purchaser
Minimum time toregain investment
Months
2.51.52.52.7
1.33.02.72.32.34.03.72.02.31.02.3
4.72.73.0
1.53.32.02.51.56.3
3.2
2.6
Producer estimateof months to
regain investment
Months
2.0
3.5
1.5
1.5
2.5
7.0
2.5
3.5
2.4
3.0
.rs made estimates.
Time remainingto use quota
Months
7.38.0
10.012.0
11.06.07.36.06.0
11.09.06.06.0
16.76.0
10.28.39.5
9.36.07.0
12.36.0
12.0
10.58.8
6.6
covered his investment in the time shown, provided he shipped thefull Class I equivalent of the purchased quota. A producer mightpay off purchase price in less than the calculated minimum if hereceived additional Class I, II, and Government Contract Milk byredistribution. (See Appendix.)
It is apparent from Table 5 that almost all purchasers couldhave repaid their quota investments in a short time. The meanminimum time required to regain investment was 2.6 months. If
15
each purchaser had taken twice as long as the minimum, only twoproducers would have lost money on the purchased base.
Producers were asked to estimate either monetary gain frompurchase of quota or number of months for the quota to pay out.Seven plant usage buyers volunteered such estimates. Estimatesof profit were converted to approximate number of months topay out and are included in Table 5. Although there were notenough observations for detailed study, producers who venturedan estimate came reasonably close to the calculated minimum.
Alternative Quota Plan
Amounts paid for quota at plants under the alternative quotaplan were higher than for plant usage quota. The range paid bythe 20 purchasers studied was from $375 to $7,200. Average ex-penditure per buyer was $2,354, and average amount per transac-tion was $1,811.
Price Per Hundredweight of Class I Eligibility. Table 6 givesdata regarding price per 100' pounds of Class I eligibility for the20 alternative quota buyers. Price per hundredweight of Class Ieligibility in the base-using period was included for comparisonswith prices paid for plant usage quota. Average price paid forClass I eligibility in the base-using period in Plant A, $0.80 perhundredweight, was lower than the average for all plant usagetransactions. All other alternative quota transactions studied,however, were at much higher prices. Still, there were only ninetransactions in which the original investment could not possiblyhave been regained during the remainder of the base-usingperiod, excluding interest.
As stated previously, price per hundredweight of Class I eligi-bility acquired was figured on the basis of a full year from dateof purchase. It was calculated by dividing amount paid by thenumber of additional hundredweight of Class I milk that thepurchase enabled the buyer to sell in the 1-year period from dateof purchase. No discount was applied to this price.
The assumption behind figuring price per 100 pounds of ClassI eligibility for 1 year from date of purchase was that the pur-chaser maintained his old quota, plus the purchased quota, inthe following base-building period. Because of the relative easeof maintaining quota under this plan (a maximum overshipmentof 15 per cent more than the producer's share of Class I and IIsales was required), it is a likely assumption in most cases.
16 ALABAMA AGRICULTURAL EXPERIMENT STATION
MARKET VALUES and TRANSFERS of MILK QUOTAS 1
TABLE 6. PRICE PAID PER HUNDREDWEIGHT OF CLASS I ELIGIBILITY, BASE-USINGPERIOD AND ONE YEAR FROM DATE OF PURCHASE, 20 ALABAMA DAIRYMEN
WHO PURCHASED QUOTA AT PLANTS UNDER THE ALTERNATIVEQUOTA PLAN, JANUARY 1961-AUGUST 19641
Class I eligibility Cost of quota
Producer Remainder Remainder
base-using On er cost base-using Oeyaperiod periodCwt. Cwt. Dol. Dol./cwt. Dol./cwt.
Plant A
2 A -- - - - - - - - - - - -
3 A -- - - - - - - - - - - -4A -- - - - - - - - - - - -5A -- - - - - - - - - - - - -
6A--- - - - - -
Plant total- --Plant B7 A - - - - - - - - - - - - - -8 A - - - - - - - - - - - - - -9 A -- - - - - - - - - - - - -
1 OA______-
Plant total -----Plant C
12 A - - - - - - - - - - - - - - -1 3 A - - - - - - - - - - - - - - -1 4 A - - - - - - - - - - - - - - -Plant total ----------Plant D1 6 A - - - - - - - - - - - - - - -1 7 A -- - - - - - - - - - - - - -1 8 A - - - - - - - - - - - - - - -19 A - - - - - - - - - - - -- - -2 0 A -- -------------2 1 A - - - - - - - - - - - - - - -
Plant total ---------
TOTAL--------- --
10 large transactions3
-
16 small transactions-
901 1,022 825 .92981 1,302 700 .71
1,330 1,506 1,000 .75315 640 710 2.25755 812 475 .63257 436 375 1.46257 436 375 1.46
2,267 2,330 1,425 .63257 436 375 1.46
2,267 2,330 1,450 .649,587 11,250 7,710 .80
376 445 1,500 3.991,825 1,939 4,000 2.19
747 844 1,000 1.34808 956 3,000 3.71455 1,257 2,500 5.49376 445 1,500 3.99
4,587 5,886 13,500 2.94
489 593 750 1.54489 593 750 1.54489 593 750 1.54
1,467 1,779 2,250 1.54
466 899 2,000 4.30585 1,130 2,500 4.27975 975 2,650 2.72183 415 1,400 7.65569 1.098 2.870 5.05927 1,424 5,000 5.39588 987 7,200 12.24
4,293 6,928 23,620 5.50*19,934 25,843 47,080 2.36
___ 15,337 22,270 ______ ____ 10,506 24,810 __
.8 12.542.66
1.11.58.862.862.61.862.62.69
3.372.06'1.18'3.141.993.372.29
1.261.261.261.26
2.222.212.723.372.613.517.293.411.821.452.36
1Producers were designated 1A-21A. -Plants were designated A, B, C, and D.' Purchased plant usage quota, but quota plan was cbanged to alternative plan
while plant usage quota was still good.'Over 100,000 pounds of Class I equivalent purchased within 1 year.
17
18 ALABAMA AGRICULTURAL EXPERIMENT STATION
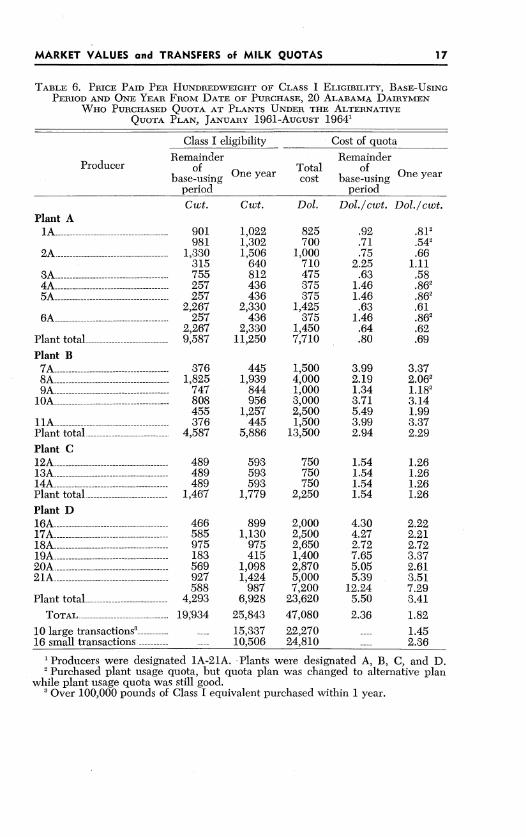
Prices per 100 pounds of Class I eligibility, calculated on a1-year basis, varied widely, but there was more variation amongplants than among transactions within the plants. Average pricepaid per additional hundredweight of Class I eligibility acquiredduring 1 year from purchase date ranged from $0.69 at Plant Ato $3.41 at Plant D, Table 6. The average was $1.45 for the largetransactions and $2.36 for the small transactions.
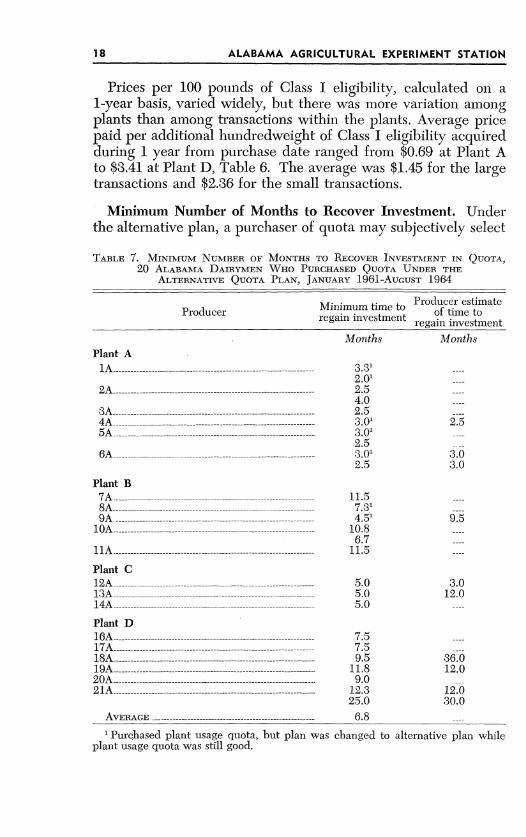
Minimum Number of Months to Recover Investment. Underthe alternative plan, a purchaser of quota may subjectively select
TABLE 7. MINIMUM NUMBER OF MONTHS TO RECOVER INVESTMENT IN QUOTA,20 ALABAMA DAIRYMEN WHO PURCHASED QUOTA UNDER THE
ALTERNATIVE QUOTA PLAN, JANUARY 1961-AUGUST 1964
oProducer estimateProducer Meginiumtmet of time to
regaregain investment
Months MonthsPlant A
1A33------1----2.01 --
2 A -- - - -- - - - -- - - - -- - - - -- - - -- - - - -- - - - - 2 .54.0 --
3 A -- - - -- - - - -- - - - -- - - - -- - - -- - - - -- - - - - 2 .54 A ---------- --------- ---------- ------ - 35A3.1-----------------------
2.5 --6 A ------------------ ----------------- 3 .0 1 3 .0
2.5 3.0
Plant B7A------------------------- -----------------------------------------. 58A-- 7.31
9 A - - - - - - - - - - - - - - - - - - - - - - - - - - - - - - - - - -4 .5 1 9 .51 O A -- - - - - - - - - - - - - - - - - - - - - - - - - - - - - - - - - - 1 0 .8
6.7 --h1A - - - - - - - - - - - - - - - - - - - - - - - - - - - - - - - - - - 1 1 .5- -
Plant C1 2 A -- - - - - - - - - - - - - - - - - - - - - - - - - - - - - - - - - 5 .0 3 .01 3 A -- - - - - - - - - - - - - - - - - - - - - - - - - - - - - - - - - - 5 .0 1 2 .01 4 A -- - - - - - - - - - - - - - - - - - - - - - - - - - - - - - - - --5 .0
Plant D1 6 A -- - - - - - - - - - - - - - - - - - - - - - - - - - - - - - - - - 7 .5 - -1 7 A - - - - - - - - - - - - - - - - - - - - - - - - - - - - - - - - - - 7 .518A -- - - - - -- - - - - - - - - - - - - - - - - - - - - - - - - - - - 9 .5 3 6 .019A -- - - - - - - - - - - - - - - - - - - - - - -- - - - - - - - - - - 1 1 .8 12 .02 0 A -- - - - - - - - - - - - - - - - - - - - - - - - - - - - - - - - - - 9 .02 1A -- - - - - - - - - - - - - - - - -- - - - - - - - - - - - - - - - -- 12 .3 12 .0
25.0 30.0
A VEBAGE .----- ---------------------- 6.8
changed to alternative plan while' Purchased plant usage quota, hut plan wasplant usage quota was still good.
18
MARKET VALUES and TRANSFERS of MILK QUOTAS
a period in which he desires to recover his investment. Purchasersof quota shipping to Plant A could have regained investmentmuch more rapidly than those selling to the other plants, Table 7.The longest minimum time needed to regain investment in aquota transaction at Plant A was 4 months, which was less thanthe minimum for any transaction at the other three plants. Aver-age minimum repayment time for all alternative quota transac-tions was 6.8 months, as compared with 2.6 months for all plantusage transactions. Most alternative quota buyers who estimatednumber of months to repay investment came close to the cal-culated minimum. Of the 10 transactions for which producerestimates were made, 5 were within 1 month of the calculatednumber.
CASE STUDIES OF FOUR PURCHASES OF QUOTA
For a more thorough study of the monetary outcome of pro-ducers who purchased quota, production and pay data wereobtained for four of the producers who were interviewed. Twoproducers under each quota plan were selected.
An analysis of this type can take into consideration additionalmilk used in higher classes resulting from redistribution, deliveryof purchased quota, and additional revenue from Class II andGovernment Contract Milk. The primary assumption used wasthat each of the producers would have delivered the sameamounts of milk, regardless of whether additional base had beenpurchased.
TABLE 8. EFFECT OF PURCHASE OF QUOTA ON PRODUCER RECEIPTS FROM DATE
OF PURCHASE THROUGH FEBRUARY 29, 1964, USING PRICES EXISTING
AT TIME OF PURCHASE, FOUR ALABAMA DAIRYMEN
Value of receiptsIncrease Price of Net
Producer Earned plus Earned inpurchased quota receipts quota gain
quota only
Dollars Dollars Dollars Dollars Dollars
11_............. 12,100 11,148 952 375 57721 21,110 20,439 671 1,40032 ............................. 11,673 11,128 545 500 4542............. 109,711 105,888 3,823 2,220 1,603
Alternative quota plan. Both of these producers maintained quota in the suc-
ceeding base-building period. Producer 2 would continue to write-off his invest-ment and would probably write-off purchase price within 6 or 7 more months.Producer 1 would continue to increase his profit on the transaction.
SPlant usage plan.
19

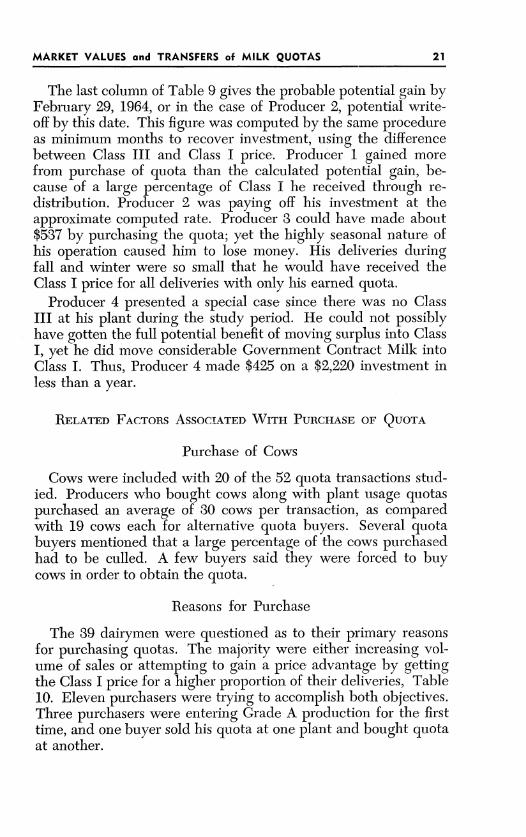
Allocations of receipts were calculated using the producer'searned quota only; these were compared with actual allocation ofreceipts as determined by earned quota plus purchased quota foreach month, beginning on date of purchase and ending February29, 1964. The computed values of the producers' receipts, as-suming 4 per cent butterfat, are given in Table 8. The net gainreceived by each producer as a result of purchasing quota ratherthan producing milk without additional quota is listed in the lastcolumn. Table 8 is based on actual producer prices existing attime of purchase, $4.00 for Class II and $4.15 for GovernmentContract Milk. Assuming these prices, all except Producer 2paid off their investments, excluding interest, and showed gainson the transactions. Producer 2 maintained his quota and wouldcontinue to write-off the investment at a similar rate during thenew base-using period. A high rate of return on investment inquota was noted. Even Producer 3's annual return on investmentwould amount to about 18 per cent.
Table 8 presents a distorted picture, however. On November1, 1963, the Board raised the producer prices of Class II andGovernment Contract Milk to $4.75 (8). How this price increaseaffected producer receipts is shown in Table 9. A price change isone of the factors a potential quota purchaser must consider inapplying a discount for uncertainty on the price he is willing topay.
TABLE 9. EFFECT OF PURCHASE OF QUOTA ON PRODUCER RECEIPTS FROM DATE
OF PURCHASE THROUGH FEBRUARY 29, 1964, USING ACTUAL PRICES,
FOUR ALABAMA DAIRYMEN
Value of receipts Increase Price Potential
Producer Earned plus Earned in of Net gain orpurchased quota receipts quota gain write-off
quota only
Dollars Dollars Dollars Dollars Dollars Dollars
11 12,203 11,235 968 375 593 501
21 21,353 20,664 689 1,400 723332 11,700 11,234 466 500 -34 537
42 114,455 111,810 2,645 2,220 425 2,890
Alternative quota plan. Both of these producers maintained quota in the suc-ceeding base-building period. Producer 2 would continue to write-off his invest-ment and would probably write-off purchase price within 6 or 7 more months.Producer 1 would continue to increase his profit on the transaction.
2 Plant usage plan.' Potential write-off.
20 ALABAMA AGRICULTURAL EXPERIMENT STATION
MARKET VALUES and TRANSFERS of MILK QUOTAS
The last column of Table 9 gives the probable potential gain byFebruary 29, 1964, or in the case of Producer 2, potential write-off by this date. This figure was computed by the same procedureas minimum months to recover investment, using the differencebetween Class III and Class I price. Producer 1 gained morefrom purchase of quota than the calculated potential gain, be-cause of a large percentage of Class I he received through re-distribution. Producer 2 was paying off his investment at theapproximate computed rate. Producer 3 could have made about$537 by purchasing the quota; yet the highly seasonal nature ofhis operation caused him to lose money. His deliveries duringfall and winter were so small that he would have received theClass I price for all deliveries with only his earned quota.
Producer 4 presented a special case since there was no ClassIII at his plant during the study period. He could not possiblyhave gotten the full potential benefit of moving surplus into ClassI, yet he did move considerable Government Contract Milk intoClass I. Thus, Producer 4 made $425 on a $2,220 investment inless than a year.
RELATED FACTORS ASSOCIATED WITH PURCHASE OF QUOTA
Purchase of Cows
Cows were included with 20 of the 52 quota transactions stud-ied. Producers who bought cows along with plant usage quotaspurchased an average of 30 cows per transaction, as comparedwith 19 cows each for alternative quota buyers. Several quotabuyers mentioned that a large percentage of the cows purchasedhad to be culled. A few buyers said they were forced to buycows in order to obtain the quota.
Reasons for Purchase
The 39 dairymen were questioned as to their primary reasonsfor purchasing quotas. The majority were either increasing vol-ume of sales or attempting to gain a price advantage by gettingthe Class I price for a higher proportion of their deliveries, Table10. Eleven purchasers were trying to accomplish both objectives.Three purchasers were entering Grade A production for the firsttime, and one buyer sold his quota at one plant and bought quotaat another.
21
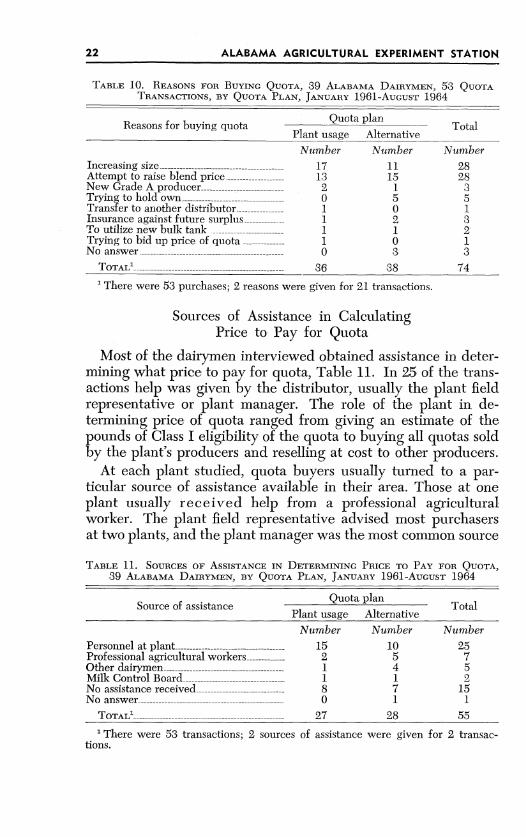
TABLE 10. REASONS FOR BUYING QUOTA, 39 ALABAMA DAIRYMEN, 53 QUOTATRANSACTIONS, BY QUOTA PLAN, JANUARY 1961-AUGUST 1964
Reasons for buying quota Quota planTotalPlant usage Alternative
Number Number Number
Increasing size ............................... . 17 11 28Attempt to raise blend price 13 15 28New Grade A producer----------------------- - 2 1 3Trying to hold own 0 5 5Transfer to another distributor............. 1 0 1Insurance against future surplus............. 1 2 3To utilize new bulk tank 1 1 2Trying to bid up price of quota 1 0 1No answer 0 3 3
TOTAL1
3------------. -6 38 74
1There were 53 purchases; 2 reasons were given for 21 transactions.
Sources of Assistance in CalculatingPrice to Pay for Quota
Most of the dairymen interviewed obtained assistance in deter-mining what price to pay for quota, Table 11. In 25 of the trans-actions help was given by the distributor, usually the plant fieldrepresentative or plant manager. The role of the plant in de-termining price of quota ranged from giving an estimate of thepounds of Class I eligibility of the quota to buying all quotas soldby the plant's producers and reselling at cost to other producers.
At each plant studied, quota buyers usually turned to a par-ticular source of assistance available in their area. Those at oneplant usually received help from a professional agriculturalworker. The plant field representative advised most purchasersat two plants, and the plant manager was the most common source
TABLE 11. SOURCES OF ASSISTANCE IN DETERMINING PRICE TO PAY FOR QUOTA,39 ALABAMA DAIRYMEN, BY QUOTA PLAN, JANUARY 1961-AUGUST 1964
Source of assistance Quota pTotalPlant usage Alternative
Number Number Number
Personnel at plant 15 10 25Professional agricultural workers------- 2 5 7Other dairymen 1 4 5Milk Control Board 1 1 2No assistance received 8 7 15No answer 0 1 1
TOTAL' 27 28 55
1 There were 53 transactions; 2 sources of assistance were given for 2 transac-tions.
22 ALABAMA AGRICULTURAL EXPERIMENT STATION
MARKET VALUES and TRANSFERS of MILK QUOTAS
of assistance at three plants. Most purchasers at the remainingplant received no aid in calculating value of base.
ESTIMATION OF QUOTA VALUE
Alabama dairymen who are considering purchase or sale ofquotas need to be able to calculate the potential value of quota.The 39 purchasers interviewed gave the following answers whenquestioned as to how they arrived at the price paid for quota:
Method Number usingUsed some method of calculating price ------------ - 10Paid asking price-- - - - - - - - - - - - -- - - - - - - - - - -- 8Plant figured price 8Plant bought quota and resold at cost to purchaser 4Compared with other prices paid for quota at plant 3Compared with price of quota at other plants 1Bid for quota until all other bidders dropped out 1Guessed 1No answer-- 3
T OTA L ...........................- 39
Only one-fourth of the sample group actually calculated pricesto pay for quota. The remainder either paid the seller's askingprice, had their distributor calculate price, decided on basis ofother quota prices, or arbitrarily arrived at a figure. The lattergroup may have made just as good or better purchases, but thedairymen who calculated value probably had more complete in-formation regarding their probable financial outcome.
METHODS USED BY ALABAMA DAIRYMEN
TO CALCULATE QUOTA VALUE
Methods used by the 10 dairymen who calculated quota pricewere simple and basically similar. Three dairymen determinedthe plant's Class I sales for the month prior to quota purchase.This figure was multiplied by the percentage of quota for sale,giving the Class I equivalent for that amount of quota for themonth. Multiplying this figure by the difference in Class I andsurplus price, $3.44, gave the approximate value of quota permonth. This value was multiplied by a maximum of 3 monthsunder plant usage and a maximum of 7 months under alternativequota to obtain the ceiling price they would bid for the base.
Another group of three dairymen used an almost identicalsystem of calculation, except they relied on the plant to figuremonthly pounds of Class I eligibility. Since these dairymen were
23
operating under the plant usage method, they multiplied monthlyvalue of the quota times the number of months remaining in thebase-using period. They bid up to half of this calculated totalvalue.
Two purchasers who bought alternative quota calculated quotavalue the same way as the first group, except the number ofmonths to recover investment was decided by each one on thebasis of individual preference.
The final two purchasers subtracted the Class III price fromexpected blend price after the quota purchase. This quota valuewas multiplied by the number of months they were willing towait to regain their investment to compute price to pay. Thismethod may have added an additional and unnecessary discountto the value of the base. It can take into account sales of surplusmilk after quota purchase, which the quota could not be expectedto move into higher classes because amount of base purchasedmight be less than amount of surplus sales.
AN ALTERNATIVE METHOD OF CALCULATING QUOTA VALUE
There is no one formula that is best for calculating the valueof base. For dairymen who are already producing surplus milk,the following might give an estimate of the price one could affordto pay for quota within a given time limit (1):
P=TX S
Where: T = time in monthsS = spread between Class I and Class III priceP = price per hundredweight per month for base
This formula would be equally applicable to either quota planused in Alabama. For example, if a producer were willing totake 6 months to pay out, he could pay as much as $20.64 perhundredweight per month ($3.44 times 6). If the purchasedquota was worth approximately 10,000 pounds of Class I permonth, he could pay as much as $2,064.00, provided he was ship-ping that much surplus.7
BUILDING VERSUS BUYING QUOTA
Under the plant usage method, a dairyman may increase hisquota if his shipments during the base-building period provide
SFor a dairyman who is not producing surplus milk, yet desires to expand pro-duction, the quota price he can afford to pay depends on how expansion will affecthis marginal cost of production relative to the price of Class I milk.
24 ALABAMA AGRICULTURAL EXPERIMENT STATION
MARKET VALUES and TRANSFERS of MILK QUOTAS
a greater proportion of his plant's receipts than they did duringthe previous base-building period. Under the alternative plan,quota can be gained if other producers undership their allotment.In most cases, a base increase can only be made through thesale of surplus.8 An effective way of evaluating value of buildingbase is to adjust the marginal revenue of surplus milk deliveredduring the base-building period for the possibility of increasingquota during the next base-using period.
Plant Usage Method
The rapid year-to-year changes that can occur in quotas underthe plant usage method make it important that producers lookat possible additional quota on a short term (1-year) basis. Thefollowing formula of the type suggested by Hoepner (3) mayprovide a useful estimate of the adjusted value of surplus as itapplies toward building additional quota:
V = (P1--P) (1 )K(1 -} i)
Where: Vq = discounted value of additional quotaP1 = price of Class I milkP3 = price of Class III milkP = subjective probability of the program being operated in the
year j (for plant usage, the coming year)i = risk free interest rate
K = subjective probability of getting additional quota times theproportion of surplus that is anticipated as additional quota
For an Alabama producer, this equation might become:
V0 = ($6.56 - $3.12) .251.06
Vq = ($3.44) (.943) (.25)Vq $0.81 per hundredweight
since P; probably equals 1 for the coming year, and K valuesmight range from about .1 to .5, depending on the individualsituation.
If an individual could purchase quota for less than $2.43 perhundredweight ($3.44 discounted for 1 year minus $0.81), heshould buy it; if not he should attempt to build base. Nothing
8 Even without being changed, a producer's quota as a percentage may still beworth more in Class I equivalent if the plant has an increase in Class I sales. Hecan obtain his share of these added sales by increasing production at the ap-proximate rate of the sales increase, which may not entail surplus production.
25
ALABAMA AGRICULTURAL EXPERIMENT STATION
has been assumed about the cost position of the producer, exceptthat he has determined to expand his shipments. The marginalrevenue of surplus milk produced during the base-building periodonly, adjusted for the possibility of obtaining more quota, is$3.12 + $0.81, or $3.93.
Alternative Quota Plan
The same formula can be adapted to the alternative quotaplan, except that the time horizon may now be broadened to in-clude several years. The formula becomes:
Vq = (P1 -P3) + Kl1
(1 +
using the same representations as defined previously.
A 3-year time period is probably adequate under present Ala-bama conditions. The following equation might provide a rea-sonable estimate of the value of building quota under the alterna-tive plan:
1 .67 33Vq = ($6.56 - $3.12) + . .075,
1.06 (1.06)2 (1.06)3
assuming, for planning purposes only, that the program will notbe in operation 4 years hence. An additional hypothesis is thatK will be small, since the proportion of surplus granted as addi-tional quota will probably be small, as will the probability ofadditional quota being earned (other than that granted for nor-mal expansion of plant sales).
The equation becomes:
Vq= ($3.44) (.943 + .596 + .277) (.075)Vq = ($3.44) (1.816) (.075)Vq = $.47 per hundredweight'
The -adjusted marginal return from the sale of 100 pounds ofsurplus milk is $3.12 + $0.47, or $3.59, during the base-buildingperiod. Using a 8-year time horizon, the producer should pur-
9 Under the alternative plan, the amount of surplus considered for new quotais at most 15 per cent of producer share of Class I and II sales; hence, surplusproduction beyond this point causes the value of K to drop rapidly. The figureshown, therefore, should be considered a reasonable possibility only for smallincreases in quota. (See footnote 2.)
26
chase quota at prices less than $6.25 per hundredweight ($3.44per 100 pounds a year, assuming K as 1.0 for purchased quota).
STEPS IN ESTIMATING QUOTA VALUE
The preceding data show that most Alabama dairymen havebeen able to buy base more cheaply than they could build it.However, many do not appear to be well informed about baseprovisions and need to know how to estimate quota values. Pre-liminary steps in estimating quota value require producers tokeep informed on current quota provisions and on changes inregulations affecting quotas. Once this has been accomplished,the potential base purchaser (or seller) in Alabama can use thefollowing general steps to estimate the value of quota:
1. The quota must be converted from a percentage to itsequivalent in Class I milk. This can be accomplished in severalways. It can be figured by plant personnel, or the producer canobtain total plant Class I sales for a specific period and multiplyClass I sales by the percentage of quota being sold.
This information, however, can be determined from the pro-ducer's milk check stubs. By dividing his earned quota into theamount of Class I milk he delivered in a particular month, he candetermine with a fair amount of accuracy what his plant's ClassI sales were during the particular pay period, provided he over-shipped his Class I entitlement. Plant sales can be calculated foreach of the preceding 12 months and an average obtained, or atypical month can be selected. By multiplying Class I sales timesthe amount of quota being sold, monthly Class I equivalent canbe obtained.
2. The producer needs to observe the trend in the plant's ClassI sales. If sales during the first half of the year were up 5 percent over the year before, the trend could probably be expectedto continue in the last half of the year.
Potential purchasers under the plant usage method can then
determine total pounds of Class I expected by the last day ofFebruary by multiplying the expected amount in an averagemonth by the number of months remaining in the base-usingperiod.
Prospective alternative quota buyers can follow the same pro-cedure, except the calculated figure may be expanded to the
MARKET VALUES and TRANSFERS of MILK QUOTAS 27

ALABAMA AGRICULTURAL EXPERIMENT STATION
number of Class I pounds expected in a year (or longer, if de-sired) from the date of quota purchase.
3. The producer must determine how additional Class I en-titlement compares with amount of surplus milk he expects toship during the same period under his earned quota. If he an-ticipates having more surplus than the amount of Class I calcu-lated, he can go on to step 4.
4. The next step is to multiply the difference between Class Iand Class III price times the number of hundredweight calcu-lated in steps 1 and 2. If a purchaser expects to have less surplusthan the amount of Class I calculated, he has several alternativesdepending on his particular situation. If he does not plan onexpanding production, he may wish to consider only the amountof surplus he can move to Class I, multiplying that figure by$3.44; or he may attempt to purchase a smaller amount of base.A producer who has no surplus but receives a large amount ofGovernment Contract Milk would multiply by the spread betweenthis price and the Class I price, or $1.81 at present. Finally, aproducer who is expanding production must take into considera-tion the effect of increased production on his marginal cost.
5. The estimated future receipts must be discounted for riskand uncertainty. This step can generally be disregarded by plantusage quota buyers, since it is fairly certain that quota provisionswill not be changed within the current base-using period. How-ever, if there is reasonable doubt that any of the computed ad-ditional receipts will not be forthcoming, the uncertain receiptsshould be eliminated.
Under the alternative quota plan, estimated future receipts ofwhich the purchaser is not reasonably sure must likewise beeliminated. Examples of how future receipts might be loweredinclude the possibility of the plan being discontinued, possiblefailure to produce all the milk, and possible loss of quota in sub-sequent base periods.
6. Since people are less interested in receiving a future returnthan in getting the same return at present, the estimated addi-tional future receipts must be discounted to their present value.A producer who is considering the purchase of quota can simplydiscount future receipts at a rate of 6 per cent annually, althoughthis overstates the discount.
As the additional receipts will be forthcoming on a monthly
28
MARKET VALUES and TRANSFERS of MILK QUOTAS
basis, the following discount formula is more accurate for eitherquota plan:
vP-
(1 + r)n
Where: P = present valuer = monthly interest rate (.5 per cent in most cases)n = number of months that will elapse before receipts will be
receivedV = value of additional receipts10
The present value of future additional receipts from purchaseof quota as calculated in these steps can provide a suitable guidefor dairymen.11 At any price under this value, additional basewould be a profit-making investment. Values calculated by thismethod are generally much higher than prices paid by Alabamadairymen. This differential, apparently caused by a high discountfor risk and uncertainty, leads to the belief that most Alabamadairymen who have purchased quota have made excellent bar-gains.
SUMMARY AND CONCLUSIONS
FINDINGS OF THE STUDY
During the period beginning January 1, 1961, and ending Aug-ust 31, 1964, 466 Grade A dairymen sold milk quotas. Of thosewho purchased quota during this period, 387 were still producingmilk in August 1964. These 387 purchasers participated in 568quota transactions. The disparity of the three figures can beexplained by some sellers of quota dispersing their base to morethan one buyer, and by some dairymen making more than onepurchase of quota.
Analysis of milk sales records of 1,201 dairymen for the 1959and 1964 base-building periods revealed that the 387 producerswho bought quotas sold considerably more milk than the 814
o Trial calculations indicated that differences between answers obtained by theformula and those from a straight 6 per cent annual discount were not largeenough to be considered important, especially since most Alabama dairymen (onthe basis of the sample group) have paid only a fraction of quota value.
SThe same procedure can be followed in calculating additional receipts frommoving surplus milk up to Class II. Additional quota does bring about an in-creased Class II entitlement, yet the amount of milk thus moved is small and theprice differential at present is only $1.81. Omission of this calculation saves timeand, in effect, results in a small additional hedge against risk and uncertainty.
29

nonbuyers. Average daily sales during the 1964 base-buildingperiod were 1,791 pounds and 1,136 pounds for the buyers andnonbuyers, respectively. Purchasers of quotas who sold milk inboth periods had higher production than nonpurchasers in 1959as well as in 1964, and showed a greater average percentage pro-duction increase during the same period.
Data obtained from a survey of 800 dairymen revealed that ahigher percentage of the producers who bought quotas in 1963engaged in so-called "good management practices" than did non-buyers. These practices included production testing, silage feed-ing, and use of artificial breeding. This difference, however, maybe attributed largely to the differences in size of operation be-tween the two groups. Previous studies have indicated thatlarger producers are more prone to use good management prac-tices.
Producers who bought quotas paid a wide range of prices. The39 dairymen who were interviewed paid $160 to $7,200. Priceper 100 pounds of Class I eligibility ranged from $0.39 to $1.96for plant usage quotas. Price per 100 pounds of Class I eligibilitywithin 1 year from date of purchase ranged from $0.54 to $7.29for base bought under the alternative quota plan. Average priceper 100 pounds of Class I eligibility under both quota plans waslower for large transactions than for small transactions.
Average minimum number of months required to regain in-vestment in quota was 2.6 for plant usage transactions and 6.8for alternative quota transactions. Although only 15 of the 89purchasers ventured an estimate of the time needed to regain thepurchase price, 10 of the 15 estimated within 2 months of thecalculated minimum.
Most of the farmers interviewed had received assistance indetermining price to pay for quotas. Plant personnel were themost common source of assistance. Producers at each plant com-monly used a particular source of assistance available in theirarea.
The majority of the sample group said they purchased quotain either an attempt to raise blend price, to increase size, or inmany instances, a combination of the two. Three-fourths of thedairymen stated that they made a good buy on quotas, but onlya third said they would definitely attempt to purchase morequotas in the future.
30 ALABAMA AGRICULTURAL EXPERIMENT STATION
MARKET VALUES and TRANSFERS of MILK QUOTAS
CONCLUSIONS
Answers given on the producer survey and responses given bysome producers when interviewed lead to the conclusion thatmany dairymen are not well informed about quota regulationsin the State. Because of the effect these regulations have ontheir incomes, it is economically important that producers becomemore familiar with pertinent regulations. Not only is such in-formation a prerequisite for purchasing quota, but it makes dairy-men better equipped to make ordinary year-to-year productionand marketing adjustments. Better knowledge about quota pro-visions could also work indirectly toward bettering producer-dis-tributor relations.
On the basis of the sample, Alabama dairymen apparentlyplace a high discount for risk and uncertainty on the value ofquota. This high discount seems to have led to the purchaseof quotas at low prices relative to their potential value. The lowinvestment in quota causes the time necessary to regain purchaseprice, or period of "write-off," to be short. These factors, coupledwith the sales increases effected by purchasers of quota, indicatethat quotas have permitted size adjustments. It appears that mostproducers who have been willing to purchase quotas have beenable to boost sales cheaply. Alabama dairymen have probablybeen able to purchase quota more cheaply than they couldbuild it.
From the standpoint of the seller, money made from sale ofquota is of lesser importance than receipts from dispersal of therest of his operation. However, the industry benefits if saleof quota helps stimulate inefficient producers to stop production.
The danger of high-priced, negotiable production quotas beingadded into the long-term costs of production remains a threat, par-ticularly if more producers change from the plant usage methodof quota building to the alternative quota plan. Price data ob-tained in the sample indicate this has not happened to date, andit is unlikely to happen if producers continue to place high dis-counts on risk and uncertainty. Still, if more producers becomeinterested in the possibilities of expansion through purchase ofbase, the increased demand would cause a rise in price. It islikely that producer knowledge about quota transfers will in-crease if producer numbers continue to decline as expected, asmost larger producers tend to be better managers.
31

MARKET VALUES and TRANSFERS of MILK QUOTAS
LITERATURE CITED
(1) ARNOLD, C. J. An Analysis of Virginia's Quota Plan for Milk. Va. Agr.Expt. Sta. Bul. 496. 1958.
(2) COBB, K. H. An Analysis of the Supply-Demand Balance for GradeA Milk in Alabama. Unpublished M.S. Thesis. Auburn Univ. 1965.
(3) HOEPNER, P. H. "Optimum Levels of Milk Production Under Market-ing Quotas." Jour. of Farm Econ. 46:3 567-579. Aug. 1964.
(4) SIMMONS, R. A. "Policy Implications," Tarheel Farm Economist. Ext.Serv., Dept. of Agr. Econ. N.C. State. Jan. 1964.
(5) STATE OF ALABAMA. ALABAMA MILK CONTROL BOARD. Digest of Ala.Milk Control Board. Revised and assembled Feb. 1, 1962.
(6) -. Digest of Alabama Milk Control Board. Revised andassembled Jan. 1, 1960.
(7) . Establishing an Alternative Quota Plan. Official Order8-63. Oct. 16, 1968.
(8) . Pricing Schedules. Official Order 2-63. Oct. 16, 1963.
(9) WILSON, L. E., BLACKSTONE, J. H., AND HARNESS, V. L. Producer Mar-keting Problems in Alabama's Fluid Milk Industry. Agr. Expt. Sta. ofAuburn Univ. Bul. 331. 1961.
33


APPENDIX
QUOTA PROVISIONS IN ALABAMA
Types of Quota Plans'
Plant Usage Method. Under the "plant usage" method all milkdelivered by a producer during the months of September throughFebruary builds his quota at the distributor's plant for the fol-lowing year. Each shipper's quota is determined by the ratio hisdeliveries of milk during the base-building period are to totalproducer receipts by the distributor during this period. Theratio is expressed as a percentage and becomes the producer'squota. This quota remains effective from the first day of Marchthrough the last day of February the following year (5). A pro-ducer with a quota of 10 per cent is entitled to receive the ClassI and Class II prices for amounts of milk equal to at least 10 percent2 of his distributor's sales of Class I and Class II products.Many plants in the State have two additional classes of milk,Government Contract Milk and inter-plant transfer of bulk milk.Producers shipping to a distributor who sells one or both classesare paid at the appropriate price for amounts of these sales asdetermined by their quotas. All milk delivered by a producerin excess of Class I, II, Government, and inter-plant transfer ispurchased at Class III (surplus) price.
Current producer prices and class designations of Grade Amilk as established by the Alabama State Milk Control Boardare shown in Appendix Table I. The butterfat differential hasgenerally been 5 cents for each 0.1 per cent of butterfat contentover or under 4 per cent, although on occasion the differential hasrisen to 6 cents.
The plant usage method is the most commonly used quota planin the State at present. At the time of this study, it was used by28 of the 86 milk distributors in Alabama.
Butterfat content has no effect in determining quotas, nor doesclass utilization of milk delivered during the base-building period.
1 A third quota plan, "winter production is summer base," was commonly usedin Alabama for many years. This is a true base plan. This plan can still be usedto build quota in Alabama, but in recent years all plants except one have dis-continued its use.
2 Appendix Tables 2 and 3 show how an individual can in some instances re-ceive the Class I and Class II prices for amounts of milk in excess of his quota.
MARKET VALUES and TRANSFERS of MILK QUOTAS 35
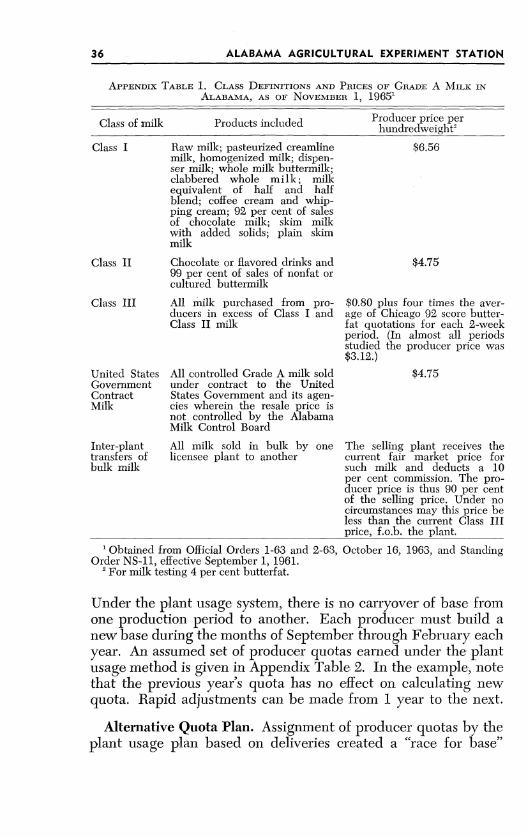
ALABAMA AGRICULTURAL EXPERIMENT STATION
APPENDIX TABLE 1. CLASS DEFINITIONS AND PRICES OF GRADE A MILK INALABAMA, AS OF NOVEMBER 1, 19651
Class of milk Products included
Class I Raw milk; pasteurized creamlinemilk, homogenized milk; dispen-ser milk; whole milk buttermilk;clabbered whole milk; milkequivalent of half and halfblend; coffee cream and whip-ping cream; 92 per cent of salesof chocolate milk; skim milkwith added solids; plain skimmilk
Class II Chocolate or flavored drinks and99 per cent of sales of nonfat orcultured buttermilk
Class III All milk purchased from pro-ducers in excess of Class I andClass II milk
United StatesGovernmentContractMilk
Inter-planttransfers ofbulk milk
All controlled Grade A milk soldunder contract to the UnitedStates Covernment and its agen-cies wherein the resale price isnot controlled by the AlabamaMilk Control Board
All milk sold in bulk by onelicensee plant to another
1 Obtained from Official Orders 1-63 and 2-63,Order NS-11, effective September 1, 1961.
2 For milk testing 4 per cent butterfat.
Producer price perhundredweight
$6.56
$4.75
$0.80 plus four times the aver-age of Chicago 92 score butter-fat quotations for each 2-weekperiod. (In almost all periodsstudied the producer price was$3.12.)
$4.75
The selling plant receives thecurrent fair market price forsuch milk and deducts a 10per cent commission. The pro-ducer price is thus 90 per centof the selling price. Under nocircumstances may this price beless than the current Class IIIprice, f.o.b. the plant.
October 16, 1963, and Standing
Under the plant usage system, there is no carryover of base fromone production period to another. Each producer must build anew base during the months of September through February eachyear. An assumed set of producer quotas earned under the plantusage method is given in Appendix Table 2. In the example, notethat the previous year's quota has no effect on calculating newquota. Rapid adjustments can be made from 1 year to the next.
Alternative Quota Plan. Assignment of producer quotas by theplant usage plan based on deliveries created a "race for base"
36
MARKET VALUES and TRANSFERS of MILK QUOTAS
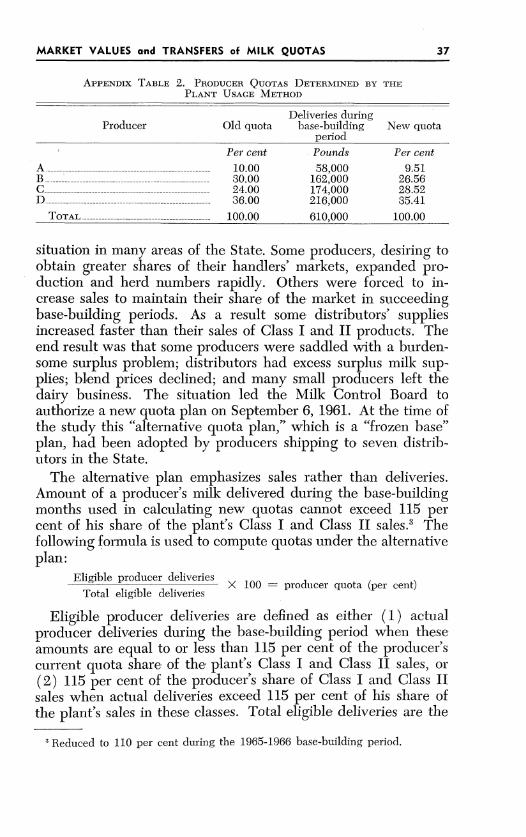
APPENDIX TABLE 2. PRODUCER QUOTAS DETERMINED BY THEPLANT USAGE METHOD
Deliveries duringProducer Old quota base-building New quota
period
Per cent Pounds Per cent
A 10.00 58,000 9.51B 30.00 162,000 26.56C --------------------------------------- 24.00 174,000 28.52D 36.00 216,000 35.41
TOTAL ............. -----............. 100.00 610,000 100.00
situation in many areas of the State. Some producers, desiring toobtain greater shares of their handlers' markets, expanded pro-duction and herd numbers rapidly. Others were forced to in-crease sales to maintain their share of the market in succeedingbase-building periods. As a result some distributors' suppliesincreased faster than their sales of Class I and II products. Theend result was that some producers were saddled with a burden-some surplus problem; distributors had excess surplus milk sup-plies; blend prices declined; and many small producers left thedairy business. The situation led the Milk Control Board toauthorize a new quota plan on September 6, 1961. At the time ofthe study this "alternative quota plan," which is a "frozen base"plan, had been adopted by producers shipping to seven distrib-utors in the State.
The alternative plan emphasizes sales rather than deliveries.Amount of a producer's milk delivered during the base-buildingmonths used in calculating new quotas cannot exceed 115 percent of his share of the plant's Class I and Class II sales. 3 Thefollowing formula is used to compute quotas under the alternativeplan:
Eligible producer deliveriesX 100 = producer quota (per cent)
Total eligible deliveries
Eligible producer deliveries are defined as either (1) actualproducer deliveries during the base-building period when theseamounts are equal to or less than 115 per cent of the producer'scurrent quota share of the plant's Class I and Class II sales, or(2) 115 per cent of the producer's share of Class I and Class IIsales when actual deliveries exceed 115 per cent of his share ofthe plant's sales in these classes. Total eligible deliveries are the
' Reduced to 110 per cent during the 1965-1966 base-building period.
37
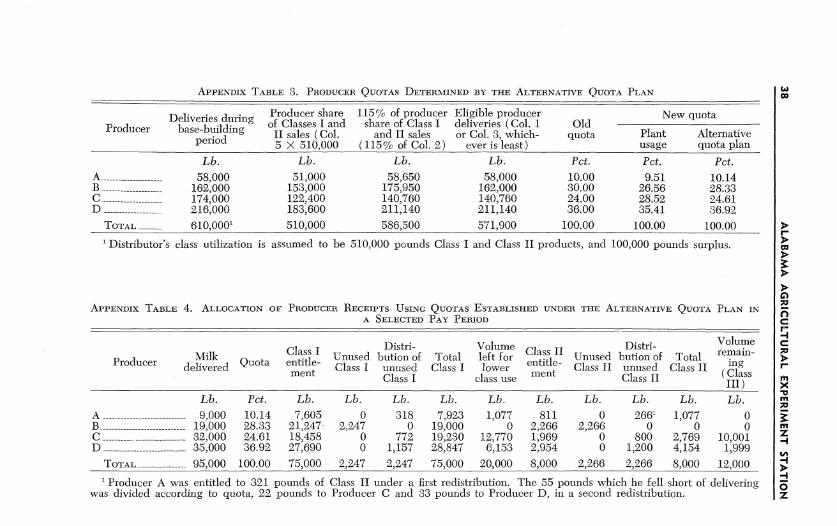
APPENDIX TABLE 3. PRODUCER QUOTAS DETERMINED BY THE ALTERNATIVE QUOTA PLANw
Deliveries duringProducer base-building
period
A - - - - - - -B - - - - - - -C - - - - - - -D -- -----
TOTAL.
Lb.58,000
162,000174,000216,000
610,000'
Producer share 115% of producer Eligible producerof Classes I and sbare of Class I deliveries (Col. 1II sales ( Col. and II sales or Col. 3, which-,5 X 510,000 (115% of Col. 2) ever is least)
Lb. Lb. Lb.51,000
153,000122,400183,600
510,000
58,650175,950140,760211,140
586,500
58,000162,000140,760211,140
571,900
Oldquota
New quota
Plant Alternativeusage quota plan
Pct. Pct.10.0030.0024.0036.00
100.00
9.5126.5628.5235.41
100.00
Pct.10.1428.3324.6136.92
100.00Distributor's class utilization is assumed to be 510,000 pounds Class I and Class II products, and 100,000 pounds surplus.
APPENDIX TABLE 4. ALLOCATION OF PRODUCER RECEIPTS USING QUOTAS ESTABLISHED UNDER THE ALTERNATIVE QUOTA PLAN INA SELECTED PAY PERIOD
Producer ~MilkProdcer delivered Quota
A -- - - - - -B - - - - - - -C - - - - - --D -- - - - - -
TOTAL-
Lb.9,000
19,00032,00035,000
95,000
Pct.
10.1428.3324.6136.92
100.00
Class I Distri-entitle- Unused bution of Total
met Class I unused Class Iment Class I
Lb.7,605
21,24718,45827,690
75,000
Lb.0
2,24700
2,247
Lb.318
0772
1,157
2,247
Lb.7,923
19,00019,23028,847
75,000.
Volume Class IIleft for entitle-lower ment
class use
Lb.1,077
012,7706,153
20,000
Lb.811
2,2661,9692,954
8,000
Distri-Unused bution of TotalClass II unused Class II
Class II
Lb.0
2,26600
2,266
Lb.266'
0800
1,200
2,266
Lb.1,077
02,7694,154
8,000
Producer A was entitled to 321 pounds of Class II under a first redistribution. The 55 pounds which he fell short of deliveringwas divided according to quota, 22 pounds to Producer C and 33 pounds to Producer D, in a second redistribution.
C
m
z-i
z
Volumeremain-
ing(ClassIII )
Lb.00
10,0011,999
12,000
w

MARKET VALUES and TRANSFERS of MILK QUOTAS
sum of all eligible producer deliveries to the plant during thebase-building months. The quota-building period used underthe alternative method is also September 1 through the last dayin February (7).
Appendix Table 3 gives an example of quota determination bythe alternative plan (the same sales are used as in AppendixTable 2). The last two columns show comparisons of quotas foreach producer computed by the two methods. Under the plantusage method, Producer C gained quota at the expense of theother three producers, but under the alternative quota plan hewas unable to make any significant increase. Producers A and Dgained base under the alternative plan, even though ProducerA's shipments were less than 115 per cent of his eligibility. Thiswas because of the relatively low percentage of eligibility shippedby Producer B.
Allocation of Producer Receipts
The application of quotas can be illustrated by showing theallocation of producer receipts for a selected pay period. Pro-ducer receipts are allocated in the same manner under bothprocedures of quota calculation. Appendix Tables 4 and 5 givethe allocation of producer receipts and the determination of pay-ments for the four producers using the quotas calculated by thealternative quota plan. The hypothetical distributor shown inthe example is assumed to have sales of 75,000 pounds of ClassI products and 8,000 pounds of Class II products during theselected pay period.
Appendix Table 4 lists the allocation of receipts with quotasestablished under the alternative plan. In the example, ProducerB fell short by 2,247 pounds of fulfilling his Class I entitlement.This amount was. proportionately divided according to quotaamong the other producers, all of whom shipped milk in excessof their Class I entitlement. Since all of Producer B's milk wentinto Class I, he fulfilled none of his Class II entitlement. This2,226 pounds was divided in the same manner. The remainingmilk shipped by Producer C and D was purchased at the surplusprice.
The value of each producer's shipments is given in AppendixTable 5. All producers were assumed to have shipped milk testing4 per cent butterfat. In many cases, producers shipping to a
39

40 ALABAMA AGRICULTURAL EXPERIMENT STATION
APPENDIX TABLE 5. DETERMINATION OF VALUE OF PRODUCER RECEIPTSALLOCATED BY QUOTAS CALCULATED BY THE ALTERATIVE QUOTA
PLAN FOR A SELECTED PAY PERIOD
Class allocation
Producer AClass I- - - - - - -Class II -- - - - -Class III- - - -T otal-- - - - - - - - - -Producer BClass I- - - - - - - -Class II- - - - - -Class III- - - --T otal-- - - - - - - - - -Producer CC lass I-- - - - - - - - - - - - - - - -C lass II ---------------C lass III ---------------T o tal-- - - - - - - - - - - - - - - - -Producer DC lass I -- - - - - - - - - - - - - - -C lass II --------- ----- -C lass III----------- ----T o ta l-- - - - - - - - - - - - - - - - -
GRAND TOTAL------_-
Price Amount Value prie~catiopricecDol. Lb. Dol. Dol.
6.56 7,923 7,519.754.75 1,077 51.163.12 0 0.00
___ 9,000 570.91 6.34
6.56 19,000 1,246.404.75 0 0.003.12 0 0.00
___ 19,000 1,246.40 6.56
6.56 19,230 1,261.494.75 2,769 131.533.12 10,001 312.03
___ 32,000 1,705.05 5.33
6.56 28,847 1,892.364.75 4,154 197.323.12 1,999 62.37
___ 35,000 2,152.05 6.15___ 95,000 5,674.41 5.97
plant share in the sales of Government Contract and inter-planttransfer milk. The only effect is the addition of two more classesof milk, however, and method of calculating returns to producersremains the same.
Transfer Provisions
Prior to 1960, regulations in Alabama regarding transfers ofquota were restrictive. A producer could transfer quota only asan incident to the sale of his herd. The Milk Control Boardallowed quota transfers only when the purchaser bought at least50 per cent of the milking cows in the herd being dispersed. Theentire quota could then be transferred to the buyer, providedshipments continued to the same distributor. A distributor ob-jecting to a transfer was allowed to petition the Board showingjust cause for voiding any transactions (6).
As herd sizes increased in the State, base transfers became evenmore restrictive. Few producers had access to the capital re-
40
quired to purchase large numbers of dairy cattle. In many in-stances, most of the cows purchased were immediately resold,often for slaughter. In 1960 the Board reduced transfer restric-tions. The new regulations were closely aligned with produceropinions and economic needs existing at that time (9).
Present regulations still allow transfer of quota only as anincident to the sale of a producer's herd. A quota is deemed tobe the personal property of the producer in whose name a licenseis held at the Milk Control Board. Any producer owning a quotamay transfer his quota for any consideration he deems sufficient.A producer may divide his quota for sale or transfer in as manyways as he desires. All transfers are subject to the following re-strictions:
1. If any portion of a producer's quota is transferred, the entirequota must be dispersed. The producer is not allowed to retainany portion of the quota for his own use.
2. Each transfer of quota must be approved by the AlabamaMilk Control Board prior to becoming final.
3. Transfer of any quota or portion of a quota to a party orparties not currently holding quota at the plant where the basewas established can be made only with the consent of the plantinvolved.
4. A quota held by a producer who dies, retires, or enters mili-tary service may be transferred to a member of the producer's im-mediate family who will continue the dairy operation, withoutapproval of the plant at which the quota was earned.
5. A quota that is held jointly may be transferred to one of thejoint holders if the agreement is terminated.
6. Any other methods of transfer must be approved by theBoard (5).
Effect of Purchase of Quota onAllocation of Producer Receipts
As an example of how quota purchase affects return, supposethat Producer A decides to get out of Grade A milk production.Producer C purchases A's quota on the first day of the selectedpay period. Producer C buys none of A's cows and ships thesame amount of milk as shown in Appendix Table 4.
Appendix Table 6 shows that the additional 10.14 per cent
41MARKET VALUES and TRANSFERS of MILK QUOTAS

N~
APPENDIX TABLE 6. EFFECT OF PURCHASE OF QUOTA ON ALLOCATION OF PRODUCER RECEIPTS USING QUOTAS ESTABLISHED UNDERTHE ALTERNATIVE QUOTA PLAN IN A SELECTED PAY PERIOD
Distri- Volume Distri- Volume oMilk Po e1seIt Unused bution of Total left for entIe Unused hution of Total remain- D
delivered Quota entitle- Class ent Class II unused Class I assgment Class I lowe Class IIlass I Class use tl
Lb. Pct. Lb. Lb. Lb. Lb. Lb. Lb. Lb. Lb. Lb. Lb.A
A.---------------------------- out of business, sold 10.14 per Cent quota to Producer C CB 19,000 28.33 21,247 2,247 0 19,000 0 2,266 2,266 0 0 0 rC 8-------------- 2,000 34.75 26,063 0 1,090 27,153 4,847 2,780 0 1,099 3,879 968 cD ______________ 35,000 36.92 27,690 0 1,157 28,847 6,153 2,954 0 1,167 4,121 2,032 M
TOTAL--------- 86,000 100.00 75,000 2,247 2,247 75,000 111,000 8,000 2,266 2,266 8,000 3,000 r
x
I
-.I
Z

quota enabled Producer C to move all but 968 pounds of hissurplus into higher classes. The additional Class I and Class IIreceipts gave Producer C an increase in the value of his milk of$290.64, and an increase in blend price from $5.33 to $6.24 perhundredweight, Appendix Table 7.
The foregoing situation should not be presumed to be typical.Each plant and producer situation must be considered separately.The example shown might have been voided at the request of thedistributor. If Producer C had not increased production, theplant would have been left with well under the 10 to 15 per centsurplus needed as a cushion for sales fluctuations and would havebeen forced to obtain supplementary milk supplies to meet dailyrequirements.
APPENDIX TABLE 7. EFFECT OF PURCHASE OF QUOTA ON VALUE OF PRODUCERRECEIPTS ALLOCATED BY THE ALTERNATIVE QUOTA PLAN FOR A
SELECTED PAY PERIOD
Class allocation Price Amount Value Blend price
Dol./Cwt. Lb. Dol. Dol./Cwt.Producer A out of business
Producer BClass I 6.56 19,000 1,246.40Class II 4.75 0Class III 3.12 0
Total - 19,000 1,246.40 6.56
Producer CClass I 6.56 27,153 1,781.24Class II 4.75 3,879 184.25Class III 3.12 968 30.20
Total 32,000 1,995.69 6.24
Producer DClass I 6.56 28,847 1,892.36Class II 4.75 4,121 195.75Class III 3.12 2,032 63.40
Total 35,000 2,151.51 6.15
GRAND TOTAL............. 86,000 5,398.60 6.27
MARKET VALUES and TRANSFERS of MILK QUOTAS 43
