market trends impacting and opportunities for the u.s. peach market
TRANSCRIPT

www.perishablesgroup.com
Market Trends Impacting and
Opportunities for the U.S. Peach
Market
Presented by Nielsen Perishables Group
February, 2012
www.perishablesgroup.com 2
Agenda
Discussion Overview
Economic/Industry Trends to Consider
Peach Purchase Dynamics
Thoughts on Peach varietal marketing
Summary

www.perishablesgroup.com 3
PG 2012…
Exclusive Retail
Programs and
Advisory Board
Alliances with
Information
Leaders
Collaboration
with Trade
Organizations
www.perishablesgroup.com 4
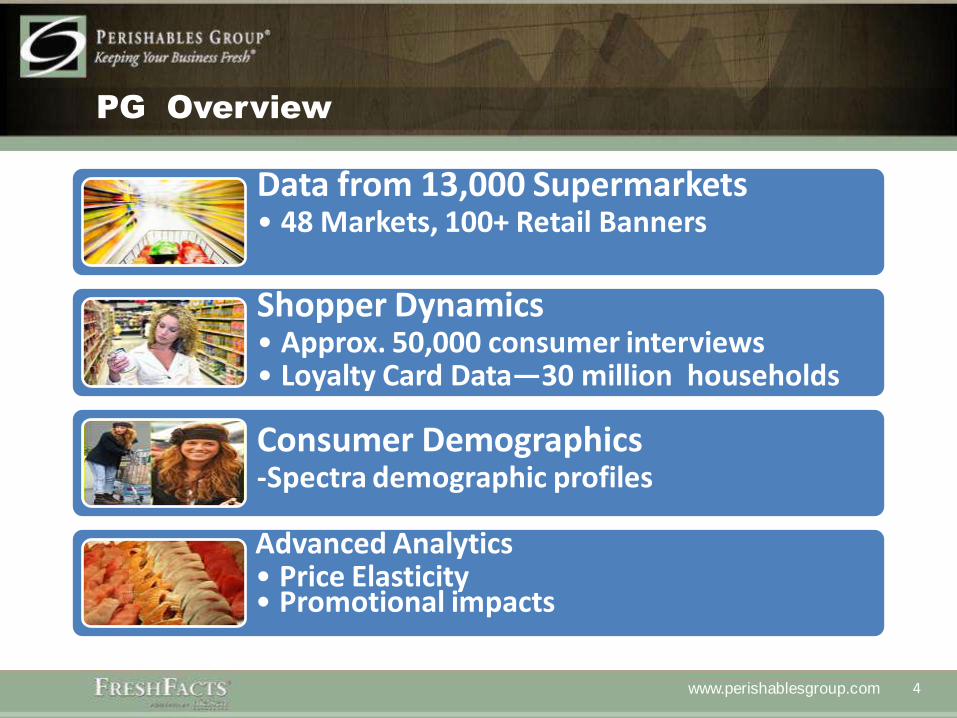
PG Overview
Data from 13,000 Supermarkets• 48 Markets, 100+ Retail Banners
Shopper Dynamics• Approx. 50,000 consumer interviews• Loyalty Card Data—30 million households
Consumer Demographics-Spectra demographic profiles
Advanced Analytics• Price Elasticity• Promotional impacts
www.perishablesgroup.com 5
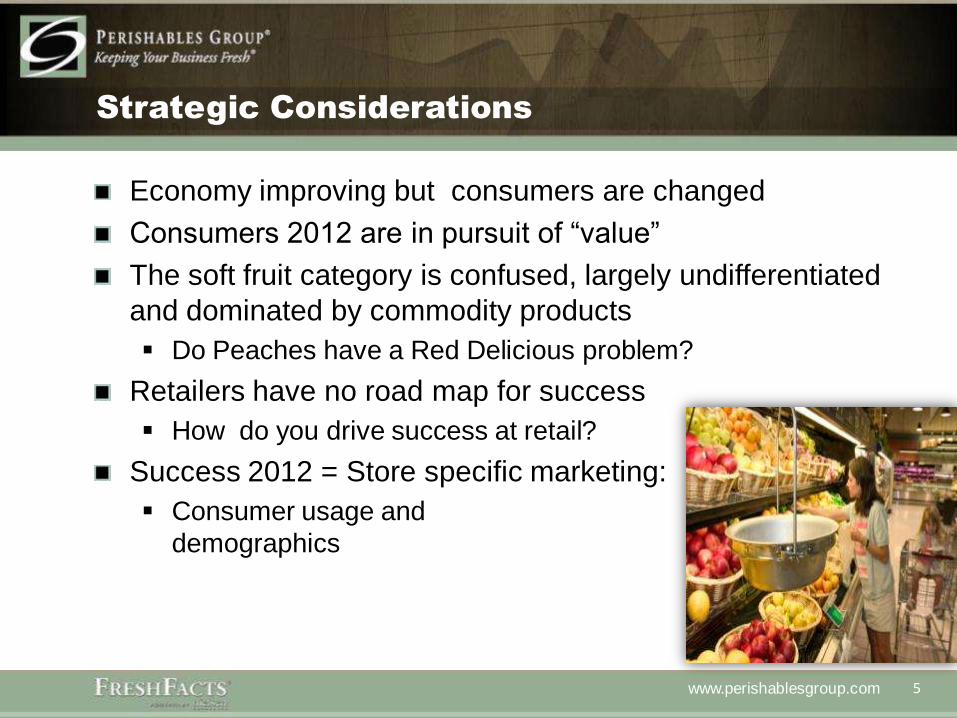
Strategic Considerations
Economy improving but consumers are changed
Consumers 2012 are in pursuit of “value”
The soft fruit category is confused, largely undifferentiated
and dominated by commodity products
Do Peaches have a Red Delicious problem?
Retailers have no road map for success
How do you drive success at retail?
Success 2012 = Store specific marketing:
Consumer usage and
demographics

2012: Markets and consumers driven by uncertainty
Source: Yahoo Finance; DQNews; ChicagoFed.org; EIA.gov
FUEL COSTS
EQUITY MARKETS LABOR MARKETSHOME PRICES
INFLATION

www.perishablesgroup.com 7
“Median household income on downslide
$49,445
$50,599
$50,939
$52,823
$52,124
$51,739
$51,174
$51,353
$51,398
$52,005
$53,164
'10
'09
'08
'07
'06
'05
'04
'03
'02
'01
'00
Median household income in 2010 inflation adjusted dollars
Source: THE CINCINNATI ENQUIRER, The New York Times, Census Bureau & USA Today
-2.3%
-0.7%
-3.6%
1.3%
0.7%
1.1%
-0.3%
-0.1%
-1.2%
-2.2%
-0.2%
'10
'09
'08
'07
'06
'05
'04
'03
'02
'01
'00
% Change from Previous Year
www.perishablesgroup.com 8
-2-10123456
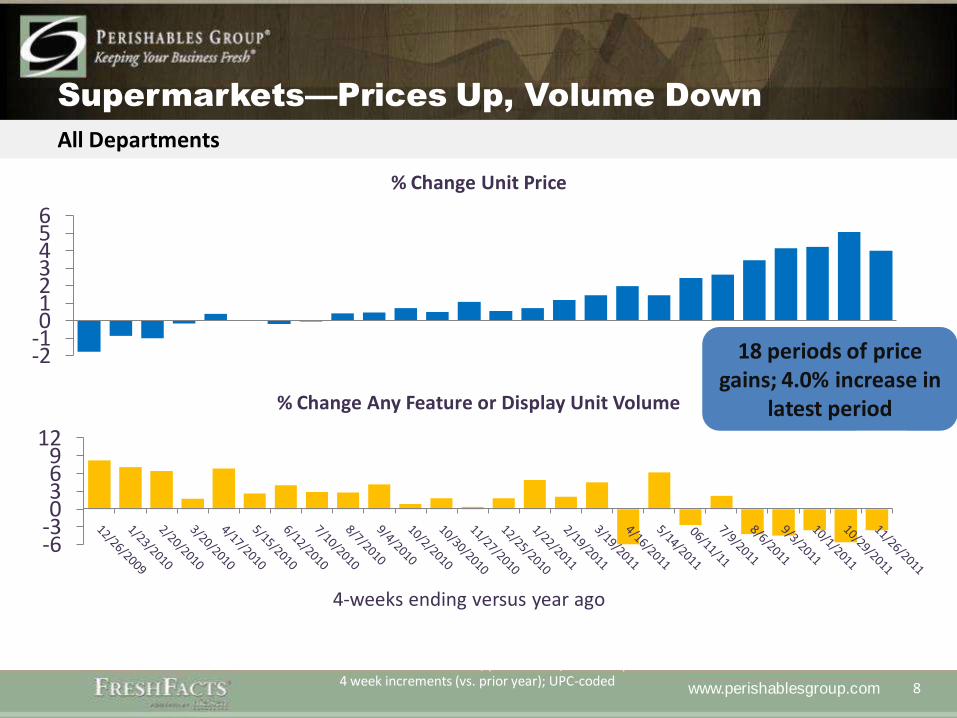
% Change Unit Price
-6-30369
12
4-weeks ending versus year ago
% Change Any Feature or Display Unit Volume
Supermarkets—Prices Up, Volume Down
Source: Nielsen Scantrack, (U.S. FDM w/ Walmart) 4 week increments (vs. prior year); UPC-coded
All Departments
18 periods of price gains; 4.0% increase in
latest period

www.perishablesgroup.com 9
The new economic recovery….
U.S. Consumer is becoming more
polarized

www.perishablesgroup.com 10
The “Consumer Hourglass Theory”
A wide swath of American companies are convinced that the consumer market is bifurcating into high and low ends and eroding in the middle—the consumer hourglass is more pronounced now than ever.
“(Proctor and Gamble) The world's largest maker of consumer products is now betting that the squeeze on middle America will be long lasting. "It's required us to think differently about our product portfolio and how to please the high-end and lower-end markets," says Melanie Healey, group president of P&G's North America business. "That's frankly where a lot of the growth is happening.“
Wall Street Journal
September 12, 2011

Increasingly polarized consumers
Source: msnbc.com; CNN Money*Supplemental Nutrition Assistance Program (SNAP)
1 in 7 Americans rely on food stamps
1 in 2 Americans own stock, mutual fund, 401K or IRA
20% of Americans earn less than $20,000 a year
87% of Americans earning over $75,000 own stocks

www.perishablesgroup.com 12
-6%
-4%
-2%
0%
2%
4%
< $20K $20K -$29K
$30K -$39K
$40K -$49K
$50K -$69K
$70K -$99K
$100K +
Household Income
Shopping Trips Shopping Dollars
Polarized consumers
Source: Nielsen Homescan, 52 w/e 10/1/2011 versus 10/2/2010excludes gas-only or Rx-only trips
1 year trend
15% of USHHs
21% of USHHs
www.perishablesgroup.com 13
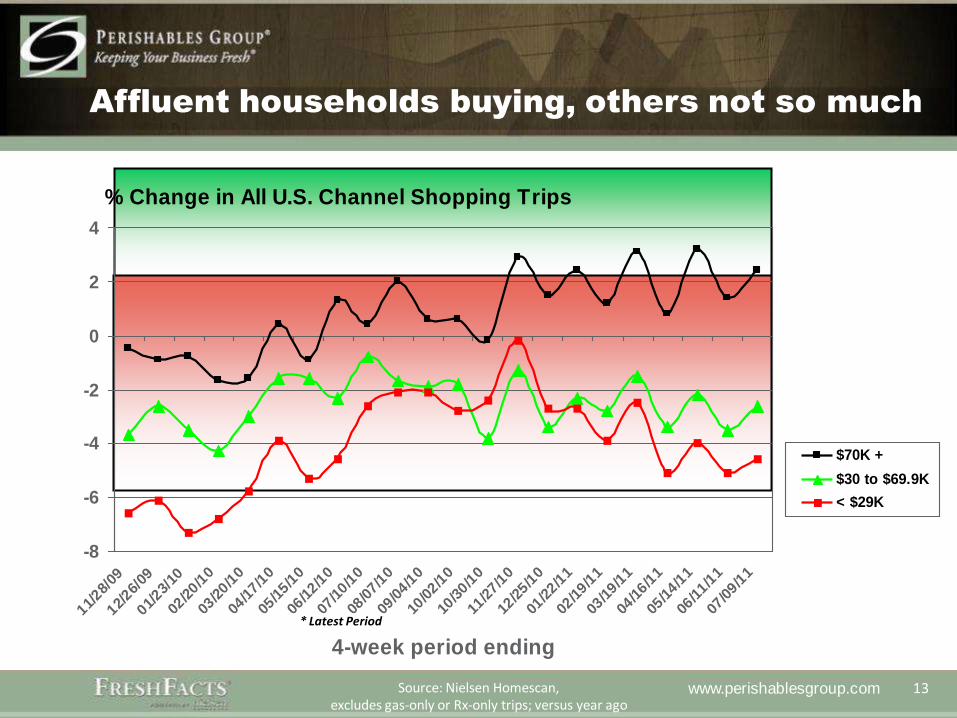
% Change in All U.S. Channel Shopping Trips
-8
-6
-4
-2
0
2
4
11/28/
09
12/26/
09
01/23/
10
02/20/1
0
03/20/1
0
04/17/1
0
05/15/1
0
06/12/1
0
07/10/1
0
08/07/1
0
09/04/1
0
10/02/1
0
10/30/1
0
11/27/1
0
12/25/1
0
01/22/1
1
02/19/1
1
03/19/1
1
04/16/1
1
05/14/1
1
06/11/1
1
07/09/1
1
4-week period ending
$70K +
$30 to $69.9K
< $29K
Affluent households buying, others not so much
* Latest Period
Source: Nielsen Homescan, excludes gas-only or Rx-only trips; versus year ago

www.perishablesgroup.com 14
It’s tough out there….even for college grads

www.perishablesgroup.com
15
WHAT DOES IT MEAN?
A Fresh Perspective on Category Development
www.perishablesgroup.com 16
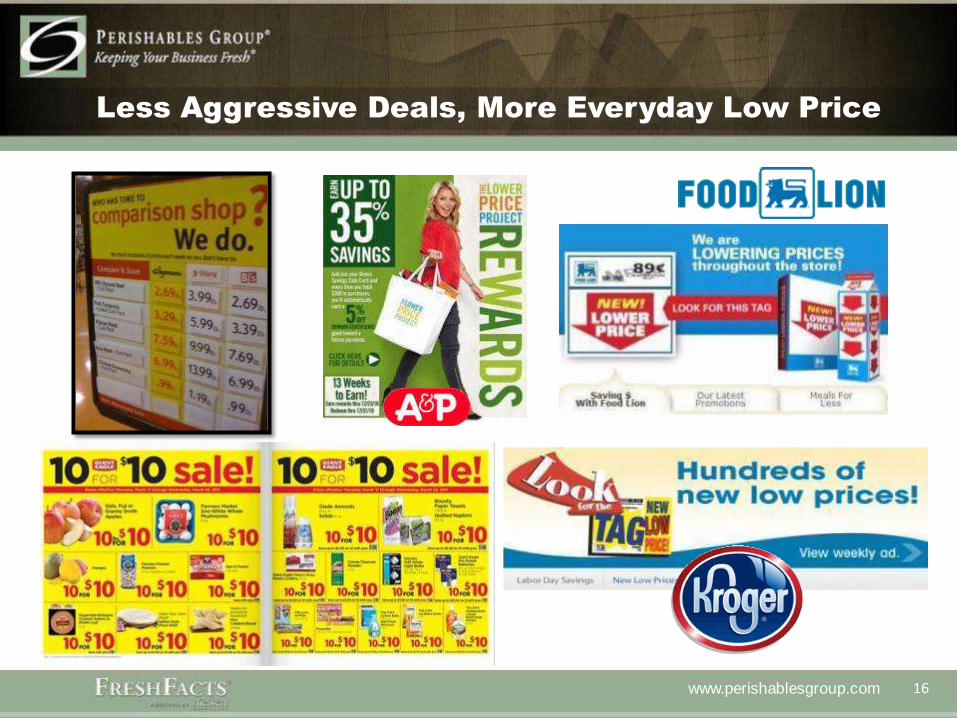
Less Aggressive Deals, More Everyday Low Price

www.perishablesgroup.com 17
Focus Shifts from Shelf to Shopper
Circular ad
counts2
Source: 1) 2011 Global Retail CIO Survey from Aldata; 2) Perishables Group, Market Track Promotional Reporting; 3) Perishables Group FreshFacts® Powered by Nielsen
Volume sold on promo3
Promoted volume lift3
Promotional Retail Prices
Peaches
+5.3%
-13.2%
-30.2%

www.perishablesgroup.com 18
Consumer “Value” Intersects with Price
Price:“I want to save money”
Convenience:“I want something that will
save time”
Dietary Restrictions:“I need to lower my cholesterol.
What can I make that is more
healthy?”
Specialty:“Certain products are worth
the money”
Occasion:“I want to bring something
fancy/trendy to this party”
Indulgence:“I want to treat myself to
something special”
Health:“I don’t want my family to
be unhealthy”
Portion Control:“I don’t want to stuff myself”
Product Success Has Many Faces

www.perishablesgroup.com 19
CONVENIENCE
“I have so much to juggle right now. How can I cut down on
the time I spend in the kitchen?”

www.perishablesgroup.com 20
-3.4%
Consumers Visiting Retailers More
Frequently for Value-added Products
CONVENIENCE
+4.8% +0.8%
Trips per
Buyer
Value-Add Fruit Value-Add Veg Total Produce
Average
Retail Price+4.5% +14.6% +5.0%
Source: 1) Perishables Group FreshFacts® Powered by Nielsen, YTD 2) Perishables Group FreshFacts® Shopper Insights Powered by Spire, YTD

www.perishablesgroup.com 21
Wider Assortment Fueling Value-Added Growth
Source: Perishables Group FreshFacts® Powered by Nielsen, YTD
Average Retail Price: 4.9%
Dollars: 0.3%
Volume: 4.4% Bulk W
hole
Waterm
elon
Value-A
dd
Waterm
elon
Value-Added Produce Item Count
2006-2010: + 50%+ from 2006 to 2010
2011: 9.2% more value-add fruit items sold
11.2% more value-add vegetable items sold
Average Retail Price: $0.40/lbs
Average Retail Price: $1.17/lbs
Average Retail Price: 1.0%
Dollars: 108.0%
Volume: 105.8%
CONVENIENCE
www.perishablesgroup.com 22
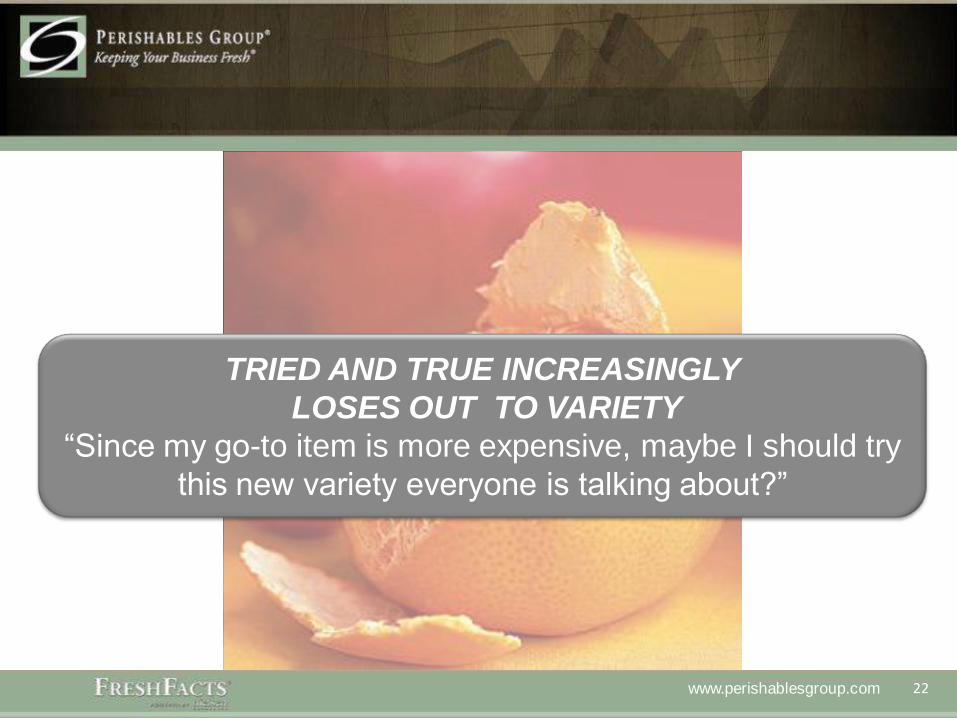
TRIED AND TRUE INCREASINGLY
LOSES OUT TO VARIETY
“Since my go-to item is more expensive, maybe I should try
this new variety everyone is talking about?”

www.perishablesgroup.com 23
Newer Varieties Experienced Growth
Despite Higher Prices
TRIED AND TRUE
Volume Velocity: 10.1%
Dollar Velocity: 7.0%
Trips per Buyer 1.0%
Bulk N
avel
Oranges
3-pound
Clem
entines
Volume Velocity: 32.7%
Dollar Velocity: 32.6%
Trips per Buyer 2.0%
Average Retail Price: 3.4%
Regular Price: 1.2%
Promoted Price: 3.4%
Average Retail Price: 0.1%
Regular Price: 1.2%
Promo Price: 0.9%
www.perishablesgroup.com 24
Cost Consumer = Price Value Consumer = Benefits/Price
Value increasingly the new category driver
Avg Price +121% higherDollar Sales 160%Unit Sales 203%
Dollar Sales 3%Unit Sales 1%
Remaining Yogurt Total Greek Yogurt
Dollar Sales6%
Unit Sales
Avg Price 83% higher Dollar Sales 9%Unit Sales 10%
Mainstream Chocolate Premium Chocolate
Dollar Sales -2%Pound Sales 1%
Avg Price 57% higher Dollar Sales 3%Pound Sales 5%
Pasta Excluding Health Healthy Pasta
Dollar Sales4%
Unit Sales -4%
Avg Price 18% higher Dollar Sales 8%Unit Sales 5%
Mainstream Coffee Premium Coffee Pod Coffee
Avg Price 40% higher Dollar Sales 115%Unit Sales 99%
Mid-Tier Toothpaste
Avg Price +268% higherDollar Sales 20%Unit Sales 20%
Dollar Sales-8%
Unit Sales -3%
Super Premium Toothpaste
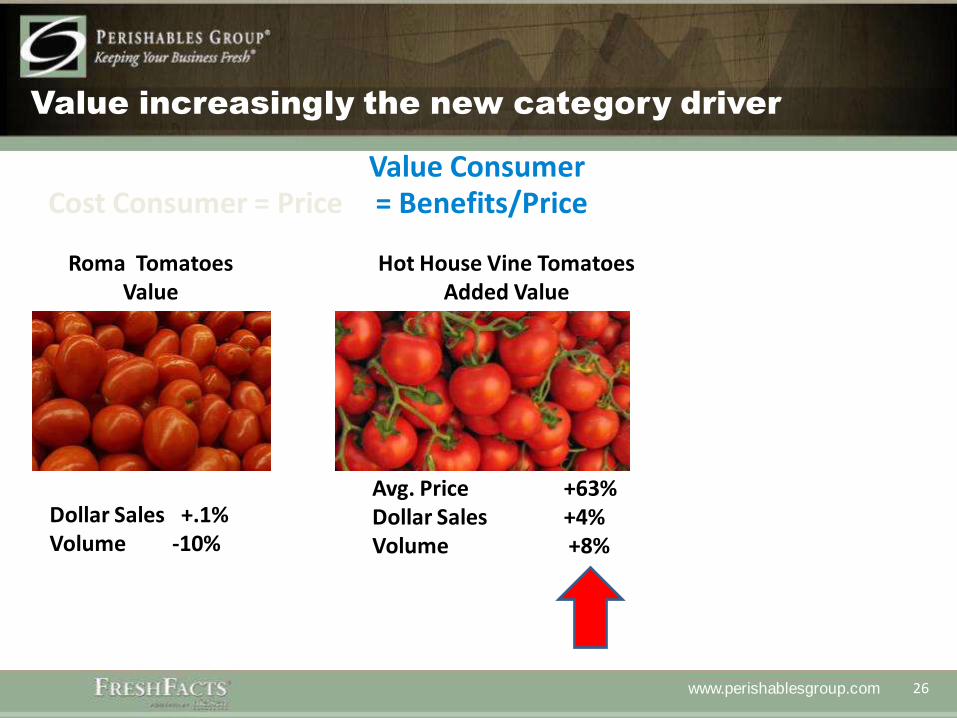
Avg. Price +63% Dollar Sales +4%Volume +8%
Roma TomatoesValue
Hot House Vine TomatoesAdded Value
Snacking TomatoesPremium Value
Avg Price +126%Dollar Sales +10%Volume +5%
Dollar Sales +.1%Volume -10%

www.perishablesgroup.com 25
Cost Consumer = Price Value Consumer = Benefits/Price
Value increasingly the new category driver
Avg Price +121% higherDollar Sales 160%Unit Sales 203%
Dollar Sales 3%Unit Sales 1%
Remaining Yogurt Total Greek Yogurt
Dollar Sales6%
Unit Sales
Avg Price 83% higher Dollar Sales 9%Unit Sales 10%
Mainstream Chocolate Premium Chocolate
Dollar Sales -2%Pound Sales 1%
Avg Price 57% higher Dollar Sales 3%Pound Sales 5%
Pasta Excluding Health Healthy Pasta
Dollar Sales4%
Unit Sales -4%
Avg Price 18% higher Dollar Sales 8%Unit Sales 5%
Mainstream Coffee Premium Coffee Pod Coffee
Avg Price 40% higher Dollar Sales 115%Unit Sales 99%
Mid-Tier Toothpaste
Avg Price +268% higherDollar Sales 20%Unit Sales 20%
Dollar Sales-8%
Unit Sales -3%
Super Premium Toothpaste
Avg. Price +63% Dollar Sales +4%Volume +8%
Roma TomatoesPrice
Hot House Vine TomatoesAdded Value
Snacking TomatoesPremium Value
Avg Price +126%Dollar Sales +10%Volume +5%
Dollar Sales +.1%Volume -10%
www.perishablesgroup.com 26
Cost Consumer = PriceValue Consumer= Benefits/Price
Value increasingly the new category driver
Avg Price +121% higherDollar Sales 160%Unit Sales 203%
Dollar Sales 3%Unit Sales 1%
Remaining Yogurt Total Greek Yogurt
Dollar Sales6%
Unit Sales
Avg Price 83% higher Dollar Sales 9%Unit Sales 10%
Mainstream Chocolate Premium Chocolate
Dollar Sales -2%Pound Sales 1%
Avg Price 57% higher Dollar Sales 3%Pound Sales 5%
Pasta Excluding Health Healthy Pasta
Dollar Sales4%
Unit Sales -4%
Avg Price 18% higher Dollar Sales 8%Unit Sales 5%
Mainstream Coffee Premium Coffee Pod Coffee
Avg Price 40% higher Dollar Sales 115%Unit Sales 99%
Mid-Tier Toothpaste
Avg Price +268% higherDollar Sales 20%Unit Sales 20%
Dollar Sales-8%
Unit Sales -3%
Super Premium Toothpaste
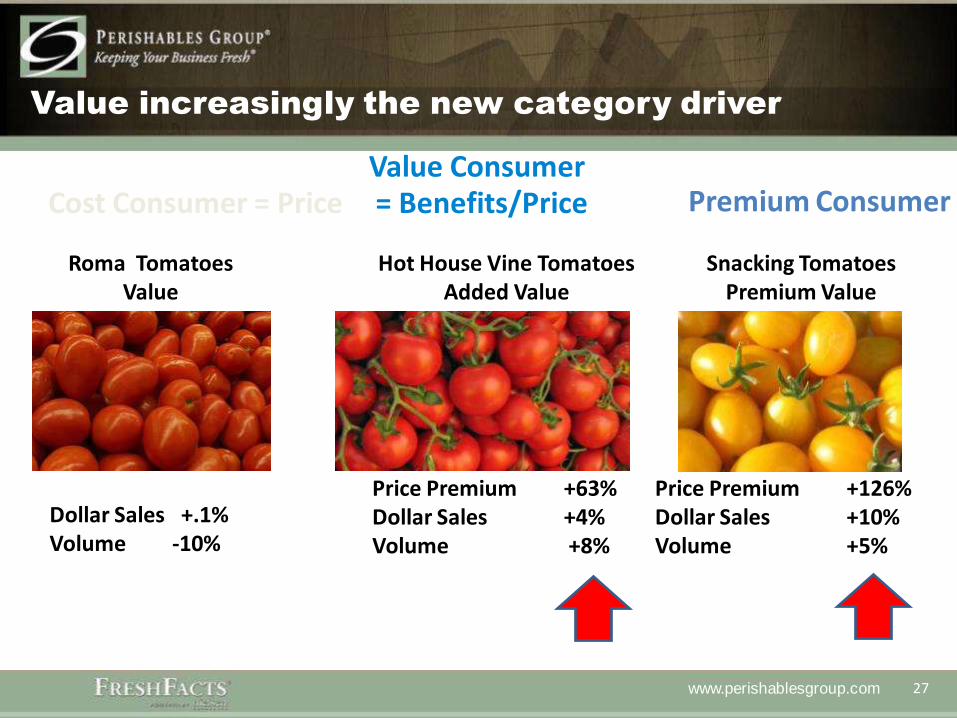
Avg. Price +63% Dollar Sales +4%Volume +8%
Roma TomatoesValue
Hot House Vine TomatoesAdded Value
Snacking TomatoesPremium Value
Avg Price +126%Dollar Sales +10%Volume +5%
Dollar Sales +.1%Volume -10%
www.perishablesgroup.com 27
Cost Consumer = PriceValue Consumer= Benefits/Price
Value increasingly the new category driver
Avg Price +121% higherDollar Sales 160%Unit Sales 203%
Dollar Sales 3%Unit Sales 1%
Remaining Yogurt Total Greek Yogurt
Dollar Sales6%
Unit Sales
Avg Price 83% higher Dollar Sales 9%Unit Sales 10%
Mainstream Chocolate Premium Chocolate
Dollar Sales -2%Pound Sales 1%
Avg Price 57% higher Dollar Sales 3%Pound Sales 5%
Pasta Excluding Health Healthy Pasta
Dollar Sales4%
Unit Sales -4%
Avg Price 18% higher Dollar Sales 8%Unit Sales 5%
Mainstream Coffee Premium Coffee Pod Coffee
Avg Price 40% higher Dollar Sales 115%Unit Sales 99%
Mid-Tier Toothpaste
Avg Price +268% higherDollar Sales 20%Unit Sales 20%
Dollar Sales-8%
Unit Sales -3%
Super Premium Toothpaste
Price Premium +63% Dollar Sales +4%Volume +8%
Roma TomatoesValue
Hot House Vine TomatoesAdded Value
Snacking TomatoesPremium Value
Price Premium +126%Dollar Sales +10%Volume +5%
Dollar Sales +.1%Volume -10%
Premium Consumer

www.perishablesgroup.com 28
Cost Consumer = Price Value Consumer = Benefits/Price
Value increasingly the new category driver
Avg Price +121% higherDollar Sales 160%Unit Sales 203%
Dollar Sales 3%Unit Sales 1%
Remaining Yogurt Total Greek Yogurt
Dollar Sales6%
Unit Sales
Avg Price 83% higher Dollar Sales 9%Unit Sales 10%
Mainstream Chocolate Premium Chocolate
Dollar Sales -2%Pound Sales 1%
Avg Price 57% higher Dollar Sales 3%Pound Sales 5%
Pasta Excluding Health Healthy Pasta
Dollar Sales4%
Unit Sales -4%
Avg Price 18% higher Dollar Sales 8%Unit Sales 5%
Mainstream Coffee Premium Coffee Pod Coffee
Avg Price 40% higher Dollar Sales 115%Unit Sales 99%
Mid-Tier Toothpaste
Avg Price +268% higherDollar Sales 20%Unit Sales 20%
Dollar Sales-8%
Unit Sales -3%
Super Premium Toothpaste
Avg. Price +63% Dollar Sales +4%Volume +8%
Green PeppersValue
Hot House Vine TomatoesAdded Value
Snacking TomatoesPremium Value
Avg Price +126%Dollar Sales +10%Volume +5%
Dollar Sales +3%Volume +4%

www.perishablesgroup.com 29
Cost Consumer = Price Value Consumer = Benefits/Price
Value increasingly the new category driver
Avg Price +121% higherDollar Sales 160%Unit Sales 203%
Dollar Sales 3%Unit Sales 1%
Remaining Yogurt Total Greek Yogurt
Dollar Sales6%
Unit Sales
Avg Price 83% higher Dollar Sales 9%Unit Sales 10%
Mainstream Chocolate Premium Chocolate
Dollar Sales-2%
Pound Sales 1%
Avg Price 57% higher Dollar Sales 3%Pound Sales 5%
Pasta Excluding Health Healthy Pasta
Dollar Sales4%
Unit Sales -4%
Avg Price 18% higher Dollar Sales 8%Unit Sales 5%
Mainstream Coffee Premium Coffee Pod Coffee
Avg Price 40% higher Dollar Sales 115%Unit Sales 99%
Mid-Tier Toothpaste
Avg Price +268% higherDollar Sales 20%Unit Sales 20%
Dollar Sales-8%
Unit Sales -3%
Super Premium Toothpaste
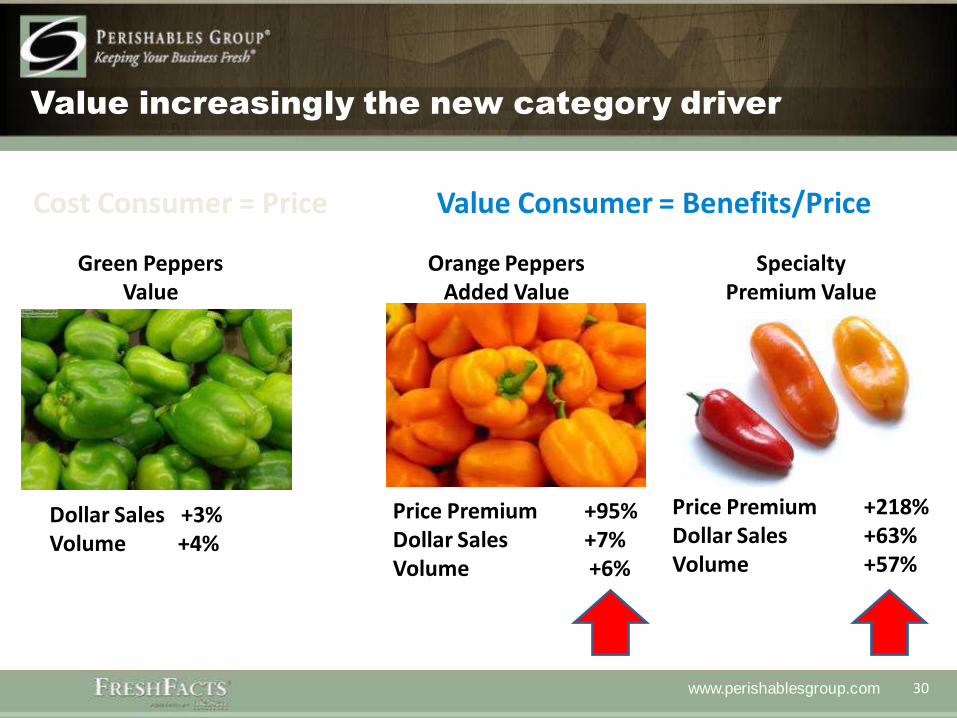
Price Premium +95% Dollar Sales +7%Volume +6%
Green PeppersValue
Orange PeppersAdded Value
Snacking TomatoesPremium Value
Avg Price +126%Dollar Sales +10%Volume +5%
Dollar Sales +3%Volume +4%
www.perishablesgroup.com 30
Cost Consumer = Price Value Consumer = Benefits/Price
Value increasingly the new category driver
Avg Price +121% higherDollar Sales 160%Unit Sales 203%
Dollar Sales 3%Unit Sales 1%
Remaining Yogurt Total Greek Yogurt
Dollar Sales6%
Unit Sales
Avg Price 83% higher Dollar Sales 9%Unit Sales 10%
Mainstream Chocolate Premium Chocolate
Dollar Sales -2%Pound Sales 1%
Avg Price 57% higher Dollar Sales 3%Pound Sales 5%
Pasta Excluding Health Healthy Pasta
Dollar Sales4%
Unit Sales -4%
Avg Price 18% higher Dollar Sales 8%Unit Sales 5%
Mainstream Coffee Premium Coffee Pod Coffee
Avg Price 40% higher Dollar Sales 115%Unit Sales 99%
Mid-Tier Toothpaste
Avg Price +268% higherDollar Sales 20%Unit Sales 20%
Dollar Sales-8%
Unit Sales -3%
Super Premium Toothpaste
Price Premium +95% Dollar Sales +7%Volume +6%
Green PeppersValue
Orange PeppersAdded Value
SpecialtyPremium Value
Price Premium +218%Dollar Sales +63%Volume +57%
Dollar Sales +3%Volume +4%

www.perishablesgroup.com 31
Cost Consumer = Price Value Consumer = Benefits/Price
Value increasingly the new category driver
Avg Price +121% higherDollar Sales 160%Unit Sales 203%
Dollar Sales 3%Unit Sales 1%
Remaining Yogurt Total Greek Yogurt
Dollar Sales6%
Unit Sales
Avg Price 83% higher Dollar Sales 9%Unit Sales 10%
Mainstream Chocolate Premium Chocolate
Dollar Sales -2%Pound Sales 1%
Avg Price 57% higher Dollar Sales 3%Pound Sales 5%
Pasta Excluding Health Healthy Pasta
Dollar Sales4%
Unit Sales -4%
Avg Price 18% higher Dollar Sales 8%Unit Sales 5%
Mainstream Coffee Premium Coffee Pod Coffee
Avg Price 40% higher Dollar Sales 115%Unit Sales 99%
Mid-Tier Toothpaste
Avg Price +268% higherDollar Sales 20%Unit Sales 20%
Dollar Sales-8%
Unit Sales -3%
Super Premium Toothpaste
Price Premium +1% Dollar Sales +13%Volume +9%
Yellow Peaches White Flesh PeachesAdded Value
Strawberry PeachPremium Value
Price Premium +84%Dollar Sales +15%Volume +25%
Dollar Sales +5%Volume -5%

www.perishablesgroup.com 32
Cost Consumer = Price Value Consumer = Benefits/Price
Value increasingly the new category driver
Avg Price +121% higherDollar Sales 160%Unit Sales 203%
Dollar Sales 3%Unit Sales 1%
Remaining Yogurt Total Greek Yogurt
Dollar Sales6%
Unit Sales
Avg Price 83% higher Dollar Sales 9%Unit Sales 10%
Mainstream Chocolate Premium Chocolate
Dollar Sales -2%Pound Sales 1%
Avg Price 57% higher Dollar Sales 3%Pound Sales 5%
Pasta Excluding Health Healthy Pasta
Dollar Sales4%
Unit Sales -4%
Avg Price 18% higher Dollar Sales 8%Unit Sales 5%
Mainstream Coffee Premium Coffee Pod Coffee
Avg Price 40% higher Dollar Sales 115%Unit Sales 99%
Mid-Tier Toothpaste
Avg Price +268% higherDollar Sales 20%Unit Sales 20%
Dollar Sales-8%
Unit Sales -3%
Super Premium Toothpaste
Price Premium +5% Dollar Sales +13%Volume +9%
Yellow Peaches White Flesh PeachesAdded Value
Strawberry PeachPremium Value
Price Premium +84%Dollar Sales +15%Volume +25%
Dollar Sales +5%Volume -5%

www.perishablesgroup.com 33
Cost Consumer = Price Value Consumer = Benefits/Price
Value increasingly the new category driver
Avg Price +121% higherDollar Sales 160%Unit Sales 203%
Dollar Sales 3%Unit Sales 1%
Remaining Yogurt Total Greek Yogurt
Dollar Sales6%
Unit Sales
Avg Price 83% higher Dollar Sales 9%Unit Sales 10%
Mainstream Chocolate Premium Chocolate
Dollar Sales -2%Pound Sales 1%
Avg Price 57% higher Dollar Sales 3%Pound Sales 5%
Pasta Excluding Health Healthy Pasta
Dollar Sales4%
Unit Sales -4%
Avg Price 18% higher Dollar Sales 8%Unit Sales 5%
Mainstream Coffee Premium Coffee Pod Coffee
Avg Price 40% higher Dollar Sales 115%Unit Sales 99%
Mid-Tier Toothpaste
Avg Price +268% higherDollar Sales 20%Unit Sales 20%
Dollar Sales-8%
Unit Sales -3%
Super Premium Toothpaste
Price Premium +5% Dollar Sales +13%Volume +9%
Yellow Peaches White Flesh PeachesAdded Value
Strawberry PeachPremium Value
Price Premium +84%Dollar Sales +15%Volume +25%
Dollar Sales +5%Volume -5%
www.perishablesgroup.com 34
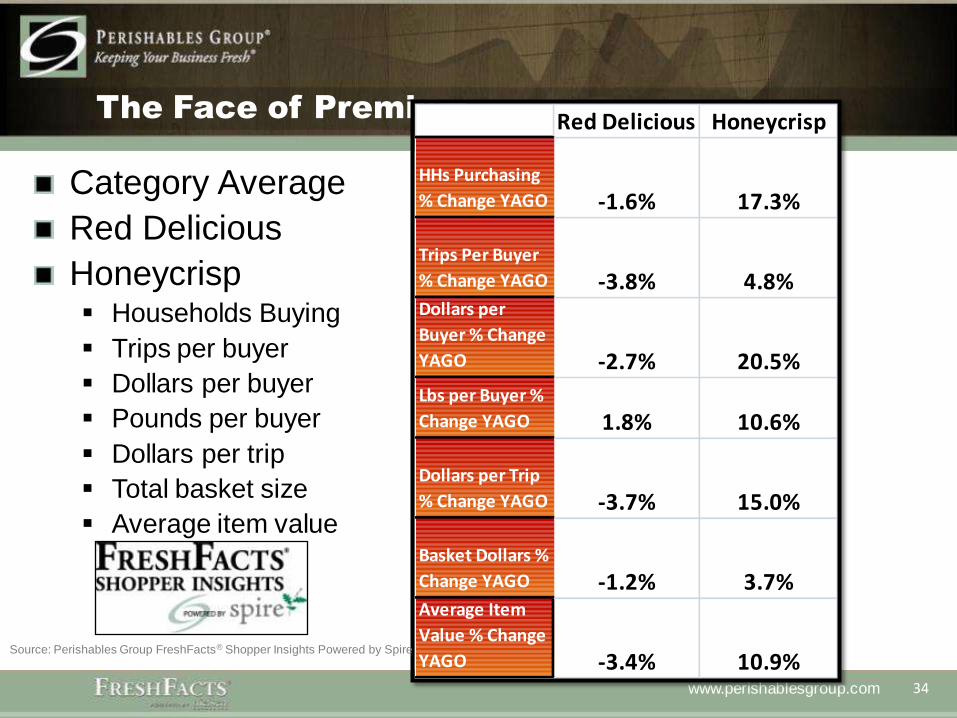
The Face of Premium…
Category Average $1.34
Red Delicious $1.31
Honeycrisp $1.99 Households Buying
Trips per buyer
Dollars per buyer
Pounds per buyer
Dollars per trip
Total basket size
Average item value
Red Delicious Honeycrisp
HHs Purchasing
% Change YAGO -1.6% 17.3%
Trips Per Buyer
% Change YAGO -3.8% 4.8%Dollars per
Buyer % Change
YAGO -2.7% 20.5%
Lbs per Buyer %
Change YAGO 1.8% 10.6%
Dollars per Trip
% Change YAGO -3.7% 15.0%
Basket Dollars %
Change YAGO -1.2% 3.7%Average Item
Value % Change
YAGO -3.4% 10.9%Source: Perishables Group FreshFacts® Shopper Insights Powered by Spire

www.perishablesgroup.com 35
Dollars per Transaction by Variety
$3.37
$3.00
$3.37$3.16
$2.82
$4.15
$2.95
$3.08$3.14 $3.07
$3.26 $3.10
$3.44
$3.10 $2.97
$5.12
$2.97$3.01
$3.41$3.30
Gala Red Delicious
Fuji Granny Smith
Golden Delicious
Honeycrisp McIntosh Braeburn Pink Lady Empire
FreshFacts Shopper Insights - Retailer CompositeAverage Apple Subcategories Dollars per Transaction
52 Weeks Ending Q2 2011
Prior Year Current Year

www.perishablesgroup.com 36
“Value” Often More Powerful Than Price…
Success is about understanding your consumer and
innovating to create value beyond price
Where Price Matters
Where Innovation Pays
TRIED AND TRUE
CONVENIENCEORGANIC
SUBSTITUTION
NEW FLAVORS
COMMODITY ITEMS
www.perishablesgroup.com 37
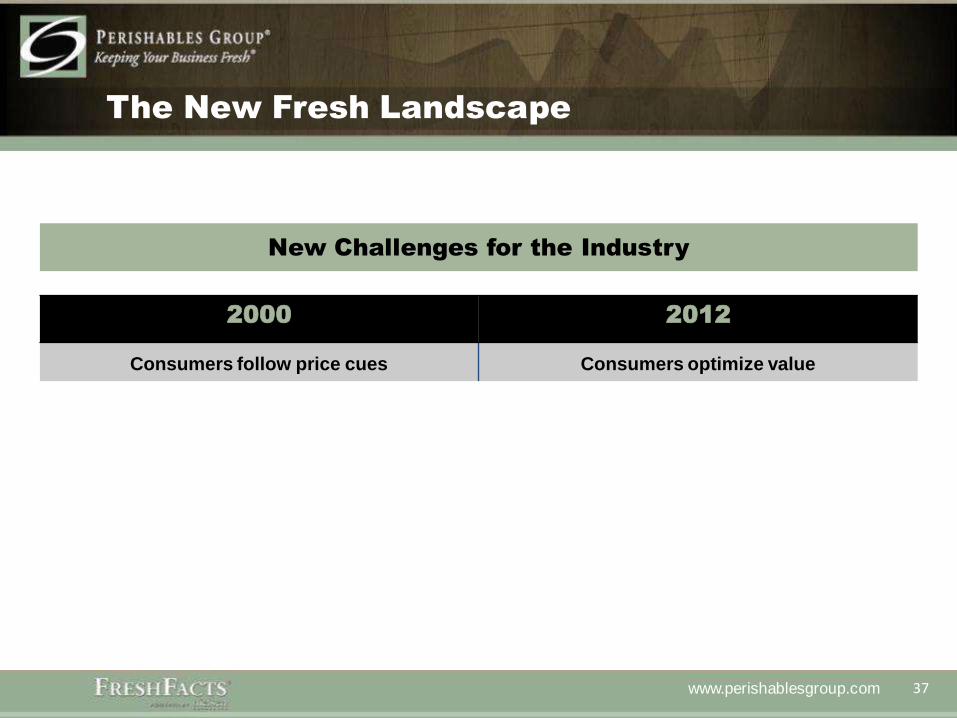
The New Fresh Landscape
2000 2012
Consumers follow price cues Consumers optimize value
Narrow category assortment Complex categories
Commodity focus by retailers Store specific focus
Limited consumer understanding Diversified consumers
Few opportunities for supply-side engagement Retailer-supplier partnership expectations
New Challenges for the Industry

www.perishablesgroup.com 38
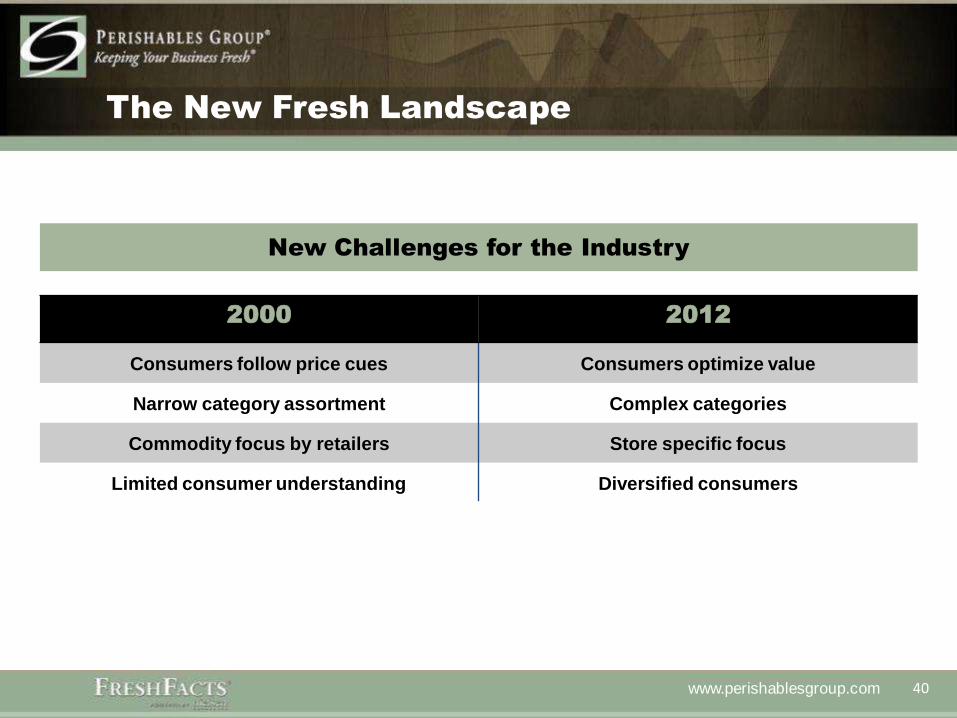
The New Fresh Landscape
2000 2012
Consumers follow price cues Consumers optimize value
Narrow category assortment Complex categories
Commodity focus by retailers Store specific focus
Limited consumer understanding Diversified consumers
Few opportunities for supply-side engagement Retailer-supplier partnership expectations
New Challenges for the Industry

www.perishablesgroup.com 39
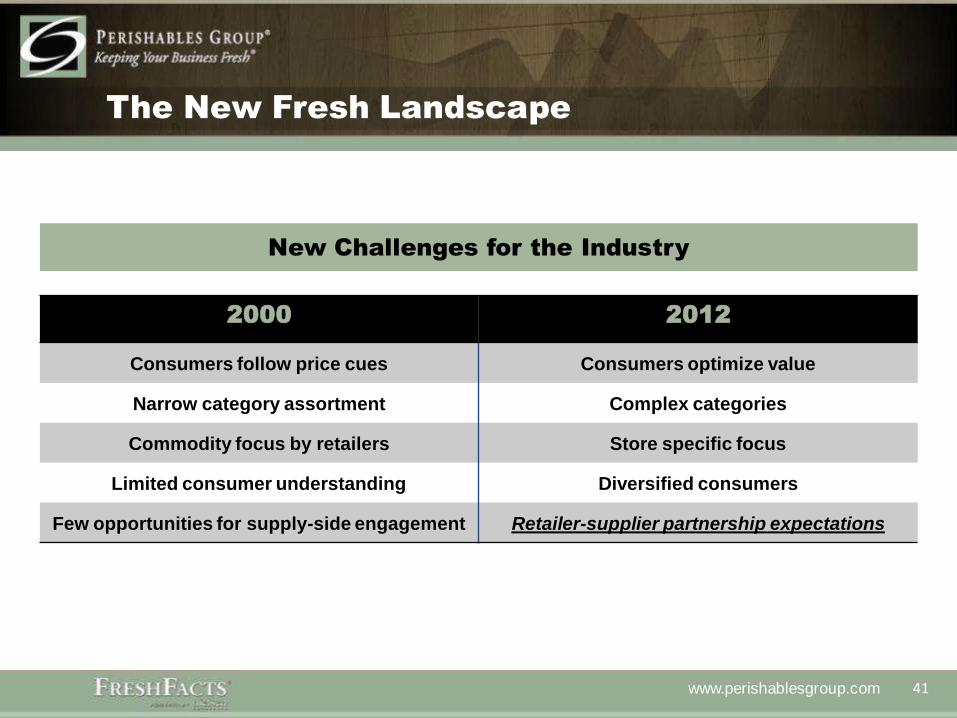
The New Fresh Landscape
2000 2012
Consumers follow price cues Consumers optimize value
Narrow category assortment Complex categories
Commodity focus by retailers Store specific focus
Limited consumer understanding Diversified consumers
Few opportunities for supply-side engagement Retailer-supplier partnership expectations
New Challenges for the Industry
www.perishablesgroup.com 40
The New Fresh Landscape
2000 2012
Consumers follow price cues Consumers optimize value
Narrow category assortment Complex categories
Commodity focus by retailers Store specific focus
Limited consumer understanding Diversified consumers
Few opportunities for supply-side engagement Retailer-supplier partnership expectations
New Challenges for the Industry
www.perishablesgroup.com 41
The New Fresh Landscape
2000 2012
Consumers follow price cues Consumers optimize value
Narrow category assortment Complex categories
Commodity focus by retailers Store specific focus
Limited consumer understanding Diversified consumers
Few opportunities for supply-side engagement Retailer-supplier partnership expectations
New Challenges for the Industry

www.perishablesgroup.com
42
UNDERSTANDING PEACH
PERFORMANCE AT RETAIL

www.perishablesgroup.com 43
Q3, 2011 Performance Total
Peach dollars increased due to price increases while
volume declined
Source: Perishables Group FreshFacts® Powered by Nielsen, Q3, 2011 vs. YAGO
Product Dollars %
Change vs
YAGO
Volume %
Change vs
YAGO
Average
Retail
Average Retail %
Change vs YAGO
Stone Fruits 5.6% -0.4% $1.53 6.0%
Peaches 6.2% -3.6% $1.45 10.2%
Nectarines 7.0% 3.9% $1.54 3.0%
Plums 1.5% 2.1% $1.64 -0.6%
www.perishablesgroup.com 44
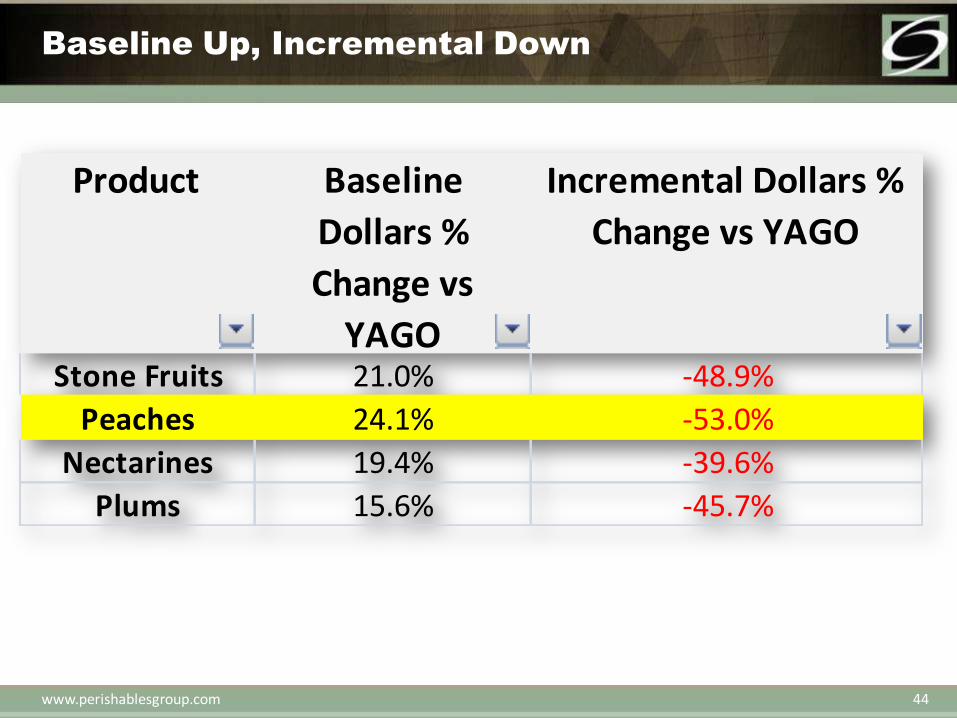
Baseline Up, Incremental Down
Product Baseline
Dollars %
Change vs
YAGO
Incremental Dollars %
Change vs YAGO
Stone Fruits 21.0% -48.9%
Peaches 24.1% -53.0%
Nectarines 19.4% -39.6%
Plums 15.6% -45.7%

www.perishablesgroup.com 45
Promotions Lose Impact
Product Dollars % on
Promotion
Dollars % on
Promotion YAGO
Dollars % Lift
on Promotion
Dollars % Lift
on Promotion
YAGO
Stone Fruits 37.7% 44.9% 41.2% 66.3%
Peaches 39.1% 47.1% 41.4% 69.2%
Nectarines 36.8% 44.1% 39.5% 59.5%
Plums 37.3% 41.9% 45.5% 74.0%
Very Similar Performance in Volume

www.perishablesgroup.com 46
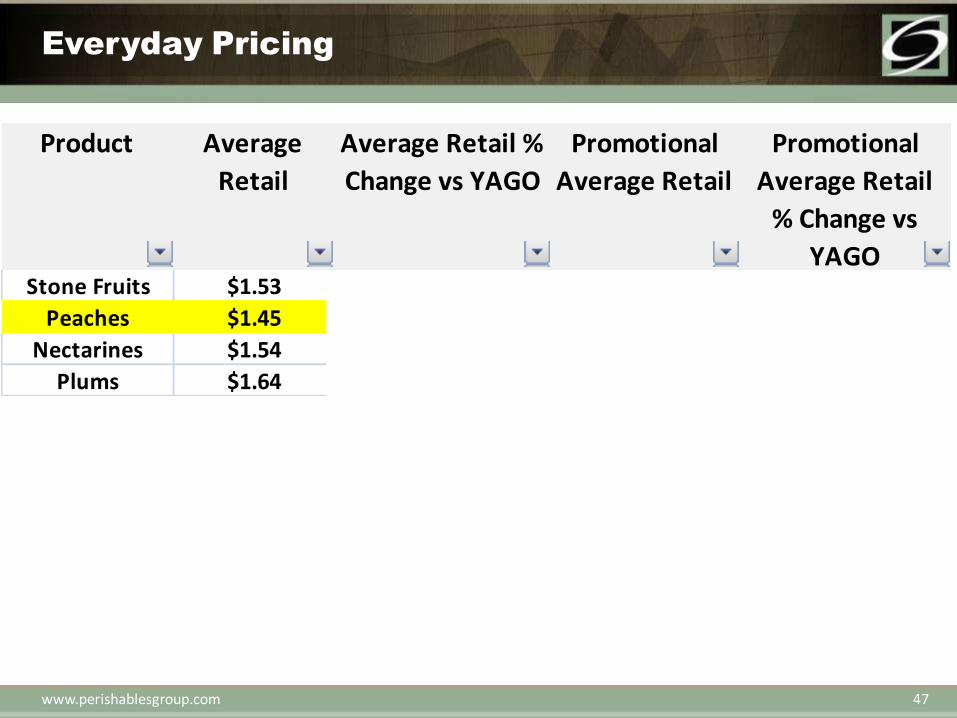
Everyday Pricing
Product Average
Retail
Average Retail %
Change vs YAGO
Promotional
Average Retail
Promotional
Average Retail
% Change vs
YAGOStone Fruits $1.53 6.0% $1.27 3.2%
Peaches $1.45 10.2% $1.19 5.3%
Nectarines $1.54 3.0% $1.28 2.0%
Plums $1.64 -0.6% $1.42 -1.5%
www.perishablesgroup.com 47
Everyday Pricing
Product Average
Retail
Average Retail %
Change vs YAGO
Promotional
Average Retail
Promotional
Average Retail
% Change vs
YAGOStone Fruits $1.53 6.0% $1.27 3.2%
Peaches $1.45 10.2% $1.19 5.3%
Nectarines $1.54 3.0% $1.28 2.0%
Plums $1.64 -0.6% $1.42 -1.5%

www.perishablesgroup.com 48
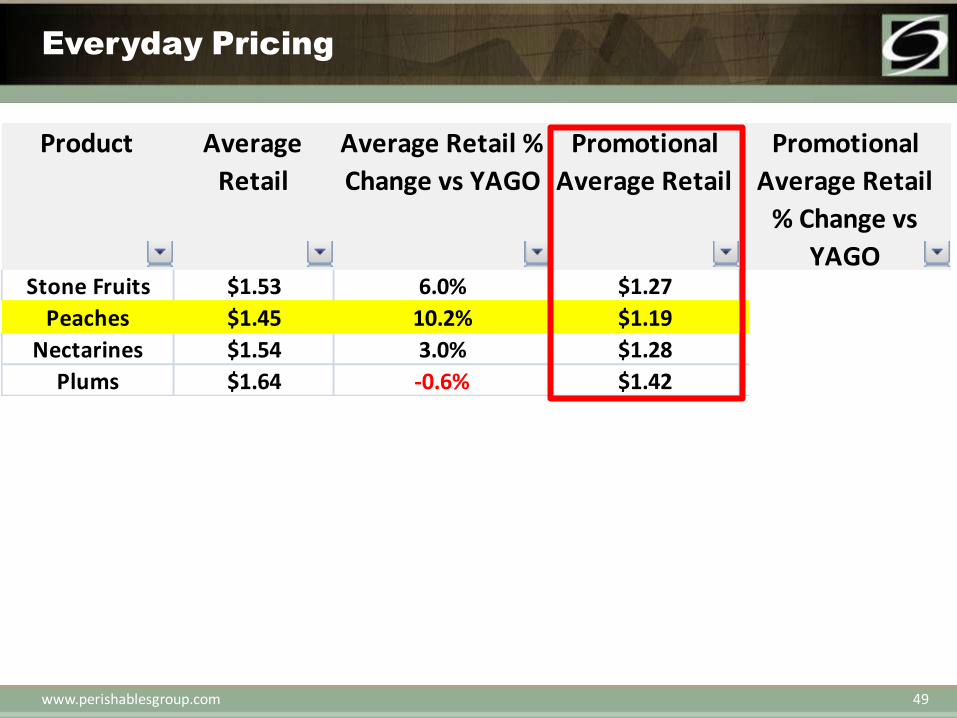
Everyday Pricing
Product Average
Retail
Average Retail %
Change vs YAGO
Promotional
Average Retail
Promotional
Average Retail
% Change vs
YAGOStone Fruits $1.53 6.0% $1.27 3.2%
Peaches $1.45 10.2% $1.19 5.3%
Nectarines $1.54 3.0% $1.28 2.0%
Plums $1.64 -0.6% $1.42 -1.5%
www.perishablesgroup.com 49
Everyday Pricing
Product Average
Retail
Average Retail %
Change vs YAGO
Promotional
Average Retail
Promotional
Average Retail
% Change vs
YAGOStone Fruits $1.53 6.0% $1.27 3.2%
Peaches $1.45 10.2% $1.19 5.3%
Nectarines $1.54 3.0% $1.28 2.0%
Plums $1.64 -0.6% $1.42 -1.5%

www.perishablesgroup.com 50
Everyday Pricing
Product Average
Retail
Average Retail %
Change vs YAGO
Promotional
Average Retail
Promotional
Average Retail
% Change vs
YAGOStone Fruits $1.53 6.0% $1.27 3.2%
Peaches $1.45 10.2% $1.19 5.3%
Nectarines $1.54 3.0% $1.28 2.0%
Plums $1.64 -0.6% $1.42 -1.5%
www.perishablesgroup.com 51
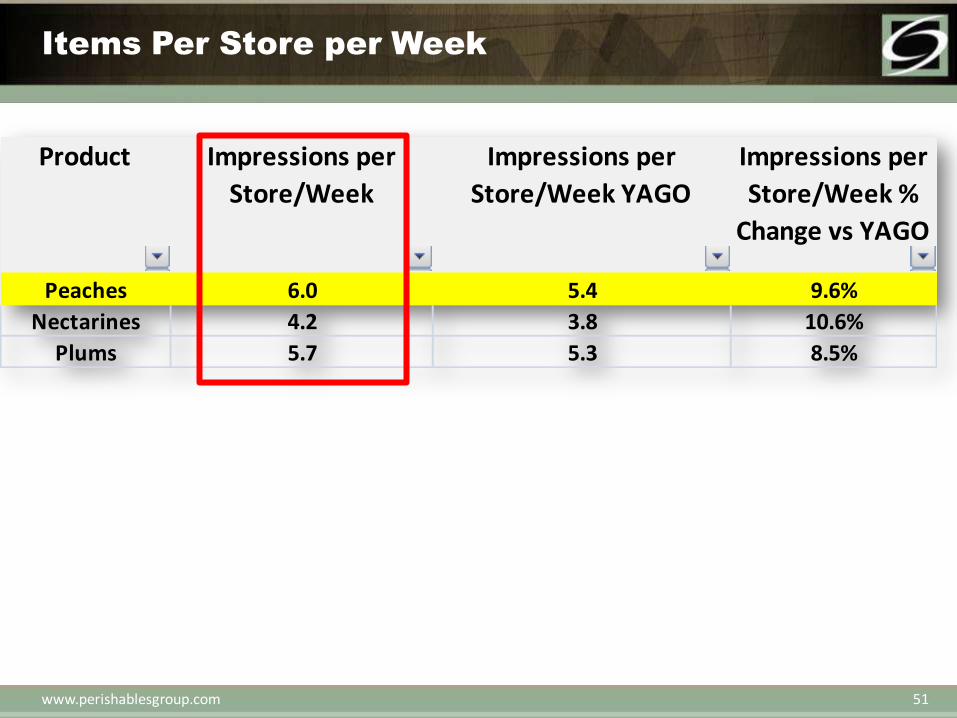
Items Per Store per Week
Product Impressions per
Store/Week
Impressions per
Store/Week YAGO
Impressions per
Store/Week %
Change vs YAGO
Peaches 6.0 5.4 9.6%
Nectarines 4.2 3.8 10.6%
Plums 5.7 5.3 8.5%
www.perishablesgroup.com 52
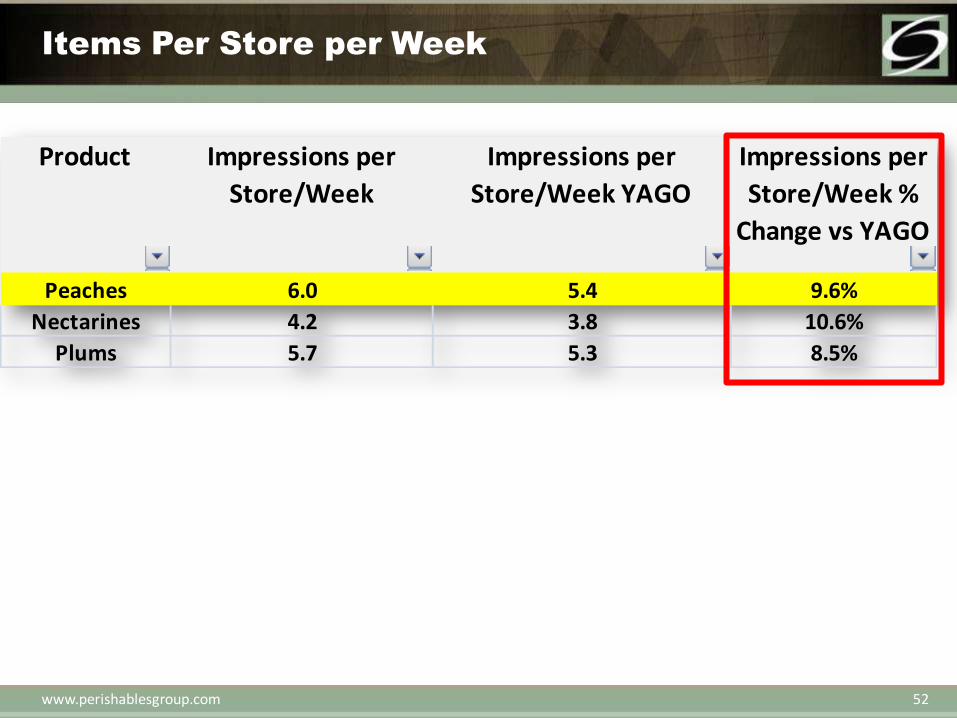
Items Per Store per Week
Product Impressions per
Store/Week
Impressions per
Store/Week YAGO
Impressions per
Store/Week %
Change vs YAGO
Peaches 6.0 5.4 9.6%
Nectarines 4.2 3.8 10.6%
Plums 5.7 5.3 8.5%
www.perishablesgroup.com 53
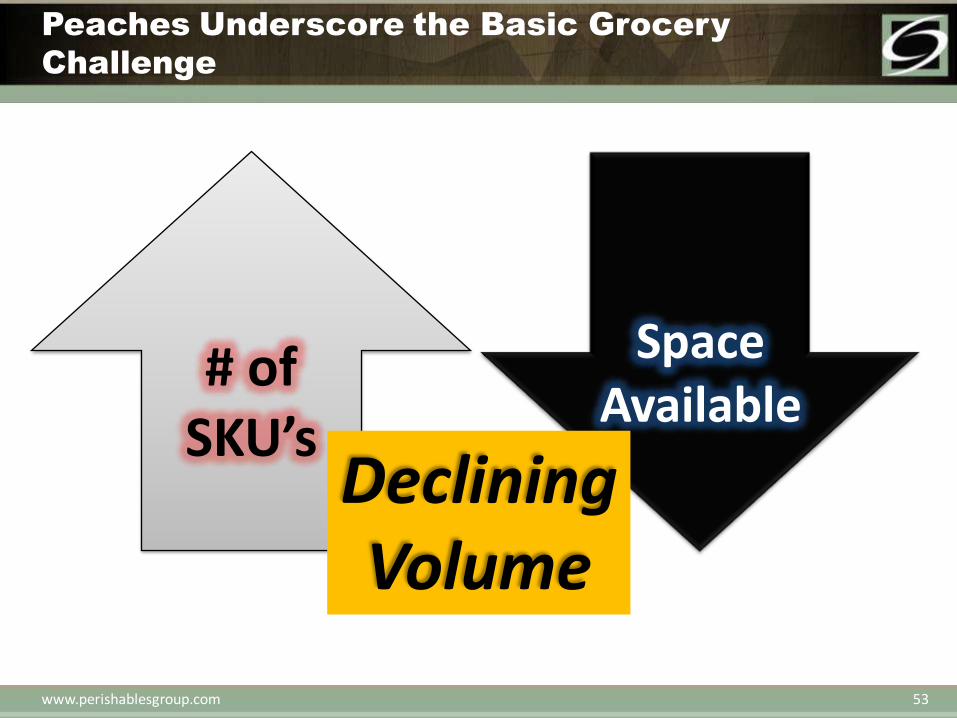
Peaches Underscore the Basic Grocery
Challenge
# of SKU’s
Space Available
Declining Volume

www.perishablesgroup.com 54
Consumer Purchase Dynamics
FreshFacts Powered by Spire, 2011
Product Household
Penetration
Trips per Buyer Multiple Item
Baskets
Peaches 36.1% 2.7 15.2%
Pears 28.8% 3.3 3.5%
Cherries 26.7% 2.1 1.0%
www.perishablesgroup.com 55
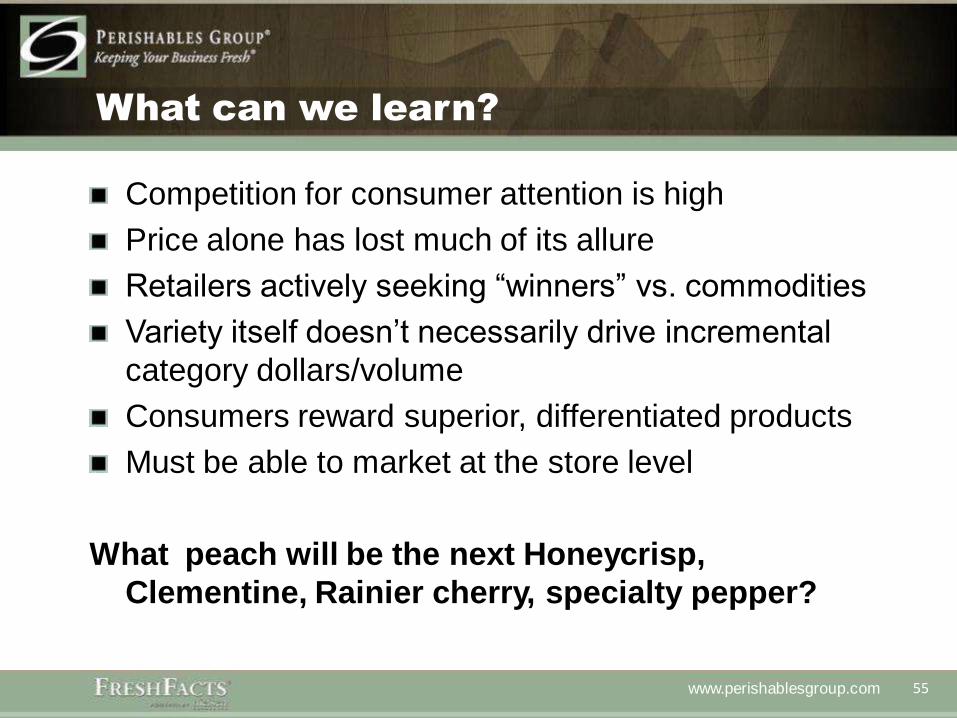
What can we learn?
Competition for consumer attention is high
Price alone has lost much of its allure
Retailers actively seeking “winners” vs. commodities
Variety itself doesn’t necessarily drive incremental
category dollars/volume
Consumers reward superior, differentiated products
Must be able to market at the store level
What peach will be the next Honeycrisp,
Clementine, Rainier cherry, specialty pepper?
www.perishablesgroup.com 56
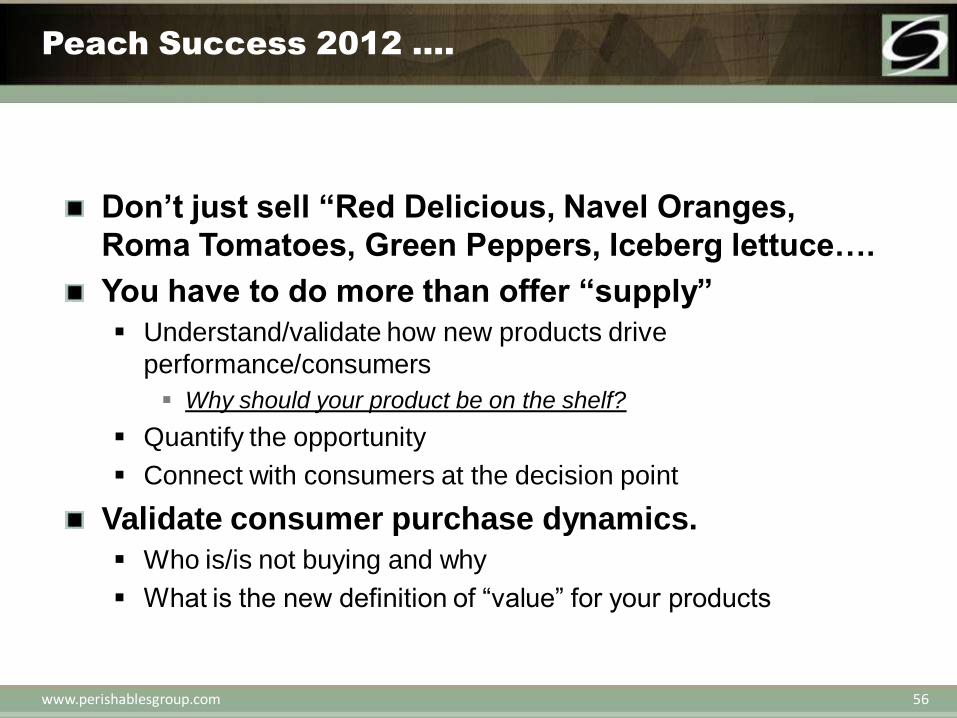
Peach Success 2012 ….
Don’t just sell “Red Delicious, Navel Oranges,
Roma Tomatoes, Green Peppers, Iceberg lettuce….
You have to do more than offer “supply”
Understand/validate how new products drive
performance/consumers
Why should your product be on the shelf?
Quantify the opportunity
Connect with consumers at the decision point
Validate consumer purchase dynamics.
Who is/is not buying and why
What is the new definition of “value” for your products

www.perishablesgroup.com 57
Thank you!
Contact Steve Lutz at Nielsen Perishables Group:
509.884.2616
www.perishablesgroup.com