market segmentation of visitors to aardklop national arts
TRANSCRIPT

Market Segmentation of Visitors to Aardklop National Arts Festival
A Comparison of Two Methods
Karin Botha
12298042
Dissertation submitted for the degree Magister Artium in Tourism
at the North West University
Study leader Prof Dr E Slabbert
Assistent study leaders Dr R Rossouw amp Mr P Viviers
Potchefstroom
2009
FINANCIAL ASSISTANCE
Financial assistance from the NRF (National Research Foundation) is gratefully acknowledged
Statements and suggestions made in this study are those of the author and should not be regarded
as those of the NRF
II
ACKNOWLEDGEMENTS
The completion of this study is a personal milestone accomplished and would not have been
possible without the prayers and assistance of the following people during this challenging time I
am truly grateful to them
bull My Heavenly Father for giving me the strength to complete this study and revealing his
presence to me throughout the process
bull My husband Franko for his support and words of encouragement especially during the most
testing times My two children Kayla and Nadine for their patience and understanding
bull My parents and grandfather for their support encouragement and prayers
bull Prof Elmarie Siabbert for her incredible commitment and mentorship as study leader Her
encouragement support and guidance is greatly appreciated She is truly an inspiration
bull My assistant study leaders Dr Riaan Rossouw for his expertise assistance and guidance with
the methodology and Mr Pierre-Andre Viviers for his support and advice throughout the study
bull Dr Suria Ellis and Prof Jan du Plessis from the Statistical Consultation Services at the Northshy
West University for her expertise and assistance
bull Dr Amanda van der Merwe for the language editing of this study and Prof Casper Lessing for
the editing of the references
bull The staff at the Institute for Tourism and Leisure Studies at the North West University
especially Martinette and Lindy for their friendship advice and encouragement
bull The fieldworkers and visitors to Aardklop for their assistance and co-operation with the survey
Without them this study would not have been possible
You1ve got to get up ever9 morning with pound)eterminatiol1
if 90ure going to go to bepound) with satisfactiol1
~ George Loyimer ~
III
ABSTRACT
MARKET SEGMENTATION OF VISITORS TO AARDKLOP NATIONAL ARTS FESTIVAL
A COMPARISON OF TWO METHODS
The Aardklop National Arts Festival is one of the three largest arts festivals in South Africa Arts
festivals such as Aardklop are also one of the most rapidly growing events tourism segments It
sustains different forms of art contributes to the livelihood of artists stimulates the growth of
regional and local economies and promotes specific destinations Destinations realise the benefits
associated with arts festivals thus there has been a remarkable increase in the annual number of
festivals hosted by different destinations However the competition in the festival market has
important implications for all South African artscultural festivals In order for a festival to be
sustainable and to reap the continuous economic contribution and benefits that festivals offer the
importance of effectivestrategic marketing of the festival must be realised An essential step
towards strategic market planning is market segmentation It is an effective tool to divide existing
and potential markets into homogenous groupssegments based on meaningful characteristics
This assists marketersorganisers of the festival to understand the needs and preferences of these
segments and to adjust the festival productprogramme accordingly A variety of methods is
available for market segmentation Two such methods are correspondence analysis and
expenditure-based segmentation
The primary goal of the study was to apply and compare these two market segmentation methods
of visitors to Aardklop National Arts Festival A literature study was undertaken to analyse arts
festivals market segmentation and specific market segmentation methods and an empirical study
was undertaken to obtain the relevant data for analysis Surveys were conducted at the festival and
data obtained from 2005 to 2008 was used Questionnaires were distributed randomly during the 5shy
day festival period and a total of 1 671 questionnaires were completed In order to achieve the
goal the study was divided into 2 articles
In Article 1 a correspondence analysis was applied to visualise the relationship between the age of
respondents and other variables Results confirmed the existence of significant differences in socioshy
demographic and behavioural variablescharacteristics between different age groups of visitors to
IV
Aardklop Older visitors (46 years and older) are associated with higher spending and attend
showsproductions such as drama classical music cabaret and visual art and exhibitions They are
also more likely to hear about Aardklop in the written media such as magazines newspapers
newsletters and e-mail to stay for shorter periods of time and to come from the Gauteng and Free
State provinces Younger visitors (aged 18 to 25) are associated with the lowest spending and rely
on word-of-mouth as a source of information through which they hear about Aardklop They are
more likely to come from the North West province to attend rock showsconcerts and to attend the
festival for longer periods of time These results rendered strategic insights regarding marketing
since a market profile of different age groups of visitors can be formulated and the festival
productprogramme can be developed according to their needs and preferences As a result the
current market can be maintained and emerging markets can be identified and targeted resulting in
long-term growth and sustainability of the festival
In Article 2 K-means clustering was done to group members together based on their similarity with
regard to spending patternsbehaviour so that these clusters could be used in the ANOVA analysis
The ANOVA analysis was applied by using the identified clusters to do expenditure-based
segmentation In the results 4 expenditure segments were identified and the analysis confirmed
the existence of significant differences in socia-demographic and behavioural
variablescharacteristics between these different expenditure groups among Aardklop visitors The
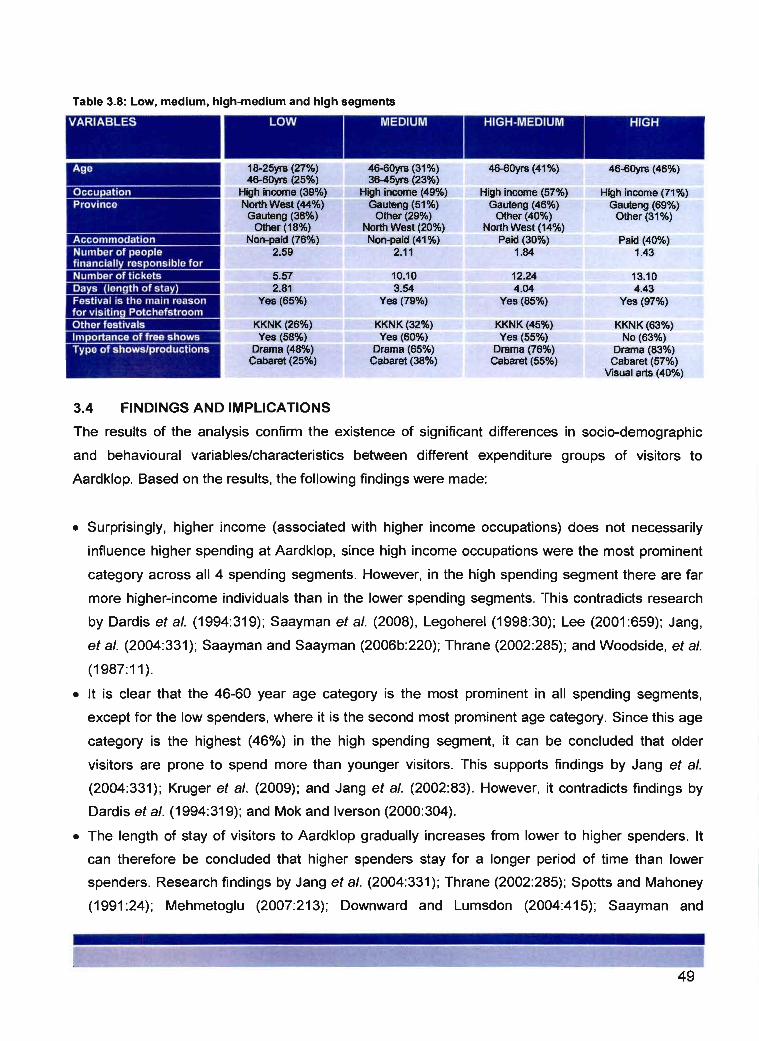
high spenders are between the ages of 46 and 60 years stay for longer periods of time and travel
longer distances to the festival They have attended other festivals as well in the past and their
main reason for travelling to Potchefstroom is to attend Aardklop These visitors prefer to attend
drama and cabaret showsproductions and they are likely to travel from Gauteng Based on these
aspects the high spenders can be differentiated from other spending segments This is beneficial
to the marketersorganisers of Aardklop since it assists in maintaining the high spending market by
fulfilling their needspreferences while also motivating them to spend more on ticketed
showsproductions The untapped spending potential in the other spending segments were also
identified along with detailed descriptions of these segments Marketersorganisers of Aardklop
can therefore also target these segments through customised packages which can eventually
convert members in these spending segments to higher spenders thereby expanding the highshy
spending segment This will maximise the economic impact of Aardklop and will result in the
competitiveness sustainability and further growth of the festival
The correspondence analysiS as a market segmentation method although exploratory is a
sophisticated technique that gives a powerful and comprehensive visual representation of the
v
relationship I possible associations between variables and respondent age groups However this
method does not always provide a detailed profile of each age category Expenditure-based
segmentation as a market segmentation method offers a good range of information and has been
found to provide a more detailed profile of each spending segment as opposed to the profiles
identified in the correspondence analysis However since both these methods can be used for
effective segmentation of the Aardklop market it is important to consider what exactly needs to be
accomplished in the marketing research so that the more appropriate market segmentation method
may be selected
Key words Aardklop National Arts Festival FestivalArts festival Correspondence analysis
Expenditure-based segmentation Market segmentation Marketing
VI
OPSOMMING
MARKSEGMENTERING VAN BESOEKERS AAN AARDKLOP NASIONALE KUNSTEFEES
n VERGELYKING VAN lWEE METODES
Die Aardklop Nasionale Kunstefees is een van die drie grootste feeste in Suid-Afrika Kunstefeeste
5005 Aardklop is een van die vinnigste groeiende geleentheidstoerismesegmente Dit hou
verskillende kunsvorme in stand dra by tot die oorlewing van kunstenaars stimuleer die groei van
streeks- en plaaslike ekonomiee en bevorder spesifieke bestemmings Omdat bestemmings
bewus is van die voordele wat kunstefeeste inhou was daar die afgelope tyd n groot toename in
die aantal feeste wat deur verskillende bestemmings aangebied word Die kompetisie in die
feesmark het egter belangrike implikasies vir aile Suid-Afrikaanse kunste-kultuurfeeste Vir n fees
om volhoubaar te wees en vir bestemmings om te baat by die voortgesette ekonomiese bydrae en
voordele wat die feeste bied moet die belangrikheid van effektiewestrategiese bemarking van die
fees begryp word n Belangrike stap ten opsigte van strategiese markbeplanning is
marksegmentering Dit is n doeltreffende instrument om bestaande en potensiele markte te verdeel
in homogene groepesegmente gegrond op betekenisvolle kenmerke Dit help die fees se
bemarkersorganiseerders om die behoeftes en voorkeure van hierdie segmente te begryp en om
die feesprodukl-program dienooreenkomstig aan te pas n Verskeidenheid metodes is beskikbaar
vir marksegmentering Twee hiervan is korrespondensie-analise en uitgawegebaseerde
segmentering
Die hoofdoel van die studie was om hierdie twee metodes van marksegmentering toe te pas en met
mekaar te vergelyk ten opsigte van besoekers aan die Aardklop Nasionale Kunstefees n
Literatuurstudie is gedoen om kunstefeeste marksegmentering en spesifieke metodes van
marksegmentering te ontleed en n empiriese studie is onderneem om die relevante data vir
ontleding te bekom Opnames is by die fees gedoen en data van 2005 tot 2008 is gebruik
Vraelyste is ewekansig uitgedeel tydens die 5-dae-feesperiode en n totaal van 1 671 vraelyste is
voltooi Om die doel te bereik is die studie in 2 artikels verdeel
In Artikel 1 is In korrespondensie-analise toegepas om die verhouding tussen die ouderdom van
respondente en ander veranderJikes te visualiseer Resultate het bevestig dat daar beduidende
VII
verskitle is in sosiodemografiese en gedragsveranderlikes-kenmerke tussen verskillende
ouderdomsgroepe onder Aardklopfeesgangers Ouer feesgangers (46 jaar en ouer) word
geassosieer met groter besteding en woon vertoningsproduksies so os drama klassieke musiek
kabaret en visuele kunste en uitstallings by Hulle is ook meer geneig om oor Aardklop te hoor in
die geskrewe media soos tydskrifte koerante nuusbriewe en e-pos om vir korter periodes te bly
en om van Gauteng en die Vrystaat te kom Jonger besoekers (18 tot 25 jaar oud) word
geassosieer met die minste besteding en maak staat op mondelinge aanbevelings as n bron van
inligting oor inligting Hulle is meer geneig om van die Noordwesprovinsie te kom om rockshy
vertonings-konserte by te woon en om die fees vir langer periodes by te woon Hierdie resultate
het strategiese insigte gebied ten opsigte van bemarking omdat n markprofiel geformuleer kan
word vir verskillende ouderdomsgroepe onder besoekers en die feesprodukl-program volgens
hulle behoeftes en voorkeure aangepas kan word Gevolglik kan die huidige mark in stand gehou
word terwyl opkomende markte terselfdertyd geidentifiseer en geteiken kan word om
langtermyngroei en volhoubaarheid van die fees te verseker
In Artikel 2 is K-gemiddelde-groepering toegepas om lede saam te groepeer gegrond op hulle
ooreenkomste ten opsigte van bestedingspatrone-gedrag sodat hierdie groepe in die ANOVAshy
analise gebruik kan word Die AN OVA-analise is toegepas deur gebruik te maak van die
gerdentifiseerde groepe om bestedingsgebaseerde segmentering te doen In die resultate is 4
bestedingsegmente geidentifiseer en die analise het bevestig dat daar beduidende verskille
bestaan ten opsigte van sosiodemografiese en gedragsveranderlikes-kenmerke tussen hierdie
verskillende bestedingsgroepe onder Aardklopfeesgangers Die groot besteders is tussen 46 en 60
jaar oud bly vir langer periodes en reis groter afstande na die fees toe Hulle het in die verlede ook
ander feeste bygewoon en hulle hoofrede vir die reis na Potchefstroom is om Aardklop by te woon
Hierdie besoekers verkies om drama- en kabaretvertonings-produksies by te woon en hulle kom
meestal van Gauteng Op grond van hierdie aspekte kan die groot besteders gedifferensieer word
van ander bestedingsegmente Hierdie kennis kan Aardklopbemarkers-organiseerders help om die
groot-bestedingsmark in stand te hou deur hulle behoeftesvoorkeure te bevredig terwyl hulle ook
gemotiveer word om meer te bestee aan betaalde vertoningsproduksies Die onontginde
bestedingspotensiaal in die ander bestedingsegmente is ook geidentifiseer en gedetailleerde
beskrywings van hierdie segmente is gegee Aardklop se bemarkersorganiseerders kan daarom
ook hierdie segmente teiken deur middel van aangepaste pakkette wat uiteindelik lede in hierdie
bestedingsegmente kan beweeg om groter besteders te word en sodoende die grootbestedingshy
segment uit te brei Dit sal die ekonomiese impak van Aardklop maksimeer en sal lei tot
mededingendheid volhoubaarheid en verdere groei van die fees
VIII
Alhoewel die korrespondensie-analise as n marksegmenteringsmetode ondersoekend van aard is
is dit n gesofistikeerde tegniek wat n kragtige en omvattende visuele uitbeelding bied van die
verhouding I moontlike assosiasies tussen veranderlikes en ouderdomsgroepe van respondente
Hierdie metode bied egter nie altyd n gedetailleerde profiel van elke ouderdomskategorie nie
8estedingsgebaseerde segmentering as n marksegmenteringsmetode bied n goeie reeks inligting
en daar is bevind dat dit n meer gedetailleerde profiel van elke bestedingsegment beskikbaar
maak teenoor die profiele wat in die korrespondensie-analise gemiddotidentifiseer word Omdat albei
metodes egter gebruik kan word vir doeltreffende segmentering van die Aardklopmark is dit
belangrik om te bepaal presies wat bemarkingsnavorsing moet bereik sod at die mees geskikte
marksegmenteringsmetode gekies kan word
Sleutelwoorde Aardklop Nasionae Kunstefees Fees Kunstefees Korrespondensie-analise
Bestedingsgebaseerde segmentering Marksegmentering Bemarking
IX
1
TABLE OF CONTENTS
CHAPTER 1 Introduction problem statement objectives and method of research
11 INTRODUCTION
12 PROBLEM STATEMENT
13 GOALS AND OBJECTIVES OF THE STUDY
131 Goal
132 Objectives
14 METHOD OF RESEARCH
1 41 Literature Study
142 Empirical Study (Survey)
1421 Research design and method of collecting data
1422 Development of the questionnaire
1423 Sampling population
1424 Sampling method
1425 Data analysis
a Correspondence Analysis
b K-means Clustering
c ANOVA analysis (Analysis of Variance)
15 DEFINING CONCEPTS
151 Aardklop National Arts Festival
152 FestivalArts festivals
153 Market segmentation
16 CHAPTER CLASSIFICATION
CHAPTER 2 Correspondence analysis of visitors to Aardklop National Arts Festival
21
22
23
231
232
233
234
INTRODUCTION
LITERATURE REVIEW
METHOD OF RESEARCH
The questionnaire
The Samples
The Method
Results
1
2
7
7
7
8
8
8
8
8
9
9
10
10
11
11
11
11
12
12
12
14
14
15
19
20
20
21
22
x
2341 General profile of festival respondents 22
2342 Cross-tabulations and accompanying correspondence biplots 23
24 FINDINGS AND IMPLICATIONS 30
25 CONCLUSIONS 32
CHAPTER 3 Expenditure-based segmentation of visitors to Aardklop National Arts 34
Festival
31 INTRODUCTION 34
32 LITERATURE REVIEW 36
33 METHOD OF RESEARCH 39
331 The questionnaire 40
332 The Samples 40
333 The Method 42
334 Results 43
3341 General profile of festival respondents 43
3342 Expenditure clusters 44
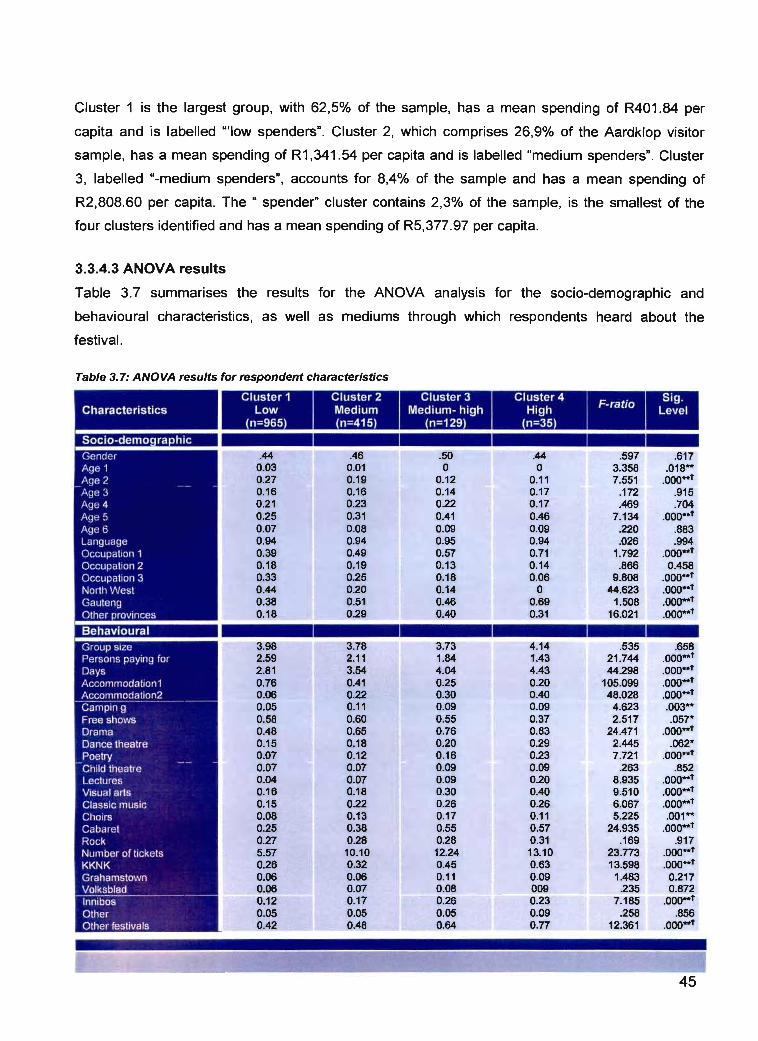
3343 ANOVA results 45
34 FINDINGS AND IMPLICATIONS 49
35 CONCLUSIONS 52
CHAPTER 4 Conclusions and Recommendations 54
41 INTRODUCTION 54
42 CONCLUSIONS 55
421 CONCLUSIONS REGARDING THE CORRESPONDENCE ANALYSIS OF 55
VISITORS TO AARDKLOP
422 CONCLUSIONS REGARDING THE EXPENDITURE-BASED SEGMENTATION OF 57
VISITORS TO AARDKLOP
423 CONCLUSIONS REGARDING THE COMPARISON OF THE APPLICATION OF 59
THE TWO SEGMENTATION METHODS
43 RECOMMENDATIONS 61
431 GENERAL RECOMMENDATIONS 61
432 RECOMMENDATIONS FOR FURTHER RESEARCH 61
REFERENCES 63
XI
LIST OF TABLES
CHAPTER 1 Introduction problem statement objectives and method of research
Table 11 Overview of economic impact and profile of Aardklop 2005-2008 5
CHAPTER 2 Correspondence analysis of visitors to Aardklop National Arts Festival
Table 21 Characteristics distinguishing older consumers from younger consumers 17
Table 22 Survey summary 20
Table 23 Festival respondent profile 22
Table 24 Age category by showsproductions attended 23
Table 25 Age category by mediums 24
Table 26 Age category by number of people financially responsible for 25
Table 27 Age category by spending category 26
Table 28 Age category by number of days attended the festival 27
Table 29 Age category by province of origin 28
Table 210 Summary of the age categories by variables 29
CHAPTER 3 Expenditure-based segmentation of visitors to Aardklop National Arts
Festival
Table 31 Overview of economic impact and profile of Aardklop 2005 - 2008 35
Table 32 Characteristics distinguishing high spenders from medium and low spenders 38
Table 33 Questionnaires completed during Aardklop National Arts Festivals 2005 shy 41
2008
Table 34 Questions used and their descriptions 41
Table 35 Festival respondent profile 44
Table 36 Cluster centres and number of cases in each cluster 44
Table 37 ANOVA results for respondent characteristics 45
Table 38 Low medium high-medium and high segments 49
XII
LIST OF FIGURES
CHAPTER 2 Correspondence analysis of visitors to Aardklop National Arts Festival
Figure 21 Biplot of age category and showsproductions attended 24
Figure 22 Biplot of age category and mediums through which respondents heard about 25
Aardklop
Figure 23 Biplot of age category and number of people financially responsible for 26
Figure 24 Biplot of age category and spending category 27
Figure 25 Biplot of age category and number of days attended the festival 28
Figure 26 Biplot of age category and province of origin 29
APPENDIXES
Appendix A Visitor questionnaire 75
XIII
CHAPTER 1 Introduction problem statement
objectives and method of research
11 INTRODUCTION
Over the past few years there has been a rapid increase in the growth of the tourism industry
worldwide In South Africa foreign arrivals increased by 83 during 2006 and the countrys annual
tourism arrivals record was broken for the third year running with 907 million foreigners visiting
South Africa in 2007 (SAT 2007)
The rapid tourism growth in South Africa can be ascribed to various reasons such as increased
marketing efforts communities recognising the potential of tourism and the variety of attractions
across the country Attractions whether natural or man-made are the underlying motivations for
people to travel (Lubbe 2003 1 05 Mcintosh amp Goeldner 1990 112) Events and festivals are
considered man-made or organised celebrations that among others serve as tourist attractions
that attract people to a specific destination and provide unique features and experiences for visitors
(Getz 1993946 Kim amp Uysal 2003160)
Events and festivals have become one of the fastest growing types of tourism attractions
especially in recent years In South Africa event tourism is estimated to expand even faster than
the 10 annual tourism growth rate (George 2004366 Gursoy Kim amp Uysal 2004172 Saayman
Saayman amp Rhodes 2001 443) Events and festivals have important roles to play in the tourism
development and marketing of a destination since it is considered a sector with significant
economic and job creation benefits (Getz 1993945 Getz 19975)
Arts festivals particularly such as the Aardklop National Arts Festival are one of the most rapidly
growing events tourism segments (Jackson amp OSullivan 2002326) and have become important to
the South African society due to a number of reasons and benefits For example it sustains
1
different forms of art it contributes to the livelihood of artists it stimulates the growth of regional
and local economies and it promotes specific destinations to name but a few (Saayman Siabbert
amp Saayman 20057)
These benefits have prompted a remarkable increase in conceptual and empirical studies on
festivals and events There has also been a big increase in the number of festivals hosted by
various destinations (Hughes 20002 Visser 2005 165) The benefits of the Aardklop festival in
particular and the contribution it makes to the community are remarkable Seen from an economic
point of view Aardklop is the third largest festival in South Africa with a total estimated economic
impact of R4665 million in 2008 (Kruger Saayman amp Saayman 200827) During its very
successful but modest beginning in 1998 it had an estimated visitor number of 25 000 thus seen
from a marketing point of view Aardklop has grown substantially in visitor numbers with an
average of just more than 56 000 visitors per year over the past three years (Kruger et al 200827
Van Heerden 200312) However when it comes to reaping the continuous contribution and
benefits of this festival the sustainability and further growth of Aardklop need to be ensured
The purpose of this chapter is to discuss the research process followed in this study This will be
accomplished by firstly analysing the problem Thereafter the goals and objectives will be stated
followed by the research methodology definitions of key concepts and lastly the chapter
classification
12 PROBLEM STATEMENT
Currently at least 211 annual festivals take place across South Africa of which 28 focus on
performing and visual arts or a combination thereof (Visser 2005165) as is the case with
Aardklop National Arts Festival The competition in this market currently has important implications
for all the South African artscultural festivals Most festivals in South Africa are experiencing a
decline in the number of festival visitors ticket sales or both (Saayman amp Saayman 2006a40-41)
The decline typically reflects the principles of a product life-cycle which state that individual events
(or products) tend to progress through stages of growth maturity and decline (Getz 1993951) The
product life-cycle therefore reflects how a festival is doing in this competitive market environment
by indicating the stage or phase it is in
However according to Saayman and Saayman (2006b219 2006582) the sustainability of a
festival must be attained at three levels namely economic environmental and socio-cultural In
order to contribute to the sustainability of the host destination the importance of effectivestrategic
2
marketing of the festival must be realised (Uys 2003 11 Walo Bull amp Breen 199796) Organisers
of recurring events can adopt and implement a number of marketing strategies to prolong the
growth phase of the festivals life-cycle Examples of marketing strategies include market
penetration (attracting more visitors to the festival by means of a more competitive marketing mix)
stimulating new and repeat visits by restructuring the festival programme or developing completely
new markets by means of extensive festival product changes (Getz 1993951) Hawes Taylor and
Hampe (199111) argue that an essential goal of a marketing strategy should be twofold namely
(1) maintaining existing markets and (2) further penetrating markets with high potential which is
possible by means of market segmentation
One of the key success factors of strategic marketing is market segmentation Dibb and Simkin
(2001 609) hold the opinion that market segmentation is vital to business success and is the
universal remedy of modern marketing since a mass marketing approach cannot be used to satisfy
diverse customer needs Nearly all markets include groups of peopleconsumers with different
needs preferences demands tastes behaviour patterns disposable income and spending
patterns therefore marketers cannot compete in an entire market seen from an economic point of
view (Buhalis 2000 1 00 Foster amp Davis 1994 132) Market segmentation therefore recognises the
differences and changes in the lifestyles desires tastes and motivations of visitors to a festival
and continually focuses marketing initiatives on economically significant groups Market segments
vary in size and potential and marketers make use of segmentation to define the marketing
objectives accurately and to allocate resources better (Lamb Hair amp McDaniel 2000213) Market
segmentation is effective since it divides the present and potential market into homogenous
groupssegments based on meaningful characteristics and concentrates promotion product and
pricing efforts on serving the most prominent portions of the market - the target markets (Mcintosh
amp Goeldner 1990407) This is done because it is expected that consumers in the same group (or
segment) will react similarly to a particular offering (McDonald amp Dunbar 199521) Segmentation
therefore assists in identifying the target market to understand their needs better and to determine
the right marketing mix for the target market (Perreault amp McCarthy 1999239) Hence market
segmentation is essential to establish efficient marketing strategies directed at these homogenous
sub-groups (Havitz Dimanche amp Bogle 199440)
In recent years market segmentation and subsequent customisation have become very effective
where the maintenance of existing markets is a primary goal (Wedel amp Kamakura 2002181) since
changes in trends and visitor preferences can be detected by means of market research and this
will assist festival marketers and organisers in adjusting the programme accordingly In other
words market segmentation is beneficial to determine whether visitor interest is still the same or
3
changing in order to maintain the existing markets This is important since the festivals life-cycle
is linked to visitor interest (Saayman 2006114) Marketers can also determine which markets with
high potential can be approached or further penetrated so that a more careful analysis of their
needs motives and expectations can be made in order to develop a festival programme and
product aimed at these specific needs (Nickels amp Wood 1997221)
Implementing market segmentation also accounts for numerous benefits The following can be
considered some of the benefits of market segmentation (Ali-Knight Drummond McMahon-Beattie
Robertson amp Yeoman 2004136 Arrimond amp Elfessi 2001391 Bennet amp Strydom 20015464
Burke amp Resnick 200039 Dibb amp Simkin 19961 Dibb amp Simkin 2001610 Ferrell Hartline amp
Lucas 200274 Frisby amp Getz 19897 George 2004135 Getz 1997260 Keller amp Kotler
2006246 Lee Lee amp Wicks 200461 Marx Van Rooyen Bosch amp Reynders 1998535 Mayfield
amp Crompton 199514 McDonald amp Dunbar 199516 Mouthinho amp Witt 1994305 Saayman
200285)
bull Marketers gain detailed knowledgedefinition of visitors with a better comprehension of their
needs
bull By concentrating on these needs marketers can match visitors needs more closely with the
festival products and services
bull With market segmentation more satisfied festival visitors and long-term visitor relationships
are formed by offering the target markets what they want
bull Market segmentation brings about more effective marketing programmes marketing mixes
and marketing costs
bull Segmentation can lead to the identification of niche markets
bull Market segmentation eases the ability to respond to markets changing needs
bull Segmentation promotes new innovative product ideas
bull It provides clarity on the size of potential markets potential effectiveness of promotions
responses to changes in the marketing mix spending patterns price sensitivity and loyalty
bull Segmentation can lead to concentration of resources in markets where competitive
advantages are great and returns are high
bull By means of segmentation a competitive advantage may be gained by understanding and
assessing the competitors and having an approach different to theirs resulting in less
conflict with competitors
bull Segmentation leads to the development of a sustainable product and better positioning of
the product
4
Therefore it is crucial to implement market segmentation so that the currenUpotential target
audience can be identified and their needs motives and expectations can be understood Based on
that information the festival programme can be designed according to the needs and preferences
of both the current and potential markets Market segmentation therefore assists in maintaining the
existing market by ensuring repeat visits and it also leads to the identification of high spenders so
that these high potential markets can be further penetrated (Burke amp Resnick 200039)
Maintaining and further penetrating festivalevent markets by means of market segmentation is an
economically sensible and sustainable strategy since increased expenditure and economic
contribution to the destination area due to the anticipation of tourists is a common feature of any
event (Murphy amp Carmichael 199132) The economic impact of a festival is measured by the size
of the festival in terms of (1) number of visitors (2) visitor spending (3) duration of stay and (4) the
multiplier effect (Saayman 2007132) In Table 11 below the economic contribution of Aardklop is
prominent The product life-cycle of a festival can be measured by the number of tickets sold
(Kruger 2009 15) based on this Aardklop is showing potential signs of decline although it is not in
a definite declining phase yet Besides the recent decline in ticket sales the festival seems to be
doing well generally As mentioned before Aardklop has experienced positive growth since its
debut in 1998 (Kruger et al 200827) and for the past 4 years the festival has maintained relatively
constant figures with regard to the number of visitors direct spending of visitors as well as average
days spent at the festival (Table 11) Thus Aardklop is an already established event on the festival
calendar of South Africa that still continues to attract a substantial number of loyal supporters (also
referred to as festinos)
Table 11 Overview of economic impact and profile of Aardklop 2005-2008
Year 2005 2006 2007 2008
Absolute number of visitors 36766 61476 51870 55518
Total tickets sold 91156 81022 84559 79530
Number of travel groups 15193 19393 16678 15294
Travel group size 2 3 3 4
Average tickets per group 6 4 5 5
Average days attended festival 3 3 3 3
Total visitor days 113240 196108 168 576 172106
Average spending per group R217438 R177955 R2 61255 R2 79997
Direct spending of visitors at festival R21 574794 R24237640 R27999000 R26 735791
Total economic impact R39171741 R42908324 R53097645 R46650703
Will visit the festival again 95 94 97 93 Source Kruger et al (200826-29) Saayman and Saayman (2006a 36-41)
Aardklop had an exceptional year in 2007 and was extended with a few days to celebrate its 10 year anniversary this could possibly account for its higher economic value in 2007
5
However to ensure the sustainability and future profitability of the festival the growth phase of the
festivals life cycle must be extended by means of continuous strategic marketing efforts That
means that although festivals and events are subjected to successive stages of growth market
research assists festival marketers in determining the changes in demand thereby making it
possible to advise festival organisers on how to modify the festival programmeproduct accordingly
(Frisby amp Getz 19897) Hence it is important that the Aardklop festival committee and
management ensure that the necessary market research is continually implemented so that they
may understand and sustain the current market of the festival and further penetrate markets with
high potential
The division or segmentation of the market can be done in various waysmethods and by means of
a variety of segmentation variables depending on the situation and product (Burke amp Resnick
200041 Dolnicar Crouch Devinney Huybers Louviere amp Oppewal 200846) These
segmentation variables include geographic socio-demographic psychographic andor behavioural
characteristics (Slabbert 20022) A large selection of possible methods is used to do
comprehensive market segmentation These include cluster analysis correspondence analysis
regression analysis Automatic Interaction (AID) analysis latent class analysis judgment-based
segmentation factor and component analysis as well as using expenditure (Slabbert 200240) In
tourism research expenditure-based segmentation as well as correspondence analysis is often
used to implement market segmentation Expenditure-based segmentation entails classifying
visitors into low medium and high spending groups or segments (Mok amp Iverson 2000302)
Correspondence analysiS entails the representation of associations between categorical variables
for effective interpretation of the data to identify and compare different segments (Beldona
Morrison amp OLeary 2005564) However these two methods have not been applied to Aardklop in
previous research
Although correspondence analYSis is purely an exploratory yet sophisticated technique Gursoy and
Chen (2000585) found it to be a much used technique in tourism marketing research
Correspondence analysis is an effective segmentation tool and useful when associations between
two or more multi-categorical variables need to be explored (Beldona et al 2005565)
A number of studies aimed at constructing segments have been based on visitor expenditure (Diazshy
Perez Bethencourt-Cejas amp Alvarez-Gonzales 2005 Saayman Van der Merwe amp Pienaar 2008
Mok amp Iverson 2000 and Legoherel and Wong 2006) This type of segmentation is beneficial
since marketing researchers have discovered that high spenders and users of a specific product
account for a disproportionately large percentage of total sales (Spotts amp Mahoney 1991 42)
6
Dolnicar et 81 (200846) indicate that when expenditures are used in empirical tourism research
valuable insights are provided on how segments of tourists with different expenditure patterns can
be targeted with specific marketing strategies
Grouping the visitors to Aardklop by means of the above-mentioned segmentation methods can
help festival organisers understand the current market better (by means of correspondence
analysis on the bases of demographics) as well as markets with high potential (by means of
expenditure-based segmentation in order to identify the high spenders at Aardklop)
Knowledgeable and informed organisers can then adjust the festival programme and marketing
efforts according to the needs motives and behaviours of these visitorsidentified segments so as
to ensure the sustainability growth continuity and success of the Aardklop festival
Therefore the research question this dissertation will attempt to address is Which markets can be
identified for Aardklop National Arts Festival by applying and comparing two market segmentation
methods namely correspondence analysis and expenditure-based segmentation
13 GOAL AND OBJECTIVES OF THE STUDY
131 Goal
To apply and compare two market segmentation methods of visitors to Aardklop National Arts
Festival
132 Objectives
The achievement of the goal relies on the following objectives
Objective 1
The application of a correspondence analysis in order to understand the Aardklop market better
Objective 2
The application of expenditure-based segmentation in order to identify the profile of high spenders
at Aardklop
Objective 3
To compare the application of correspondence analysis and expenditure-based segmentation to
the Aardklop market
7
Objective 4
To draw conclusions and make recommendations regarding market segmentation of visitors to
Aardklop
14 METHOD OF RESEARCH
This quantitative study follows a two-pronged approach Firstly a literature analysis was done by
collecting secondary data on the topic from existing sources and secondly an empirical survey
was done by collecting primary data by means of a structured questionnaire
141 Literature Study
A literature study was based on specific keywords tourism event tourism arts festival market
segmentation target market economic impact correspondence analysis and expenditure-based
segmentation The internet including scientific databases and search engines such as Google
Scholar RSat ScienceDirect and Ebscohost played a vital role in searching for the most recent
relevant publications and information Other sources also used during the literature study included
books accredited journal articles theses dissertations and tourism-related sources such as
tourism reports and Aardklop website sources
142 Empirical Study (Survey)
The empirical survey was conducted at Aardklop National Arts Festival in the following manner
1421 Research design and method of collecting data
A quantitative approach by means of a questionnaire was followed Siabbert (200463) emphasises
that the advantages of such an approach include (1) it is suitable for collecting demographic
information such as gender age and income (2) it is inexpensive to conduct and (3) it is relatively
easy to tabulate and analyse the data using statistical programmes
Participants were grouped into segments based on certain demographic and socio-economic
characteristics and the research was exploratory in nature The results lead to the identification of
current markets in order to maintain existing markets and penetrate markets with high potential
This study will attempt to determine a demographic (based on age of visitors) and a socioshy
economic (based on visitor spending) profile of visitors to the Aardklop National Arts Festival by
means of a structured questionnaire that serves as the instrument to collect the data
1422 Development of the questionnaire
The Institute for Tourism and Leisure Studies at the North-West University Potchefstroom Campus
developed the questionnaire in collaboration with the festival organisers and it has proved to be
8
successful This research instrument (questionnaire) was used in similar studies often conducted at
South African arts festivals (Van Heerden 2003 Pissoort 2007) A pilot study was done in 2002 at
Aardklop and 6 successful surveys followed in the years thereafter The questionnaire remained
similar throughout these years
The questionnaire was divided into three sections and mainly consisted of closed questions (see
Appendix A) Section one included questions based on socio-demographics of the visitor (such as
gender age language occupation and province of origin) followed by questions in section two
based on behavioural elements (such as travel group size days spent at the festival
productionsgenres attended type of accommodation used other festival attended throughout the
year attendance of free shows number of persons financially responsible for and spending) In
section three more general behavioural questions were also asked such as the means through
which information regarding the festival was communicated (for example magazines newspapers
newsletter etcetera)
1423 Sampling population
The design for drawing a sample consists of defining the population of interest The survey
population for this study was selected from a group of people that attended the festival The
Institute for Tourism and Leisure Studies at the North-West University (Potchefstroom Campus)
conducted 7 surveys at the Aardklop National Arts Festival (2001-2008) From 2005 to 2008 a total
of 1 671 questionnaires were completed by visitors to the festival and the data from these surveys
were used for this study since the questionnaire as well as the general characteristics of the
population remained similar over the four years
The total of 1 671 questionnaires is beneficial since segmentation requires large sets of data
(Burgan amp Mules 200055) Cooper and Emory (1995207) as well as Krejcie and Morgan
(1970608) point out that in any defined population for a population of 100 000 (N) the
recommended sample size (S) is 384 Aardklop has a 4 year average of just fewer than 51 500
attendants With an average of 418 questionnaires per year over the four consecutive year period
the sample size is appropriate for this type of study
1424 Sampling method
For the duration of the festival a non-probability sampling method was used to conduct the
surveys namely convenience sampling The survey was conducted by means of a selfshy
administered questionnaire among the tourists at the festival These respondents were briefed
about the purpose of the research and were willing participants To limit response bias towards a
9
certain group of festival attendants questionnaires were distributed on-site but at different
locations for example in the areasvenues of shows and productions in the areas of closed streets
where attendants gather between shows and on the main festival grounds Field workers were
trained to understand the purpose of the study and the questionnaire so that they could assist
respondents where necessary without interfering with the completion of the questionnaire
Questionnaires were distributed on each day of the 5 day festival period This ensured that the
feedback received by the sample population was an accurate portrayal of visitor spending
1425 Data analysis
The data was coded on Microsoft Excel and processed using SPSS (Statistical Package for the
Social Sciences) and Statistica software with the assistance of the Statistical Services at the Northshy
West University Potchefstroom Campus An initial data analysis entailed descriptive statistics and
focused on the demographic profile of the visitor to the Aardklop festival by means of frequencies
A correspondence analysis was undertaken to visualise the correlationirelationship between the
age of respondents and other variables A K-means clustering was done to group members
together based on their similarity with regard to spending patternsbehaviour so that these clusters
could be used in the ANOVA analysis The ANOVA analysis was applied by using the identified
clusters to do expenditure-based segmentation A brief description of each analysis that was used
will be provided in the following section
a Correspondence Analysis
Beldona et al (2005564) point out that correspondence analysis is an exploratory and
sophisticated technique that gives a powerful representation of association between categorical
variables by giving a comprehensive view of the data (in the contingency table) for effective
interpretation It is also a much used technique in tourism marketing literature (Beldona et al
2005564) Examples of these include Arimond and Elfessi (2001 391) Beldona et al (2005561)
Calantone Benedetto Hakam and Bojanic (198925) Chen (2000241) Chen (2001345) Chen
and Gursoy (2000193) Cheung (1994374) Gursoy and Chen (2000583) Kara Kaynak and
Kucukemiroglu (1996102) Kaynak Kucukemiroglu and Kara (1994237) Malhotra and Bartels
(200265) and Shanka and Taylor (200455) For purposes of this study a correspondence analysis
of socio-demographic and behavioural variables was undertaken in order to visualise the
relationship possible associations between these variables and respondent age groups
(dependent variable)
10
b K-means Clustering
Instead of simply dividing the market into three spending categories (high medium and low) for
purposes of expenditure-based segmentation clustering is a method used to group members
together based on their natural similarity and makes no pre-determined selection in the number of
spending groups (Saayman Siabbert amp Saayman 2009) K-means clustering is a method of
clustering whereby the data is divided into K (number of clusters chosen by researcher) clusters
and assigns each item to a cluster based on distances that measures the closeness or similarity to
the mean value of the cluster (Kruger Saayman amp Saayman 20097)
c ANOVA analysis (Analysis of Variance)
An AN OVA (also referred to as an F-test) is closely related to the t-test These two analyses differ
mostly on the grounds that the t-test assesses the difference between the means of two groups
while the ANOVA on the other hand assesses the difference between the means of two or more
groups (Kruger 200911) For purposes of this study the analysis of variance (ANOVA) was used
to determine the differences in terms of socio-demographic and behavioural variables (as tested by
the questionnaire) between the identified expenditure clusters and to test whether these differences
were statistically significant
15 DEFINING CONCEPTS
The following concepts were used during the course of the study and therefore need clarification
151 Aardklop National Arts Festival
The Aardklop National Arts Festival is a South African arts festival held annually in Potchefstroom
in the North-West Province after a very successful debut in 1998 It is a cultural event that takes
place for 5 successive days at the end of September and hosts items in a variety of venues in and
around the town such as theatre dance music cabaret and visual arts A large craft market as
well as open-air performances also form part of this predominantly Afrikaans event (ANON 2008
Van Heerden 200311) According to the organisers Aardklop was initiated because of concern for
the arts and artists as well as to cater for the cultural needs in the northern part of South Africa
(ANON 2008 Van Heerden 200311 Kruger et al 20081) The main aim of the festival is
therefore to provide a quality platform for artists to promote the arts and to strive towards creating
new job opportunities Although Aardklop is a predominantly Afrikaans festival it readily
accommodates activities for other language groups as well (Kruger et al 20081)
11
152 FestivalArt festivals
The Oxford Concise Dictionary (2001 530) defines a festival as a day or a period set aside for
celebration or feasting an organised set of performances and special events Smith (1990128)
defines festivals as a celebration of a theme or a special event that takes place for a limited period
of time and invites the public to a once-off annual or less frequent happening More specifically an
arts festival can be defined as a community-themed event or celebration designed to showcase
different art forms and activities - along with the related tourism and hospitality experiences (Kruger
amp Petzer 2008113) Isar (1976131) explains that an arts festival is something exceptional
something out of the ordinary something that must create a special atmosphere which stems not
only from the quality of the art and the production but from the traditions of a region
153 Market segmentation
Consumers have different demands tastes behaviour patterns disposable income and spending
patterns therefore marketers cannot compete in an entire market from an economic point of view
(Foster amp Davis 1994132) Grouping consumers with similar needs and preferences together is
known as market segmentation (Middleton 199471) This is done since it is expected that
consumers in the same group (or segment) will react similarly to a particular offering (McDonald amp
Dunbar 199521) Dibb and Simkin (2001 609) point out that market segmentation is vital to
business success and is the universal remedy of modern marketing since a mass marketing
approach cannot be used to satisfy diverse customer needs Instead market segmentation takes
care of the element of diversity whereby customers with similar requirements and buying behaviour
are grouped into segments Identifying these segments assists in allocating limited resources to
serve the most appropriate customers Wedel and Kamakura (2002182) also argues that
whenever demand is heterogeneous it will be profitable to distinguish segments By grouping
tourists into different segments (within which visitors have similar characteristics and needs) it
allows for each segment to be reached with a specific marketing mix (McDonald amp Dunbar
199510)
16 CHAPTER CLASSIFICATION
The study is divided into four chapters The following provides a brief outline of what is presented in
each chapter
Chapter 1 Introduction and problem statement
Chapter 1 comprised a general introduction to the study the problem statement followed by the
research goal and objectives as well as the method of research Key concepts that are used in the
study are defined The aim of this chapter is to give an overview of the Aardklop National Arts
12
festival and the problem the festival organisers and marketers need to address The importance of
market segmentation for Aardklop is emphasised and two segmentation methods are identified that
will benefit Aardklop in the context of the identified problem
Chapter 2 Correspondence analysis of visitors to the Aardklop National Arts Festival
(Article 1)
Chapter two consists of Article 1 In this article correspondence analysis as a segmentation
method with age as the dependent variable is applied to visitors at the Aardklop National Arts
Festival With this method it is possible to comprehensively classify markets into profiles to
determine any changes in the needs or trends in order to maintain existing target markets This will
contribute to the sustainability and growth of the festival since improvements can be made with
regard to the festival program and marketing efforts
Chapter 3 Expenditure-based segmentation of visitors to the Aardklop National Arts
Festival (Article 2)
This chapter consists of Article 2 In this article expenditure-based segmentation is applied to
visitors at the Aardklop National Arts Festival With this method a comprehensive profile of the
target market with regard to visitor spending will be compiled and the most viable market financially
speaking will be identified in order for it to be penetrated further With fewer people spending more
at the festival the social and environmental impact remains minimal This will also contribute to the
sustainability of the festival since high spending target markets have a direct influence on the
extent of the economic impact
Chapter 4 Conclusions and recommendations
The final chapter draws conclusions based on the content of the first chapters Recommendations
with regard to different marketing strategies are made and the two market segmentation methods
that were used will assist the festival organisers and marketers with sustainable planning and
marketing practices This chapter is concluded with a summary highlighting the importance of
festival management through implementing continuous market segmentation by means of various
segmentation methods
13
CHAPTER 2 Correspondence analysis of visitors to the Aardklop National Arts Festival
21 INTRODUCTION
There are currently at least 211 annual festivals that take place across South Africa of which 28
focus on performing and visual arts or a combination thereof (Visser 2005165) as is the case of
the Aardklop National Arts Festival (hereafter referred to as Aardklop) This predominantly
Afrikaans cultural event is the third largest festival of its kind in South Africa and takes place
annually in the city of Potchefstroom The festival hosts approximately 85 productions by 390 artists
across a variety of genres such as theatre dance cabaret jazz rock literature childrens and
street theatre and visual arts (ANON 2008 Raath 2009 van Heerden 200311 Kruger Saayman
amp Saayman 200827) According to the organisers Aardklop was started out of concern for the arts
and artists as well as to cater for the cultural needs of the community in the northern part of South
Africa The main aim of the festival therefore is to provide a quality platform for artists to promote
the arts (ANON 2008 van Heerden 2003 11 Kruger et a 2008 1)
A growing problem in the events and festivals sector is competition that threatens the sustainability
of the event (Smith amp Jenner 199874) In South Africa competition in the festival market has
serious implications for most artscultural festivals such as declines in festival visitor numbers
ticket sales or combinations of both (Saayman amp Saayman 2006a40-41) However by identifying
festival visitors specific needs and motives for attending a festival (and possible changes in these
needs and motives) a festival productprogramme can be designed to satisfy these needs The
tailor-made programmes will encourage visitors to spend more money on ticketed
showsproductions and to attend the festival repeatedly Increased ticket sales result in increased
profits which ensure the sustainability of the festival (Koc amp Altinay 2007228 Pissoort 20072
Mok amp Iverson 2000304 Formica amp Uysal 199816) Therefore one of the best ways to secure
long-term growth of a festival is to understand the festival market enabling the development of a
sustainable marketing strategyprogramme so that a steady growth rate is maintained (Uys
200313)
14
Thus Aardklops organisersmarketers need to understand the needs behaviour and expectations
of current andor potential visitors by means of market segmentation in order to secure long-term
growth and sustainability The purpose of this article is to analyse the visitors to the Aardklop
National Arts Festival by means of correspondence analysis To achieve this the literature review
method of research listing of research results and conclusions will be presented below
22 LITERATURE REVIEW
In order to create retain and satisfy the needs of Aardklop festival visitors - seeking their
consumption (of ticketed showsproductions) as well as their loyalty by repeatedly visiting the
festival - the continuous process of market segmentation must be applied by grouping or
segmenting current andor potential visitors with very different needs motives behaviours ages
income levels family sizes etcetera (Koc amp Altinay 2007228 van Zyl 200585) Market
segmentation recognises the differences and changes in the lifestyles desires tastes and
motivations of visitors to a festival and divides the present and potential market into homogenous
groupssegments based on meaningful characteristics since it is expected that consumers in the
same segment will react similarly to a particular offering (Lamb Hair amp McDaniel 2000213
Mcintosh amp Goeldner 1990407 McDonald amp Dunbar 199521) Segmentation therefore assists to
pinpOint the target market in order to better understand their needs since changes in trends and
visitor preferences can be detected Pinpointing the target market will assist festival marketers and
organisers in adjusting the programme accordingly such subsequent customisation has recently
become very effective for the maintenance of existing markets (Saayman 2006 114 Perreault amp
McCarthy 1999239 Wedel amp Kamakura 2002181) When needs and expectations are met or
exceeded consumer satisfaction will increase which is pivotal for establishing a long-term
consumer relationship and ensuring repeat business higher usage and increasing the probability of
the consumer recommending the service to someone else More satisfied consumers are also less
prone to consider product offerings from competition (Lee Lee Lee amp Babin 200858)
A large selection of possible methods can be used to do comprehensive market segmentation
These include cluster analysis regression analysis Automatic Interaction (AID) analysis latent
class analysis judgment based segmentation factor and component analysis expenditure-based
segmentation as well as correspondence analysis (Slabbert 200240) Correspondence analysis is
often used to implement market segmentation especially in tourism marketing literature (Beldona
Morrison amp OLeary 2005564 Gursoy amp Chen 2000585) Examples of such literature include the
following studies
15
bull Arimond and Elfessi (2001) firstly used correspondence analysis to spatially map desirable
attributes of a bed and breakfast facility and then cluster analysis to identify market segments
bull Beldona et al (2005) examined purchase motives of pleasure travel components of low and
high complexity in a web environment
bull Calantone Benedetto Hakam and BOjanic (1989) researched tourists perceptions of
Singapore and other Pacific Rim countries
bull Chen (2000) researched cross-cultural differences in travel information acquisition among
tourists from three Pacific-Rim countries
bull Chen (2001) also researched Korean outbound travellers destination images
bull Chen and Gursoy (2000) researched a cross-cultural comparison of the information sources
used by first-time and repeat travellers of German British and French travellers to the US as
well as
bull a competitive analysis of cross cultural information search behaviour of German British and
French travellers to the US (Gursoy amp Chen 2000)
bull Cheung (1994) explored principal component analysis and correspondence analysis as
methods for the multi-criteria decision making problem
bull Kara Kaynak and Kucukemiroglu (1996) used correspondence analYSis to position fast-food
outlets in two regions of North America
bull Kaynak Kucukemiroglu and Kara (1994) explored consumers perceptions of intemational
airlines
bull Malhotra and Bartels (2002) considered correspondence analysis as an approach to minimise
the attribute pre-specification bias in international marketing management and
bull Shanka and Taylor (2004) explored sources of information used by festival visitors to the
Spoleto festival in Italy
Correspondence analysis is therefore not only a much used market segmentation method but is
also implemented across a variety of tourism-related topics However correspondence analysis
research based on festivals is extremely limited and market segmentation still needs to be
implemented on a large scale by these means in the eventsfestival sector
The application of correspondence analysis can be based on a variety of variables such as age
sources of information used gender and so forth thereby making it a flexible exploratory research
method Tourism literature is saturated with research studies that segment markets by means of a
variety of segmentation variables depending on the purpose of the study (Formica amp Uysal 1998
Burke amp Resnick 2000 and Dolnicar Crouch Devinney Huybers Louviere amp Oppewal 2008)
These segmentation variables can be categorised into various bases such as (Slabbert 20022
16
Burke amp Resnick 200041 Lubbe 200077 George 2004126 Kotler amp Armstrong 2004240
Lamb Hair McDaniel Boshoff amp Terblanche 2004168 Saayman van der Merwe amp Pienaar
2008 Formica amp Uysal 1998 17)
bull geographic (eg region country city suburb climate and transport)
bull socia-demographic (eg gender age occupation and family life-cycle)
bull psychographic (eg social class lifestyle andor personality characteristics) and
bull behavioural (eg loyalty attitudes length of stay travel group size accommodation
preferences benefits sought by travellers and travel motivations)
Demographic segmentation is a popular method in market segmentation because consumer needs
and wants are usually influenced by demographic variables and these variables are generally
easier to measure than most other variables (Bowen 1998289) According to Holbrook and
Schindler (199627) one specific socia-demographic variable that marketers have used
successfully is segmentation based on age The purpose of segmentation by means of age is to
divide the market into specific age categories in order to determine the characteristic differences of
each category However results of studies where age was used as segmentation variable can be
inconsistent (Horneman Carter Wei amp Ruys 200223) due to changes in market trends and in the
needs and preferences of the consumers For this purpose it should be noted that the results of
age-segmentation studies are bound to change constantly and should be applied on a continuous
basis in order to monitor these changes in the market Various studies of which the results revealed
differences in the characteristics of older as opposed to younger consumers are captured in Table
21 below
Table 21 Characteristics distinguishing older consumers from younger consumers
CHcIRACTERISTIC bull bull - AUTHORS
Recreationleisure Older consumers go bowling more Hisrich and Peters (1974) 88
activities often than younger consumers quoted by Holbrook and Shindler (199627)
Travellers over the age of 50 prefer Anderson and Langmeyer non-hectic pre-planned pleasure (1982) as quoted by trips Homeman at a (200223) Travellers over age 55 are more Javalgi Thomas and Rao likely to cruise tour visit friends and (1992) as quoted by relatives leas likely to visit cities Homeman at 8 (200224) resorts and theme parks Older festival visitors (over 30 years Younger festival visitors (younger Formica and Uysal (199822) of age) to Spoleto Festival than 30 years) to Spoieto Festival (International cultural-historical are less inclined to socialise and festival) in Italy seek socialisation interact with other visitors and Interaction with other festival visitors Respondents (in 12 states of the USA) with children under 18 years of age Hsu Kang and Wolfe were more likely to attend fairs and festivals in the USA (200212) European cultural market consists of European cuitural market consists Richards (2001 40) 26 vIsitors over the age of 50 of 35 visitors under the age of 30 years
17
Madiumsof communication inform ation
lifestyle
Expendituresllncome
Travel behaviour
us festival visitors are more likely to be under 50 years of age Older consumers process consumer information slowly I less accurately
Older consumers read magazine advertisements with less youthful models (cigarette advertisements)
Age group 45-54years depends on Young age group (18-25 years) television and age group 55+ depends on word-of-mouth as depends on newspapers as a source of festival information source of festival information (Swan (Swan Valley Wine Festival in Valley Wine Festival in Australia) Australia) Older consumers tend to aim more towards a more sedatedignified lifestyle
Young bachelors spend more on away-from-home entertainment (concerls movies bars dancing)
Young singles spend more on clothing than married or older adults
Older consumers (Japanese outbound pleasure travellers Tsltsikamma National Par1 visitors) are associated with higher spending Older consumers show more diligent shopping behaviour
Younger consumers (TahNanese tourists to Guam and leisure expenditures In US) are associated with higher spending
Older and middle-aged festival Younger festival visitors (less than visitors to the Spoleto Festival earn 30 years) to Spoleto Festival earn a higher income lower income Overall purchasing involvement is higher among adults with children than younger or older adults without children
Young and agad visitors (US visitors to Hawaii) average daily expenshyditure is significantly less than the visitors in the in-between age groups Older visitors spend more than younger visitors at festivals (jazz and arts festivals)
Younger and middle-aged natureshybased tourists are likely to be high spenders
Senior travellers travel longer distances and stay away longer than any other age group
Older senior (65+ years) natureshybased travelers in North Carolina South Carolina and Georgia were more likely to stay at their destination longer spend more time planning In advance for their trip and visit friends and relatives than younger senior travellers (55-04)
Out-of-region visitors to an international Jazz festival in Italy (Umbria region) were younger
Middle-aged and older visitors to the Younger age group (less than 30 Spoleto Festival are mostly married years) are mostly singles but
prefer to visit the Spoleto Festival with partners
Young and aged visitors (US visitors to HawaII) stay much longer than the visitors in the in-between age groups
Ba~anBa~anUysal and Sunshine (199521) Cole and Gaeth (1990) as quoted by Holbrook and Shindler (199627) Mazis Ringold Perry and Denman (1992) as quoted by Holbrook and Shindler (199627) Shanka and Taylor (200458)
Morgan and Levy (1993) as quoted by Holbrook and Shindler (199627) Schanlnger and Danko (1993) as quoted by Holbrook and Shindler (199627) Wagner and Hanns (1983) as quoted by Holbrook and Shindler (199627-28) Jang Bai Hong and OLeary (2004331) Kruger Saayman and Saayman (2009) Jang Ismail and Ham (200283) Zeithaml (1985) as quoted by Holbrook and Shindler (199627) Dardis Soberon-Ferrer and Patro (1994315) Mok and Iverson (2000302)
Formica and Uysal (199822)
Slama and Tashchian (1985) as quoted by Holbrook and Shindler (199628) Mak Moncur and Yonamlne (19776) Saayman and Saayman (2006b217) and Thrane (2002284) Mehmetoglu (2007213) and Pouta Neuvonen and Sievanen (2006131) Shoemaker (1989) Blazey (1991) and Pearce (1999) as quoted by Homeman at a (200223) Ba~anBa~anand
Silverberg (1999) as quoted by Horneman at a (200224)
Formica and Uysal (199817)
Formica and Uysal (199822)
Mak at a (19776)
18
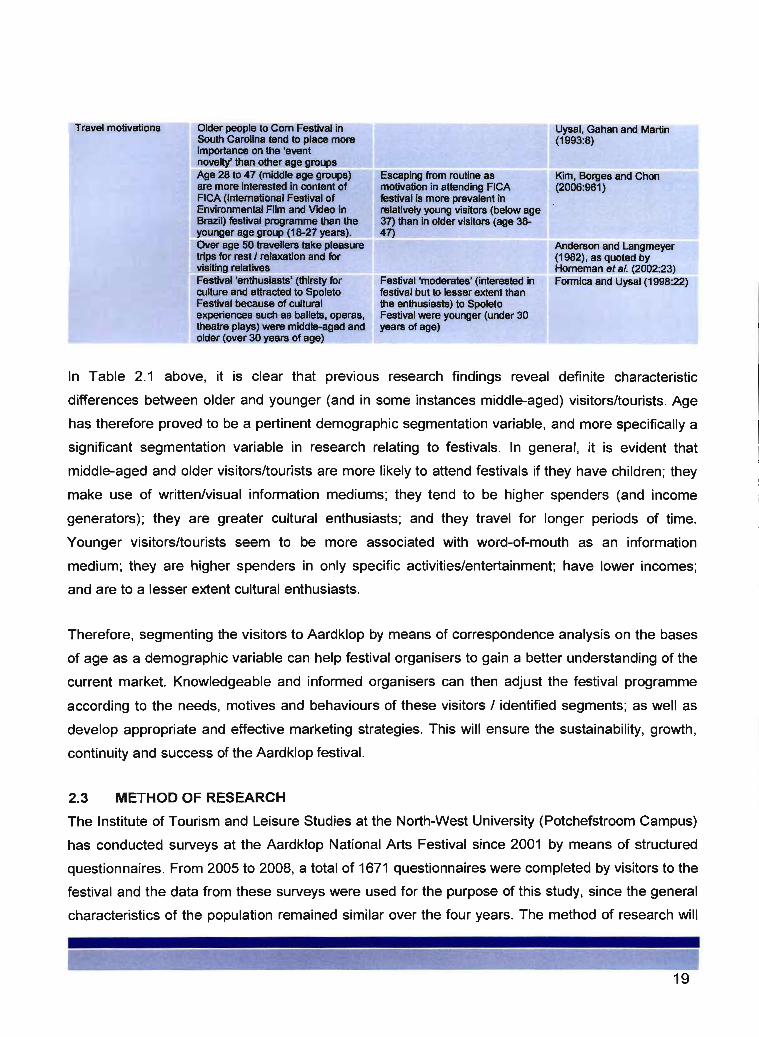
Travel motivations Older people to Com Festival in South Carolina tend to place more importance on the event novelty than other age groups Age 28 to 47 (middle age groups) are more interested in content of FICA (International Festival of Environmental Film and VIdeo in Brazil) festival programme than the younger age group (18- 7 yeara) Over age 50 travellers take pleasure trips for rest I relaxation and for visiting relatives Festival enthusiasts (thirsty for culture and attracted to Spoleto Festival because of cultural experiences such as ballets operas theatre plays) were middle-aged and older (over 30 years of age)
Escaping from routine as motivation in attending FICA festival is more prevalent in relatively young visitors (below age 37) than in older visitors (age 38shy47)
Festival moderates (interested in festival but to lesser extent than the enthusiasts) to Spoleto Festival were younger (under 30 years of age)
Uysal Gahan and Martin (19938)
Kim Borges and Chon (2006961)
Anderson and Langmeyer (1982) as quoted by Homeman et 8 (200223) Formica and Uysal (199822)
In Table 21 above it is clear that previous research findings reveal definite characteristic
differences between older and younger (and in some instances middle-aged) visitorstourists Age
has therefore proved to be a pertinent demographic segmentation variable and more specifically a
significant segmentation variable in research relating to festivals In general it is evident that
middle-aged and older visitorstourists are more likely to attend festivals if they have children they
make use of writtenvisual information mediums they tend to be higher spenders (and income
generators) they are greater cultural enthusiasts and they travel for longer periods of time
Younger visitorstourists seem to be more associated with word-of-mouth as an information
medium they are higher spenders in only specific activitiesentertainment have lower incomes
and are to a lesser extent cultural enthusiasts
Therefore segmenting the visitors to Aardklop by means of correspondence analysis on the bases
of age as a demographic variable can help festival organisers to gain a better understanding of the
current market Knowledgeable and informed organisers can then adjust the festival programme
according to the needs motives and behaviours of these visitors identified segments as well as
develop appropriate and effective marketing strategies This will ensure the sustainability growth
continuity and success of the Aardklop festival
23 METHOD OF RESEARCH
The Institute of Tourism and Leisure Studies at the North-West University (Potchefstroom Campus)
has conducted surveys at the Aardklop National Arts Festival since 2001 by means of structured
questionnaires From 2005 to 2008 a total of 1671 questionnaires were completed by visitors to the
festival and the data from these surveys were used for the purpose of this study since the general
characteristics of the population remained similar over the four years The method of research will
19
be discussed with reference to (i) the questionnaire (ii) the samples and (iii) the method of market
segmentation
231 The questionnaire
The survey questionnaire used for the visitors to Aardklop remained similar throughout the four
year data collection period This questionnaire was also similar to previous questionnaires used at
other festivals in South Africa such as the Klein Karoo (Slabbert Saayman Saayman amp Viviers
2008) and Grahamstown National Arts Festivals (Viviers Siabbert Saayman amp Saayman 2008)
The questionnaire was divided into three sections and consisted mainly of closed questions (see
Appendix A) Section one included questions based on the socio-demographics of the visitor (such
as gender age language occupation and province of origin) followed by questions based on
behavioural elements (such as travel group size days spent at the festival productionsgenres
attended number of persons financially responsible for and spending) in section two In section
three more general behavioural questions were also asked such as the means through which
information regarding the festival was communicated (for example magazines newspapers and
newsletter)
232 The samples
The surveys were conducted annually during the festival in Potchefstroom by means of
convenience sampling Cooper and Emory (1995207) as well as Krejcie and Morgan (1970608)
point out that in any defined population for a population of 100 000 (N) the recommended sample
size (S) is 384 Table 22 below indicates that Aardklop has had a 4 year average of below 51 500
attendants With an average of 418 questionnaires per year over the four consecutive year period
the sample size is appropriate for this research
Table 22 Survey summary
Year Number of Number of Absolute number questionnaires questionnaires of visitors
distributed included in the data analysis
2005 420 407 36766
2006 420 413 61476
2007 24 Sep - 29 Sep 400 357 51870
2008 30 Sep -4 Oct 500 494 55518
TOTAL 1740 1671 205630 435 418 51408
Source Kruger et al (2008227) Saayman and Saayman (2007226) Saayman and Saayman (2006a837) Saayman and Saayman (2005945)
20
The survey was conducted by means of a self-administered questionnaire among adult visitors at
the festival These respondents were briefed about the purpose of the research and were willing
participants In order to limit response bias towards a certain group of festival attendants
questionnaires were distributed on-site but at different locations such as in the areasvenues of
shows and productions in the areas of closed streets where attendants gather between shows and
on the main festival grounds Field workers from the North-West University were trained to
administer the surveys and to understand the purpose of the study and the questionnaire in order
to assist respondents where necessary (but without interfering with the completion of the
questionnaire)
233 The method
The data was analysed using SPSS (Statistical Package for the Social Sciences) and Statistica
Correspondence analysis (CORA) sometimes called dual scaling is an exploratory technique for
analysing multi-way frequency tables Multi-way frequency tables are cross-classifications of two or
more categorical variables (Bartholomew Steele Moustaki amp Galbraith 200281 Calantone et a
198926) CORA transforms these tables consisting of numerical information (categorical data
frequencies) into a graphical display within a low-dimensional space This makes it easier to identify
the key features of the data when interpreting the information (Shanka amp Taylor 200457
Bartholomew et a 200281) The joint graphical display can help detect structural relationships or
associations between these categorical variables (row categories and column categories) (Hoffman
amp Franke 1986215) whereby respondents choosing the same category are plotted close to each
other and respondents choosing different categories are plotted as far apart as possible (Arrimond
Achenreiner amp Elfessi 200332) In other words the proximity between a pair of points is used to
interpret the underlying relationship between the points Closely aligned points reveal a strong
relationship (Chen 2001 346)
The most important feature of CORA is its multivariate nature that enables multivariate treatment of
multiple categorical data simultaneously (Gursoy amp Chen 2000585) The application of CORA is
therefore an effective segmentation tool since it allows for effective interpretation of the data in
order to identify and compare different segments in a market This method is applied in this
research where a demographic variable namely age (of the festival attendee) is the dependent
variable Age was categorised into six groups where 1 = under 18 years 2 = 18-25 years 3 = 26shy
35 years 4 = 36-45 years 5 = 46-60 years and 6 = older than 60 years These age categories of
respondents were corresponded with the showsproductions attended mediums through which
respondents heard about the festival number of people for whom the respondent is financially
21
responsible spending categories number of days attended the festival and province of origin The
results of the correspondence analysis will be discussed in the next section
234 Results
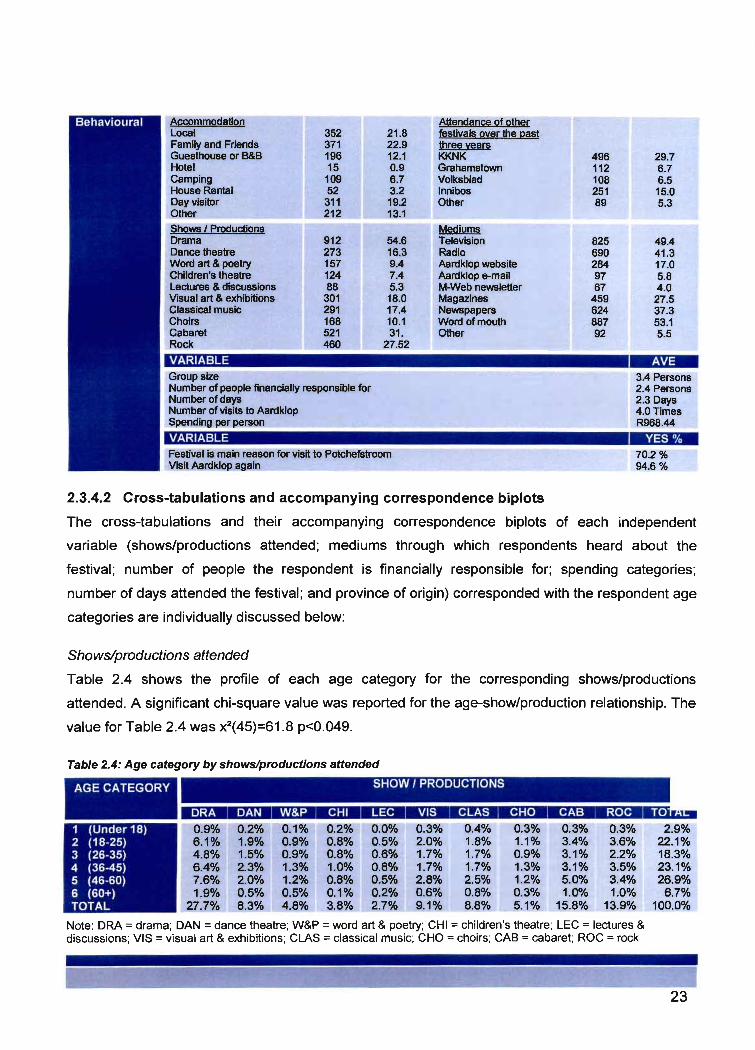
The empirical results are presented in two divisions namely (1) the general profile of the
respondent population to Aardklop over the period of four consecutive years (2005-2008) and (2)
the cross-tabulations and their accompanying correspondence biplots of the corresponded
variables with the age categories of respondents
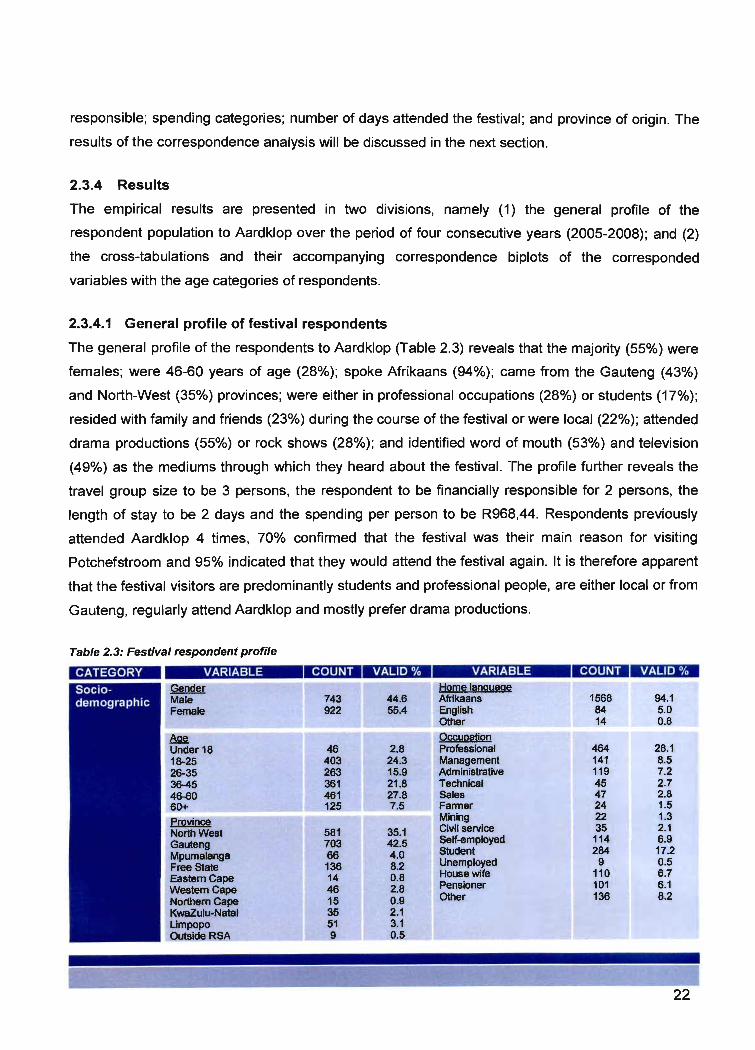
2341 General profile of festival respondents
The general profile of the respondents to Aardklop (Table 23) reveals that the majority (55) were
females were 46-60 years of age (28) spoke Afrikaans (94) came from the Gauteng (43)
and North-West (35) provinces were either in professional occupations (28) or students (17)
resided with family and friends (23) during the course of the festival or were local (22) attended
drama productions (55) or rock shows (28) and identified word of mouth (53) and television
(49) as the mediums through which they heard about the festival The profile further reveals the
travel group size to be 3 persons the respondent to be financially responsible for 2 persons the
length of stay to be 2 days and the spending per person to be R96844 Respondents previously
attended Aardklop 4 times 70 confirmed that the festival was their main reason for visiting
Potchefstroom and 95 indicated that they would attend the festival again It is therefore apparent
that the festival visitors are predominantly students and professional people are either local or from
Gauteng regularly attend Aardklop and mostly prefer drama productions
Table 23 Festival respondent profile
CATEGORY VARIABLE VARIABLE HQm2 Ignguag~
Male 743 446 Afrikaans 1568 941 Female 922 554 English 84 50
il Other 14 08
AIm OccultiQn Under 18 46 28 Professional 464 281 18-25 403 243 Management 141 85 26-35 263 159 Administrative 119 72 36-45 361 21 8 Technical 45 27 46-60 461 278 Sales 47 28 60+ 125 75 Farmer 24 15
Mining 22 13
~
~ Civil service 35 21 NorthWest 581 351 Self-employed 114 69Gauteng 703 425 Student 284 172 Mpumalanga 66 40 Unemployed 9 05 Free State 136 82 Housewife 110 67Eastemcape 14 08 Pensioner 101 61WestemCape 46 28 Other 136 82Northern cape 15 09
KwaZulu-Natal 35 21 Umpopo 51 31 Outside RSA 9 05
22
297 67 65 150 53
494 413 170 58 40
275 373 531 55
Number of people financially responsible for Number of days Number of visits to Aardklop Spending per person
VARIABLE
Festival is main reason for visit to Potchefstroom Visit Aardklop again
34 Persons 24 Persons 23 Days 40 Times R96844
702 946
2342 Cross-tabulations and accompanying correspondence biplots
The cross-tabulations and their accompanying correspondence biplots of each independent
variable (showsproductions attended mediums through which respondents heard about the
festival number of people the respondent is financially responsible for spending categories
number of days attended the festival and province of origin) corresponded with the respondent age
categories are individually discussed below
Showsproductions attended
Table 24 shows the profile of each age category for the corresponding showsproductions
attended A significant chi-square value was reported for the age-showproduction relationship The
value for Table 24 was x2(45)=618 pltO049
Table 24 Age category by showsproductions attended
SHOW I PRODUCTIONSAGE CATEGORY
ORA I DAN I WampP CHI LEG JWmiddot=eImiddotmiddotUr1= IWIIMii 1 (Under 18) 09 02 0100 02 00 03 04 03 03 03 29 2 (18-25) 61 19 09 08 05 20 18 11 34 36 221 3 (26-35) 48 15 09 08 06 17 17 09 31 22 183 4 (36-45) 64 23 13 10 08 17 17 13 31 35 231 5 (46-60) 76 20 12 08 05 28 25 12 50 34 269 6 (60+) 19 05 05degA 01 02 06 08 03 10 10 67 TOTAL 277 83 48 38 27 91 88 51 158 139 1000
Note ORA = drama DAN = dance theatre WampP = word art amp poetry CHI = childrens theatre LEC = lectures amp discussions VIS = visual art amp exhibitions CLAS = classical music CHO = choirs CAB = cabaret ROC = rock
AccommQdatiQn Local Family and Friends Guesthouse or 8amp8 Hotel Camping House Rental Day visitor Other
Shows l e~ugjQlsect Drama Dance theatre Word art amp poetry Childrens theatre Lectures amp discussions VISual art amp exhibitions ClaSSical music Choirs Cabaret Rock
VARIABLE
Group size
352 218 371 229 196 121 15 09
109 67 52 32
311 192 212 131
912 546 273 163 157 94 124 74 88 53
301 180 291 174 168 101 521 31 460 2752
Attend5n~ Qf Qther festivals over the [last three vears KKNK Grahamstown Volksblad Innibos Other
Mediums Television Radio Aardklop website Aardklop e-mail M-Web newsletter Magazines Newspapers Word of mouth Other
496 112 108 251 89
825 690 284 97 67
459 624 887 92
23
Figure 21 is the biplot for the cross-tabulation of age category by showsproductions attended
which reveals the relationships between the row (age categories) and column (showsproductions)
based on the proximities of the row and column points The biplot indicates that the older age
groups (46-60 years and over 60s) are more likely to attend cabaret shows visual art and
exhibitions as well as classical music On the other hand the younger generation (ages 18-25)
seemed to be more attracted to rock shows and word art and poetry The results suggest that
visitors in age group 4 (36-45 years) were more likely to attend dance theatre productions and
lectures and discussions It can be seen that drama is not related to a specific age group and is
therefore a genre generally attended by all aged visitors
- 05 lt1gt l J 1
04 (II lt1gt gt c 03 c shylt1gt- CHO
J1 shy2gt 0 02 w~ - r- 01NC) cj-OC) 00
Cii --shycr- -01 LEC lt1gt v EltD _ 0 -02 Cl~
-03 -025 -020 -015 -010 -0 05 000 005 010 015
Dimension 1 Eigenvalue 00786 (41 72 of Inertia)
Figure 21 Sipot of age category and shows productions attended
Note ORA =drama DAN =dance theatre WampP =word art amp poetry CHI =childrens theatre LEC = lectures amp discussions VIS = visual art amp exhibitions CLAS = classical music CHO = choirs CAB = cabaret ROC = rock
Mediums through which respondents heard about Aardklop
Table 25 shows the profile of each age category for the corresponding mediums through which
respondents heard about Aardklop A significant chi-square value was reported for the age-medium
relationship The value for Table 25 was x2(35)=591 plt0007
Tabe 25 Age category by mediums
MEDIUMSAGE CATEGORY
TV I RAD WEB I EM NL MAG NP I WOM I TOTAL
1 (Under 18) 2 (18-25) 3 (26-35) 4 (36-45) 5 (46-60) 6 (60+) TOTAL
07 47 37 50 53 13
206
06 37 37 38 43 11
173
04 17 13 17 19 04 76
02 06 05 06 07 02 27
01 04 03 04 04 01 17
06 24 21 26 32 06
116
07 37 29 37 41 10
161
08 61 40 50 52 12
224
42 234 185 228 251
59 1000
Note TV =television RAD =radio WEB = Aardklop website EM = Aardklop e-mail NL =M-Web newsletter MAG = magazines NP = newspapers WOM = word of mouth
24
Figure 22 is the biplot for the cross-tabulation of age category by mediums which reveal the
relationships between the row (age categories) and column (mediums) based on the proximities of
the row and column points The biplot indicates that age groups 2 and 3 (ages 18 to 35) were more
likely to rely on word of mouth The 46-60 year old respondents were more likely to hear about
Aardklop by means of written mediums such as magazines newspapers Aardklop e-mail and Mshy
Web newsletter It would also seem that the age group older than 60 also relies on the same
mediums as the 46-60 year olds The under 18s are separated from other age groups and the
Aardklop website is separated from other mediums
02 18
N
bull co
~ 01t 10 ~ gt ~o 00 ill I0
N CCi I -01 0 ~ ~ WEB Q) -02E is
-03 -02 -01 00 01 02 03
Dimension 1 Eigenvalue 00994 (6558 of Inertia)
Figure 22 Siplot of age category and mediums through which respondents heard about Aardklop
Note TV = television RAD = radio WEB =Aardklop website EM =Aardklop e-mail NL =M-Web newsletter MAG = magazines NP =newspapers WOM =word of mouth
Number ofpeople financially responsible for
Table 26 shows the profile of each age category for the corresponding number of people for whom
the respondent is financially responsible A significant chi-square value was reported for the ageshy
number of people financially responsible for relationship The value for Table 26 was x2(25)=3436
plt0001
Table 26 Age category by number ofpeople financially responsible for
NUMBER OF PEOPLE FINANCIALLY RESPONSIBLE FORAGE CATEGORY
1 PERSON 2 PPL i 3 PPL I 4 PPL I 5 PPL 6 PPL I TOTAL
1 (Under 18) 21 01 01 01 00 01 25 2 (18-25) 138 60 15 11 04 06 234 3 (26-35) 36 75 15 18 06 08 159 4 (36-45) 34 55 37 54 17 23 220 5 (46-60) 78 110010 35 41 13 10 286 6 (60+) 23 40 04 06 01 01 76 TOTAL 330 341 108 131 42 49 1000
Note PPL =people
25
Figure 23 is the biplot for the cross-tabulation of age category by number of people financially
responsible for which reveals the relationships between the row (age categories) and column
(number of people) based on the proximities of the row and column points The results suggest that
the respondents aged 18-25 only pay for themselves (1 person) at the festival The age groups that
appeared to be financially responsible for 2 people included the 26-35 year olds the over 60s
group and - because of the relatively low inertia of dimension 2 (2339) - the 46 to 60 year olds
could also be considered to carry financial responsibility for 2 people The 36-45 year old age
group on the other hand were more likely to be responsible for 3 to 6 people which probably
represent a family
0 7 en () 0 6 Ii
bull~ 0 5
~ 0 4 0 Ii) 0 3 ~
i 0 2 iii ~l Q) 0 1
~ poundc 0 0 Q)
-0 1 $ 0
-0 2 N c -03011
-04
~ -0 5 0
-06 -12 -10 -0 8 -0 6 -04 -02 00 0 2 04 06 08
Dimension 1 Eigenvalue 16338 (7499 of Inertia)
Figure 23 Siplot of age category and number ofpeople financially responsible for
Note PPL =people
Spending categories
Table 27 shows the profile of each age category for the corresponding spending categories A
significant chi-square value was reported for the age-spending relationship The value for Table 27
was x2(20)=647 plt0001
Table 27 Age category by spending category
SPENDING CATEGORY AGE CATEGORY
Spend 1 I Spend 2 I Spend 3 I Spend 4 Spend 5 I Total
1 (Under 18) 08 10 02 02 01 24 2 (18-25) 48 59 56 42 29 233 3 (26-35) 33 25 34 37 30 158 4 (36-45) 48 42 39 42 48 21 8 5 (46-60) 48 48 55 61 76 289 6 (60+) 13 17 14 14 18 77 TOTAL 198 201 201 198 202 1000
Note Spend 1 = under R240 Spend 2 = R240-R479 Spend 3 = R480-R829 Spend 4 = R830-R1449 Spend 5 = R1450+ These Rand-values reflect expenditure per person (deflated with consumer price index for 4 years data)
26
Figure 24 is the biplot for the cross-tabulation of age category by spending category which reveals
the relationships between the row (age categories) and column (spending categories) based on the
proximities of the row and column points Age group 5 (ages 46-60) appeared to be the spenders
as the results suggest that they are closely related to spending categories 4 and 5 (R830 and
more) Slightly younger visitors (age group 26 to 35 years) appeared to be spending between R480
and R1449 per person (spending category 3 and 4) The 18-25 year age group were the lowest
spenders as revealed by the close proximity (1823 inertia of dimension 2) of this age group to
spending categories 1 and 2 (below R480) The under 18s are separated from other age groups
probably because they are likely to be non-earning dependants
04 bull
Q)~ 0 3 ai ~ Ec _ 02 Q) 0
middotwQl - 0 1 C) - NN c IX) 00 r---~------------~-------+------~----+---~~~~----~ oCmiddotiii c -01 ~
ci -02 ~~~~~--~----~--~--~--~--~~~~--~--~------~
-09 -08 -07 -0 6 -0 5 -04 -03 -02 -01 00 01 0 2 0 3 04
Dimension 1 Eigenvalue 03142 (7454 of Inertia)
Figure 24 Siplot of age category and spending category
Note Spend 1 = under R240 Spend 2 = R240-R479 Spend 3 = R480-R829 Spend 4 = R830-R1449 Spend 5 = R1450+ These Rand-values reflect expenditure per person (deflated with consumer price index for 4 years data)
Number of days attended the festival
Table 28 shows the profile of each age category for the corresponding number of days the
respondent attended the festival A significant chi-square value was reported for the relationship
age - number ofdays The value for Table 28 was x2(15)=821 plt0001
Table 28 Age category by number of days attended the festival
I
AGE CATEGORY NUMBER OF DAYS
1 DAY 2-3 DAYS I 4-5 DAYS 6 DAYS I TOTAL
1 (Under 18) 2 (18-25) 3 (26-35) 4 (36-45) 5 (46-60) 6 (60+) TOTAL
06 25 41 51 60 16
199
07 83 71 87 126 23
397
12 105 36 66 76 33
327
02 28 09 15 18 04 77
28 242 157 21 8 281 76
1000
27
Figure 25 is the biplot for the cross-tabulation of age category by number of days attended the
festival revealing the relationships between the row (age categories) and column (number of days)
based on the proximities of the row and column pOints The biplot indicates that age group 2 (ages
18-25) was more likely to attend the festival for 4 days and longer The 36-60 year olds (age groups
4 and 5) seemed to stay for shorter periods of between 2 and 3 days Age group 3 (26-35 years)
appeared to attend the festival for only 1 day Due to the low inertia of dimension 2 the results
suggest that the under 18s and over 60s also attend the festival for 4-5 days
03 15
sect ~
cti 02 ~
~ 01 ~ ~i- 0 0
j N
-01
ll -0 2
-04 -0 3 -0 2 -0 1 00 0 1 0 2 0 3 0 4
Dimension 1 Eigenvalue 04295 (85 22 of Inertia)
Figure 25 Siplot of age category and number of days attended the festival
Province
Table 29 shows the profile of each age category for the corresponding province of origin A
significant chi-square value was reported for the age-province relationship The value for Table 29
was x2(45)=823 plt0001
Table 29 Age category by province of origin
AGE CATEGORY PROVINCE
NW I GAU I MPL FS I EC WC I NC I KZN i LIM INT I TOTAL
1 (Under 18) 13 1000 01 01 00 00 00 01 01 00 27 2 (18-25) 101 95 07 15 04 12 01 00 06 02 243 3 (26-35) 58 64 09 18 02 04 01 02 02 01 159 4 (36-45) 70 95 06 19 01 04 03 09 08 01 216 5 (46-60) 75 136 15 22 02 07 03 07 09 02 278 6 (60+) 34 24 03 07 00 01 01 02 04 00 76 TOTAL 351 424 40 82 09 28 09 21 30 05 1000
Note NW = North West GAU =Gauteng MPL = Mpumalanga FS =Free State EC = Eastern Cape WC = Western Cape NC =Northern Cape KZN =KwaZulu-Natal LIM =Limpopo INT =International origin
28
Figure 26 is the biplot for the cross-tabulation of age category by province of origin which reveals
the relationships between the row (age categories) and column (provinces) based on the
proximities of the row and column points It would seem that according to the results visitors from
the Gauteng Mpumalanga and Free State provinces are more likely to be in age groups 4 and 5
(36-60 years) It appears that visitors from the Limpopo province are also likely to be between the
ages of 36 to 45 The results further suggest that the locals (North West province) are more likely to
be between the ages of 18 and 25 years and probably represent the prominent student market in
Potchefstroom
0 4~~~~--~---r------~------~--~~------~------~
Qj ro 03 2t WC ~ ~ 02 e shy~ 0 01 Wshy- N 00 middot Nltt eOO -012 N wshy t-C e shyQ)N -02 Eltt- shy -03Cl~
-04 L-~__---L__~__---__~_______L-__~--_____---_____I
-06 -04 -02 00 02 04 06 08
Dimension 1 Eigenvalue 02647 (5294 of Inertia)
Figure 26 Siplot of age category and province of origin
Note NW =North West GAU =Gauteng MPL =Mpumalanga FS =Free State EC =Eastern Cape WC =Western Cape NC =Northern Cape KZN =KwaZulu-Natal LIM =Limpopo INT =International origin
A layout of the results in a summarised format is captured in Table 210 below
Table 210 Summary of the age categories by variables
AGE CATEGORY VARIABLE
Age 1 (Under 18)
Age 2 (18middot25)
I I
Age 3 (26middot35)
Age 4 (36middot45)
I Age 5 (46-60)
I
I Age 6 (60+)
Shows I Dance theatre Classic Classic
productions Rock Word art amp poetry
Lectures amp discussions
Cabaret Visual arts amp
Cabaret Visual arts amp
exhibitions exhibitions
Mediums
Word of mouth Word of mouth
Magazines Newspapers M-web newsletter Aardklop e-mail
Magazines Newspapers M-web newsletter Aardklop e-mail
Financial res onsibility
1 person 2 people 3-6 people 2 people 2 people
Sending Spend 1 amp2 Spend3amp4 Spend 4 amp5
Days 4-5 days 4+ days 1 day 2-3 days 2-3 days 4-5 days
Province Mpumalanga Mpumalanga
NorthWest Gauteng Free State
Gauleng Free State
Umpopo
29
24 FINDINGS AND IMPLICATIONS
The results of the analysis confirm the existence of significant differences in socio-demographic
and behavioural variablescharacteristics between different age groups of visitors to Aardklop
National Arts Festival Based on the results the following findings were revealed
bull Very few festival visitors are older than 60 (75) as opposed to 925 being younger than 60
This finding is in part confirmed by Backman et al (199521) who revealed that festival visitors
are more likely to be under 50 years of age
bull The age groups 46-60 and older than 60 were more likely to hear about Aardklop in written
media such as magazines newspapers the M-Web newsletter and Aardklop e-mail Younger
visitors aged 18-35 (age categories 2 and 3) relied more on word of mouth as a means through
which they heard about Aardklop This research finding partially supports the findings of
Shanka and Taylor (200458) who indicated that young visitors (18-25 years) depend on word
of mouth whereas the age group 55 and over depend on newspapers as a source of
information They also indicated that the age group 45-54 depends on television as a medium
however this does not seem to be the case with visitors to the Aardklop festival
bull Older visitors (aged 46-60) seemed to be associated with the two highest spending categories
at the festival (respectively R830-R1449 and R1450+) This result confirms research by
Formica and Uysal (199822) Jang et al (2004) Saayman and Saayman (2006b217) Thrane
(2002284) Kruger et al (2009) as well as Jang et al (200283) who have found that older
aged (and in some cases middle-aged) festival visitors pleasure travellers and consumers
earning higher incomes are associated with higher spending and show more diligent spending
(shopping) behaviour
bull Younger visitors (aged 18-25) spend the least as indicated by spending categories 1 and 2
(respectively under R240 and R240-R479) This could be consistent with findings of Formica
and Uysal (199822) who indicated that festival visitors younger than 30 earn a lower income
which may result in lower spending However the findings are inconsistent with research by
Dardis et al (1994315) Mehmetoglu (2007213) Pouta et al (2006131) and Mok and Iverson
(2000302) who found that younger aged leisure and nature-based consumers (and in some
cases middle-aged consumers) are associated with higher spending
bull Visitors aged 18-25 years were more likely to attend rock showsconcerts This confirms
research findings by Schaninger and Danko (1993) (as cited in Holbrook and Shindler
(199627) who indicated that young consumers (bachelors) are high spenders at entertainment
events such as concerts
30
bull Visitors in age category 4 (36-45 years) were more likely to attend productionsshows such as
dance theatre and lectures and discussions while age categories 5-6 (46 years and older) were
more associated with attending showsproductions such as classical music cabaret and visual
art and exhibitions These findings are to some extent supported by research by Formica and
Uysal (199822) who found that middle-aged and older festival visitors enjoy cultural
experiences such as ballets operas and theatre plays
bull Festival visitors in age categories 3 4 and 5 (ages 26-60) stay for shorter periods of time (1-3
days) The very young and very old age groups (younger than 25 and older than 60) appear to
stay for longer periods of time The latter is partially confirmed by researchers Shoemaker
(1989) Blazey (1991) Pearce (1999) and Backman et al (1999) (as quoted by Horneman et
al (200223raquo who found that senior travellers stay away (or stay at their destinations) for
longer Research by Mak et al (19776) made similar findings pointing out that young and aged
visitors stayed much longer than the visitors in the in-between age groups
bull Locals (visitors in the region of Potchefstroom) or visitors who come from the North West
province were likely to be younger (between the ages of 18 and 25) This contradicts the
research conclusions of Formica and Uysal (199817) who found that out-of-region festival
visitors were younger
These findings suggest some important implications for and challenges to the marketersorganisers
of the Aardklop National Arts
bull The results emphasise that the majority (925) of visitors to Aardklop National Arts Festival
are younger than 60 The largest age categories namely 46-60 year olds and 18-25 year olds
respectively account for 278 and 243 of the respondents Marketing strategies should
therefore focus predominantly on these visitors since they represent a prominent portion of the
total population Implications for targeting these visitors follow below
bull The 46-60 year olds (age category 5) are the highest spenders and enjoy showsproductions
such as classical music cabaret and visual arts and exhibitions These types of
showsproductions along with drama (which is likely to be attended by most age groups (as
indicated in Figure 21) and accounts for 546 of the genres attended by the entire
population) could be used in promotions and in marketing communication efforts These
marketing communication efforts should specifically include written media such as magazines
newspapers Aardklop e-mail and the M-web newsletter Marketing efforts that utilise local
newspapers in the Gauteng and Free State provinces as a medium of communication could
prove to be effective since Gauteng and Free State visitors are the largest and third largest
markets respectively and are also the provinces associated with this age group Two to three
31
day packages including a variety of showsproductions (but primarily including the aforeshy
mentioned genres) could prove to be a popular promotional product and further increase
exposure to the arts The option of promotional packages for 2 persons or couples (comboshy
packages) should also be considered since respondents in this age group tend to be financially
responsible for two people and would possibly find such an offer appealing
bull The 18-25 year olds (age category 2) are the lowest spenders but the second largest group in
the population Therefore profitability of the festival in this regard could be based on the large
numbers of young local festival visitors attending the festival Discounted packages for
individuals including rock shows word art and poetry and drama could therefore prove to be
successful Other genres could be gradually introduced to these packages to increase their
exposure to the arts and love thereof Investing in this market segment (who already shows a
prominent interest in the arts regardless of their lower spending) should lead to the increase of
festinos to the Aardklop festival in the future as this market matures in age and financial status
Effective promotions such as attractive and affordable packages will result in satisfied
customers which should further contribute to word of mouth as marketing medium
bull The focus should not only be on the high spending 46-60 year old Gauteng market and the
large local student market but also on the remaining (and smaller) markets with potential The
variety of shows and productions already offered by the Aardklop programme and the potential
of these remaining markets make it unnecessary for Aardklop to introduce additional features to
the festival The 26-35 year olds (age category 3) reveal average to relatively high spending
(spending categories 3 and 4) The extent of spending along with the length of stay (1 day) of
this age category indicates true potential therefore festival marketers should concentrate their
marketing efforts on encouraging them to stay longer (which usually results in increased visitor
spending) If the two to three day package deals for two people or couples (as recommended
for the age category 5 market) do not encourage longer stay and do not appeal to this age
group immediately (since they seem to prefer the day-visitor option) single day packages for
two people or couples could also prove to be successful in fulfilling their needs and trends thus
sustaining visitor numbers to the festival Another remaining market with potential namely age
category 4 (36-45 year olds) would benefit from bulk packages that offer group discounts since
these respondents are financially responsible for 3 to 6 people Their packages along with the
standard drama productions should include dance theatre and lectures and discussions
25 CONCLUSIONS
The purpose of this article was to apply correspondence analysis with age as the dependent
variable in order to better understand the Aardklop market Internationally and in South Africa
32
limited market segmentation research on festivals (and more specifically arts festivals) by means of
correspondence analysis has been done This study can therefore be considered as a benchmark
in the South African research context The literature review indicated that the socio-demographic
behavioural and other variables vary between different aged visitorstourists The results in this
study confirm that each age category of the visitors to Aardklop can be associated with specific
variables Thus a market profile of different aged visitors to the festival was formulated This is
beneficial to the marketersorganisers of Aardklop since the festival productprogramme as well as
associated marketing efforts can be developed according to the needspreferences of these
markets
It is clear that correspondence analysis is a viable exploratory method for applying market
segmentation Future researchers should therefore consider using this method because it is useful
in transforming two or more categorical variables into a low-dimensional graphical making it easier
to identify the key features of the data when interpreting the information Applying correspondence
analysis with age as the dependent variable to other festivals in South Africa could enhance
comparative research It is also recommended that correspondence analyses be applied to other
tourism products within the industry or by means of other segmentation variables (for instance
province of origin or repeat visitors versus first time visitors) Finally continuous market
segmentation should be applied to Aardklop in order for festival organisersmarketers to stay aware
of trends and changes in visitor preferences so as to adapt marketing efforts accordingly
33
CHAPTER 3 Expenditure-based segmentation of visitors to the Aardklop National Arts Festival
31 INTRODUCTION
Globally the number of festivals is on the increase As a result competition and changes in the
South African festival market have far-reaching implications for most artscultural festivals such as
declines in the number of festival visitors ticket sales or both (Saayman amp Saayman 2006a40-41)
With the advent of newly launched festivals festival markets are becoming increasingly diversified
and cannot be characterised as homogeneous (Gursoy Kim amp Uysal 2004 171 Dibb amp Simkin
2004347 Hassan 2000240 Mules amp Faulkner 1996107 Saayman amp Saayman 2004636)
Mykletun Crotts and Mykletun (2001 494) agree and argue that not all groups of visitors at a
festival are alike therefore important to periodically assess which segments provide the greatest
return-on-investment Laesser and Crouch (2006397) also point out that a possible means to
achieve improved returns is through an appropriate market segmentation strategy in other words
by targeting the groups of visitors (and their needs) that generate high returns According to Cook
and Mindak (198480) and Twedt (196471) it is often the case that the heavy users account for a
large percentage of overall expenditurereturns The use of visitor expenditure in tourism marketing
to segment the market in order to determine the high spenders is a comprehensive means to apply
market segmentation (Diaz-Perez Bethencourt-Cejas amp Alvarez-Gonzales 2005961 Saayman
Van der Merwe amp Pienaar 2008 Mok amp Iverson 2000299 and Legoherel amp Wong 200616)
Identifying high spenders by means of market segmentation can therefore assist festivals such as
the Aardklop National Arts Festival (hereafter referred to as Aardklop) in targeting the right market
Aardklop is the third largest festival of its kind in South Africa with a total estimated economic
impact of R4665 million and more than 55000 visitors in 2008 (Kruger Saayman amp Saayman
200827) This predominantly Afrikaans cultural event takes place in the city of Potchefstroom
(situated in the North West Province) for 5 successive days during September and hosts
approximately 85 productions by 390 artists across a variety of genres such as theatre dance
34
cabaret jazz rock literature childrens and street theatre as well as visual arts (ANON 2008
Raath 2009 Van Heerden 200311)
Since its debut in 1998 Aardklop has become an established event on the festival calendar of
South Africa The current status of Aardklop reveals varying growth rates regarding visitor numbers
number of tickets sold direct spending of visitors average days spent at the festival as well as
overall economic impact (Kruger et al 200826-29 Saayman amp Saayman 2006a36-41) Table 31
captures the figures reflecting varying growth over the past four years and suggests that Aardklop
is showing signs of potential decline especially in ticket sales although it is not in a definite decline
phase of its product life-cycle yet
Table 31 Overview of economic impact and profile ofAardklop 2005 - 2008
Year 2005 2006 2007 -shyAbsolute number of visitors 36766 61476 51870 55518
Total tickets sold 91156 81022 84559 79530
Number of travel groups 15193 19393 16678 15294
Travel group size 2 3 3 4
Average tickets per group 6 4 5 5
Average days attended festival 3 3 3 3
Total visitor days 113240 196108 168 576 172 106
Average spending per group R217438 R177955 R2 61255 R279997
Direct spending of visitors at festival R21574794 R24237640 R27999000 R26 735 791
Total economic impact R39171741 R42908324 R53097645 R46650703
Will visit the festival again 95 94 97 93
Source Kruger et al (200826-29) Saayman amp Saayman (2006a36-41)
bull Aardklop had an exceptional year in 2007 and was extended with a few days to celebrate its 10 year anniversary this could possibly account for its higher economic value in 2007
Ticket sales may be increased by identifying high spenders by means of market segmentation
since they account for a large percentage of overall sales The aim of this article is therefore to
apply expenditure-based segmentation to identify which socio-demographic and behavioural
variables distinguish the high spenders at the festival This will assist Aardklops
marketersorganisers to understand and cater for the needs and preferences of these high
spenders thereby ensuring the sustainability and further growth of Aardklop To achieve this aim
the article is structured in the following manner first a literature review is offered followed by a
description of the survey a discussion of the results and finally a discussion of the implications
and the conclusions
35
32 LITERATURE REVIEW
According to Saayman and Saayman (2006b219 2005582) the sustainability of a festival must be
attained at three levels namely economic environmental and socio-cultural Achieving
sustainability therefore strongly depends on enhancing economic benefits (yVTO 2002 1) The
economic impact of a festival is measured by the size of the festival in terms of (1) number of
visitors (2) visitor spending (3) duration of stay and (4) the multiplier effect (Saayman 2000114)
According to Murphy and Carmichael (1991 32) the increased expenditure and economic
contribution to the destination area due to the anticipation of tourists is a common feature of any
eventlfestival With an estimated economic impact of R46 million (Kruger et a 200828) due to
visitor expenditure Aardklops impact and benefits on the host destination is evident proving why
festivals are organised in the first place (Thrane 2002281) Since visitor expenditure also includes
spending on ticketed showsproductions the economic impact is also measured by the size of the
festival in terms of the number of ticketed showsproductions sold The advantage of ticket sales as
opposed to the number of visitors attending the festival (but not necessarily spending at the
festival) is that the overcrowding associated with the festival may be alleviated or avoided all
together Other advantages include a more favourable impact on the environment and the host
community Therefore in order to sustain the nature of the festival it is important to identify and
attract visitors who attend ticketed showsproductions (Kruger 20093)
Research by Thrane (2002281) Saayman and Saayman (2006b220) and Kruger (200934)
indicated that visitors attending festival showsproductions stay longer and spend more than those
not interested in showsproductions This results in a greater overall personal expenditure during
the festival Therefore one of the best ways to increase economic benefits without necessarily
increasing the number of tourists is to encourage tourists to stay longer and provide opportunities
for them to increase spending (Gokovali Bahar amp Kozak 2007737 WTO 20022) This in turn
contributes to a greater economic impact of the festival (Gokovali et a 2007737 Kastenholz
2005556) and ensures its growth and sustainability
Since the total economic impact of a festival is a function of both the direct and indirect
expenditures made by visitors (Lee Lee Lee amp Babin 200856) it is important to understand visitor
spending behaviour at a festival and the underlying variables affecting such behaviour (Mok amp
Iverson 2000300) Kruger (20093) has also found that ticket sales and the types of
showsproductions attended can be used as an indicator of visitor interest in a festival and of how
successfully the programme addresses and fulfils visitors needs When needs and expectations
are met or exceeded consumer satisfaction will increase this is pivotal to establishing a long-term
consumer relationship ensuring repeat business higher usage and increasing the probability of the
36
consumer recommending the service to someone else (Lee et al 200858) Mok and Iverson
(2000299) stress that understanding tourists expenditure patterns and activities allows marketers
to strategically plan facilities and amenities Market segmentation is the means through which these
expenditure patterns and activities of tourists can be understood a suitable marketing strategy can
be developed and the continuous growth and sustainability of the festival can be ensured
According to Spotts and Mahoney (1991 42) segmenting travel markets on the basis of travel
expenditure is furthermore a useful alternative to the more common approach of segmenting on the
basis of travel This is because (festival) marketers seek visitors who will spend money and not just
time at tourism (festival) products (Mok amp Iverson 2000299) In terms of managerial implications
expenditure is considered to be an important factor that helps to understand the consumption
behaviour of tourists since this enables tourism (festival) marketers to develop appropriate
products (festival programmes) and to evaluate the economic benefits of each segment (Legoherel
ampWong 200616)
The underlying rationale of identifying market segments on grounds of expenditure is based on the
necessity to increase the effectiveness and efficiency of marketing programmes and their
resources both in terms of addressing (1) the right group of people and (2) their relevant needs
(Laesser amp Crouch 2006397) Touristvisitor spending is furthermore one of the most critical
variables of analysis for tourist destinations (festivals) since it directly determines the festivals
profitability (Frechtling 200626) It is therefore important to determine which visitors spend most at
a festival and which variables are most influential in determining their expenditure levels
(Kastenholz 2005557) According to Gokovali et al (2007737) once the factors that affect visitor
expenditure are identified policy development will be possible to strengthen the spending to
maximise economic benefits of a festival Festival organisers can thus effectively apply the
variables when doing market segmentation to focus their marketing efforts on those visitors who
spend the most at the festival (Kruger et al 200816)
Kruger (2009 17-18) cites studies which show that various benefits can be derived from applying
expenditure-based segmentation (Wilton amp Nickerson 200621 Thrane 2002286 Woodside
Cook amp Mindak 198710 Davies amp Mangan 1992698 Mok amp Iverson 2000304) namely
bull niche marketing
bull determining the attractiveness and viability of visitor segments
bull a clear distinction between heavy spenders and heavy users
bull maximised economic benefits
37
bull better aimedstrategic marketing efforts
bull visitor loyalty coupled with repeat visits as well as
bull better understanding and application of behavioural characteristics that influence visitor
spending
Marketers of different types of tourism products have made various attempts to segment the
tourism market into high medium and low expenditure groups and to identify the characteristics of
each group (see Mok amp Iverson 2000 Saayman amp Saayman 2006b Saayman et al 2008 Spotts
amp Mahoney 1991 Pizam amp Reichel 1979 Mehmetoglu 2007 Pouta Neuvonen amp Siev~nen
2006 Raaij amp Francken 1984 Woodside et al 1987 Kruger Saayman amp Saayman 2009 and
Thrane 2002) Results from previous research findings reveal definite characteristics that
distinguish high spenders from other spending segments in the market Expenditure can therefore
be seen as a significant segmentation variable
Table 32 Characteristics distinguishing high spenders from medium and low spenders
CHARACTERISTICS
Income
Socio-demographics
Geographic
Travel behaviour
HIGH SPENDERS
High spenders tend to earn higher income I salaries
Older aged consumers are associated with higher spending Younger aged consumers are associated with higher spending High spenders are prone to have a higher level of education Children are more likely to be present with high spenders High spenders can be associated with certain nationalities and geographic originsregions (depending on the study at hand) High spenders are associated with longer stays
High spenders are associated with shorter stays Tourists travelling for the purpose of honeymoons tend to be high spenders Travelling with spouse gir1-1boyfriend and parents tend to result in greater spending High spenders tend to travel in smaller travel parties High spenders tend to travel in larger travel parties High spenders tend to travel individually rather than in groups
AUTHORS
Dardis Soberon-Ferrer amp Patro 1994 Legoherel 199819 Lee 2001659 Jang Bai Hong amp OLeary 2004331 Saayman amp Saayman 2006b220 Thrane 2002285 Woodside at a 198711 Saayman at a 2008 Jang et a 2004319 Kruger at a 2009 Jang Ismail amp Ham 200283 Dardis at a 1994319 Mok amp Iverson 2000304 Dardis at a 1994319 Pizam amp Reichel 197942 Woodside at a 198711 Spotts amp Mahoney 1991 24 Cai Hong amp Morrison 199515 Legoherel 199819 Diaz-Perez et aI 2005961 Laesser amp Crouch 2006401 Jang et a 200283 Jang at a 2004331 Thrane 2002285 Spotts amp Mahoney 199124 Mehmetoglu 2007213 Downward amp Lumsdon 2004415 Saayman amp Saayman 2006b220 Kruger at a 2009 Mok amp Iverson 2000304 Jang et a 200283 Legoherel 199830
Mok amp Iverson 2000304
Jang at aI 200283 Cai at a 199515
Mok amp Iverson 2000304 Saayman amp Saayman 2006b220 Spotts amp Mahoney 199124 Lee 2001659 Jang at a 2004331 Jang at a 200283 Mok amp Iverson 2000304
38
High spenders are more likely to be first-time Jang et a 2004331 Opperman 1997178 visitors to a destination High spenders tend to travel longer distances Saayman et a 2008 Pouta Neuvonen amp to the destination Sievanen 2006132 Cannon amp Ford
2002263 Lee 2001 659 Leones Colby amp Crandall 199856 Long amp Perdue 199012
Visitors travelling for purposes of working Laesser amp Crouch 2006401 holidays as well as delegates to conferences are asSociated with higher spending Conference delegates travelling with spouses Laesser amp Crouch 2006401 are inclined to be hgher spenders
Recreation and leisure High spenders tend to be highly attracted to Mok amp Iverson 2000304 activities shopping
Visitors who have attended other festivals are Saayman and Saayman 2006b217 Kruger also more inclined to fall into the highshy et a 200828 spender ca~ory Visitors with festivals as main reason for Thrane 2002284 Kruger at a 200828 travel tend to spend more as opposed to Kruger 200934 other reasons High spenders tend to be more involved with Spotts amp Mahoney 199124 Legoherel recreation and are associated with higher 199830 usage of travel information High spenders tend to attend drama music Kruger 200950 theatre and cabaret and contemporary music showsproductions
Seasonality Peak seasons are associated with higher Jang at a 200283 spending
In general it is evident from Table 32 that high spenders tend to earn a higher income are higher
qualified are accompanying children and stay for longer at their destinations They can also be
associated with certain nationalities or geographical areas travel longer distances and are
frequent users of travel information High spenders at a festival often visit other festivals too and
consider the festival as the main reason for their travel to a destination Expenditure-based
segmentation can therefore assist Aardklops marketersorganisers to differentiate between the
high spenders and other spending segments in the market as well as to determine the viability of
targeting this market This information can be used to (1) determine the profile of the high spenders
at the festival and (2) increase visitor spending by attracting these visitors by means of a
customised festival programme
Based on the above applying expenditure-based segmentation to visitors attending Aardklop will
prove to be extremely helpful especially from a marketing point of view This research will greatly
assist Aardklops marketers and organisers to determine what it takes to encourage visitors to
attend the ticketed showsproductions how the festivals appeal for high spenders could be
maximised and how high spenders could be encouraged to stay longer
33 METHOD OF RESEARCH
The Institute for Tourism and Leisure Studies at the North-West University (Potchefstroom
Campus) has conducted surveys at the Aardklop National Arts Festival by means of structured
39
questionnaires since 2001 From 2005 to 2008 a total of 1671 questionnaires were completed by
visitors to the festival and the data from these surveys was used for the purpose of this study since
the general characteristics of the population remained similar over the four years The method of
research will be discussed by means of (i) the questionnaire (ii) the samples and (iii) the method of
market segmentation
331 The questionnaire
The survey questionnaire used for the visitors to Aardklop remained similar throughout the four
year data collection period This questionnaire was also similar to previous questionnaires used at
other festivals in South Africa such as the Klein Karoo (Slabbert Saayman Saayman amp Viviers
2008) and Grahamstown National Arts Festivals (Viviers Siabbert Saayman amp Saayman 2008)
The questionnaire was divided into three sections and mainly consisted of closed questions (see
Appendix A) Section one included questions based on the socio-demographics of the visitor (such
as gender age language occupation province of origin) followed by questions in section 2 based
on behavioural elements (such as travel group size days spent at the festival productionsgenres
attended number of persons financially responsible for and spending) Questions relating to
spending were category-specific (such as accommodation shows food and beverages shopping
recreation and transport) There were no questions about household income because this
information was considered to be too sensitive To compensate for this visitor occupation was
classified according to low medium and high income levels which can be viewed as a weak proxy
for income This is to account for the influence of discretionary disposable income on spending In
section three more general behaviour questions were also asked such as the means through
which information regarding the festival was communicated (for example magazines newspapers
newsletter etcetera)
332 The samples
For four consecutive years the surveys were conducted annually during the festival in
Potchefstroom by means of convenience sampling Aardklop has a 4-year average of just fewer
than 51 500 visitors (Kruger et al 200827 Saayman amp Saayman 2006a37) Cooper and Emory
(1995207) as well as Krejcie and Morgan (1970608) argue that in any defined population for a
population of 100 000 (N) the recommended sample size (S) is 384 per survey Table 33 lists the
sample size for each year With an average of 418 questionnaires per year over the consecutive 4shy
year period the sample size is applicable
The survey was conducted among adult visitors at the festival by means of a self-administered
questionnaire These respondents were briefed about the purpose of the research and were willing
40
participants In order to limit response bias towards a certain group of festival visitors
questionnaires were distributed on-site but at different locations such as in the areasvenues of
shows and productions in the areas of closed streets where visitors gather between shows and on
the main festival grounds Field workers of the North-West University were trained to administer the
process and to understand the purpose of the study as well as the questionnaire in order to assist
respondents where necessary (but without interfering with the completion of the questionnaire)
Questionnaires were distributed on each day of the 5-day festival period This ensured that the
feedback received by the sample population was an accurate portrayal of visitor spending
Questionnaires of respondents who did not complete the spending information or who did not give
account of the number of people for whom they were financially responsible were disregarded
This reduced the number of cases in the dataset from N=1671 to N=1544 (see Table 33 below)
Table 33 Questionnaires completed during Aardklop National Arts Festivals 2005 - 2008
Date 2005 2006 2007 2008 28 Sep - 1 Oct 27 Se - 3 Oct 24 Se - 29 Se 30 Sep -4 Oct
Number of visitor 407 413 357 494 16t questionnaires
Adjusted sample 383 347 342 472 1544
Source Saayman amp Saayman 2005a9 Saayman amp Saayman 2006a8-9 Saayman amp Saayman 20072-3 Kruger Saayman amp Saayman 20082
Most questions have an assigned number depending on the chosen answer which is used in the
analysis The socio-demographic and behavioural variables used along with the assigned numbers
(coding) are described in Table 34 below
Table 34 Questions used and their descriptions
QUESTION DESCRIPTION CODING VARIABLE
Home language Afrikaans = 1 Other = 0 LANGUAGE Male = 1 Female=O GENDER
8gsect ~
Yes = 1 No = 0 AGE 1 Yes = 1 No = 0 AGE 2
bull Under 18 bull 18 - 25
Yes = 1 No = 0 AGE 3bull 26 - 35 Yes = 1 No = 0 AGE 4bull 36-45 Yes = 1 No = 0 AGE 5bull 46- 60 Yes = 1 No =0 AGE 6
bull 60+
Occupation OCCUPATION 1bull High income ~ Professional Management Yes = 1 No = 0
Self-employed bull Medium income = Technical Sales Farmer Yes = 1 No = 0 OCCUPATION 2
Mining Administrative Civil service bull Low income = Housewife Pensioner Student Yes = 1 No =0 OCCUPATION 3
Unemployed
NORTHWESTProyjnce Yes = 1 No=O bull NorthWest Yes = 1 No =0 GAUTENG
bull Gauteng Yes = 1 t-NV and Gauteng = 0 OTHER PROVINCES
bull Other
41
Accommodation bull Non-paid accommodation = Local resident
Family or friends Day visitor bull Paid accommodation = Registered guesthouse
or B+B I Festival guesthouse Hotel Rent full houseOther
bull camping
GroUP sjze Nymber of days Number of visits to AardlslOP Number of tickets
Festival main reason for visit 10 Potchefstroom
VIsit Aardklop again
Attendance of other festivals over the past three ~
bull KKNK bull Grahamslown bull Volksblad bull Innibas bull Other
Shows I productions
bull Drama bull Dance theatre bull Word art amp poetry bull Childrens theatre bull Lectures amp discussions bull Visual art ampexhibitions bull Classical music bull Choirs bull Cabaret bull R)Ck
FreeSbows
Medlyms bull Television bull Radio bull Aardklop website bull Aardklop e-mail bull M-Web newsletter bull Magazines bull Newspapers bull Word of mouth bull Other
333 The Method
Yes = 1 No = 0
Yes = 1 No = 0
Yes = 1 No = 0
Open question Open question Open question Open question
Yes=1No=0
Yes = 1 No = 0
Yes = 1 No = 0 Yes = 1 No = 0 Yes = 1 No = 0 Yes = 1 No = 0 Yes = 1 No =0
Yes = 1 No = 0 Yes = 1 No = 0 Yes = 1 No =0 Yes = 1 No = 0 Yes = 1 No = 0 Yes = 1 No = 0 Yes = 1 No = 0 Yes = 1 No = 0 Yes = 1 No=O Yes = 1 No=O
Yes = 1 No = 0
Yes = 1 No = 0 Yes = 1 No = 0 Yes = 1 No = 0 Yes=1 No=0 Yes = 1 No=O Yes=1No=0 Yes =1 No = 0 Yes = 1 No = 0 Yes=1No=0
ACCOMMODATION 1
ACCOMMODATION 2
CAMPING
GROUP-SIZE DAYS TIMES
TICKETS
REASON
VISIT AGAIN
KKNK GRAHAMSTOWN
VOLKSBLAD INNIBOS OTHER
DRAMA DANCE THEATRE
POETRY CHILD THEATRE
LECTURES VISUAL ARTS
CLASSICAL MUSIC CHOIRS
CABARET ROCK
FREE SHOWS
TV RADIO
WEBSITE E-MAIL
NEWSLETTER MAGAZINES
NEWSPAPERS WORD OF MOUTH
OTHER
In the analysis spending per person is the dependent variable The data was analysed using SPSS
(Statistical Package for the Social Sciences) Total expenditure was calculated by adding each
respondents spending category entries and subtracting the transport cost to the festival since
including this expense leads to bias for visitors further away from Potchefstroom The total
expenditure was then divided by the number of people for whom the respondent was financially
responsible during the trip This resulted in total spending per person In order to render real
expenditure per person that is comparable across the four years of pooled data from the reduced
dataset (N=1544) (Table 33) the total expenditure per person was deflated with the consumer
price index The real expenditure per person variable was used to create spending segments
42
Cluster analysis measures the distance in rands (ZAR) between cases on a combination of
dimensions and uses this to identify groups of cases within which there is considerable
homogeneity and between which there are clear boundaries (Gough Eardley Bradshaw Ditch amp
Whiteford 199721) K-means clustering (a non-hierarchical segmentation technique) was used to
organise visitors into groups with similar expenditure patterns K-means clustering requires the
researcher to specify a priori the number of clusters (k) and thus provides a preliminary testing of
alternative typologies (Gough 19964) Taking into account practical considerations for segmenting
the arts festival market the study findings appeared to be more manageable and easier to
communicate for three (low medium high) to five (low low-medium medium high-medium high)
expenditure groups The clustering begins by using the values of the first n cases as temporary
estimates of the k cluster means Initial cluster centres form by assigning each case in turn to the
cluster with the closest centre and then updating the centre until final cluster centres are identified
Within each step cases are grouped into the cluster with the closest centre and the centres are
recomputed until no further change occurs in the centres (Pitruzello 1999) It offers a good range
of information to help interpret the results and is therefore the technique selected here As a result
four clusters were identified
One-way analysis of variance (ANOVA) was performed to test for significant associations and
differences between expenditure segments and categories based on socio-demographic and
behavioural variables as measured by the questionnaire Furthermore AN OVA was accompanied
by Welch and Brown-Forsythe robust tests to further explore the differences among segments
334 Results
The empirical results are presented in three sections namely (1) the general profile of the
respondent population to Aardklop over the consecutive four year period (2005-2008) (2) the
expenditure clusters and (3) the ANOVA results
3341 General profile of festival respondents
The general profile of the respondents to Aardklop (Table 35) reveals that the majority (55) were
females 46-60 years of age (28) spoke Afrikaans (94) came from the Gauteng (43) and
North West (35) provinces were in the high income occupations (44) resided with family and
friends (23) or were local (22) attended drama productions (55) or rock shows (28) and
identified word of mouth (53) and television (49) as the mediums through which they heard
about the festival Travel group size is 3 persons respondents are financially responsible for 2
persons the length of stay is 2 days and the spending per person is R96844 Respondents
attended Aardklop 4 times before the festival was their main reason for visiting Potchefstroom and
43
95 would attend the festival again In brief it is apparent that the festival visitors are
predominantly students and professional people are local or from Gauteng regularly attend
Aardklop and mostly enjoy drama productions
Table 3S Festival respondent profile
CATEGORY VARIABLE UmiddotIJ~W1p_ VARIABLE
~ Iom~ 11I[]9i9~ Male 743 446 Afrikaans 1568 941 Female 922 554 Other 98 58
ampm Province Under 18 46 28 NorthWest 581 351 18-25 403 243 Gauteng 703 425 28-35 263 159 Other 372 224 36-45 361 218 Occupation46-60 461 278 High income 719 435 60+ 125 75 Medium Income 292 176
Low income 504 305
A~rnmQltiQl Attnl~ of Q~r Non-paid accommodation 1034 639 msecttivalsect over 1M risl Paid accommodation 475 294 three vears Camping 109 67 KKNK 496 297
Grahamstown 112 67 Volksblad 108 65 (nnlbos 251 150 Other 89 53
secth~ I P[QIltIlQl Mediums Drama 912 546 Television 825 494 Dance theatre 273 163 Radio 690 41 3 Word art amp poetry 157 94 Aardklop website 284 170 Childrens theatre 124 74 Aardklop e-mail 97 58 Lectures amp discussions 88 53 M-Web newsletter 67 40 Visual art amp exhlbiUons 301 180 Magazines 459 275 Classical music 291 174 Newspapers 624 373 Choirs 168 101 Word of mouth 887 531 Cabaret 521 31 Other 92 55 Rock 460 2752
VARIABLE M Group size 34 Persons Number of people financially responsible for 24 Persons Number of days 23 Days Number of visits to Aardklop 40 TImes Number of tickets 81 tickets Spending per person R96844
VARIABLE
Festival is main reason for visit to Potchefatroom 702 VISit Aardklop again 946 0(
3342 Expenditure clusters
In this analysis respondents were divided into four meaningful expenditure segments The final
cluster centres and number of cases in each cluster are indicated in Table 36 below
Table 36 Cluster centres and number of cases In each cluster
CLUSTER CENTRE
40184 134154 280860 84 536797 23
100
44
Cluster 1 is the largest group with 625 of the sample has a mean spending of R40184 per
capita and is labelled Ylow spenders Cluster 2 which comprises 269 of the Aardklop visitor
sample has a mean spending of R1341 54 per capita and is labelled medium spenders Cluster
3 labelled -medium spenders accounts for 84 of the sample and has a mean spending of
R280860 per capita The spender cluster contains 23 of the sample is the smallest of the
four clusters identified and has a mean spending of R537797 per capita
3343 ANOVA results
Table 37 summarises the results for the ANOVA analysis for the socio-demographic and
behavioural characteristics as well as mediums through which respondents heard about the
festival
Table 37 ANOVA results for respondent characteristics
Cluster 1 Cluster 2 Cluster 3 Cluster 4 F t middot High middotra 10Low Medium Medium- high
(n=965) (n=415) (n=129) n=35)
44 46 50 44 597 617 003 001 0 0 3358 018shy027 019 012 011 7551 000- 1
016 016 014 017 172 915 021 023 022 017 469 704 025 031 041 046 7134 000-1
007 008 009 009 220 883 094 094 095 094 026 994 039 049 057 071 1792 000-1
018 019 013 014 866 00458 033 025 018 006 9808 000-1
044 020 014 0 44623 000-1
038 051 046 069 1508 000-1
018 029 0040 031 16021 000-1
398 378 373 4 14 535 658 259 211 184 143 21744 000-1
281 354 404 4043 44298 000-1
076 041 025 020 105099 000-1
006 022 030 0040 48028 000-1
005 011 009 009 4623 003 058 060 055 037 2517 057 048 065 076 083 240471 000-1
015 018 020 029 2445 062 007 012 016 023 7721 000-1
007 007 009 009 263 852 004 007 009 020 8935 000-1
016 018 030 0040 9510 000-1
015 022 026 026 6067 000-1
008 013 017 011 5225 001shy025 038 055 057 24935 000-1
027 028 028 031 169 917 557 1010 1224 1310 23773 000-1
026 032 045 063 13598 000-1
006 006 011 009 10483 0217 006 007 008 009 235 0872 012 017 026 023 7185 000-1
005 005 005 009 258 858 0042 048 064 077 12361 000-1
45
395 394 443 457 1866 133 094 094 092 094 285 836 065 079 085 097 19196 OOO-t
049 050 053 043 547 650 043 041 040 031 721 540 016 020 013 017 1532 204 005 008 005 006 2093 099middot 004 005 005 0 774 508 027 028 026 029 062 980 037 039 036 040 252 860 056 054 053 049 305 822 005 007 004 006 697 554
bullbull indicates Significance at a 5 level indicates significance at a 10 level and t indicates Significance according to both the Welch and Brown-Forsythe robust tests of equality of means
According to Table 37 above significant differences exist between the mean values of the low
medium high-medium and high spender groups regarding the visitors age category occupation
(excluding medium income occupations ie Occupation 2) province of origin number of persons
for whom they are financially responsible for whom they are paying the number of days they
attend the festival the preference for either camping paid accommodation or non-paid
accommodation the importance of free shows the types of showsproductions attended (excluding
childrens theatre and rock shows) the number of tickets paid for attendance of other festivals over
the past three years (including KKNK and Innibos only) and Aardklop being the main reason for
visiting Potchefstroom
There were no significant differences between the mean values of the four clusters regarding the
gender of respondents their language their group size number of times they have visited
Aardklop whether they will visit the festival again as well as the medium through which they heard
about Aardklop (with the exception of Aardklop e-mail which shows significance at a 10 level)
The socio demographic and behavioural characteristics of the four expenditure clusters are
compared and reported in the following paragraphs Each cluster namely low spenders medium
spenders medium-high spenders and high spenders will be discussed individually
Low spending segment (Cluster 1 n =965 625 of the visitors)
Visitors in this segment vary in age (27 were 18-2525 were 46-60 and 21 were 36-45 years
old) and are mostly from the North West (44) and Gauteng (38) provinces Their occupations
are mostly in the high income (39) and low income (33) occupation categories and they are
financially responsible for 259 people at the festival (the highest across all four segments of which
the average is 199 people) The participatory nature of these low spenders as festival visitors as
46
opposed to the other expenditure segments appear to be the least (557 tickets purchased
compared to the 807 average) and only 65 indicated that the festival was the main reason for
their visit to Potchefstroom (compared to an 82 average across all four segments) They attend
the festival for the shortest duration (281 days compared to the 371 average) and prefer non-paid
accommodation (76) as opposed to paid accommodation (6) and camping (5) The shows
and productions they attend include a large variety of which drama rock and cabaret are the most
preferred In fact these three genres are among the most preferred across all spending segments
but to a greater or lesser extent in each instance (of which rock as pointed out above does not
indicate a significant difference across the four segments) The popularity of drama
showsproductions gradually increase from the low spenders (48) to the high spenders (83)
Drama attended by the medium and medium high spenders was indicated at 65 and 76
respectively Cabaret showsproductions revealed the same steady increase in popularity from the
low spenders (25) to the high spenders (57) Furthermore more than half the respondents
(58) in this segment considered free shows at Aardklop as important and also attended the
KKNK (27) Innibos (12) as well as other festivals (42) over the past three years
Medium spending segment (Cluster 2 n = 415269 of the visitors)
A typical visitor in this segment is middle-aged (31 are between 46 and 60 and 23 are between
36 and 45 years of age) and reside in the Gauteng province (51 ) Their occupations are
predominantly high income occupations (49) and they are financially responsible for 211 people
at the festival (slightly higher than the average of 199 people across the four segments) The
participatory nature of these medium spenders as determined by the number of tickets purchased
is higher than the average (1010 tickets purchased compared to the 807 average) and 79
indicated that the festival was the main reason for their visit to Potchefstroom (compared to an 82
average across all four segments) They attend the festival for 281 days compared to the 371 day
average and prefer non-paid accommodation (41) as opposed to paid accommodation (22)
and camping (11 ) They also attend a large variety of shows and productions of which drama
(65) rock (28) and cabaret (38) are the most preferred shortly followed by classical music
(22) Visitors in this segment feel the strongest about the importance of free shows at Aardklop
(60) and over the past three years attended the KKNK (32) Innibos (17) as well as other
festivals (48)
High-medium spending segment (Cluster 3 n =129 84 of the visitors)
Like medium spenders in cluster 2 visitors in this segment are middle-aged (41 are between 46
and 60 and 22 are between 36 and 45 years of age) and reside in Gauteng (46) and other
47
provinces (40) Their occupations are also mostly high income occupations (57) and they are
financially responsible for 184 people at the festival (the second lowest across all four segments of
which the average is 199 people) Visitors in this group purchased relatively more tickets than the
low and medium segments (122 tickets compared to an 807 average across all four segments)
and also consider free shows at Aardklop to be important (55) Eighty-five percent (85)
indicated that the festival was the main reason for their visit to Potchefstroom (compared to an 82
average across all four segments) They attend the festival for longer than the average duration
across the four segments (404 days compared to the 371 average) In contrast with the
preference for non-paid accommodation among the low and medium spenders this segment
prefers paid accommodation (30) Shows and productions attended by this segment once again
reveal a large variety of which drama (76) and cabaret (55) visual arts (30) and rock (28)
are the most preferred closely followed by classical music (26) Over the past three years these
medium-high spenders also attended the KKNK (45) Innibos (26) and other festivals (64)
High spending segment (Cluster 4 n = 3523 of the visitors)
On average this type of visitor was the most distinct from other clusters and has the smallest
membership (23 see Table 36) These visitors are mostly aged between 46 and 60 years and
mostly reside in the Gauteng province (69) (as is the case with the medium and high-medium
visitors coming predominantly from this province) Seventy-one percent (71 ) of the visitors in this
high spending segment are in high income occupations and are financially responsible for 143
people at the festival (which is the lowest across all four segments of which the average is 199
people) Visitors in this group purchased the highest number of tickets (1310 tickets compared to
the 807 average) and considered the free shows at Aardklop to be the least important (37)
Almost all the visitors in this segment (97) indicated that the festival was the main reason for their
visit to Potchefstroom (which was the highest across all four segments of which 82 was the
average) They preferred paid accommodation (40) and attend the festival for longer than any
other expenditure segment (443 days compared to the 371 average) Diversity appeared to be
very important among this type of visitor when selecting types of showsproductions For instance
their preference for free shows (37) was much lower than the other groups While they would
attend drama (83) and cabaret (57) type shows they would also attend the visual arts (40)
rock shows (31 ) dance theatre (29) classical music (26) and poetry (23) type shows but
would also spend relatively more time attending lectures (20) than the other groups Over the
past three years these high spenders attended the KKNK (63) Innibos (23) as well as other
festivals (77) more times than any other segments Table 311 below summarises the results
48
Table 38 Low medium high-medlum and high segments
VARIABLES HIGH
18-25yrs (27) 46-6Oyrs (31 ) 46middot6Oyrs (46) 46-6Oyrs (25) 36-45yrs (23)
Occupation High income (39) High income (49) High income (57) High income (71) Province North West (44) Gauteng (51) Gauteng (46) Gauteng (69)
Gauteng (38) Other (2900) Other (40) Other (31) Other (18) North West (20) North West (14)
Accommodation Non-paid (76) Non-paid (41) Paid (30) Paid (40) Number of people 259 211 184 143 financial responsible for
557 1010 1224 1310 Da s (length of stay) 281 354 404 443 FestivaTiSthe main reason Yes (65) Yes (79) Yes (85) Yes (97) for visiting Potchofstroom Other festivals KKNK (26) KKNK(32) KKNK(45) KKNK(63) 1m ortance of free shows Yes (58) Yes (60) Yes (55) No (63)
Drama (48) Drama (65) Drama (76) Drama (83) Cabaret (25) Cabaret (38) Cabaret (55) Cabaret (57)
Visual arts (40)
34 FINDINGS AND IMPLICATIONS
The results of the analysis confirm the existence of significant differences in socio-demographic
and behavioural variablescharacteristics between different expenditure groups of visitors to
Aardklop Based on the results the following findings were made
bull Surprisingly higher income (associated with higher income occupations) does not necessarily
influence higher spending at Aardklop since high income occupations were the most prominent
category across all 4 spending segments However in the high spending segment there are far
more higher-income individuals than in the lower spending segments This contradicts research
by Dardis et a (1994319) Saayman et a (2008) Legoherel (199830) Lee (2001659) Jang
et a (2004331) Saayman and Saayman (2006b220) Thrane (2002285) and Woodside et al
(198711)
bull It is clear that the 46-60 year age category is the most prominent in all spending segments
except for the low spenders where it is the second most prominent age category Since this age
category is the highest (46) in the high spending segment it can be concluded that older
visitors are prone to spend more than younger visitors This supports findings by Jang et al
(2004331) Kruger et a (2009) and Jang et al (200283) However it contradicts findings by
Dardis et al (1994319) and Mok and Iverson (2000304)
bull The length of stay of visitors to Aardklop gradually increases from lower to higher spenders It
can therefore be concluded that higher spenders stay for a longer period of time than lower
spenders Research findings by Jang et al (2004331) Thrane (2002285) Spotts and Mahoney
(199124) Mehmetoglu (2007213) Downward and Lumsdon (2004415) Saayman and
49
Saayman (2006b220) Kruger et al (2009) Mok and Iverson (2000304) Jang et al (200283)
support this However findings by Legoherel (199830) are contradictory
bull Aardklops higher spenders tend to travel longer distances to Potchefstroom The number of
festival visitors from the local North West province is the highest (44) in the low spending
segment and dramatically decreases across to the high spending segments (where 0 high
spending visitors are from the North West province) On the other hand visitors from Gauteng
and other provinces (logically travelling longer distances to the festival than visitors in the North
West) together account for 56 of the lower spending segment as apposed to a combined
100 in the high spending segment Similar findings were made by Saayman et al (2008)
Pouta et al (2006132) Cannon and Ford (2002263) Lee (2001 659) Leones et al (199856)
Long and Perdue (199012)
bull Based on the previous finding it may also be concluded that Gauteng visitors in general seem to
be higher spenders This was also concluded by Kruger (20094950) and is not surprising since
Gauteng has the highest per capita income in the country This is also confirmed by research
compiled by Legoherel (1998 19) Diaz-Perez et al (2005961) Laesser and Crouch (2006401)
and Jang et al (200283) who found that high spenders can be associated with specific
geographic originsregions depending on the study at hand
bull The more other festivals visitors to Aardklop attended as well the more money they are likely to
spend In other words visitors who have attended other festivals too are inclined to be high
spenders This is evident in the percentage of visitors also attending KKNK (the festival mostly
attended by all spending segments besides Aardklop) which increases from the low spending
segment (26) right through to the high spending segment (63) These findings are confirmed
by Saayman and Saayman (2006b217) and Kruger et al (200828)
bull Group size and the number of previous visits to Aardklop were not statistically significant even
though research findings of Mok and Iverson (2000304) and Saayman and Saayman
(2006b220) indicated that smaller groups tend to be high spenders However Spotts and
Mahoney (1991 24) Lee (2001 659) Jang et al (2004331) and Jang et al (200283) indicated
that large groups appear to be high spenders Jang et al (2004331) and Opperman (1997178)
also found first-time visitors to be higher spenders than repeat visitors
bull Visitors for whom the Aardklop festival is the main reason for travelling to Potchefstroom are
higher spenders This has proved to be the case for 65 of the low spenders but for an immense
97 in the high spending segment This result is supported by Thrane (2002284) Kruger et al
(200828) and Kruger (200934)
bull Although visitors to Aardklop indicated drama and cabaret to be the two most preferred
showsproductions across all four spending segments increased interest in these activities is
50
evident in the high spending segment This is indicated by 83 for drama and 57 for cabaret in
the high spending segment as opposed to 48 for drama and 25 for cabaret in the lower
spending segment This is consistent with the conclusions of Kruger (200950) that drama and
cabaret were among the genres identified to be preferred by high spenders
bull A finding in this study which could not be compared to any previous research was the fact that
free shows were less important to the high spenders than to the other spending segments More
than half the respondents in the low medium and medium-high categories (58 60 and 55
respectively) indicated it to be important whereas it was unimportant to 63 of the high
spenders
These findings suggest some important implications and challenges to the marketersorganisers of
Aardklop in order to encourage visitors to attend more ticketed showsproductions to attract more
high spenders to the festival and to encourage them to stay for longer
bull Firstly marketing efforts for the higher spenders should be predominantly aimed at the Gauteng
province since this province is the origin of most high spenders and also a prominent province
of origin across all spending segments However in the low spending segment marketing
efforts should mainly focus on the North West province (but without excluding the Gauteng
province)
bull The unexpected finding that higher income (associated with higher income occupations) is the
most prominent category across all 4 spending segments implies that the majority of
respondents in lower medium and medium-high spending segments are not low earning
individuals It is important for Aardklop marketersorganisers to realise the spending potential of
these three segments so that spending on more ticketed showsproductions can be
encouraged by means of tailored products that appeal to their needs and preferences This
could expand the high spending segment Since these segments indicate that free shows are
important to them it could be incorporated in packages where ticketed showsproductions are
combined with a free show as an incentive These packages should include the preferred
drama and cabaret genres should include slightly more than the number of ticketed
showsproductions usually attended by them and should encourage these visitors to stay
longer (by perhaps designing 4-day packages for segments that are more inclined to stay for 3
days) This marketing approach will encourage greater spending by visitors who have the
potential to spend more and will increase their exposure to the arts and possibly the number of
high spenders in the future
51
bull With reference to the profile of the high spending segment in Table 311 Aardklop
marketersorganisers should design packages that focus on catering for these high spenders
specific needspreferences For instance packages should involve most of the types of
showsproductions (but to a greater extent drama cabaret and visual arts) and should stretch
across the entire duration of Aardklop (since these visitors stay for most of the festivals 5-day
duration) The focus of these packages should be to encourage even more spending by these
already eager spenders culture lovers Therefore slightly more showsproductions than the
number usually attended by these visitors should be incorporated in the packages (for instance
15 tickets across all genres instead of 13) The inclusion of accommodation in these packages
for convenience should also be considered since a large percentage of these high spenders
make use of paid accommodation The convenience element could serve to persuade these
high spenders to purchase packages and in this way to buy more tickets than they would
otherwise have bought This marketing approach should not only maintain the existing high
spending market by catering for their needspreferences but aims at further increasing the
expenditure levels of this segment
35 CONCLUSIONS
The purpose of this article was to apply expenditure-based segmentation whereby distinguishable
expenditure segments are identified in order to determine the profile of the high spenders at
Aardklop The literature review indicates differences between socio-demographic behavioural and
other characteristics of the different expenditure segments The results both support and contradict
research findings in existing literature An interesting result is that the majority of respondents in
each spending segment (not only the high spenders) are high income earners associated with
higher income occupations This emphasises the spending potential in the Aardklop visitor market
that still needs to be reached Knowledge of this market will make it possible for
marketersorganisers of Aardklop to focus on customised packages (according to the
needspreferences of the low medium and medium-high spenders) to encourage this market to
spend more on ticketed showsproductions and to increase their length of stay This can eventually
convert members in these spending segments to higher spenders thereby expanding the total high
spending segment The results also reveal the profile of high spenders and how they are
distinguishable by various characteristics (or the extent to which the characteristic applies) This
too is knowledge that can assist Aardklop marketersorganisers to not only maintain the high
spending market by fulfilling their needspreferences but to motivate them to spend more on
ticketed showsproductions
52
This research has made a substantial contribution because expenditure-based segmentation of
markets for a national arts festival in South Africa has only been applied once before by Kruger
(2009) at the Klein Karoo Arts Festival This research therefore benefits both festival
marketersorganisers and future researchers Further research is recommended for the benefit of
Aardklop and the South African arts festival market in general Firstly continuous market
segmentation at Aardklop is recommended in order for festival organisersmarketers to
continuously stay aware of new trends and changes in visitor preferences to adapt marketing
efforts accordingly The usefulness of a cluster analysis (more specifically K-means clustering) in
the expenditure-based segmentation of this study appears to be robust meaningful and simple and
should be implemented more in festival research Further segmentation methods should also be
applied to the Aardklop market so that these various methods and their effectiveness can be
compared
53
CHAPTER 4
Conclusions and Recommendations
41 INTRODUCTION
The aim of the study was to apply and compare two market segmentation methods of visitors to
Aardklop National Arts Festival To achieve this aim the following objectives were set in Chapter 1
and pursued in the study
bull The first objective was to gain a better understanding of the Aardklop market by applying a
correspondence analysis with age as the dependent variable This objective was achieved in
Chapter 2 (Article 1) of the study The research clearly indicated that profiles of specific age
categories could be distinguished from other segments based on certain variables
bull The second objective was to identify the profile of high spenders at Aardklop by applying
expenditure-based segmentation This objective was accomplished in Chapter 3 (Article 2) of
the study The research revealed a definite differentiation between the profile of high spenders
and that of other spending segments based on certain variables
bull The third objective was to compare the application of correspondence analysis and
expenditure-based segmentation in festival research This objective is accomplished in Chapter
4 of this study The research indicated that there are certain noteworthy facets in the application
of these two methods that should be taken into account by future researchers when compiling
similar studies
bull The fourth objective was to draw conclusions and make recommendations concerning the
market segmentation of visitors to Aardklop This chapter will therefore draw on the research
results in Chapters 2 and 3 to compare the application of the two market segmentation
methods to conclude the findings of the research and to make recommendations regarding
future festivals and research
54
42 CONCLUSIONS
The conclusions regarding the literature review and the surveys as reported in the two articles will
be discussed as well as the conclusions regarding the comparison of the application of the two
segmentation methods
421 CONCLUSIONS REGARDING THE CORRESPONDENCE ANALYSIS OF VISITORS TO
AARDKLOP
The following conclusions can be drawn from the literature
bull Aardklop was initiated because of the concern for the arts and artists and its main aim is to
provide a quality platform for artists to promote the arts (cf 21)
bull However the fierce competition in the festival market has serious implications for all South
African artscultural festivals (cf 21)
bull Market segmentation is effective in dividing the present and potential markets into homogenous
groupssegments based on meaningful characteristics This assists marketersorganisers of the
festival to understand the needs and preferences of these segments and to adjust the festival
productprogramme accordingly (cf 22)
bull By catering for the needspreferences of the visitors it may be ensured that customers are more
satisfied and less likely to consider product offerings from competition (cf 22)
bull Various methods can be used for comprehensive market segmentation among others
correspondence analysis (cf 22)
bull Correspondence analysis is frequently used especially in tourism marketing literature
However limited market segmentation research by means of this method based on festivals
exists (cf 22)
bull There are also various segmentation variables that can be used in correspondence analysis of
which age has successfully been applied by researchers and marketers (cf 22)
bull Previous research findings identified definite differences in characteristics between older and
younger visitorstourists (cf 22)
55
bull Identifying visitor needs and motives for attending the festival by means of market segmentation
with age as the dependent variable can assist marketersorganisers of Aardklop to better
understand the current market Festival programmes and effective marketing strategies can be
developed accordingly This will ensure the sustainability growth continuity and success of
Aardklop (cf 22)
The following conclusions can be drawn from the survey
In Article 1 a correspondence analysis was applied with age as the dependent variable to
understand the Aardklop market better The results confirmed the existence of significant
differences in socio-demographic and behavioural variablescharacteristics between different age
groups of visitors to Aardklop such as the following (cf 234)
bull Most festival visitors 925 are under the age of 60
bull The age groups 46-60 and older than 60 are more likely to hear about Aardklop in the written
media such as magazines newspapers the M-Web newsletter and Aardklop e-mail Younger
visitors aged 18 to 35 rely more on word of mouth
bull Older visitors (aged 46-60) seem to be associated with the two highest spending categories at
the festival Younger visitors (aged 18-25) spend the least
bull Visitors aged 18-25 years are more likely to attend rock showsconcerts
bull Visitors aged 36-45 years are more likely to attend productionsshows such as dance theatre
and lectures and discussions and age categories 5-6 (46 years and older) are more associated
with attending showsproductions such as classical music cabaret and visual art and
exhibitions
bull Festival visitors in age categories 3 4 and 5 (26-60 years) stay for shorter periods of time (1-3
days) The very young and very old age groups (younger than 25 and older than 60) appear to
stay for longer periods of time (4 days and more)
bull Locals (visitors in the region of Potchefstroom) or visitors from the North West are likely to be
younger (between the ages of 18 and 25) Age categories 4 and 5 (36-60 years old) were likely
to travel from the Gauteng and Free State provinces
Understanding the Aardklop market is particularly beneficial to the marketersorganisers of the
festival especially for the purposes of effective marketing since a market profile of different age
groups of visitors can be formulated and the festival productprogramme can be developed
56
according to their needs and preferences This makes it possible to maintain the current market as
well as to identify and grow upcoming markets resulting in the long-term growth and sustainability
of the festival The method although exploratory is a sophisticated technique that gives a powerful
and comprehensive visual representation of the relationship possible associations between
variables and respondent age groups However this method does not always provide a detailed
profile of each age category (see Table 210)
422 CONCLUSIONS REGARDING THE EXPENDITURE-BASED SEGMENTATION OF
VISITORS TO AARDKLOP
The following conclusions can be drawn from the literature
bull Globally the number of festivals is increasing causing competition in the festival market with
implications such as declines in ticket sales (cf 31)
bull Aardklop is the third largest arts festival in South Africa and its current status reveals potential
signs of decline in ticket sales which could negatively affect the economic impact of the festival
and threaten the sustainability of this event (cf 31)
bull With the increase in the number of festivals festival markets are also becoming increasingly
diversified (cf 31)
bull Festival organisersmarketers should periodically asses this heterogeneous market and identify
the segments that provide the greatest return-on-investment so that the needs of these
segments can be catered for (cf 31)
bull Market segmentation by means of expenditure-based segmentation assists in identifying the
high spenders in a market as well as their needs and preferences (cf 31)
bull Previous research findings identify definite differences in characteristics between high spenders
and low spenders (cf 32)
bull By catering for the needs and preferences of these high spenders by means of tailored festival
programmes and marketing efforts high spenders will be encouraged to spend more on
ticketed showsproduction and repeat visits will be ensured (cf 32)
57
bull Increased ticket sales will result in a greater economic impact of Aardklop thus ensuring the
sustainability of the festival (cf 32)
The following conclusions can be drawn from the survey
In Article 2 expenditure-based segmentation was applied to identify the profile of high spenders at
Aardklop In the results 4 segments were identified and the analysis confirmed the existence of
significant differences in socio-demographic and behavioural variablescharacteristics between
these different expenditure groups of visitors to Aardklop In this way high spenders could be
differentiated These included the following (cf 334)
bull Higher income associated with higher income occupations does not necessarily influence
higher spending at Aardklop since high income occupations were the most prominent category
across all 4 spending segments This reveals that there is untapped spending potential in the
Aardklop market
bull The age category 46-60 years is the most prominent in all spending segments except for the low
spenders where it is the second most prominent age category
bull Older visitors are prone to spend more than younger visitors
bull Higher spenders stay for a longer period of time than lower spenders
bull Aardklops higher spenders tend to travel longer distances to Potchefstroom
bull Gauteng visitors in general seem to be higher spenders
bull Visitors who have attended other festivals as well are inclined to be high spenders
bull Visitors who travel to Potchefstroom for the main reason of attending the Aardklop festival are
higher spenders
bull Drama and cabaret are by and large preferred by high spenders
bull For high spenders free shows are less important than for the other spending segments
It is beneficial to the marketersorganisers of Aardklop to identify a detailed profile of high spenders
because it will assist marketersorganisers to maintain the high spending market by fulfilling their
needspreferences but also to motivate them to spend more on ticketed showsproductions Since
the under-utilised spending potential in the other spending segments were revealed along with
detailed descriptions of these segments marketersorganisers of Aardklop can target these
segments by means of customised packages (according to the needspreferences) that will
encourage the segments to spend more on ticketed showsproductions and to increase their length
58
of stay This can eventually convert members in these spending segments into higher spenders
thereby expanding the total high spending segment This will maximise the economic impact of
Aardklop and will result in the competitiveness sustainability and further growth of the festival
The method used in Article 2 namely K-means clustering offers a good range of information to
help interpret the results Instead of simply dividing the market into three spending categories (high
medium and low) for purposes of expenditure-based segmentation this method makes no preshy
determined selection in the number of spending groups Instead it groups members together based
on their natural similarity with regard to expenditure patterns ANOVA was used to determine the
differences in terms of socio-demographic and behavioural variables (as tested by the
questionnaire) between the identified clusters and to test whether these differences were
statistically significant This method provides a more detailed profile of each spending segment
Table 311)
423 CONCLUSIONS REGARDING THE COMPARISON OF THE APPLICATION OF THE TWO
SEGMENTATION METHODS
The two market segmentation methods applied in this study can be considered to be effective and
comprehensive As mentioned above the correspondence analysis revealed a less detailed profile
of each age category whereas the profile of the spending segments in the expenditure-based
article was more detailed It would therefore seem that the expenditure-based method is the better
option of the two when applying market segmentation to festivals However it should also be
pointed out that since both these methods can be used to effectively segment the Aardklop market
it is perhaps more important to consider what exactly needs to be accomplished in the marketing
research in order to identify the more appropriate market segmentation method
Correspondence analysis as opposed to expenditure-based segmentation can also be considered
as more flexible in terms of the bases on which segmentation is applied since a variety of
segmentation variables can be used to divide the market into groups (for example age as applied in
this study gender province of origin types of showsproduction etcetera) Expenditure-based
segmentation on the other hand exclusively uses expenditure as segmentation variable
Another facet that can be concluded from the comparison of these two methods is that if age were
to be used as a segmentation variable in the application of correspondence analysis in the future
quota sampling could be beneficial in order for the researcher to ensure that the right variety of
respondents are selected (for example a relatively equal selectionnumber of respondents in each
59
age group can to some extent be visibly identified by fieldworkers) This is however not a simple
task in the application of expenditure-based segmentation since it is not possible to differentiate
between high and low spenders according to appearance Below is a summary of the benefits
derived from applying each segmentation method
The benefits of applying correspondence analysis to Aardklop are
bull It assists in understanding the Aardklop market better
bull It assists in formulating a market profile of different aged visitors to the festival
bull Continuous correspondence analysis research with age as the segmentation variable assists in
monitoring the different age groups in order to stay aware of changes in their needs and
preferences as well as market trends
bull Marketing efforts directed at the different age categories can be adapted continuously and
accordingly
bull A festival producUprogramme can be developed according to the needs and preferences of the
largest age category visitors thereby maintaining the current market
bull The identification of other smaller markets by means of correspondence analysis could lead to
the growth of these markets since the festival producUprogramme could also make provision for
their specific needs and preferences
bull Catering for the needs and preferences of the larger prominent markets as well as the smaller
markets with growth potential will contribute to the competitiveness long-term growth and
sustainability of the festival
bull This research contributes to a better understanding of the profile of visitors to arts festivals in
South Africa
The benefits of applying expenditure-based segmentation to Aardklop are
bull It assists in penetrating markets with high potential
bull It assists in formulating a market profile of high spenders to the festival
bull The high spending market can be maintained by catering for their needs and ensuring return
visits
bull The untapped spending potential in the Aardklop market can be identified
bull Visitors can be encouraged to attend more ticketed showsproductions
bull Visitors exposure to the arts can be increased
bull Visitor spending can be increased
bull Visitors length of stay can be prolonged
bull A direct contribution to a greater economic impact of the festival can be made
60
bull A continuous economic contribution to the host community can be ensured
bull The competitive advantage of Aardklop can be increased
bull A contribution to the sustainability and further growth of Aardklop is made
43 RECOMMENDATIONS
Recommendations will be discussed in two sections namely general recommendations and
recommendations for further research
431 GENERAL RECOMMENDATIONS
Based on this research recommendations are made regarding Aardklop and other festivals
bull The results of Article 1 (correspondence analysis) where age was used as the segmentation
variable are inconsistent with certain findings of previous research This may be due to ever
changing market trends and changes in the needspreferences of visitors It is therefore
recommended that continuous segmentation is applied for Aardklop marketersorganisers to
stay aware of these changes so that the necessary adjustments can be made to the festival
programme and marketing communication
bull For purposes of effectively comparing differences in characteristics between different age
groups of visitors in correspondence analysis studies it is recommended that age categories be
standardised in Aardklop and other festival questionnaires
bull Since the Living Standards Measure (LSM) is used to indicate the socio-economic status of an
individual or group it is a recommended to incorporate this index in the Aardklop and other
festival questionnaires for market segmentation purposes
bull Various other segmentation methods should also be applied to the Aardklop market so that
these methods and their effectiveness can be compared with the two methods applied in this
study
432 RECOMMENDATIONS FOR FURTHER RESEARCH
Based on this research further research is recommended for the benefit of future researchers
andor the South African arts festival market
bull Since the results of market segmentation studies where age was used as the segmentation
variable can be rather inconsistent it is recommended that other segmentation variables such
as travel motivations benefit segmentation etcetera are used for future market segmentation
research based on festivals or other tourism-related products
bull In South African publications no research articles were found where correspondence analysis
was applied to festivals In general this market segmentation method is implemented only to a
limited degree in the field of tourism Future researchers should consider using the exploratory
method as it is useful for transforming two or more categorical variables into a graphical display
within a low-dimensional space making it easier to identify the key features of the data when
interpreting the information Applying correspondence analysis with age as the dependent
variable to the two other major arts festivals in South Africa namely Grahamstown National Arts
Festival and Klein Karoo National Arts Festival could be beneficial for comparative purposes
bull The usefulness of a cluster analysis (more specifically K-means clustering) in the expenditureshy
based segmentation of this study appears to be robust meaningful and simple and it should be
implemented more in festival research
62
REFERENCES
ALI-KNIGHT J DRUMMOND S McMAHON-BEATTIE U ROBERTSON M amp YEOMAN I
2004 Festival and event management an international arts and culture perspective London
Butterworth-Heinemann 418 p
ANON 2008 Aardklop National Arts Festival httpwwwaardklopcozaindexphp
frontend_action=display_text_contentampitem_id=78 Date of access 2 February 2009
ARRIMOND G ACHENREINER G amp ELFESSI A 2003 An innovative approach to tourism
market segmentation research an applied study Journal of hospitality marketing and
management 10(3)25-56
ARRIMOND G amp ELFESSI A 2001 A clustering method for categorical data in tourism market
segmentation research Journal of travel research 39(4)391-397
BACKMAN K BACKMAN SJ UYSAL M amp SUNSHINE KM 1995 Event tourism an
examination of motivations and activities Festival management and event tourism 3(1)15-24
BARTHOLOMEW DJ STEELE F MOUSTAKI I amp GALBRAITH J1 2002 The analysis
and interpretation of multivariate data for social scientists London Chapman amp Hall 263 p
BELDONA S MORRISON AM amp OLEARY J 2005 Online shopping motivations and
pleasure travel products a correspondence analysis Tourism management 26(4)561-570
BENNETT JA amp STRYDOM JW 2001 Introduction to travel and tourism marketing Cape
Town Juta Education 252 p
BOWEN JT 1998 Market segmentation in hospitality research no longer a sequential process
International journal of contemporary hospitality management 10(7) 289-296
BUHALlS D 2000 Marketing the competitive destination of the future Tourism management
21(1)97-116
63
BURGAN B amp MULES T 2000 Estimating the impact of events sampling frame issues in
identifying event related expenditure (Paper presented at the Conference Events Beyond 2000
Setting the agenda Sydney p52-59) httpwwwbusinessutseduauacempdfs Events2000_
finalversionpdfpage=52 Date of access 13 February 2009
BURKE J amp RESNICK B 2000 Marketing and selling the travel product 2nd ed New York
Delmar Thompson Learning 301 p
CAl LA HONG G amp MORRISON AM 1995 Household expenditure patterns for tourism
products and services Journal of travel and tourism marketing 4(4) 15-40
CALANTONE RJ DI BENEDETTO I HAKAM A amp BOJANIC BC 1989 Multiple
multinational tourism positioning using correspondence analysis Journal of travel research 28(2)
25-32
CANNON TF amp FORD J 2002 Relationship of demographic and trip characteristics to visitor
spending an analysis of sport travel visitors across time Tourism economics 8(3)263-271
CHEN JS 2000 Cross-cultural differences in travel information acquisition among tourists from
three pacific-rim countries Journal of hospitality and tourism research 24(2)239-251
CHEN JS 2001 A case study of Korean outbound travellers destination images by using
correspondence analysis Tourism management 22(4)345-350
CHEN JS amp GURSOY D 2000 Cross-cultural comparison of the information sources used by
first time and repeat travellers and its marketing implications Hospitality management 19(2)191shy
203
CHEUNG Y 1994 Categorical criteria values correspondence analysis Omega international
journal ofmanagement science 22(4)371-380
COOK VJ amp MINDAK WA 1984 A search for constants the heavy user revisited I Journal
of consumer marketing 1 (4)79-81
COOPER DR amp EMORY CW 1995 Research methods Homewood III Irwin 691 p
64
DARDIS R SOBERON-FERRER H amp PATRO D 1994 Analysis of leisure expenditures in
the United States Joumal of leisure research 26(4)309-321
DIAZ-PEREZ FM BETHENCOURT-CEJAS M amp ALVAREZ-GONZALEZ JA 2005 The
segmentation of canary island tourism markets by expenditure implications for tourism policy
Tourism management 26(6)961-964
DIBB S amp SIMKIN L 1996 The market segmentation workbook target marketing for
marketing managers London Routledge 171 p
DIBB S amp SIMKIN L 2001 Marketing segmentation diagnosing and treating the barriers
Industrial marketing management 30(8)609-625
DIBB S amp SIMKIN L 2004 Marketing briefs a revision and study guide 2 nd ed Oxford
Elsevier Butterworth-Heinemann 363 p
DOLNICAR S CROUCHIG DEVINNEY T HUYBERS T LOUVIERE JJ amp OPPEWAL
H 2008 Tourism and discretionary income allocation heterogeneity among households
Tourism management 29(1 )44-52
DOWNWARD P amp LUMSDON L 2004 Tourism transport and visitor spending a study in the
North York Moors National Park UK Joumal of travel research 42(4)415-420
2ndFERRELL OC HARTLINE MD amp LUCAS GH 2002 Marketing strategy ed Fort
Worth Harcourt College Publishers 469 p
FORMICA S amp UYSAL M 1998 Market segmentation of an international CUltural-historical
event in Italy Joumal of travel research 36(4)16-24
FOSTER D amp DAVIS J 1994 Mastering marketing Houndmills Macmillan 287 p
FRECHTLlNG DC 2006 An assessment of visitor expenditure methods and models Joumalof
travel research 45(1 )26-35
FRISBY W amp GETZ D 1989 Festival management a case study perspective Joumalof
travel research 28(1)7-11
65
2ndGEORGE R 2004 Marketing South African tourism ed Cape Town Oxford University
Press 415 p
GETZ D 1993 Festivals and special events Encyclopaedia of hospitality and tourism 37945shy
955
GETZ D 1997 Event management and event tourism New York Cognizant Communication
Corp 386 p
GOKOVALI U BAHAR O amp KOZAK M 2007 Determinants of length of stay a practical use
of survival analysis Tourism management 28736-746
GOUGH I 1996 Social assistance in Southern Europe South European Society and Politics
1(1)1-23
GOUGH I EARDLEY T BRADSHAW J DITCH J amp WHITEFORD P 1997 Social
assistance in OECD countries Journal of European social policy 7(1)17-43
GURSOY D amp CHEN JS 2000 Competitive analysis of cross cultural information search
behaviour Tourism management 21 (6) 583-590
GURSOY D KIM K amp UYSAL M 2004 Perceived impacts of festivals and special events by
organisers an extension and validation Tourism management 25(2)171-181
HASSAN SS 2000 Determinants of market competitiveness in an environmentally sustainable
tourism industry Journal of travel research 38(3)239-245
HAVITZ ME DIMANCHE F amp BOGLE T 1994 Segmenting the adult fitness market using
involvement profiles Journal ofpark and recreation administration 12(3)38-56
HAWES DK TAYLOR DT amp HAMPE GD 1991 Destination marketing by states Journal
of travel research 30( 1) 11-17
HOFFMAN DL amp FRANKE GR 1986 Correspondence analysis graphical representation of
categorical data in marketing research Journal of marketing research 23(3)213-227
66
HOLBROOK MB amp SCHINDLER RM 1996 Market segmentation based on age and attitude
toward the past concepts methods and findings concerning nostalgic influences on customer
tastes Journal of business research 37(1)27-39
HORNEMAN L CARTER RW WEI S amp RUYS H 2002 Profiling the senior traveler an
Australian perspective Journal of travel research 41 (1 )23-37
HSU CHC KANG SK amp WOLFE K 2002 Psychographic and demographic profiles of
niche market leisure travelers Journal of hospitality and tourism research 26(1)3-22
HUGHES H 2000 Arts entertainment and tourism Oxford Butterworth-Heinemann 244 p
ISAR RF 1976 Culture and the arts festival of the twentieth century Cultures 3(2)125-145
JACKSON MJ amp OSULLIVAN D 2002 Festival tourism a contributor to sustainable local
economic development Journal of sustainable tourism 10(4)325-342
JANG S BAI B HONG G amp OLEARY JT 2004 Understanding travel expenditure
patterns a study of Japanese pleasure travelers to the United States by income level Tourism
management 25(3)331-341
JANG S ISMAIL JA amp HAM 2002 Heavy spenders medium spenders and lights spenders
of Japanese outbound please travelers Journal of hospitality amp leisure marketing 9(34)83-106
KARA A KAYNAK E amp KUCUKEMIROGLU O 1996 Positioning of fast-food outlets in two
regions of North America a comparative study using correspondence analysis Journal of
professional services marketing 14(2)99-119
KASTENHOLZ E 2005 Analysing determinants of visitor spending for the rural tourist market in
North Portugal Tourism economics 11 (4 )555-569
KAYNAK E KUCUKEMIROGLU O amp KARA A 1994 Consumers perceptions of airlines a
correspondence analysis approach in a global airline industry Management international review
34(3)235-254
KELLER KL amp KOTLER P 2006 Marketing management 12th ed Upper Saddle River NJ
Prentice Hall 729 p
KIM H BORGES MC amp CHON J 2006 Impacts of environmental values on tourism
motivation the case of FICA Brazil Tourism management 27(5)957-967
KIM K amp UYSAL M 2003 Perceived socio-economic impacts of festivals and events among
organisers Journal of hospitality and leisure marketing 10(34) 159-171
KOC E amp ALTINAY G 2007 An analysis of seasonality in monthly per person tourist spending
in Turkish inbound tourism from a market segmentation perspective Tourism management
28(1 )227-237
KOTLER P amp ARMSTRONG G 2004 Principles of marketing 10th ed New York Pearson
953 p
KREJCIE RV amp MORGAN DW 1970 Determining sample size for research activities
Educational and psychological measurement 30607-610
KRUGER M 2009 Spending behaviour of visitors to the Klein Karoo National Arts Festival
Potchefstroom North-West University (Dissertation - MA) 66 p
KRUGER M SAAYMAN M SAAYMAN A 2008 Bemarkingsprofiel en ekonomiese impak
van besoekers aan die Aardklop Nasionale Kunstefees Potchefstroom Instituut vir Toerisme en
Vryetydstudies 33 p
KRUGER M SAAYMAN M amp SAAYMAN A 2009 Expenditure-based segmentation of
visitors to Tsitsikamma National Park Cornell hospitality quarterly (In process of review)
KRUGER S amp PETZER DJ 2008 Measuring tourists satisfaction with quality of life issues at
an arts festival Acta commercii 8113-127
LAESSER C amp CROUCH G1 2006 Segmenting markets by travel expenditure patterns the
case of international visitors to Australia Journal of travel research 44(4)397-406
68
LAMB CW HAIR JF amp McDANIEL C 2000 Marketing 5th ed Cincinnati Oh Southshy
Western College 773 p
LAMB CW HAIR JF McDANIEL C BOSHOFF C amp TERBLANCHE NS 2004
Marketing 2nd South African ed Cape Town Oxford University Press 502 p
LEE CK LEE YK amp WICKS BE 2004 Segmentation of festival motivation by nationality
and satisfaction Tourism management 25(1 )61-70
LEE H 2001 Determinants of recreational boater expenditures on trips Tourism management
22659-667
LEE Y LEE C LEE S amp BABIN B 2008 Festivals capes and patrons emotions
satisfaction and loyalty Journal of business research 61 (1 )56-64
LEGOHEREL P 1998 Toward a market segmentation of the tourism trade expenditure levels
and consumer behaviour instability Journal of travel and tourism marketing 7(3)19-39
LEGOHEREL P amp WONG KKF 2006 Market segmentation in the tourism industry and
consumersspending what about direct expenditures Journal of travel and tourism marketing
20(2) 15-30
LEONES J COLBY B amp CRANDALL K 1998 Tracking the expenditures of the elusive
nature tourists of Southeastern Arizona Journal of travel research 36(3)5664
LONG PT amp PERDUE RR 1990 The economic impact of rural festivals and special events
assessing the spatial distribution of expenditures Journal of travel research 28(4)10-14
LUBBE BA 2000 Tourism distribution managing the travel intermediary Cape Town Juta
386 p
LUBBE BA 2003 Tourism management in Southern Africa Cape Town Pearson Education
290 p
69
MAK J MONCUR J amp YONAMINE D 1977 Determinants of visitors expenditures and visitor
lengths of stay a cross-section analysis of US visitors to Hawaii Journal of travel research
15(3)5-8
MALHOTRA KN amp BARTELS BC 2002 Overcoming the attribute prespecification bias in
international marketing research by using non-attribute-based correspondence analysis
International marketing review 19(1 )65-79
MARX S VAN ROOYEN DC BOSCH JK amp REYNDERS HJJ 1998 Business
management 2nd ed Pretoria Van Schaik Academic 797 p
MAYFIELD TL amp CROMPTON JL 1995 The status of the marketing concept among festival
organisers Journal of travel research 33(4)14-22
McDONALD M amp DUNBAR I 1995 Market segmentation London Macmillan 271 p
MciNTOSH RW amp GOELDNER CR 1990 Tourism principles practices philosophies New
York Wiley 534p
MEHMETOGLU M 2007 Nature-based tourists the relationship between their trip expenditures
and activities Journal of sustainable tourism 15(2)200-215
MIDDLETON VTC 1994 Marketing in travel and tourism Oxford Butterworth - Heinemann
393 p
MOK C amp IVERSON TJ 2000 Expenditure-based segmentation Taiwanese tourists to
Guam Tourism management 21 299-305
MOUTHINHO L amp WITT SF 1994 Tourism marketing and management handbook 2nd ed
Upper Saddle River NJ Prentice Hall 617 p
MULES T amp FAULKNER B 1996 An economic perspective on special events Tourism
economics 2(2)107-118
MURPHY PE amp CARMICHAEL BA 1991 Assessing the tourism benefits of an open access
sports tournament the 1989 BC Winter Games Journal of travel research 29(3)32-36
70
MYKLETUN RJ CROTTS JC amp MYK- bLETUN 1 2001 Positioning an island destination in
the peripheral area of the Baltics a flexible approach to market segmentation Tourism
management 22(5) 493-500
NICKELS WG amp WOOD MB 1997 Marketing relationships quality value New York
Worth 633 p
OPPERMAN M 1997 First-time and repeat visitors to New Zealand Tourism management
18(3)177-181
OXFORD CONCISE DICTIONARY 2001 London HarperCollins 832 p
PERREAULT WD amp McCARTHY EJ 1999 Basic marketing a global- managerial approach
Boston Mass Irwin McGraw-HilI 763 p
PISSOORT V 2007 Visitor segmentation of arts festivals a comparative study of three events
Potchefstroom North-West University (Dissertation - MA) 132 p
PITRUZELLO S 1999 Decommodification and the worlds of welfare capitalism a cluster
analysis Seminar paperWS90 European Forum Florence EUI
PIZAM A amp REICHEL A 1979 Big spenders and little spenders in US tourism Journal of
travel research 18(1 )42-43
POUTA E NEUVONEN M amp SIEVANEN T 2006 Determinants of nature trip expenditures in
Southern Finland implications for nature tourism development Scandinavian journal of hospitality
and tourism 6(2) 118-135
RAAIJ Wv amp FRANCKEN DA 1984 Vacation decisions activities and satisfactions Annals
of tourism research 11(1)101-112
RAA TH A 2009 Verbal communication with Aardklop office representative (Telephonic
interview on 12 March 2009)
RICAHRDS G 2001 Cultural attractions and European tourism Wallingford CAB International 245 p
SAAYMAN A amp SAAYMAN M 2005 Ekonomiese impak en profiel van besoekers aan die
Aardklop Nasionale Kunstefees Potchefstroom Instituut vir Toerisme en Vryetydstudies 58 p
SAAYMAN A amp SAAYMAN M 2006a Ekonomiese impak en profiel van besoekers aan die
Aardklop Nasionale Kunstefees Potchefstroom Instituut vir Toerisme en Vryetydstudies 47 p
SAAYMAN A amp SAAYMAN M 2006b Socio-demographics and visiting patterns of arts
festivals in South Africa Event management 9(4)211-222
SAAYMAN A amp SAAYMAN M 2007 Ekonomiese impak en profiel van besoekers aan die
Aardklop Nasionale Kunstefees Potchefstroom Instituut vir Toerisme en Vryetydstudies 33 p
SAAYMAN M 2000 En route with tourism Potchefstroom Leisure Consultants and
Publications 330 p
SAAYMAN M 2002 Tourism marketing in South Africa Potchefstroom Leisure Consultants and
Publications 450 p
SAAYMAN M 2006 Marketing tourism products and destinations getting back to basics 2nd ed
Potchefstroom Institute for Tourism and Leisure Studies 234 p
SAAYMAN M 2007 En route with tourism an introductory text 3rd ed Potchefstroom Leisure
Consultants and Publications 356 p
SAAYMAN M amp SAAYMAN A 2004 Economic impact of cultural events South African journal
of economic and management sciences 7(4)629-642
SAAYMAN M amp SAAYMAN A 2006 Does the location of arts festivals matter Papers in
regional science 85(4)569-584
SAAYMAN M SAAYMAN A amp RHODES JA 2001 Domestic tourist spending and economic
development the case of the North-West Province Development Southern Africa 18(4)443-452
SAAYMAN M SLABBERT E amp SAAYMAN A 2005 Profile and economic impact of
Volksblad Arts Festival Potchefstroom Institute for Tourism and Leisure Studies 32 p
72
SAAYMAN M SLABBERT E amp SAAYMAN A 2009 Expenditure-based segmentation of
visitors to the Grahamstown National Arts Festival Management dynamics (In process of review)
SAAYMAN M VAN DER MERWE P amp PIENAAR J 2008 Expenditure-based segmentation
of South African biltong hunters South African journal of wildlife research (In process of
publication )
SAT see SA TOUR
SATOUR South African Tourism Board 2007 Dhttpwwwstatssagovzapublications
publicationsearch Date of access 10 March 2008
SHANKA T amp TAYLOR R 2004 A correspondence analysis of sources of information used by
festival visitors Tourism analysis 9(12)55-62
SLABBERT E 2002 Key success factors of tourist market segmentation Potchefstroom
Potchefstroom University for Christian Higher Education (Dissertation - MA) 122 p
SLABBERT E 2004 An integrated tourism model for cultural events Potchefstroom North-West
University (Thesis - PhD) 220 p
SLABBERT E SAAYMAN M SAAYMAN A amp VIVIERS P 2008 Die sosio-ekonomiese
impak van besoekers aan die ABSA KKNK Potchefstroom Instituut vir Toerisme en
Vryetydstudies 87 p
SMITH C amp JENNER P 1998 The impact of festivals and special events on tourism Travel
and tourism analyst 4(1)73-100
SMITH LJ 1990 Dictionary of concepts in recreation and leisure studies Westport Greenwood
Press 384 p
spons DM amp MAHONEY EM 1991 Segmenting visitors to a destination region based on
the volume of their expenditures Business research division 29(4)24-31
THRANE C 2002 Jazz Festival visitors and their expenditures linking spending patterns to
musical interest Journal of travel research 40(3) 281-286
73
TWEDT DW 1964 How important to marketing strategy is the heavy user Journal of
marketing 28(1 )71-72
UYS MC 2003 A sustainable marketing strategy for Dutch tourists to South Africa
Potchefstroom Potchefstroom University for Christian Higher Education (Dissertation - MCom)
147 p
UYSAL M GAHAN L amp MARTIN B 1993 An examination of event motivations a case
study Festival management and event tourism 1(1)5-10
VAN HEERDEN A 2003 The economic impact of the Aardklop National Arts Festival in
Potchefstroom Potchefstroom PU vir CHO (Dissertation - MA) 105 p
VAN ZYL C 2005 Optimum market-positioning models for South African Arts festival scenarios
Pretoria University of South Africa (Thesis - PhD) 433 p
VISSER G 2005 Lets be festive exploratory notes on festival tourism in South Africa Urban
forum 16(3)155-175
VIVIERS P SLABBERT E SAAYMAN M amp SAAYMAN A 2008 The socio-economic
impact of visitors to Grahamstown National Arts Festival Potchefstroom Institute for Tourism and
Leisure Studies 87 p
WALO M BULL A amp BREEN H 1997 Achieving economic benefits at local events a case
study of a local sports event Festival management amp event tourism 4(34)95-106
WEDEL M amp KAMAKURA W 2002 Introduction to the special issue on market segmentation
International journal of research in marketing 19(3) 181-183
WOODSIDE AG COOK VJ amp MINDAK W 1987 Profiling the heavy traveler segment
Journal of travel research 25(3)9-15
WORLD TOURISM ORGANISATION (WTO) 2002 Enhancing the economic benefits of tourism
for local communities and poverty alleviation World Tourism Organisation 60 p
WTO see WORLD TOURISM ORGANISATION
74
APPENDIX A Visitor questionnaire
75

FINANCIAL ASSISTANCE
Financial assistance from the NRF (National Research Foundation) is gratefully acknowledged
Statements and suggestions made in this study are those of the author and should not be regarded
as those of the NRF
II
ACKNOWLEDGEMENTS
The completion of this study is a personal milestone accomplished and would not have been
possible without the prayers and assistance of the following people during this challenging time I
am truly grateful to them
bull My Heavenly Father for giving me the strength to complete this study and revealing his
presence to me throughout the process
bull My husband Franko for his support and words of encouragement especially during the most
testing times My two children Kayla and Nadine for their patience and understanding
bull My parents and grandfather for their support encouragement and prayers
bull Prof Elmarie Siabbert for her incredible commitment and mentorship as study leader Her
encouragement support and guidance is greatly appreciated She is truly an inspiration
bull My assistant study leaders Dr Riaan Rossouw for his expertise assistance and guidance with
the methodology and Mr Pierre-Andre Viviers for his support and advice throughout the study
bull Dr Suria Ellis and Prof Jan du Plessis from the Statistical Consultation Services at the Northshy
West University for her expertise and assistance
bull Dr Amanda van der Merwe for the language editing of this study and Prof Casper Lessing for
the editing of the references
bull The staff at the Institute for Tourism and Leisure Studies at the North West University
especially Martinette and Lindy for their friendship advice and encouragement
bull The fieldworkers and visitors to Aardklop for their assistance and co-operation with the survey
Without them this study would not have been possible
You1ve got to get up ever9 morning with pound)eterminatiol1
if 90ure going to go to bepound) with satisfactiol1
~ George Loyimer ~
III
ABSTRACT
MARKET SEGMENTATION OF VISITORS TO AARDKLOP NATIONAL ARTS FESTIVAL
A COMPARISON OF TWO METHODS
The Aardklop National Arts Festival is one of the three largest arts festivals in South Africa Arts
festivals such as Aardklop are also one of the most rapidly growing events tourism segments It
sustains different forms of art contributes to the livelihood of artists stimulates the growth of
regional and local economies and promotes specific destinations Destinations realise the benefits
associated with arts festivals thus there has been a remarkable increase in the annual number of
festivals hosted by different destinations However the competition in the festival market has
important implications for all South African artscultural festivals In order for a festival to be
sustainable and to reap the continuous economic contribution and benefits that festivals offer the
importance of effectivestrategic marketing of the festival must be realised An essential step
towards strategic market planning is market segmentation It is an effective tool to divide existing
and potential markets into homogenous groupssegments based on meaningful characteristics
This assists marketersorganisers of the festival to understand the needs and preferences of these
segments and to adjust the festival productprogramme accordingly A variety of methods is
available for market segmentation Two such methods are correspondence analysis and
expenditure-based segmentation
The primary goal of the study was to apply and compare these two market segmentation methods
of visitors to Aardklop National Arts Festival A literature study was undertaken to analyse arts
festivals market segmentation and specific market segmentation methods and an empirical study
was undertaken to obtain the relevant data for analysis Surveys were conducted at the festival and
data obtained from 2005 to 2008 was used Questionnaires were distributed randomly during the 5shy
day festival period and a total of 1 671 questionnaires were completed In order to achieve the
goal the study was divided into 2 articles
In Article 1 a correspondence analysis was applied to visualise the relationship between the age of
respondents and other variables Results confirmed the existence of significant differences in socioshy
demographic and behavioural variablescharacteristics between different age groups of visitors to
IV
Aardklop Older visitors (46 years and older) are associated with higher spending and attend
showsproductions such as drama classical music cabaret and visual art and exhibitions They are
also more likely to hear about Aardklop in the written media such as magazines newspapers
newsletters and e-mail to stay for shorter periods of time and to come from the Gauteng and Free
State provinces Younger visitors (aged 18 to 25) are associated with the lowest spending and rely
on word-of-mouth as a source of information through which they hear about Aardklop They are
more likely to come from the North West province to attend rock showsconcerts and to attend the
festival for longer periods of time These results rendered strategic insights regarding marketing
since a market profile of different age groups of visitors can be formulated and the festival
productprogramme can be developed according to their needs and preferences As a result the
current market can be maintained and emerging markets can be identified and targeted resulting in
long-term growth and sustainability of the festival
In Article 2 K-means clustering was done to group members together based on their similarity with
regard to spending patternsbehaviour so that these clusters could be used in the ANOVA analysis
The ANOVA analysis was applied by using the identified clusters to do expenditure-based
segmentation In the results 4 expenditure segments were identified and the analysis confirmed
the existence of significant differences in socia-demographic and behavioural
variablescharacteristics between these different expenditure groups among Aardklop visitors The
high spenders are between the ages of 46 and 60 years stay for longer periods of time and travel
longer distances to the festival They have attended other festivals as well in the past and their
main reason for travelling to Potchefstroom is to attend Aardklop These visitors prefer to attend
drama and cabaret showsproductions and they are likely to travel from Gauteng Based on these
aspects the high spenders can be differentiated from other spending segments This is beneficial
to the marketersorganisers of Aardklop since it assists in maintaining the high spending market by
fulfilling their needspreferences while also motivating them to spend more on ticketed
showsproductions The untapped spending potential in the other spending segments were also
identified along with detailed descriptions of these segments Marketersorganisers of Aardklop
can therefore also target these segments through customised packages which can eventually
convert members in these spending segments to higher spenders thereby expanding the highshy
spending segment This will maximise the economic impact of Aardklop and will result in the
competitiveness sustainability and further growth of the festival
The correspondence analysiS as a market segmentation method although exploratory is a
sophisticated technique that gives a powerful and comprehensive visual representation of the
v
relationship I possible associations between variables and respondent age groups However this
method does not always provide a detailed profile of each age category Expenditure-based
segmentation as a market segmentation method offers a good range of information and has been
found to provide a more detailed profile of each spending segment as opposed to the profiles
identified in the correspondence analysis However since both these methods can be used for
effective segmentation of the Aardklop market it is important to consider what exactly needs to be
accomplished in the marketing research so that the more appropriate market segmentation method
may be selected
Key words Aardklop National Arts Festival FestivalArts festival Correspondence analysis
Expenditure-based segmentation Market segmentation Marketing
VI
OPSOMMING
MARKSEGMENTERING VAN BESOEKERS AAN AARDKLOP NASIONALE KUNSTEFEES
n VERGELYKING VAN lWEE METODES
Die Aardklop Nasionale Kunstefees is een van die drie grootste feeste in Suid-Afrika Kunstefeeste
5005 Aardklop is een van die vinnigste groeiende geleentheidstoerismesegmente Dit hou
verskillende kunsvorme in stand dra by tot die oorlewing van kunstenaars stimuleer die groei van
streeks- en plaaslike ekonomiee en bevorder spesifieke bestemmings Omdat bestemmings
bewus is van die voordele wat kunstefeeste inhou was daar die afgelope tyd n groot toename in
die aantal feeste wat deur verskillende bestemmings aangebied word Die kompetisie in die
feesmark het egter belangrike implikasies vir aile Suid-Afrikaanse kunste-kultuurfeeste Vir n fees
om volhoubaar te wees en vir bestemmings om te baat by die voortgesette ekonomiese bydrae en
voordele wat die feeste bied moet die belangrikheid van effektiewestrategiese bemarking van die
fees begryp word n Belangrike stap ten opsigte van strategiese markbeplanning is
marksegmentering Dit is n doeltreffende instrument om bestaande en potensiele markte te verdeel
in homogene groepesegmente gegrond op betekenisvolle kenmerke Dit help die fees se
bemarkersorganiseerders om die behoeftes en voorkeure van hierdie segmente te begryp en om
die feesprodukl-program dienooreenkomstig aan te pas n Verskeidenheid metodes is beskikbaar
vir marksegmentering Twee hiervan is korrespondensie-analise en uitgawegebaseerde
segmentering
Die hoofdoel van die studie was om hierdie twee metodes van marksegmentering toe te pas en met
mekaar te vergelyk ten opsigte van besoekers aan die Aardklop Nasionale Kunstefees n
Literatuurstudie is gedoen om kunstefeeste marksegmentering en spesifieke metodes van
marksegmentering te ontleed en n empiriese studie is onderneem om die relevante data vir
ontleding te bekom Opnames is by die fees gedoen en data van 2005 tot 2008 is gebruik
Vraelyste is ewekansig uitgedeel tydens die 5-dae-feesperiode en n totaal van 1 671 vraelyste is
voltooi Om die doel te bereik is die studie in 2 artikels verdeel
In Artikel 1 is In korrespondensie-analise toegepas om die verhouding tussen die ouderdom van
respondente en ander veranderJikes te visualiseer Resultate het bevestig dat daar beduidende
VII
verskitle is in sosiodemografiese en gedragsveranderlikes-kenmerke tussen verskillende
ouderdomsgroepe onder Aardklopfeesgangers Ouer feesgangers (46 jaar en ouer) word
geassosieer met groter besteding en woon vertoningsproduksies so os drama klassieke musiek
kabaret en visuele kunste en uitstallings by Hulle is ook meer geneig om oor Aardklop te hoor in
die geskrewe media soos tydskrifte koerante nuusbriewe en e-pos om vir korter periodes te bly
en om van Gauteng en die Vrystaat te kom Jonger besoekers (18 tot 25 jaar oud) word
geassosieer met die minste besteding en maak staat op mondelinge aanbevelings as n bron van
inligting oor inligting Hulle is meer geneig om van die Noordwesprovinsie te kom om rockshy
vertonings-konserte by te woon en om die fees vir langer periodes by te woon Hierdie resultate
het strategiese insigte gebied ten opsigte van bemarking omdat n markprofiel geformuleer kan
word vir verskillende ouderdomsgroepe onder besoekers en die feesprodukl-program volgens
hulle behoeftes en voorkeure aangepas kan word Gevolglik kan die huidige mark in stand gehou
word terwyl opkomende markte terselfdertyd geidentifiseer en geteiken kan word om
langtermyngroei en volhoubaarheid van die fees te verseker
In Artikel 2 is K-gemiddelde-groepering toegepas om lede saam te groepeer gegrond op hulle
ooreenkomste ten opsigte van bestedingspatrone-gedrag sodat hierdie groepe in die ANOVAshy
analise gebruik kan word Die AN OVA-analise is toegepas deur gebruik te maak van die
gerdentifiseerde groepe om bestedingsgebaseerde segmentering te doen In die resultate is 4
bestedingsegmente geidentifiseer en die analise het bevestig dat daar beduidende verskille
bestaan ten opsigte van sosiodemografiese en gedragsveranderlikes-kenmerke tussen hierdie
verskillende bestedingsgroepe onder Aardklopfeesgangers Die groot besteders is tussen 46 en 60
jaar oud bly vir langer periodes en reis groter afstande na die fees toe Hulle het in die verlede ook
ander feeste bygewoon en hulle hoofrede vir die reis na Potchefstroom is om Aardklop by te woon
Hierdie besoekers verkies om drama- en kabaretvertonings-produksies by te woon en hulle kom
meestal van Gauteng Op grond van hierdie aspekte kan die groot besteders gedifferensieer word
van ander bestedingsegmente Hierdie kennis kan Aardklopbemarkers-organiseerders help om die
groot-bestedingsmark in stand te hou deur hulle behoeftesvoorkeure te bevredig terwyl hulle ook
gemotiveer word om meer te bestee aan betaalde vertoningsproduksies Die onontginde
bestedingspotensiaal in die ander bestedingsegmente is ook geidentifiseer en gedetailleerde
beskrywings van hierdie segmente is gegee Aardklop se bemarkersorganiseerders kan daarom
ook hierdie segmente teiken deur middel van aangepaste pakkette wat uiteindelik lede in hierdie
bestedingsegmente kan beweeg om groter besteders te word en sodoende die grootbestedingshy
segment uit te brei Dit sal die ekonomiese impak van Aardklop maksimeer en sal lei tot
mededingendheid volhoubaarheid en verdere groei van die fees
VIII
Alhoewel die korrespondensie-analise as n marksegmenteringsmetode ondersoekend van aard is
is dit n gesofistikeerde tegniek wat n kragtige en omvattende visuele uitbeelding bied van die
verhouding I moontlike assosiasies tussen veranderlikes en ouderdomsgroepe van respondente
Hierdie metode bied egter nie altyd n gedetailleerde profiel van elke ouderdomskategorie nie
8estedingsgebaseerde segmentering as n marksegmenteringsmetode bied n goeie reeks inligting
en daar is bevind dat dit n meer gedetailleerde profiel van elke bestedingsegment beskikbaar
maak teenoor die profiele wat in die korrespondensie-analise gemiddotidentifiseer word Omdat albei
metodes egter gebruik kan word vir doeltreffende segmentering van die Aardklopmark is dit
belangrik om te bepaal presies wat bemarkingsnavorsing moet bereik sod at die mees geskikte
marksegmenteringsmetode gekies kan word
Sleutelwoorde Aardklop Nasionae Kunstefees Fees Kunstefees Korrespondensie-analise
Bestedingsgebaseerde segmentering Marksegmentering Bemarking
IX
1
TABLE OF CONTENTS
CHAPTER 1 Introduction problem statement objectives and method of research
11 INTRODUCTION
12 PROBLEM STATEMENT
13 GOALS AND OBJECTIVES OF THE STUDY
131 Goal
132 Objectives
14 METHOD OF RESEARCH
1 41 Literature Study
142 Empirical Study (Survey)
1421 Research design and method of collecting data
1422 Development of the questionnaire
1423 Sampling population
1424 Sampling method
1425 Data analysis
a Correspondence Analysis
b K-means Clustering
c ANOVA analysis (Analysis of Variance)
15 DEFINING CONCEPTS
151 Aardklop National Arts Festival
152 FestivalArts festivals
153 Market segmentation
16 CHAPTER CLASSIFICATION
CHAPTER 2 Correspondence analysis of visitors to Aardklop National Arts Festival
21
22
23
231
232
233
234
INTRODUCTION
LITERATURE REVIEW
METHOD OF RESEARCH
The questionnaire
The Samples
The Method
Results
1
2
7
7
7
8
8
8
8
8
9
9
10
10
11
11
11
11
12
12
12
14
14
15
19
20
20
21
22
x
2341 General profile of festival respondents 22
2342 Cross-tabulations and accompanying correspondence biplots 23
24 FINDINGS AND IMPLICATIONS 30
25 CONCLUSIONS 32
CHAPTER 3 Expenditure-based segmentation of visitors to Aardklop National Arts 34
Festival
31 INTRODUCTION 34
32 LITERATURE REVIEW 36
33 METHOD OF RESEARCH 39
331 The questionnaire 40
332 The Samples 40
333 The Method 42
334 Results 43
3341 General profile of festival respondents 43
3342 Expenditure clusters 44
3343 ANOVA results 45
34 FINDINGS AND IMPLICATIONS 49
35 CONCLUSIONS 52
CHAPTER 4 Conclusions and Recommendations 54
41 INTRODUCTION 54
42 CONCLUSIONS 55
421 CONCLUSIONS REGARDING THE CORRESPONDENCE ANALYSIS OF 55
VISITORS TO AARDKLOP
422 CONCLUSIONS REGARDING THE EXPENDITURE-BASED SEGMENTATION OF 57
VISITORS TO AARDKLOP
423 CONCLUSIONS REGARDING THE COMPARISON OF THE APPLICATION OF 59
THE TWO SEGMENTATION METHODS
43 RECOMMENDATIONS 61
431 GENERAL RECOMMENDATIONS 61
432 RECOMMENDATIONS FOR FURTHER RESEARCH 61
REFERENCES 63
XI
LIST OF TABLES
CHAPTER 1 Introduction problem statement objectives and method of research
Table 11 Overview of economic impact and profile of Aardklop 2005-2008 5
CHAPTER 2 Correspondence analysis of visitors to Aardklop National Arts Festival
Table 21 Characteristics distinguishing older consumers from younger consumers 17
Table 22 Survey summary 20
Table 23 Festival respondent profile 22
Table 24 Age category by showsproductions attended 23
Table 25 Age category by mediums 24
Table 26 Age category by number of people financially responsible for 25
Table 27 Age category by spending category 26
Table 28 Age category by number of days attended the festival 27
Table 29 Age category by province of origin 28
Table 210 Summary of the age categories by variables 29
CHAPTER 3 Expenditure-based segmentation of visitors to Aardklop National Arts
Festival
Table 31 Overview of economic impact and profile of Aardklop 2005 - 2008 35
Table 32 Characteristics distinguishing high spenders from medium and low spenders 38
Table 33 Questionnaires completed during Aardklop National Arts Festivals 2005 shy 41
2008
Table 34 Questions used and their descriptions 41
Table 35 Festival respondent profile 44
Table 36 Cluster centres and number of cases in each cluster 44
Table 37 ANOVA results for respondent characteristics 45
Table 38 Low medium high-medium and high segments 49
XII
LIST OF FIGURES
CHAPTER 2 Correspondence analysis of visitors to Aardklop National Arts Festival
Figure 21 Biplot of age category and showsproductions attended 24
Figure 22 Biplot of age category and mediums through which respondents heard about 25
Aardklop
Figure 23 Biplot of age category and number of people financially responsible for 26
Figure 24 Biplot of age category and spending category 27
Figure 25 Biplot of age category and number of days attended the festival 28
Figure 26 Biplot of age category and province of origin 29
APPENDIXES
Appendix A Visitor questionnaire 75
XIII
CHAPTER 1 Introduction problem statement
objectives and method of research
11 INTRODUCTION
Over the past few years there has been a rapid increase in the growth of the tourism industry
worldwide In South Africa foreign arrivals increased by 83 during 2006 and the countrys annual
tourism arrivals record was broken for the third year running with 907 million foreigners visiting
South Africa in 2007 (SAT 2007)
The rapid tourism growth in South Africa can be ascribed to various reasons such as increased
marketing efforts communities recognising the potential of tourism and the variety of attractions
across the country Attractions whether natural or man-made are the underlying motivations for
people to travel (Lubbe 2003 1 05 Mcintosh amp Goeldner 1990 112) Events and festivals are
considered man-made or organised celebrations that among others serve as tourist attractions
that attract people to a specific destination and provide unique features and experiences for visitors
(Getz 1993946 Kim amp Uysal 2003160)
Events and festivals have become one of the fastest growing types of tourism attractions
especially in recent years In South Africa event tourism is estimated to expand even faster than
the 10 annual tourism growth rate (George 2004366 Gursoy Kim amp Uysal 2004172 Saayman
Saayman amp Rhodes 2001 443) Events and festivals have important roles to play in the tourism
development and marketing of a destination since it is considered a sector with significant
economic and job creation benefits (Getz 1993945 Getz 19975)
Arts festivals particularly such as the Aardklop National Arts Festival are one of the most rapidly
growing events tourism segments (Jackson amp OSullivan 2002326) and have become important to
the South African society due to a number of reasons and benefits For example it sustains
1
different forms of art it contributes to the livelihood of artists it stimulates the growth of regional
and local economies and it promotes specific destinations to name but a few (Saayman Siabbert
amp Saayman 20057)
These benefits have prompted a remarkable increase in conceptual and empirical studies on
festivals and events There has also been a big increase in the number of festivals hosted by
various destinations (Hughes 20002 Visser 2005 165) The benefits of the Aardklop festival in
particular and the contribution it makes to the community are remarkable Seen from an economic
point of view Aardklop is the third largest festival in South Africa with a total estimated economic
impact of R4665 million in 2008 (Kruger Saayman amp Saayman 200827) During its very
successful but modest beginning in 1998 it had an estimated visitor number of 25 000 thus seen
from a marketing point of view Aardklop has grown substantially in visitor numbers with an
average of just more than 56 000 visitors per year over the past three years (Kruger et al 200827
Van Heerden 200312) However when it comes to reaping the continuous contribution and
benefits of this festival the sustainability and further growth of Aardklop need to be ensured
The purpose of this chapter is to discuss the research process followed in this study This will be
accomplished by firstly analysing the problem Thereafter the goals and objectives will be stated
followed by the research methodology definitions of key concepts and lastly the chapter
classification
12 PROBLEM STATEMENT
Currently at least 211 annual festivals take place across South Africa of which 28 focus on
performing and visual arts or a combination thereof (Visser 2005165) as is the case with
Aardklop National Arts Festival The competition in this market currently has important implications
for all the South African artscultural festivals Most festivals in South Africa are experiencing a
decline in the number of festival visitors ticket sales or both (Saayman amp Saayman 2006a40-41)
The decline typically reflects the principles of a product life-cycle which state that individual events
(or products) tend to progress through stages of growth maturity and decline (Getz 1993951) The
product life-cycle therefore reflects how a festival is doing in this competitive market environment
by indicating the stage or phase it is in
However according to Saayman and Saayman (2006b219 2006582) the sustainability of a
festival must be attained at three levels namely economic environmental and socio-cultural In
order to contribute to the sustainability of the host destination the importance of effectivestrategic
2
marketing of the festival must be realised (Uys 2003 11 Walo Bull amp Breen 199796) Organisers
of recurring events can adopt and implement a number of marketing strategies to prolong the
growth phase of the festivals life-cycle Examples of marketing strategies include market
penetration (attracting more visitors to the festival by means of a more competitive marketing mix)
stimulating new and repeat visits by restructuring the festival programme or developing completely
new markets by means of extensive festival product changes (Getz 1993951) Hawes Taylor and
Hampe (199111) argue that an essential goal of a marketing strategy should be twofold namely
(1) maintaining existing markets and (2) further penetrating markets with high potential which is
possible by means of market segmentation
One of the key success factors of strategic marketing is market segmentation Dibb and Simkin
(2001 609) hold the opinion that market segmentation is vital to business success and is the
universal remedy of modern marketing since a mass marketing approach cannot be used to satisfy
diverse customer needs Nearly all markets include groups of peopleconsumers with different
needs preferences demands tastes behaviour patterns disposable income and spending
patterns therefore marketers cannot compete in an entire market seen from an economic point of
view (Buhalis 2000 1 00 Foster amp Davis 1994 132) Market segmentation therefore recognises the
differences and changes in the lifestyles desires tastes and motivations of visitors to a festival
and continually focuses marketing initiatives on economically significant groups Market segments
vary in size and potential and marketers make use of segmentation to define the marketing
objectives accurately and to allocate resources better (Lamb Hair amp McDaniel 2000213) Market
segmentation is effective since it divides the present and potential market into homogenous
groupssegments based on meaningful characteristics and concentrates promotion product and
pricing efforts on serving the most prominent portions of the market - the target markets (Mcintosh
amp Goeldner 1990407) This is done because it is expected that consumers in the same group (or
segment) will react similarly to a particular offering (McDonald amp Dunbar 199521) Segmentation
therefore assists in identifying the target market to understand their needs better and to determine
the right marketing mix for the target market (Perreault amp McCarthy 1999239) Hence market
segmentation is essential to establish efficient marketing strategies directed at these homogenous
sub-groups (Havitz Dimanche amp Bogle 199440)
In recent years market segmentation and subsequent customisation have become very effective
where the maintenance of existing markets is a primary goal (Wedel amp Kamakura 2002181) since
changes in trends and visitor preferences can be detected by means of market research and this
will assist festival marketers and organisers in adjusting the programme accordingly In other
words market segmentation is beneficial to determine whether visitor interest is still the same or
3
changing in order to maintain the existing markets This is important since the festivals life-cycle
is linked to visitor interest (Saayman 2006114) Marketers can also determine which markets with
high potential can be approached or further penetrated so that a more careful analysis of their
needs motives and expectations can be made in order to develop a festival programme and
product aimed at these specific needs (Nickels amp Wood 1997221)
Implementing market segmentation also accounts for numerous benefits The following can be
considered some of the benefits of market segmentation (Ali-Knight Drummond McMahon-Beattie
Robertson amp Yeoman 2004136 Arrimond amp Elfessi 2001391 Bennet amp Strydom 20015464
Burke amp Resnick 200039 Dibb amp Simkin 19961 Dibb amp Simkin 2001610 Ferrell Hartline amp
Lucas 200274 Frisby amp Getz 19897 George 2004135 Getz 1997260 Keller amp Kotler
2006246 Lee Lee amp Wicks 200461 Marx Van Rooyen Bosch amp Reynders 1998535 Mayfield
amp Crompton 199514 McDonald amp Dunbar 199516 Mouthinho amp Witt 1994305 Saayman
200285)
bull Marketers gain detailed knowledgedefinition of visitors with a better comprehension of their
needs
bull By concentrating on these needs marketers can match visitors needs more closely with the
festival products and services
bull With market segmentation more satisfied festival visitors and long-term visitor relationships
are formed by offering the target markets what they want
bull Market segmentation brings about more effective marketing programmes marketing mixes
and marketing costs
bull Segmentation can lead to the identification of niche markets
bull Market segmentation eases the ability to respond to markets changing needs
bull Segmentation promotes new innovative product ideas
bull It provides clarity on the size of potential markets potential effectiveness of promotions
responses to changes in the marketing mix spending patterns price sensitivity and loyalty
bull Segmentation can lead to concentration of resources in markets where competitive
advantages are great and returns are high
bull By means of segmentation a competitive advantage may be gained by understanding and
assessing the competitors and having an approach different to theirs resulting in less
conflict with competitors
bull Segmentation leads to the development of a sustainable product and better positioning of
the product
4
Therefore it is crucial to implement market segmentation so that the currenUpotential target
audience can be identified and their needs motives and expectations can be understood Based on
that information the festival programme can be designed according to the needs and preferences
of both the current and potential markets Market segmentation therefore assists in maintaining the
existing market by ensuring repeat visits and it also leads to the identification of high spenders so
that these high potential markets can be further penetrated (Burke amp Resnick 200039)
Maintaining and further penetrating festivalevent markets by means of market segmentation is an
economically sensible and sustainable strategy since increased expenditure and economic
contribution to the destination area due to the anticipation of tourists is a common feature of any
event (Murphy amp Carmichael 199132) The economic impact of a festival is measured by the size
of the festival in terms of (1) number of visitors (2) visitor spending (3) duration of stay and (4) the
multiplier effect (Saayman 2007132) In Table 11 below the economic contribution of Aardklop is
prominent The product life-cycle of a festival can be measured by the number of tickets sold
(Kruger 2009 15) based on this Aardklop is showing potential signs of decline although it is not in
a definite declining phase yet Besides the recent decline in ticket sales the festival seems to be
doing well generally As mentioned before Aardklop has experienced positive growth since its
debut in 1998 (Kruger et al 200827) and for the past 4 years the festival has maintained relatively
constant figures with regard to the number of visitors direct spending of visitors as well as average
days spent at the festival (Table 11) Thus Aardklop is an already established event on the festival
calendar of South Africa that still continues to attract a substantial number of loyal supporters (also
referred to as festinos)
Table 11 Overview of economic impact and profile of Aardklop 2005-2008
Year 2005 2006 2007 2008
Absolute number of visitors 36766 61476 51870 55518
Total tickets sold 91156 81022 84559 79530
Number of travel groups 15193 19393 16678 15294
Travel group size 2 3 3 4
Average tickets per group 6 4 5 5
Average days attended festival 3 3 3 3
Total visitor days 113240 196108 168 576 172106
Average spending per group R217438 R177955 R2 61255 R2 79997
Direct spending of visitors at festival R21 574794 R24237640 R27999000 R26 735791
Total economic impact R39171741 R42908324 R53097645 R46650703
Will visit the festival again 95 94 97 93 Source Kruger et al (200826-29) Saayman and Saayman (2006a 36-41)
Aardklop had an exceptional year in 2007 and was extended with a few days to celebrate its 10 year anniversary this could possibly account for its higher economic value in 2007
5
However to ensure the sustainability and future profitability of the festival the growth phase of the
festivals life cycle must be extended by means of continuous strategic marketing efforts That
means that although festivals and events are subjected to successive stages of growth market
research assists festival marketers in determining the changes in demand thereby making it
possible to advise festival organisers on how to modify the festival programmeproduct accordingly
(Frisby amp Getz 19897) Hence it is important that the Aardklop festival committee and
management ensure that the necessary market research is continually implemented so that they
may understand and sustain the current market of the festival and further penetrate markets with
high potential
The division or segmentation of the market can be done in various waysmethods and by means of
a variety of segmentation variables depending on the situation and product (Burke amp Resnick
200041 Dolnicar Crouch Devinney Huybers Louviere amp Oppewal 200846) These
segmentation variables include geographic socio-demographic psychographic andor behavioural
characteristics (Slabbert 20022) A large selection of possible methods is used to do
comprehensive market segmentation These include cluster analysis correspondence analysis
regression analysis Automatic Interaction (AID) analysis latent class analysis judgment-based
segmentation factor and component analysis as well as using expenditure (Slabbert 200240) In
tourism research expenditure-based segmentation as well as correspondence analysis is often
used to implement market segmentation Expenditure-based segmentation entails classifying
visitors into low medium and high spending groups or segments (Mok amp Iverson 2000302)
Correspondence analysiS entails the representation of associations between categorical variables
for effective interpretation of the data to identify and compare different segments (Beldona
Morrison amp OLeary 2005564) However these two methods have not been applied to Aardklop in
previous research
Although correspondence analYSis is purely an exploratory yet sophisticated technique Gursoy and
Chen (2000585) found it to be a much used technique in tourism marketing research
Correspondence analysis is an effective segmentation tool and useful when associations between
two or more multi-categorical variables need to be explored (Beldona et al 2005565)
A number of studies aimed at constructing segments have been based on visitor expenditure (Diazshy
Perez Bethencourt-Cejas amp Alvarez-Gonzales 2005 Saayman Van der Merwe amp Pienaar 2008
Mok amp Iverson 2000 and Legoherel and Wong 2006) This type of segmentation is beneficial
since marketing researchers have discovered that high spenders and users of a specific product
account for a disproportionately large percentage of total sales (Spotts amp Mahoney 1991 42)
6
Dolnicar et 81 (200846) indicate that when expenditures are used in empirical tourism research
valuable insights are provided on how segments of tourists with different expenditure patterns can
be targeted with specific marketing strategies
Grouping the visitors to Aardklop by means of the above-mentioned segmentation methods can
help festival organisers understand the current market better (by means of correspondence
analysis on the bases of demographics) as well as markets with high potential (by means of
expenditure-based segmentation in order to identify the high spenders at Aardklop)
Knowledgeable and informed organisers can then adjust the festival programme and marketing
efforts according to the needs motives and behaviours of these visitorsidentified segments so as
to ensure the sustainability growth continuity and success of the Aardklop festival
Therefore the research question this dissertation will attempt to address is Which markets can be
identified for Aardklop National Arts Festival by applying and comparing two market segmentation
methods namely correspondence analysis and expenditure-based segmentation
13 GOAL AND OBJECTIVES OF THE STUDY
131 Goal
To apply and compare two market segmentation methods of visitors to Aardklop National Arts
Festival
132 Objectives
The achievement of the goal relies on the following objectives
Objective 1
The application of a correspondence analysis in order to understand the Aardklop market better
Objective 2
The application of expenditure-based segmentation in order to identify the profile of high spenders
at Aardklop
Objective 3
To compare the application of correspondence analysis and expenditure-based segmentation to
the Aardklop market
7
Objective 4
To draw conclusions and make recommendations regarding market segmentation of visitors to
Aardklop
14 METHOD OF RESEARCH
This quantitative study follows a two-pronged approach Firstly a literature analysis was done by
collecting secondary data on the topic from existing sources and secondly an empirical survey
was done by collecting primary data by means of a structured questionnaire
141 Literature Study
A literature study was based on specific keywords tourism event tourism arts festival market
segmentation target market economic impact correspondence analysis and expenditure-based
segmentation The internet including scientific databases and search engines such as Google
Scholar RSat ScienceDirect and Ebscohost played a vital role in searching for the most recent
relevant publications and information Other sources also used during the literature study included
books accredited journal articles theses dissertations and tourism-related sources such as
tourism reports and Aardklop website sources
142 Empirical Study (Survey)
The empirical survey was conducted at Aardklop National Arts Festival in the following manner
1421 Research design and method of collecting data
A quantitative approach by means of a questionnaire was followed Siabbert (200463) emphasises
that the advantages of such an approach include (1) it is suitable for collecting demographic
information such as gender age and income (2) it is inexpensive to conduct and (3) it is relatively
easy to tabulate and analyse the data using statistical programmes
Participants were grouped into segments based on certain demographic and socio-economic
characteristics and the research was exploratory in nature The results lead to the identification of
current markets in order to maintain existing markets and penetrate markets with high potential
This study will attempt to determine a demographic (based on age of visitors) and a socioshy
economic (based on visitor spending) profile of visitors to the Aardklop National Arts Festival by
means of a structured questionnaire that serves as the instrument to collect the data
1422 Development of the questionnaire
The Institute for Tourism and Leisure Studies at the North-West University Potchefstroom Campus
developed the questionnaire in collaboration with the festival organisers and it has proved to be
8
successful This research instrument (questionnaire) was used in similar studies often conducted at
South African arts festivals (Van Heerden 2003 Pissoort 2007) A pilot study was done in 2002 at
Aardklop and 6 successful surveys followed in the years thereafter The questionnaire remained
similar throughout these years
The questionnaire was divided into three sections and mainly consisted of closed questions (see
Appendix A) Section one included questions based on socio-demographics of the visitor (such as
gender age language occupation and province of origin) followed by questions in section two
based on behavioural elements (such as travel group size days spent at the festival
productionsgenres attended type of accommodation used other festival attended throughout the
year attendance of free shows number of persons financially responsible for and spending) In
section three more general behavioural questions were also asked such as the means through
which information regarding the festival was communicated (for example magazines newspapers
newsletter etcetera)
1423 Sampling population
The design for drawing a sample consists of defining the population of interest The survey
population for this study was selected from a group of people that attended the festival The
Institute for Tourism and Leisure Studies at the North-West University (Potchefstroom Campus)
conducted 7 surveys at the Aardklop National Arts Festival (2001-2008) From 2005 to 2008 a total
of 1 671 questionnaires were completed by visitors to the festival and the data from these surveys
were used for this study since the questionnaire as well as the general characteristics of the
population remained similar over the four years
The total of 1 671 questionnaires is beneficial since segmentation requires large sets of data
(Burgan amp Mules 200055) Cooper and Emory (1995207) as well as Krejcie and Morgan
(1970608) point out that in any defined population for a population of 100 000 (N) the
recommended sample size (S) is 384 Aardklop has a 4 year average of just fewer than 51 500
attendants With an average of 418 questionnaires per year over the four consecutive year period
the sample size is appropriate for this type of study
1424 Sampling method
For the duration of the festival a non-probability sampling method was used to conduct the
surveys namely convenience sampling The survey was conducted by means of a selfshy
administered questionnaire among the tourists at the festival These respondents were briefed
about the purpose of the research and were willing participants To limit response bias towards a
9
certain group of festival attendants questionnaires were distributed on-site but at different
locations for example in the areasvenues of shows and productions in the areas of closed streets
where attendants gather between shows and on the main festival grounds Field workers were
trained to understand the purpose of the study and the questionnaire so that they could assist
respondents where necessary without interfering with the completion of the questionnaire
Questionnaires were distributed on each day of the 5 day festival period This ensured that the
feedback received by the sample population was an accurate portrayal of visitor spending
1425 Data analysis
The data was coded on Microsoft Excel and processed using SPSS (Statistical Package for the
Social Sciences) and Statistica software with the assistance of the Statistical Services at the Northshy
West University Potchefstroom Campus An initial data analysis entailed descriptive statistics and
focused on the demographic profile of the visitor to the Aardklop festival by means of frequencies
A correspondence analysis was undertaken to visualise the correlationirelationship between the
age of respondents and other variables A K-means clustering was done to group members
together based on their similarity with regard to spending patternsbehaviour so that these clusters
could be used in the ANOVA analysis The ANOVA analysis was applied by using the identified
clusters to do expenditure-based segmentation A brief description of each analysis that was used
will be provided in the following section
a Correspondence Analysis
Beldona et al (2005564) point out that correspondence analysis is an exploratory and
sophisticated technique that gives a powerful representation of association between categorical
variables by giving a comprehensive view of the data (in the contingency table) for effective
interpretation It is also a much used technique in tourism marketing literature (Beldona et al
2005564) Examples of these include Arimond and Elfessi (2001 391) Beldona et al (2005561)
Calantone Benedetto Hakam and Bojanic (198925) Chen (2000241) Chen (2001345) Chen
and Gursoy (2000193) Cheung (1994374) Gursoy and Chen (2000583) Kara Kaynak and
Kucukemiroglu (1996102) Kaynak Kucukemiroglu and Kara (1994237) Malhotra and Bartels
(200265) and Shanka and Taylor (200455) For purposes of this study a correspondence analysis
of socio-demographic and behavioural variables was undertaken in order to visualise the
relationship possible associations between these variables and respondent age groups
(dependent variable)
10
b K-means Clustering
Instead of simply dividing the market into three spending categories (high medium and low) for
purposes of expenditure-based segmentation clustering is a method used to group members
together based on their natural similarity and makes no pre-determined selection in the number of
spending groups (Saayman Siabbert amp Saayman 2009) K-means clustering is a method of
clustering whereby the data is divided into K (number of clusters chosen by researcher) clusters
and assigns each item to a cluster based on distances that measures the closeness or similarity to
the mean value of the cluster (Kruger Saayman amp Saayman 20097)
c ANOVA analysis (Analysis of Variance)
An AN OVA (also referred to as an F-test) is closely related to the t-test These two analyses differ
mostly on the grounds that the t-test assesses the difference between the means of two groups
while the ANOVA on the other hand assesses the difference between the means of two or more
groups (Kruger 200911) For purposes of this study the analysis of variance (ANOVA) was used
to determine the differences in terms of socio-demographic and behavioural variables (as tested by
the questionnaire) between the identified expenditure clusters and to test whether these differences
were statistically significant
15 DEFINING CONCEPTS
The following concepts were used during the course of the study and therefore need clarification
151 Aardklop National Arts Festival
The Aardklop National Arts Festival is a South African arts festival held annually in Potchefstroom
in the North-West Province after a very successful debut in 1998 It is a cultural event that takes
place for 5 successive days at the end of September and hosts items in a variety of venues in and
around the town such as theatre dance music cabaret and visual arts A large craft market as
well as open-air performances also form part of this predominantly Afrikaans event (ANON 2008
Van Heerden 200311) According to the organisers Aardklop was initiated because of concern for
the arts and artists as well as to cater for the cultural needs in the northern part of South Africa
(ANON 2008 Van Heerden 200311 Kruger et al 20081) The main aim of the festival is
therefore to provide a quality platform for artists to promote the arts and to strive towards creating
new job opportunities Although Aardklop is a predominantly Afrikaans festival it readily
accommodates activities for other language groups as well (Kruger et al 20081)
11
152 FestivalArt festivals
The Oxford Concise Dictionary (2001 530) defines a festival as a day or a period set aside for
celebration or feasting an organised set of performances and special events Smith (1990128)
defines festivals as a celebration of a theme or a special event that takes place for a limited period
of time and invites the public to a once-off annual or less frequent happening More specifically an
arts festival can be defined as a community-themed event or celebration designed to showcase
different art forms and activities - along with the related tourism and hospitality experiences (Kruger
amp Petzer 2008113) Isar (1976131) explains that an arts festival is something exceptional
something out of the ordinary something that must create a special atmosphere which stems not
only from the quality of the art and the production but from the traditions of a region
153 Market segmentation
Consumers have different demands tastes behaviour patterns disposable income and spending
patterns therefore marketers cannot compete in an entire market from an economic point of view
(Foster amp Davis 1994132) Grouping consumers with similar needs and preferences together is
known as market segmentation (Middleton 199471) This is done since it is expected that
consumers in the same group (or segment) will react similarly to a particular offering (McDonald amp
Dunbar 199521) Dibb and Simkin (2001 609) point out that market segmentation is vital to
business success and is the universal remedy of modern marketing since a mass marketing
approach cannot be used to satisfy diverse customer needs Instead market segmentation takes
care of the element of diversity whereby customers with similar requirements and buying behaviour
are grouped into segments Identifying these segments assists in allocating limited resources to
serve the most appropriate customers Wedel and Kamakura (2002182) also argues that
whenever demand is heterogeneous it will be profitable to distinguish segments By grouping
tourists into different segments (within which visitors have similar characteristics and needs) it
allows for each segment to be reached with a specific marketing mix (McDonald amp Dunbar
199510)
16 CHAPTER CLASSIFICATION
The study is divided into four chapters The following provides a brief outline of what is presented in
each chapter
Chapter 1 Introduction and problem statement
Chapter 1 comprised a general introduction to the study the problem statement followed by the
research goal and objectives as well as the method of research Key concepts that are used in the
study are defined The aim of this chapter is to give an overview of the Aardklop National Arts
12
festival and the problem the festival organisers and marketers need to address The importance of
market segmentation for Aardklop is emphasised and two segmentation methods are identified that
will benefit Aardklop in the context of the identified problem
Chapter 2 Correspondence analysis of visitors to the Aardklop National Arts Festival
(Article 1)
Chapter two consists of Article 1 In this article correspondence analysis as a segmentation
method with age as the dependent variable is applied to visitors at the Aardklop National Arts
Festival With this method it is possible to comprehensively classify markets into profiles to
determine any changes in the needs or trends in order to maintain existing target markets This will
contribute to the sustainability and growth of the festival since improvements can be made with
regard to the festival program and marketing efforts
Chapter 3 Expenditure-based segmentation of visitors to the Aardklop National Arts
Festival (Article 2)
This chapter consists of Article 2 In this article expenditure-based segmentation is applied to
visitors at the Aardklop National Arts Festival With this method a comprehensive profile of the
target market with regard to visitor spending will be compiled and the most viable market financially
speaking will be identified in order for it to be penetrated further With fewer people spending more
at the festival the social and environmental impact remains minimal This will also contribute to the
sustainability of the festival since high spending target markets have a direct influence on the
extent of the economic impact
Chapter 4 Conclusions and recommendations
The final chapter draws conclusions based on the content of the first chapters Recommendations
with regard to different marketing strategies are made and the two market segmentation methods
that were used will assist the festival organisers and marketers with sustainable planning and
marketing practices This chapter is concluded with a summary highlighting the importance of
festival management through implementing continuous market segmentation by means of various
segmentation methods
13
CHAPTER 2 Correspondence analysis of visitors to the Aardklop National Arts Festival
21 INTRODUCTION
There are currently at least 211 annual festivals that take place across South Africa of which 28
focus on performing and visual arts or a combination thereof (Visser 2005165) as is the case of
the Aardklop National Arts Festival (hereafter referred to as Aardklop) This predominantly
Afrikaans cultural event is the third largest festival of its kind in South Africa and takes place
annually in the city of Potchefstroom The festival hosts approximately 85 productions by 390 artists
across a variety of genres such as theatre dance cabaret jazz rock literature childrens and
street theatre and visual arts (ANON 2008 Raath 2009 van Heerden 200311 Kruger Saayman
amp Saayman 200827) According to the organisers Aardklop was started out of concern for the arts
and artists as well as to cater for the cultural needs of the community in the northern part of South
Africa The main aim of the festival therefore is to provide a quality platform for artists to promote
the arts (ANON 2008 van Heerden 2003 11 Kruger et a 2008 1)
A growing problem in the events and festivals sector is competition that threatens the sustainability
of the event (Smith amp Jenner 199874) In South Africa competition in the festival market has
serious implications for most artscultural festivals such as declines in festival visitor numbers
ticket sales or combinations of both (Saayman amp Saayman 2006a40-41) However by identifying
festival visitors specific needs and motives for attending a festival (and possible changes in these
needs and motives) a festival productprogramme can be designed to satisfy these needs The
tailor-made programmes will encourage visitors to spend more money on ticketed
showsproductions and to attend the festival repeatedly Increased ticket sales result in increased
profits which ensure the sustainability of the festival (Koc amp Altinay 2007228 Pissoort 20072
Mok amp Iverson 2000304 Formica amp Uysal 199816) Therefore one of the best ways to secure
long-term growth of a festival is to understand the festival market enabling the development of a
sustainable marketing strategyprogramme so that a steady growth rate is maintained (Uys
200313)
14
Thus Aardklops organisersmarketers need to understand the needs behaviour and expectations
of current andor potential visitors by means of market segmentation in order to secure long-term
growth and sustainability The purpose of this article is to analyse the visitors to the Aardklop
National Arts Festival by means of correspondence analysis To achieve this the literature review
method of research listing of research results and conclusions will be presented below
22 LITERATURE REVIEW
In order to create retain and satisfy the needs of Aardklop festival visitors - seeking their
consumption (of ticketed showsproductions) as well as their loyalty by repeatedly visiting the
festival - the continuous process of market segmentation must be applied by grouping or
segmenting current andor potential visitors with very different needs motives behaviours ages
income levels family sizes etcetera (Koc amp Altinay 2007228 van Zyl 200585) Market
segmentation recognises the differences and changes in the lifestyles desires tastes and
motivations of visitors to a festival and divides the present and potential market into homogenous
groupssegments based on meaningful characteristics since it is expected that consumers in the
same segment will react similarly to a particular offering (Lamb Hair amp McDaniel 2000213
Mcintosh amp Goeldner 1990407 McDonald amp Dunbar 199521) Segmentation therefore assists to
pinpOint the target market in order to better understand their needs since changes in trends and
visitor preferences can be detected Pinpointing the target market will assist festival marketers and
organisers in adjusting the programme accordingly such subsequent customisation has recently
become very effective for the maintenance of existing markets (Saayman 2006 114 Perreault amp
McCarthy 1999239 Wedel amp Kamakura 2002181) When needs and expectations are met or
exceeded consumer satisfaction will increase which is pivotal for establishing a long-term
consumer relationship and ensuring repeat business higher usage and increasing the probability of
the consumer recommending the service to someone else More satisfied consumers are also less
prone to consider product offerings from competition (Lee Lee Lee amp Babin 200858)
A large selection of possible methods can be used to do comprehensive market segmentation
These include cluster analysis regression analysis Automatic Interaction (AID) analysis latent
class analysis judgment based segmentation factor and component analysis expenditure-based
segmentation as well as correspondence analysis (Slabbert 200240) Correspondence analysis is
often used to implement market segmentation especially in tourism marketing literature (Beldona
Morrison amp OLeary 2005564 Gursoy amp Chen 2000585) Examples of such literature include the
following studies
15
bull Arimond and Elfessi (2001) firstly used correspondence analysis to spatially map desirable
attributes of a bed and breakfast facility and then cluster analysis to identify market segments
bull Beldona et al (2005) examined purchase motives of pleasure travel components of low and
high complexity in a web environment
bull Calantone Benedetto Hakam and BOjanic (1989) researched tourists perceptions of
Singapore and other Pacific Rim countries
bull Chen (2000) researched cross-cultural differences in travel information acquisition among
tourists from three Pacific-Rim countries
bull Chen (2001) also researched Korean outbound travellers destination images
bull Chen and Gursoy (2000) researched a cross-cultural comparison of the information sources
used by first-time and repeat travellers of German British and French travellers to the US as
well as
bull a competitive analysis of cross cultural information search behaviour of German British and
French travellers to the US (Gursoy amp Chen 2000)
bull Cheung (1994) explored principal component analysis and correspondence analysis as
methods for the multi-criteria decision making problem
bull Kara Kaynak and Kucukemiroglu (1996) used correspondence analYSis to position fast-food
outlets in two regions of North America
bull Kaynak Kucukemiroglu and Kara (1994) explored consumers perceptions of intemational
airlines
bull Malhotra and Bartels (2002) considered correspondence analysis as an approach to minimise
the attribute pre-specification bias in international marketing management and
bull Shanka and Taylor (2004) explored sources of information used by festival visitors to the
Spoleto festival in Italy
Correspondence analysis is therefore not only a much used market segmentation method but is
also implemented across a variety of tourism-related topics However correspondence analysis
research based on festivals is extremely limited and market segmentation still needs to be
implemented on a large scale by these means in the eventsfestival sector
The application of correspondence analysis can be based on a variety of variables such as age
sources of information used gender and so forth thereby making it a flexible exploratory research
method Tourism literature is saturated with research studies that segment markets by means of a
variety of segmentation variables depending on the purpose of the study (Formica amp Uysal 1998
Burke amp Resnick 2000 and Dolnicar Crouch Devinney Huybers Louviere amp Oppewal 2008)
These segmentation variables can be categorised into various bases such as (Slabbert 20022
16
Burke amp Resnick 200041 Lubbe 200077 George 2004126 Kotler amp Armstrong 2004240
Lamb Hair McDaniel Boshoff amp Terblanche 2004168 Saayman van der Merwe amp Pienaar
2008 Formica amp Uysal 1998 17)
bull geographic (eg region country city suburb climate and transport)
bull socia-demographic (eg gender age occupation and family life-cycle)
bull psychographic (eg social class lifestyle andor personality characteristics) and
bull behavioural (eg loyalty attitudes length of stay travel group size accommodation
preferences benefits sought by travellers and travel motivations)
Demographic segmentation is a popular method in market segmentation because consumer needs
and wants are usually influenced by demographic variables and these variables are generally
easier to measure than most other variables (Bowen 1998289) According to Holbrook and
Schindler (199627) one specific socia-demographic variable that marketers have used
successfully is segmentation based on age The purpose of segmentation by means of age is to
divide the market into specific age categories in order to determine the characteristic differences of
each category However results of studies where age was used as segmentation variable can be
inconsistent (Horneman Carter Wei amp Ruys 200223) due to changes in market trends and in the
needs and preferences of the consumers For this purpose it should be noted that the results of
age-segmentation studies are bound to change constantly and should be applied on a continuous
basis in order to monitor these changes in the market Various studies of which the results revealed
differences in the characteristics of older as opposed to younger consumers are captured in Table
21 below
Table 21 Characteristics distinguishing older consumers from younger consumers
CHcIRACTERISTIC bull bull - AUTHORS
Recreationleisure Older consumers go bowling more Hisrich and Peters (1974) 88
activities often than younger consumers quoted by Holbrook and Shindler (199627)
Travellers over the age of 50 prefer Anderson and Langmeyer non-hectic pre-planned pleasure (1982) as quoted by trips Homeman at a (200223) Travellers over age 55 are more Javalgi Thomas and Rao likely to cruise tour visit friends and (1992) as quoted by relatives leas likely to visit cities Homeman at 8 (200224) resorts and theme parks Older festival visitors (over 30 years Younger festival visitors (younger Formica and Uysal (199822) of age) to Spoleto Festival than 30 years) to Spoieto Festival (International cultural-historical are less inclined to socialise and festival) in Italy seek socialisation interact with other visitors and Interaction with other festival visitors Respondents (in 12 states of the USA) with children under 18 years of age Hsu Kang and Wolfe were more likely to attend fairs and festivals in the USA (200212) European cultural market consists of European cuitural market consists Richards (2001 40) 26 vIsitors over the age of 50 of 35 visitors under the age of 30 years
17
Madiumsof communication inform ation
lifestyle
Expendituresllncome
Travel behaviour
us festival visitors are more likely to be under 50 years of age Older consumers process consumer information slowly I less accurately
Older consumers read magazine advertisements with less youthful models (cigarette advertisements)
Age group 45-54years depends on Young age group (18-25 years) television and age group 55+ depends on word-of-mouth as depends on newspapers as a source of festival information source of festival information (Swan (Swan Valley Wine Festival in Valley Wine Festival in Australia) Australia) Older consumers tend to aim more towards a more sedatedignified lifestyle
Young bachelors spend more on away-from-home entertainment (concerls movies bars dancing)
Young singles spend more on clothing than married or older adults
Older consumers (Japanese outbound pleasure travellers Tsltsikamma National Par1 visitors) are associated with higher spending Older consumers show more diligent shopping behaviour
Younger consumers (TahNanese tourists to Guam and leisure expenditures In US) are associated with higher spending
Older and middle-aged festival Younger festival visitors (less than visitors to the Spoleto Festival earn 30 years) to Spoleto Festival earn a higher income lower income Overall purchasing involvement is higher among adults with children than younger or older adults without children
Young and agad visitors (US visitors to Hawaii) average daily expenshyditure is significantly less than the visitors in the in-between age groups Older visitors spend more than younger visitors at festivals (jazz and arts festivals)
Younger and middle-aged natureshybased tourists are likely to be high spenders
Senior travellers travel longer distances and stay away longer than any other age group
Older senior (65+ years) natureshybased travelers in North Carolina South Carolina and Georgia were more likely to stay at their destination longer spend more time planning In advance for their trip and visit friends and relatives than younger senior travellers (55-04)
Out-of-region visitors to an international Jazz festival in Italy (Umbria region) were younger
Middle-aged and older visitors to the Younger age group (less than 30 Spoleto Festival are mostly married years) are mostly singles but
prefer to visit the Spoleto Festival with partners
Young and aged visitors (US visitors to HawaII) stay much longer than the visitors in the in-between age groups
Ba~anBa~anUysal and Sunshine (199521) Cole and Gaeth (1990) as quoted by Holbrook and Shindler (199627) Mazis Ringold Perry and Denman (1992) as quoted by Holbrook and Shindler (199627) Shanka and Taylor (200458)
Morgan and Levy (1993) as quoted by Holbrook and Shindler (199627) Schanlnger and Danko (1993) as quoted by Holbrook and Shindler (199627) Wagner and Hanns (1983) as quoted by Holbrook and Shindler (199627-28) Jang Bai Hong and OLeary (2004331) Kruger Saayman and Saayman (2009) Jang Ismail and Ham (200283) Zeithaml (1985) as quoted by Holbrook and Shindler (199627) Dardis Soberon-Ferrer and Patro (1994315) Mok and Iverson (2000302)
Formica and Uysal (199822)
Slama and Tashchian (1985) as quoted by Holbrook and Shindler (199628) Mak Moncur and Yonamlne (19776) Saayman and Saayman (2006b217) and Thrane (2002284) Mehmetoglu (2007213) and Pouta Neuvonen and Sievanen (2006131) Shoemaker (1989) Blazey (1991) and Pearce (1999) as quoted by Homeman at a (200223) Ba~anBa~anand
Silverberg (1999) as quoted by Horneman at a (200224)
Formica and Uysal (199817)
Formica and Uysal (199822)
Mak at a (19776)
18
Travel motivations Older people to Com Festival in South Carolina tend to place more importance on the event novelty than other age groups Age 28 to 47 (middle age groups) are more interested in content of FICA (International Festival of Environmental Film and VIdeo in Brazil) festival programme than the younger age group (18- 7 yeara) Over age 50 travellers take pleasure trips for rest I relaxation and for visiting relatives Festival enthusiasts (thirsty for culture and attracted to Spoleto Festival because of cultural experiences such as ballets operas theatre plays) were middle-aged and older (over 30 years of age)
Escaping from routine as motivation in attending FICA festival is more prevalent in relatively young visitors (below age 37) than in older visitors (age 38shy47)
Festival moderates (interested in festival but to lesser extent than the enthusiasts) to Spoleto Festival were younger (under 30 years of age)
Uysal Gahan and Martin (19938)
Kim Borges and Chon (2006961)
Anderson and Langmeyer (1982) as quoted by Homeman et 8 (200223) Formica and Uysal (199822)
In Table 21 above it is clear that previous research findings reveal definite characteristic
differences between older and younger (and in some instances middle-aged) visitorstourists Age
has therefore proved to be a pertinent demographic segmentation variable and more specifically a
significant segmentation variable in research relating to festivals In general it is evident that
middle-aged and older visitorstourists are more likely to attend festivals if they have children they
make use of writtenvisual information mediums they tend to be higher spenders (and income
generators) they are greater cultural enthusiasts and they travel for longer periods of time
Younger visitorstourists seem to be more associated with word-of-mouth as an information
medium they are higher spenders in only specific activitiesentertainment have lower incomes
and are to a lesser extent cultural enthusiasts
Therefore segmenting the visitors to Aardklop by means of correspondence analysis on the bases
of age as a demographic variable can help festival organisers to gain a better understanding of the
current market Knowledgeable and informed organisers can then adjust the festival programme
according to the needs motives and behaviours of these visitors identified segments as well as
develop appropriate and effective marketing strategies This will ensure the sustainability growth
continuity and success of the Aardklop festival
23 METHOD OF RESEARCH
The Institute of Tourism and Leisure Studies at the North-West University (Potchefstroom Campus)
has conducted surveys at the Aardklop National Arts Festival since 2001 by means of structured
questionnaires From 2005 to 2008 a total of 1671 questionnaires were completed by visitors to the
festival and the data from these surveys were used for the purpose of this study since the general
characteristics of the population remained similar over the four years The method of research will
19
be discussed with reference to (i) the questionnaire (ii) the samples and (iii) the method of market
segmentation
231 The questionnaire
The survey questionnaire used for the visitors to Aardklop remained similar throughout the four
year data collection period This questionnaire was also similar to previous questionnaires used at
other festivals in South Africa such as the Klein Karoo (Slabbert Saayman Saayman amp Viviers
2008) and Grahamstown National Arts Festivals (Viviers Siabbert Saayman amp Saayman 2008)
The questionnaire was divided into three sections and consisted mainly of closed questions (see
Appendix A) Section one included questions based on the socio-demographics of the visitor (such
as gender age language occupation and province of origin) followed by questions based on
behavioural elements (such as travel group size days spent at the festival productionsgenres
attended number of persons financially responsible for and spending) in section two In section
three more general behavioural questions were also asked such as the means through which
information regarding the festival was communicated (for example magazines newspapers and
newsletter)
232 The samples
The surveys were conducted annually during the festival in Potchefstroom by means of
convenience sampling Cooper and Emory (1995207) as well as Krejcie and Morgan (1970608)
point out that in any defined population for a population of 100 000 (N) the recommended sample
size (S) is 384 Table 22 below indicates that Aardklop has had a 4 year average of below 51 500
attendants With an average of 418 questionnaires per year over the four consecutive year period
the sample size is appropriate for this research
Table 22 Survey summary
Year Number of Number of Absolute number questionnaires questionnaires of visitors
distributed included in the data analysis
2005 420 407 36766
2006 420 413 61476
2007 24 Sep - 29 Sep 400 357 51870
2008 30 Sep -4 Oct 500 494 55518
TOTAL 1740 1671 205630 435 418 51408
Source Kruger et al (2008227) Saayman and Saayman (2007226) Saayman and Saayman (2006a837) Saayman and Saayman (2005945)
20
The survey was conducted by means of a self-administered questionnaire among adult visitors at
the festival These respondents were briefed about the purpose of the research and were willing
participants In order to limit response bias towards a certain group of festival attendants
questionnaires were distributed on-site but at different locations such as in the areasvenues of
shows and productions in the areas of closed streets where attendants gather between shows and
on the main festival grounds Field workers from the North-West University were trained to
administer the surveys and to understand the purpose of the study and the questionnaire in order
to assist respondents where necessary (but without interfering with the completion of the
questionnaire)
233 The method
The data was analysed using SPSS (Statistical Package for the Social Sciences) and Statistica
Correspondence analysis (CORA) sometimes called dual scaling is an exploratory technique for
analysing multi-way frequency tables Multi-way frequency tables are cross-classifications of two or
more categorical variables (Bartholomew Steele Moustaki amp Galbraith 200281 Calantone et a
198926) CORA transforms these tables consisting of numerical information (categorical data
frequencies) into a graphical display within a low-dimensional space This makes it easier to identify
the key features of the data when interpreting the information (Shanka amp Taylor 200457
Bartholomew et a 200281) The joint graphical display can help detect structural relationships or
associations between these categorical variables (row categories and column categories) (Hoffman
amp Franke 1986215) whereby respondents choosing the same category are plotted close to each
other and respondents choosing different categories are plotted as far apart as possible (Arrimond
Achenreiner amp Elfessi 200332) In other words the proximity between a pair of points is used to
interpret the underlying relationship between the points Closely aligned points reveal a strong
relationship (Chen 2001 346)
The most important feature of CORA is its multivariate nature that enables multivariate treatment of
multiple categorical data simultaneously (Gursoy amp Chen 2000585) The application of CORA is
therefore an effective segmentation tool since it allows for effective interpretation of the data in
order to identify and compare different segments in a market This method is applied in this
research where a demographic variable namely age (of the festival attendee) is the dependent
variable Age was categorised into six groups where 1 = under 18 years 2 = 18-25 years 3 = 26shy
35 years 4 = 36-45 years 5 = 46-60 years and 6 = older than 60 years These age categories of
respondents were corresponded with the showsproductions attended mediums through which
respondents heard about the festival number of people for whom the respondent is financially
21
responsible spending categories number of days attended the festival and province of origin The
results of the correspondence analysis will be discussed in the next section
234 Results
The empirical results are presented in two divisions namely (1) the general profile of the
respondent population to Aardklop over the period of four consecutive years (2005-2008) and (2)
the cross-tabulations and their accompanying correspondence biplots of the corresponded
variables with the age categories of respondents
2341 General profile of festival respondents
The general profile of the respondents to Aardklop (Table 23) reveals that the majority (55) were
females were 46-60 years of age (28) spoke Afrikaans (94) came from the Gauteng (43)
and North-West (35) provinces were either in professional occupations (28) or students (17)
resided with family and friends (23) during the course of the festival or were local (22) attended
drama productions (55) or rock shows (28) and identified word of mouth (53) and television
(49) as the mediums through which they heard about the festival The profile further reveals the
travel group size to be 3 persons the respondent to be financially responsible for 2 persons the
length of stay to be 2 days and the spending per person to be R96844 Respondents previously
attended Aardklop 4 times 70 confirmed that the festival was their main reason for visiting
Potchefstroom and 95 indicated that they would attend the festival again It is therefore apparent
that the festival visitors are predominantly students and professional people are either local or from
Gauteng regularly attend Aardklop and mostly prefer drama productions
Table 23 Festival respondent profile
CATEGORY VARIABLE VARIABLE HQm2 Ignguag~
Male 743 446 Afrikaans 1568 941 Female 922 554 English 84 50
il Other 14 08
AIm OccultiQn Under 18 46 28 Professional 464 281 18-25 403 243 Management 141 85 26-35 263 159 Administrative 119 72 36-45 361 21 8 Technical 45 27 46-60 461 278 Sales 47 28 60+ 125 75 Farmer 24 15
Mining 22 13
~
~ Civil service 35 21 NorthWest 581 351 Self-employed 114 69Gauteng 703 425 Student 284 172 Mpumalanga 66 40 Unemployed 9 05 Free State 136 82 Housewife 110 67Eastemcape 14 08 Pensioner 101 61WestemCape 46 28 Other 136 82Northern cape 15 09
KwaZulu-Natal 35 21 Umpopo 51 31 Outside RSA 9 05
22
297 67 65 150 53
494 413 170 58 40
275 373 531 55
Number of people financially responsible for Number of days Number of visits to Aardklop Spending per person
VARIABLE
Festival is main reason for visit to Potchefstroom Visit Aardklop again
34 Persons 24 Persons 23 Days 40 Times R96844
702 946
2342 Cross-tabulations and accompanying correspondence biplots
The cross-tabulations and their accompanying correspondence biplots of each independent
variable (showsproductions attended mediums through which respondents heard about the
festival number of people the respondent is financially responsible for spending categories
number of days attended the festival and province of origin) corresponded with the respondent age
categories are individually discussed below
Showsproductions attended
Table 24 shows the profile of each age category for the corresponding showsproductions
attended A significant chi-square value was reported for the age-showproduction relationship The
value for Table 24 was x2(45)=618 pltO049
Table 24 Age category by showsproductions attended
SHOW I PRODUCTIONSAGE CATEGORY
ORA I DAN I WampP CHI LEG JWmiddot=eImiddotmiddotUr1= IWIIMii 1 (Under 18) 09 02 0100 02 00 03 04 03 03 03 29 2 (18-25) 61 19 09 08 05 20 18 11 34 36 221 3 (26-35) 48 15 09 08 06 17 17 09 31 22 183 4 (36-45) 64 23 13 10 08 17 17 13 31 35 231 5 (46-60) 76 20 12 08 05 28 25 12 50 34 269 6 (60+) 19 05 05degA 01 02 06 08 03 10 10 67 TOTAL 277 83 48 38 27 91 88 51 158 139 1000
Note ORA = drama DAN = dance theatre WampP = word art amp poetry CHI = childrens theatre LEC = lectures amp discussions VIS = visual art amp exhibitions CLAS = classical music CHO = choirs CAB = cabaret ROC = rock
AccommQdatiQn Local Family and Friends Guesthouse or 8amp8 Hotel Camping House Rental Day visitor Other
Shows l e~ugjQlsect Drama Dance theatre Word art amp poetry Childrens theatre Lectures amp discussions VISual art amp exhibitions ClaSSical music Choirs Cabaret Rock
VARIABLE
Group size
352 218 371 229 196 121 15 09
109 67 52 32
311 192 212 131
912 546 273 163 157 94 124 74 88 53
301 180 291 174 168 101 521 31 460 2752
Attend5n~ Qf Qther festivals over the [last three vears KKNK Grahamstown Volksblad Innibos Other
Mediums Television Radio Aardklop website Aardklop e-mail M-Web newsletter Magazines Newspapers Word of mouth Other
496 112 108 251 89
825 690 284 97 67
459 624 887 92
23
Figure 21 is the biplot for the cross-tabulation of age category by showsproductions attended
which reveals the relationships between the row (age categories) and column (showsproductions)
based on the proximities of the row and column points The biplot indicates that the older age
groups (46-60 years and over 60s) are more likely to attend cabaret shows visual art and
exhibitions as well as classical music On the other hand the younger generation (ages 18-25)
seemed to be more attracted to rock shows and word art and poetry The results suggest that
visitors in age group 4 (36-45 years) were more likely to attend dance theatre productions and
lectures and discussions It can be seen that drama is not related to a specific age group and is
therefore a genre generally attended by all aged visitors
- 05 lt1gt l J 1
04 (II lt1gt gt c 03 c shylt1gt- CHO
J1 shy2gt 0 02 w~ - r- 01NC) cj-OC) 00
Cii --shycr- -01 LEC lt1gt v EltD _ 0 -02 Cl~
-03 -025 -020 -015 -010 -0 05 000 005 010 015
Dimension 1 Eigenvalue 00786 (41 72 of Inertia)
Figure 21 Sipot of age category and shows productions attended
Note ORA =drama DAN =dance theatre WampP =word art amp poetry CHI =childrens theatre LEC = lectures amp discussions VIS = visual art amp exhibitions CLAS = classical music CHO = choirs CAB = cabaret ROC = rock
Mediums through which respondents heard about Aardklop
Table 25 shows the profile of each age category for the corresponding mediums through which
respondents heard about Aardklop A significant chi-square value was reported for the age-medium
relationship The value for Table 25 was x2(35)=591 plt0007
Tabe 25 Age category by mediums
MEDIUMSAGE CATEGORY
TV I RAD WEB I EM NL MAG NP I WOM I TOTAL
1 (Under 18) 2 (18-25) 3 (26-35) 4 (36-45) 5 (46-60) 6 (60+) TOTAL
07 47 37 50 53 13
206
06 37 37 38 43 11
173
04 17 13 17 19 04 76
02 06 05 06 07 02 27
01 04 03 04 04 01 17
06 24 21 26 32 06
116
07 37 29 37 41 10
161
08 61 40 50 52 12
224
42 234 185 228 251
59 1000
Note TV =television RAD =radio WEB = Aardklop website EM = Aardklop e-mail NL =M-Web newsletter MAG = magazines NP = newspapers WOM = word of mouth
24
Figure 22 is the biplot for the cross-tabulation of age category by mediums which reveal the
relationships between the row (age categories) and column (mediums) based on the proximities of
the row and column points The biplot indicates that age groups 2 and 3 (ages 18 to 35) were more
likely to rely on word of mouth The 46-60 year old respondents were more likely to hear about
Aardklop by means of written mediums such as magazines newspapers Aardklop e-mail and Mshy
Web newsletter It would also seem that the age group older than 60 also relies on the same
mediums as the 46-60 year olds The under 18s are separated from other age groups and the
Aardklop website is separated from other mediums
02 18
N
bull co
~ 01t 10 ~ gt ~o 00 ill I0
N CCi I -01 0 ~ ~ WEB Q) -02E is
-03 -02 -01 00 01 02 03
Dimension 1 Eigenvalue 00994 (6558 of Inertia)
Figure 22 Siplot of age category and mediums through which respondents heard about Aardklop
Note TV = television RAD = radio WEB =Aardklop website EM =Aardklop e-mail NL =M-Web newsletter MAG = magazines NP =newspapers WOM =word of mouth
Number ofpeople financially responsible for
Table 26 shows the profile of each age category for the corresponding number of people for whom
the respondent is financially responsible A significant chi-square value was reported for the ageshy
number of people financially responsible for relationship The value for Table 26 was x2(25)=3436
plt0001
Table 26 Age category by number ofpeople financially responsible for
NUMBER OF PEOPLE FINANCIALLY RESPONSIBLE FORAGE CATEGORY
1 PERSON 2 PPL i 3 PPL I 4 PPL I 5 PPL 6 PPL I TOTAL
1 (Under 18) 21 01 01 01 00 01 25 2 (18-25) 138 60 15 11 04 06 234 3 (26-35) 36 75 15 18 06 08 159 4 (36-45) 34 55 37 54 17 23 220 5 (46-60) 78 110010 35 41 13 10 286 6 (60+) 23 40 04 06 01 01 76 TOTAL 330 341 108 131 42 49 1000
Note PPL =people
25
Figure 23 is the biplot for the cross-tabulation of age category by number of people financially
responsible for which reveals the relationships between the row (age categories) and column
(number of people) based on the proximities of the row and column points The results suggest that
the respondents aged 18-25 only pay for themselves (1 person) at the festival The age groups that
appeared to be financially responsible for 2 people included the 26-35 year olds the over 60s
group and - because of the relatively low inertia of dimension 2 (2339) - the 46 to 60 year olds
could also be considered to carry financial responsibility for 2 people The 36-45 year old age
group on the other hand were more likely to be responsible for 3 to 6 people which probably
represent a family
0 7 en () 0 6 Ii
bull~ 0 5
~ 0 4 0 Ii) 0 3 ~
i 0 2 iii ~l Q) 0 1
~ poundc 0 0 Q)
-0 1 $ 0
-0 2 N c -03011
-04
~ -0 5 0
-06 -12 -10 -0 8 -0 6 -04 -02 00 0 2 04 06 08
Dimension 1 Eigenvalue 16338 (7499 of Inertia)
Figure 23 Siplot of age category and number ofpeople financially responsible for
Note PPL =people
Spending categories
Table 27 shows the profile of each age category for the corresponding spending categories A
significant chi-square value was reported for the age-spending relationship The value for Table 27
was x2(20)=647 plt0001
Table 27 Age category by spending category
SPENDING CATEGORY AGE CATEGORY
Spend 1 I Spend 2 I Spend 3 I Spend 4 Spend 5 I Total
1 (Under 18) 08 10 02 02 01 24 2 (18-25) 48 59 56 42 29 233 3 (26-35) 33 25 34 37 30 158 4 (36-45) 48 42 39 42 48 21 8 5 (46-60) 48 48 55 61 76 289 6 (60+) 13 17 14 14 18 77 TOTAL 198 201 201 198 202 1000
Note Spend 1 = under R240 Spend 2 = R240-R479 Spend 3 = R480-R829 Spend 4 = R830-R1449 Spend 5 = R1450+ These Rand-values reflect expenditure per person (deflated with consumer price index for 4 years data)
26
Figure 24 is the biplot for the cross-tabulation of age category by spending category which reveals
the relationships between the row (age categories) and column (spending categories) based on the
proximities of the row and column points Age group 5 (ages 46-60) appeared to be the spenders
as the results suggest that they are closely related to spending categories 4 and 5 (R830 and
more) Slightly younger visitors (age group 26 to 35 years) appeared to be spending between R480
and R1449 per person (spending category 3 and 4) The 18-25 year age group were the lowest
spenders as revealed by the close proximity (1823 inertia of dimension 2) of this age group to
spending categories 1 and 2 (below R480) The under 18s are separated from other age groups
probably because they are likely to be non-earning dependants
04 bull
Q)~ 0 3 ai ~ Ec _ 02 Q) 0
middotwQl - 0 1 C) - NN c IX) 00 r---~------------~-------+------~----+---~~~~----~ oCmiddotiii c -01 ~
ci -02 ~~~~~--~----~--~--~--~--~~~~--~--~------~
-09 -08 -07 -0 6 -0 5 -04 -03 -02 -01 00 01 0 2 0 3 04
Dimension 1 Eigenvalue 03142 (7454 of Inertia)
Figure 24 Siplot of age category and spending category
Note Spend 1 = under R240 Spend 2 = R240-R479 Spend 3 = R480-R829 Spend 4 = R830-R1449 Spend 5 = R1450+ These Rand-values reflect expenditure per person (deflated with consumer price index for 4 years data)
Number of days attended the festival
Table 28 shows the profile of each age category for the corresponding number of days the
respondent attended the festival A significant chi-square value was reported for the relationship
age - number ofdays The value for Table 28 was x2(15)=821 plt0001
Table 28 Age category by number of days attended the festival
I
AGE CATEGORY NUMBER OF DAYS
1 DAY 2-3 DAYS I 4-5 DAYS 6 DAYS I TOTAL
1 (Under 18) 2 (18-25) 3 (26-35) 4 (36-45) 5 (46-60) 6 (60+) TOTAL
06 25 41 51 60 16
199
07 83 71 87 126 23
397
12 105 36 66 76 33
327
02 28 09 15 18 04 77
28 242 157 21 8 281 76
1000
27
Figure 25 is the biplot for the cross-tabulation of age category by number of days attended the
festival revealing the relationships between the row (age categories) and column (number of days)
based on the proximities of the row and column pOints The biplot indicates that age group 2 (ages
18-25) was more likely to attend the festival for 4 days and longer The 36-60 year olds (age groups
4 and 5) seemed to stay for shorter periods of between 2 and 3 days Age group 3 (26-35 years)
appeared to attend the festival for only 1 day Due to the low inertia of dimension 2 the results
suggest that the under 18s and over 60s also attend the festival for 4-5 days
03 15
sect ~
cti 02 ~
~ 01 ~ ~i- 0 0
j N
-01
ll -0 2
-04 -0 3 -0 2 -0 1 00 0 1 0 2 0 3 0 4
Dimension 1 Eigenvalue 04295 (85 22 of Inertia)
Figure 25 Siplot of age category and number of days attended the festival
Province
Table 29 shows the profile of each age category for the corresponding province of origin A
significant chi-square value was reported for the age-province relationship The value for Table 29
was x2(45)=823 plt0001
Table 29 Age category by province of origin
AGE CATEGORY PROVINCE
NW I GAU I MPL FS I EC WC I NC I KZN i LIM INT I TOTAL
1 (Under 18) 13 1000 01 01 00 00 00 01 01 00 27 2 (18-25) 101 95 07 15 04 12 01 00 06 02 243 3 (26-35) 58 64 09 18 02 04 01 02 02 01 159 4 (36-45) 70 95 06 19 01 04 03 09 08 01 216 5 (46-60) 75 136 15 22 02 07 03 07 09 02 278 6 (60+) 34 24 03 07 00 01 01 02 04 00 76 TOTAL 351 424 40 82 09 28 09 21 30 05 1000
Note NW = North West GAU =Gauteng MPL = Mpumalanga FS =Free State EC = Eastern Cape WC = Western Cape NC =Northern Cape KZN =KwaZulu-Natal LIM =Limpopo INT =International origin
28
Figure 26 is the biplot for the cross-tabulation of age category by province of origin which reveals
the relationships between the row (age categories) and column (provinces) based on the
proximities of the row and column points It would seem that according to the results visitors from
the Gauteng Mpumalanga and Free State provinces are more likely to be in age groups 4 and 5
(36-60 years) It appears that visitors from the Limpopo province are also likely to be between the
ages of 36 to 45 The results further suggest that the locals (North West province) are more likely to
be between the ages of 18 and 25 years and probably represent the prominent student market in
Potchefstroom
0 4~~~~--~---r------~------~--~~------~------~
Qj ro 03 2t WC ~ ~ 02 e shy~ 0 01 Wshy- N 00 middot Nltt eOO -012 N wshy t-C e shyQ)N -02 Eltt- shy -03Cl~
-04 L-~__---L__~__---__~_______L-__~--_____---_____I
-06 -04 -02 00 02 04 06 08
Dimension 1 Eigenvalue 02647 (5294 of Inertia)
Figure 26 Siplot of age category and province of origin
Note NW =North West GAU =Gauteng MPL =Mpumalanga FS =Free State EC =Eastern Cape WC =Western Cape NC =Northern Cape KZN =KwaZulu-Natal LIM =Limpopo INT =International origin
A layout of the results in a summarised format is captured in Table 210 below
Table 210 Summary of the age categories by variables
AGE CATEGORY VARIABLE
Age 1 (Under 18)
Age 2 (18middot25)
I I
Age 3 (26middot35)
Age 4 (36middot45)
I Age 5 (46-60)
I
I Age 6 (60+)
Shows I Dance theatre Classic Classic
productions Rock Word art amp poetry
Lectures amp discussions
Cabaret Visual arts amp
Cabaret Visual arts amp
exhibitions exhibitions
Mediums
Word of mouth Word of mouth
Magazines Newspapers M-web newsletter Aardklop e-mail
Magazines Newspapers M-web newsletter Aardklop e-mail
Financial res onsibility
1 person 2 people 3-6 people 2 people 2 people
Sending Spend 1 amp2 Spend3amp4 Spend 4 amp5
Days 4-5 days 4+ days 1 day 2-3 days 2-3 days 4-5 days
Province Mpumalanga Mpumalanga
NorthWest Gauteng Free State
Gauleng Free State
Umpopo
29
24 FINDINGS AND IMPLICATIONS
The results of the analysis confirm the existence of significant differences in socio-demographic
and behavioural variablescharacteristics between different age groups of visitors to Aardklop
National Arts Festival Based on the results the following findings were revealed
bull Very few festival visitors are older than 60 (75) as opposed to 925 being younger than 60
This finding is in part confirmed by Backman et al (199521) who revealed that festival visitors
are more likely to be under 50 years of age
bull The age groups 46-60 and older than 60 were more likely to hear about Aardklop in written
media such as magazines newspapers the M-Web newsletter and Aardklop e-mail Younger
visitors aged 18-35 (age categories 2 and 3) relied more on word of mouth as a means through
which they heard about Aardklop This research finding partially supports the findings of
Shanka and Taylor (200458) who indicated that young visitors (18-25 years) depend on word
of mouth whereas the age group 55 and over depend on newspapers as a source of
information They also indicated that the age group 45-54 depends on television as a medium
however this does not seem to be the case with visitors to the Aardklop festival
bull Older visitors (aged 46-60) seemed to be associated with the two highest spending categories
at the festival (respectively R830-R1449 and R1450+) This result confirms research by
Formica and Uysal (199822) Jang et al (2004) Saayman and Saayman (2006b217) Thrane
(2002284) Kruger et al (2009) as well as Jang et al (200283) who have found that older
aged (and in some cases middle-aged) festival visitors pleasure travellers and consumers
earning higher incomes are associated with higher spending and show more diligent spending
(shopping) behaviour
bull Younger visitors (aged 18-25) spend the least as indicated by spending categories 1 and 2
(respectively under R240 and R240-R479) This could be consistent with findings of Formica
and Uysal (199822) who indicated that festival visitors younger than 30 earn a lower income
which may result in lower spending However the findings are inconsistent with research by
Dardis et al (1994315) Mehmetoglu (2007213) Pouta et al (2006131) and Mok and Iverson
(2000302) who found that younger aged leisure and nature-based consumers (and in some
cases middle-aged consumers) are associated with higher spending
bull Visitors aged 18-25 years were more likely to attend rock showsconcerts This confirms
research findings by Schaninger and Danko (1993) (as cited in Holbrook and Shindler
(199627) who indicated that young consumers (bachelors) are high spenders at entertainment
events such as concerts
30
bull Visitors in age category 4 (36-45 years) were more likely to attend productionsshows such as
dance theatre and lectures and discussions while age categories 5-6 (46 years and older) were
more associated with attending showsproductions such as classical music cabaret and visual
art and exhibitions These findings are to some extent supported by research by Formica and
Uysal (199822) who found that middle-aged and older festival visitors enjoy cultural
experiences such as ballets operas and theatre plays
bull Festival visitors in age categories 3 4 and 5 (ages 26-60) stay for shorter periods of time (1-3
days) The very young and very old age groups (younger than 25 and older than 60) appear to
stay for longer periods of time The latter is partially confirmed by researchers Shoemaker
(1989) Blazey (1991) Pearce (1999) and Backman et al (1999) (as quoted by Horneman et
al (200223raquo who found that senior travellers stay away (or stay at their destinations) for
longer Research by Mak et al (19776) made similar findings pointing out that young and aged
visitors stayed much longer than the visitors in the in-between age groups
bull Locals (visitors in the region of Potchefstroom) or visitors who come from the North West
province were likely to be younger (between the ages of 18 and 25) This contradicts the
research conclusions of Formica and Uysal (199817) who found that out-of-region festival
visitors were younger
These findings suggest some important implications for and challenges to the marketersorganisers
of the Aardklop National Arts
bull The results emphasise that the majority (925) of visitors to Aardklop National Arts Festival
are younger than 60 The largest age categories namely 46-60 year olds and 18-25 year olds
respectively account for 278 and 243 of the respondents Marketing strategies should
therefore focus predominantly on these visitors since they represent a prominent portion of the
total population Implications for targeting these visitors follow below
bull The 46-60 year olds (age category 5) are the highest spenders and enjoy showsproductions
such as classical music cabaret and visual arts and exhibitions These types of
showsproductions along with drama (which is likely to be attended by most age groups (as
indicated in Figure 21) and accounts for 546 of the genres attended by the entire
population) could be used in promotions and in marketing communication efforts These
marketing communication efforts should specifically include written media such as magazines
newspapers Aardklop e-mail and the M-web newsletter Marketing efforts that utilise local
newspapers in the Gauteng and Free State provinces as a medium of communication could
prove to be effective since Gauteng and Free State visitors are the largest and third largest
markets respectively and are also the provinces associated with this age group Two to three
31
day packages including a variety of showsproductions (but primarily including the aforeshy
mentioned genres) could prove to be a popular promotional product and further increase
exposure to the arts The option of promotional packages for 2 persons or couples (comboshy
packages) should also be considered since respondents in this age group tend to be financially
responsible for two people and would possibly find such an offer appealing
bull The 18-25 year olds (age category 2) are the lowest spenders but the second largest group in
the population Therefore profitability of the festival in this regard could be based on the large
numbers of young local festival visitors attending the festival Discounted packages for
individuals including rock shows word art and poetry and drama could therefore prove to be
successful Other genres could be gradually introduced to these packages to increase their
exposure to the arts and love thereof Investing in this market segment (who already shows a
prominent interest in the arts regardless of their lower spending) should lead to the increase of
festinos to the Aardklop festival in the future as this market matures in age and financial status
Effective promotions such as attractive and affordable packages will result in satisfied
customers which should further contribute to word of mouth as marketing medium
bull The focus should not only be on the high spending 46-60 year old Gauteng market and the
large local student market but also on the remaining (and smaller) markets with potential The
variety of shows and productions already offered by the Aardklop programme and the potential
of these remaining markets make it unnecessary for Aardklop to introduce additional features to
the festival The 26-35 year olds (age category 3) reveal average to relatively high spending
(spending categories 3 and 4) The extent of spending along with the length of stay (1 day) of
this age category indicates true potential therefore festival marketers should concentrate their
marketing efforts on encouraging them to stay longer (which usually results in increased visitor
spending) If the two to three day package deals for two people or couples (as recommended
for the age category 5 market) do not encourage longer stay and do not appeal to this age
group immediately (since they seem to prefer the day-visitor option) single day packages for
two people or couples could also prove to be successful in fulfilling their needs and trends thus
sustaining visitor numbers to the festival Another remaining market with potential namely age
category 4 (36-45 year olds) would benefit from bulk packages that offer group discounts since
these respondents are financially responsible for 3 to 6 people Their packages along with the
standard drama productions should include dance theatre and lectures and discussions
25 CONCLUSIONS
The purpose of this article was to apply correspondence analysis with age as the dependent
variable in order to better understand the Aardklop market Internationally and in South Africa
32
limited market segmentation research on festivals (and more specifically arts festivals) by means of
correspondence analysis has been done This study can therefore be considered as a benchmark
in the South African research context The literature review indicated that the socio-demographic
behavioural and other variables vary between different aged visitorstourists The results in this
study confirm that each age category of the visitors to Aardklop can be associated with specific
variables Thus a market profile of different aged visitors to the festival was formulated This is
beneficial to the marketersorganisers of Aardklop since the festival productprogramme as well as
associated marketing efforts can be developed according to the needspreferences of these
markets
It is clear that correspondence analysis is a viable exploratory method for applying market
segmentation Future researchers should therefore consider using this method because it is useful
in transforming two or more categorical variables into a low-dimensional graphical making it easier
to identify the key features of the data when interpreting the information Applying correspondence
analysis with age as the dependent variable to other festivals in South Africa could enhance
comparative research It is also recommended that correspondence analyses be applied to other
tourism products within the industry or by means of other segmentation variables (for instance
province of origin or repeat visitors versus first time visitors) Finally continuous market
segmentation should be applied to Aardklop in order for festival organisersmarketers to stay aware
of trends and changes in visitor preferences so as to adapt marketing efforts accordingly
33
CHAPTER 3 Expenditure-based segmentation of visitors to the Aardklop National Arts Festival
31 INTRODUCTION
Globally the number of festivals is on the increase As a result competition and changes in the
South African festival market have far-reaching implications for most artscultural festivals such as
declines in the number of festival visitors ticket sales or both (Saayman amp Saayman 2006a40-41)
With the advent of newly launched festivals festival markets are becoming increasingly diversified
and cannot be characterised as homogeneous (Gursoy Kim amp Uysal 2004 171 Dibb amp Simkin
2004347 Hassan 2000240 Mules amp Faulkner 1996107 Saayman amp Saayman 2004636)
Mykletun Crotts and Mykletun (2001 494) agree and argue that not all groups of visitors at a
festival are alike therefore important to periodically assess which segments provide the greatest
return-on-investment Laesser and Crouch (2006397) also point out that a possible means to
achieve improved returns is through an appropriate market segmentation strategy in other words
by targeting the groups of visitors (and their needs) that generate high returns According to Cook
and Mindak (198480) and Twedt (196471) it is often the case that the heavy users account for a
large percentage of overall expenditurereturns The use of visitor expenditure in tourism marketing
to segment the market in order to determine the high spenders is a comprehensive means to apply
market segmentation (Diaz-Perez Bethencourt-Cejas amp Alvarez-Gonzales 2005961 Saayman
Van der Merwe amp Pienaar 2008 Mok amp Iverson 2000299 and Legoherel amp Wong 200616)
Identifying high spenders by means of market segmentation can therefore assist festivals such as
the Aardklop National Arts Festival (hereafter referred to as Aardklop) in targeting the right market
Aardklop is the third largest festival of its kind in South Africa with a total estimated economic
impact of R4665 million and more than 55000 visitors in 2008 (Kruger Saayman amp Saayman
200827) This predominantly Afrikaans cultural event takes place in the city of Potchefstroom
(situated in the North West Province) for 5 successive days during September and hosts
approximately 85 productions by 390 artists across a variety of genres such as theatre dance
34
cabaret jazz rock literature childrens and street theatre as well as visual arts (ANON 2008
Raath 2009 Van Heerden 200311)
Since its debut in 1998 Aardklop has become an established event on the festival calendar of
South Africa The current status of Aardklop reveals varying growth rates regarding visitor numbers
number of tickets sold direct spending of visitors average days spent at the festival as well as
overall economic impact (Kruger et al 200826-29 Saayman amp Saayman 2006a36-41) Table 31
captures the figures reflecting varying growth over the past four years and suggests that Aardklop
is showing signs of potential decline especially in ticket sales although it is not in a definite decline
phase of its product life-cycle yet
Table 31 Overview of economic impact and profile ofAardklop 2005 - 2008
Year 2005 2006 2007 -shyAbsolute number of visitors 36766 61476 51870 55518
Total tickets sold 91156 81022 84559 79530
Number of travel groups 15193 19393 16678 15294
Travel group size 2 3 3 4
Average tickets per group 6 4 5 5
Average days attended festival 3 3 3 3
Total visitor days 113240 196108 168 576 172 106
Average spending per group R217438 R177955 R2 61255 R279997
Direct spending of visitors at festival R21574794 R24237640 R27999000 R26 735 791
Total economic impact R39171741 R42908324 R53097645 R46650703
Will visit the festival again 95 94 97 93
Source Kruger et al (200826-29) Saayman amp Saayman (2006a36-41)
bull Aardklop had an exceptional year in 2007 and was extended with a few days to celebrate its 10 year anniversary this could possibly account for its higher economic value in 2007
Ticket sales may be increased by identifying high spenders by means of market segmentation
since they account for a large percentage of overall sales The aim of this article is therefore to
apply expenditure-based segmentation to identify which socio-demographic and behavioural
variables distinguish the high spenders at the festival This will assist Aardklops
marketersorganisers to understand and cater for the needs and preferences of these high
spenders thereby ensuring the sustainability and further growth of Aardklop To achieve this aim
the article is structured in the following manner first a literature review is offered followed by a
description of the survey a discussion of the results and finally a discussion of the implications
and the conclusions
35
32 LITERATURE REVIEW
According to Saayman and Saayman (2006b219 2005582) the sustainability of a festival must be
attained at three levels namely economic environmental and socio-cultural Achieving
sustainability therefore strongly depends on enhancing economic benefits (yVTO 2002 1) The
economic impact of a festival is measured by the size of the festival in terms of (1) number of
visitors (2) visitor spending (3) duration of stay and (4) the multiplier effect (Saayman 2000114)
According to Murphy and Carmichael (1991 32) the increased expenditure and economic
contribution to the destination area due to the anticipation of tourists is a common feature of any
eventlfestival With an estimated economic impact of R46 million (Kruger et a 200828) due to
visitor expenditure Aardklops impact and benefits on the host destination is evident proving why
festivals are organised in the first place (Thrane 2002281) Since visitor expenditure also includes
spending on ticketed showsproductions the economic impact is also measured by the size of the
festival in terms of the number of ticketed showsproductions sold The advantage of ticket sales as
opposed to the number of visitors attending the festival (but not necessarily spending at the
festival) is that the overcrowding associated with the festival may be alleviated or avoided all
together Other advantages include a more favourable impact on the environment and the host
community Therefore in order to sustain the nature of the festival it is important to identify and
attract visitors who attend ticketed showsproductions (Kruger 20093)
Research by Thrane (2002281) Saayman and Saayman (2006b220) and Kruger (200934)
indicated that visitors attending festival showsproductions stay longer and spend more than those
not interested in showsproductions This results in a greater overall personal expenditure during
the festival Therefore one of the best ways to increase economic benefits without necessarily
increasing the number of tourists is to encourage tourists to stay longer and provide opportunities
for them to increase spending (Gokovali Bahar amp Kozak 2007737 WTO 20022) This in turn
contributes to a greater economic impact of the festival (Gokovali et a 2007737 Kastenholz
2005556) and ensures its growth and sustainability
Since the total economic impact of a festival is a function of both the direct and indirect
expenditures made by visitors (Lee Lee Lee amp Babin 200856) it is important to understand visitor
spending behaviour at a festival and the underlying variables affecting such behaviour (Mok amp
Iverson 2000300) Kruger (20093) has also found that ticket sales and the types of
showsproductions attended can be used as an indicator of visitor interest in a festival and of how
successfully the programme addresses and fulfils visitors needs When needs and expectations
are met or exceeded consumer satisfaction will increase this is pivotal to establishing a long-term
consumer relationship ensuring repeat business higher usage and increasing the probability of the
36
consumer recommending the service to someone else (Lee et al 200858) Mok and Iverson
(2000299) stress that understanding tourists expenditure patterns and activities allows marketers
to strategically plan facilities and amenities Market segmentation is the means through which these
expenditure patterns and activities of tourists can be understood a suitable marketing strategy can
be developed and the continuous growth and sustainability of the festival can be ensured
According to Spotts and Mahoney (1991 42) segmenting travel markets on the basis of travel
expenditure is furthermore a useful alternative to the more common approach of segmenting on the
basis of travel This is because (festival) marketers seek visitors who will spend money and not just
time at tourism (festival) products (Mok amp Iverson 2000299) In terms of managerial implications
expenditure is considered to be an important factor that helps to understand the consumption
behaviour of tourists since this enables tourism (festival) marketers to develop appropriate
products (festival programmes) and to evaluate the economic benefits of each segment (Legoherel
ampWong 200616)
The underlying rationale of identifying market segments on grounds of expenditure is based on the
necessity to increase the effectiveness and efficiency of marketing programmes and their
resources both in terms of addressing (1) the right group of people and (2) their relevant needs
(Laesser amp Crouch 2006397) Touristvisitor spending is furthermore one of the most critical
variables of analysis for tourist destinations (festivals) since it directly determines the festivals
profitability (Frechtling 200626) It is therefore important to determine which visitors spend most at
a festival and which variables are most influential in determining their expenditure levels
(Kastenholz 2005557) According to Gokovali et al (2007737) once the factors that affect visitor
expenditure are identified policy development will be possible to strengthen the spending to
maximise economic benefits of a festival Festival organisers can thus effectively apply the
variables when doing market segmentation to focus their marketing efforts on those visitors who
spend the most at the festival (Kruger et al 200816)
Kruger (2009 17-18) cites studies which show that various benefits can be derived from applying
expenditure-based segmentation (Wilton amp Nickerson 200621 Thrane 2002286 Woodside
Cook amp Mindak 198710 Davies amp Mangan 1992698 Mok amp Iverson 2000304) namely
bull niche marketing
bull determining the attractiveness and viability of visitor segments
bull a clear distinction between heavy spenders and heavy users
bull maximised economic benefits
37
bull better aimedstrategic marketing efforts
bull visitor loyalty coupled with repeat visits as well as
bull better understanding and application of behavioural characteristics that influence visitor
spending
Marketers of different types of tourism products have made various attempts to segment the
tourism market into high medium and low expenditure groups and to identify the characteristics of
each group (see Mok amp Iverson 2000 Saayman amp Saayman 2006b Saayman et al 2008 Spotts
amp Mahoney 1991 Pizam amp Reichel 1979 Mehmetoglu 2007 Pouta Neuvonen amp Siev~nen
2006 Raaij amp Francken 1984 Woodside et al 1987 Kruger Saayman amp Saayman 2009 and
Thrane 2002) Results from previous research findings reveal definite characteristics that
distinguish high spenders from other spending segments in the market Expenditure can therefore
be seen as a significant segmentation variable
Table 32 Characteristics distinguishing high spenders from medium and low spenders
CHARACTERISTICS
Income
Socio-demographics
Geographic
Travel behaviour
HIGH SPENDERS
High spenders tend to earn higher income I salaries
Older aged consumers are associated with higher spending Younger aged consumers are associated with higher spending High spenders are prone to have a higher level of education Children are more likely to be present with high spenders High spenders can be associated with certain nationalities and geographic originsregions (depending on the study at hand) High spenders are associated with longer stays
High spenders are associated with shorter stays Tourists travelling for the purpose of honeymoons tend to be high spenders Travelling with spouse gir1-1boyfriend and parents tend to result in greater spending High spenders tend to travel in smaller travel parties High spenders tend to travel in larger travel parties High spenders tend to travel individually rather than in groups
AUTHORS
Dardis Soberon-Ferrer amp Patro 1994 Legoherel 199819 Lee 2001659 Jang Bai Hong amp OLeary 2004331 Saayman amp Saayman 2006b220 Thrane 2002285 Woodside at a 198711 Saayman at a 2008 Jang et a 2004319 Kruger at a 2009 Jang Ismail amp Ham 200283 Dardis at a 1994319 Mok amp Iverson 2000304 Dardis at a 1994319 Pizam amp Reichel 197942 Woodside at a 198711 Spotts amp Mahoney 1991 24 Cai Hong amp Morrison 199515 Legoherel 199819 Diaz-Perez et aI 2005961 Laesser amp Crouch 2006401 Jang et a 200283 Jang at a 2004331 Thrane 2002285 Spotts amp Mahoney 199124 Mehmetoglu 2007213 Downward amp Lumsdon 2004415 Saayman amp Saayman 2006b220 Kruger at a 2009 Mok amp Iverson 2000304 Jang et a 200283 Legoherel 199830
Mok amp Iverson 2000304
Jang at aI 200283 Cai at a 199515
Mok amp Iverson 2000304 Saayman amp Saayman 2006b220 Spotts amp Mahoney 199124 Lee 2001659 Jang at a 2004331 Jang at a 200283 Mok amp Iverson 2000304
38
High spenders are more likely to be first-time Jang et a 2004331 Opperman 1997178 visitors to a destination High spenders tend to travel longer distances Saayman et a 2008 Pouta Neuvonen amp to the destination Sievanen 2006132 Cannon amp Ford
2002263 Lee 2001 659 Leones Colby amp Crandall 199856 Long amp Perdue 199012
Visitors travelling for purposes of working Laesser amp Crouch 2006401 holidays as well as delegates to conferences are asSociated with higher spending Conference delegates travelling with spouses Laesser amp Crouch 2006401 are inclined to be hgher spenders
Recreation and leisure High spenders tend to be highly attracted to Mok amp Iverson 2000304 activities shopping
Visitors who have attended other festivals are Saayman and Saayman 2006b217 Kruger also more inclined to fall into the highshy et a 200828 spender ca~ory Visitors with festivals as main reason for Thrane 2002284 Kruger at a 200828 travel tend to spend more as opposed to Kruger 200934 other reasons High spenders tend to be more involved with Spotts amp Mahoney 199124 Legoherel recreation and are associated with higher 199830 usage of travel information High spenders tend to attend drama music Kruger 200950 theatre and cabaret and contemporary music showsproductions
Seasonality Peak seasons are associated with higher Jang at a 200283 spending
In general it is evident from Table 32 that high spenders tend to earn a higher income are higher
qualified are accompanying children and stay for longer at their destinations They can also be
associated with certain nationalities or geographical areas travel longer distances and are
frequent users of travel information High spenders at a festival often visit other festivals too and
consider the festival as the main reason for their travel to a destination Expenditure-based
segmentation can therefore assist Aardklops marketersorganisers to differentiate between the
high spenders and other spending segments in the market as well as to determine the viability of
targeting this market This information can be used to (1) determine the profile of the high spenders
at the festival and (2) increase visitor spending by attracting these visitors by means of a
customised festival programme
Based on the above applying expenditure-based segmentation to visitors attending Aardklop will
prove to be extremely helpful especially from a marketing point of view This research will greatly
assist Aardklops marketers and organisers to determine what it takes to encourage visitors to
attend the ticketed showsproductions how the festivals appeal for high spenders could be
maximised and how high spenders could be encouraged to stay longer
33 METHOD OF RESEARCH
The Institute for Tourism and Leisure Studies at the North-West University (Potchefstroom
Campus) has conducted surveys at the Aardklop National Arts Festival by means of structured
39
questionnaires since 2001 From 2005 to 2008 a total of 1671 questionnaires were completed by
visitors to the festival and the data from these surveys was used for the purpose of this study since
the general characteristics of the population remained similar over the four years The method of
research will be discussed by means of (i) the questionnaire (ii) the samples and (iii) the method of
market segmentation
331 The questionnaire
The survey questionnaire used for the visitors to Aardklop remained similar throughout the four
year data collection period This questionnaire was also similar to previous questionnaires used at
other festivals in South Africa such as the Klein Karoo (Slabbert Saayman Saayman amp Viviers
2008) and Grahamstown National Arts Festivals (Viviers Siabbert Saayman amp Saayman 2008)
The questionnaire was divided into three sections and mainly consisted of closed questions (see
Appendix A) Section one included questions based on the socio-demographics of the visitor (such
as gender age language occupation province of origin) followed by questions in section 2 based
on behavioural elements (such as travel group size days spent at the festival productionsgenres
attended number of persons financially responsible for and spending) Questions relating to
spending were category-specific (such as accommodation shows food and beverages shopping
recreation and transport) There were no questions about household income because this
information was considered to be too sensitive To compensate for this visitor occupation was
classified according to low medium and high income levels which can be viewed as a weak proxy
for income This is to account for the influence of discretionary disposable income on spending In
section three more general behaviour questions were also asked such as the means through
which information regarding the festival was communicated (for example magazines newspapers
newsletter etcetera)
332 The samples
For four consecutive years the surveys were conducted annually during the festival in
Potchefstroom by means of convenience sampling Aardklop has a 4-year average of just fewer
than 51 500 visitors (Kruger et al 200827 Saayman amp Saayman 2006a37) Cooper and Emory
(1995207) as well as Krejcie and Morgan (1970608) argue that in any defined population for a
population of 100 000 (N) the recommended sample size (S) is 384 per survey Table 33 lists the
sample size for each year With an average of 418 questionnaires per year over the consecutive 4shy
year period the sample size is applicable
The survey was conducted among adult visitors at the festival by means of a self-administered
questionnaire These respondents were briefed about the purpose of the research and were willing
40
participants In order to limit response bias towards a certain group of festival visitors
questionnaires were distributed on-site but at different locations such as in the areasvenues of
shows and productions in the areas of closed streets where visitors gather between shows and on
the main festival grounds Field workers of the North-West University were trained to administer the
process and to understand the purpose of the study as well as the questionnaire in order to assist
respondents where necessary (but without interfering with the completion of the questionnaire)
Questionnaires were distributed on each day of the 5-day festival period This ensured that the
feedback received by the sample population was an accurate portrayal of visitor spending
Questionnaires of respondents who did not complete the spending information or who did not give
account of the number of people for whom they were financially responsible were disregarded
This reduced the number of cases in the dataset from N=1671 to N=1544 (see Table 33 below)
Table 33 Questionnaires completed during Aardklop National Arts Festivals 2005 - 2008
Date 2005 2006 2007 2008 28 Sep - 1 Oct 27 Se - 3 Oct 24 Se - 29 Se 30 Sep -4 Oct
Number of visitor 407 413 357 494 16t questionnaires
Adjusted sample 383 347 342 472 1544
Source Saayman amp Saayman 2005a9 Saayman amp Saayman 2006a8-9 Saayman amp Saayman 20072-3 Kruger Saayman amp Saayman 20082
Most questions have an assigned number depending on the chosen answer which is used in the
analysis The socio-demographic and behavioural variables used along with the assigned numbers
(coding) are described in Table 34 below
Table 34 Questions used and their descriptions
QUESTION DESCRIPTION CODING VARIABLE
Home language Afrikaans = 1 Other = 0 LANGUAGE Male = 1 Female=O GENDER
8gsect ~
Yes = 1 No = 0 AGE 1 Yes = 1 No = 0 AGE 2
bull Under 18 bull 18 - 25
Yes = 1 No = 0 AGE 3bull 26 - 35 Yes = 1 No = 0 AGE 4bull 36-45 Yes = 1 No = 0 AGE 5bull 46- 60 Yes = 1 No =0 AGE 6
bull 60+
Occupation OCCUPATION 1bull High income ~ Professional Management Yes = 1 No = 0
Self-employed bull Medium income = Technical Sales Farmer Yes = 1 No = 0 OCCUPATION 2
Mining Administrative Civil service bull Low income = Housewife Pensioner Student Yes = 1 No =0 OCCUPATION 3
Unemployed
NORTHWESTProyjnce Yes = 1 No=O bull NorthWest Yes = 1 No =0 GAUTENG
bull Gauteng Yes = 1 t-NV and Gauteng = 0 OTHER PROVINCES
bull Other
41
Accommodation bull Non-paid accommodation = Local resident
Family or friends Day visitor bull Paid accommodation = Registered guesthouse
or B+B I Festival guesthouse Hotel Rent full houseOther
bull camping
GroUP sjze Nymber of days Number of visits to AardlslOP Number of tickets
Festival main reason for visit 10 Potchefstroom
VIsit Aardklop again
Attendance of other festivals over the past three ~
bull KKNK bull Grahamslown bull Volksblad bull Innibas bull Other
Shows I productions
bull Drama bull Dance theatre bull Word art amp poetry bull Childrens theatre bull Lectures amp discussions bull Visual art ampexhibitions bull Classical music bull Choirs bull Cabaret bull R)Ck
FreeSbows
Medlyms bull Television bull Radio bull Aardklop website bull Aardklop e-mail bull M-Web newsletter bull Magazines bull Newspapers bull Word of mouth bull Other
333 The Method
Yes = 1 No = 0
Yes = 1 No = 0
Yes = 1 No = 0
Open question Open question Open question Open question
Yes=1No=0
Yes = 1 No = 0
Yes = 1 No = 0 Yes = 1 No = 0 Yes = 1 No = 0 Yes = 1 No = 0 Yes = 1 No =0
Yes = 1 No = 0 Yes = 1 No = 0 Yes = 1 No =0 Yes = 1 No = 0 Yes = 1 No = 0 Yes = 1 No = 0 Yes = 1 No = 0 Yes = 1 No = 0 Yes = 1 No=O Yes = 1 No=O
Yes = 1 No = 0
Yes = 1 No = 0 Yes = 1 No = 0 Yes = 1 No = 0 Yes=1 No=0 Yes = 1 No=O Yes=1No=0 Yes =1 No = 0 Yes = 1 No = 0 Yes=1No=0
ACCOMMODATION 1
ACCOMMODATION 2
CAMPING
GROUP-SIZE DAYS TIMES
TICKETS
REASON
VISIT AGAIN
KKNK GRAHAMSTOWN
VOLKSBLAD INNIBOS OTHER
DRAMA DANCE THEATRE
POETRY CHILD THEATRE
LECTURES VISUAL ARTS
CLASSICAL MUSIC CHOIRS
CABARET ROCK
FREE SHOWS
TV RADIO
WEBSITE E-MAIL
NEWSLETTER MAGAZINES
NEWSPAPERS WORD OF MOUTH
OTHER
In the analysis spending per person is the dependent variable The data was analysed using SPSS
(Statistical Package for the Social Sciences) Total expenditure was calculated by adding each
respondents spending category entries and subtracting the transport cost to the festival since
including this expense leads to bias for visitors further away from Potchefstroom The total
expenditure was then divided by the number of people for whom the respondent was financially
responsible during the trip This resulted in total spending per person In order to render real
expenditure per person that is comparable across the four years of pooled data from the reduced
dataset (N=1544) (Table 33) the total expenditure per person was deflated with the consumer
price index The real expenditure per person variable was used to create spending segments
42
Cluster analysis measures the distance in rands (ZAR) between cases on a combination of
dimensions and uses this to identify groups of cases within which there is considerable
homogeneity and between which there are clear boundaries (Gough Eardley Bradshaw Ditch amp
Whiteford 199721) K-means clustering (a non-hierarchical segmentation technique) was used to
organise visitors into groups with similar expenditure patterns K-means clustering requires the
researcher to specify a priori the number of clusters (k) and thus provides a preliminary testing of
alternative typologies (Gough 19964) Taking into account practical considerations for segmenting
the arts festival market the study findings appeared to be more manageable and easier to
communicate for three (low medium high) to five (low low-medium medium high-medium high)
expenditure groups The clustering begins by using the values of the first n cases as temporary
estimates of the k cluster means Initial cluster centres form by assigning each case in turn to the
cluster with the closest centre and then updating the centre until final cluster centres are identified
Within each step cases are grouped into the cluster with the closest centre and the centres are
recomputed until no further change occurs in the centres (Pitruzello 1999) It offers a good range
of information to help interpret the results and is therefore the technique selected here As a result
four clusters were identified
One-way analysis of variance (ANOVA) was performed to test for significant associations and
differences between expenditure segments and categories based on socio-demographic and
behavioural variables as measured by the questionnaire Furthermore AN OVA was accompanied
by Welch and Brown-Forsythe robust tests to further explore the differences among segments
334 Results
The empirical results are presented in three sections namely (1) the general profile of the
respondent population to Aardklop over the consecutive four year period (2005-2008) (2) the
expenditure clusters and (3) the ANOVA results
3341 General profile of festival respondents
The general profile of the respondents to Aardklop (Table 35) reveals that the majority (55) were
females 46-60 years of age (28) spoke Afrikaans (94) came from the Gauteng (43) and
North West (35) provinces were in the high income occupations (44) resided with family and
friends (23) or were local (22) attended drama productions (55) or rock shows (28) and
identified word of mouth (53) and television (49) as the mediums through which they heard
about the festival Travel group size is 3 persons respondents are financially responsible for 2
persons the length of stay is 2 days and the spending per person is R96844 Respondents
attended Aardklop 4 times before the festival was their main reason for visiting Potchefstroom and
43
95 would attend the festival again In brief it is apparent that the festival visitors are
predominantly students and professional people are local or from Gauteng regularly attend
Aardklop and mostly enjoy drama productions
Table 3S Festival respondent profile
CATEGORY VARIABLE UmiddotIJ~W1p_ VARIABLE
~ Iom~ 11I[]9i9~ Male 743 446 Afrikaans 1568 941 Female 922 554 Other 98 58
ampm Province Under 18 46 28 NorthWest 581 351 18-25 403 243 Gauteng 703 425 28-35 263 159 Other 372 224 36-45 361 218 Occupation46-60 461 278 High income 719 435 60+ 125 75 Medium Income 292 176
Low income 504 305
A~rnmQltiQl Attnl~ of Q~r Non-paid accommodation 1034 639 msecttivalsect over 1M risl Paid accommodation 475 294 three vears Camping 109 67 KKNK 496 297
Grahamstown 112 67 Volksblad 108 65 (nnlbos 251 150 Other 89 53
secth~ I P[QIltIlQl Mediums Drama 912 546 Television 825 494 Dance theatre 273 163 Radio 690 41 3 Word art amp poetry 157 94 Aardklop website 284 170 Childrens theatre 124 74 Aardklop e-mail 97 58 Lectures amp discussions 88 53 M-Web newsletter 67 40 Visual art amp exhlbiUons 301 180 Magazines 459 275 Classical music 291 174 Newspapers 624 373 Choirs 168 101 Word of mouth 887 531 Cabaret 521 31 Other 92 55 Rock 460 2752
VARIABLE M Group size 34 Persons Number of people financially responsible for 24 Persons Number of days 23 Days Number of visits to Aardklop 40 TImes Number of tickets 81 tickets Spending per person R96844
VARIABLE
Festival is main reason for visit to Potchefatroom 702 VISit Aardklop again 946 0(
3342 Expenditure clusters
In this analysis respondents were divided into four meaningful expenditure segments The final
cluster centres and number of cases in each cluster are indicated in Table 36 below
Table 36 Cluster centres and number of cases In each cluster
CLUSTER CENTRE
40184 134154 280860 84 536797 23
100
44
Cluster 1 is the largest group with 625 of the sample has a mean spending of R40184 per
capita and is labelled Ylow spenders Cluster 2 which comprises 269 of the Aardklop visitor
sample has a mean spending of R1341 54 per capita and is labelled medium spenders Cluster
3 labelled -medium spenders accounts for 84 of the sample and has a mean spending of
R280860 per capita The spender cluster contains 23 of the sample is the smallest of the
four clusters identified and has a mean spending of R537797 per capita
3343 ANOVA results
Table 37 summarises the results for the ANOVA analysis for the socio-demographic and
behavioural characteristics as well as mediums through which respondents heard about the
festival
Table 37 ANOVA results for respondent characteristics
Cluster 1 Cluster 2 Cluster 3 Cluster 4 F t middot High middotra 10Low Medium Medium- high
(n=965) (n=415) (n=129) n=35)
44 46 50 44 597 617 003 001 0 0 3358 018shy027 019 012 011 7551 000- 1
016 016 014 017 172 915 021 023 022 017 469 704 025 031 041 046 7134 000-1
007 008 009 009 220 883 094 094 095 094 026 994 039 049 057 071 1792 000-1
018 019 013 014 866 00458 033 025 018 006 9808 000-1
044 020 014 0 44623 000-1
038 051 046 069 1508 000-1
018 029 0040 031 16021 000-1
398 378 373 4 14 535 658 259 211 184 143 21744 000-1
281 354 404 4043 44298 000-1
076 041 025 020 105099 000-1
006 022 030 0040 48028 000-1
005 011 009 009 4623 003 058 060 055 037 2517 057 048 065 076 083 240471 000-1
015 018 020 029 2445 062 007 012 016 023 7721 000-1
007 007 009 009 263 852 004 007 009 020 8935 000-1
016 018 030 0040 9510 000-1
015 022 026 026 6067 000-1
008 013 017 011 5225 001shy025 038 055 057 24935 000-1
027 028 028 031 169 917 557 1010 1224 1310 23773 000-1
026 032 045 063 13598 000-1
006 006 011 009 10483 0217 006 007 008 009 235 0872 012 017 026 023 7185 000-1
005 005 005 009 258 858 0042 048 064 077 12361 000-1
45
395 394 443 457 1866 133 094 094 092 094 285 836 065 079 085 097 19196 OOO-t
049 050 053 043 547 650 043 041 040 031 721 540 016 020 013 017 1532 204 005 008 005 006 2093 099middot 004 005 005 0 774 508 027 028 026 029 062 980 037 039 036 040 252 860 056 054 053 049 305 822 005 007 004 006 697 554
bullbull indicates Significance at a 5 level indicates significance at a 10 level and t indicates Significance according to both the Welch and Brown-Forsythe robust tests of equality of means
According to Table 37 above significant differences exist between the mean values of the low
medium high-medium and high spender groups regarding the visitors age category occupation
(excluding medium income occupations ie Occupation 2) province of origin number of persons
for whom they are financially responsible for whom they are paying the number of days they
attend the festival the preference for either camping paid accommodation or non-paid
accommodation the importance of free shows the types of showsproductions attended (excluding
childrens theatre and rock shows) the number of tickets paid for attendance of other festivals over
the past three years (including KKNK and Innibos only) and Aardklop being the main reason for
visiting Potchefstroom
There were no significant differences between the mean values of the four clusters regarding the
gender of respondents their language their group size number of times they have visited
Aardklop whether they will visit the festival again as well as the medium through which they heard
about Aardklop (with the exception of Aardklop e-mail which shows significance at a 10 level)
The socio demographic and behavioural characteristics of the four expenditure clusters are
compared and reported in the following paragraphs Each cluster namely low spenders medium
spenders medium-high spenders and high spenders will be discussed individually
Low spending segment (Cluster 1 n =965 625 of the visitors)
Visitors in this segment vary in age (27 were 18-2525 were 46-60 and 21 were 36-45 years
old) and are mostly from the North West (44) and Gauteng (38) provinces Their occupations
are mostly in the high income (39) and low income (33) occupation categories and they are
financially responsible for 259 people at the festival (the highest across all four segments of which
the average is 199 people) The participatory nature of these low spenders as festival visitors as
46
opposed to the other expenditure segments appear to be the least (557 tickets purchased
compared to the 807 average) and only 65 indicated that the festival was the main reason for
their visit to Potchefstroom (compared to an 82 average across all four segments) They attend
the festival for the shortest duration (281 days compared to the 371 average) and prefer non-paid
accommodation (76) as opposed to paid accommodation (6) and camping (5) The shows
and productions they attend include a large variety of which drama rock and cabaret are the most
preferred In fact these three genres are among the most preferred across all spending segments
but to a greater or lesser extent in each instance (of which rock as pointed out above does not
indicate a significant difference across the four segments) The popularity of drama
showsproductions gradually increase from the low spenders (48) to the high spenders (83)
Drama attended by the medium and medium high spenders was indicated at 65 and 76
respectively Cabaret showsproductions revealed the same steady increase in popularity from the
low spenders (25) to the high spenders (57) Furthermore more than half the respondents
(58) in this segment considered free shows at Aardklop as important and also attended the
KKNK (27) Innibos (12) as well as other festivals (42) over the past three years
Medium spending segment (Cluster 2 n = 415269 of the visitors)
A typical visitor in this segment is middle-aged (31 are between 46 and 60 and 23 are between
36 and 45 years of age) and reside in the Gauteng province (51 ) Their occupations are
predominantly high income occupations (49) and they are financially responsible for 211 people
at the festival (slightly higher than the average of 199 people across the four segments) The
participatory nature of these medium spenders as determined by the number of tickets purchased
is higher than the average (1010 tickets purchased compared to the 807 average) and 79
indicated that the festival was the main reason for their visit to Potchefstroom (compared to an 82
average across all four segments) They attend the festival for 281 days compared to the 371 day
average and prefer non-paid accommodation (41) as opposed to paid accommodation (22)
and camping (11 ) They also attend a large variety of shows and productions of which drama
(65) rock (28) and cabaret (38) are the most preferred shortly followed by classical music
(22) Visitors in this segment feel the strongest about the importance of free shows at Aardklop
(60) and over the past three years attended the KKNK (32) Innibos (17) as well as other
festivals (48)
High-medium spending segment (Cluster 3 n =129 84 of the visitors)
Like medium spenders in cluster 2 visitors in this segment are middle-aged (41 are between 46
and 60 and 22 are between 36 and 45 years of age) and reside in Gauteng (46) and other
47
provinces (40) Their occupations are also mostly high income occupations (57) and they are
financially responsible for 184 people at the festival (the second lowest across all four segments of
which the average is 199 people) Visitors in this group purchased relatively more tickets than the
low and medium segments (122 tickets compared to an 807 average across all four segments)
and also consider free shows at Aardklop to be important (55) Eighty-five percent (85)
indicated that the festival was the main reason for their visit to Potchefstroom (compared to an 82
average across all four segments) They attend the festival for longer than the average duration
across the four segments (404 days compared to the 371 average) In contrast with the
preference for non-paid accommodation among the low and medium spenders this segment
prefers paid accommodation (30) Shows and productions attended by this segment once again
reveal a large variety of which drama (76) and cabaret (55) visual arts (30) and rock (28)
are the most preferred closely followed by classical music (26) Over the past three years these
medium-high spenders also attended the KKNK (45) Innibos (26) and other festivals (64)
High spending segment (Cluster 4 n = 3523 of the visitors)
On average this type of visitor was the most distinct from other clusters and has the smallest
membership (23 see Table 36) These visitors are mostly aged between 46 and 60 years and
mostly reside in the Gauteng province (69) (as is the case with the medium and high-medium
visitors coming predominantly from this province) Seventy-one percent (71 ) of the visitors in this
high spending segment are in high income occupations and are financially responsible for 143
people at the festival (which is the lowest across all four segments of which the average is 199
people) Visitors in this group purchased the highest number of tickets (1310 tickets compared to
the 807 average) and considered the free shows at Aardklop to be the least important (37)
Almost all the visitors in this segment (97) indicated that the festival was the main reason for their
visit to Potchefstroom (which was the highest across all four segments of which 82 was the
average) They preferred paid accommodation (40) and attend the festival for longer than any
other expenditure segment (443 days compared to the 371 average) Diversity appeared to be
very important among this type of visitor when selecting types of showsproductions For instance
their preference for free shows (37) was much lower than the other groups While they would
attend drama (83) and cabaret (57) type shows they would also attend the visual arts (40)
rock shows (31 ) dance theatre (29) classical music (26) and poetry (23) type shows but
would also spend relatively more time attending lectures (20) than the other groups Over the
past three years these high spenders attended the KKNK (63) Innibos (23) as well as other
festivals (77) more times than any other segments Table 311 below summarises the results
48
Table 38 Low medium high-medlum and high segments
VARIABLES HIGH
18-25yrs (27) 46-6Oyrs (31 ) 46middot6Oyrs (46) 46-6Oyrs (25) 36-45yrs (23)
Occupation High income (39) High income (49) High income (57) High income (71) Province North West (44) Gauteng (51) Gauteng (46) Gauteng (69)
Gauteng (38) Other (2900) Other (40) Other (31) Other (18) North West (20) North West (14)
Accommodation Non-paid (76) Non-paid (41) Paid (30) Paid (40) Number of people 259 211 184 143 financial responsible for
557 1010 1224 1310 Da s (length of stay) 281 354 404 443 FestivaTiSthe main reason Yes (65) Yes (79) Yes (85) Yes (97) for visiting Potchofstroom Other festivals KKNK (26) KKNK(32) KKNK(45) KKNK(63) 1m ortance of free shows Yes (58) Yes (60) Yes (55) No (63)
Drama (48) Drama (65) Drama (76) Drama (83) Cabaret (25) Cabaret (38) Cabaret (55) Cabaret (57)
Visual arts (40)
34 FINDINGS AND IMPLICATIONS
The results of the analysis confirm the existence of significant differences in socio-demographic
and behavioural variablescharacteristics between different expenditure groups of visitors to
Aardklop Based on the results the following findings were made
bull Surprisingly higher income (associated with higher income occupations) does not necessarily
influence higher spending at Aardklop since high income occupations were the most prominent
category across all 4 spending segments However in the high spending segment there are far
more higher-income individuals than in the lower spending segments This contradicts research
by Dardis et a (1994319) Saayman et a (2008) Legoherel (199830) Lee (2001659) Jang
et a (2004331) Saayman and Saayman (2006b220) Thrane (2002285) and Woodside et al
(198711)
bull It is clear that the 46-60 year age category is the most prominent in all spending segments
except for the low spenders where it is the second most prominent age category Since this age
category is the highest (46) in the high spending segment it can be concluded that older
visitors are prone to spend more than younger visitors This supports findings by Jang et al
(2004331) Kruger et a (2009) and Jang et al (200283) However it contradicts findings by
Dardis et al (1994319) and Mok and Iverson (2000304)
bull The length of stay of visitors to Aardklop gradually increases from lower to higher spenders It
can therefore be concluded that higher spenders stay for a longer period of time than lower
spenders Research findings by Jang et al (2004331) Thrane (2002285) Spotts and Mahoney
(199124) Mehmetoglu (2007213) Downward and Lumsdon (2004415) Saayman and
49
Saayman (2006b220) Kruger et al (2009) Mok and Iverson (2000304) Jang et al (200283)
support this However findings by Legoherel (199830) are contradictory
bull Aardklops higher spenders tend to travel longer distances to Potchefstroom The number of
festival visitors from the local North West province is the highest (44) in the low spending
segment and dramatically decreases across to the high spending segments (where 0 high
spending visitors are from the North West province) On the other hand visitors from Gauteng
and other provinces (logically travelling longer distances to the festival than visitors in the North
West) together account for 56 of the lower spending segment as apposed to a combined
100 in the high spending segment Similar findings were made by Saayman et al (2008)
Pouta et al (2006132) Cannon and Ford (2002263) Lee (2001 659) Leones et al (199856)
Long and Perdue (199012)
bull Based on the previous finding it may also be concluded that Gauteng visitors in general seem to
be higher spenders This was also concluded by Kruger (20094950) and is not surprising since
Gauteng has the highest per capita income in the country This is also confirmed by research
compiled by Legoherel (1998 19) Diaz-Perez et al (2005961) Laesser and Crouch (2006401)
and Jang et al (200283) who found that high spenders can be associated with specific
geographic originsregions depending on the study at hand
bull The more other festivals visitors to Aardklop attended as well the more money they are likely to
spend In other words visitors who have attended other festivals too are inclined to be high
spenders This is evident in the percentage of visitors also attending KKNK (the festival mostly
attended by all spending segments besides Aardklop) which increases from the low spending
segment (26) right through to the high spending segment (63) These findings are confirmed
by Saayman and Saayman (2006b217) and Kruger et al (200828)
bull Group size and the number of previous visits to Aardklop were not statistically significant even
though research findings of Mok and Iverson (2000304) and Saayman and Saayman
(2006b220) indicated that smaller groups tend to be high spenders However Spotts and
Mahoney (1991 24) Lee (2001 659) Jang et al (2004331) and Jang et al (200283) indicated
that large groups appear to be high spenders Jang et al (2004331) and Opperman (1997178)
also found first-time visitors to be higher spenders than repeat visitors
bull Visitors for whom the Aardklop festival is the main reason for travelling to Potchefstroom are
higher spenders This has proved to be the case for 65 of the low spenders but for an immense
97 in the high spending segment This result is supported by Thrane (2002284) Kruger et al
(200828) and Kruger (200934)
bull Although visitors to Aardklop indicated drama and cabaret to be the two most preferred
showsproductions across all four spending segments increased interest in these activities is
50
evident in the high spending segment This is indicated by 83 for drama and 57 for cabaret in
the high spending segment as opposed to 48 for drama and 25 for cabaret in the lower
spending segment This is consistent with the conclusions of Kruger (200950) that drama and
cabaret were among the genres identified to be preferred by high spenders
bull A finding in this study which could not be compared to any previous research was the fact that
free shows were less important to the high spenders than to the other spending segments More
than half the respondents in the low medium and medium-high categories (58 60 and 55
respectively) indicated it to be important whereas it was unimportant to 63 of the high
spenders
These findings suggest some important implications and challenges to the marketersorganisers of
Aardklop in order to encourage visitors to attend more ticketed showsproductions to attract more
high spenders to the festival and to encourage them to stay for longer
bull Firstly marketing efforts for the higher spenders should be predominantly aimed at the Gauteng
province since this province is the origin of most high spenders and also a prominent province
of origin across all spending segments However in the low spending segment marketing
efforts should mainly focus on the North West province (but without excluding the Gauteng
province)
bull The unexpected finding that higher income (associated with higher income occupations) is the
most prominent category across all 4 spending segments implies that the majority of
respondents in lower medium and medium-high spending segments are not low earning
individuals It is important for Aardklop marketersorganisers to realise the spending potential of
these three segments so that spending on more ticketed showsproductions can be
encouraged by means of tailored products that appeal to their needs and preferences This
could expand the high spending segment Since these segments indicate that free shows are
important to them it could be incorporated in packages where ticketed showsproductions are
combined with a free show as an incentive These packages should include the preferred
drama and cabaret genres should include slightly more than the number of ticketed
showsproductions usually attended by them and should encourage these visitors to stay
longer (by perhaps designing 4-day packages for segments that are more inclined to stay for 3
days) This marketing approach will encourage greater spending by visitors who have the
potential to spend more and will increase their exposure to the arts and possibly the number of
high spenders in the future
51
bull With reference to the profile of the high spending segment in Table 311 Aardklop
marketersorganisers should design packages that focus on catering for these high spenders
specific needspreferences For instance packages should involve most of the types of
showsproductions (but to a greater extent drama cabaret and visual arts) and should stretch
across the entire duration of Aardklop (since these visitors stay for most of the festivals 5-day
duration) The focus of these packages should be to encourage even more spending by these
already eager spenders culture lovers Therefore slightly more showsproductions than the
number usually attended by these visitors should be incorporated in the packages (for instance
15 tickets across all genres instead of 13) The inclusion of accommodation in these packages
for convenience should also be considered since a large percentage of these high spenders
make use of paid accommodation The convenience element could serve to persuade these
high spenders to purchase packages and in this way to buy more tickets than they would
otherwise have bought This marketing approach should not only maintain the existing high
spending market by catering for their needspreferences but aims at further increasing the
expenditure levels of this segment
35 CONCLUSIONS
The purpose of this article was to apply expenditure-based segmentation whereby distinguishable
expenditure segments are identified in order to determine the profile of the high spenders at
Aardklop The literature review indicates differences between socio-demographic behavioural and
other characteristics of the different expenditure segments The results both support and contradict
research findings in existing literature An interesting result is that the majority of respondents in
each spending segment (not only the high spenders) are high income earners associated with
higher income occupations This emphasises the spending potential in the Aardklop visitor market
that still needs to be reached Knowledge of this market will make it possible for
marketersorganisers of Aardklop to focus on customised packages (according to the
needspreferences of the low medium and medium-high spenders) to encourage this market to
spend more on ticketed showsproductions and to increase their length of stay This can eventually
convert members in these spending segments to higher spenders thereby expanding the total high
spending segment The results also reveal the profile of high spenders and how they are
distinguishable by various characteristics (or the extent to which the characteristic applies) This
too is knowledge that can assist Aardklop marketersorganisers to not only maintain the high
spending market by fulfilling their needspreferences but to motivate them to spend more on
ticketed showsproductions
52
This research has made a substantial contribution because expenditure-based segmentation of
markets for a national arts festival in South Africa has only been applied once before by Kruger
(2009) at the Klein Karoo Arts Festival This research therefore benefits both festival
marketersorganisers and future researchers Further research is recommended for the benefit of
Aardklop and the South African arts festival market in general Firstly continuous market
segmentation at Aardklop is recommended in order for festival organisersmarketers to
continuously stay aware of new trends and changes in visitor preferences to adapt marketing
efforts accordingly The usefulness of a cluster analysis (more specifically K-means clustering) in
the expenditure-based segmentation of this study appears to be robust meaningful and simple and
should be implemented more in festival research Further segmentation methods should also be
applied to the Aardklop market so that these various methods and their effectiveness can be
compared
53
CHAPTER 4
Conclusions and Recommendations
41 INTRODUCTION
The aim of the study was to apply and compare two market segmentation methods of visitors to
Aardklop National Arts Festival To achieve this aim the following objectives were set in Chapter 1
and pursued in the study
bull The first objective was to gain a better understanding of the Aardklop market by applying a
correspondence analysis with age as the dependent variable This objective was achieved in
Chapter 2 (Article 1) of the study The research clearly indicated that profiles of specific age
categories could be distinguished from other segments based on certain variables
bull The second objective was to identify the profile of high spenders at Aardklop by applying
expenditure-based segmentation This objective was accomplished in Chapter 3 (Article 2) of
the study The research revealed a definite differentiation between the profile of high spenders
and that of other spending segments based on certain variables
bull The third objective was to compare the application of correspondence analysis and
expenditure-based segmentation in festival research This objective is accomplished in Chapter
4 of this study The research indicated that there are certain noteworthy facets in the application
of these two methods that should be taken into account by future researchers when compiling
similar studies
bull The fourth objective was to draw conclusions and make recommendations concerning the
market segmentation of visitors to Aardklop This chapter will therefore draw on the research
results in Chapters 2 and 3 to compare the application of the two market segmentation
methods to conclude the findings of the research and to make recommendations regarding
future festivals and research
54
42 CONCLUSIONS
The conclusions regarding the literature review and the surveys as reported in the two articles will
be discussed as well as the conclusions regarding the comparison of the application of the two
segmentation methods
421 CONCLUSIONS REGARDING THE CORRESPONDENCE ANALYSIS OF VISITORS TO
AARDKLOP
The following conclusions can be drawn from the literature
bull Aardklop was initiated because of the concern for the arts and artists and its main aim is to
provide a quality platform for artists to promote the arts (cf 21)
bull However the fierce competition in the festival market has serious implications for all South
African artscultural festivals (cf 21)
bull Market segmentation is effective in dividing the present and potential markets into homogenous
groupssegments based on meaningful characteristics This assists marketersorganisers of the
festival to understand the needs and preferences of these segments and to adjust the festival
productprogramme accordingly (cf 22)
bull By catering for the needspreferences of the visitors it may be ensured that customers are more
satisfied and less likely to consider product offerings from competition (cf 22)
bull Various methods can be used for comprehensive market segmentation among others
correspondence analysis (cf 22)
bull Correspondence analysis is frequently used especially in tourism marketing literature
However limited market segmentation research by means of this method based on festivals
exists (cf 22)
bull There are also various segmentation variables that can be used in correspondence analysis of
which age has successfully been applied by researchers and marketers (cf 22)
bull Previous research findings identified definite differences in characteristics between older and
younger visitorstourists (cf 22)
55
bull Identifying visitor needs and motives for attending the festival by means of market segmentation
with age as the dependent variable can assist marketersorganisers of Aardklop to better
understand the current market Festival programmes and effective marketing strategies can be
developed accordingly This will ensure the sustainability growth continuity and success of
Aardklop (cf 22)
The following conclusions can be drawn from the survey
In Article 1 a correspondence analysis was applied with age as the dependent variable to
understand the Aardklop market better The results confirmed the existence of significant
differences in socio-demographic and behavioural variablescharacteristics between different age
groups of visitors to Aardklop such as the following (cf 234)
bull Most festival visitors 925 are under the age of 60
bull The age groups 46-60 and older than 60 are more likely to hear about Aardklop in the written
media such as magazines newspapers the M-Web newsletter and Aardklop e-mail Younger
visitors aged 18 to 35 rely more on word of mouth
bull Older visitors (aged 46-60) seem to be associated with the two highest spending categories at
the festival Younger visitors (aged 18-25) spend the least
bull Visitors aged 18-25 years are more likely to attend rock showsconcerts
bull Visitors aged 36-45 years are more likely to attend productionsshows such as dance theatre
and lectures and discussions and age categories 5-6 (46 years and older) are more associated
with attending showsproductions such as classical music cabaret and visual art and
exhibitions
bull Festival visitors in age categories 3 4 and 5 (26-60 years) stay for shorter periods of time (1-3
days) The very young and very old age groups (younger than 25 and older than 60) appear to
stay for longer periods of time (4 days and more)
bull Locals (visitors in the region of Potchefstroom) or visitors from the North West are likely to be
younger (between the ages of 18 and 25) Age categories 4 and 5 (36-60 years old) were likely
to travel from the Gauteng and Free State provinces
Understanding the Aardklop market is particularly beneficial to the marketersorganisers of the
festival especially for the purposes of effective marketing since a market profile of different age
groups of visitors can be formulated and the festival productprogramme can be developed
56
according to their needs and preferences This makes it possible to maintain the current market as
well as to identify and grow upcoming markets resulting in the long-term growth and sustainability
of the festival The method although exploratory is a sophisticated technique that gives a powerful
and comprehensive visual representation of the relationship possible associations between
variables and respondent age groups However this method does not always provide a detailed
profile of each age category (see Table 210)
422 CONCLUSIONS REGARDING THE EXPENDITURE-BASED SEGMENTATION OF
VISITORS TO AARDKLOP
The following conclusions can be drawn from the literature
bull Globally the number of festivals is increasing causing competition in the festival market with
implications such as declines in ticket sales (cf 31)
bull Aardklop is the third largest arts festival in South Africa and its current status reveals potential
signs of decline in ticket sales which could negatively affect the economic impact of the festival
and threaten the sustainability of this event (cf 31)
bull With the increase in the number of festivals festival markets are also becoming increasingly
diversified (cf 31)
bull Festival organisersmarketers should periodically asses this heterogeneous market and identify
the segments that provide the greatest return-on-investment so that the needs of these
segments can be catered for (cf 31)
bull Market segmentation by means of expenditure-based segmentation assists in identifying the
high spenders in a market as well as their needs and preferences (cf 31)
bull Previous research findings identify definite differences in characteristics between high spenders
and low spenders (cf 32)
bull By catering for the needs and preferences of these high spenders by means of tailored festival
programmes and marketing efforts high spenders will be encouraged to spend more on
ticketed showsproduction and repeat visits will be ensured (cf 32)
57
bull Increased ticket sales will result in a greater economic impact of Aardklop thus ensuring the
sustainability of the festival (cf 32)
The following conclusions can be drawn from the survey
In Article 2 expenditure-based segmentation was applied to identify the profile of high spenders at
Aardklop In the results 4 segments were identified and the analysis confirmed the existence of
significant differences in socio-demographic and behavioural variablescharacteristics between
these different expenditure groups of visitors to Aardklop In this way high spenders could be
differentiated These included the following (cf 334)
bull Higher income associated with higher income occupations does not necessarily influence
higher spending at Aardklop since high income occupations were the most prominent category
across all 4 spending segments This reveals that there is untapped spending potential in the
Aardklop market
bull The age category 46-60 years is the most prominent in all spending segments except for the low
spenders where it is the second most prominent age category
bull Older visitors are prone to spend more than younger visitors
bull Higher spenders stay for a longer period of time than lower spenders
bull Aardklops higher spenders tend to travel longer distances to Potchefstroom
bull Gauteng visitors in general seem to be higher spenders
bull Visitors who have attended other festivals as well are inclined to be high spenders
bull Visitors who travel to Potchefstroom for the main reason of attending the Aardklop festival are
higher spenders
bull Drama and cabaret are by and large preferred by high spenders
bull For high spenders free shows are less important than for the other spending segments
It is beneficial to the marketersorganisers of Aardklop to identify a detailed profile of high spenders
because it will assist marketersorganisers to maintain the high spending market by fulfilling their
needspreferences but also to motivate them to spend more on ticketed showsproductions Since
the under-utilised spending potential in the other spending segments were revealed along with
detailed descriptions of these segments marketersorganisers of Aardklop can target these
segments by means of customised packages (according to the needspreferences) that will
encourage the segments to spend more on ticketed showsproductions and to increase their length
58
of stay This can eventually convert members in these spending segments into higher spenders
thereby expanding the total high spending segment This will maximise the economic impact of
Aardklop and will result in the competitiveness sustainability and further growth of the festival
The method used in Article 2 namely K-means clustering offers a good range of information to
help interpret the results Instead of simply dividing the market into three spending categories (high
medium and low) for purposes of expenditure-based segmentation this method makes no preshy
determined selection in the number of spending groups Instead it groups members together based
on their natural similarity with regard to expenditure patterns ANOVA was used to determine the
differences in terms of socio-demographic and behavioural variables (as tested by the
questionnaire) between the identified clusters and to test whether these differences were
statistically significant This method provides a more detailed profile of each spending segment
Table 311)
423 CONCLUSIONS REGARDING THE COMPARISON OF THE APPLICATION OF THE TWO
SEGMENTATION METHODS
The two market segmentation methods applied in this study can be considered to be effective and
comprehensive As mentioned above the correspondence analysis revealed a less detailed profile
of each age category whereas the profile of the spending segments in the expenditure-based
article was more detailed It would therefore seem that the expenditure-based method is the better
option of the two when applying market segmentation to festivals However it should also be
pointed out that since both these methods can be used to effectively segment the Aardklop market
it is perhaps more important to consider what exactly needs to be accomplished in the marketing
research in order to identify the more appropriate market segmentation method
Correspondence analysis as opposed to expenditure-based segmentation can also be considered
as more flexible in terms of the bases on which segmentation is applied since a variety of
segmentation variables can be used to divide the market into groups (for example age as applied in
this study gender province of origin types of showsproduction etcetera) Expenditure-based
segmentation on the other hand exclusively uses expenditure as segmentation variable
Another facet that can be concluded from the comparison of these two methods is that if age were
to be used as a segmentation variable in the application of correspondence analysis in the future
quota sampling could be beneficial in order for the researcher to ensure that the right variety of
respondents are selected (for example a relatively equal selectionnumber of respondents in each
59
age group can to some extent be visibly identified by fieldworkers) This is however not a simple
task in the application of expenditure-based segmentation since it is not possible to differentiate
between high and low spenders according to appearance Below is a summary of the benefits
derived from applying each segmentation method
The benefits of applying correspondence analysis to Aardklop are
bull It assists in understanding the Aardklop market better
bull It assists in formulating a market profile of different aged visitors to the festival
bull Continuous correspondence analysis research with age as the segmentation variable assists in
monitoring the different age groups in order to stay aware of changes in their needs and
preferences as well as market trends
bull Marketing efforts directed at the different age categories can be adapted continuously and
accordingly
bull A festival producUprogramme can be developed according to the needs and preferences of the
largest age category visitors thereby maintaining the current market
bull The identification of other smaller markets by means of correspondence analysis could lead to
the growth of these markets since the festival producUprogramme could also make provision for
their specific needs and preferences
bull Catering for the needs and preferences of the larger prominent markets as well as the smaller
markets with growth potential will contribute to the competitiveness long-term growth and
sustainability of the festival
bull This research contributes to a better understanding of the profile of visitors to arts festivals in
South Africa
The benefits of applying expenditure-based segmentation to Aardklop are
bull It assists in penetrating markets with high potential
bull It assists in formulating a market profile of high spenders to the festival
bull The high spending market can be maintained by catering for their needs and ensuring return
visits
bull The untapped spending potential in the Aardklop market can be identified
bull Visitors can be encouraged to attend more ticketed showsproductions
bull Visitors exposure to the arts can be increased
bull Visitor spending can be increased
bull Visitors length of stay can be prolonged
bull A direct contribution to a greater economic impact of the festival can be made
60
bull A continuous economic contribution to the host community can be ensured
bull The competitive advantage of Aardklop can be increased
bull A contribution to the sustainability and further growth of Aardklop is made
43 RECOMMENDATIONS
Recommendations will be discussed in two sections namely general recommendations and
recommendations for further research
431 GENERAL RECOMMENDATIONS
Based on this research recommendations are made regarding Aardklop and other festivals
bull The results of Article 1 (correspondence analysis) where age was used as the segmentation
variable are inconsistent with certain findings of previous research This may be due to ever
changing market trends and changes in the needspreferences of visitors It is therefore
recommended that continuous segmentation is applied for Aardklop marketersorganisers to
stay aware of these changes so that the necessary adjustments can be made to the festival
programme and marketing communication
bull For purposes of effectively comparing differences in characteristics between different age
groups of visitors in correspondence analysis studies it is recommended that age categories be
standardised in Aardklop and other festival questionnaires
bull Since the Living Standards Measure (LSM) is used to indicate the socio-economic status of an
individual or group it is a recommended to incorporate this index in the Aardklop and other
festival questionnaires for market segmentation purposes
bull Various other segmentation methods should also be applied to the Aardklop market so that
these methods and their effectiveness can be compared with the two methods applied in this
study
432 RECOMMENDATIONS FOR FURTHER RESEARCH
Based on this research further research is recommended for the benefit of future researchers
andor the South African arts festival market
bull Since the results of market segmentation studies where age was used as the segmentation
variable can be rather inconsistent it is recommended that other segmentation variables such
as travel motivations benefit segmentation etcetera are used for future market segmentation
research based on festivals or other tourism-related products
bull In South African publications no research articles were found where correspondence analysis
was applied to festivals In general this market segmentation method is implemented only to a
limited degree in the field of tourism Future researchers should consider using the exploratory
method as it is useful for transforming two or more categorical variables into a graphical display
within a low-dimensional space making it easier to identify the key features of the data when
interpreting the information Applying correspondence analysis with age as the dependent
variable to the two other major arts festivals in South Africa namely Grahamstown National Arts
Festival and Klein Karoo National Arts Festival could be beneficial for comparative purposes
bull The usefulness of a cluster analysis (more specifically K-means clustering) in the expenditureshy
based segmentation of this study appears to be robust meaningful and simple and it should be
implemented more in festival research
62
REFERENCES
ALI-KNIGHT J DRUMMOND S McMAHON-BEATTIE U ROBERTSON M amp YEOMAN I
2004 Festival and event management an international arts and culture perspective London
Butterworth-Heinemann 418 p
ANON 2008 Aardklop National Arts Festival httpwwwaardklopcozaindexphp
frontend_action=display_text_contentampitem_id=78 Date of access 2 February 2009
ARRIMOND G ACHENREINER G amp ELFESSI A 2003 An innovative approach to tourism
market segmentation research an applied study Journal of hospitality marketing and
management 10(3)25-56
ARRIMOND G amp ELFESSI A 2001 A clustering method for categorical data in tourism market
segmentation research Journal of travel research 39(4)391-397
BACKMAN K BACKMAN SJ UYSAL M amp SUNSHINE KM 1995 Event tourism an
examination of motivations and activities Festival management and event tourism 3(1)15-24
BARTHOLOMEW DJ STEELE F MOUSTAKI I amp GALBRAITH J1 2002 The analysis
and interpretation of multivariate data for social scientists London Chapman amp Hall 263 p
BELDONA S MORRISON AM amp OLEARY J 2005 Online shopping motivations and
pleasure travel products a correspondence analysis Tourism management 26(4)561-570
BENNETT JA amp STRYDOM JW 2001 Introduction to travel and tourism marketing Cape
Town Juta Education 252 p
BOWEN JT 1998 Market segmentation in hospitality research no longer a sequential process
International journal of contemporary hospitality management 10(7) 289-296
BUHALlS D 2000 Marketing the competitive destination of the future Tourism management
21(1)97-116
63
BURGAN B amp MULES T 2000 Estimating the impact of events sampling frame issues in
identifying event related expenditure (Paper presented at the Conference Events Beyond 2000
Setting the agenda Sydney p52-59) httpwwwbusinessutseduauacempdfs Events2000_
finalversionpdfpage=52 Date of access 13 February 2009
BURKE J amp RESNICK B 2000 Marketing and selling the travel product 2nd ed New York
Delmar Thompson Learning 301 p
CAl LA HONG G amp MORRISON AM 1995 Household expenditure patterns for tourism
products and services Journal of travel and tourism marketing 4(4) 15-40
CALANTONE RJ DI BENEDETTO I HAKAM A amp BOJANIC BC 1989 Multiple
multinational tourism positioning using correspondence analysis Journal of travel research 28(2)
25-32
CANNON TF amp FORD J 2002 Relationship of demographic and trip characteristics to visitor
spending an analysis of sport travel visitors across time Tourism economics 8(3)263-271
CHEN JS 2000 Cross-cultural differences in travel information acquisition among tourists from
three pacific-rim countries Journal of hospitality and tourism research 24(2)239-251
CHEN JS 2001 A case study of Korean outbound travellers destination images by using
correspondence analysis Tourism management 22(4)345-350
CHEN JS amp GURSOY D 2000 Cross-cultural comparison of the information sources used by
first time and repeat travellers and its marketing implications Hospitality management 19(2)191shy
203
CHEUNG Y 1994 Categorical criteria values correspondence analysis Omega international
journal ofmanagement science 22(4)371-380
COOK VJ amp MINDAK WA 1984 A search for constants the heavy user revisited I Journal
of consumer marketing 1 (4)79-81
COOPER DR amp EMORY CW 1995 Research methods Homewood III Irwin 691 p
64
DARDIS R SOBERON-FERRER H amp PATRO D 1994 Analysis of leisure expenditures in
the United States Joumal of leisure research 26(4)309-321
DIAZ-PEREZ FM BETHENCOURT-CEJAS M amp ALVAREZ-GONZALEZ JA 2005 The
segmentation of canary island tourism markets by expenditure implications for tourism policy
Tourism management 26(6)961-964
DIBB S amp SIMKIN L 1996 The market segmentation workbook target marketing for
marketing managers London Routledge 171 p
DIBB S amp SIMKIN L 2001 Marketing segmentation diagnosing and treating the barriers
Industrial marketing management 30(8)609-625
DIBB S amp SIMKIN L 2004 Marketing briefs a revision and study guide 2 nd ed Oxford
Elsevier Butterworth-Heinemann 363 p
DOLNICAR S CROUCHIG DEVINNEY T HUYBERS T LOUVIERE JJ amp OPPEWAL
H 2008 Tourism and discretionary income allocation heterogeneity among households
Tourism management 29(1 )44-52
DOWNWARD P amp LUMSDON L 2004 Tourism transport and visitor spending a study in the
North York Moors National Park UK Joumal of travel research 42(4)415-420
2ndFERRELL OC HARTLINE MD amp LUCAS GH 2002 Marketing strategy ed Fort
Worth Harcourt College Publishers 469 p
FORMICA S amp UYSAL M 1998 Market segmentation of an international CUltural-historical
event in Italy Joumal of travel research 36(4)16-24
FOSTER D amp DAVIS J 1994 Mastering marketing Houndmills Macmillan 287 p
FRECHTLlNG DC 2006 An assessment of visitor expenditure methods and models Joumalof
travel research 45(1 )26-35
FRISBY W amp GETZ D 1989 Festival management a case study perspective Joumalof
travel research 28(1)7-11
65
2ndGEORGE R 2004 Marketing South African tourism ed Cape Town Oxford University
Press 415 p
GETZ D 1993 Festivals and special events Encyclopaedia of hospitality and tourism 37945shy
955
GETZ D 1997 Event management and event tourism New York Cognizant Communication
Corp 386 p
GOKOVALI U BAHAR O amp KOZAK M 2007 Determinants of length of stay a practical use
of survival analysis Tourism management 28736-746
GOUGH I 1996 Social assistance in Southern Europe South European Society and Politics
1(1)1-23
GOUGH I EARDLEY T BRADSHAW J DITCH J amp WHITEFORD P 1997 Social
assistance in OECD countries Journal of European social policy 7(1)17-43
GURSOY D amp CHEN JS 2000 Competitive analysis of cross cultural information search
behaviour Tourism management 21 (6) 583-590
GURSOY D KIM K amp UYSAL M 2004 Perceived impacts of festivals and special events by
organisers an extension and validation Tourism management 25(2)171-181
HASSAN SS 2000 Determinants of market competitiveness in an environmentally sustainable
tourism industry Journal of travel research 38(3)239-245
HAVITZ ME DIMANCHE F amp BOGLE T 1994 Segmenting the adult fitness market using
involvement profiles Journal ofpark and recreation administration 12(3)38-56
HAWES DK TAYLOR DT amp HAMPE GD 1991 Destination marketing by states Journal
of travel research 30( 1) 11-17
HOFFMAN DL amp FRANKE GR 1986 Correspondence analysis graphical representation of
categorical data in marketing research Journal of marketing research 23(3)213-227
66
HOLBROOK MB amp SCHINDLER RM 1996 Market segmentation based on age and attitude
toward the past concepts methods and findings concerning nostalgic influences on customer
tastes Journal of business research 37(1)27-39
HORNEMAN L CARTER RW WEI S amp RUYS H 2002 Profiling the senior traveler an
Australian perspective Journal of travel research 41 (1 )23-37
HSU CHC KANG SK amp WOLFE K 2002 Psychographic and demographic profiles of
niche market leisure travelers Journal of hospitality and tourism research 26(1)3-22
HUGHES H 2000 Arts entertainment and tourism Oxford Butterworth-Heinemann 244 p
ISAR RF 1976 Culture and the arts festival of the twentieth century Cultures 3(2)125-145
JACKSON MJ amp OSULLIVAN D 2002 Festival tourism a contributor to sustainable local
economic development Journal of sustainable tourism 10(4)325-342
JANG S BAI B HONG G amp OLEARY JT 2004 Understanding travel expenditure
patterns a study of Japanese pleasure travelers to the United States by income level Tourism
management 25(3)331-341
JANG S ISMAIL JA amp HAM 2002 Heavy spenders medium spenders and lights spenders
of Japanese outbound please travelers Journal of hospitality amp leisure marketing 9(34)83-106
KARA A KAYNAK E amp KUCUKEMIROGLU O 1996 Positioning of fast-food outlets in two
regions of North America a comparative study using correspondence analysis Journal of
professional services marketing 14(2)99-119
KASTENHOLZ E 2005 Analysing determinants of visitor spending for the rural tourist market in
North Portugal Tourism economics 11 (4 )555-569
KAYNAK E KUCUKEMIROGLU O amp KARA A 1994 Consumers perceptions of airlines a
correspondence analysis approach in a global airline industry Management international review
34(3)235-254
KELLER KL amp KOTLER P 2006 Marketing management 12th ed Upper Saddle River NJ
Prentice Hall 729 p
KIM H BORGES MC amp CHON J 2006 Impacts of environmental values on tourism
motivation the case of FICA Brazil Tourism management 27(5)957-967
KIM K amp UYSAL M 2003 Perceived socio-economic impacts of festivals and events among
organisers Journal of hospitality and leisure marketing 10(34) 159-171
KOC E amp ALTINAY G 2007 An analysis of seasonality in monthly per person tourist spending
in Turkish inbound tourism from a market segmentation perspective Tourism management
28(1 )227-237
KOTLER P amp ARMSTRONG G 2004 Principles of marketing 10th ed New York Pearson
953 p
KREJCIE RV amp MORGAN DW 1970 Determining sample size for research activities
Educational and psychological measurement 30607-610
KRUGER M 2009 Spending behaviour of visitors to the Klein Karoo National Arts Festival
Potchefstroom North-West University (Dissertation - MA) 66 p
KRUGER M SAAYMAN M SAAYMAN A 2008 Bemarkingsprofiel en ekonomiese impak
van besoekers aan die Aardklop Nasionale Kunstefees Potchefstroom Instituut vir Toerisme en
Vryetydstudies 33 p
KRUGER M SAAYMAN M amp SAAYMAN A 2009 Expenditure-based segmentation of
visitors to Tsitsikamma National Park Cornell hospitality quarterly (In process of review)
KRUGER S amp PETZER DJ 2008 Measuring tourists satisfaction with quality of life issues at
an arts festival Acta commercii 8113-127
LAESSER C amp CROUCH G1 2006 Segmenting markets by travel expenditure patterns the
case of international visitors to Australia Journal of travel research 44(4)397-406
68
LAMB CW HAIR JF amp McDANIEL C 2000 Marketing 5th ed Cincinnati Oh Southshy
Western College 773 p
LAMB CW HAIR JF McDANIEL C BOSHOFF C amp TERBLANCHE NS 2004
Marketing 2nd South African ed Cape Town Oxford University Press 502 p
LEE CK LEE YK amp WICKS BE 2004 Segmentation of festival motivation by nationality
and satisfaction Tourism management 25(1 )61-70
LEE H 2001 Determinants of recreational boater expenditures on trips Tourism management
22659-667
LEE Y LEE C LEE S amp BABIN B 2008 Festivals capes and patrons emotions
satisfaction and loyalty Journal of business research 61 (1 )56-64
LEGOHEREL P 1998 Toward a market segmentation of the tourism trade expenditure levels
and consumer behaviour instability Journal of travel and tourism marketing 7(3)19-39
LEGOHEREL P amp WONG KKF 2006 Market segmentation in the tourism industry and
consumersspending what about direct expenditures Journal of travel and tourism marketing
20(2) 15-30
LEONES J COLBY B amp CRANDALL K 1998 Tracking the expenditures of the elusive
nature tourists of Southeastern Arizona Journal of travel research 36(3)5664
LONG PT amp PERDUE RR 1990 The economic impact of rural festivals and special events
assessing the spatial distribution of expenditures Journal of travel research 28(4)10-14
LUBBE BA 2000 Tourism distribution managing the travel intermediary Cape Town Juta
386 p
LUBBE BA 2003 Tourism management in Southern Africa Cape Town Pearson Education
290 p
69
MAK J MONCUR J amp YONAMINE D 1977 Determinants of visitors expenditures and visitor
lengths of stay a cross-section analysis of US visitors to Hawaii Journal of travel research
15(3)5-8
MALHOTRA KN amp BARTELS BC 2002 Overcoming the attribute prespecification bias in
international marketing research by using non-attribute-based correspondence analysis
International marketing review 19(1 )65-79
MARX S VAN ROOYEN DC BOSCH JK amp REYNDERS HJJ 1998 Business
management 2nd ed Pretoria Van Schaik Academic 797 p
MAYFIELD TL amp CROMPTON JL 1995 The status of the marketing concept among festival
organisers Journal of travel research 33(4)14-22
McDONALD M amp DUNBAR I 1995 Market segmentation London Macmillan 271 p
MciNTOSH RW amp GOELDNER CR 1990 Tourism principles practices philosophies New
York Wiley 534p
MEHMETOGLU M 2007 Nature-based tourists the relationship between their trip expenditures
and activities Journal of sustainable tourism 15(2)200-215
MIDDLETON VTC 1994 Marketing in travel and tourism Oxford Butterworth - Heinemann
393 p
MOK C amp IVERSON TJ 2000 Expenditure-based segmentation Taiwanese tourists to
Guam Tourism management 21 299-305
MOUTHINHO L amp WITT SF 1994 Tourism marketing and management handbook 2nd ed
Upper Saddle River NJ Prentice Hall 617 p
MULES T amp FAULKNER B 1996 An economic perspective on special events Tourism
economics 2(2)107-118
MURPHY PE amp CARMICHAEL BA 1991 Assessing the tourism benefits of an open access
sports tournament the 1989 BC Winter Games Journal of travel research 29(3)32-36
70
MYKLETUN RJ CROTTS JC amp MYK- bLETUN 1 2001 Positioning an island destination in
the peripheral area of the Baltics a flexible approach to market segmentation Tourism
management 22(5) 493-500
NICKELS WG amp WOOD MB 1997 Marketing relationships quality value New York
Worth 633 p
OPPERMAN M 1997 First-time and repeat visitors to New Zealand Tourism management
18(3)177-181
OXFORD CONCISE DICTIONARY 2001 London HarperCollins 832 p
PERREAULT WD amp McCARTHY EJ 1999 Basic marketing a global- managerial approach
Boston Mass Irwin McGraw-HilI 763 p
PISSOORT V 2007 Visitor segmentation of arts festivals a comparative study of three events
Potchefstroom North-West University (Dissertation - MA) 132 p
PITRUZELLO S 1999 Decommodification and the worlds of welfare capitalism a cluster
analysis Seminar paperWS90 European Forum Florence EUI
PIZAM A amp REICHEL A 1979 Big spenders and little spenders in US tourism Journal of
travel research 18(1 )42-43
POUTA E NEUVONEN M amp SIEVANEN T 2006 Determinants of nature trip expenditures in
Southern Finland implications for nature tourism development Scandinavian journal of hospitality
and tourism 6(2) 118-135
RAAIJ Wv amp FRANCKEN DA 1984 Vacation decisions activities and satisfactions Annals
of tourism research 11(1)101-112
RAA TH A 2009 Verbal communication with Aardklop office representative (Telephonic
interview on 12 March 2009)
RICAHRDS G 2001 Cultural attractions and European tourism Wallingford CAB International 245 p
SAAYMAN A amp SAAYMAN M 2005 Ekonomiese impak en profiel van besoekers aan die
Aardklop Nasionale Kunstefees Potchefstroom Instituut vir Toerisme en Vryetydstudies 58 p
SAAYMAN A amp SAAYMAN M 2006a Ekonomiese impak en profiel van besoekers aan die
Aardklop Nasionale Kunstefees Potchefstroom Instituut vir Toerisme en Vryetydstudies 47 p
SAAYMAN A amp SAAYMAN M 2006b Socio-demographics and visiting patterns of arts
festivals in South Africa Event management 9(4)211-222
SAAYMAN A amp SAAYMAN M 2007 Ekonomiese impak en profiel van besoekers aan die
Aardklop Nasionale Kunstefees Potchefstroom Instituut vir Toerisme en Vryetydstudies 33 p
SAAYMAN M 2000 En route with tourism Potchefstroom Leisure Consultants and
Publications 330 p
SAAYMAN M 2002 Tourism marketing in South Africa Potchefstroom Leisure Consultants and
Publications 450 p
SAAYMAN M 2006 Marketing tourism products and destinations getting back to basics 2nd ed
Potchefstroom Institute for Tourism and Leisure Studies 234 p
SAAYMAN M 2007 En route with tourism an introductory text 3rd ed Potchefstroom Leisure
Consultants and Publications 356 p
SAAYMAN M amp SAAYMAN A 2004 Economic impact of cultural events South African journal
of economic and management sciences 7(4)629-642
SAAYMAN M amp SAAYMAN A 2006 Does the location of arts festivals matter Papers in
regional science 85(4)569-584
SAAYMAN M SAAYMAN A amp RHODES JA 2001 Domestic tourist spending and economic
development the case of the North-West Province Development Southern Africa 18(4)443-452
SAAYMAN M SLABBERT E amp SAAYMAN A 2005 Profile and economic impact of
Volksblad Arts Festival Potchefstroom Institute for Tourism and Leisure Studies 32 p
72
SAAYMAN M SLABBERT E amp SAAYMAN A 2009 Expenditure-based segmentation of
visitors to the Grahamstown National Arts Festival Management dynamics (In process of review)
SAAYMAN M VAN DER MERWE P amp PIENAAR J 2008 Expenditure-based segmentation
of South African biltong hunters South African journal of wildlife research (In process of
publication )
SAT see SA TOUR
SATOUR South African Tourism Board 2007 Dhttpwwwstatssagovzapublications
publicationsearch Date of access 10 March 2008
SHANKA T amp TAYLOR R 2004 A correspondence analysis of sources of information used by
festival visitors Tourism analysis 9(12)55-62
SLABBERT E 2002 Key success factors of tourist market segmentation Potchefstroom
Potchefstroom University for Christian Higher Education (Dissertation - MA) 122 p
SLABBERT E 2004 An integrated tourism model for cultural events Potchefstroom North-West
University (Thesis - PhD) 220 p
SLABBERT E SAAYMAN M SAAYMAN A amp VIVIERS P 2008 Die sosio-ekonomiese
impak van besoekers aan die ABSA KKNK Potchefstroom Instituut vir Toerisme en
Vryetydstudies 87 p
SMITH C amp JENNER P 1998 The impact of festivals and special events on tourism Travel
and tourism analyst 4(1)73-100
SMITH LJ 1990 Dictionary of concepts in recreation and leisure studies Westport Greenwood
Press 384 p
spons DM amp MAHONEY EM 1991 Segmenting visitors to a destination region based on
the volume of their expenditures Business research division 29(4)24-31
THRANE C 2002 Jazz Festival visitors and their expenditures linking spending patterns to
musical interest Journal of travel research 40(3) 281-286
73
TWEDT DW 1964 How important to marketing strategy is the heavy user Journal of
marketing 28(1 )71-72
UYS MC 2003 A sustainable marketing strategy for Dutch tourists to South Africa
Potchefstroom Potchefstroom University for Christian Higher Education (Dissertation - MCom)
147 p
UYSAL M GAHAN L amp MARTIN B 1993 An examination of event motivations a case
study Festival management and event tourism 1(1)5-10
VAN HEERDEN A 2003 The economic impact of the Aardklop National Arts Festival in
Potchefstroom Potchefstroom PU vir CHO (Dissertation - MA) 105 p
VAN ZYL C 2005 Optimum market-positioning models for South African Arts festival scenarios
Pretoria University of South Africa (Thesis - PhD) 433 p
VISSER G 2005 Lets be festive exploratory notes on festival tourism in South Africa Urban
forum 16(3)155-175
VIVIERS P SLABBERT E SAAYMAN M amp SAAYMAN A 2008 The socio-economic
impact of visitors to Grahamstown National Arts Festival Potchefstroom Institute for Tourism and
Leisure Studies 87 p
WALO M BULL A amp BREEN H 1997 Achieving economic benefits at local events a case
study of a local sports event Festival management amp event tourism 4(34)95-106
WEDEL M amp KAMAKURA W 2002 Introduction to the special issue on market segmentation
International journal of research in marketing 19(3) 181-183
WOODSIDE AG COOK VJ amp MINDAK W 1987 Profiling the heavy traveler segment
Journal of travel research 25(3)9-15
WORLD TOURISM ORGANISATION (WTO) 2002 Enhancing the economic benefits of tourism
for local communities and poverty alleviation World Tourism Organisation 60 p
WTO see WORLD TOURISM ORGANISATION
74
APPENDIX A Visitor questionnaire
75
1
TABLE OF CONTENTS
CHAPTER 1 Introduction problem statement objectives and method of research
11 INTRODUCTION
12 PROBLEM STATEMENT
13 GOALS AND OBJECTIVES OF THE STUDY
131 Goal
132 Objectives
14 METHOD OF RESEARCH
1 41 Literature Study
142 Empirical Study (Survey)
1421 Research design and method of collecting data
1422 Development of the questionnaire
1423 Sampling population
1424 Sampling method
1425 Data analysis
a Correspondence Analysis
b K-means Clustering
c ANOVA analysis (Analysis of Variance)
15 DEFINING CONCEPTS
151 Aardklop National Arts Festival
152 FestivalArts festivals
153 Market segmentation
16 CHAPTER CLASSIFICATION
CHAPTER 2 Correspondence analysis of visitors to Aardklop National Arts Festival
21
22
23
231
232
233
234
INTRODUCTION
LITERATURE REVIEW
METHOD OF RESEARCH
The questionnaire
The Samples
The Method
Results
1
2
7
7
7
8
8
8
8
8
9
9
10
10
11
11
11
11
12
12
12
14
14
15
19
20
20
21
22
x
2341 General profile of festival respondents 22
2342 Cross-tabulations and accompanying correspondence biplots 23
24 FINDINGS AND IMPLICATIONS 30
25 CONCLUSIONS 32
CHAPTER 3 Expenditure-based segmentation of visitors to Aardklop National Arts 34
Festival
31 INTRODUCTION 34
32 LITERATURE REVIEW 36
33 METHOD OF RESEARCH 39
331 The questionnaire 40
332 The Samples 40
333 The Method 42
334 Results 43
3341 General profile of festival respondents 43
3342 Expenditure clusters 44
3343 ANOVA results 45
34 FINDINGS AND IMPLICATIONS 49
35 CONCLUSIONS 52
CHAPTER 4 Conclusions and Recommendations 54
41 INTRODUCTION 54
42 CONCLUSIONS 55
421 CONCLUSIONS REGARDING THE CORRESPONDENCE ANALYSIS OF 55
VISITORS TO AARDKLOP
422 CONCLUSIONS REGARDING THE EXPENDITURE-BASED SEGMENTATION OF 57
VISITORS TO AARDKLOP
423 CONCLUSIONS REGARDING THE COMPARISON OF THE APPLICATION OF 59
THE TWO SEGMENTATION METHODS
43 RECOMMENDATIONS 61
431 GENERAL RECOMMENDATIONS 61
432 RECOMMENDATIONS FOR FURTHER RESEARCH 61
REFERENCES 63
XI
LIST OF TABLES
CHAPTER 1 Introduction problem statement objectives and method of research
Table 11 Overview of economic impact and profile of Aardklop 2005-2008 5
CHAPTER 2 Correspondence analysis of visitors to Aardklop National Arts Festival
Table 21 Characteristics distinguishing older consumers from younger consumers 17
Table 22 Survey summary 20
Table 23 Festival respondent profile 22
Table 24 Age category by showsproductions attended 23
Table 25 Age category by mediums 24
Table 26 Age category by number of people financially responsible for 25
Table 27 Age category by spending category 26
Table 28 Age category by number of days attended the festival 27
Table 29 Age category by province of origin 28
Table 210 Summary of the age categories by variables 29
CHAPTER 3 Expenditure-based segmentation of visitors to Aardklop National Arts
Festival
Table 31 Overview of economic impact and profile of Aardklop 2005 - 2008 35
Table 32 Characteristics distinguishing high spenders from medium and low spenders 38
Table 33 Questionnaires completed during Aardklop National Arts Festivals 2005 shy 41
2008
Table 34 Questions used and their descriptions 41
Table 35 Festival respondent profile 44
Table 36 Cluster centres and number of cases in each cluster 44
Table 37 ANOVA results for respondent characteristics 45
Table 38 Low medium high-medium and high segments 49
XII
LIST OF FIGURES
CHAPTER 2 Correspondence analysis of visitors to Aardklop National Arts Festival
Figure 21 Biplot of age category and showsproductions attended 24
Figure 22 Biplot of age category and mediums through which respondents heard about 25
Aardklop
Figure 23 Biplot of age category and number of people financially responsible for 26
Figure 24 Biplot of age category and spending category 27
Figure 25 Biplot of age category and number of days attended the festival 28
Figure 26 Biplot of age category and province of origin 29
APPENDIXES
Appendix A Visitor questionnaire 75
XIII
CHAPTER 1 Introduction problem statement
objectives and method of research
11 INTRODUCTION
Over the past few years there has been a rapid increase in the growth of the tourism industry
worldwide In South Africa foreign arrivals increased by 83 during 2006 and the countrys annual
tourism arrivals record was broken for the third year running with 907 million foreigners visiting
South Africa in 2007 (SAT 2007)
The rapid tourism growth in South Africa can be ascribed to various reasons such as increased
marketing efforts communities recognising the potential of tourism and the variety of attractions
across the country Attractions whether natural or man-made are the underlying motivations for
people to travel (Lubbe 2003 1 05 Mcintosh amp Goeldner 1990 112) Events and festivals are
considered man-made or organised celebrations that among others serve as tourist attractions
that attract people to a specific destination and provide unique features and experiences for visitors
(Getz 1993946 Kim amp Uysal 2003160)
Events and festivals have become one of the fastest growing types of tourism attractions
especially in recent years In South Africa event tourism is estimated to expand even faster than
the 10 annual tourism growth rate (George 2004366 Gursoy Kim amp Uysal 2004172 Saayman
Saayman amp Rhodes 2001 443) Events and festivals have important roles to play in the tourism
development and marketing of a destination since it is considered a sector with significant
economic and job creation benefits (Getz 1993945 Getz 19975)
Arts festivals particularly such as the Aardklop National Arts Festival are one of the most rapidly
growing events tourism segments (Jackson amp OSullivan 2002326) and have become important to
the South African society due to a number of reasons and benefits For example it sustains
1
different forms of art it contributes to the livelihood of artists it stimulates the growth of regional
and local economies and it promotes specific destinations to name but a few (Saayman Siabbert
amp Saayman 20057)
These benefits have prompted a remarkable increase in conceptual and empirical studies on
festivals and events There has also been a big increase in the number of festivals hosted by
various destinations (Hughes 20002 Visser 2005 165) The benefits of the Aardklop festival in
particular and the contribution it makes to the community are remarkable Seen from an economic
point of view Aardklop is the third largest festival in South Africa with a total estimated economic
impact of R4665 million in 2008 (Kruger Saayman amp Saayman 200827) During its very
successful but modest beginning in 1998 it had an estimated visitor number of 25 000 thus seen
from a marketing point of view Aardklop has grown substantially in visitor numbers with an
average of just more than 56 000 visitors per year over the past three years (Kruger et al 200827
Van Heerden 200312) However when it comes to reaping the continuous contribution and
benefits of this festival the sustainability and further growth of Aardklop need to be ensured
The purpose of this chapter is to discuss the research process followed in this study This will be
accomplished by firstly analysing the problem Thereafter the goals and objectives will be stated
followed by the research methodology definitions of key concepts and lastly the chapter
classification
12 PROBLEM STATEMENT
Currently at least 211 annual festivals take place across South Africa of which 28 focus on
performing and visual arts or a combination thereof (Visser 2005165) as is the case with
Aardklop National Arts Festival The competition in this market currently has important implications
for all the South African artscultural festivals Most festivals in South Africa are experiencing a
decline in the number of festival visitors ticket sales or both (Saayman amp Saayman 2006a40-41)
The decline typically reflects the principles of a product life-cycle which state that individual events
(or products) tend to progress through stages of growth maturity and decline (Getz 1993951) The
product life-cycle therefore reflects how a festival is doing in this competitive market environment
by indicating the stage or phase it is in
However according to Saayman and Saayman (2006b219 2006582) the sustainability of a
festival must be attained at three levels namely economic environmental and socio-cultural In
order to contribute to the sustainability of the host destination the importance of effectivestrategic
2
marketing of the festival must be realised (Uys 2003 11 Walo Bull amp Breen 199796) Organisers
of recurring events can adopt and implement a number of marketing strategies to prolong the
growth phase of the festivals life-cycle Examples of marketing strategies include market
penetration (attracting more visitors to the festival by means of a more competitive marketing mix)
stimulating new and repeat visits by restructuring the festival programme or developing completely
new markets by means of extensive festival product changes (Getz 1993951) Hawes Taylor and
Hampe (199111) argue that an essential goal of a marketing strategy should be twofold namely
(1) maintaining existing markets and (2) further penetrating markets with high potential which is
possible by means of market segmentation
One of the key success factors of strategic marketing is market segmentation Dibb and Simkin
(2001 609) hold the opinion that market segmentation is vital to business success and is the
universal remedy of modern marketing since a mass marketing approach cannot be used to satisfy
diverse customer needs Nearly all markets include groups of peopleconsumers with different
needs preferences demands tastes behaviour patterns disposable income and spending
patterns therefore marketers cannot compete in an entire market seen from an economic point of
view (Buhalis 2000 1 00 Foster amp Davis 1994 132) Market segmentation therefore recognises the
differences and changes in the lifestyles desires tastes and motivations of visitors to a festival
and continually focuses marketing initiatives on economically significant groups Market segments
vary in size and potential and marketers make use of segmentation to define the marketing
objectives accurately and to allocate resources better (Lamb Hair amp McDaniel 2000213) Market
segmentation is effective since it divides the present and potential market into homogenous
groupssegments based on meaningful characteristics and concentrates promotion product and
pricing efforts on serving the most prominent portions of the market - the target markets (Mcintosh
amp Goeldner 1990407) This is done because it is expected that consumers in the same group (or
segment) will react similarly to a particular offering (McDonald amp Dunbar 199521) Segmentation
therefore assists in identifying the target market to understand their needs better and to determine
the right marketing mix for the target market (Perreault amp McCarthy 1999239) Hence market
segmentation is essential to establish efficient marketing strategies directed at these homogenous
sub-groups (Havitz Dimanche amp Bogle 199440)
In recent years market segmentation and subsequent customisation have become very effective
where the maintenance of existing markets is a primary goal (Wedel amp Kamakura 2002181) since
changes in trends and visitor preferences can be detected by means of market research and this
will assist festival marketers and organisers in adjusting the programme accordingly In other
words market segmentation is beneficial to determine whether visitor interest is still the same or
3
changing in order to maintain the existing markets This is important since the festivals life-cycle
is linked to visitor interest (Saayman 2006114) Marketers can also determine which markets with
high potential can be approached or further penetrated so that a more careful analysis of their
needs motives and expectations can be made in order to develop a festival programme and
product aimed at these specific needs (Nickels amp Wood 1997221)
Implementing market segmentation also accounts for numerous benefits The following can be
considered some of the benefits of market segmentation (Ali-Knight Drummond McMahon-Beattie
Robertson amp Yeoman 2004136 Arrimond amp Elfessi 2001391 Bennet amp Strydom 20015464
Burke amp Resnick 200039 Dibb amp Simkin 19961 Dibb amp Simkin 2001610 Ferrell Hartline amp
Lucas 200274 Frisby amp Getz 19897 George 2004135 Getz 1997260 Keller amp Kotler
2006246 Lee Lee amp Wicks 200461 Marx Van Rooyen Bosch amp Reynders 1998535 Mayfield
amp Crompton 199514 McDonald amp Dunbar 199516 Mouthinho amp Witt 1994305 Saayman
200285)
bull Marketers gain detailed knowledgedefinition of visitors with a better comprehension of their
needs
bull By concentrating on these needs marketers can match visitors needs more closely with the
festival products and services
bull With market segmentation more satisfied festival visitors and long-term visitor relationships
are formed by offering the target markets what they want
bull Market segmentation brings about more effective marketing programmes marketing mixes
and marketing costs
bull Segmentation can lead to the identification of niche markets
bull Market segmentation eases the ability to respond to markets changing needs
bull Segmentation promotes new innovative product ideas
bull It provides clarity on the size of potential markets potential effectiveness of promotions
responses to changes in the marketing mix spending patterns price sensitivity and loyalty
bull Segmentation can lead to concentration of resources in markets where competitive
advantages are great and returns are high
bull By means of segmentation a competitive advantage may be gained by understanding and
assessing the competitors and having an approach different to theirs resulting in less
conflict with competitors
bull Segmentation leads to the development of a sustainable product and better positioning of
the product
4
Therefore it is crucial to implement market segmentation so that the currenUpotential target
audience can be identified and their needs motives and expectations can be understood Based on
that information the festival programme can be designed according to the needs and preferences
of both the current and potential markets Market segmentation therefore assists in maintaining the
existing market by ensuring repeat visits and it also leads to the identification of high spenders so
that these high potential markets can be further penetrated (Burke amp Resnick 200039)
Maintaining and further penetrating festivalevent markets by means of market segmentation is an
economically sensible and sustainable strategy since increased expenditure and economic
contribution to the destination area due to the anticipation of tourists is a common feature of any
event (Murphy amp Carmichael 199132) The economic impact of a festival is measured by the size
of the festival in terms of (1) number of visitors (2) visitor spending (3) duration of stay and (4) the
multiplier effect (Saayman 2007132) In Table 11 below the economic contribution of Aardklop is
prominent The product life-cycle of a festival can be measured by the number of tickets sold
(Kruger 2009 15) based on this Aardklop is showing potential signs of decline although it is not in
a definite declining phase yet Besides the recent decline in ticket sales the festival seems to be
doing well generally As mentioned before Aardklop has experienced positive growth since its
debut in 1998 (Kruger et al 200827) and for the past 4 years the festival has maintained relatively
constant figures with regard to the number of visitors direct spending of visitors as well as average
days spent at the festival (Table 11) Thus Aardklop is an already established event on the festival
calendar of South Africa that still continues to attract a substantial number of loyal supporters (also
referred to as festinos)
Table 11 Overview of economic impact and profile of Aardklop 2005-2008
Year 2005 2006 2007 2008
Absolute number of visitors 36766 61476 51870 55518
Total tickets sold 91156 81022 84559 79530
Number of travel groups 15193 19393 16678 15294
Travel group size 2 3 3 4
Average tickets per group 6 4 5 5
Average days attended festival 3 3 3 3
Total visitor days 113240 196108 168 576 172106
Average spending per group R217438 R177955 R2 61255 R2 79997
Direct spending of visitors at festival R21 574794 R24237640 R27999000 R26 735791
Total economic impact R39171741 R42908324 R53097645 R46650703
Will visit the festival again 95 94 97 93 Source Kruger et al (200826-29) Saayman and Saayman (2006a 36-41)
Aardklop had an exceptional year in 2007 and was extended with a few days to celebrate its 10 year anniversary this could possibly account for its higher economic value in 2007
5
However to ensure the sustainability and future profitability of the festival the growth phase of the
festivals life cycle must be extended by means of continuous strategic marketing efforts That
means that although festivals and events are subjected to successive stages of growth market
research assists festival marketers in determining the changes in demand thereby making it
possible to advise festival organisers on how to modify the festival programmeproduct accordingly
(Frisby amp Getz 19897) Hence it is important that the Aardklop festival committee and
management ensure that the necessary market research is continually implemented so that they
may understand and sustain the current market of the festival and further penetrate markets with
high potential
The division or segmentation of the market can be done in various waysmethods and by means of
a variety of segmentation variables depending on the situation and product (Burke amp Resnick
200041 Dolnicar Crouch Devinney Huybers Louviere amp Oppewal 200846) These
segmentation variables include geographic socio-demographic psychographic andor behavioural
characteristics (Slabbert 20022) A large selection of possible methods is used to do
comprehensive market segmentation These include cluster analysis correspondence analysis
regression analysis Automatic Interaction (AID) analysis latent class analysis judgment-based
segmentation factor and component analysis as well as using expenditure (Slabbert 200240) In
tourism research expenditure-based segmentation as well as correspondence analysis is often
used to implement market segmentation Expenditure-based segmentation entails classifying
visitors into low medium and high spending groups or segments (Mok amp Iverson 2000302)
Correspondence analysiS entails the representation of associations between categorical variables
for effective interpretation of the data to identify and compare different segments (Beldona
Morrison amp OLeary 2005564) However these two methods have not been applied to Aardklop in
previous research
Although correspondence analYSis is purely an exploratory yet sophisticated technique Gursoy and
Chen (2000585) found it to be a much used technique in tourism marketing research
Correspondence analysis is an effective segmentation tool and useful when associations between
two or more multi-categorical variables need to be explored (Beldona et al 2005565)
A number of studies aimed at constructing segments have been based on visitor expenditure (Diazshy
Perez Bethencourt-Cejas amp Alvarez-Gonzales 2005 Saayman Van der Merwe amp Pienaar 2008
Mok amp Iverson 2000 and Legoherel and Wong 2006) This type of segmentation is beneficial
since marketing researchers have discovered that high spenders and users of a specific product
account for a disproportionately large percentage of total sales (Spotts amp Mahoney 1991 42)
6
Dolnicar et 81 (200846) indicate that when expenditures are used in empirical tourism research
valuable insights are provided on how segments of tourists with different expenditure patterns can
be targeted with specific marketing strategies
Grouping the visitors to Aardklop by means of the above-mentioned segmentation methods can
help festival organisers understand the current market better (by means of correspondence
analysis on the bases of demographics) as well as markets with high potential (by means of
expenditure-based segmentation in order to identify the high spenders at Aardklop)
Knowledgeable and informed organisers can then adjust the festival programme and marketing
efforts according to the needs motives and behaviours of these visitorsidentified segments so as
to ensure the sustainability growth continuity and success of the Aardklop festival
Therefore the research question this dissertation will attempt to address is Which markets can be
identified for Aardklop National Arts Festival by applying and comparing two market segmentation
methods namely correspondence analysis and expenditure-based segmentation
13 GOAL AND OBJECTIVES OF THE STUDY
131 Goal
To apply and compare two market segmentation methods of visitors to Aardklop National Arts
Festival
132 Objectives
The achievement of the goal relies on the following objectives
Objective 1
The application of a correspondence analysis in order to understand the Aardklop market better
Objective 2
The application of expenditure-based segmentation in order to identify the profile of high spenders
at Aardklop
Objective 3
To compare the application of correspondence analysis and expenditure-based segmentation to
the Aardklop market
7
Objective 4
To draw conclusions and make recommendations regarding market segmentation of visitors to
Aardklop
14 METHOD OF RESEARCH
This quantitative study follows a two-pronged approach Firstly a literature analysis was done by
collecting secondary data on the topic from existing sources and secondly an empirical survey
was done by collecting primary data by means of a structured questionnaire
141 Literature Study
A literature study was based on specific keywords tourism event tourism arts festival market
segmentation target market economic impact correspondence analysis and expenditure-based
segmentation The internet including scientific databases and search engines such as Google
Scholar RSat ScienceDirect and Ebscohost played a vital role in searching for the most recent
relevant publications and information Other sources also used during the literature study included
books accredited journal articles theses dissertations and tourism-related sources such as
tourism reports and Aardklop website sources
142 Empirical Study (Survey)
The empirical survey was conducted at Aardklop National Arts Festival in the following manner
1421 Research design and method of collecting data
A quantitative approach by means of a questionnaire was followed Siabbert (200463) emphasises
that the advantages of such an approach include (1) it is suitable for collecting demographic
information such as gender age and income (2) it is inexpensive to conduct and (3) it is relatively
easy to tabulate and analyse the data using statistical programmes
Participants were grouped into segments based on certain demographic and socio-economic
characteristics and the research was exploratory in nature The results lead to the identification of
current markets in order to maintain existing markets and penetrate markets with high potential
This study will attempt to determine a demographic (based on age of visitors) and a socioshy
economic (based on visitor spending) profile of visitors to the Aardklop National Arts Festival by
means of a structured questionnaire that serves as the instrument to collect the data
1422 Development of the questionnaire
The Institute for Tourism and Leisure Studies at the North-West University Potchefstroom Campus
developed the questionnaire in collaboration with the festival organisers and it has proved to be
8
successful This research instrument (questionnaire) was used in similar studies often conducted at
South African arts festivals (Van Heerden 2003 Pissoort 2007) A pilot study was done in 2002 at
Aardklop and 6 successful surveys followed in the years thereafter The questionnaire remained
similar throughout these years
The questionnaire was divided into three sections and mainly consisted of closed questions (see
Appendix A) Section one included questions based on socio-demographics of the visitor (such as
gender age language occupation and province of origin) followed by questions in section two
based on behavioural elements (such as travel group size days spent at the festival
productionsgenres attended type of accommodation used other festival attended throughout the
year attendance of free shows number of persons financially responsible for and spending) In
section three more general behavioural questions were also asked such as the means through
which information regarding the festival was communicated (for example magazines newspapers
newsletter etcetera)
1423 Sampling population
The design for drawing a sample consists of defining the population of interest The survey
population for this study was selected from a group of people that attended the festival The
Institute for Tourism and Leisure Studies at the North-West University (Potchefstroom Campus)
conducted 7 surveys at the Aardklop National Arts Festival (2001-2008) From 2005 to 2008 a total
of 1 671 questionnaires were completed by visitors to the festival and the data from these surveys
were used for this study since the questionnaire as well as the general characteristics of the
population remained similar over the four years
The total of 1 671 questionnaires is beneficial since segmentation requires large sets of data
(Burgan amp Mules 200055) Cooper and Emory (1995207) as well as Krejcie and Morgan
(1970608) point out that in any defined population for a population of 100 000 (N) the
recommended sample size (S) is 384 Aardklop has a 4 year average of just fewer than 51 500
attendants With an average of 418 questionnaires per year over the four consecutive year period
the sample size is appropriate for this type of study
1424 Sampling method
For the duration of the festival a non-probability sampling method was used to conduct the
surveys namely convenience sampling The survey was conducted by means of a selfshy
administered questionnaire among the tourists at the festival These respondents were briefed
about the purpose of the research and were willing participants To limit response bias towards a
9
certain group of festival attendants questionnaires were distributed on-site but at different
locations for example in the areasvenues of shows and productions in the areas of closed streets
where attendants gather between shows and on the main festival grounds Field workers were
trained to understand the purpose of the study and the questionnaire so that they could assist
respondents where necessary without interfering with the completion of the questionnaire
Questionnaires were distributed on each day of the 5 day festival period This ensured that the
feedback received by the sample population was an accurate portrayal of visitor spending
1425 Data analysis
The data was coded on Microsoft Excel and processed using SPSS (Statistical Package for the
Social Sciences) and Statistica software with the assistance of the Statistical Services at the Northshy
West University Potchefstroom Campus An initial data analysis entailed descriptive statistics and
focused on the demographic profile of the visitor to the Aardklop festival by means of frequencies
A correspondence analysis was undertaken to visualise the correlationirelationship between the
age of respondents and other variables A K-means clustering was done to group members
together based on their similarity with regard to spending patternsbehaviour so that these clusters
could be used in the ANOVA analysis The ANOVA analysis was applied by using the identified
clusters to do expenditure-based segmentation A brief description of each analysis that was used
will be provided in the following section
a Correspondence Analysis
Beldona et al (2005564) point out that correspondence analysis is an exploratory and
sophisticated technique that gives a powerful representation of association between categorical
variables by giving a comprehensive view of the data (in the contingency table) for effective
interpretation It is also a much used technique in tourism marketing literature (Beldona et al
2005564) Examples of these include Arimond and Elfessi (2001 391) Beldona et al (2005561)
Calantone Benedetto Hakam and Bojanic (198925) Chen (2000241) Chen (2001345) Chen
and Gursoy (2000193) Cheung (1994374) Gursoy and Chen (2000583) Kara Kaynak and
Kucukemiroglu (1996102) Kaynak Kucukemiroglu and Kara (1994237) Malhotra and Bartels
(200265) and Shanka and Taylor (200455) For purposes of this study a correspondence analysis
of socio-demographic and behavioural variables was undertaken in order to visualise the
relationship possible associations between these variables and respondent age groups
(dependent variable)
10
b K-means Clustering
Instead of simply dividing the market into three spending categories (high medium and low) for
purposes of expenditure-based segmentation clustering is a method used to group members
together based on their natural similarity and makes no pre-determined selection in the number of
spending groups (Saayman Siabbert amp Saayman 2009) K-means clustering is a method of
clustering whereby the data is divided into K (number of clusters chosen by researcher) clusters
and assigns each item to a cluster based on distances that measures the closeness or similarity to
the mean value of the cluster (Kruger Saayman amp Saayman 20097)
c ANOVA analysis (Analysis of Variance)
An AN OVA (also referred to as an F-test) is closely related to the t-test These two analyses differ
mostly on the grounds that the t-test assesses the difference between the means of two groups
while the ANOVA on the other hand assesses the difference between the means of two or more
groups (Kruger 200911) For purposes of this study the analysis of variance (ANOVA) was used
to determine the differences in terms of socio-demographic and behavioural variables (as tested by
the questionnaire) between the identified expenditure clusters and to test whether these differences
were statistically significant
15 DEFINING CONCEPTS
The following concepts were used during the course of the study and therefore need clarification
151 Aardklop National Arts Festival
The Aardklop National Arts Festival is a South African arts festival held annually in Potchefstroom
in the North-West Province after a very successful debut in 1998 It is a cultural event that takes
place for 5 successive days at the end of September and hosts items in a variety of venues in and
around the town such as theatre dance music cabaret and visual arts A large craft market as
well as open-air performances also form part of this predominantly Afrikaans event (ANON 2008
Van Heerden 200311) According to the organisers Aardklop was initiated because of concern for
the arts and artists as well as to cater for the cultural needs in the northern part of South Africa
(ANON 2008 Van Heerden 200311 Kruger et al 20081) The main aim of the festival is
therefore to provide a quality platform for artists to promote the arts and to strive towards creating
new job opportunities Although Aardklop is a predominantly Afrikaans festival it readily
accommodates activities for other language groups as well (Kruger et al 20081)
11
152 FestivalArt festivals
The Oxford Concise Dictionary (2001 530) defines a festival as a day or a period set aside for
celebration or feasting an organised set of performances and special events Smith (1990128)
defines festivals as a celebration of a theme or a special event that takes place for a limited period
of time and invites the public to a once-off annual or less frequent happening More specifically an
arts festival can be defined as a community-themed event or celebration designed to showcase
different art forms and activities - along with the related tourism and hospitality experiences (Kruger
amp Petzer 2008113) Isar (1976131) explains that an arts festival is something exceptional
something out of the ordinary something that must create a special atmosphere which stems not
only from the quality of the art and the production but from the traditions of a region
153 Market segmentation
Consumers have different demands tastes behaviour patterns disposable income and spending
patterns therefore marketers cannot compete in an entire market from an economic point of view
(Foster amp Davis 1994132) Grouping consumers with similar needs and preferences together is
known as market segmentation (Middleton 199471) This is done since it is expected that
consumers in the same group (or segment) will react similarly to a particular offering (McDonald amp
Dunbar 199521) Dibb and Simkin (2001 609) point out that market segmentation is vital to
business success and is the universal remedy of modern marketing since a mass marketing
approach cannot be used to satisfy diverse customer needs Instead market segmentation takes
care of the element of diversity whereby customers with similar requirements and buying behaviour
are grouped into segments Identifying these segments assists in allocating limited resources to
serve the most appropriate customers Wedel and Kamakura (2002182) also argues that
whenever demand is heterogeneous it will be profitable to distinguish segments By grouping
tourists into different segments (within which visitors have similar characteristics and needs) it
allows for each segment to be reached with a specific marketing mix (McDonald amp Dunbar
199510)
16 CHAPTER CLASSIFICATION
The study is divided into four chapters The following provides a brief outline of what is presented in
each chapter
Chapter 1 Introduction and problem statement
Chapter 1 comprised a general introduction to the study the problem statement followed by the
research goal and objectives as well as the method of research Key concepts that are used in the
study are defined The aim of this chapter is to give an overview of the Aardklop National Arts
12
festival and the problem the festival organisers and marketers need to address The importance of
market segmentation for Aardklop is emphasised and two segmentation methods are identified that
will benefit Aardklop in the context of the identified problem
Chapter 2 Correspondence analysis of visitors to the Aardklop National Arts Festival
(Article 1)
Chapter two consists of Article 1 In this article correspondence analysis as a segmentation
method with age as the dependent variable is applied to visitors at the Aardklop National Arts
Festival With this method it is possible to comprehensively classify markets into profiles to
determine any changes in the needs or trends in order to maintain existing target markets This will
contribute to the sustainability and growth of the festival since improvements can be made with
regard to the festival program and marketing efforts
Chapter 3 Expenditure-based segmentation of visitors to the Aardklop National Arts
Festival (Article 2)
This chapter consists of Article 2 In this article expenditure-based segmentation is applied to
visitors at the Aardklop National Arts Festival With this method a comprehensive profile of the
target market with regard to visitor spending will be compiled and the most viable market financially
speaking will be identified in order for it to be penetrated further With fewer people spending more
at the festival the social and environmental impact remains minimal This will also contribute to the
sustainability of the festival since high spending target markets have a direct influence on the
extent of the economic impact
Chapter 4 Conclusions and recommendations
The final chapter draws conclusions based on the content of the first chapters Recommendations
with regard to different marketing strategies are made and the two market segmentation methods
that were used will assist the festival organisers and marketers with sustainable planning and
marketing practices This chapter is concluded with a summary highlighting the importance of
festival management through implementing continuous market segmentation by means of various
segmentation methods
13
CHAPTER 2 Correspondence analysis of visitors to the Aardklop National Arts Festival
21 INTRODUCTION
There are currently at least 211 annual festivals that take place across South Africa of which 28
focus on performing and visual arts or a combination thereof (Visser 2005165) as is the case of
the Aardklop National Arts Festival (hereafter referred to as Aardklop) This predominantly
Afrikaans cultural event is the third largest festival of its kind in South Africa and takes place
annually in the city of Potchefstroom The festival hosts approximately 85 productions by 390 artists
across a variety of genres such as theatre dance cabaret jazz rock literature childrens and
street theatre and visual arts (ANON 2008 Raath 2009 van Heerden 200311 Kruger Saayman
amp Saayman 200827) According to the organisers Aardklop was started out of concern for the arts
and artists as well as to cater for the cultural needs of the community in the northern part of South
Africa The main aim of the festival therefore is to provide a quality platform for artists to promote
the arts (ANON 2008 van Heerden 2003 11 Kruger et a 2008 1)
A growing problem in the events and festivals sector is competition that threatens the sustainability
of the event (Smith amp Jenner 199874) In South Africa competition in the festival market has
serious implications for most artscultural festivals such as declines in festival visitor numbers
ticket sales or combinations of both (Saayman amp Saayman 2006a40-41) However by identifying
festival visitors specific needs and motives for attending a festival (and possible changes in these
needs and motives) a festival productprogramme can be designed to satisfy these needs The
tailor-made programmes will encourage visitors to spend more money on ticketed
showsproductions and to attend the festival repeatedly Increased ticket sales result in increased
profits which ensure the sustainability of the festival (Koc amp Altinay 2007228 Pissoort 20072
Mok amp Iverson 2000304 Formica amp Uysal 199816) Therefore one of the best ways to secure
long-term growth of a festival is to understand the festival market enabling the development of a
sustainable marketing strategyprogramme so that a steady growth rate is maintained (Uys
200313)
14
Thus Aardklops organisersmarketers need to understand the needs behaviour and expectations
of current andor potential visitors by means of market segmentation in order to secure long-term
growth and sustainability The purpose of this article is to analyse the visitors to the Aardklop
National Arts Festival by means of correspondence analysis To achieve this the literature review
method of research listing of research results and conclusions will be presented below
22 LITERATURE REVIEW
In order to create retain and satisfy the needs of Aardklop festival visitors - seeking their
consumption (of ticketed showsproductions) as well as their loyalty by repeatedly visiting the
festival - the continuous process of market segmentation must be applied by grouping or
segmenting current andor potential visitors with very different needs motives behaviours ages
income levels family sizes etcetera (Koc amp Altinay 2007228 van Zyl 200585) Market
segmentation recognises the differences and changes in the lifestyles desires tastes and
motivations of visitors to a festival and divides the present and potential market into homogenous
groupssegments based on meaningful characteristics since it is expected that consumers in the
same segment will react similarly to a particular offering (Lamb Hair amp McDaniel 2000213
Mcintosh amp Goeldner 1990407 McDonald amp Dunbar 199521) Segmentation therefore assists to
pinpOint the target market in order to better understand their needs since changes in trends and
visitor preferences can be detected Pinpointing the target market will assist festival marketers and
organisers in adjusting the programme accordingly such subsequent customisation has recently
become very effective for the maintenance of existing markets (Saayman 2006 114 Perreault amp
McCarthy 1999239 Wedel amp Kamakura 2002181) When needs and expectations are met or
exceeded consumer satisfaction will increase which is pivotal for establishing a long-term
consumer relationship and ensuring repeat business higher usage and increasing the probability of
the consumer recommending the service to someone else More satisfied consumers are also less
prone to consider product offerings from competition (Lee Lee Lee amp Babin 200858)
A large selection of possible methods can be used to do comprehensive market segmentation
These include cluster analysis regression analysis Automatic Interaction (AID) analysis latent
class analysis judgment based segmentation factor and component analysis expenditure-based
segmentation as well as correspondence analysis (Slabbert 200240) Correspondence analysis is
often used to implement market segmentation especially in tourism marketing literature (Beldona
Morrison amp OLeary 2005564 Gursoy amp Chen 2000585) Examples of such literature include the
following studies
15
bull Arimond and Elfessi (2001) firstly used correspondence analysis to spatially map desirable
attributes of a bed and breakfast facility and then cluster analysis to identify market segments
bull Beldona et al (2005) examined purchase motives of pleasure travel components of low and
high complexity in a web environment
bull Calantone Benedetto Hakam and BOjanic (1989) researched tourists perceptions of
Singapore and other Pacific Rim countries
bull Chen (2000) researched cross-cultural differences in travel information acquisition among
tourists from three Pacific-Rim countries
bull Chen (2001) also researched Korean outbound travellers destination images
bull Chen and Gursoy (2000) researched a cross-cultural comparison of the information sources
used by first-time and repeat travellers of German British and French travellers to the US as
well as
bull a competitive analysis of cross cultural information search behaviour of German British and
French travellers to the US (Gursoy amp Chen 2000)
bull Cheung (1994) explored principal component analysis and correspondence analysis as
methods for the multi-criteria decision making problem
bull Kara Kaynak and Kucukemiroglu (1996) used correspondence analYSis to position fast-food
outlets in two regions of North America
bull Kaynak Kucukemiroglu and Kara (1994) explored consumers perceptions of intemational
airlines
bull Malhotra and Bartels (2002) considered correspondence analysis as an approach to minimise
the attribute pre-specification bias in international marketing management and
bull Shanka and Taylor (2004) explored sources of information used by festival visitors to the
Spoleto festival in Italy
Correspondence analysis is therefore not only a much used market segmentation method but is
also implemented across a variety of tourism-related topics However correspondence analysis
research based on festivals is extremely limited and market segmentation still needs to be
implemented on a large scale by these means in the eventsfestival sector
The application of correspondence analysis can be based on a variety of variables such as age
sources of information used gender and so forth thereby making it a flexible exploratory research
method Tourism literature is saturated with research studies that segment markets by means of a
variety of segmentation variables depending on the purpose of the study (Formica amp Uysal 1998
Burke amp Resnick 2000 and Dolnicar Crouch Devinney Huybers Louviere amp Oppewal 2008)
These segmentation variables can be categorised into various bases such as (Slabbert 20022
16
Burke amp Resnick 200041 Lubbe 200077 George 2004126 Kotler amp Armstrong 2004240
Lamb Hair McDaniel Boshoff amp Terblanche 2004168 Saayman van der Merwe amp Pienaar
2008 Formica amp Uysal 1998 17)
bull geographic (eg region country city suburb climate and transport)
bull socia-demographic (eg gender age occupation and family life-cycle)
bull psychographic (eg social class lifestyle andor personality characteristics) and
bull behavioural (eg loyalty attitudes length of stay travel group size accommodation
preferences benefits sought by travellers and travel motivations)
Demographic segmentation is a popular method in market segmentation because consumer needs
and wants are usually influenced by demographic variables and these variables are generally
easier to measure than most other variables (Bowen 1998289) According to Holbrook and
Schindler (199627) one specific socia-demographic variable that marketers have used
successfully is segmentation based on age The purpose of segmentation by means of age is to
divide the market into specific age categories in order to determine the characteristic differences of
each category However results of studies where age was used as segmentation variable can be
inconsistent (Horneman Carter Wei amp Ruys 200223) due to changes in market trends and in the
needs and preferences of the consumers For this purpose it should be noted that the results of
age-segmentation studies are bound to change constantly and should be applied on a continuous
basis in order to monitor these changes in the market Various studies of which the results revealed
differences in the characteristics of older as opposed to younger consumers are captured in Table
21 below
Table 21 Characteristics distinguishing older consumers from younger consumers
CHcIRACTERISTIC bull bull - AUTHORS
Recreationleisure Older consumers go bowling more Hisrich and Peters (1974) 88
activities often than younger consumers quoted by Holbrook and Shindler (199627)
Travellers over the age of 50 prefer Anderson and Langmeyer non-hectic pre-planned pleasure (1982) as quoted by trips Homeman at a (200223) Travellers over age 55 are more Javalgi Thomas and Rao likely to cruise tour visit friends and (1992) as quoted by relatives leas likely to visit cities Homeman at 8 (200224) resorts and theme parks Older festival visitors (over 30 years Younger festival visitors (younger Formica and Uysal (199822) of age) to Spoleto Festival than 30 years) to Spoieto Festival (International cultural-historical are less inclined to socialise and festival) in Italy seek socialisation interact with other visitors and Interaction with other festival visitors Respondents (in 12 states of the USA) with children under 18 years of age Hsu Kang and Wolfe were more likely to attend fairs and festivals in the USA (200212) European cultural market consists of European cuitural market consists Richards (2001 40) 26 vIsitors over the age of 50 of 35 visitors under the age of 30 years
17
Madiumsof communication inform ation
lifestyle
Expendituresllncome
Travel behaviour
us festival visitors are more likely to be under 50 years of age Older consumers process consumer information slowly I less accurately
Older consumers read magazine advertisements with less youthful models (cigarette advertisements)
Age group 45-54years depends on Young age group (18-25 years) television and age group 55+ depends on word-of-mouth as depends on newspapers as a source of festival information source of festival information (Swan (Swan Valley Wine Festival in Valley Wine Festival in Australia) Australia) Older consumers tend to aim more towards a more sedatedignified lifestyle
Young bachelors spend more on away-from-home entertainment (concerls movies bars dancing)
Young singles spend more on clothing than married or older adults
Older consumers (Japanese outbound pleasure travellers Tsltsikamma National Par1 visitors) are associated with higher spending Older consumers show more diligent shopping behaviour
Younger consumers (TahNanese tourists to Guam and leisure expenditures In US) are associated with higher spending
Older and middle-aged festival Younger festival visitors (less than visitors to the Spoleto Festival earn 30 years) to Spoleto Festival earn a higher income lower income Overall purchasing involvement is higher among adults with children than younger or older adults without children
Young and agad visitors (US visitors to Hawaii) average daily expenshyditure is significantly less than the visitors in the in-between age groups Older visitors spend more than younger visitors at festivals (jazz and arts festivals)
Younger and middle-aged natureshybased tourists are likely to be high spenders
Senior travellers travel longer distances and stay away longer than any other age group
Older senior (65+ years) natureshybased travelers in North Carolina South Carolina and Georgia were more likely to stay at their destination longer spend more time planning In advance for their trip and visit friends and relatives than younger senior travellers (55-04)
Out-of-region visitors to an international Jazz festival in Italy (Umbria region) were younger
Middle-aged and older visitors to the Younger age group (less than 30 Spoleto Festival are mostly married years) are mostly singles but
prefer to visit the Spoleto Festival with partners
Young and aged visitors (US visitors to HawaII) stay much longer than the visitors in the in-between age groups
Ba~anBa~anUysal and Sunshine (199521) Cole and Gaeth (1990) as quoted by Holbrook and Shindler (199627) Mazis Ringold Perry and Denman (1992) as quoted by Holbrook and Shindler (199627) Shanka and Taylor (200458)
Morgan and Levy (1993) as quoted by Holbrook and Shindler (199627) Schanlnger and Danko (1993) as quoted by Holbrook and Shindler (199627) Wagner and Hanns (1983) as quoted by Holbrook and Shindler (199627-28) Jang Bai Hong and OLeary (2004331) Kruger Saayman and Saayman (2009) Jang Ismail and Ham (200283) Zeithaml (1985) as quoted by Holbrook and Shindler (199627) Dardis Soberon-Ferrer and Patro (1994315) Mok and Iverson (2000302)
Formica and Uysal (199822)
Slama and Tashchian (1985) as quoted by Holbrook and Shindler (199628) Mak Moncur and Yonamlne (19776) Saayman and Saayman (2006b217) and Thrane (2002284) Mehmetoglu (2007213) and Pouta Neuvonen and Sievanen (2006131) Shoemaker (1989) Blazey (1991) and Pearce (1999) as quoted by Homeman at a (200223) Ba~anBa~anand
Silverberg (1999) as quoted by Horneman at a (200224)
Formica and Uysal (199817)
Formica and Uysal (199822)
Mak at a (19776)
18
Travel motivations Older people to Com Festival in South Carolina tend to place more importance on the event novelty than other age groups Age 28 to 47 (middle age groups) are more interested in content of FICA (International Festival of Environmental Film and VIdeo in Brazil) festival programme than the younger age group (18- 7 yeara) Over age 50 travellers take pleasure trips for rest I relaxation and for visiting relatives Festival enthusiasts (thirsty for culture and attracted to Spoleto Festival because of cultural experiences such as ballets operas theatre plays) were middle-aged and older (over 30 years of age)
Escaping from routine as motivation in attending FICA festival is more prevalent in relatively young visitors (below age 37) than in older visitors (age 38shy47)
Festival moderates (interested in festival but to lesser extent than the enthusiasts) to Spoleto Festival were younger (under 30 years of age)
Uysal Gahan and Martin (19938)
Kim Borges and Chon (2006961)
Anderson and Langmeyer (1982) as quoted by Homeman et 8 (200223) Formica and Uysal (199822)
In Table 21 above it is clear that previous research findings reveal definite characteristic
differences between older and younger (and in some instances middle-aged) visitorstourists Age
has therefore proved to be a pertinent demographic segmentation variable and more specifically a
significant segmentation variable in research relating to festivals In general it is evident that
middle-aged and older visitorstourists are more likely to attend festivals if they have children they
make use of writtenvisual information mediums they tend to be higher spenders (and income
generators) they are greater cultural enthusiasts and they travel for longer periods of time
Younger visitorstourists seem to be more associated with word-of-mouth as an information
medium they are higher spenders in only specific activitiesentertainment have lower incomes
and are to a lesser extent cultural enthusiasts
Therefore segmenting the visitors to Aardklop by means of correspondence analysis on the bases
of age as a demographic variable can help festival organisers to gain a better understanding of the
current market Knowledgeable and informed organisers can then adjust the festival programme
according to the needs motives and behaviours of these visitors identified segments as well as
develop appropriate and effective marketing strategies This will ensure the sustainability growth
continuity and success of the Aardklop festival
23 METHOD OF RESEARCH
The Institute of Tourism and Leisure Studies at the North-West University (Potchefstroom Campus)
has conducted surveys at the Aardklop National Arts Festival since 2001 by means of structured
questionnaires From 2005 to 2008 a total of 1671 questionnaires were completed by visitors to the
festival and the data from these surveys were used for the purpose of this study since the general
characteristics of the population remained similar over the four years The method of research will
19
be discussed with reference to (i) the questionnaire (ii) the samples and (iii) the method of market
segmentation
231 The questionnaire
The survey questionnaire used for the visitors to Aardklop remained similar throughout the four
year data collection period This questionnaire was also similar to previous questionnaires used at
other festivals in South Africa such as the Klein Karoo (Slabbert Saayman Saayman amp Viviers
2008) and Grahamstown National Arts Festivals (Viviers Siabbert Saayman amp Saayman 2008)
The questionnaire was divided into three sections and consisted mainly of closed questions (see
Appendix A) Section one included questions based on the socio-demographics of the visitor (such
as gender age language occupation and province of origin) followed by questions based on
behavioural elements (such as travel group size days spent at the festival productionsgenres
attended number of persons financially responsible for and spending) in section two In section
three more general behavioural questions were also asked such as the means through which
information regarding the festival was communicated (for example magazines newspapers and
newsletter)
232 The samples
The surveys were conducted annually during the festival in Potchefstroom by means of
convenience sampling Cooper and Emory (1995207) as well as Krejcie and Morgan (1970608)
point out that in any defined population for a population of 100 000 (N) the recommended sample
size (S) is 384 Table 22 below indicates that Aardklop has had a 4 year average of below 51 500
attendants With an average of 418 questionnaires per year over the four consecutive year period
the sample size is appropriate for this research
Table 22 Survey summary
Year Number of Number of Absolute number questionnaires questionnaires of visitors
distributed included in the data analysis
2005 420 407 36766
2006 420 413 61476
2007 24 Sep - 29 Sep 400 357 51870
2008 30 Sep -4 Oct 500 494 55518
TOTAL 1740 1671 205630 435 418 51408
Source Kruger et al (2008227) Saayman and Saayman (2007226) Saayman and Saayman (2006a837) Saayman and Saayman (2005945)
20
The survey was conducted by means of a self-administered questionnaire among adult visitors at
the festival These respondents were briefed about the purpose of the research and were willing
participants In order to limit response bias towards a certain group of festival attendants
questionnaires were distributed on-site but at different locations such as in the areasvenues of
shows and productions in the areas of closed streets where attendants gather between shows and
on the main festival grounds Field workers from the North-West University were trained to
administer the surveys and to understand the purpose of the study and the questionnaire in order
to assist respondents where necessary (but without interfering with the completion of the
questionnaire)
233 The method
The data was analysed using SPSS (Statistical Package for the Social Sciences) and Statistica
Correspondence analysis (CORA) sometimes called dual scaling is an exploratory technique for
analysing multi-way frequency tables Multi-way frequency tables are cross-classifications of two or
more categorical variables (Bartholomew Steele Moustaki amp Galbraith 200281 Calantone et a
198926) CORA transforms these tables consisting of numerical information (categorical data
frequencies) into a graphical display within a low-dimensional space This makes it easier to identify
the key features of the data when interpreting the information (Shanka amp Taylor 200457
Bartholomew et a 200281) The joint graphical display can help detect structural relationships or
associations between these categorical variables (row categories and column categories) (Hoffman
amp Franke 1986215) whereby respondents choosing the same category are plotted close to each
other and respondents choosing different categories are plotted as far apart as possible (Arrimond
Achenreiner amp Elfessi 200332) In other words the proximity between a pair of points is used to
interpret the underlying relationship between the points Closely aligned points reveal a strong
relationship (Chen 2001 346)
The most important feature of CORA is its multivariate nature that enables multivariate treatment of
multiple categorical data simultaneously (Gursoy amp Chen 2000585) The application of CORA is
therefore an effective segmentation tool since it allows for effective interpretation of the data in
order to identify and compare different segments in a market This method is applied in this
research where a demographic variable namely age (of the festival attendee) is the dependent
variable Age was categorised into six groups where 1 = under 18 years 2 = 18-25 years 3 = 26shy
35 years 4 = 36-45 years 5 = 46-60 years and 6 = older than 60 years These age categories of
respondents were corresponded with the showsproductions attended mediums through which
respondents heard about the festival number of people for whom the respondent is financially
21
responsible spending categories number of days attended the festival and province of origin The
results of the correspondence analysis will be discussed in the next section
234 Results
The empirical results are presented in two divisions namely (1) the general profile of the
respondent population to Aardklop over the period of four consecutive years (2005-2008) and (2)
the cross-tabulations and their accompanying correspondence biplots of the corresponded
variables with the age categories of respondents
2341 General profile of festival respondents
The general profile of the respondents to Aardklop (Table 23) reveals that the majority (55) were
females were 46-60 years of age (28) spoke Afrikaans (94) came from the Gauteng (43)
and North-West (35) provinces were either in professional occupations (28) or students (17)
resided with family and friends (23) during the course of the festival or were local (22) attended
drama productions (55) or rock shows (28) and identified word of mouth (53) and television
(49) as the mediums through which they heard about the festival The profile further reveals the
travel group size to be 3 persons the respondent to be financially responsible for 2 persons the
length of stay to be 2 days and the spending per person to be R96844 Respondents previously
attended Aardklop 4 times 70 confirmed that the festival was their main reason for visiting
Potchefstroom and 95 indicated that they would attend the festival again It is therefore apparent
that the festival visitors are predominantly students and professional people are either local or from
Gauteng regularly attend Aardklop and mostly prefer drama productions
Table 23 Festival respondent profile
CATEGORY VARIABLE VARIABLE HQm2 Ignguag~
Male 743 446 Afrikaans 1568 941 Female 922 554 English 84 50
il Other 14 08
AIm OccultiQn Under 18 46 28 Professional 464 281 18-25 403 243 Management 141 85 26-35 263 159 Administrative 119 72 36-45 361 21 8 Technical 45 27 46-60 461 278 Sales 47 28 60+ 125 75 Farmer 24 15
Mining 22 13
~
~ Civil service 35 21 NorthWest 581 351 Self-employed 114 69Gauteng 703 425 Student 284 172 Mpumalanga 66 40 Unemployed 9 05 Free State 136 82 Housewife 110 67Eastemcape 14 08 Pensioner 101 61WestemCape 46 28 Other 136 82Northern cape 15 09
KwaZulu-Natal 35 21 Umpopo 51 31 Outside RSA 9 05
22
297 67 65 150 53
494 413 170 58 40
275 373 531 55
Number of people financially responsible for Number of days Number of visits to Aardklop Spending per person
VARIABLE
Festival is main reason for visit to Potchefstroom Visit Aardklop again
34 Persons 24 Persons 23 Days 40 Times R96844
702 946
2342 Cross-tabulations and accompanying correspondence biplots
The cross-tabulations and their accompanying correspondence biplots of each independent
variable (showsproductions attended mediums through which respondents heard about the
festival number of people the respondent is financially responsible for spending categories
number of days attended the festival and province of origin) corresponded with the respondent age
categories are individually discussed below
Showsproductions attended
Table 24 shows the profile of each age category for the corresponding showsproductions
attended A significant chi-square value was reported for the age-showproduction relationship The
value for Table 24 was x2(45)=618 pltO049
Table 24 Age category by showsproductions attended
SHOW I PRODUCTIONSAGE CATEGORY
ORA I DAN I WampP CHI LEG JWmiddot=eImiddotmiddotUr1= IWIIMii 1 (Under 18) 09 02 0100 02 00 03 04 03 03 03 29 2 (18-25) 61 19 09 08 05 20 18 11 34 36 221 3 (26-35) 48 15 09 08 06 17 17 09 31 22 183 4 (36-45) 64 23 13 10 08 17 17 13 31 35 231 5 (46-60) 76 20 12 08 05 28 25 12 50 34 269 6 (60+) 19 05 05degA 01 02 06 08 03 10 10 67 TOTAL 277 83 48 38 27 91 88 51 158 139 1000
Note ORA = drama DAN = dance theatre WampP = word art amp poetry CHI = childrens theatre LEC = lectures amp discussions VIS = visual art amp exhibitions CLAS = classical music CHO = choirs CAB = cabaret ROC = rock
AccommQdatiQn Local Family and Friends Guesthouse or 8amp8 Hotel Camping House Rental Day visitor Other
Shows l e~ugjQlsect Drama Dance theatre Word art amp poetry Childrens theatre Lectures amp discussions VISual art amp exhibitions ClaSSical music Choirs Cabaret Rock
VARIABLE
Group size
352 218 371 229 196 121 15 09
109 67 52 32
311 192 212 131
912 546 273 163 157 94 124 74 88 53
301 180 291 174 168 101 521 31 460 2752
Attend5n~ Qf Qther festivals over the [last three vears KKNK Grahamstown Volksblad Innibos Other
Mediums Television Radio Aardklop website Aardklop e-mail M-Web newsletter Magazines Newspapers Word of mouth Other
496 112 108 251 89
825 690 284 97 67
459 624 887 92
23
Figure 21 is the biplot for the cross-tabulation of age category by showsproductions attended
which reveals the relationships between the row (age categories) and column (showsproductions)
based on the proximities of the row and column points The biplot indicates that the older age
groups (46-60 years and over 60s) are more likely to attend cabaret shows visual art and
exhibitions as well as classical music On the other hand the younger generation (ages 18-25)
seemed to be more attracted to rock shows and word art and poetry The results suggest that
visitors in age group 4 (36-45 years) were more likely to attend dance theatre productions and
lectures and discussions It can be seen that drama is not related to a specific age group and is
therefore a genre generally attended by all aged visitors
- 05 lt1gt l J 1
04 (II lt1gt gt c 03 c shylt1gt- CHO
J1 shy2gt 0 02 w~ - r- 01NC) cj-OC) 00
Cii --shycr- -01 LEC lt1gt v EltD _ 0 -02 Cl~
-03 -025 -020 -015 -010 -0 05 000 005 010 015
Dimension 1 Eigenvalue 00786 (41 72 of Inertia)
Figure 21 Sipot of age category and shows productions attended
Note ORA =drama DAN =dance theatre WampP =word art amp poetry CHI =childrens theatre LEC = lectures amp discussions VIS = visual art amp exhibitions CLAS = classical music CHO = choirs CAB = cabaret ROC = rock
Mediums through which respondents heard about Aardklop
Table 25 shows the profile of each age category for the corresponding mediums through which
respondents heard about Aardklop A significant chi-square value was reported for the age-medium
relationship The value for Table 25 was x2(35)=591 plt0007
Tabe 25 Age category by mediums
MEDIUMSAGE CATEGORY
TV I RAD WEB I EM NL MAG NP I WOM I TOTAL
1 (Under 18) 2 (18-25) 3 (26-35) 4 (36-45) 5 (46-60) 6 (60+) TOTAL
07 47 37 50 53 13
206
06 37 37 38 43 11
173
04 17 13 17 19 04 76
02 06 05 06 07 02 27
01 04 03 04 04 01 17
06 24 21 26 32 06
116
07 37 29 37 41 10
161
08 61 40 50 52 12
224
42 234 185 228 251
59 1000
Note TV =television RAD =radio WEB = Aardklop website EM = Aardklop e-mail NL =M-Web newsletter MAG = magazines NP = newspapers WOM = word of mouth
24
Figure 22 is the biplot for the cross-tabulation of age category by mediums which reveal the
relationships between the row (age categories) and column (mediums) based on the proximities of
the row and column points The biplot indicates that age groups 2 and 3 (ages 18 to 35) were more
likely to rely on word of mouth The 46-60 year old respondents were more likely to hear about
Aardklop by means of written mediums such as magazines newspapers Aardklop e-mail and Mshy
Web newsletter It would also seem that the age group older than 60 also relies on the same
mediums as the 46-60 year olds The under 18s are separated from other age groups and the
Aardklop website is separated from other mediums
02 18
N
bull co
~ 01t 10 ~ gt ~o 00 ill I0
N CCi I -01 0 ~ ~ WEB Q) -02E is
-03 -02 -01 00 01 02 03
Dimension 1 Eigenvalue 00994 (6558 of Inertia)
Figure 22 Siplot of age category and mediums through which respondents heard about Aardklop
Note TV = television RAD = radio WEB =Aardklop website EM =Aardklop e-mail NL =M-Web newsletter MAG = magazines NP =newspapers WOM =word of mouth
Number ofpeople financially responsible for
Table 26 shows the profile of each age category for the corresponding number of people for whom
the respondent is financially responsible A significant chi-square value was reported for the ageshy
number of people financially responsible for relationship The value for Table 26 was x2(25)=3436
plt0001
Table 26 Age category by number ofpeople financially responsible for
NUMBER OF PEOPLE FINANCIALLY RESPONSIBLE FORAGE CATEGORY
1 PERSON 2 PPL i 3 PPL I 4 PPL I 5 PPL 6 PPL I TOTAL
1 (Under 18) 21 01 01 01 00 01 25 2 (18-25) 138 60 15 11 04 06 234 3 (26-35) 36 75 15 18 06 08 159 4 (36-45) 34 55 37 54 17 23 220 5 (46-60) 78 110010 35 41 13 10 286 6 (60+) 23 40 04 06 01 01 76 TOTAL 330 341 108 131 42 49 1000
Note PPL =people
25
Figure 23 is the biplot for the cross-tabulation of age category by number of people financially
responsible for which reveals the relationships between the row (age categories) and column
(number of people) based on the proximities of the row and column points The results suggest that
the respondents aged 18-25 only pay for themselves (1 person) at the festival The age groups that
appeared to be financially responsible for 2 people included the 26-35 year olds the over 60s
group and - because of the relatively low inertia of dimension 2 (2339) - the 46 to 60 year olds
could also be considered to carry financial responsibility for 2 people The 36-45 year old age
group on the other hand were more likely to be responsible for 3 to 6 people which probably
represent a family
0 7 en () 0 6 Ii
bull~ 0 5
~ 0 4 0 Ii) 0 3 ~
i 0 2 iii ~l Q) 0 1
~ poundc 0 0 Q)
-0 1 $ 0
-0 2 N c -03011
-04
~ -0 5 0
-06 -12 -10 -0 8 -0 6 -04 -02 00 0 2 04 06 08
Dimension 1 Eigenvalue 16338 (7499 of Inertia)
Figure 23 Siplot of age category and number ofpeople financially responsible for
Note PPL =people
Spending categories
Table 27 shows the profile of each age category for the corresponding spending categories A
significant chi-square value was reported for the age-spending relationship The value for Table 27
was x2(20)=647 plt0001
Table 27 Age category by spending category
SPENDING CATEGORY AGE CATEGORY
Spend 1 I Spend 2 I Spend 3 I Spend 4 Spend 5 I Total
1 (Under 18) 08 10 02 02 01 24 2 (18-25) 48 59 56 42 29 233 3 (26-35) 33 25 34 37 30 158 4 (36-45) 48 42 39 42 48 21 8 5 (46-60) 48 48 55 61 76 289 6 (60+) 13 17 14 14 18 77 TOTAL 198 201 201 198 202 1000
Note Spend 1 = under R240 Spend 2 = R240-R479 Spend 3 = R480-R829 Spend 4 = R830-R1449 Spend 5 = R1450+ These Rand-values reflect expenditure per person (deflated with consumer price index for 4 years data)
26
Figure 24 is the biplot for the cross-tabulation of age category by spending category which reveals
the relationships between the row (age categories) and column (spending categories) based on the
proximities of the row and column points Age group 5 (ages 46-60) appeared to be the spenders
as the results suggest that they are closely related to spending categories 4 and 5 (R830 and
more) Slightly younger visitors (age group 26 to 35 years) appeared to be spending between R480
and R1449 per person (spending category 3 and 4) The 18-25 year age group were the lowest
spenders as revealed by the close proximity (1823 inertia of dimension 2) of this age group to
spending categories 1 and 2 (below R480) The under 18s are separated from other age groups
probably because they are likely to be non-earning dependants
04 bull
Q)~ 0 3 ai ~ Ec _ 02 Q) 0
middotwQl - 0 1 C) - NN c IX) 00 r---~------------~-------+------~----+---~~~~----~ oCmiddotiii c -01 ~
ci -02 ~~~~~--~----~--~--~--~--~~~~--~--~------~
-09 -08 -07 -0 6 -0 5 -04 -03 -02 -01 00 01 0 2 0 3 04
Dimension 1 Eigenvalue 03142 (7454 of Inertia)
Figure 24 Siplot of age category and spending category
Note Spend 1 = under R240 Spend 2 = R240-R479 Spend 3 = R480-R829 Spend 4 = R830-R1449 Spend 5 = R1450+ These Rand-values reflect expenditure per person (deflated with consumer price index for 4 years data)
Number of days attended the festival
Table 28 shows the profile of each age category for the corresponding number of days the
respondent attended the festival A significant chi-square value was reported for the relationship
age - number ofdays The value for Table 28 was x2(15)=821 plt0001
Table 28 Age category by number of days attended the festival
I
AGE CATEGORY NUMBER OF DAYS
1 DAY 2-3 DAYS I 4-5 DAYS 6 DAYS I TOTAL
1 (Under 18) 2 (18-25) 3 (26-35) 4 (36-45) 5 (46-60) 6 (60+) TOTAL
06 25 41 51 60 16
199
07 83 71 87 126 23
397
12 105 36 66 76 33
327
02 28 09 15 18 04 77
28 242 157 21 8 281 76
1000
27
Figure 25 is the biplot for the cross-tabulation of age category by number of days attended the
festival revealing the relationships between the row (age categories) and column (number of days)
based on the proximities of the row and column pOints The biplot indicates that age group 2 (ages
18-25) was more likely to attend the festival for 4 days and longer The 36-60 year olds (age groups
4 and 5) seemed to stay for shorter periods of between 2 and 3 days Age group 3 (26-35 years)
appeared to attend the festival for only 1 day Due to the low inertia of dimension 2 the results
suggest that the under 18s and over 60s also attend the festival for 4-5 days
03 15
sect ~
cti 02 ~
~ 01 ~ ~i- 0 0
j N
-01
ll -0 2
-04 -0 3 -0 2 -0 1 00 0 1 0 2 0 3 0 4
Dimension 1 Eigenvalue 04295 (85 22 of Inertia)
Figure 25 Siplot of age category and number of days attended the festival
Province
Table 29 shows the profile of each age category for the corresponding province of origin A
significant chi-square value was reported for the age-province relationship The value for Table 29
was x2(45)=823 plt0001
Table 29 Age category by province of origin
AGE CATEGORY PROVINCE
NW I GAU I MPL FS I EC WC I NC I KZN i LIM INT I TOTAL
1 (Under 18) 13 1000 01 01 00 00 00 01 01 00 27 2 (18-25) 101 95 07 15 04 12 01 00 06 02 243 3 (26-35) 58 64 09 18 02 04 01 02 02 01 159 4 (36-45) 70 95 06 19 01 04 03 09 08 01 216 5 (46-60) 75 136 15 22 02 07 03 07 09 02 278 6 (60+) 34 24 03 07 00 01 01 02 04 00 76 TOTAL 351 424 40 82 09 28 09 21 30 05 1000
Note NW = North West GAU =Gauteng MPL = Mpumalanga FS =Free State EC = Eastern Cape WC = Western Cape NC =Northern Cape KZN =KwaZulu-Natal LIM =Limpopo INT =International origin
28
Figure 26 is the biplot for the cross-tabulation of age category by province of origin which reveals
the relationships between the row (age categories) and column (provinces) based on the
proximities of the row and column points It would seem that according to the results visitors from
the Gauteng Mpumalanga and Free State provinces are more likely to be in age groups 4 and 5
(36-60 years) It appears that visitors from the Limpopo province are also likely to be between the
ages of 36 to 45 The results further suggest that the locals (North West province) are more likely to
be between the ages of 18 and 25 years and probably represent the prominent student market in
Potchefstroom
0 4~~~~--~---r------~------~--~~------~------~
Qj ro 03 2t WC ~ ~ 02 e shy~ 0 01 Wshy- N 00 middot Nltt eOO -012 N wshy t-C e shyQ)N -02 Eltt- shy -03Cl~
-04 L-~__---L__~__---__~_______L-__~--_____---_____I
-06 -04 -02 00 02 04 06 08
Dimension 1 Eigenvalue 02647 (5294 of Inertia)
Figure 26 Siplot of age category and province of origin
Note NW =North West GAU =Gauteng MPL =Mpumalanga FS =Free State EC =Eastern Cape WC =Western Cape NC =Northern Cape KZN =KwaZulu-Natal LIM =Limpopo INT =International origin
A layout of the results in a summarised format is captured in Table 210 below
Table 210 Summary of the age categories by variables
AGE CATEGORY VARIABLE
Age 1 (Under 18)
Age 2 (18middot25)
I I
Age 3 (26middot35)
Age 4 (36middot45)
I Age 5 (46-60)
I
I Age 6 (60+)
Shows I Dance theatre Classic Classic
productions Rock Word art amp poetry
Lectures amp discussions
Cabaret Visual arts amp
Cabaret Visual arts amp
exhibitions exhibitions
Mediums
Word of mouth Word of mouth
Magazines Newspapers M-web newsletter Aardklop e-mail
Magazines Newspapers M-web newsletter Aardklop e-mail
Financial res onsibility
1 person 2 people 3-6 people 2 people 2 people
Sending Spend 1 amp2 Spend3amp4 Spend 4 amp5
Days 4-5 days 4+ days 1 day 2-3 days 2-3 days 4-5 days
Province Mpumalanga Mpumalanga
NorthWest Gauteng Free State
Gauleng Free State
Umpopo
29
24 FINDINGS AND IMPLICATIONS
The results of the analysis confirm the existence of significant differences in socio-demographic
and behavioural variablescharacteristics between different age groups of visitors to Aardklop
National Arts Festival Based on the results the following findings were revealed
bull Very few festival visitors are older than 60 (75) as opposed to 925 being younger than 60
This finding is in part confirmed by Backman et al (199521) who revealed that festival visitors
are more likely to be under 50 years of age
bull The age groups 46-60 and older than 60 were more likely to hear about Aardklop in written
media such as magazines newspapers the M-Web newsletter and Aardklop e-mail Younger
visitors aged 18-35 (age categories 2 and 3) relied more on word of mouth as a means through
which they heard about Aardklop This research finding partially supports the findings of
Shanka and Taylor (200458) who indicated that young visitors (18-25 years) depend on word
of mouth whereas the age group 55 and over depend on newspapers as a source of
information They also indicated that the age group 45-54 depends on television as a medium
however this does not seem to be the case with visitors to the Aardklop festival
bull Older visitors (aged 46-60) seemed to be associated with the two highest spending categories
at the festival (respectively R830-R1449 and R1450+) This result confirms research by
Formica and Uysal (199822) Jang et al (2004) Saayman and Saayman (2006b217) Thrane
(2002284) Kruger et al (2009) as well as Jang et al (200283) who have found that older
aged (and in some cases middle-aged) festival visitors pleasure travellers and consumers
earning higher incomes are associated with higher spending and show more diligent spending
(shopping) behaviour
bull Younger visitors (aged 18-25) spend the least as indicated by spending categories 1 and 2
(respectively under R240 and R240-R479) This could be consistent with findings of Formica
and Uysal (199822) who indicated that festival visitors younger than 30 earn a lower income
which may result in lower spending However the findings are inconsistent with research by
Dardis et al (1994315) Mehmetoglu (2007213) Pouta et al (2006131) and Mok and Iverson
(2000302) who found that younger aged leisure and nature-based consumers (and in some
cases middle-aged consumers) are associated with higher spending
bull Visitors aged 18-25 years were more likely to attend rock showsconcerts This confirms
research findings by Schaninger and Danko (1993) (as cited in Holbrook and Shindler
(199627) who indicated that young consumers (bachelors) are high spenders at entertainment
events such as concerts
30
bull Visitors in age category 4 (36-45 years) were more likely to attend productionsshows such as
dance theatre and lectures and discussions while age categories 5-6 (46 years and older) were
more associated with attending showsproductions such as classical music cabaret and visual
art and exhibitions These findings are to some extent supported by research by Formica and
Uysal (199822) who found that middle-aged and older festival visitors enjoy cultural
experiences such as ballets operas and theatre plays
bull Festival visitors in age categories 3 4 and 5 (ages 26-60) stay for shorter periods of time (1-3
days) The very young and very old age groups (younger than 25 and older than 60) appear to
stay for longer periods of time The latter is partially confirmed by researchers Shoemaker
(1989) Blazey (1991) Pearce (1999) and Backman et al (1999) (as quoted by Horneman et
al (200223raquo who found that senior travellers stay away (or stay at their destinations) for
longer Research by Mak et al (19776) made similar findings pointing out that young and aged
visitors stayed much longer than the visitors in the in-between age groups
bull Locals (visitors in the region of Potchefstroom) or visitors who come from the North West
province were likely to be younger (between the ages of 18 and 25) This contradicts the
research conclusions of Formica and Uysal (199817) who found that out-of-region festival
visitors were younger
These findings suggest some important implications for and challenges to the marketersorganisers
of the Aardklop National Arts
bull The results emphasise that the majority (925) of visitors to Aardklop National Arts Festival
are younger than 60 The largest age categories namely 46-60 year olds and 18-25 year olds
respectively account for 278 and 243 of the respondents Marketing strategies should
therefore focus predominantly on these visitors since they represent a prominent portion of the
total population Implications for targeting these visitors follow below
bull The 46-60 year olds (age category 5) are the highest spenders and enjoy showsproductions
such as classical music cabaret and visual arts and exhibitions These types of
showsproductions along with drama (which is likely to be attended by most age groups (as
indicated in Figure 21) and accounts for 546 of the genres attended by the entire
population) could be used in promotions and in marketing communication efforts These
marketing communication efforts should specifically include written media such as magazines
newspapers Aardklop e-mail and the M-web newsletter Marketing efforts that utilise local
newspapers in the Gauteng and Free State provinces as a medium of communication could
prove to be effective since Gauteng and Free State visitors are the largest and third largest
markets respectively and are also the provinces associated with this age group Two to three
31
day packages including a variety of showsproductions (but primarily including the aforeshy
mentioned genres) could prove to be a popular promotional product and further increase
exposure to the arts The option of promotional packages for 2 persons or couples (comboshy
packages) should also be considered since respondents in this age group tend to be financially
responsible for two people and would possibly find such an offer appealing
bull The 18-25 year olds (age category 2) are the lowest spenders but the second largest group in
the population Therefore profitability of the festival in this regard could be based on the large
numbers of young local festival visitors attending the festival Discounted packages for
individuals including rock shows word art and poetry and drama could therefore prove to be
successful Other genres could be gradually introduced to these packages to increase their
exposure to the arts and love thereof Investing in this market segment (who already shows a
prominent interest in the arts regardless of their lower spending) should lead to the increase of
festinos to the Aardklop festival in the future as this market matures in age and financial status
Effective promotions such as attractive and affordable packages will result in satisfied
customers which should further contribute to word of mouth as marketing medium
bull The focus should not only be on the high spending 46-60 year old Gauteng market and the
large local student market but also on the remaining (and smaller) markets with potential The
variety of shows and productions already offered by the Aardklop programme and the potential
of these remaining markets make it unnecessary for Aardklop to introduce additional features to
the festival The 26-35 year olds (age category 3) reveal average to relatively high spending
(spending categories 3 and 4) The extent of spending along with the length of stay (1 day) of
this age category indicates true potential therefore festival marketers should concentrate their
marketing efforts on encouraging them to stay longer (which usually results in increased visitor
spending) If the two to three day package deals for two people or couples (as recommended
for the age category 5 market) do not encourage longer stay and do not appeal to this age
group immediately (since they seem to prefer the day-visitor option) single day packages for
two people or couples could also prove to be successful in fulfilling their needs and trends thus
sustaining visitor numbers to the festival Another remaining market with potential namely age
category 4 (36-45 year olds) would benefit from bulk packages that offer group discounts since
these respondents are financially responsible for 3 to 6 people Their packages along with the
standard drama productions should include dance theatre and lectures and discussions
25 CONCLUSIONS
The purpose of this article was to apply correspondence analysis with age as the dependent
variable in order to better understand the Aardklop market Internationally and in South Africa
32
limited market segmentation research on festivals (and more specifically arts festivals) by means of
correspondence analysis has been done This study can therefore be considered as a benchmark
in the South African research context The literature review indicated that the socio-demographic
behavioural and other variables vary between different aged visitorstourists The results in this
study confirm that each age category of the visitors to Aardklop can be associated with specific
variables Thus a market profile of different aged visitors to the festival was formulated This is
beneficial to the marketersorganisers of Aardklop since the festival productprogramme as well as
associated marketing efforts can be developed according to the needspreferences of these
markets
It is clear that correspondence analysis is a viable exploratory method for applying market
segmentation Future researchers should therefore consider using this method because it is useful
in transforming two or more categorical variables into a low-dimensional graphical making it easier
to identify the key features of the data when interpreting the information Applying correspondence
analysis with age as the dependent variable to other festivals in South Africa could enhance
comparative research It is also recommended that correspondence analyses be applied to other
tourism products within the industry or by means of other segmentation variables (for instance
province of origin or repeat visitors versus first time visitors) Finally continuous market
segmentation should be applied to Aardklop in order for festival organisersmarketers to stay aware
of trends and changes in visitor preferences so as to adapt marketing efforts accordingly
33
CHAPTER 3 Expenditure-based segmentation of visitors to the Aardklop National Arts Festival
31 INTRODUCTION
Globally the number of festivals is on the increase As a result competition and changes in the
South African festival market have far-reaching implications for most artscultural festivals such as
declines in the number of festival visitors ticket sales or both (Saayman amp Saayman 2006a40-41)
With the advent of newly launched festivals festival markets are becoming increasingly diversified
and cannot be characterised as homogeneous (Gursoy Kim amp Uysal 2004 171 Dibb amp Simkin
2004347 Hassan 2000240 Mules amp Faulkner 1996107 Saayman amp Saayman 2004636)
Mykletun Crotts and Mykletun (2001 494) agree and argue that not all groups of visitors at a
festival are alike therefore important to periodically assess which segments provide the greatest
return-on-investment Laesser and Crouch (2006397) also point out that a possible means to
achieve improved returns is through an appropriate market segmentation strategy in other words
by targeting the groups of visitors (and their needs) that generate high returns According to Cook
and Mindak (198480) and Twedt (196471) it is often the case that the heavy users account for a
large percentage of overall expenditurereturns The use of visitor expenditure in tourism marketing
to segment the market in order to determine the high spenders is a comprehensive means to apply
market segmentation (Diaz-Perez Bethencourt-Cejas amp Alvarez-Gonzales 2005961 Saayman
Van der Merwe amp Pienaar 2008 Mok amp Iverson 2000299 and Legoherel amp Wong 200616)
Identifying high spenders by means of market segmentation can therefore assist festivals such as
the Aardklop National Arts Festival (hereafter referred to as Aardklop) in targeting the right market
Aardklop is the third largest festival of its kind in South Africa with a total estimated economic
impact of R4665 million and more than 55000 visitors in 2008 (Kruger Saayman amp Saayman
200827) This predominantly Afrikaans cultural event takes place in the city of Potchefstroom
(situated in the North West Province) for 5 successive days during September and hosts
approximately 85 productions by 390 artists across a variety of genres such as theatre dance
34
cabaret jazz rock literature childrens and street theatre as well as visual arts (ANON 2008
Raath 2009 Van Heerden 200311)
Since its debut in 1998 Aardklop has become an established event on the festival calendar of
South Africa The current status of Aardklop reveals varying growth rates regarding visitor numbers
number of tickets sold direct spending of visitors average days spent at the festival as well as
overall economic impact (Kruger et al 200826-29 Saayman amp Saayman 2006a36-41) Table 31
captures the figures reflecting varying growth over the past four years and suggests that Aardklop
is showing signs of potential decline especially in ticket sales although it is not in a definite decline
phase of its product life-cycle yet
Table 31 Overview of economic impact and profile ofAardklop 2005 - 2008
Year 2005 2006 2007 -shyAbsolute number of visitors 36766 61476 51870 55518
Total tickets sold 91156 81022 84559 79530
Number of travel groups 15193 19393 16678 15294
Travel group size 2 3 3 4
Average tickets per group 6 4 5 5
Average days attended festival 3 3 3 3
Total visitor days 113240 196108 168 576 172 106
Average spending per group R217438 R177955 R2 61255 R279997
Direct spending of visitors at festival R21574794 R24237640 R27999000 R26 735 791
Total economic impact R39171741 R42908324 R53097645 R46650703
Will visit the festival again 95 94 97 93
Source Kruger et al (200826-29) Saayman amp Saayman (2006a36-41)
bull Aardklop had an exceptional year in 2007 and was extended with a few days to celebrate its 10 year anniversary this could possibly account for its higher economic value in 2007
Ticket sales may be increased by identifying high spenders by means of market segmentation
since they account for a large percentage of overall sales The aim of this article is therefore to
apply expenditure-based segmentation to identify which socio-demographic and behavioural
variables distinguish the high spenders at the festival This will assist Aardklops
marketersorganisers to understand and cater for the needs and preferences of these high
spenders thereby ensuring the sustainability and further growth of Aardklop To achieve this aim
the article is structured in the following manner first a literature review is offered followed by a
description of the survey a discussion of the results and finally a discussion of the implications
and the conclusions
35
32 LITERATURE REVIEW
According to Saayman and Saayman (2006b219 2005582) the sustainability of a festival must be
attained at three levels namely economic environmental and socio-cultural Achieving
sustainability therefore strongly depends on enhancing economic benefits (yVTO 2002 1) The
economic impact of a festival is measured by the size of the festival in terms of (1) number of
visitors (2) visitor spending (3) duration of stay and (4) the multiplier effect (Saayman 2000114)
According to Murphy and Carmichael (1991 32) the increased expenditure and economic
contribution to the destination area due to the anticipation of tourists is a common feature of any
eventlfestival With an estimated economic impact of R46 million (Kruger et a 200828) due to
visitor expenditure Aardklops impact and benefits on the host destination is evident proving why
festivals are organised in the first place (Thrane 2002281) Since visitor expenditure also includes
spending on ticketed showsproductions the economic impact is also measured by the size of the
festival in terms of the number of ticketed showsproductions sold The advantage of ticket sales as
opposed to the number of visitors attending the festival (but not necessarily spending at the
festival) is that the overcrowding associated with the festival may be alleviated or avoided all
together Other advantages include a more favourable impact on the environment and the host
community Therefore in order to sustain the nature of the festival it is important to identify and
attract visitors who attend ticketed showsproductions (Kruger 20093)
Research by Thrane (2002281) Saayman and Saayman (2006b220) and Kruger (200934)
indicated that visitors attending festival showsproductions stay longer and spend more than those
not interested in showsproductions This results in a greater overall personal expenditure during
the festival Therefore one of the best ways to increase economic benefits without necessarily
increasing the number of tourists is to encourage tourists to stay longer and provide opportunities
for them to increase spending (Gokovali Bahar amp Kozak 2007737 WTO 20022) This in turn
contributes to a greater economic impact of the festival (Gokovali et a 2007737 Kastenholz
2005556) and ensures its growth and sustainability
Since the total economic impact of a festival is a function of both the direct and indirect
expenditures made by visitors (Lee Lee Lee amp Babin 200856) it is important to understand visitor
spending behaviour at a festival and the underlying variables affecting such behaviour (Mok amp
Iverson 2000300) Kruger (20093) has also found that ticket sales and the types of
showsproductions attended can be used as an indicator of visitor interest in a festival and of how
successfully the programme addresses and fulfils visitors needs When needs and expectations
are met or exceeded consumer satisfaction will increase this is pivotal to establishing a long-term
consumer relationship ensuring repeat business higher usage and increasing the probability of the
36
consumer recommending the service to someone else (Lee et al 200858) Mok and Iverson
(2000299) stress that understanding tourists expenditure patterns and activities allows marketers
to strategically plan facilities and amenities Market segmentation is the means through which these
expenditure patterns and activities of tourists can be understood a suitable marketing strategy can
be developed and the continuous growth and sustainability of the festival can be ensured
According to Spotts and Mahoney (1991 42) segmenting travel markets on the basis of travel
expenditure is furthermore a useful alternative to the more common approach of segmenting on the
basis of travel This is because (festival) marketers seek visitors who will spend money and not just
time at tourism (festival) products (Mok amp Iverson 2000299) In terms of managerial implications
expenditure is considered to be an important factor that helps to understand the consumption
behaviour of tourists since this enables tourism (festival) marketers to develop appropriate
products (festival programmes) and to evaluate the economic benefits of each segment (Legoherel
ampWong 200616)
The underlying rationale of identifying market segments on grounds of expenditure is based on the
necessity to increase the effectiveness and efficiency of marketing programmes and their
resources both in terms of addressing (1) the right group of people and (2) their relevant needs
(Laesser amp Crouch 2006397) Touristvisitor spending is furthermore one of the most critical
variables of analysis for tourist destinations (festivals) since it directly determines the festivals
profitability (Frechtling 200626) It is therefore important to determine which visitors spend most at
a festival and which variables are most influential in determining their expenditure levels
(Kastenholz 2005557) According to Gokovali et al (2007737) once the factors that affect visitor
expenditure are identified policy development will be possible to strengthen the spending to
maximise economic benefits of a festival Festival organisers can thus effectively apply the
variables when doing market segmentation to focus their marketing efforts on those visitors who
spend the most at the festival (Kruger et al 200816)
Kruger (2009 17-18) cites studies which show that various benefits can be derived from applying
expenditure-based segmentation (Wilton amp Nickerson 200621 Thrane 2002286 Woodside
Cook amp Mindak 198710 Davies amp Mangan 1992698 Mok amp Iverson 2000304) namely
bull niche marketing
bull determining the attractiveness and viability of visitor segments
bull a clear distinction between heavy spenders and heavy users
bull maximised economic benefits
37
bull better aimedstrategic marketing efforts
bull visitor loyalty coupled with repeat visits as well as
bull better understanding and application of behavioural characteristics that influence visitor
spending
Marketers of different types of tourism products have made various attempts to segment the
tourism market into high medium and low expenditure groups and to identify the characteristics of
each group (see Mok amp Iverson 2000 Saayman amp Saayman 2006b Saayman et al 2008 Spotts
amp Mahoney 1991 Pizam amp Reichel 1979 Mehmetoglu 2007 Pouta Neuvonen amp Siev~nen
2006 Raaij amp Francken 1984 Woodside et al 1987 Kruger Saayman amp Saayman 2009 and
Thrane 2002) Results from previous research findings reveal definite characteristics that
distinguish high spenders from other spending segments in the market Expenditure can therefore
be seen as a significant segmentation variable
Table 32 Characteristics distinguishing high spenders from medium and low spenders
CHARACTERISTICS
Income
Socio-demographics
Geographic
Travel behaviour
HIGH SPENDERS
High spenders tend to earn higher income I salaries
Older aged consumers are associated with higher spending Younger aged consumers are associated with higher spending High spenders are prone to have a higher level of education Children are more likely to be present with high spenders High spenders can be associated with certain nationalities and geographic originsregions (depending on the study at hand) High spenders are associated with longer stays
High spenders are associated with shorter stays Tourists travelling for the purpose of honeymoons tend to be high spenders Travelling with spouse gir1-1boyfriend and parents tend to result in greater spending High spenders tend to travel in smaller travel parties High spenders tend to travel in larger travel parties High spenders tend to travel individually rather than in groups
AUTHORS
Dardis Soberon-Ferrer amp Patro 1994 Legoherel 199819 Lee 2001659 Jang Bai Hong amp OLeary 2004331 Saayman amp Saayman 2006b220 Thrane 2002285 Woodside at a 198711 Saayman at a 2008 Jang et a 2004319 Kruger at a 2009 Jang Ismail amp Ham 200283 Dardis at a 1994319 Mok amp Iverson 2000304 Dardis at a 1994319 Pizam amp Reichel 197942 Woodside at a 198711 Spotts amp Mahoney 1991 24 Cai Hong amp Morrison 199515 Legoherel 199819 Diaz-Perez et aI 2005961 Laesser amp Crouch 2006401 Jang et a 200283 Jang at a 2004331 Thrane 2002285 Spotts amp Mahoney 199124 Mehmetoglu 2007213 Downward amp Lumsdon 2004415 Saayman amp Saayman 2006b220 Kruger at a 2009 Mok amp Iverson 2000304 Jang et a 200283 Legoherel 199830
Mok amp Iverson 2000304
Jang at aI 200283 Cai at a 199515
Mok amp Iverson 2000304 Saayman amp Saayman 2006b220 Spotts amp Mahoney 199124 Lee 2001659 Jang at a 2004331 Jang at a 200283 Mok amp Iverson 2000304
38
High spenders are more likely to be first-time Jang et a 2004331 Opperman 1997178 visitors to a destination High spenders tend to travel longer distances Saayman et a 2008 Pouta Neuvonen amp to the destination Sievanen 2006132 Cannon amp Ford
2002263 Lee 2001 659 Leones Colby amp Crandall 199856 Long amp Perdue 199012
Visitors travelling for purposes of working Laesser amp Crouch 2006401 holidays as well as delegates to conferences are asSociated with higher spending Conference delegates travelling with spouses Laesser amp Crouch 2006401 are inclined to be hgher spenders
Recreation and leisure High spenders tend to be highly attracted to Mok amp Iverson 2000304 activities shopping
Visitors who have attended other festivals are Saayman and Saayman 2006b217 Kruger also more inclined to fall into the highshy et a 200828 spender ca~ory Visitors with festivals as main reason for Thrane 2002284 Kruger at a 200828 travel tend to spend more as opposed to Kruger 200934 other reasons High spenders tend to be more involved with Spotts amp Mahoney 199124 Legoherel recreation and are associated with higher 199830 usage of travel information High spenders tend to attend drama music Kruger 200950 theatre and cabaret and contemporary music showsproductions
Seasonality Peak seasons are associated with higher Jang at a 200283 spending
In general it is evident from Table 32 that high spenders tend to earn a higher income are higher
qualified are accompanying children and stay for longer at their destinations They can also be
associated with certain nationalities or geographical areas travel longer distances and are
frequent users of travel information High spenders at a festival often visit other festivals too and
consider the festival as the main reason for their travel to a destination Expenditure-based
segmentation can therefore assist Aardklops marketersorganisers to differentiate between the
high spenders and other spending segments in the market as well as to determine the viability of
targeting this market This information can be used to (1) determine the profile of the high spenders
at the festival and (2) increase visitor spending by attracting these visitors by means of a
customised festival programme
Based on the above applying expenditure-based segmentation to visitors attending Aardklop will
prove to be extremely helpful especially from a marketing point of view This research will greatly
assist Aardklops marketers and organisers to determine what it takes to encourage visitors to
attend the ticketed showsproductions how the festivals appeal for high spenders could be
maximised and how high spenders could be encouraged to stay longer
33 METHOD OF RESEARCH
The Institute for Tourism and Leisure Studies at the North-West University (Potchefstroom
Campus) has conducted surveys at the Aardklop National Arts Festival by means of structured
39
questionnaires since 2001 From 2005 to 2008 a total of 1671 questionnaires were completed by
visitors to the festival and the data from these surveys was used for the purpose of this study since
the general characteristics of the population remained similar over the four years The method of
research will be discussed by means of (i) the questionnaire (ii) the samples and (iii) the method of
market segmentation
331 The questionnaire
The survey questionnaire used for the visitors to Aardklop remained similar throughout the four
year data collection period This questionnaire was also similar to previous questionnaires used at
other festivals in South Africa such as the Klein Karoo (Slabbert Saayman Saayman amp Viviers
2008) and Grahamstown National Arts Festivals (Viviers Siabbert Saayman amp Saayman 2008)
The questionnaire was divided into three sections and mainly consisted of closed questions (see
Appendix A) Section one included questions based on the socio-demographics of the visitor (such
as gender age language occupation province of origin) followed by questions in section 2 based
on behavioural elements (such as travel group size days spent at the festival productionsgenres
attended number of persons financially responsible for and spending) Questions relating to
spending were category-specific (such as accommodation shows food and beverages shopping
recreation and transport) There were no questions about household income because this
information was considered to be too sensitive To compensate for this visitor occupation was
classified according to low medium and high income levels which can be viewed as a weak proxy
for income This is to account for the influence of discretionary disposable income on spending In
section three more general behaviour questions were also asked such as the means through
which information regarding the festival was communicated (for example magazines newspapers
newsletter etcetera)
332 The samples
For four consecutive years the surveys were conducted annually during the festival in
Potchefstroom by means of convenience sampling Aardklop has a 4-year average of just fewer
than 51 500 visitors (Kruger et al 200827 Saayman amp Saayman 2006a37) Cooper and Emory
(1995207) as well as Krejcie and Morgan (1970608) argue that in any defined population for a
population of 100 000 (N) the recommended sample size (S) is 384 per survey Table 33 lists the
sample size for each year With an average of 418 questionnaires per year over the consecutive 4shy
year period the sample size is applicable
The survey was conducted among adult visitors at the festival by means of a self-administered
questionnaire These respondents were briefed about the purpose of the research and were willing
40
participants In order to limit response bias towards a certain group of festival visitors
questionnaires were distributed on-site but at different locations such as in the areasvenues of
shows and productions in the areas of closed streets where visitors gather between shows and on
the main festival grounds Field workers of the North-West University were trained to administer the
process and to understand the purpose of the study as well as the questionnaire in order to assist
respondents where necessary (but without interfering with the completion of the questionnaire)
Questionnaires were distributed on each day of the 5-day festival period This ensured that the
feedback received by the sample population was an accurate portrayal of visitor spending
Questionnaires of respondents who did not complete the spending information or who did not give
account of the number of people for whom they were financially responsible were disregarded
This reduced the number of cases in the dataset from N=1671 to N=1544 (see Table 33 below)
Table 33 Questionnaires completed during Aardklop National Arts Festivals 2005 - 2008
Date 2005 2006 2007 2008 28 Sep - 1 Oct 27 Se - 3 Oct 24 Se - 29 Se 30 Sep -4 Oct
Number of visitor 407 413 357 494 16t questionnaires
Adjusted sample 383 347 342 472 1544
Source Saayman amp Saayman 2005a9 Saayman amp Saayman 2006a8-9 Saayman amp Saayman 20072-3 Kruger Saayman amp Saayman 20082
Most questions have an assigned number depending on the chosen answer which is used in the
analysis The socio-demographic and behavioural variables used along with the assigned numbers
(coding) are described in Table 34 below
Table 34 Questions used and their descriptions
QUESTION DESCRIPTION CODING VARIABLE
Home language Afrikaans = 1 Other = 0 LANGUAGE Male = 1 Female=O GENDER
8gsect ~
Yes = 1 No = 0 AGE 1 Yes = 1 No = 0 AGE 2
bull Under 18 bull 18 - 25
Yes = 1 No = 0 AGE 3bull 26 - 35 Yes = 1 No = 0 AGE 4bull 36-45 Yes = 1 No = 0 AGE 5bull 46- 60 Yes = 1 No =0 AGE 6
bull 60+
Occupation OCCUPATION 1bull High income ~ Professional Management Yes = 1 No = 0
Self-employed bull Medium income = Technical Sales Farmer Yes = 1 No = 0 OCCUPATION 2
Mining Administrative Civil service bull Low income = Housewife Pensioner Student Yes = 1 No =0 OCCUPATION 3
Unemployed
NORTHWESTProyjnce Yes = 1 No=O bull NorthWest Yes = 1 No =0 GAUTENG
bull Gauteng Yes = 1 t-NV and Gauteng = 0 OTHER PROVINCES
bull Other
41
Accommodation bull Non-paid accommodation = Local resident
Family or friends Day visitor bull Paid accommodation = Registered guesthouse
or B+B I Festival guesthouse Hotel Rent full houseOther
bull camping
GroUP sjze Nymber of days Number of visits to AardlslOP Number of tickets
Festival main reason for visit 10 Potchefstroom
VIsit Aardklop again
Attendance of other festivals over the past three ~
bull KKNK bull Grahamslown bull Volksblad bull Innibas bull Other
Shows I productions
bull Drama bull Dance theatre bull Word art amp poetry bull Childrens theatre bull Lectures amp discussions bull Visual art ampexhibitions bull Classical music bull Choirs bull Cabaret bull R)Ck
FreeSbows
Medlyms bull Television bull Radio bull Aardklop website bull Aardklop e-mail bull M-Web newsletter bull Magazines bull Newspapers bull Word of mouth bull Other
333 The Method
Yes = 1 No = 0
Yes = 1 No = 0
Yes = 1 No = 0
Open question Open question Open question Open question
Yes=1No=0
Yes = 1 No = 0
Yes = 1 No = 0 Yes = 1 No = 0 Yes = 1 No = 0 Yes = 1 No = 0 Yes = 1 No =0
Yes = 1 No = 0 Yes = 1 No = 0 Yes = 1 No =0 Yes = 1 No = 0 Yes = 1 No = 0 Yes = 1 No = 0 Yes = 1 No = 0 Yes = 1 No = 0 Yes = 1 No=O Yes = 1 No=O
Yes = 1 No = 0
Yes = 1 No = 0 Yes = 1 No = 0 Yes = 1 No = 0 Yes=1 No=0 Yes = 1 No=O Yes=1No=0 Yes =1 No = 0 Yes = 1 No = 0 Yes=1No=0
ACCOMMODATION 1
ACCOMMODATION 2
CAMPING
GROUP-SIZE DAYS TIMES
TICKETS
REASON
VISIT AGAIN
KKNK GRAHAMSTOWN
VOLKSBLAD INNIBOS OTHER
DRAMA DANCE THEATRE
POETRY CHILD THEATRE
LECTURES VISUAL ARTS
CLASSICAL MUSIC CHOIRS
CABARET ROCK
FREE SHOWS
TV RADIO
WEBSITE E-MAIL
NEWSLETTER MAGAZINES
NEWSPAPERS WORD OF MOUTH
OTHER
In the analysis spending per person is the dependent variable The data was analysed using SPSS
(Statistical Package for the Social Sciences) Total expenditure was calculated by adding each
respondents spending category entries and subtracting the transport cost to the festival since
including this expense leads to bias for visitors further away from Potchefstroom The total
expenditure was then divided by the number of people for whom the respondent was financially
responsible during the trip This resulted in total spending per person In order to render real
expenditure per person that is comparable across the four years of pooled data from the reduced
dataset (N=1544) (Table 33) the total expenditure per person was deflated with the consumer
price index The real expenditure per person variable was used to create spending segments
42
Cluster analysis measures the distance in rands (ZAR) between cases on a combination of
dimensions and uses this to identify groups of cases within which there is considerable
homogeneity and between which there are clear boundaries (Gough Eardley Bradshaw Ditch amp
Whiteford 199721) K-means clustering (a non-hierarchical segmentation technique) was used to
organise visitors into groups with similar expenditure patterns K-means clustering requires the
researcher to specify a priori the number of clusters (k) and thus provides a preliminary testing of
alternative typologies (Gough 19964) Taking into account practical considerations for segmenting
the arts festival market the study findings appeared to be more manageable and easier to
communicate for three (low medium high) to five (low low-medium medium high-medium high)
expenditure groups The clustering begins by using the values of the first n cases as temporary
estimates of the k cluster means Initial cluster centres form by assigning each case in turn to the
cluster with the closest centre and then updating the centre until final cluster centres are identified
Within each step cases are grouped into the cluster with the closest centre and the centres are
recomputed until no further change occurs in the centres (Pitruzello 1999) It offers a good range
of information to help interpret the results and is therefore the technique selected here As a result
four clusters were identified
One-way analysis of variance (ANOVA) was performed to test for significant associations and
differences between expenditure segments and categories based on socio-demographic and
behavioural variables as measured by the questionnaire Furthermore AN OVA was accompanied
by Welch and Brown-Forsythe robust tests to further explore the differences among segments
334 Results
The empirical results are presented in three sections namely (1) the general profile of the
respondent population to Aardklop over the consecutive four year period (2005-2008) (2) the
expenditure clusters and (3) the ANOVA results
3341 General profile of festival respondents
The general profile of the respondents to Aardklop (Table 35) reveals that the majority (55) were
females 46-60 years of age (28) spoke Afrikaans (94) came from the Gauteng (43) and
North West (35) provinces were in the high income occupations (44) resided with family and
friends (23) or were local (22) attended drama productions (55) or rock shows (28) and
identified word of mouth (53) and television (49) as the mediums through which they heard
about the festival Travel group size is 3 persons respondents are financially responsible for 2
persons the length of stay is 2 days and the spending per person is R96844 Respondents
attended Aardklop 4 times before the festival was their main reason for visiting Potchefstroom and
43
95 would attend the festival again In brief it is apparent that the festival visitors are
predominantly students and professional people are local or from Gauteng regularly attend
Aardklop and mostly enjoy drama productions
Table 3S Festival respondent profile
CATEGORY VARIABLE UmiddotIJ~W1p_ VARIABLE
~ Iom~ 11I[]9i9~ Male 743 446 Afrikaans 1568 941 Female 922 554 Other 98 58
ampm Province Under 18 46 28 NorthWest 581 351 18-25 403 243 Gauteng 703 425 28-35 263 159 Other 372 224 36-45 361 218 Occupation46-60 461 278 High income 719 435 60+ 125 75 Medium Income 292 176
Low income 504 305
A~rnmQltiQl Attnl~ of Q~r Non-paid accommodation 1034 639 msecttivalsect over 1M risl Paid accommodation 475 294 three vears Camping 109 67 KKNK 496 297
Grahamstown 112 67 Volksblad 108 65 (nnlbos 251 150 Other 89 53
secth~ I P[QIltIlQl Mediums Drama 912 546 Television 825 494 Dance theatre 273 163 Radio 690 41 3 Word art amp poetry 157 94 Aardklop website 284 170 Childrens theatre 124 74 Aardklop e-mail 97 58 Lectures amp discussions 88 53 M-Web newsletter 67 40 Visual art amp exhlbiUons 301 180 Magazines 459 275 Classical music 291 174 Newspapers 624 373 Choirs 168 101 Word of mouth 887 531 Cabaret 521 31 Other 92 55 Rock 460 2752
VARIABLE M Group size 34 Persons Number of people financially responsible for 24 Persons Number of days 23 Days Number of visits to Aardklop 40 TImes Number of tickets 81 tickets Spending per person R96844
VARIABLE
Festival is main reason for visit to Potchefatroom 702 VISit Aardklop again 946 0(
3342 Expenditure clusters
In this analysis respondents were divided into four meaningful expenditure segments The final
cluster centres and number of cases in each cluster are indicated in Table 36 below
Table 36 Cluster centres and number of cases In each cluster
CLUSTER CENTRE
40184 134154 280860 84 536797 23
100
44
Cluster 1 is the largest group with 625 of the sample has a mean spending of R40184 per
capita and is labelled Ylow spenders Cluster 2 which comprises 269 of the Aardklop visitor
sample has a mean spending of R1341 54 per capita and is labelled medium spenders Cluster
3 labelled -medium spenders accounts for 84 of the sample and has a mean spending of
R280860 per capita The spender cluster contains 23 of the sample is the smallest of the
four clusters identified and has a mean spending of R537797 per capita
3343 ANOVA results
Table 37 summarises the results for the ANOVA analysis for the socio-demographic and
behavioural characteristics as well as mediums through which respondents heard about the
festival
Table 37 ANOVA results for respondent characteristics
Cluster 1 Cluster 2 Cluster 3 Cluster 4 F t middot High middotra 10Low Medium Medium- high
(n=965) (n=415) (n=129) n=35)
44 46 50 44 597 617 003 001 0 0 3358 018shy027 019 012 011 7551 000- 1
016 016 014 017 172 915 021 023 022 017 469 704 025 031 041 046 7134 000-1
007 008 009 009 220 883 094 094 095 094 026 994 039 049 057 071 1792 000-1
018 019 013 014 866 00458 033 025 018 006 9808 000-1
044 020 014 0 44623 000-1
038 051 046 069 1508 000-1
018 029 0040 031 16021 000-1
398 378 373 4 14 535 658 259 211 184 143 21744 000-1
281 354 404 4043 44298 000-1
076 041 025 020 105099 000-1
006 022 030 0040 48028 000-1
005 011 009 009 4623 003 058 060 055 037 2517 057 048 065 076 083 240471 000-1
015 018 020 029 2445 062 007 012 016 023 7721 000-1
007 007 009 009 263 852 004 007 009 020 8935 000-1
016 018 030 0040 9510 000-1
015 022 026 026 6067 000-1
008 013 017 011 5225 001shy025 038 055 057 24935 000-1
027 028 028 031 169 917 557 1010 1224 1310 23773 000-1
026 032 045 063 13598 000-1
006 006 011 009 10483 0217 006 007 008 009 235 0872 012 017 026 023 7185 000-1
005 005 005 009 258 858 0042 048 064 077 12361 000-1
45
395 394 443 457 1866 133 094 094 092 094 285 836 065 079 085 097 19196 OOO-t
049 050 053 043 547 650 043 041 040 031 721 540 016 020 013 017 1532 204 005 008 005 006 2093 099middot 004 005 005 0 774 508 027 028 026 029 062 980 037 039 036 040 252 860 056 054 053 049 305 822 005 007 004 006 697 554
bullbull indicates Significance at a 5 level indicates significance at a 10 level and t indicates Significance according to both the Welch and Brown-Forsythe robust tests of equality of means
According to Table 37 above significant differences exist between the mean values of the low
medium high-medium and high spender groups regarding the visitors age category occupation
(excluding medium income occupations ie Occupation 2) province of origin number of persons
for whom they are financially responsible for whom they are paying the number of days they
attend the festival the preference for either camping paid accommodation or non-paid
accommodation the importance of free shows the types of showsproductions attended (excluding
childrens theatre and rock shows) the number of tickets paid for attendance of other festivals over
the past three years (including KKNK and Innibos only) and Aardklop being the main reason for
visiting Potchefstroom
There were no significant differences between the mean values of the four clusters regarding the
gender of respondents their language their group size number of times they have visited
Aardklop whether they will visit the festival again as well as the medium through which they heard
about Aardklop (with the exception of Aardklop e-mail which shows significance at a 10 level)
The socio demographic and behavioural characteristics of the four expenditure clusters are
compared and reported in the following paragraphs Each cluster namely low spenders medium
spenders medium-high spenders and high spenders will be discussed individually
Low spending segment (Cluster 1 n =965 625 of the visitors)
Visitors in this segment vary in age (27 were 18-2525 were 46-60 and 21 were 36-45 years
old) and are mostly from the North West (44) and Gauteng (38) provinces Their occupations
are mostly in the high income (39) and low income (33) occupation categories and they are
financially responsible for 259 people at the festival (the highest across all four segments of which
the average is 199 people) The participatory nature of these low spenders as festival visitors as
46
opposed to the other expenditure segments appear to be the least (557 tickets purchased
compared to the 807 average) and only 65 indicated that the festival was the main reason for
their visit to Potchefstroom (compared to an 82 average across all four segments) They attend
the festival for the shortest duration (281 days compared to the 371 average) and prefer non-paid
accommodation (76) as opposed to paid accommodation (6) and camping (5) The shows
and productions they attend include a large variety of which drama rock and cabaret are the most
preferred In fact these three genres are among the most preferred across all spending segments
but to a greater or lesser extent in each instance (of which rock as pointed out above does not
indicate a significant difference across the four segments) The popularity of drama
showsproductions gradually increase from the low spenders (48) to the high spenders (83)
Drama attended by the medium and medium high spenders was indicated at 65 and 76
respectively Cabaret showsproductions revealed the same steady increase in popularity from the
low spenders (25) to the high spenders (57) Furthermore more than half the respondents
(58) in this segment considered free shows at Aardklop as important and also attended the
KKNK (27) Innibos (12) as well as other festivals (42) over the past three years
Medium spending segment (Cluster 2 n = 415269 of the visitors)
A typical visitor in this segment is middle-aged (31 are between 46 and 60 and 23 are between
36 and 45 years of age) and reside in the Gauteng province (51 ) Their occupations are
predominantly high income occupations (49) and they are financially responsible for 211 people
at the festival (slightly higher than the average of 199 people across the four segments) The
participatory nature of these medium spenders as determined by the number of tickets purchased
is higher than the average (1010 tickets purchased compared to the 807 average) and 79
indicated that the festival was the main reason for their visit to Potchefstroom (compared to an 82
average across all four segments) They attend the festival for 281 days compared to the 371 day
average and prefer non-paid accommodation (41) as opposed to paid accommodation (22)
and camping (11 ) They also attend a large variety of shows and productions of which drama
(65) rock (28) and cabaret (38) are the most preferred shortly followed by classical music
(22) Visitors in this segment feel the strongest about the importance of free shows at Aardklop
(60) and over the past three years attended the KKNK (32) Innibos (17) as well as other
festivals (48)
High-medium spending segment (Cluster 3 n =129 84 of the visitors)
Like medium spenders in cluster 2 visitors in this segment are middle-aged (41 are between 46
and 60 and 22 are between 36 and 45 years of age) and reside in Gauteng (46) and other
47
provinces (40) Their occupations are also mostly high income occupations (57) and they are
financially responsible for 184 people at the festival (the second lowest across all four segments of
which the average is 199 people) Visitors in this group purchased relatively more tickets than the
low and medium segments (122 tickets compared to an 807 average across all four segments)
and also consider free shows at Aardklop to be important (55) Eighty-five percent (85)
indicated that the festival was the main reason for their visit to Potchefstroom (compared to an 82
average across all four segments) They attend the festival for longer than the average duration
across the four segments (404 days compared to the 371 average) In contrast with the
preference for non-paid accommodation among the low and medium spenders this segment
prefers paid accommodation (30) Shows and productions attended by this segment once again
reveal a large variety of which drama (76) and cabaret (55) visual arts (30) and rock (28)
are the most preferred closely followed by classical music (26) Over the past three years these
medium-high spenders also attended the KKNK (45) Innibos (26) and other festivals (64)
High spending segment (Cluster 4 n = 3523 of the visitors)
On average this type of visitor was the most distinct from other clusters and has the smallest
membership (23 see Table 36) These visitors are mostly aged between 46 and 60 years and
mostly reside in the Gauteng province (69) (as is the case with the medium and high-medium
visitors coming predominantly from this province) Seventy-one percent (71 ) of the visitors in this
high spending segment are in high income occupations and are financially responsible for 143
people at the festival (which is the lowest across all four segments of which the average is 199
people) Visitors in this group purchased the highest number of tickets (1310 tickets compared to
the 807 average) and considered the free shows at Aardklop to be the least important (37)
Almost all the visitors in this segment (97) indicated that the festival was the main reason for their
visit to Potchefstroom (which was the highest across all four segments of which 82 was the
average) They preferred paid accommodation (40) and attend the festival for longer than any
other expenditure segment (443 days compared to the 371 average) Diversity appeared to be
very important among this type of visitor when selecting types of showsproductions For instance
their preference for free shows (37) was much lower than the other groups While they would
attend drama (83) and cabaret (57) type shows they would also attend the visual arts (40)
rock shows (31 ) dance theatre (29) classical music (26) and poetry (23) type shows but
would also spend relatively more time attending lectures (20) than the other groups Over the
past three years these high spenders attended the KKNK (63) Innibos (23) as well as other
festivals (77) more times than any other segments Table 311 below summarises the results
48
Table 38 Low medium high-medlum and high segments
VARIABLES HIGH
18-25yrs (27) 46-6Oyrs (31 ) 46middot6Oyrs (46) 46-6Oyrs (25) 36-45yrs (23)
Occupation High income (39) High income (49) High income (57) High income (71) Province North West (44) Gauteng (51) Gauteng (46) Gauteng (69)
Gauteng (38) Other (2900) Other (40) Other (31) Other (18) North West (20) North West (14)
Accommodation Non-paid (76) Non-paid (41) Paid (30) Paid (40) Number of people 259 211 184 143 financial responsible for
557 1010 1224 1310 Da s (length of stay) 281 354 404 443 FestivaTiSthe main reason Yes (65) Yes (79) Yes (85) Yes (97) for visiting Potchofstroom Other festivals KKNK (26) KKNK(32) KKNK(45) KKNK(63) 1m ortance of free shows Yes (58) Yes (60) Yes (55) No (63)
Drama (48) Drama (65) Drama (76) Drama (83) Cabaret (25) Cabaret (38) Cabaret (55) Cabaret (57)
Visual arts (40)
34 FINDINGS AND IMPLICATIONS
The results of the analysis confirm the existence of significant differences in socio-demographic
and behavioural variablescharacteristics between different expenditure groups of visitors to
Aardklop Based on the results the following findings were made
bull Surprisingly higher income (associated with higher income occupations) does not necessarily
influence higher spending at Aardklop since high income occupations were the most prominent
category across all 4 spending segments However in the high spending segment there are far
more higher-income individuals than in the lower spending segments This contradicts research
by Dardis et a (1994319) Saayman et a (2008) Legoherel (199830) Lee (2001659) Jang
et a (2004331) Saayman and Saayman (2006b220) Thrane (2002285) and Woodside et al
(198711)
bull It is clear that the 46-60 year age category is the most prominent in all spending segments
except for the low spenders where it is the second most prominent age category Since this age
category is the highest (46) in the high spending segment it can be concluded that older
visitors are prone to spend more than younger visitors This supports findings by Jang et al
(2004331) Kruger et a (2009) and Jang et al (200283) However it contradicts findings by
Dardis et al (1994319) and Mok and Iverson (2000304)
bull The length of stay of visitors to Aardklop gradually increases from lower to higher spenders It
can therefore be concluded that higher spenders stay for a longer period of time than lower
spenders Research findings by Jang et al (2004331) Thrane (2002285) Spotts and Mahoney
(199124) Mehmetoglu (2007213) Downward and Lumsdon (2004415) Saayman and
49
Saayman (2006b220) Kruger et al (2009) Mok and Iverson (2000304) Jang et al (200283)
support this However findings by Legoherel (199830) are contradictory
bull Aardklops higher spenders tend to travel longer distances to Potchefstroom The number of
festival visitors from the local North West province is the highest (44) in the low spending
segment and dramatically decreases across to the high spending segments (where 0 high
spending visitors are from the North West province) On the other hand visitors from Gauteng
and other provinces (logically travelling longer distances to the festival than visitors in the North
West) together account for 56 of the lower spending segment as apposed to a combined
100 in the high spending segment Similar findings were made by Saayman et al (2008)
Pouta et al (2006132) Cannon and Ford (2002263) Lee (2001 659) Leones et al (199856)
Long and Perdue (199012)
bull Based on the previous finding it may also be concluded that Gauteng visitors in general seem to
be higher spenders This was also concluded by Kruger (20094950) and is not surprising since
Gauteng has the highest per capita income in the country This is also confirmed by research
compiled by Legoherel (1998 19) Diaz-Perez et al (2005961) Laesser and Crouch (2006401)
and Jang et al (200283) who found that high spenders can be associated with specific
geographic originsregions depending on the study at hand
bull The more other festivals visitors to Aardklop attended as well the more money they are likely to
spend In other words visitors who have attended other festivals too are inclined to be high
spenders This is evident in the percentage of visitors also attending KKNK (the festival mostly
attended by all spending segments besides Aardklop) which increases from the low spending
segment (26) right through to the high spending segment (63) These findings are confirmed
by Saayman and Saayman (2006b217) and Kruger et al (200828)
bull Group size and the number of previous visits to Aardklop were not statistically significant even
though research findings of Mok and Iverson (2000304) and Saayman and Saayman
(2006b220) indicated that smaller groups tend to be high spenders However Spotts and
Mahoney (1991 24) Lee (2001 659) Jang et al (2004331) and Jang et al (200283) indicated
that large groups appear to be high spenders Jang et al (2004331) and Opperman (1997178)
also found first-time visitors to be higher spenders than repeat visitors
bull Visitors for whom the Aardklop festival is the main reason for travelling to Potchefstroom are
higher spenders This has proved to be the case for 65 of the low spenders but for an immense
97 in the high spending segment This result is supported by Thrane (2002284) Kruger et al
(200828) and Kruger (200934)
bull Although visitors to Aardklop indicated drama and cabaret to be the two most preferred
showsproductions across all four spending segments increased interest in these activities is
50
evident in the high spending segment This is indicated by 83 for drama and 57 for cabaret in
the high spending segment as opposed to 48 for drama and 25 for cabaret in the lower
spending segment This is consistent with the conclusions of Kruger (200950) that drama and
cabaret were among the genres identified to be preferred by high spenders
bull A finding in this study which could not be compared to any previous research was the fact that
free shows were less important to the high spenders than to the other spending segments More
than half the respondents in the low medium and medium-high categories (58 60 and 55
respectively) indicated it to be important whereas it was unimportant to 63 of the high
spenders
These findings suggest some important implications and challenges to the marketersorganisers of
Aardklop in order to encourage visitors to attend more ticketed showsproductions to attract more
high spenders to the festival and to encourage them to stay for longer
bull Firstly marketing efforts for the higher spenders should be predominantly aimed at the Gauteng
province since this province is the origin of most high spenders and also a prominent province
of origin across all spending segments However in the low spending segment marketing
efforts should mainly focus on the North West province (but without excluding the Gauteng
province)
bull The unexpected finding that higher income (associated with higher income occupations) is the
most prominent category across all 4 spending segments implies that the majority of
respondents in lower medium and medium-high spending segments are not low earning
individuals It is important for Aardklop marketersorganisers to realise the spending potential of
these three segments so that spending on more ticketed showsproductions can be
encouraged by means of tailored products that appeal to their needs and preferences This
could expand the high spending segment Since these segments indicate that free shows are
important to them it could be incorporated in packages where ticketed showsproductions are
combined with a free show as an incentive These packages should include the preferred
drama and cabaret genres should include slightly more than the number of ticketed
showsproductions usually attended by them and should encourage these visitors to stay
longer (by perhaps designing 4-day packages for segments that are more inclined to stay for 3
days) This marketing approach will encourage greater spending by visitors who have the
potential to spend more and will increase their exposure to the arts and possibly the number of
high spenders in the future
51
bull With reference to the profile of the high spending segment in Table 311 Aardklop
marketersorganisers should design packages that focus on catering for these high spenders
specific needspreferences For instance packages should involve most of the types of
showsproductions (but to a greater extent drama cabaret and visual arts) and should stretch
across the entire duration of Aardklop (since these visitors stay for most of the festivals 5-day
duration) The focus of these packages should be to encourage even more spending by these
already eager spenders culture lovers Therefore slightly more showsproductions than the
number usually attended by these visitors should be incorporated in the packages (for instance
15 tickets across all genres instead of 13) The inclusion of accommodation in these packages
for convenience should also be considered since a large percentage of these high spenders
make use of paid accommodation The convenience element could serve to persuade these
high spenders to purchase packages and in this way to buy more tickets than they would
otherwise have bought This marketing approach should not only maintain the existing high
spending market by catering for their needspreferences but aims at further increasing the
expenditure levels of this segment
35 CONCLUSIONS
The purpose of this article was to apply expenditure-based segmentation whereby distinguishable
expenditure segments are identified in order to determine the profile of the high spenders at
Aardklop The literature review indicates differences between socio-demographic behavioural and
other characteristics of the different expenditure segments The results both support and contradict
research findings in existing literature An interesting result is that the majority of respondents in
each spending segment (not only the high spenders) are high income earners associated with
higher income occupations This emphasises the spending potential in the Aardklop visitor market
that still needs to be reached Knowledge of this market will make it possible for
marketersorganisers of Aardklop to focus on customised packages (according to the
needspreferences of the low medium and medium-high spenders) to encourage this market to
spend more on ticketed showsproductions and to increase their length of stay This can eventually
convert members in these spending segments to higher spenders thereby expanding the total high
spending segment The results also reveal the profile of high spenders and how they are
distinguishable by various characteristics (or the extent to which the characteristic applies) This
too is knowledge that can assist Aardklop marketersorganisers to not only maintain the high
spending market by fulfilling their needspreferences but to motivate them to spend more on
ticketed showsproductions
52
This research has made a substantial contribution because expenditure-based segmentation of
markets for a national arts festival in South Africa has only been applied once before by Kruger
(2009) at the Klein Karoo Arts Festival This research therefore benefits both festival
marketersorganisers and future researchers Further research is recommended for the benefit of
Aardklop and the South African arts festival market in general Firstly continuous market
segmentation at Aardklop is recommended in order for festival organisersmarketers to
continuously stay aware of new trends and changes in visitor preferences to adapt marketing
efforts accordingly The usefulness of a cluster analysis (more specifically K-means clustering) in
the expenditure-based segmentation of this study appears to be robust meaningful and simple and
should be implemented more in festival research Further segmentation methods should also be
applied to the Aardklop market so that these various methods and their effectiveness can be
compared
53
CHAPTER 4
Conclusions and Recommendations
41 INTRODUCTION
The aim of the study was to apply and compare two market segmentation methods of visitors to
Aardklop National Arts Festival To achieve this aim the following objectives were set in Chapter 1
and pursued in the study
bull The first objective was to gain a better understanding of the Aardklop market by applying a
correspondence analysis with age as the dependent variable This objective was achieved in
Chapter 2 (Article 1) of the study The research clearly indicated that profiles of specific age
categories could be distinguished from other segments based on certain variables
bull The second objective was to identify the profile of high spenders at Aardklop by applying
expenditure-based segmentation This objective was accomplished in Chapter 3 (Article 2) of
the study The research revealed a definite differentiation between the profile of high spenders
and that of other spending segments based on certain variables
bull The third objective was to compare the application of correspondence analysis and
expenditure-based segmentation in festival research This objective is accomplished in Chapter
4 of this study The research indicated that there are certain noteworthy facets in the application
of these two methods that should be taken into account by future researchers when compiling
similar studies
bull The fourth objective was to draw conclusions and make recommendations concerning the
market segmentation of visitors to Aardklop This chapter will therefore draw on the research
results in Chapters 2 and 3 to compare the application of the two market segmentation
methods to conclude the findings of the research and to make recommendations regarding
future festivals and research
54
42 CONCLUSIONS
The conclusions regarding the literature review and the surveys as reported in the two articles will
be discussed as well as the conclusions regarding the comparison of the application of the two
segmentation methods
421 CONCLUSIONS REGARDING THE CORRESPONDENCE ANALYSIS OF VISITORS TO
AARDKLOP
The following conclusions can be drawn from the literature
bull Aardklop was initiated because of the concern for the arts and artists and its main aim is to
provide a quality platform for artists to promote the arts (cf 21)
bull However the fierce competition in the festival market has serious implications for all South
African artscultural festivals (cf 21)
bull Market segmentation is effective in dividing the present and potential markets into homogenous
groupssegments based on meaningful characteristics This assists marketersorganisers of the
festival to understand the needs and preferences of these segments and to adjust the festival
productprogramme accordingly (cf 22)
bull By catering for the needspreferences of the visitors it may be ensured that customers are more
satisfied and less likely to consider product offerings from competition (cf 22)
bull Various methods can be used for comprehensive market segmentation among others
correspondence analysis (cf 22)
bull Correspondence analysis is frequently used especially in tourism marketing literature
However limited market segmentation research by means of this method based on festivals
exists (cf 22)
bull There are also various segmentation variables that can be used in correspondence analysis of
which age has successfully been applied by researchers and marketers (cf 22)
bull Previous research findings identified definite differences in characteristics between older and
younger visitorstourists (cf 22)
55
bull Identifying visitor needs and motives for attending the festival by means of market segmentation
with age as the dependent variable can assist marketersorganisers of Aardklop to better
understand the current market Festival programmes and effective marketing strategies can be
developed accordingly This will ensure the sustainability growth continuity and success of
Aardklop (cf 22)
The following conclusions can be drawn from the survey
In Article 1 a correspondence analysis was applied with age as the dependent variable to
understand the Aardklop market better The results confirmed the existence of significant
differences in socio-demographic and behavioural variablescharacteristics between different age
groups of visitors to Aardklop such as the following (cf 234)
bull Most festival visitors 925 are under the age of 60
bull The age groups 46-60 and older than 60 are more likely to hear about Aardklop in the written
media such as magazines newspapers the M-Web newsletter and Aardklop e-mail Younger
visitors aged 18 to 35 rely more on word of mouth
bull Older visitors (aged 46-60) seem to be associated with the two highest spending categories at
the festival Younger visitors (aged 18-25) spend the least
bull Visitors aged 18-25 years are more likely to attend rock showsconcerts
bull Visitors aged 36-45 years are more likely to attend productionsshows such as dance theatre
and lectures and discussions and age categories 5-6 (46 years and older) are more associated
with attending showsproductions such as classical music cabaret and visual art and
exhibitions
bull Festival visitors in age categories 3 4 and 5 (26-60 years) stay for shorter periods of time (1-3
days) The very young and very old age groups (younger than 25 and older than 60) appear to
stay for longer periods of time (4 days and more)
bull Locals (visitors in the region of Potchefstroom) or visitors from the North West are likely to be
younger (between the ages of 18 and 25) Age categories 4 and 5 (36-60 years old) were likely
to travel from the Gauteng and Free State provinces
Understanding the Aardklop market is particularly beneficial to the marketersorganisers of the
festival especially for the purposes of effective marketing since a market profile of different age
groups of visitors can be formulated and the festival productprogramme can be developed
56
according to their needs and preferences This makes it possible to maintain the current market as
well as to identify and grow upcoming markets resulting in the long-term growth and sustainability
of the festival The method although exploratory is a sophisticated technique that gives a powerful
and comprehensive visual representation of the relationship possible associations between
variables and respondent age groups However this method does not always provide a detailed
profile of each age category (see Table 210)
422 CONCLUSIONS REGARDING THE EXPENDITURE-BASED SEGMENTATION OF
VISITORS TO AARDKLOP
The following conclusions can be drawn from the literature
bull Globally the number of festivals is increasing causing competition in the festival market with
implications such as declines in ticket sales (cf 31)
bull Aardklop is the third largest arts festival in South Africa and its current status reveals potential
signs of decline in ticket sales which could negatively affect the economic impact of the festival
and threaten the sustainability of this event (cf 31)
bull With the increase in the number of festivals festival markets are also becoming increasingly
diversified (cf 31)
bull Festival organisersmarketers should periodically asses this heterogeneous market and identify
the segments that provide the greatest return-on-investment so that the needs of these
segments can be catered for (cf 31)
bull Market segmentation by means of expenditure-based segmentation assists in identifying the
high spenders in a market as well as their needs and preferences (cf 31)
bull Previous research findings identify definite differences in characteristics between high spenders
and low spenders (cf 32)
bull By catering for the needs and preferences of these high spenders by means of tailored festival
programmes and marketing efforts high spenders will be encouraged to spend more on
ticketed showsproduction and repeat visits will be ensured (cf 32)
57
bull Increased ticket sales will result in a greater economic impact of Aardklop thus ensuring the
sustainability of the festival (cf 32)
The following conclusions can be drawn from the survey
In Article 2 expenditure-based segmentation was applied to identify the profile of high spenders at
Aardklop In the results 4 segments were identified and the analysis confirmed the existence of
significant differences in socio-demographic and behavioural variablescharacteristics between
these different expenditure groups of visitors to Aardklop In this way high spenders could be
differentiated These included the following (cf 334)
bull Higher income associated with higher income occupations does not necessarily influence
higher spending at Aardklop since high income occupations were the most prominent category
across all 4 spending segments This reveals that there is untapped spending potential in the
Aardklop market
bull The age category 46-60 years is the most prominent in all spending segments except for the low
spenders where it is the second most prominent age category
bull Older visitors are prone to spend more than younger visitors
bull Higher spenders stay for a longer period of time than lower spenders
bull Aardklops higher spenders tend to travel longer distances to Potchefstroom
bull Gauteng visitors in general seem to be higher spenders
bull Visitors who have attended other festivals as well are inclined to be high spenders
bull Visitors who travel to Potchefstroom for the main reason of attending the Aardklop festival are
higher spenders
bull Drama and cabaret are by and large preferred by high spenders
bull For high spenders free shows are less important than for the other spending segments
It is beneficial to the marketersorganisers of Aardklop to identify a detailed profile of high spenders
because it will assist marketersorganisers to maintain the high spending market by fulfilling their
needspreferences but also to motivate them to spend more on ticketed showsproductions Since
the under-utilised spending potential in the other spending segments were revealed along with
detailed descriptions of these segments marketersorganisers of Aardklop can target these
segments by means of customised packages (according to the needspreferences) that will
encourage the segments to spend more on ticketed showsproductions and to increase their length
58
of stay This can eventually convert members in these spending segments into higher spenders
thereby expanding the total high spending segment This will maximise the economic impact of
Aardklop and will result in the competitiveness sustainability and further growth of the festival
The method used in Article 2 namely K-means clustering offers a good range of information to
help interpret the results Instead of simply dividing the market into three spending categories (high
medium and low) for purposes of expenditure-based segmentation this method makes no preshy
determined selection in the number of spending groups Instead it groups members together based
on their natural similarity with regard to expenditure patterns ANOVA was used to determine the
differences in terms of socio-demographic and behavioural variables (as tested by the
questionnaire) between the identified clusters and to test whether these differences were
statistically significant This method provides a more detailed profile of each spending segment
Table 311)
423 CONCLUSIONS REGARDING THE COMPARISON OF THE APPLICATION OF THE TWO
SEGMENTATION METHODS
The two market segmentation methods applied in this study can be considered to be effective and
comprehensive As mentioned above the correspondence analysis revealed a less detailed profile
of each age category whereas the profile of the spending segments in the expenditure-based
article was more detailed It would therefore seem that the expenditure-based method is the better
option of the two when applying market segmentation to festivals However it should also be
pointed out that since both these methods can be used to effectively segment the Aardklop market
it is perhaps more important to consider what exactly needs to be accomplished in the marketing
research in order to identify the more appropriate market segmentation method
Correspondence analysis as opposed to expenditure-based segmentation can also be considered
as more flexible in terms of the bases on which segmentation is applied since a variety of
segmentation variables can be used to divide the market into groups (for example age as applied in
this study gender province of origin types of showsproduction etcetera) Expenditure-based
segmentation on the other hand exclusively uses expenditure as segmentation variable
Another facet that can be concluded from the comparison of these two methods is that if age were
to be used as a segmentation variable in the application of correspondence analysis in the future
quota sampling could be beneficial in order for the researcher to ensure that the right variety of
respondents are selected (for example a relatively equal selectionnumber of respondents in each
59
age group can to some extent be visibly identified by fieldworkers) This is however not a simple
task in the application of expenditure-based segmentation since it is not possible to differentiate
between high and low spenders according to appearance Below is a summary of the benefits
derived from applying each segmentation method
The benefits of applying correspondence analysis to Aardklop are
bull It assists in understanding the Aardklop market better
bull It assists in formulating a market profile of different aged visitors to the festival
bull Continuous correspondence analysis research with age as the segmentation variable assists in
monitoring the different age groups in order to stay aware of changes in their needs and
preferences as well as market trends
bull Marketing efforts directed at the different age categories can be adapted continuously and
accordingly
bull A festival producUprogramme can be developed according to the needs and preferences of the
largest age category visitors thereby maintaining the current market
bull The identification of other smaller markets by means of correspondence analysis could lead to
the growth of these markets since the festival producUprogramme could also make provision for
their specific needs and preferences
bull Catering for the needs and preferences of the larger prominent markets as well as the smaller
markets with growth potential will contribute to the competitiveness long-term growth and
sustainability of the festival
bull This research contributes to a better understanding of the profile of visitors to arts festivals in
South Africa
The benefits of applying expenditure-based segmentation to Aardklop are
bull It assists in penetrating markets with high potential
bull It assists in formulating a market profile of high spenders to the festival
bull The high spending market can be maintained by catering for their needs and ensuring return
visits
bull The untapped spending potential in the Aardklop market can be identified
bull Visitors can be encouraged to attend more ticketed showsproductions
bull Visitors exposure to the arts can be increased
bull Visitor spending can be increased
bull Visitors length of stay can be prolonged
bull A direct contribution to a greater economic impact of the festival can be made
60
bull A continuous economic contribution to the host community can be ensured
bull The competitive advantage of Aardklop can be increased
bull A contribution to the sustainability and further growth of Aardklop is made
43 RECOMMENDATIONS
Recommendations will be discussed in two sections namely general recommendations and
recommendations for further research
431 GENERAL RECOMMENDATIONS
Based on this research recommendations are made regarding Aardklop and other festivals
bull The results of Article 1 (correspondence analysis) where age was used as the segmentation
variable are inconsistent with certain findings of previous research This may be due to ever
changing market trends and changes in the needspreferences of visitors It is therefore
recommended that continuous segmentation is applied for Aardklop marketersorganisers to
stay aware of these changes so that the necessary adjustments can be made to the festival
programme and marketing communication
bull For purposes of effectively comparing differences in characteristics between different age
groups of visitors in correspondence analysis studies it is recommended that age categories be
standardised in Aardklop and other festival questionnaires
bull Since the Living Standards Measure (LSM) is used to indicate the socio-economic status of an
individual or group it is a recommended to incorporate this index in the Aardklop and other
festival questionnaires for market segmentation purposes
bull Various other segmentation methods should also be applied to the Aardklop market so that
these methods and their effectiveness can be compared with the two methods applied in this
study
432 RECOMMENDATIONS FOR FURTHER RESEARCH
Based on this research further research is recommended for the benefit of future researchers
andor the South African arts festival market
bull Since the results of market segmentation studies where age was used as the segmentation
variable can be rather inconsistent it is recommended that other segmentation variables such
as travel motivations benefit segmentation etcetera are used for future market segmentation
research based on festivals or other tourism-related products
bull In South African publications no research articles were found where correspondence analysis
was applied to festivals In general this market segmentation method is implemented only to a
limited degree in the field of tourism Future researchers should consider using the exploratory
method as it is useful for transforming two or more categorical variables into a graphical display
within a low-dimensional space making it easier to identify the key features of the data when
interpreting the information Applying correspondence analysis with age as the dependent
variable to the two other major arts festivals in South Africa namely Grahamstown National Arts
Festival and Klein Karoo National Arts Festival could be beneficial for comparative purposes
bull The usefulness of a cluster analysis (more specifically K-means clustering) in the expenditureshy
based segmentation of this study appears to be robust meaningful and simple and it should be
implemented more in festival research
62
REFERENCES
ALI-KNIGHT J DRUMMOND S McMAHON-BEATTIE U ROBERTSON M amp YEOMAN I
2004 Festival and event management an international arts and culture perspective London
Butterworth-Heinemann 418 p
ANON 2008 Aardklop National Arts Festival httpwwwaardklopcozaindexphp
frontend_action=display_text_contentampitem_id=78 Date of access 2 February 2009
ARRIMOND G ACHENREINER G amp ELFESSI A 2003 An innovative approach to tourism
market segmentation research an applied study Journal of hospitality marketing and
management 10(3)25-56
ARRIMOND G amp ELFESSI A 2001 A clustering method for categorical data in tourism market
segmentation research Journal of travel research 39(4)391-397
BACKMAN K BACKMAN SJ UYSAL M amp SUNSHINE KM 1995 Event tourism an
examination of motivations and activities Festival management and event tourism 3(1)15-24
BARTHOLOMEW DJ STEELE F MOUSTAKI I amp GALBRAITH J1 2002 The analysis
and interpretation of multivariate data for social scientists London Chapman amp Hall 263 p
BELDONA S MORRISON AM amp OLEARY J 2005 Online shopping motivations and
pleasure travel products a correspondence analysis Tourism management 26(4)561-570
BENNETT JA amp STRYDOM JW 2001 Introduction to travel and tourism marketing Cape
Town Juta Education 252 p
BOWEN JT 1998 Market segmentation in hospitality research no longer a sequential process
International journal of contemporary hospitality management 10(7) 289-296
BUHALlS D 2000 Marketing the competitive destination of the future Tourism management
21(1)97-116
63
BURGAN B amp MULES T 2000 Estimating the impact of events sampling frame issues in
identifying event related expenditure (Paper presented at the Conference Events Beyond 2000
Setting the agenda Sydney p52-59) httpwwwbusinessutseduauacempdfs Events2000_
finalversionpdfpage=52 Date of access 13 February 2009
BURKE J amp RESNICK B 2000 Marketing and selling the travel product 2nd ed New York
Delmar Thompson Learning 301 p
CAl LA HONG G amp MORRISON AM 1995 Household expenditure patterns for tourism
products and services Journal of travel and tourism marketing 4(4) 15-40
CALANTONE RJ DI BENEDETTO I HAKAM A amp BOJANIC BC 1989 Multiple
multinational tourism positioning using correspondence analysis Journal of travel research 28(2)
25-32
CANNON TF amp FORD J 2002 Relationship of demographic and trip characteristics to visitor
spending an analysis of sport travel visitors across time Tourism economics 8(3)263-271
CHEN JS 2000 Cross-cultural differences in travel information acquisition among tourists from
three pacific-rim countries Journal of hospitality and tourism research 24(2)239-251
CHEN JS 2001 A case study of Korean outbound travellers destination images by using
correspondence analysis Tourism management 22(4)345-350
CHEN JS amp GURSOY D 2000 Cross-cultural comparison of the information sources used by
first time and repeat travellers and its marketing implications Hospitality management 19(2)191shy
203
CHEUNG Y 1994 Categorical criteria values correspondence analysis Omega international
journal ofmanagement science 22(4)371-380
COOK VJ amp MINDAK WA 1984 A search for constants the heavy user revisited I Journal
of consumer marketing 1 (4)79-81
COOPER DR amp EMORY CW 1995 Research methods Homewood III Irwin 691 p
64
DARDIS R SOBERON-FERRER H amp PATRO D 1994 Analysis of leisure expenditures in
the United States Joumal of leisure research 26(4)309-321
DIAZ-PEREZ FM BETHENCOURT-CEJAS M amp ALVAREZ-GONZALEZ JA 2005 The
segmentation of canary island tourism markets by expenditure implications for tourism policy
Tourism management 26(6)961-964
DIBB S amp SIMKIN L 1996 The market segmentation workbook target marketing for
marketing managers London Routledge 171 p
DIBB S amp SIMKIN L 2001 Marketing segmentation diagnosing and treating the barriers
Industrial marketing management 30(8)609-625
DIBB S amp SIMKIN L 2004 Marketing briefs a revision and study guide 2 nd ed Oxford
Elsevier Butterworth-Heinemann 363 p
DOLNICAR S CROUCHIG DEVINNEY T HUYBERS T LOUVIERE JJ amp OPPEWAL
H 2008 Tourism and discretionary income allocation heterogeneity among households
Tourism management 29(1 )44-52
DOWNWARD P amp LUMSDON L 2004 Tourism transport and visitor spending a study in the
North York Moors National Park UK Joumal of travel research 42(4)415-420
2ndFERRELL OC HARTLINE MD amp LUCAS GH 2002 Marketing strategy ed Fort
Worth Harcourt College Publishers 469 p
FORMICA S amp UYSAL M 1998 Market segmentation of an international CUltural-historical
event in Italy Joumal of travel research 36(4)16-24
FOSTER D amp DAVIS J 1994 Mastering marketing Houndmills Macmillan 287 p
FRECHTLlNG DC 2006 An assessment of visitor expenditure methods and models Joumalof
travel research 45(1 )26-35
FRISBY W amp GETZ D 1989 Festival management a case study perspective Joumalof
travel research 28(1)7-11
65
2ndGEORGE R 2004 Marketing South African tourism ed Cape Town Oxford University
Press 415 p
GETZ D 1993 Festivals and special events Encyclopaedia of hospitality and tourism 37945shy
955
GETZ D 1997 Event management and event tourism New York Cognizant Communication
Corp 386 p
GOKOVALI U BAHAR O amp KOZAK M 2007 Determinants of length of stay a practical use
of survival analysis Tourism management 28736-746
GOUGH I 1996 Social assistance in Southern Europe South European Society and Politics
1(1)1-23
GOUGH I EARDLEY T BRADSHAW J DITCH J amp WHITEFORD P 1997 Social
assistance in OECD countries Journal of European social policy 7(1)17-43
GURSOY D amp CHEN JS 2000 Competitive analysis of cross cultural information search
behaviour Tourism management 21 (6) 583-590
GURSOY D KIM K amp UYSAL M 2004 Perceived impacts of festivals and special events by
organisers an extension and validation Tourism management 25(2)171-181
HASSAN SS 2000 Determinants of market competitiveness in an environmentally sustainable
tourism industry Journal of travel research 38(3)239-245
HAVITZ ME DIMANCHE F amp BOGLE T 1994 Segmenting the adult fitness market using
involvement profiles Journal ofpark and recreation administration 12(3)38-56
HAWES DK TAYLOR DT amp HAMPE GD 1991 Destination marketing by states Journal
of travel research 30( 1) 11-17
HOFFMAN DL amp FRANKE GR 1986 Correspondence analysis graphical representation of
categorical data in marketing research Journal of marketing research 23(3)213-227
66
HOLBROOK MB amp SCHINDLER RM 1996 Market segmentation based on age and attitude
toward the past concepts methods and findings concerning nostalgic influences on customer
tastes Journal of business research 37(1)27-39
HORNEMAN L CARTER RW WEI S amp RUYS H 2002 Profiling the senior traveler an
Australian perspective Journal of travel research 41 (1 )23-37
HSU CHC KANG SK amp WOLFE K 2002 Psychographic and demographic profiles of
niche market leisure travelers Journal of hospitality and tourism research 26(1)3-22
HUGHES H 2000 Arts entertainment and tourism Oxford Butterworth-Heinemann 244 p
ISAR RF 1976 Culture and the arts festival of the twentieth century Cultures 3(2)125-145
JACKSON MJ amp OSULLIVAN D 2002 Festival tourism a contributor to sustainable local
economic development Journal of sustainable tourism 10(4)325-342
JANG S BAI B HONG G amp OLEARY JT 2004 Understanding travel expenditure
patterns a study of Japanese pleasure travelers to the United States by income level Tourism
management 25(3)331-341
JANG S ISMAIL JA amp HAM 2002 Heavy spenders medium spenders and lights spenders
of Japanese outbound please travelers Journal of hospitality amp leisure marketing 9(34)83-106
KARA A KAYNAK E amp KUCUKEMIROGLU O 1996 Positioning of fast-food outlets in two
regions of North America a comparative study using correspondence analysis Journal of
professional services marketing 14(2)99-119
KASTENHOLZ E 2005 Analysing determinants of visitor spending for the rural tourist market in
North Portugal Tourism economics 11 (4 )555-569
KAYNAK E KUCUKEMIROGLU O amp KARA A 1994 Consumers perceptions of airlines a
correspondence analysis approach in a global airline industry Management international review
34(3)235-254
KELLER KL amp KOTLER P 2006 Marketing management 12th ed Upper Saddle River NJ
Prentice Hall 729 p
KIM H BORGES MC amp CHON J 2006 Impacts of environmental values on tourism
motivation the case of FICA Brazil Tourism management 27(5)957-967
KIM K amp UYSAL M 2003 Perceived socio-economic impacts of festivals and events among
organisers Journal of hospitality and leisure marketing 10(34) 159-171
KOC E amp ALTINAY G 2007 An analysis of seasonality in monthly per person tourist spending
in Turkish inbound tourism from a market segmentation perspective Tourism management
28(1 )227-237
KOTLER P amp ARMSTRONG G 2004 Principles of marketing 10th ed New York Pearson
953 p
KREJCIE RV amp MORGAN DW 1970 Determining sample size for research activities
Educational and psychological measurement 30607-610
KRUGER M 2009 Spending behaviour of visitors to the Klein Karoo National Arts Festival
Potchefstroom North-West University (Dissertation - MA) 66 p
KRUGER M SAAYMAN M SAAYMAN A 2008 Bemarkingsprofiel en ekonomiese impak
van besoekers aan die Aardklop Nasionale Kunstefees Potchefstroom Instituut vir Toerisme en
Vryetydstudies 33 p
KRUGER M SAAYMAN M amp SAAYMAN A 2009 Expenditure-based segmentation of
visitors to Tsitsikamma National Park Cornell hospitality quarterly (In process of review)
KRUGER S amp PETZER DJ 2008 Measuring tourists satisfaction with quality of life issues at
an arts festival Acta commercii 8113-127
LAESSER C amp CROUCH G1 2006 Segmenting markets by travel expenditure patterns the
case of international visitors to Australia Journal of travel research 44(4)397-406
68
LAMB CW HAIR JF amp McDANIEL C 2000 Marketing 5th ed Cincinnati Oh Southshy
Western College 773 p
LAMB CW HAIR JF McDANIEL C BOSHOFF C amp TERBLANCHE NS 2004
Marketing 2nd South African ed Cape Town Oxford University Press 502 p
LEE CK LEE YK amp WICKS BE 2004 Segmentation of festival motivation by nationality
and satisfaction Tourism management 25(1 )61-70
LEE H 2001 Determinants of recreational boater expenditures on trips Tourism management
22659-667
LEE Y LEE C LEE S amp BABIN B 2008 Festivals capes and patrons emotions
satisfaction and loyalty Journal of business research 61 (1 )56-64
LEGOHEREL P 1998 Toward a market segmentation of the tourism trade expenditure levels
and consumer behaviour instability Journal of travel and tourism marketing 7(3)19-39
LEGOHEREL P amp WONG KKF 2006 Market segmentation in the tourism industry and
consumersspending what about direct expenditures Journal of travel and tourism marketing
20(2) 15-30
LEONES J COLBY B amp CRANDALL K 1998 Tracking the expenditures of the elusive
nature tourists of Southeastern Arizona Journal of travel research 36(3)5664
LONG PT amp PERDUE RR 1990 The economic impact of rural festivals and special events
assessing the spatial distribution of expenditures Journal of travel research 28(4)10-14
LUBBE BA 2000 Tourism distribution managing the travel intermediary Cape Town Juta
386 p
LUBBE BA 2003 Tourism management in Southern Africa Cape Town Pearson Education
290 p
69
MAK J MONCUR J amp YONAMINE D 1977 Determinants of visitors expenditures and visitor
lengths of stay a cross-section analysis of US visitors to Hawaii Journal of travel research
15(3)5-8
MALHOTRA KN amp BARTELS BC 2002 Overcoming the attribute prespecification bias in
international marketing research by using non-attribute-based correspondence analysis
International marketing review 19(1 )65-79
MARX S VAN ROOYEN DC BOSCH JK amp REYNDERS HJJ 1998 Business
management 2nd ed Pretoria Van Schaik Academic 797 p
MAYFIELD TL amp CROMPTON JL 1995 The status of the marketing concept among festival
organisers Journal of travel research 33(4)14-22
McDONALD M amp DUNBAR I 1995 Market segmentation London Macmillan 271 p
MciNTOSH RW amp GOELDNER CR 1990 Tourism principles practices philosophies New
York Wiley 534p
MEHMETOGLU M 2007 Nature-based tourists the relationship between their trip expenditures
and activities Journal of sustainable tourism 15(2)200-215
MIDDLETON VTC 1994 Marketing in travel and tourism Oxford Butterworth - Heinemann
393 p
MOK C amp IVERSON TJ 2000 Expenditure-based segmentation Taiwanese tourists to
Guam Tourism management 21 299-305
MOUTHINHO L amp WITT SF 1994 Tourism marketing and management handbook 2nd ed
Upper Saddle River NJ Prentice Hall 617 p
MULES T amp FAULKNER B 1996 An economic perspective on special events Tourism
economics 2(2)107-118
MURPHY PE amp CARMICHAEL BA 1991 Assessing the tourism benefits of an open access
sports tournament the 1989 BC Winter Games Journal of travel research 29(3)32-36
70
MYKLETUN RJ CROTTS JC amp MYK- bLETUN 1 2001 Positioning an island destination in
the peripheral area of the Baltics a flexible approach to market segmentation Tourism
management 22(5) 493-500
NICKELS WG amp WOOD MB 1997 Marketing relationships quality value New York
Worth 633 p
OPPERMAN M 1997 First-time and repeat visitors to New Zealand Tourism management
18(3)177-181
OXFORD CONCISE DICTIONARY 2001 London HarperCollins 832 p
PERREAULT WD amp McCARTHY EJ 1999 Basic marketing a global- managerial approach
Boston Mass Irwin McGraw-HilI 763 p
PISSOORT V 2007 Visitor segmentation of arts festivals a comparative study of three events
Potchefstroom North-West University (Dissertation - MA) 132 p
PITRUZELLO S 1999 Decommodification and the worlds of welfare capitalism a cluster
analysis Seminar paperWS90 European Forum Florence EUI
PIZAM A amp REICHEL A 1979 Big spenders and little spenders in US tourism Journal of
travel research 18(1 )42-43
POUTA E NEUVONEN M amp SIEVANEN T 2006 Determinants of nature trip expenditures in
Southern Finland implications for nature tourism development Scandinavian journal of hospitality
and tourism 6(2) 118-135
RAAIJ Wv amp FRANCKEN DA 1984 Vacation decisions activities and satisfactions Annals
of tourism research 11(1)101-112
RAA TH A 2009 Verbal communication with Aardklop office representative (Telephonic
interview on 12 March 2009)
RICAHRDS G 2001 Cultural attractions and European tourism Wallingford CAB International 245 p
SAAYMAN A amp SAAYMAN M 2005 Ekonomiese impak en profiel van besoekers aan die
Aardklop Nasionale Kunstefees Potchefstroom Instituut vir Toerisme en Vryetydstudies 58 p
SAAYMAN A amp SAAYMAN M 2006a Ekonomiese impak en profiel van besoekers aan die
Aardklop Nasionale Kunstefees Potchefstroom Instituut vir Toerisme en Vryetydstudies 47 p
SAAYMAN A amp SAAYMAN M 2006b Socio-demographics and visiting patterns of arts
festivals in South Africa Event management 9(4)211-222
SAAYMAN A amp SAAYMAN M 2007 Ekonomiese impak en profiel van besoekers aan die
Aardklop Nasionale Kunstefees Potchefstroom Instituut vir Toerisme en Vryetydstudies 33 p
SAAYMAN M 2000 En route with tourism Potchefstroom Leisure Consultants and
Publications 330 p
SAAYMAN M 2002 Tourism marketing in South Africa Potchefstroom Leisure Consultants and
Publications 450 p
SAAYMAN M 2006 Marketing tourism products and destinations getting back to basics 2nd ed
Potchefstroom Institute for Tourism and Leisure Studies 234 p
SAAYMAN M 2007 En route with tourism an introductory text 3rd ed Potchefstroom Leisure
Consultants and Publications 356 p
SAAYMAN M amp SAAYMAN A 2004 Economic impact of cultural events South African journal
of economic and management sciences 7(4)629-642
SAAYMAN M amp SAAYMAN A 2006 Does the location of arts festivals matter Papers in
regional science 85(4)569-584
SAAYMAN M SAAYMAN A amp RHODES JA 2001 Domestic tourist spending and economic
development the case of the North-West Province Development Southern Africa 18(4)443-452
SAAYMAN M SLABBERT E amp SAAYMAN A 2005 Profile and economic impact of
Volksblad Arts Festival Potchefstroom Institute for Tourism and Leisure Studies 32 p
72
SAAYMAN M SLABBERT E amp SAAYMAN A 2009 Expenditure-based segmentation of
visitors to the Grahamstown National Arts Festival Management dynamics (In process of review)
SAAYMAN M VAN DER MERWE P amp PIENAAR J 2008 Expenditure-based segmentation
of South African biltong hunters South African journal of wildlife research (In process of
publication )
SAT see SA TOUR
SATOUR South African Tourism Board 2007 Dhttpwwwstatssagovzapublications
publicationsearch Date of access 10 March 2008
SHANKA T amp TAYLOR R 2004 A correspondence analysis of sources of information used by
festival visitors Tourism analysis 9(12)55-62
SLABBERT E 2002 Key success factors of tourist market segmentation Potchefstroom
Potchefstroom University for Christian Higher Education (Dissertation - MA) 122 p
SLABBERT E 2004 An integrated tourism model for cultural events Potchefstroom North-West
University (Thesis - PhD) 220 p
SLABBERT E SAAYMAN M SAAYMAN A amp VIVIERS P 2008 Die sosio-ekonomiese
impak van besoekers aan die ABSA KKNK Potchefstroom Instituut vir Toerisme en
Vryetydstudies 87 p
SMITH C amp JENNER P 1998 The impact of festivals and special events on tourism Travel
and tourism analyst 4(1)73-100
SMITH LJ 1990 Dictionary of concepts in recreation and leisure studies Westport Greenwood
Press 384 p
spons DM amp MAHONEY EM 1991 Segmenting visitors to a destination region based on
the volume of their expenditures Business research division 29(4)24-31
THRANE C 2002 Jazz Festival visitors and their expenditures linking spending patterns to
musical interest Journal of travel research 40(3) 281-286
73
TWEDT DW 1964 How important to marketing strategy is the heavy user Journal of
marketing 28(1 )71-72
UYS MC 2003 A sustainable marketing strategy for Dutch tourists to South Africa
Potchefstroom Potchefstroom University for Christian Higher Education (Dissertation - MCom)
147 p
UYSAL M GAHAN L amp MARTIN B 1993 An examination of event motivations a case
study Festival management and event tourism 1(1)5-10
VAN HEERDEN A 2003 The economic impact of the Aardklop National Arts Festival in
Potchefstroom Potchefstroom PU vir CHO (Dissertation - MA) 105 p
VAN ZYL C 2005 Optimum market-positioning models for South African Arts festival scenarios
Pretoria University of South Africa (Thesis - PhD) 433 p
VISSER G 2005 Lets be festive exploratory notes on festival tourism in South Africa Urban
forum 16(3)155-175
VIVIERS P SLABBERT E SAAYMAN M amp SAAYMAN A 2008 The socio-economic
impact of visitors to Grahamstown National Arts Festival Potchefstroom Institute for Tourism and
Leisure Studies 87 p
WALO M BULL A amp BREEN H 1997 Achieving economic benefits at local events a case
study of a local sports event Festival management amp event tourism 4(34)95-106
WEDEL M amp KAMAKURA W 2002 Introduction to the special issue on market segmentation
International journal of research in marketing 19(3) 181-183
WOODSIDE AG COOK VJ amp MINDAK W 1987 Profiling the heavy traveler segment
Journal of travel research 25(3)9-15
WORLD TOURISM ORGANISATION (WTO) 2002 Enhancing the economic benefits of tourism
for local communities and poverty alleviation World Tourism Organisation 60 p
WTO see WORLD TOURISM ORGANISATION
74
APPENDIX A Visitor questionnaire
75