destination segmentation: a recommended two-step … · keywords: destination, segmentation, ......
TRANSCRIPT
1
Destination Segmentation: A Recommended Two-step Approach
Keywords: destination, segmentation, stakeholder theory, TwoStep® cluster analysis
Aaron Tkaczynski, The School of Tourism, The University of Queensland, Brisbane,
Queensland, 4072, Australia.
Telephone: +61 7 3346 7789. Fax: + 61 7 3346 8716.
Email: [email protected].
Sharyn Rundle-Thiele, Marketing Department, Griffith Business School, Griffith University,
Nathan, Queensland, 4111, Australia.
Telephone: +61 7 3735 6446. Fax: +61 7 3735 7126.
Email: [email protected].
Narelle Beaumont, School of Marketing and Management, University of Southern
Queensland, PO Box 4196, Springfield, Queensland, 4300, Australia.
Telephone: +61 7 3470 4570. Fax: +61 7 3470 4501.
Email: [email protected].
Original Submission Date: 06/17/2008
Revised Submission Date: 11/30/2008
2
Abstract
Tourism segmentation studies have traditionally developed segmentation variables from
secondary data or a review of the literature. Based on stakeholder theory, this study
recommends a two-step approach to destination segmentation, incorporating the views of
multiple stakeholders. This paper details the recommended segmentation approach using one
Australian destination. Step one involved understanding how multiple stakeholders viewed
their market to identify relevant segmentation variables. Step two involved segmenting the
destination based on the variables identified in step one. When compared with segments
currently used by the destination marketing organization, the segments derived from the two-
step approach to segmentation captured more of the tourists visiting the area. Segmentation
guides budgetary decision making and the proposed two-step approach to segmentation may
assist tourism destinations to maximize limited resources by targeting more of the types of
tourists who are frequenting the destination.
3
Introduction
Market segmentation has been widely acknowledged in the tourism marketing literature as a
relevant marketing strategy (e.g. Bieger and Laesser 2002; Dolnicar 2007; Johns and
Gyimothy 2002; Kolb 2006). Market segmentation research has assisted researchers to
understand the ways that destinations can effectively segment tourism markets and thus
identify and attract tourists from key target markets (e.g. Cha, McCleary and Uysal 1995;
Dolnicar and Leisch 2003; Sarigollu and Huang 2005).
The majority of segmentation studies have emphasized building tourism profiles at a
destination through using a visitor survey developed from studies in the literature (e.g.
Horneman et al. 2002; Kim, Jogarantam and Noh 2006; McGuiggan and Foo 2004), or
through using secondary data (e.g. Carmichael and Smith 2004; Jang, Morrison and O’Leary
2004; Laesser and Crouch 2006). Very little research has been conducted taking a stakeholder
view to destination segmentation, despite many authors promoting the importance of utilizing
a stakeholder approach for destination management and marketing purposes (e.g. Blain, Levy
and Ritchie 2005; Fyall and Garrod 2005; Jamal and Getz 1995; Morgan, Pritchard and
Piggott 2003; Sautter and Leisen 1999; Sheehan, Ritchie and Hudson 2007; Sheehan and
Ritchie 2005).
This research will contribute to the tourism literature by proposing a two-step approach to
segmentation. This paper details a two-step approach to segmentation using one Australian
destination. Step one involved understanding how multiple stakeholders viewed their market
to identify relevant segmentation variables. Step two involved segmenting the destination
based on the variables identified in step one. In contrast to previous tourist-focused

4
segmentation studies, the two-step approach recommended and detailed in this study
considers both tourism stakeholders and tourists. The segments derived from the proposed
two-step approach are then compared and contrasted with the segments currently utilized by
the destination marketing organization (DMO).

5
Stakeholder theory
Stakeholder theory, a management theory proposed by Freeman (1984), argues that the
interests of all stakeholders are of intrinsic value (Donaldson and Preston 1995) to an
organization. Freeman (1984, p. 46) argues that a stakeholder “is any group or individual who
can affect or is affected by the achievement of the organization’s objectives”. This theory
suggests that an organization that fulfils its stakeholders’ interests will perform better
than firms that do not address these groups’ interests (Agle, Mitchell and Sonnenfeld
1999; Berman et al. 1999; Post, Preston and Sachs 2002). In tourism, this theory can be
applied to a destination where many authors have identified different stakeholders (e.g.
Sautter and Leisen 1999; Sheehan and Ritchie 2005; Sheehan, Ritchie and Hudson 2007). A
destination is a region or place with a distinct image that has natural attractions such as
climate, hydrology, topography and/or iconic attractions such as amusement parks and
shopping facilities (Weaver and Lawton 2006). Destination stakeholders include hotels,
restaurants, tour operators, government bodies, attractions, gas stations, retail outlets, city
officials, transportation companies, incentive planners, airlines and/or universities (Blain,
Levy and Ritchie 2005). Whilst the DMO is responsible for marketing a destination, it is
rarely an operator of the product and is thus reliant on stakeholder support to successfully
promote and market a destination (Pike 2004). If one of the key stakeholders (e.g. a
transportation company) withdraws its support for the marketing of the destination, the
destination may be threatened as a common approach is not being utilized (Clarkson 1995).
For the DMO to ensure that various stakeholders support tourism marketing of the destination,
it needs to ensure the needs and interests of stakeholders are met when selecting target
markets (Sheehan, Ritchie and Hudson 2007). A two-step approach is conducive to

6
developing a holistic destination image and it may enable a destination to succeed in the long
run by having a common goal and strategy at the destination level.
Market segmentation
Destination stakeholders recognize the importance of effective marketing strategies to the
area’s collective success with tourism. This can be difficult to achieve due to the self interest
of stakeholders in fulfilling their own objectives. In addition, those responsible for marketing
a destination (e.g. the DMO) need to acknowledge that every tourist is different and that the
tourism industry cannot possibly cater for all individuals separately (Dolnicar 2007).
Segmentation is a marketing strategy (Smith 1956) that helps managers effectively market a
destination (Dolnicar 2007; Pike 2005). Segmentation involves viewing a heterogeneous
market as a number of smaller more homogeneous markets (Smith 1956). These smaller
markets can be distinguished by different consumer needs, characteristics, or behavior
(Kotler 1980). For segmentation to be managerially useful, each segment needs to be
accessible, measurable and substantial (Kotler 1980).
A review of the literature indicates there is no one correct way to segment a market (Kotler
1980; Beane and Ennis 1987). Tourism researchers have applied as few as one and as many
as four segmentation bases - geographic, demographic, psychographic and behavioral as
described by Kotler (1980) - to segment markets. Several researchers (e.g. Andereck and
Caldwell 1994; Johns and Gyimothy 2002; Lehto, O’Leary and Morrison 2002) have
criticized the widespread use of demographic and geographic segmentation bases due to their
inability to predict who will travel to a destination. However, other authors such as Cha,
McCleary and Uysal (1995), Morrison et al. (1996) and Mudambi and Baum (1997) have
7
suggested these bases can be useful in predicting tourist behavior. Recently, Tkaczynski,
Rundle-Thiele and Beaumont (2009) reviewed 119 destination segmentation studies and
identified a mixture of the usage of geographic, demographic, psychographic and behavioral
bases to segment markets. This review identified that less than 10 per cent of these studies
employed only one or two segmentation bases. The use of two or three segmentation bases
was most typical with 39 per cent of studies using three segmentation bases and 29 percent
using two bases to segment a market. Twenty two percent used four bases to segment tourist
markets.
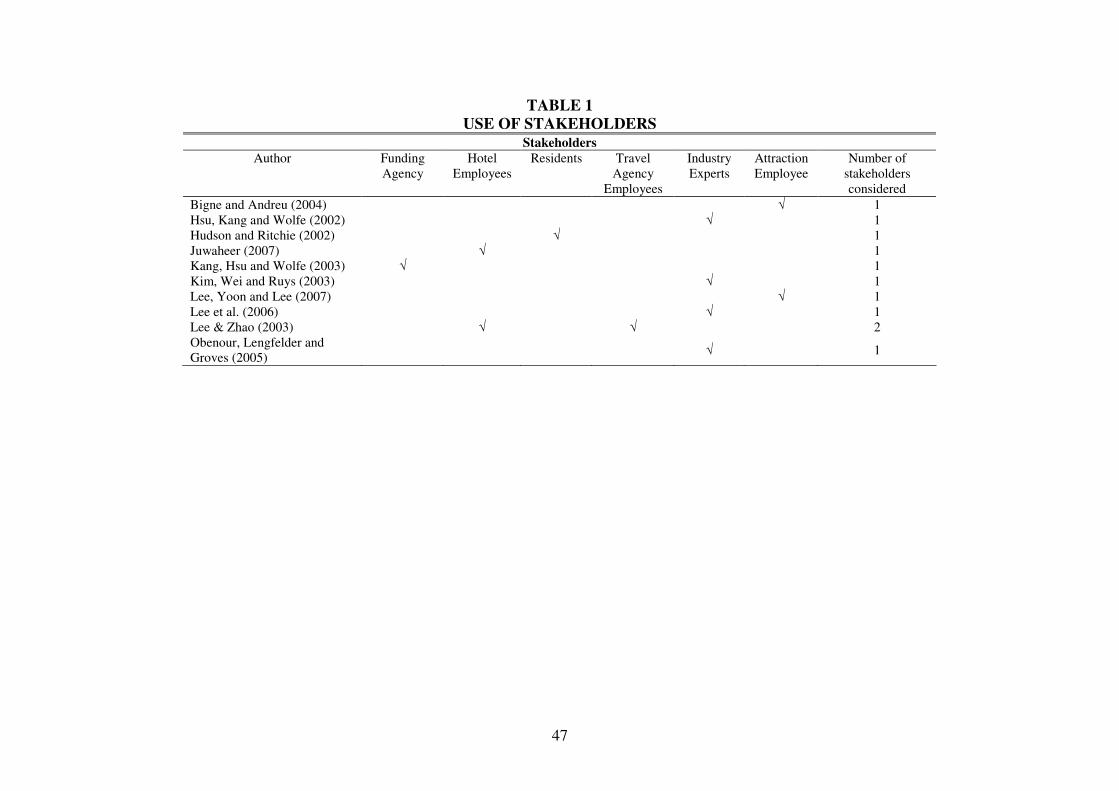
We reviewed 119 academic studiesi and identified that of the 84 per cent of studies that listed
how their questionnaire was developed, the majority developed tourist profiles solely from
the tourism marketing literature (39%) or by using secondary visitor data (35%). Few studies
(8.4%) considered stakeholders’ views. Further, the stakeholders that were considered (e.g.
hotel and travel agency employees) were not decision makers for managerial and marketing
purposes. The studies that employed a stakeholder approach are listed in Table 1.
INSERT TABLE 1 HERE
None of the studies that considered stakeholders when segmenting tourists involved more
than two types of stakeholders. Therefore, preference has been given to certain types of
stakeholders instead of considering a range of tourism stakeholders relevant to a destination
(e.g. DMOs, accommodation providers, tour operators). It should be noted that the
stakeholders that were considered in the reviewed studies (e.g. hotel and travel agency
employees) were not destination decision makers for managerial and marketing purposes.
Additionally, the studies in this review did not consider the different types of organizations at

8
a destination within the one stakeholder category (e.g. the different types of accommodation
providers). As all stakeholder types are crucial for the continual operation of a destination,
their insights into market segmentation may be useful for marketing and management
purposes as they have been identified as knowledgeable about tourism at the destination and
their tourist markets (e.g. Sautter and Leisen 1999; Sheehan and Ritchie 2005; Sheehan,
Ritchie and Hudson 2007).
9
Two-step segmentation approach
To date, little segmentation research has explicitly reported consideration of tourism
stakeholders. Only 8 per cent of the 119 academic studies reviewed explicitly referred to
tourism stakeholders and no more than two tourism stakeholders were considered in any
single study. Multiple stakeholder viewpoints would allow researchers to become more
familiar with, and hence knowledgeable about, the destination under study. Unless the
researcher has a complete understanding of tourism stakeholders, some variables that may be
important to tourism stakeholders may be overlooked (examples might include different types
of expenditure or activities sought). The variables generated in these studies are likely to be
guided by the researcher’s own experience and their review of the literature. Such endeavors
may not sufficiently accommodate the variation within a single tourism destination. For
example, five star hotels at a destination attract certain types of tourists while backpacker
hostels attract a completely different cohort. It is also noted that, whilst some studies have
employed a stakeholder perspective, multiple stakeholders with decision making
responsibilities have not been considered. As several authors (e.g. Blain, Levy and Ritchie
2005; Sautter and Leisen 1999; Sheehan and Ritchie 2005) have argued, many stakeholders
are influential in marketing a destination.
A two-step approach is an approach to segmentation that considers two points of view. The
two-step approach to segmentation proposed here requires consideration to be given to both 1)
tourism stakeholders and 2) tourists. Segmentation researchers have not considered tourism
stakeholder views and to date a two-step research design utilizing a multiple stakeholder and
visitor perspective has not been applied in tourism segmentation research. These observations
provided the impetus for the study. The proposed two-step approach is described in this study.

10
In the first step a case study with semi-structured interviews was employed to identify how
tourism stakeholders segment their market. Variables identified by stakeholders were used to
construct a survey for administration to tourists in the second step. Finally, the segments
derived from the proposed two-step approach to segmentation were compared and contrasted
with the segments currently identified by the DMO for destination marketing purposes.
Step one – Destination stakeholder case study
A case study method was utilized for the first step of the research. The methodology used in
step one is detailed in Tkaczynski, Rundle-Thiele and Beaumont (2009). A case study
method was chosen for step one as it has been has been widely utilized by researchers
seeking to understand marketing phenomena (e.g. Awaitefe 2004; Prideaux and Cooper 2002;
Sheehan, Ritchie and Hudson 2007). This technique permits researchers to investigate
complex issues in some depth (Yin 2003). A single case study of one Australian destination
was deemed most appropriate to ensure that an in-depth understanding of market
segmentation from a tourism stakeholder perspective was obtained (Lee 1999). Efforts were
made to include participants from a wide cross section of the tourism stakeholders in the
destination to maximize variation among stakeholders. Thirteen interviews were conducted
with the local government organization, DMOs (regional and state), accommodation
providers, and tour operators. The accommodation providers were a backpacker resort,
caravan park, self-contained unit provider, and a low, a medium and a high star rating hotel.
The tour operator stakeholders consisted of a whale watching operator, a fishing charter
operator, an adventure tour operator, and a museum. Further detail on the selection of
interviewees and the data analysis methods and findings are detailed in Tkaczynski, Rundle-
Thiele and Beaumont (2009).
11
To identify how various tourism stakeholders segment their tourist market, the 13
tourism stakeholders were asked to describe how they segmented the market. In instances
where formal marketing plans were not employed, probes were applied to understand
whether the market was approached as a whole or in parts (segments). It was identified that
the stakeholders segmented their markets differently. Key findings were that four
segmentation bases as identified by Kotler (1980) were identified by destination stakeholders
as relevant for segmenting tourists visiting the destination. Specifically, tourism stakeholders
identified 13 variables they felt were relevant for segmentation purposes, namely age, gender,
travel party composition (TPC), income, education (demographic), location (geographic),
trip purpose, push motivations, pull motivations, activities (psychographic), expenditure,
number of nights, and purchasing behavior (behavioral). The results of step one are
elaborated in Tkaczynski, Rundle-Thiele and Beaumont (2009).
Step two – Tourist survey
A survey was then developed to enable data to be collected from tourists visiting the
destination for each of the 13 variables identified by the destination stakeholders in step one.
The survey was written in English. Some modifications were made from the semi-structured
interviews. Purchasing behavior and expenditure were combined to form three expenditure
variables: activities expenditure, food and beverages expenditure and accommodation
expenditure. This modification was needed as the destination stakeholders knew that tourists
spent their money on these items, but did not know the amount. These variables represent
different aspects of tourists’ expenditure at the destination and, consistent with other studies
12
(e.g. Hong et al. 2005; Lehto, O’Leary and Morrison 2004; Wilson and Thilmany 2006), we
decided to treat them separately.
As motivations have been frequently identified in the tourism marketing literature (e.g.
Baloglu and Uysal 1996; Cha, McCleary and Uysal 1995; Kim and Lee 2002) and are part of
past travel surveys at the destination, motivations based on these sources were included in the
survey. Both push and pull motivations were chosen as they represent different aspects of a
tourist’s motivation (Dann 1981; Baloglu and Uysal 1996; Yuan and McDonald 1990).
Thirty-nine questions were used for this questionnaire. Activities sought, push motivations,
pull motivations and nights were treated as continuous variables based on the interview
responses. The first three variables were measured in a binary ‘yes’ or ‘no’ format and ‘yes’
responses were summed to calculate a number for each variable. This format has been used
for activities (e.g. Dolnicar 2004a; Lee et al. 2006; Morrison et al. 2003) and motivations (e.g.
Dolnicar 2004b; Kim, Wei and Ruys 2003) in the literature. The possible activities sought
were identified from the semi-structured interviews. Six were considered. In total, 11 push
and 12 pull motivations were measured. Nights required the respondent to specify the number
of nights they had stayed or were planning to stay at the destination. Average length of stay
has been used in past studies (e.g. Alipour et al. 2007; Becken, Simmons and Frampton 2003;
Hsu and Kang 2007).
Nine of the questions, age, gender, travel party composition (TPC), income, location, trip
purpose, accommodation expenditure, activities expenditure, and food and beverages
expenditure were designed as categorical variables, as the stakeholders explained these
13
variables based on the different categories. It was also identified in the review of the 119
destination segmentation studies that categories were commonly used for these variables.
Consistent with prior studies, six categories were chosen to capture age (e.g. Hsu, Kang and
Wolfe 2002; Johns and Gyimothy 2002; Yoo, McKercher and Mena 2004) and household
income (e.g. Bonn, Joseph and Dai 2005; Kang, Hsu and Wolfe 2003; Pike 2002) of
respondents. For gender, respondents needed to indicate whether they were male or female.
Consistent with prior research (e.g. Becken, Simmons and Frampton 2003; Dolnicar and
Laesser 2007; Morrison et al. 2003), travel party composition was categorized into five
groups. Similar to the tourism literature (e.g. Hong et al. 2005; Onyx and Leonard 2005; Park
et al. 2002), the origin of tourists were classed into categories once all were identified. The
four most popular trip purpose options from the interviews were chosen. With reference to
the literature (e.g. Diaz-Perez, Bethencourt-Cejas and Alvarez-Gonzalez 2005; MacKay,
Andereck and Vogt 2002; McCleary, Weaver and Meng 2005), five categories were used to
identify the three daily expenditure variables.
14
Tourist survey data collection
The sample population for this study was tourists at the destination under study. Respondents
needed to be over 18 and had or would have spent at least a night in the chosen destination.
The tourists also needed to have made the choice to visit the destination for a purpose other
than business/work. This was justified as the results were to be compared to the type of
visitor segments targeted by the DMO.
A sample size of at least 500 needed to be collected to provide a 95 per cent confidence level
so that results could be generalized to this tourist population (Veal 2005). To obtain this
minimum sample size, the questionnaire survey was conducted using a cross-sectional study
design over a seven month period from July 2007 to January 2008. By using this design, the
seasonality at the coastal destination was not a limitation, as the data was collected during the
different seasons, catering to the high and low tourist times.
A non-probability sampling method in the form of quota sampling was utilized. Whilst
research bias is a concern, probability sampling was impossible as a list of sampling units
with a known probability was unable to be verified (Aaker, Kumar & Day 2003; Veal 2005).
The regional tourism authority (DMO) has primary markets that it targets, but every type of
tourist that travels to this region is not known. Researchers of non-probability sampling argue
that it can readily be used in the exploratory stages of research (Aaker, Kumar & Day 2003;
Malhotra 2004) which is essentially what this research represents. To ensure that a large
enough group of respondents was targeted, at least 120 surveys were collected each month.
This allowed monthly comparisons to be made.
15
In researching the destination, the researcher considered popular locations where tourists of
all different demographics may be during the beginning or the end of their holiday. By
choosing many locations, this ensured that a dominant location was not chosen which may
have biased results (Veal 2005). The respondents were identified as a ‘first past the post’
sampling method (McKercher and Wong 2004). Thus, people who were there at the time
were approached by the researcher to complete an on-site survey.
Questionnaires were collected at accommodation places, such as a caravan park, a
backpacker hostel and a five star resort, at a visitor information centre, and at transport
locations, such as the bus terminal, the ferry terminal and the airport. A minimum of eight
responses each month were collected from each location to ensure that a specific type of
tourist that was the most easily accessible did not dominate the results. In over 97 per cent of
the situations a researcher was present to distribute and collect the questionnaire. Several
questionnaires were left in the lobby at the accommodation places and the main seating area
of the visitor information centre. In these instances approximately 20 questionnaires were
completed, indicating a very low response rate without a researcher present. The time spent at
each location to collect the responses varied. The researcher spent whole days at the
accommodation places to achieve the quotas, whereas only one hour was necessary at the
airport. It is noted that the largest quota of responses was collected at the airport terminal, as
these respondents had the highest acceptance rate for completing the questionnaire. Tourists
with different demographics, geographics, psychographics and behavioral tendencies also
used this similar transport mode which ensured that a diversity of tourists could be targeted at
this location. In total 84.9 percent of tourists approached chose to complete the questionnaire.
16
Tourist survey data analysis
Data collected in the survey were analyzed using the Statistical Package for the Social
Sciences (SPSS) Version 15.0 (SPSS 2007). TwoStep® cluster analysis using the log-
likelihood measure was used to reveal natural groupings in the data set using all of the
segmentation variables identified in the case study methodology. In the review of the 119
studies, it was identified that 69.2 per cent chose cluster analysis to profile tourists. Most
have employed factor analysis to reproduce items in subsequent analysis, followed by
cluster analysis (43.7% of the 119 reviewed studies). Other studies have employed
only cluster analysis (e.g. Beh and Bruyere 2007; Bieger and Laesser 2002; Dolnicar and
Leisch 2003; Hyde 2006; McKercher et al. 2003). Another method was the usage of self
organizing neural networks (e.g. Bloom 2004; Dolnicar 2004a; Kim, Wei and Ruys 2003).
The authors have only noted two prior usages of TwoStep® cluster analysis to segment
tourists at a destination (Hsu, Kang and Lam 2006; Laesser, Crouch and Beritelli 2006).
TwoStep® cluster analysis was considered most appropriate for this research as it is the only
type of cluster analysis in SPSS that forms clusters based on both continuous and categorical
data (Chiu et al. 2001; Norusis 2008). Data transformation prior to analysis was therefore not
required. TwoStep® cluster analysis permits researchers to retain full information providing
rich explanation for managerial decision making purposes. In addition, TwoStep® cluster
analysis is suitable for a large data set (n = 852 in this study) (Hsu, Kang and Lam 2006).
TwoStep® cluster analysis involves two stages. In the first step, original cases are grouped
into preclusters by constructing a cluster features tree (Okasaki 2007). In the second step, the
standard hierarchical clustering algorithm on the preclusters is used (Norusis 2008). Forming
clusters hierarchically lets the researcher explore a range of solutions with different numbers
17
of clusters (Norusis 2008). This produces a range of solutions which is then reduced to the
best number of clusters on the basis of Schwarz’s Bayesian information criterion (BIC). The
BIC is considered one of the most useful and objective selection criteria, as it avoids the
arbitrariness of traditional clustering techniques (Chiu et al. 2001; Norusis 2008). In
considering which variables to remove from the analysis, the one with the lowest BIC is
preferred (Norusis 2008). Once the cluster solution is formed, chi-square tests are conducted
for categorical variables and student t-tests for continuous variables to examine the
importance of individual variables in a cluster (Norusis 2008). If the absolute value of the
statistic for a cluster is greater than the critical value, the variable is considered important in
distinguishing that cluster from the others (Norusis 2008).

18
Results
Identification of segments
The TwoStep® cluster analysis was used to form the clusters based on the segmentation
variables identified by tourism stakeholders in stage one of the research. It was identified that
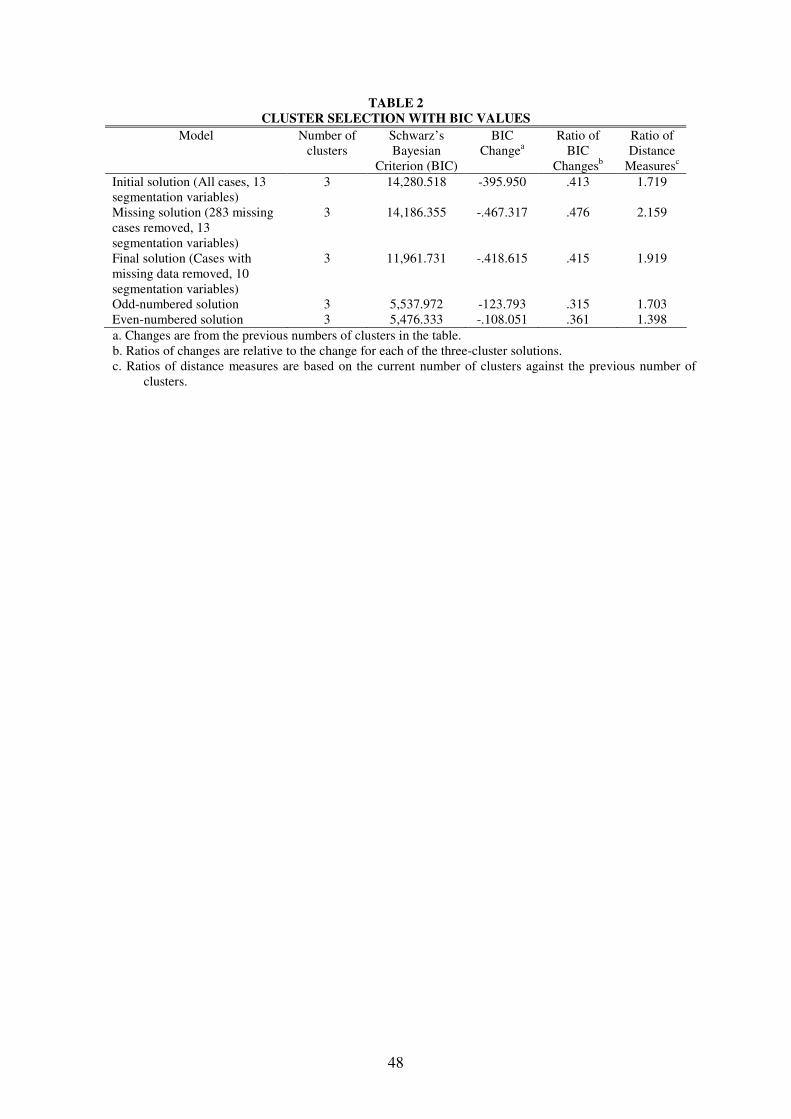
283 cases had missing data. Cluster analysis was performed on both the full data set and a
data set that had all cases with missing data removed. The solution with missing data cases
omitted produced a smaller BIC and a relatively large range of BIC change and distance. It
was, therefore, decided to remove cases with missing data. Key statistics are reported in
Table 2.
INSERT TABLE 2 HERE
Three clusters were revealed within the tourism data set. Three of the variables, gender,
number of activities and trip purpose, did not distinguish clusters and were removed from the
analysis. Cluster analysis was performed once again with the ten variables that were capable
of distinguishing between segments. Three clusters were revealed with a smaller BIC value
and a lower BIC change and distance measure. A cluster solution with 10 segmentation
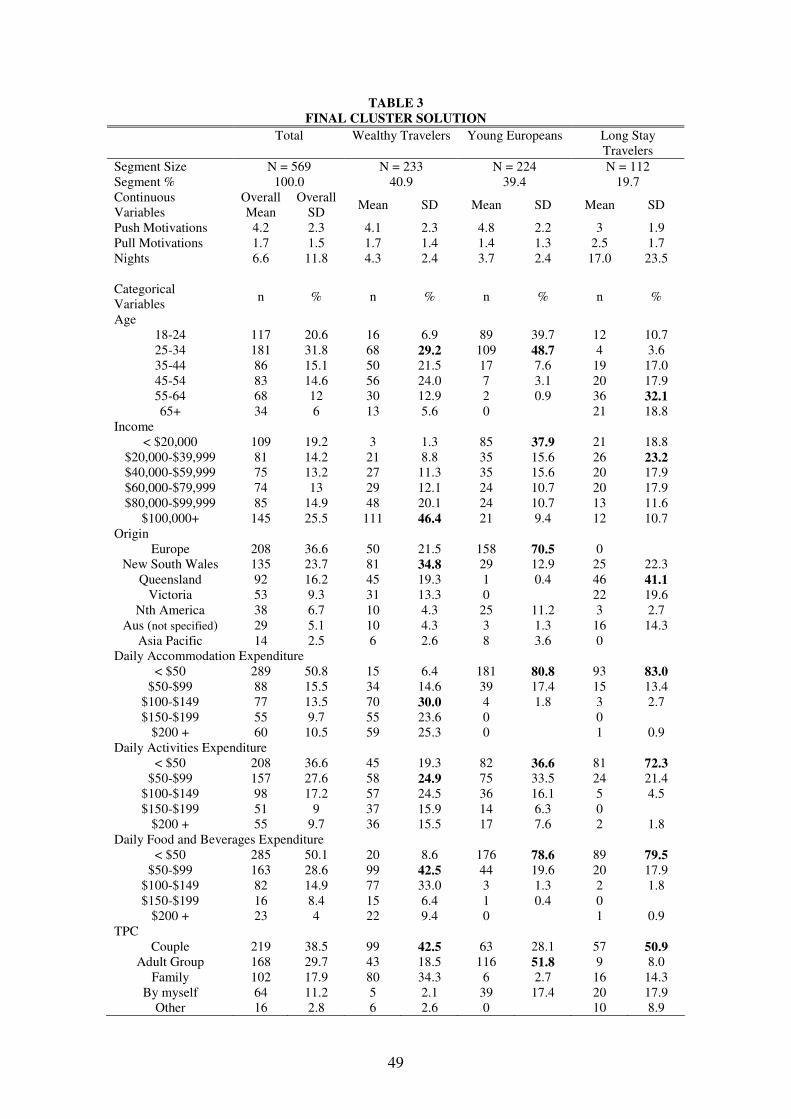
variables was accepted as the final solution (see Tables 3 and 4). Student t-tests and chi-
square tests confirmed that each of the ten variables varied between clusters.
INSERT TABLE 3 HERE
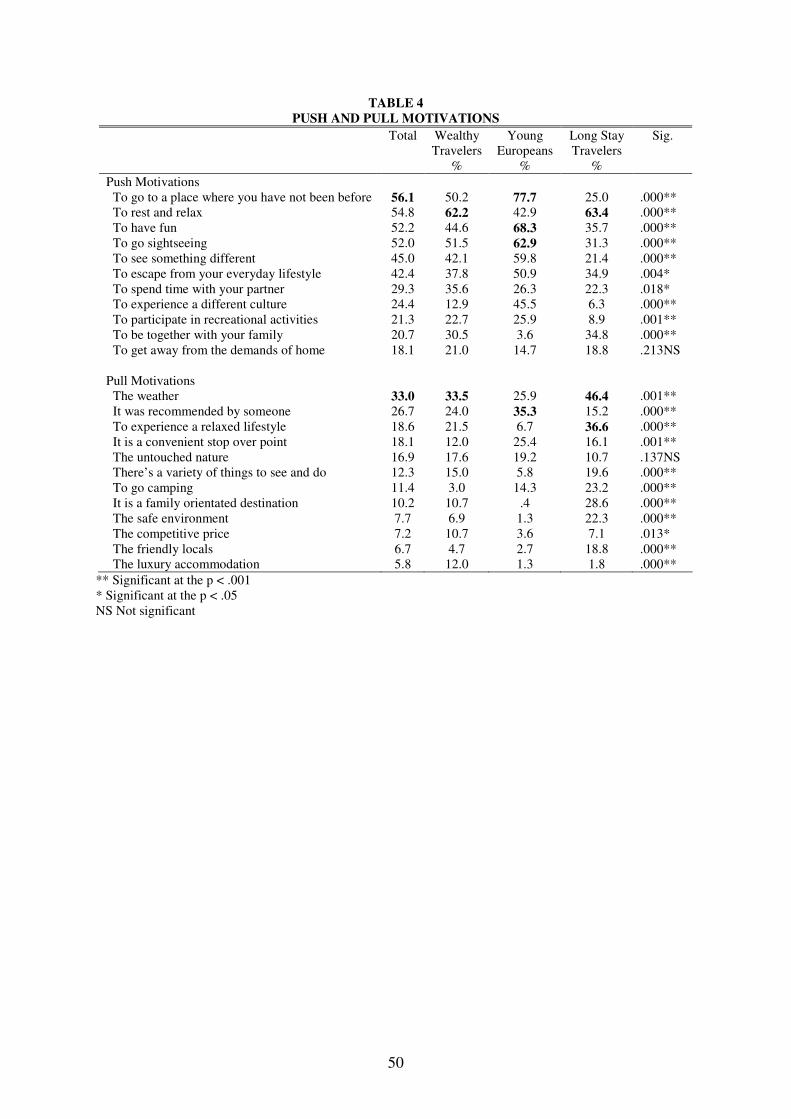
INSERT TABLE 4 HERE

19
The first cluster is the largest (40.9%). The majority of people in this segment earn over
$100,000 a year and travel from New South Wales (NSW). Tourists in this segment are
primarily aged between 25-54. These tourists travel as a couple or as a family and they stay
on average four nights. Of the three clusters, this segment spends the most on a daily basis
with over $100 for daily accommodation and $50-$149 for both daily activities and food and
beverages expenditure. This segment has roughly four push motivations and one pull
motivation. The most popular push motivation was “to rest and relax” and “the weather”
pulled tourists most frequently to the destination. The key distinguishing feature of this
segment is the higher income and daily expenditure. This cluster was, therefore, labeled
wealthy travelers.
The second cluster is virtually the same size (39.4%). This segment is young with the
overwhelming majority aged under 35. This segment earns the least and travels
predominantly from Europe. The cluster spends less per day when compared with the wealthy
traveler segment with under $50 being the most popular option for all three expenditure
categories. Approximately half of this segment travel as an adult group. This segment stays
for 3-5 nights. This segment has the most push motivations and the fewest pull motivations.
“It was recommended by someone” was the dominant pull motivation and “to go to a place
you have not been before” was the most popular push motivation. The key distinguishing
features of this segment is that the tourists are young and travel from Europe. Due to these
features, this segment is labeled young Europeans.
The third cluster is the smallest and represents approximately 20 per cent of the tourism data
set. These tourists are older with more than half being aged over 55. The income of this
segment was approximately evenly distributed across the six categories. This segment largely
20
comprises domestic travelers with Queensland (QLD) the dominant origin (41.1%). These
tourists travel as a couple and stay the longest, an average 17 nights. They have the lowest
number of push motivations and the highest number of pull motivations. This segment also
travels “to rest and relax” and is pulled by “the weather” and “to experience a relaxed
lifestyle”. This segment is distinguishable based on its long length of stay. This segment was,
therefore, labeled long stay travelers.
To validate the model, the tourists were sorted based on the month of when the survey was
collected. The month was considered the most effective option as it enabled both data sets to
contain tourists from both the high (e.g. Christmas period) and low seasons (e.g. mid-year).
Combining months also ensured that month of data collection did not bias the sample. Three
odd-numbered months (n = 253) and three even-numbered months (n = 246) were chosen to
split the file evenly. As can be seen from Table 2, both models produced a similar BIC value,
BIC change and ratio of change. It was identified that the size of the segments varied very
little. It was also noted that the split files accurately represented the final solution with only
minor changes identified. On this basis, it was concluded that the three-cluster solution was
validated for this study (Hair et al. 2006).
Comparison to DMO segments
The segments derived from the two-step approach were then compared with the primary
segments that have been identified by the DMO as set out in Table 5 (Tourism Queensland
2007). The DMO segments were identified through a combination of tourism researchii and
market intelligence by Tourism Queensland in coordination with Tourism Australia.
According to Tourism Queensland (2007) these segments represent the tourists who have the

21
greatest potential to be converted into visitors to the region, and therefore, a high chance of
providing a positive return on investment in marketing activities. Young parents (family) and
older tourists (aged 45 and over) with an annual household income of $60,000 dominate the
segments that are currently described by the DMO.
The DMO also identifies two international markets that are believed to have the most
potential to convert into visitors (Tourism Queensland 2007). No research has been
conducted by the DMO, and these markets are based on information from Tourism Australia,
the national tourism organization. The first segment is classed as the international drive
market (size is estimated at 360,000 for all of QLD). This segment travels to fulfill an inner
drive to challenge themselves. This group travels from the United Kingdom (UK), Germany,
United States of America (USA), Europe and New Zealand (NZ). The second international
market is the youth and backpacker market (size is estimated at 320,000 for all of QLD)
which travels for the same reasons as the international drive market. This segment travels
from the UK, Germany, USA and Europe. The youth and backpacker market is considered
secondary to the drive market (Tourism Queensland 2007).
The DMO and state tourism organization, in partnership with other local tourism stakeholders
such as the regional council, market the destination to potential tourists (Tourism Queensland
2007). Minimal funds are available and have to be allocated carefully. In recent years one-off
campaigns have been used to target both intrastate and interstate tourists. For example, a
$400,000 five week integrated campaign was run in Sydney (NSW) following the
introduction of direct flights from Sydney to the destination in July 2005. This campaign
employed television, print, and online media to target interstate tourists.
22
On an international level, the destination participates in several marketing initiatives. This
includes the Journalists Program for international journalists which showcases the region’s
main features to self-drive tourists (Tourism Queensland 2007). The destination is also part of
other state-wide marketing promotions such as ‘Brand Queensland’. Additionally, the
destination’s tourism products are currently featured in brochures distributed in Austria,
France, Germany, Italy, Japan, Netherlands, NZ, Scandinavia, Singapore, South Africa,
Switzerland, UK, USA and Canada (Tourism Queensland 2007).
INSERT TABLE 5 HERE
Mode of transportation and lifestage were not identified as a segmentation variable in the
two-step approach to segmentation. Further, the three expenditure items (behavioral) and two
motivations variables (psychographic) were not utilized in the DMO segmentation. The DMO
segmentation uses three forms of segmentation being demographic (lifestage, age, and
household income), geographic (source market) and behavioral characteristics (travel party,
transport, and type of trip). The segments derived from the proposed two-step approach use
all four segmentation bases. It was also noted that whilst the DMO segmentation emphasizes
the lifestage and source market segmentation variables, the cluster solution treats each of the
10 segmentation variables equally.
The wealthy traveler segment compares favorably with the DMO segments that travel from
Sydney and Brisbane (segments 1, 2 and 5). The wealthy traveler segment has tourists that
originate from NSW (whose capital is Sydney) and QLD (whose capital is Brisbane). This
segment is also aged between 25-54, which are the ages included in these three DMO
segments. Wealthy travelers also travel predominantly as a couple or a family and stay for a
23
short break (roughly half a week). Additionally, over 75 per cent of the wealthy travelers earn
a household income in excess of $60,000 per annum which is similar to the three segments.
The DMO treats international and domestic tourists separately. While segments are used for
domestic marketing, segments are not used for international marketing. Due to the difference
in focus, the young European segment was not described by the DMO. Despite representing
one-fifth of the tourist market and the longest staying segment, the long stay traveler segment
was not defined by the DMO. A further point of difference was that the third and fourth
segments of the DMO were not identified when the two-step approach to segmentation was
used.
Further analysis of the segments generated from the recommended two-step approach to
segmentation was undertaken. The DMO segments were compared to the three segments
identified using the two-step approach to segmentation. Any tourists with distinguishing
characteristics not described in the DMO segments were eliminated from the data file to
understand how many tourists were not being described by the five DMO segments. This
occurred as follows. First, tourists that were not from within QLD or Sydney (NSW) were
removed from the data file. This resulted in 625 cases being deleted and produced a data set
of 227 which is just over a quarter of the original sample (26.6%). Secondly, tourists that
travelled as singles were deleted from the data file as this category was not considered by the
DMO when segmenting tourists based on their travel party. This resulted in 12.8 per cent of
the 227 cases being deleted, which left a tourist market of 198 tourists. The proposed two-
step segmentation method captured 569 of the 852 tourists, which represents 66.8 per cent of
the tourism data set, while the segments currently used by the DMO targeted 198 tourists,
which represents just 23.2 per cent of the tourists in the study sample.

24
By considering all tourists travelling to the destination, the two-step segmentation approach
encompassed more tourists. Approximately two-thirds of the tourists travelling to the
destination were cluster analyzed in this study whereas the DMO segments focused on less
than half the tourists travelling to the destination. From a marketing and managerial approach,
the two-step approach ensures that a more holistic view of tourists at the destination can be
obtained.
25
Discussion and Conclusions
Stakeholders play an important part in marketing a destination to potential tourists (Sautter
and Leisen 1999; Sheehan, Ritchie and Hudson 2007; Sheehan and Ritchie 2005).
Collaborative efforts between tourism stakeholders and the DMO are required to maximize
DMO and other tourism stakeholders’ resources (Sheehan, Ritchie and Hudson 2007). Failure
to develop a collective approach to marketing is likely to disadvantage destinations
promoting themselves in a competitive market place, as stakeholders that are excluded from
the marketing of the destination may not support the destination’s marketing (Blain, Levy and
Ritchie 2005; Prideaux and Cooper 2002; Sheehan, Ritchie and Hudson 2007). Instead, these
stakeholders may promote their organization and destination separately from the DMO. For
the best return on investment the DMO needs to attract the same tourist segments that various
tourism stakeholders seek to attract once they have reached the destination.
Two-step approach to segmentation
This paper proposed a two-step approach to segmentation. Many contributions to the
literature and practice were identified from this research. From a theoretical perspective, the
first major contribution is that all four segmentation bases as defined by Kotler (1980) were
identified using this approach. This confirms the findings from the literature (e.g. Beh and
Bruyere 2007; Carmichael and Smith 2004; Chang 2006) that multivariate segmentation is
preferable. In this study, age, income, TPC (demographic), origin (geographic), push
motivations, pull motivations (psychographic), activities expenditure, food and beverages
expenditure, accommodation expenditure, and nights (behavioral) produced three segments.
26
From a practical perspective, this two-step approach is applicable for simultaneously
segmenting all tourists travelling to a destination. By interviewing relevant stakeholders, this
research was able to first identify the segmentation variables relevant to tourism stakeholders.
Comparison to DMO segments
While surveys were used for both the DMO segments and the proposed two-step approach,
the tourist segments that were derived varied considerably. Only one of the segments
identified in this study, wealthy travelers, was comparable with the segments currently
defined by the DMO. The other two tourism segments identified from the two-step approach,
young Europeans and long stay travelers, were not considered in the DMO segmentation.
These segments represent approximately 60 per cent of the usable tourist sample for this
study.
We contend that the two-step approach may be a more appropriate segmentation method, as it
is capable of assisting tourism marketers to target more of the tourists frequenting the
destination. Currently, the DMO segments target less than a quarter of the types of tourists
visiting the destination. Whilst the emphasis on wealthy travelers is relevant, young
Europeans and long stay travelers also need to be considered. Young Europeans and the long
stay travelers have different distinguishing characteristics to each other and the wealthy
traveler segment (e.g. different ages and travel party compositions). These two segments also
represent a large share of the market.
The inclusion of stakeholders in planning is considered beneficial in many organizational
settings (Agle, Mitchell and Sonnenfeld 1999; Berman et al. 1999; Post, Preston and Sachs
27
2002). It is, therefore, crucial that segments relevant to all stakeholders are considered and
ultimately targeted. The segments to prioritize should be chosen at the discretion of the
tourism stakeholders. For this study, emphasizing only wealthy travelers is likely to isolate
the tourism stakeholders that wish to target the tourists with less daily expenditure (e.g.
backpacker hostels, caravan parks, certain tour operators) from the other stakeholders (e.g.
five star resorts). If the destination marketing strategy is based on targeting the higher end
tourists, these stakeholders focusing on the lower earning and spending tourists are, therefore,
likely to design their own marketing strategies to attract their potential tourists (Buhalis 2000)
leading to a segregated, and hence less effective, approach.
An additional contribution arising from this study is that the two-step approach provides a
much richer description of the segments when compared to the current DMO segments. This
richness can be applied to better frame management thinking. Geographic and demographic
data can be used to select relevant media while behavioral and psychographic variables can
be utilized by tourism stakeholders to tailor tourism product offerings and pricing and to
inform promotion development. For example, knowledge that 80 per cent of long stay
travelers reside on the eastern seaboard of Australia can be used by the DMO. Armed with
this knowledge the DMO would focus communication aimed at the long stay traveler
segment on eastern seaboard media which specifically targets people 55 years and over.
No psychographic variables were applied within the DMO segmentation, but push and pull
motivations were clear descriptors for the two-step approach as the number of motivations
varied between segments. For each segment, motivations were multidimensional, which
confirmed the literature (e.g. Baloglu and Uysal 1996; Bieger and Laesser 2002; Dolnicar

28
2004a; Sirakaya, Uysal and Yoshioka 2003). In contrast to previous studies, the method used
in this paper enabled both the number and types of motivations to be considered.
A final contribution of this research is use of three expenditure items that produced findings
of primary importance to tourism stakeholders. Economic injection is one of the main
benefits to destination stakeholders at a destination (Gunn and Var 2002; Swarbrooke and
Horner 1999; Weaver and Lawton 2006). Despite the DMO using income as a characteristic
of the five segments, it was identified that higher income did not automatically translate to
higher expenditure. This finding confirms previous studies (e.g. Carmichael and Smith 2004;
Hu and Yu 2007; Lee, Morrison and O'Leary 2006; Petrick 2005; Sung 2004). For example,
Carmichael and Smith (2004) identified that a segment, shopping enthusiasts, spent more at a
shopping destination despite not having the highest income. Tourists with higher incomes do
not necessarily spend more while at the destination. It was identified that whilst the long stay
travelers had an annual household income that was generally higher than the young
Europeans, their daily expenditure was lower. This study shows that both income and
expenditure need to be considered as variables when considering the financial activity of
tourists at a destination.
29
Managerial Implications
Recent domestic marketing efforts by the DMO currently targeted approximately one quarter
of tourists traveling to the destination. A substantial segment that was identified using the
two-step approach to segmentation was young Europeans. DMOs have the objective of
attracting visitors to a destination. Use of a two-step approach to segmentation suggests that
some funds could be redeployed away from targeting tourists around the age of 45 years old
residing in QLD and Sydney towards European travelers. Redeployment of funds would
assist the DMO to improve return on investment as the funds would be spent in areas where
tourist response is more likely. It is argued that because this destination does not have the
funds to advertise internationally to the continent of Europe, funds could be used to target
these European tourists in popular Australian tourist destinations such as Cairns, Melbourne
and Sydney. As these tourists tend to spend very little on accommodation, it would be
considered appropriate to promote the destination in backpacker hostels at nearby
destinations. In addition, as a major pull motivation was “it was recommended by someone”,
it may be useful to contact tourist guides in the regions or promote in international traveler
guides such as the Lonely Planet.
As the other segment, long stay travelers, represents tourists that may be considered ‘grey
nomads’ defined as “over-55s who travel independently in caravans, motorhomes,
campervans or converted buses for between three months and three years” (Robson 2007), it
may be useful to promote the destination in caravan parks throughout Australia. This segment
spends the least on the three expenditure items on a daily basis, but their length of stay is on
average four times the other segments. Accordingly, their overall expenditure is the highest
and this makes them a valuable market for the destination. Focusing on this segment also

30
ensures that the issues of seasonality at the destination can be minimized, as these tourists can
choose to stay at the destination for long periods during the low peak seasons. As “to rest and
relax” (push) and “the weather” and “relaxed lifestyle” (pull) are popular motivations for this
segment, these characteristics of the destination need to be considered when promoting to
these tourists.

31
Limitations and future research
This study considered one Australian destination. Future research is recommended in a range
of alternate destinations to further our understanding of the recommended two-step approach
to segmentation. Future research is required in urban destinations and other regional
destinations. Additionally researchers could consider the usefulness of the two-step
segmentation approach for state and country level marketing efforts. Such endeavors would
require additional rigor in the first stage as considerably more stakeholders would be
involved.
This research was conducted using a cross-sectional research design. Future research should
be conducted longitudinally to see if the segments described by the proposed two-step
approach are better able to predict the types of tourists travelling to the destination. Another
limitation arising in this research is that some of the categories within this research could
have been expanded. It was acknowledged that Europe is a large source market, which
represents many countries with populations in excess of 20 million people such as the UK,
Spain, France and Germany. Identifying if the majority of tourists come from one country,
region or state has marketing implications. Designing specific packages for tourists from
European countries such as the UK or Germany may increase the growth of tourism from
these countries to this destination. As many wealthy tourists travel from Europe, this could be
a financially attractive option.
The use of the TwoStep® clustering method was only noted twice before in tourism research.
The TwoStep® clustering method was selected to segment tourists in stage two due to its
ability to simultaneously consider categorical and numeric variables. Research is required to

32
compare clustering methods for tourism segmentation. This would require researchers to
cluster using the new TwoStep® clustering method and then cluster the same data set using
more traditional clustering methods.
33
REFERENCES
Aaker, D. A., V. Kumar, and G. S. Day (2003). Marketing Research. 8th ed. NJ, United
States of America: John Wiley & Sons, Inc.
Agle, B. R., R. K. Mitchell, and J. A. Sonnenfeld (1999). “Who Matters to CEOs? An
Investigation of Stakeholder Attributes and Salience, Corporate Performance, and
CEO Values.” Academy of Management Journal, 42 (5): 507-525.
Alipour, H., M. Altinay, K. Hussain, and N. Sheikhani (2007). “Perceptions of the Beach
Users: A Case Study of the Coastal Areas of North Cyprus Towards Establishment of
a Carrying Capacity.” Tourism Analysis, 12 (3): 175-190.
Andereck, K. L., and L. L. Caldwell (1994). “Variable Selection in Tourism Market
Segmentation Models.” Journal of Travel Research, 33 (2): 40-46.
Awaitefe, O. D. (2004). “Motivation and Other Considerations in Tourist Destination Choice:
A Case Study of Nigeria.” Tourism Geographies, 6 (3): 303-330.
Baloglu, S., and M. Uysal (1996). “Market Segments of Push and Pull Motivations: A
Canonical Correlation Approach.” International Journal of Contemporary Hospitality
Management, 8 (3): 32-8.
Beane, T. T., and D. M. Ennis (1987). “Market Segmentation: A Review.” European Journal
of Marketing, 21 (5): 20-42.
34
Becken, S., D. Simmons., and C. Frampton (2003). “Segmenting Tourists by their Travel
Patterns for Insights into Achieving Energy Efficiency.” Journal of Travel Research,
42 (10): 48-56.
Berman, S. L., A. C. Wicks, S. Kotha., and T. M. Jones (1999). “Does Stakeholder
Orientation Matter? The Relationship Between Stakeholder Management Models and
Firm Financial Performance.” Academy of Management Journal, 42 (5): 488-506.
Beh, A., and B. L. Bruyere (2007). “Segmentation by Visitor Motivation in Three Kenyan
National Reserves.” Tourism Management, 28 (6): 1461-1471.
Bieger, T., and C. Laesser (2002). “Market Segmentation by Motivation: The Case of
Switzerland.” Journal of Travel Research, 41 (1): 68-76.
Bigne, J. E., and L. Andreu (2004). “Emotions In Segmentation: An Empirical Study.”
Annals of Tourism Research, 31 (3): 682-696.
Blain, C., S. E. Levy, and J. R. B. Ritchie (2005). “Destination Branding: Insights and
Practices from Destination Management Organizations.” Journal of Travel Research,
43 (4): 328-338.
Bloom, J. Z. (2004). “Tourism Market Segmentation with Linear and Non-linear
Techniques.” Tourism Management, 25 (6): 723-733.
35
Bonn, M. A., S. M. Joseph, and M. Dai (2005). “International Versus Domestic Visitors: An
Examination of Destination Image Perceptions.” Journal of Travel Research, 43 (3):
294-301.
Buhalis, D. (2000). “Marketing the Competitive Destination of the Future.” Tourism
Management, 21 (1): 97-116.
Carmichael, B. A., and W. W. Smith (2004). “Canadian Domestic Travel Behaviour: A
Market Segmentation Study of Rural Shopper.” Journal of Vacation Marketing, 10
(4): 333-347.
Cha, S., K., W. McCleary, and M. Uysal (1995). “Travel Motivations of Japanese Profile for
Pleasure Overseas Travelers: A Factor-Cluster Segmentation Approach.” Journal of
Travel Research, 34 (1): 33-39.
Chang, J. (2006). “Segmenting Tourists to Aboriginal Cultural Festivals: An Example in the
Rukai Tribal Area. Taiwan.” Tourism Management, 27 (6): 1224-1234.
Chiu, T., D-P. Fang, J. Chen, Y. Wang, and C. Jeris (2001). “A Robust and Scalable
Clustering Algorithm for Mixed Type Attributes in Large Database Environment.” In
Proceedings of the 7th ACM SIGKDDD International Conference on Knowledge
Discovery and Data Mining. San Francisco: ACM SIGKDDD, pp. 263-68.
Clarkson, M. B. E. (1995). “A Stakeholder Framework for Analysing and Evaluating
Corporate Social Performance.” The Academy of Management Review, 20 (1): 92-117.
36
Dann, G. M. (1981). “Tourism Motivations: An Appraisal.” Annals of Tourism Research, 8
(2): 189-219.
Diaz-Perez, F. M., M. Bethencourt-Cejas, and J. A. Alvarez-Gonzalez (2005). “The
Segmentation of Canary Island Tourism Markets by Expenditure: Implications for
Tourism Policy.” Tourism Management, 26 (6): 961-4.
Dolnicar, S. (2004a). “Tracking Data-driven Market Segments.” Tourism Analysis, 8 (2/4):
227-32.
_________ (2004b). “Beyond 'Commonsense Segmentation': A Systematics of Segmentation
Approaches in Tourism.” Journal of Travel Research, 42(3), 244-250.
_________ (2007). “Market Segmentation in Tourism.” In Tourism Management, Analysis,
Behaviour and Strategy, edited by A. Woodside and D. Martin. Cambridge: CABI (In
press).
Dolnicar, S., and C. Laesser (2007). “Travel Agency Marketing Strategy: Insights from
Switzerland.” Journal of Travel Research, 46 (2): 133-146.
Dolnicar, S., and F. Leisch (2003). “Winter Tourist Segments in Austria: Identifying Stable
Vacation Styles Using Bagged Clustered Techniques.” Journal of Travel Research, 41
(3): 281-292.
37
Donaldson, T., and L. E. Preston (1995). “The Stakeholder Theory of the Corporation:
Concepts, Evidence and Implications.” Academy of Management Review, 20 (1): 65-
91.
Freeman, R. E. (1984). Strategic Management: A Stakeholder Approach. Boston, USA:
Pitman.
Fyall, A., and B. Garrod (2005). Tourism Marketing: A Collaborative Approach. Clevedon:
Channel View Publications.
Gunn, C. A., and T. Var (2002). Tourism Planning: Bases, Concepts, Cases. 4th ed. New
York: Taylor & Francis.
Hair, J. F., W. C. Black, B. J. Babin, R. E. Anderson, and R. L. Tatham (2006). Multivariate
Data Analysis. 6th ed. Upper Saddle River, NJ: Prentice Hall.
Hong, G-S., J. X. Fan, L. Palmer, and V. Bhargava (2005). “Leisure Travel Expenditure
Patterns by Family Life Cycle Stages.” Journal of Travel & Tourism Marketing, 18
(2): 15-30.
Horneman, L., R. W. Carter, S. Wei, and H. Ruys (2002). “Profiling the Senior Traveller: An
Australian Perspective.” Journal of Travel Research, 41 (1): 23-37.
Hsu, C. H. C., and S. K. Kang (2007). “CHAID-based Segmentation: International Visitors’
Trip Characteristics and Perceptions.” Journal of Travel Research, 46 (2): 207-216.
38
Hsu, C. H. C., S. K. Kang, and T. Lam (2006). “Reference Group Influences Among Chinese
Travelers.” Journal of Travel Research, 44 (4): 474-484.
Hsu, C. H. C., S. K. Kang, and K. Wolfe (2002). “Psychographic and Demographic Profiles
of Niche Market Leisure Travellers.” Journal of Hospitality & Tourism Marketing, 26
(1): 3-22.
Hu, B., and H. Yu (2007). “Segmentation by Craft Selection Criteria and Shopping
Involvement.” Tourism Management, 28 (4): 1079-1092.
Hudson, S., and B. Ritchie (2002). “Understanding the Domestic Market Using Cluster
Analysis: A Case Study of the Marketing Efforts of Travel Alberta.” Journal of
Vacation Marketing, 8 (3): 263-276.
Hyde, K. F. (2006). “Contemporary Information Search Strategies of Destination-Naïve
International Vacationers.” Journal of Travel & Tourism Marketing, 21 (2/3): 63-76.
Jamal, T., and D. Getz (1995). “Collaborative Theory and Community Tourism Planning.”
Annals of Tourism Research, 22 (1): 186-204.
Jang, S., Morrison, A.M., and J. T. O'Leary (2004). “A Procedure for Target Market
Selection in Tourism.” Journal of Travel & Tourism Marketing, 16 (1): 19-33.
39
Johns, N., and S. Gyimothy (2002). “Market Segmentation and the Prediction of Tourist
Behavior: The Case of Bornholm, Denmark.” Journal of Travel Research, 40 (3):
316-327.
Juwaheer, T. D. (2007). “Using Service Quality Expectations as a Criterion to Segment
International Tourists in the Hospitality Industry: An Outlook of Hotels of Mauritius.”
Journal of Travel & Tourism Marketing, 21 (2/3): 1-18.
Kang, S. K., C. H. C. Hsu, and K. Wolfe (2003). “Family Traveler Segmentation By
Vacation Decision-Making Patterns.” Journal of Hospitality & Tourism Research, 27
(4): 448-469.
Kim, S-S., and C. K. Lee (2002). “Push and Pull Relationships.” Annals of Tourism
Research, 29 (1): 257-60.
Kim, J., S. Wei, and H. Ruys (2003). “Segmenting the Market of West Australian Senior
Tourists Using an Artificial Neural Network.” Tourism Management, 24 (1): 25-34.
Kim, K., G. Jogaratnam, and J. Noh (2006). “Travel Decisions of Students at a US University:
Segmenting the International Market.” Journal of Vacation Marketing, 12 (4): 345-
357.
Kolb, B. M. (2006). Tourism Marketing for Cities and Towns- Using Branding and Events to
Attract Tourists. Amsterdam, Boston: Elsevier/Butterworth-Heinemann.
40
Kotler, P. (1980). Principles of Marketing: Englewood Cliffs, New Jersey: Prentice-Hall.
Laesser, C., and G. I. Crouch (2006). “Segmenting Markets by Travel Expenditure Patterns:
The Case of International Visitors to Australia.” Journal of Travel Research, 44 (4):
397-406.
Laesser, C., G. I. Crouch, and P. Beritelli (2006). “Market Segmentation by Reasons and
Influences to Visit a Destination: The Case of International Visitors to Australia.”
Tourism Analysis, 11 (4): 241-249.
Lee, C-K., Y-K. Lee, B. J. Bernhard, and Y-S. Yoon (2006). “Segmenting Casino Gamblers
by Motivation: A Cluster Analysis of Korean Gamblers.” Tourism Management, 27
(5): 856-866.
Lee, G., A. M. Morrison, and J. T. O'Leary (2006). “The Economic Value Portfolio Matrix:
A Target Market Selection Tool for Destination Marketing Organisations.” Tourism
Management, 27 (4): 576-88.
Lee, C-K., Y-S. Yoon, and S-K. Lee (2007). “Investigating the Relationships Among
Perceived Value, Satisfaction, and Recommendations: The Case of the Korean
DMZ.” Tourism Management, 28 (1): 204-214.
Lee, K., and J. Zhao (2003). “Japanese Travelers’ Service Preferences in U.S. Hotels.”
Journal of Travel & Tourism Marketing, 12 (2): 67-85.
41
Lee, T. (1999). Qualitative methods in Organisational Research. London: Sage Publications.
Lehto, X. Y., J. T. O’Leary, and A. M. Morrison (2002). “Do Psychographics Influence
Vacation Destination Choices? A Comparison of British Travellers to North America,
Asia and Oceania,” Journal of Vacation Marketing, 8 (2): 109-125.
______ (2004). “The Effect Of Prior Experience On Vacation Behavior.” Annals of Tourism
Research, 31 (4): 801-818.
MacKay, K. J., K. L. Andereck, and C. A. Vogt (2002). “Understanding Vacationing
Motorist Niche Markets.” Journal of Travel Research, 40 (4): 356-63.
Malhotra, N. K. (2004). Marketing Research- An Applied Orientation. 4th ed. Upper Saddle
River, NJ: Education Inc.
McCleary, K. W., P. A. Weaver, and F. Meng (2005). “Dance as a Tourism Activity:
Demographics, Demand Characteristics, Motivation, and Segmentation.” Tourism
Analysis, 10 (3): 277-90.
McGuiggan, R., and J-A. Foo (2004). “Who Plays Which Tourist Roles? An Australian
Perspective.” Journal of Travel & Tourism Marketing, 17 (1): 41-54.
McKercher, B., P. S. Y. Ho, H. du Cros, and B. C. So-Ming (2003). “Activities-Based
Segmentation of the Cultural Tourism Market.” Journal of Travel & Tourism
Marketing, 12 (1): 23-46.
42
McKercher, B., and D. Y. Y. Wong (2004). “Understanding Tourist Behaviour: Examining
the Combined Effects of Prior Visitation History and Destination Status.” Journal of
Travel Research, 43 (2); 171-179.
Morgan, N. J., A. Pritchard, and R. Piggott (2003). “Destination Branding and the Role of the
Stakeholders: The Case of New Zealand.” Journal of Vacation Marketing, 9 (3): 285-
299.
Morrison, A. M., C. G. Braunlich, A. Cai, and J. T. O’Leary (1996). “Profile of the Casino
Resort Vacationer.” Journal of Travel Research, 35(2): 55-61.
Morrison, A. M., C-H. Yang, J. T. O'Leary, and N. Nadkarni (2003). “Comparative Profiles
of Travellers on Cruises and Land-based Resort Vacations.” The Journal of Tourism
Studies, 14 (1): 99-111.
Mudambi, R., and T. Baum (1997). “Strategic Segmentation: An Empirical Analysis of
Tourist Expenditure in Turkey.” Journal of Travel Research, 36 (1): 29-34.
Norusis, M. (2008). SPSS 16.0 Guide to Data Analysis. NJ: Prentice Hall.
Obenour, W., J. Lengfelder, and D. Groves (2005). “The Development of a Destination
Through the Image Assessment of Six Geographic Markets.” Journal of Vacation
Marketing, 11 (2): 107-119.

43
Okasaki, S. (2007). “Lessons Learned from I-mode: What Makes Consumers Click Wireless
Banner Ads?” Computers in Human Behavior, 23 (3): 1692-1719.
Onyx, J., and R. Leonard (2005). “Australian Grey Nomads and American Snowbirds:
Similarities and Differences.” The Journal of Tourism Studies, 16 (1): 61-68.
Park, M., X. Yang, B. Lee, H-C. Jang, and P. A. Stokowski (2002). “Segmenting Casino
Gamblers by Involvement Profiles: A Colorado Example.” Tourism Management 23
(1): 55-65.
Petrick, J. F. (2005). “Segmenting Cruise Passengers with Price Sensitivity.” Tourism
Management, 26 (5): 753-62.
Pike, S. (2002). “ToMA as a Measure of Competitive Advantage for Short Break Holiday
Destinations.” The Journal of Tourism Studies, 13 (1): 9-19.
_______(2004). Destination Marketing Organisations. Oxford: Elsevier.
_______(2005). “Tourism Destination Branding Complexity.” Journal of Product & Brand
Management, 14 (4): 258-9.
Post, J. E., L. E. Preston, and S. Sachs (2002). Redefining the Corporation: Stakeholder
Management and Organizational Wealth, Stanford, California: Stanford Business
Books.
44
Prideaux, B., and C. Cooper (2002). “Marketing and Destination Growth: A Symbiotic
Relationship or Simple Coincidence?” Journal of Vacation Marketing, 9 (1): 35-51.
Robson, L. (2007). Grey Nomads Driving Tourism.
http://www.news.com.au/couriermail/story/0,23739,21717472-5003424,00.html
(accessed May 31, 2008).
Sarigollu, E., and R. Huang (2005). “Benefits Segmentation of Visitors to Latin America.”
Journal of Travel Research, 43 (3): 277-293.
Sautter, E. T., and B. Leisen (1999) “Managing Stakeholders: A Tourism Planning Model.”
Tourism Research, 26 (2): 312-328.
Sheehan, L. R., and J. R. B. Ritchie (2005). “Destination Stakeholders – Exploring Identity
and Salience.” Annals of Tourism Research, 32 (3): 711-734.
Sheehan, L., J. R. B. Ritchie, and S. Hudson (2007). “The Destination Promotion Triad:
Understanding Asymmetric Stakeholder Interdependencies Among the City, Hotels,
and DMO.” Journal of Travel Research, 46 (1): 64-74.
Sirakaya, E., M. Uysal, and C. F. Yoshioka (2003). “Segmenting the Japanese Tour Market to
Turkey.” Journal of Travel Research, 41 (3): 292-304.
Smith, W (1956). “Product Differentiation and Market Segmentation as Alternative
Marketing Strategies.” Journal of Marketing, 21 (1): 3-8.
45
SPSS (2007). Statistical Package for Social Sciences for Windows, 15.0. Chicago: SPSS.
Sung, H. H. (2004). “Classification of Adventure Travellers: Behaviour, Decision Making,
and Target Markets.” Journal of Travel Research, 42 (4): 343-356.
Swarbrooke, J., and S. Horner (1999). Consumer Behaviour in Tourism. Oxford:
Butterworth-Heinemann.
Tkaczynski, A., Rundle-Thiele, S.R., and Beaumont, N. (2009). “Segmentation: A Tourism
Stakeholder View.” Tourism Management. 30 (2): 169-175.
Tourism Queensland (2007). Fraser Coast Destination Management Plan.
http://www.tq.com.au/shadomx/apps/fms/fmsdownload.cfm?file_uuid=D4461468-
0810-C6E8-0005-2C896386472B&siteName=tqcorp_06. (accessed October 29,
2007).
Veal, A. J. (2005). Research Methods for Leisure and Tourism- A Practical Guide. 3rd ed.
Essex, England: Pearson Education Limited.
Weaver, D., and L. Lawton (2006). Tourism Management. 3rd ed. Milton, Qld: John Wiley &
Sons.
46
Wilson, J., and D. Thilmany (2006). “Golfers in Colorado: The Role of Golf in Recreational
and Tourism Lifestyles and Expenditures.” Journal of Travel & Tourism Marketing,
20 (3/4): 127-144.
Yin, K. (2003). Case Study Research–Designs and Methods. 3rd ed. California: Sage
Publications, Inc.
Yoo, J. J-E., B. McKercher, and M. Mena (2004). “Cross-Cultural Comparison of Trip
Characteristics: International Visitors to Hong Kong from Mainland China and USA.”
Journal of Travel & Tourism Marketing, 16 (1): 65-77.
Yuan, S., and C. McDonald (1990). “'Motivational Determinants of International Pleasure
time.” Journal of Travel Research, 29 (1): 42-4.
47
TABLE 1
USE OF STAKEHOLDERS
Stakeholders
Author Funding Agency
Hotel Employees
Residents Travel Agency
Employees
Industry Experts
Attraction Employee
Number of stakeholders considered
Bigne and Andreu (2004) √ 1 Hsu, Kang and Wolfe (2002) √ 1 Hudson and Ritchie (2002) √ 1 Juwaheer (2007) √ 1 Kang, Hsu and Wolfe (2003) √ 1 Kim, Wei and Ruys (2003) √ 1 Lee, Yoon and Lee (2007) √ 1 Lee et al. (2006) √ 1 Lee & Zhao (2003) √ √ 2 Obenour, Lengfelder and Groves (2005)
√ 1
48
TABLE 2
CLUSTER SELECTION WITH BIC VALUES
Model Number of clusters
Schwarz’s Bayesian
Criterion (BIC)
BIC Changea
Ratio of BIC
Changesb
Ratio of Distance
Measuresc
Initial solution (All cases, 13 segmentation variables)
3 14,280.518 -395.950 .413 1.719
Missing solution (283 missing cases removed, 13 segmentation variables)
3 14,186.355 -.467.317 .476 2.159
Final solution (Cases with missing data removed, 10 segmentation variables)
3 11,961.731 -.418.615 .415 1.919
Odd-numbered solution 3 5,537.972 -123.793 .315 1.703 Even-numbered solution 3 5,476.333 -.108.051 .361 1.398
a. Changes are from the previous numbers of clusters in the table. b. Ratios of changes are relative to the change for each of the three-cluster solutions. c. Ratios of distance measures are based on the current number of clusters against the previous number of
clusters.
49
TABLE 3
FINAL CLUSTER SOLUTION
Total Wealthy Travelers Young Europeans Long Stay Travelers
Segment Size N = 569 N = 233 N = 224 N = 112 Segment % 100.0 40.9 39.4 19.7 Continuous Variables
Overall Mean
Overall SD
Mean SD Mean SD Mean SD
Push Motivations 4.2 2.3 4.1 2.3 4.8 2.2 3 1.9 Pull Motivations 1.7 1.5 1.7 1.4 1.4 1.3 2.5 1.7 Nights 6.6 11.8 4.3 2.4 3.7 2.4 17.0 23.5 Categorical Variables
n % n % n % n %
Age 18-24 117 20.6 16 6.9 89 39.7 12 10.7 25-34 181 31.8 68 29.2 109 48.7 4 3.6 35-44 86 15.1 50 21.5 17 7.6 19 17.0 45-54 83 14.6 56 24.0 7 3.1 20 17.9 55-64 68 12 30 12.9 2 0.9 36 32.1
65+ 34 6 13 5.6 0 21 18.8 Income
< $20,000 109 19.2 3 1.3 85 37.9 21 18.8 $20,000-$39,999 81 14.2 21 8.8 35 15.6 26 23.2 $40,000-$59,999 75 13.2 27 11.3 35 15.6 20 17.9 $60,000-$79,999 74 13 29 12.1 24 10.7 20 17.9 $80,000-$99,999 85 14.9 48 20.1 24 10.7 13 11.6
$100,000+ 145 25.5 111 46.4 21 9.4 12 10.7 Origin
Europe 208 36.6 50 21.5 158 70.5 0 New South Wales 135 23.7 81 34.8 29 12.9 25 22.3
Queensland 92 16.2 45 19.3 1 0.4 46 41.1
Victoria 53 9.3 31 13.3 0 22 19.6 Nth America 38 6.7 10 4.3 25 11.2 3 2.7
Aus (not specified) 29 5.1 10 4.3 3 1.3 16 14.3 Asia Pacific 14 2.5 6 2.6 8 3.6 0
Daily Accommodation Expenditure < $50 289 50.8 15 6.4 181 80.8 93 83.0
$50-$99 88 15.5 34 14.6 39 17.4 15 13.4 $100-$149 77 13.5 70 30.0 4 1.8 3 2.7 $150-$199 55 9.7 55 23.6 0 0
$200 + 60 10.5 59 25.3 0 1 0.9 Daily Activities Expenditure
< $50 208 36.6 45 19.3 82 36.6 81 72.3
$50-$99 157 27.6 58 24.9 75 33.5 24 21.4 $100-$149 98 17.2 57 24.5 36 16.1 5 4.5 $150-$199 51 9 37 15.9 14 6.3 0
$200 + 55 9.7 36 15.5 17 7.6 2 1.8 Daily Food and Beverages Expenditure
< $50 285 50.1 20 8.6 176 78.6 89 79.5
$50-$99 163 28.6 99 42.5 44 19.6 20 17.9 $100-$149 82 14.9 77 33.0 3 1.3 2 1.8 $150-$199 16 8.4 15 6.4 1 0.4 0
$200 + 23 4 22 9.4 0 1 0.9 TPC
Couple 219 38.5 99 42.5 63 28.1 57 50.9
Adult Group 168 29.7 43 18.5 116 51.8 9 8.0 Family 102 17.9 80 34.3 6 2.7 16 14.3
By myself 64 11.2 5 2.1 39 17.4 20 17.9 Other 16 2.8 6 2.6 0 10 8.9
50
TABLE 4
PUSH AND PULL MOTIVATIONS
Total Wealthy Travelers
%
Young Europeans
%
Long Stay Travelers
%
Sig.
Push Motivations To go to a place where you have not been before 56.1 50.2 77.7 25.0 .000** To rest and relax 54.8 62.2 42.9 63.4 .000** To have fun 52.2 44.6 68.3 35.7 .000** To go sightseeing 52.0 51.5 62.9 31.3 .000** To see something different 45.0 42.1 59.8 21.4 .000** To escape from your everyday lifestyle 42.4 37.8 50.9 34.9 .004* To spend time with your partner 29.3 35.6 26.3 22.3 .018* To experience a different culture 24.4 12.9 45.5 6.3 .000** To participate in recreational activities 21.3 22.7 25.9 8.9 .001** To be together with your family 20.7 30.5 3.6 34.8 .000** To get away from the demands of home 18.1 21.0 14.7 18.8 .213NS Pull Motivations The weather 33.0 33.5 25.9 46.4 .001** It was recommended by someone 26.7 24.0 35.3 15.2 .000** To experience a relaxed lifestyle 18.6 21.5 6.7 36.6 .000** It is a convenient stop over point 18.1 12.0 25.4 16.1 .001** The untouched nature 16.9 17.6 19.2 10.7 .137NS There’s a variety of things to see and do 12.3 15.0 5.8 19.6 .000** To go camping 11.4 3.0 14.3 23.2 .000** It is a family orientated destination 10.2 10.7 .4 28.6 .000** The safe environment 7.7 6.9 1.3 22.3 .000** The competitive price 7.2 10.7 3.6 7.1 .013* The friendly locals 6.7 4.7 2.7 18.8 .000** The luxury accommodation 5.8 12.0 1.3 1.8 .000**
** Significant at the p < .001 * Significant at the p < .05 NS Not significant

51
TABLE 5
DMO SEGMENTS
Segment Characteristics Size of segment
Segment Number
Lifestage Source Market
Age Household
Income Travel Party Transport
Type Of Trip
QLD preferrers
Destination preferrers
1 45 years
plus Brisbane 45+ Over $60K
Couples, some family and friends
groups
Car, fly Short break
or 1-2 weeks
409,000 (19% of intrastate
QLD preferrers)
113,000 (20% of intrastate
destination preferrers)
2 Young Parents
Brisbane 25-45 Over $60K Family Car, fly Short break
or 1-2 weeks
272,000 (13% of intrastate
QLD preferrers)
83,000 (15% of intrastate
preferrers)
3 45 years
plus
Regional QLD (excl.
Brisbane)
45+ Up to $60K
Couples, some family and friends
groups
Car, fly Short break
or 1-2 weeks
490,000 (23% of intrastate
QLD preferrers)
107,000 (19% of intrastate
destination preferrers)
4 Young Parents
Regional QLD
(exclu. Brisbane)
20-45 Up to $70K Family Car Short break or 1 week
366,000 (17% of intrastate
QLD preferrers)
115,000 (20% of intrastate
destination preferrers)
5
Young Parents and
Midlife Households
Sydney 25-64 Over $60K
Couples and family, some friends and
groups
Car, fly/drive
Short break or 1-3 weeks
847,000 (15% of interstate
QLD preferrers)
111,000 (17% of interstate
destination preferrers)

52
Biographical Notes
Aaron Tkaczynski is a PhD candidate and Senior Research Officer at the School of Tourism,
The University of Queensland. His research interests include market segmentation,
destination management and consumer behavior of tourists.
Sharyn Rundle-Thiele is an associate professor of Marketing at Griffith Business School,
Griffith University. She holds a PhD from the University of South Australia. Her research
centers upon three key areas: 1) customer loyalty and retention strategies, 2) decision making,
and 3) corporate social performance. Sharyn’s research has been recognized most notably
with a commendation award in the Journal of Services Marketing. Research results have been
disseminated via a range of marketing, general management and tourism journals.
Narelle Beaumont is a lecturer in the School of Management and Marketing, University of
Southern Queensland. She holds a PhD from Griffith University. Her research interests
include ecotourism and environmental attitudes, visitor management in protected areas, and
community and local government involvement in tourism planning.

53
iOur literature review was limited to academic studies, which are readily accessible. We acknowledge it is possible that destinations may have segmented their markets using a stakeholder approach and that these may not be reported in the academic literature. iiThese segments were based on the findings of the standardized National Visitor Survey designed by Tourism Australia. It is used in each destination in Australia.