market overview in electric power systems market structure and operation introduction market...
TRANSCRIPT
Market Overview in Electric Power
Systems
Market Structure and Operation
Introduction
Market Overview
Market Overview in Electric Power Systems
Mohammad Shahidehpour
Department of Electrical and Computer Engineering Department of Electrical and Computer Engineering Illinois Institute of TechnologyIllinois Institute of Technology
March 2002
Market Overview in Electric Power
Systems
Market Structure and Operation
Introduction
Market Overview
Introduction
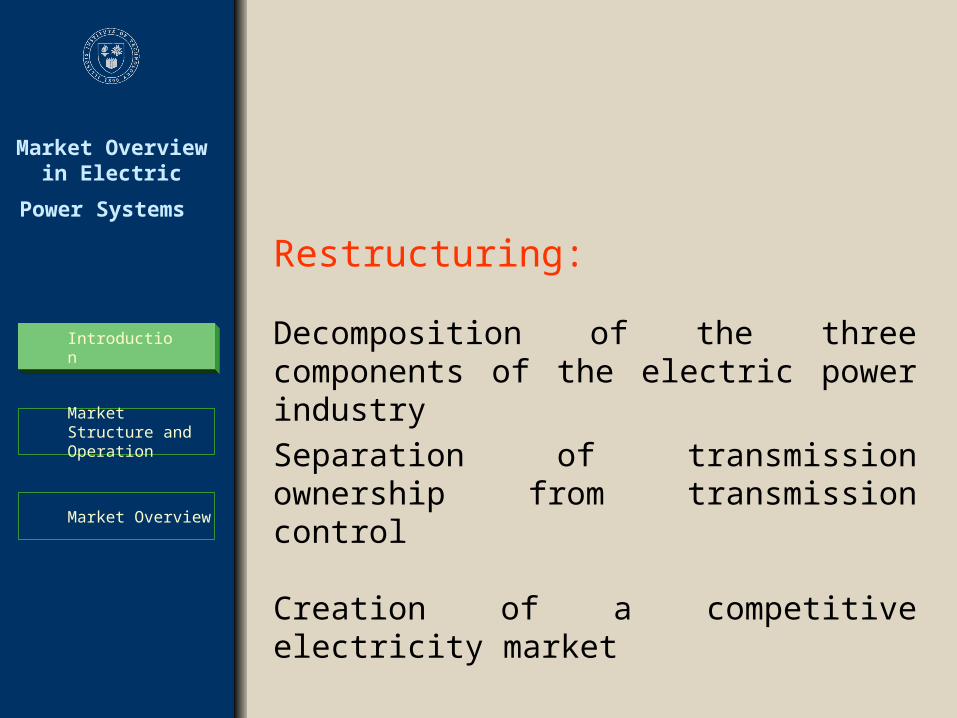
Restructuring:
Decomposition of the three components of the electric power industry
Separation of transmission ownership from transmission control
Creation of a competitive electricity market
Market Overview in Electric Power
Systems
Market Structure and Operation
Introduction
Market Overview
Introduction
0
100
200
300
400
500
600
700
800
900
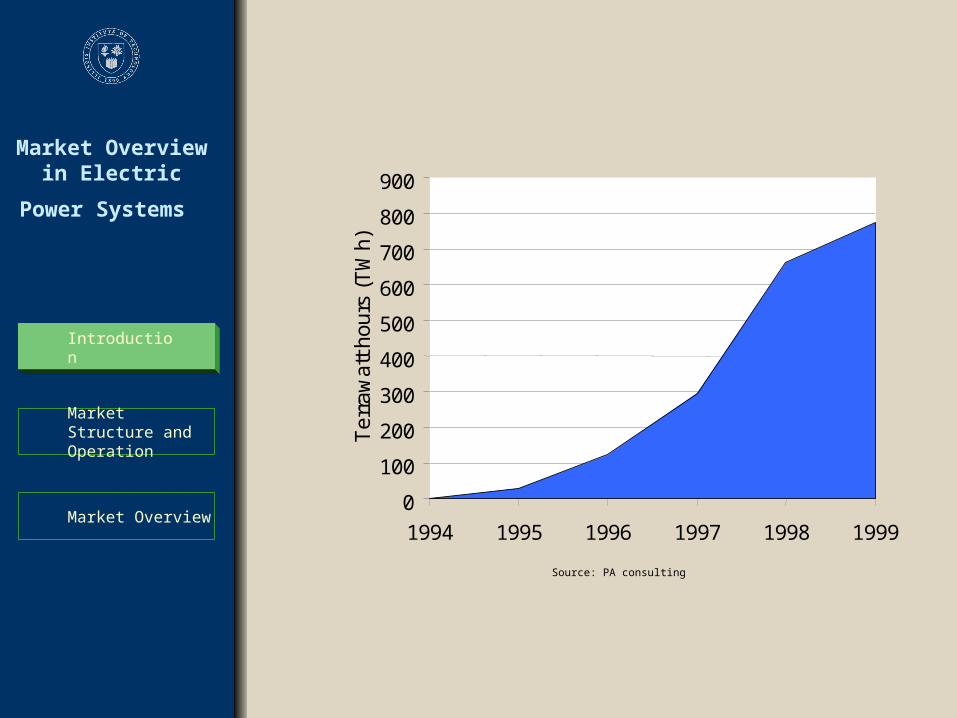
1994 1995 1996 1997 1998 1999
Ter
raw
att h
ours
(T
Wh)
Source: PA consulting
Market Overview in Electric Power
Systems
Market Structure and Operation
Introduction
Market Overview
Introduction
0
100
200
300
400
500
600
700
800
900
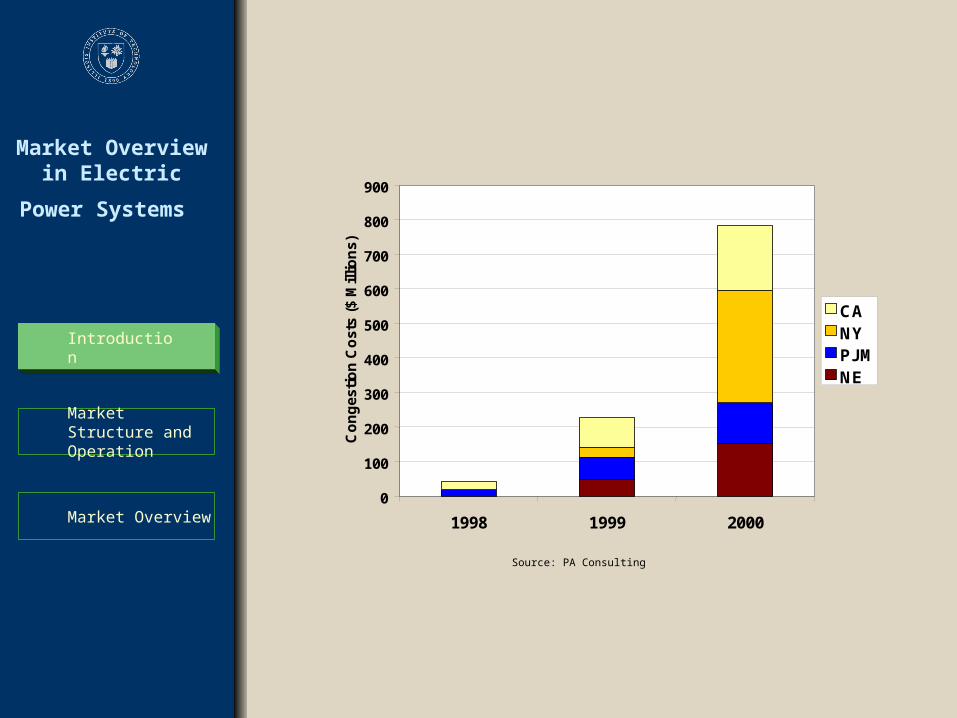
1998 1999 2000
Co
ng
esti
on
Co
sts
($
Mil
lion
s)
CA NY PJM NE
Source: PA Consulting
Market Overview in Electric Power
Systems
Market Structure and Operation
Introduction
Market Overview
Introduction
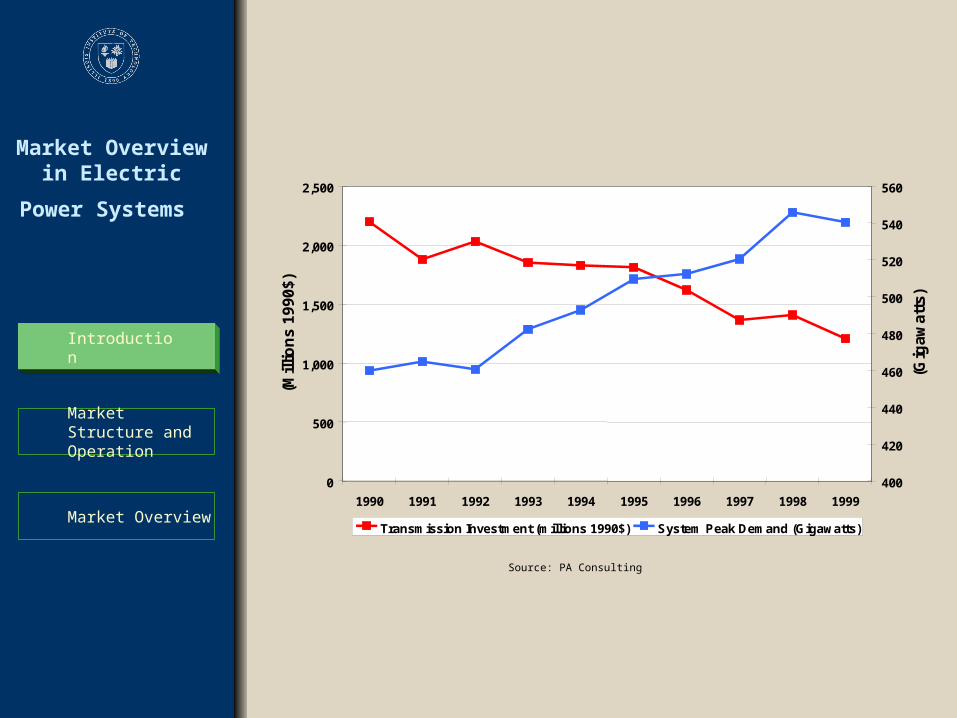
0
500
1,000
1,500
2,000
2,500
1990 1991 1992 1993 1994 1995 1996 1997 1998 1999
(Mill
ion
s 19
90$)
400
420
440
460
480
500
520
540
560
(Gig
awat
ts)
Transmission Investment (millions 1990$) System Peak Demand (Gigawatts)
Source: PA Consulting
Market Overview in Electric Power
Systems
Market Structure and Operation
Introduction
Market Overview
Introduction
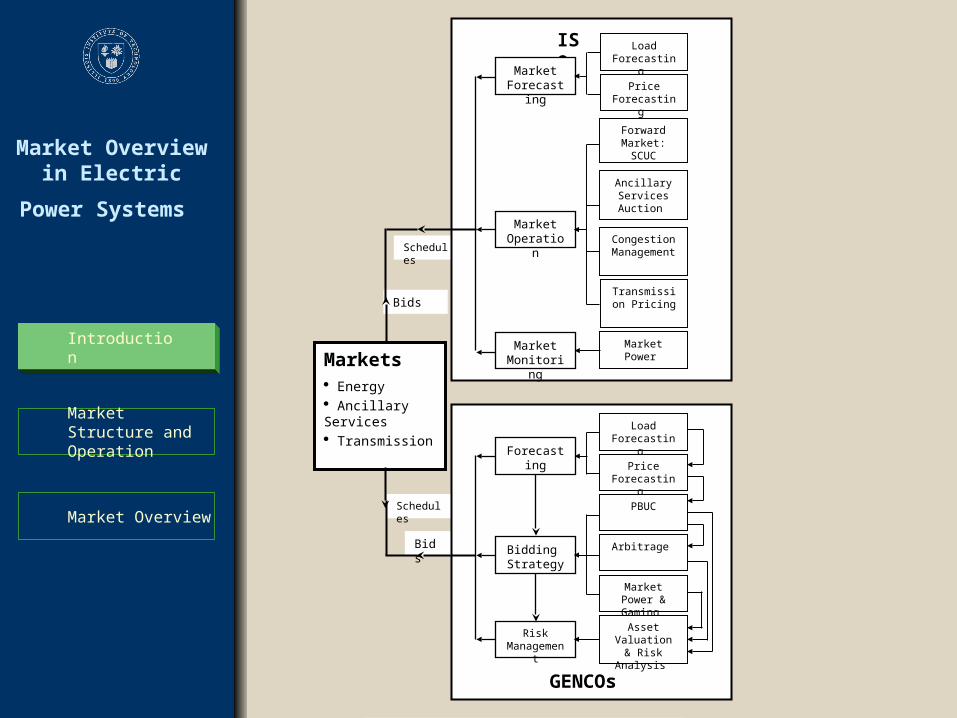
Schedules
ISO
Schedules
Bids
Bids
GENCOs
Market Forecasting
MarketOperation
Market Monitoring
Forward Market: SCUC
Ancillary Services Auction
Transmission Pricing
Market Power
Forecasting
Load Forecasting
Price Forecasting
Bidding Strategy
Risk Management
PBUC
Arbitrage
Market Power & Gaming
Asset Valuation &
Risk Analysis
Markets Energy Ancillary Services Transmission
Load Forecasting
Price Forecasting
Congestion Management
Market Overview in Electric Power
Systems
Market Structure and Operation
Introduction
Market Overview
Introduction
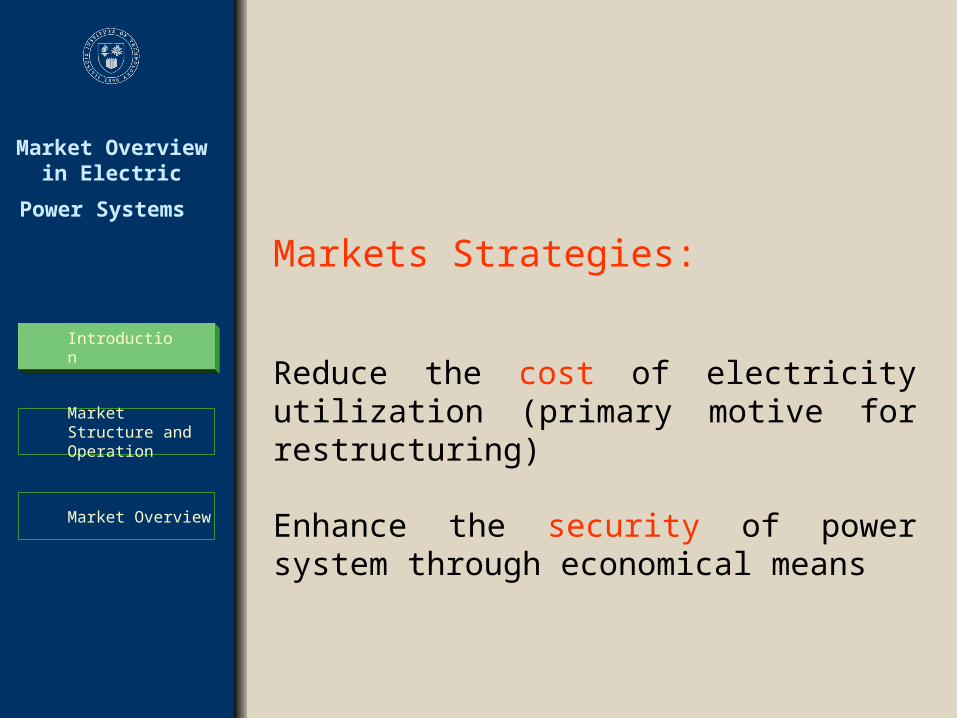
Markets Strategies:
Reduce the cost of electricity utilization (primary motive for restructuring)
Enhance the security of power system through economical means
Market Overview in Electric Power
Systems
Market Structure and Operation
Introduction
Market Overview
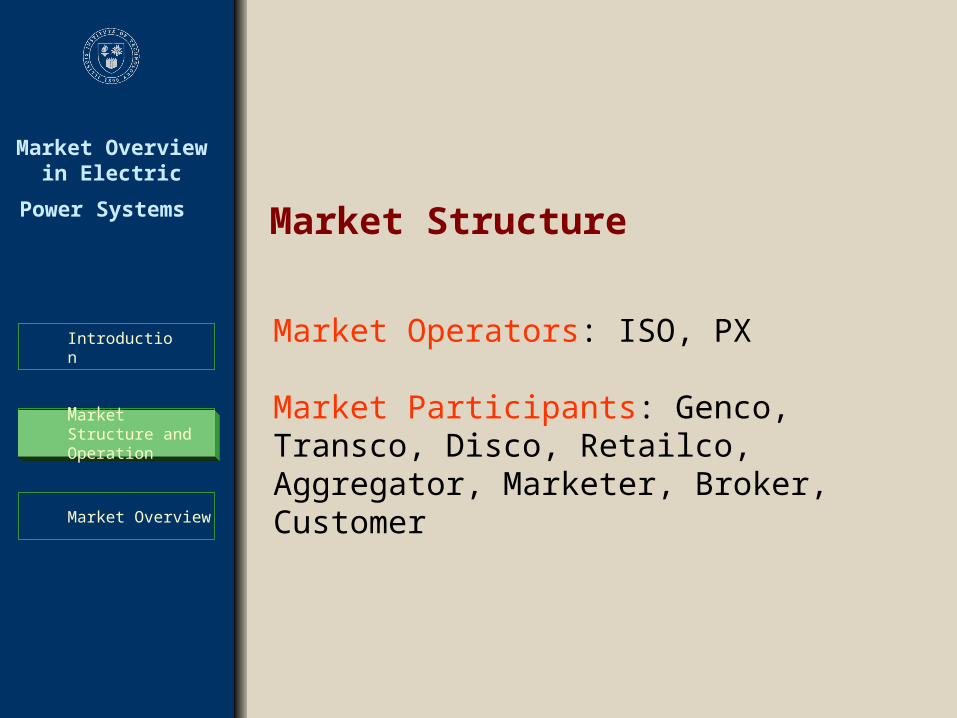
Market Structure and Operation
Market Operators: ISO, PX
Market Participants: Genco, Transco, Disco, Retailco, Aggregator, Marketer, Broker, Customer
Market Structure
Market Overview in Electric Power
Systems
Market Structure and Operation
Introduction
Market Overview
Two sets of forecasted information:
• Load
• Electricity price Market Overview
Overview of the Market
Information Forecasting
Market Overview in Electric Power
Systems
Market Structure and Operation
Introduction
Market Overview
Basis for price forecasting Most important price driver
Load forecasting applications:Unit Commitment,Power System Security, Generation Reserve Allocation, Market Behavior.
Market Overview
Load Forecasting
Market Overview in Electric Power
Systems
Market Structure and Operation
Introduction
Market OverviewMarket Overview
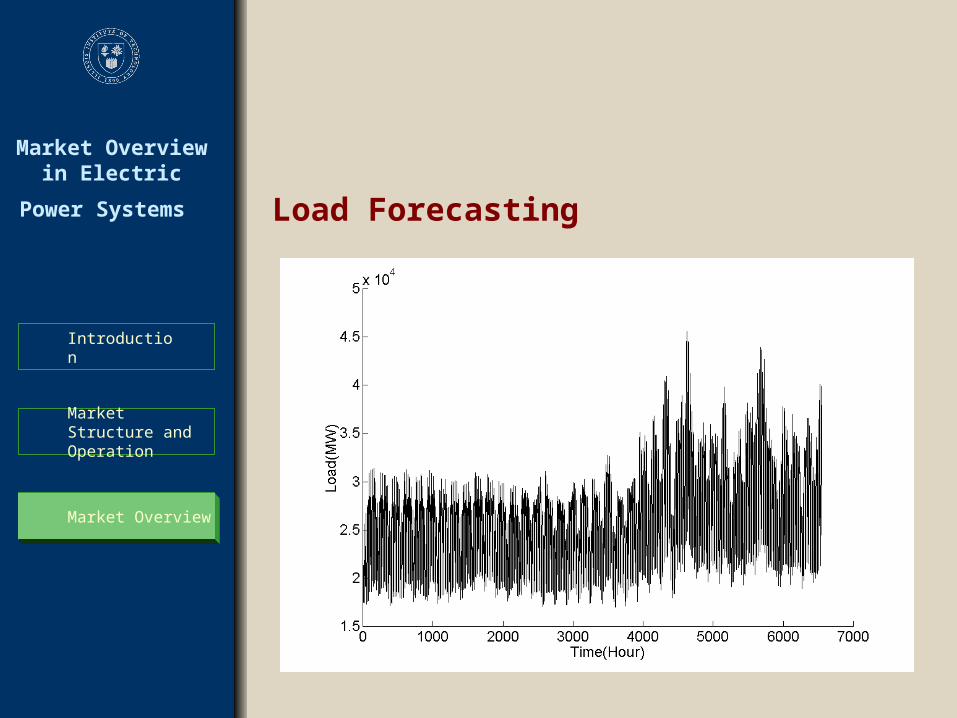
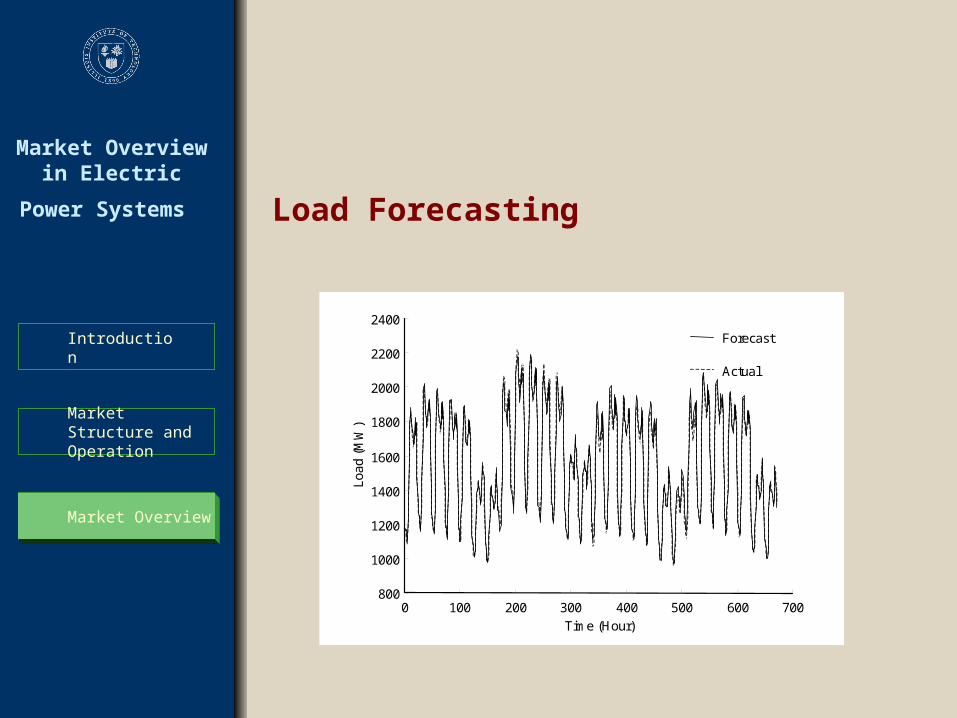
Load Forecasting
Market Overview in Electric Power
Systems
Market Structure and Operation
Introduction
Market OverviewMarket Overview
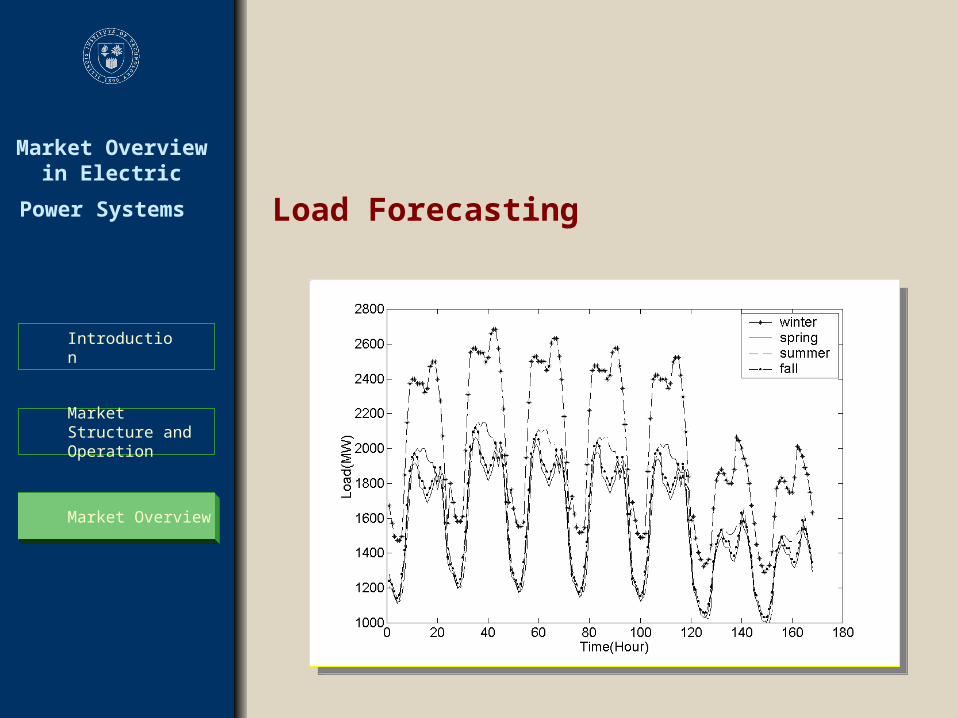
Load Forecasting
Market Overview in Electric Power
Systems
Market Structure and Operation
Introduction
Market OverviewMarket Overview
Load Forecasting
0 100 200 300 400 500 600 700 800
1000
1200
1400
1600
1800
2000
2200
2400
Time (Hour)
Load
(M
W)
Forecast
Actual
Market Overview in Electric Power
Systems
Market Structure and Operation
Introduction
Market Overview
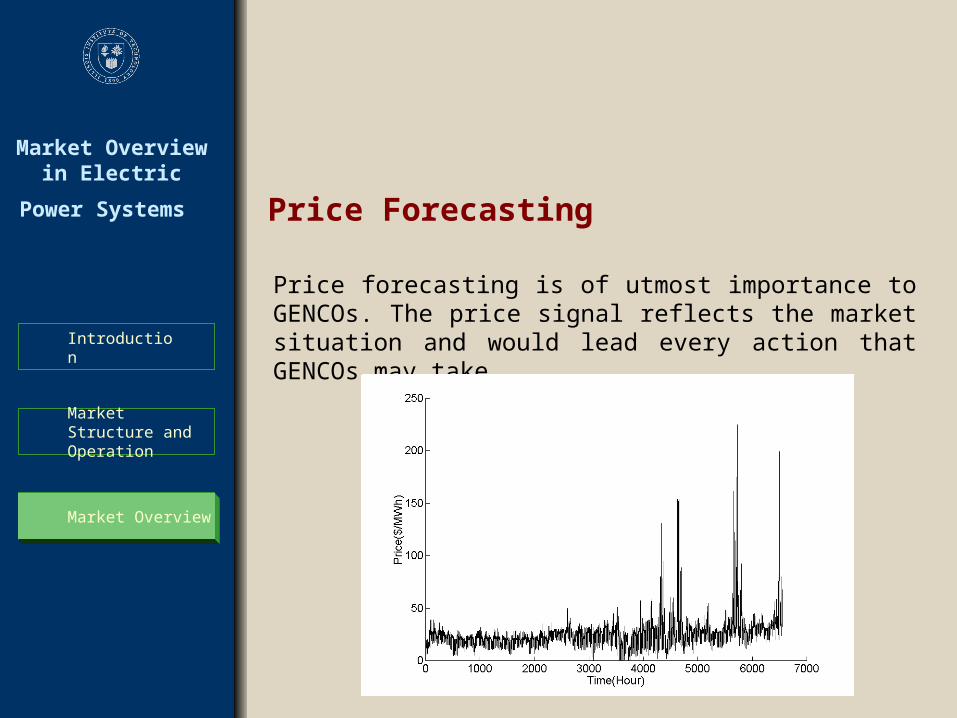
Price forecasting is of utmost importance to GENCOs. The price signal reflects the market situation and would lead every action that GENCOs may take.
Market Overview
Price Forecasting
Market Overview in Electric Power
Systems
Market Structure and Operation
Introduction
Market OverviewMarket Overview
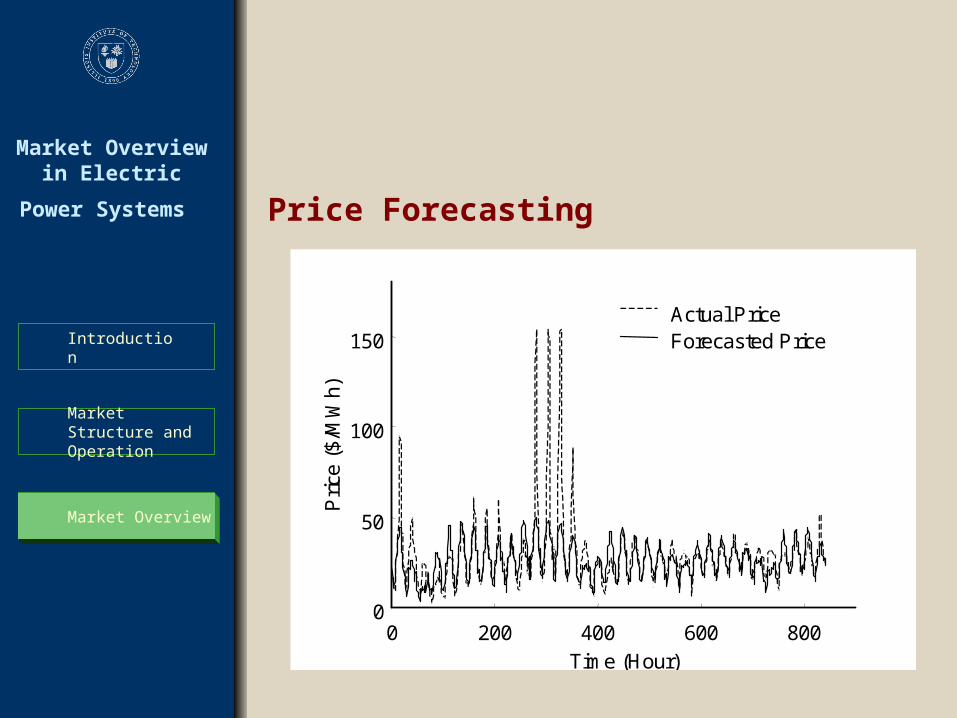
Price Forecasting
0 200 400 600 800 0
50
100
150
Time (Hour)
Pric
e ($
/MW
h)
Actual Price Forecasted Price
Market Overview in Electric Power
Systems
Market Structure and Operation
Introduction
Market OverviewMarket Overview
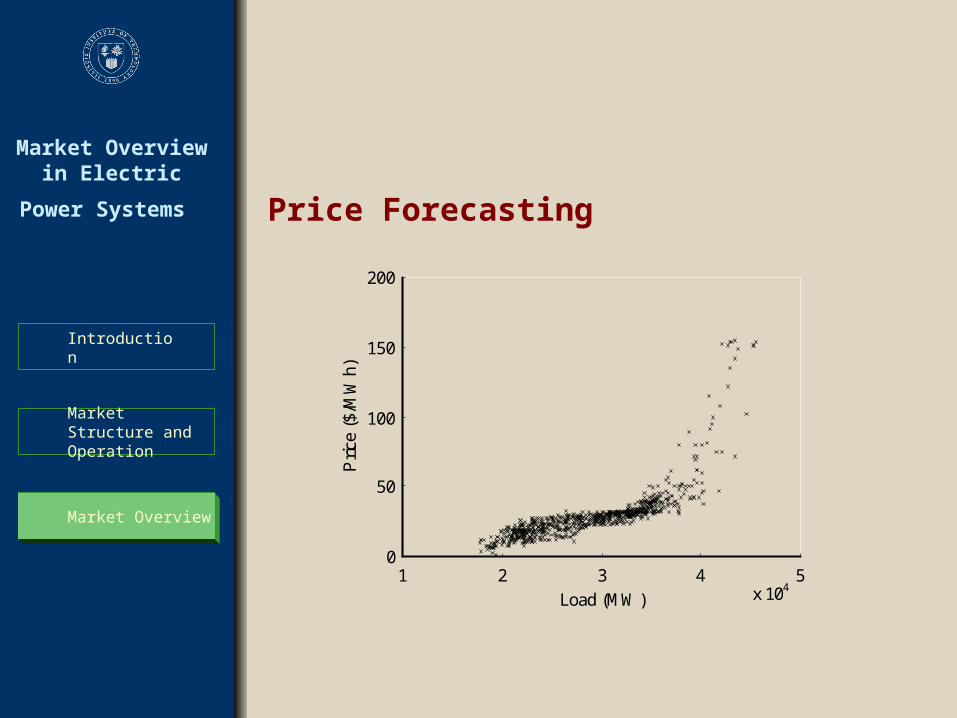
Price Forecasting
1 2 3 4 5 x 10⁴
0
50
100
150
200
Load (MW)
Pric
e ($
/MW
h)
Market Overview in Electric Power
Systems
Market Structure and Operation
Introduction
Market OverviewMarket Overview
Price Forecasting
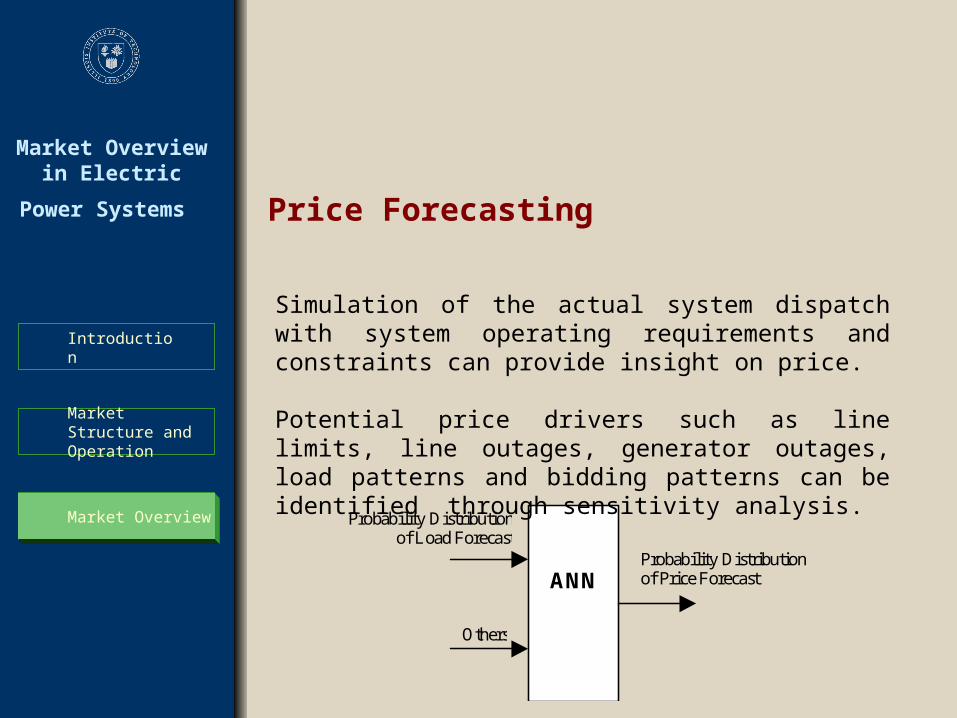
Probability Distributionof Load Forecast
Probability Distributionof Price ForecastANN
Others
Simulation of the actual system dispatch with system operating requirements and constraints can provide insight on price.
Potential price drivers such as line limits, line outages, generator outages, load patterns and bidding patterns can be identified through sensitivity analysis.
Market Overview in Electric Power
Systems
Market Structure and Operation
Introduction
Market Overview
In California and New England, GENCOs will run the unit commitment, which is called price based unit commitment.
Market Overview
Unit Commitment in Markets
In PJM and New York, ISO runs the transmission security and voltage constrained unit commitment, which is called security constrained unit commitment.

Market Overview in Electric Power
Systems
Market Structure and Operation
Introduction
Market OverviewMarket Overview
Unit Commitment in Markets
PBUC
gm
rm
nm
m0
mg
mr
mn
P0 P R N
gm
rm
nm
m0
mg
mr
mn
P0 P R N
Market Overview in Electric Power
Systems
Market Structure and Operation
Introduction
Market OverviewMarket Overview
Unit Commitment in Markets
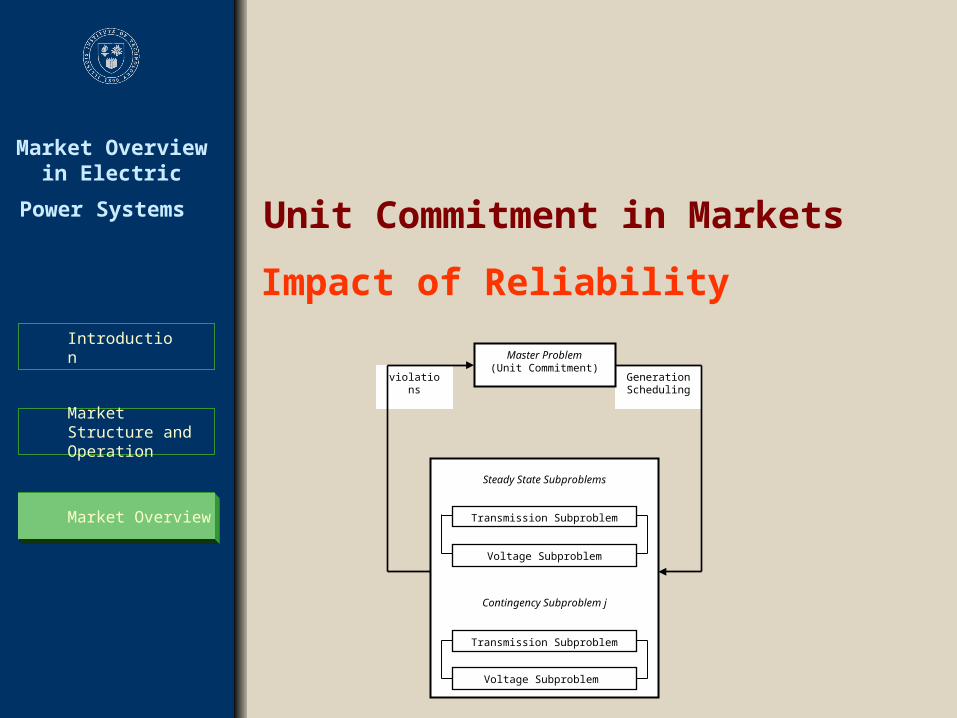
Impact of Reliability
Generation Scheduling
violations
Voltage Subproblem
Transmission Subproblem
Master Problem(Unit Commitment)
Contingency Subproblem j
Transmission Subproblem
Voltage Subproblem
Steady State Subproblems

Market Overview in Electric Power
Systems
Market Structure and Operation
Introduction
Market Overview
The usage of arbitrage includes any activity that attempts to buy a relatively under-priced commodity and to sell a similar and relatively overpriced commodity for profit.
Market Overview
Arbitrage in Electricity Markets
EmissionPrice ($/Ton)
No-ArbitrageProfit ($)
ArbitrageProfit ($)
Arbitrage StrategyArbitrage Amount
(Ton)0.1 200003 241895 Purchase 33.501 200003 219636 Purchase 15.002 200003 207427 Purchase 5.003 200003 202427 Purchase 5.004 200003 200003 No Trades 0.005 200003 202404 Sale 7.50
EmissionPrice ($/Ton)
No-ArbitrageProfit ($)
ArbitrageProfit ($)
Arbitrage StrategyArbitrage Amount
(Ton)0.1 200003 241895 Purchase 33.501 200003 219636 Purchase 15.002 200003 207427 Purchase 5.003 200003 202427 Purchase 5.004 200003 200003 No Trades 0.005 200003 202404 Sale 7.50
Market Overview in Electric Power
Systems
Market Structure and Operation
Introduction
Market OverviewMarket Overview
Market Power and Monitoring
Identify non-competitive situations in restructured energy marketplaces
Provide support for minimizing risks involved in price decisions in restructured energy marketplaces
Uncertainty and the competitiveness of the market: gaming strategy is an indispensable tool for GENCOs.
Market Overview in Electric Power
Systems
Market Structure and Operation
Introduction
Market OverviewMarket Overview
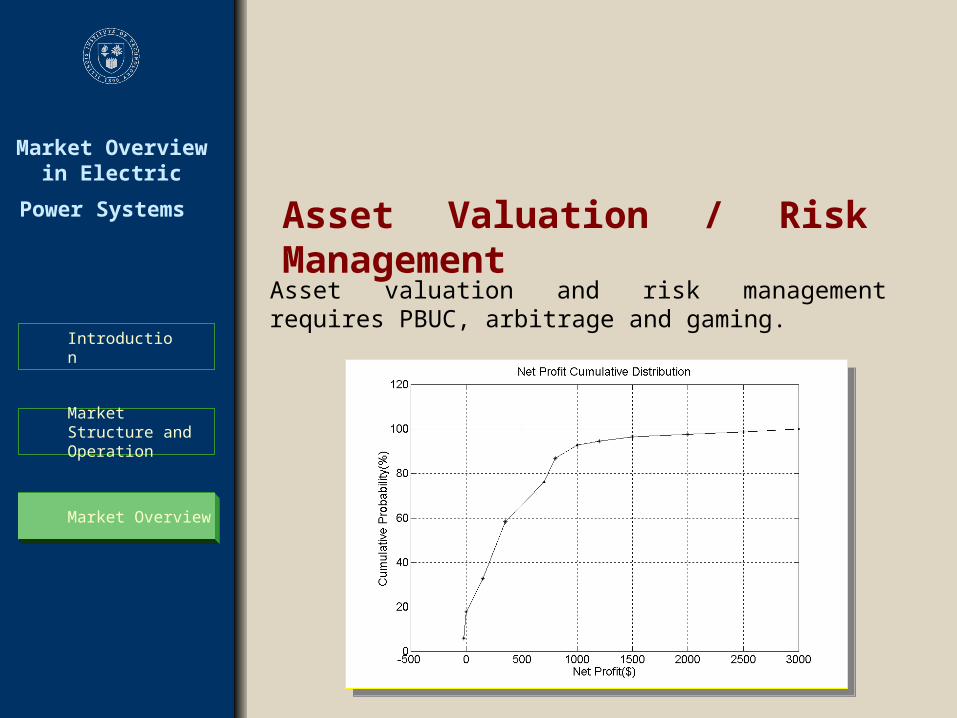
Asset Valuation / Risk Management
Asset valuation and risk management requires PBUC, arbitrage and gaming.
Market Overview in Electric Power
Systems
Market Structure and Operation
Introduction
Market OverviewMarket Overview
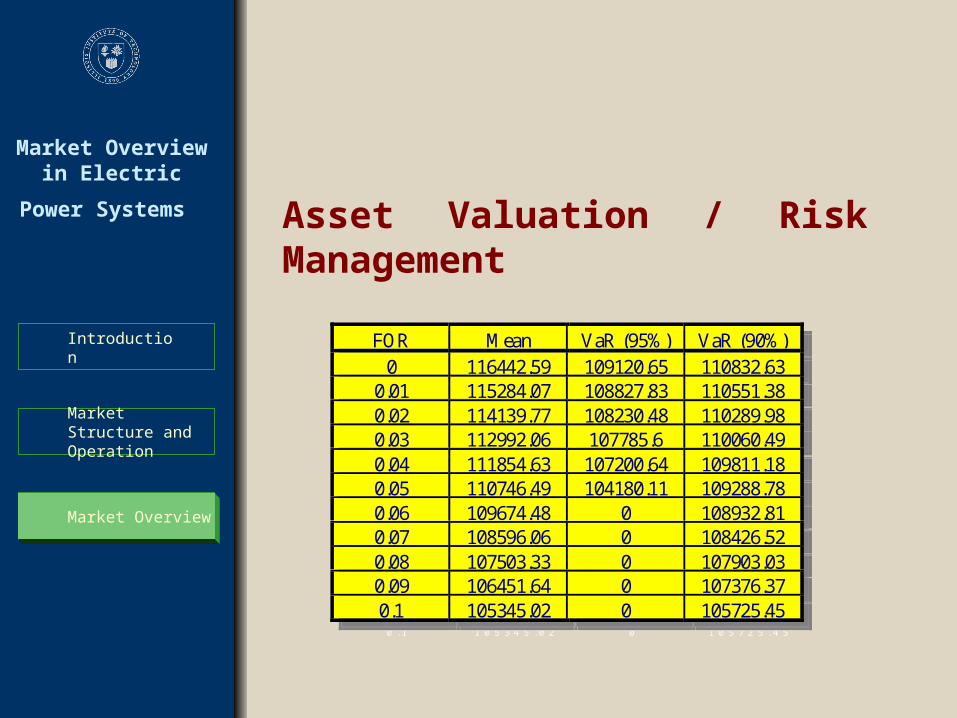
Asset Valuation / Risk Management
FOR Mean VaR (95%) VaR (90%)0 116442.59 109120.65 110832.63
0.01 115284.07 108827.83 110551.380.02 114139.77 108230.48 110289.980.03 112992.06 107785.6 110060.490.04 111854.63 107200.64 109811.180.05 110746.49 104180.11 109288.780.06 109674.48 0 108932.810.07 108596.06 0 108426.520.08 107503.33 0 107903.030.09 106451.64 0 107376.370.1 105345.02 0 105725.45
Market Overview in Electric Power
Systems
Market Structure and Operation
Introduction
Market OverviewMarket Overview
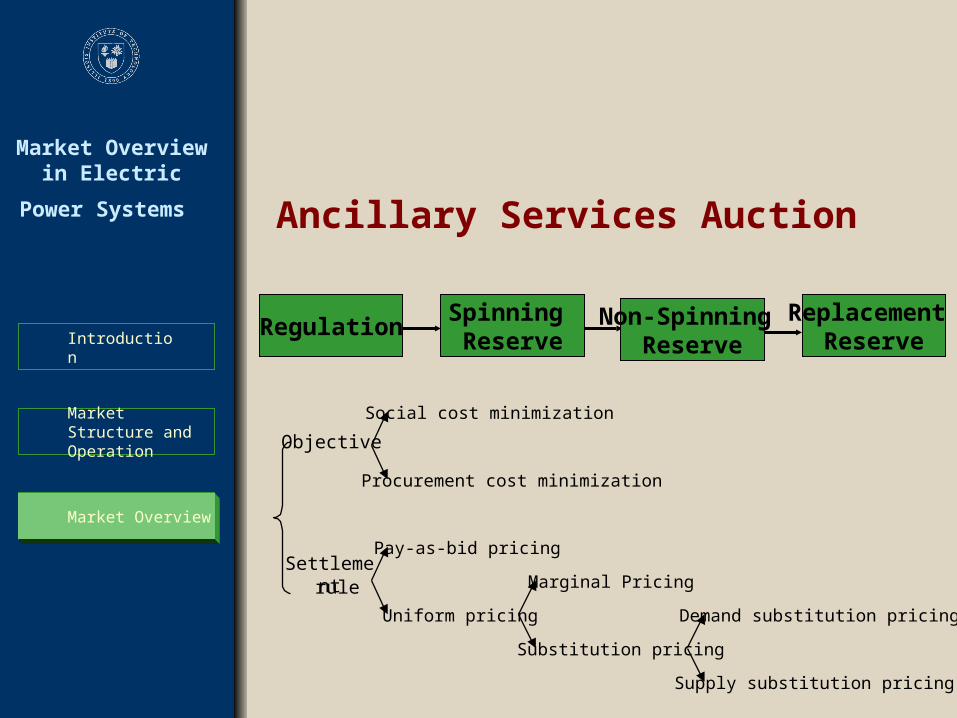
Ancillary Services Auction
Objective
Social cost minimization
Procurement cost minimization
Settlementrule
Uniform pricing
Pay-as-bid pricing
Substitution pricing
Marginal Pricing
Supply substitution pricing
Demand substitution pricing
RegulationSpinning Reserve
Non-Spinning Reserve
Replacement Reserve
Market Overview in Electric Power
Systems
Market Structure and Operation
Introduction
Market OverviewMarket Overview
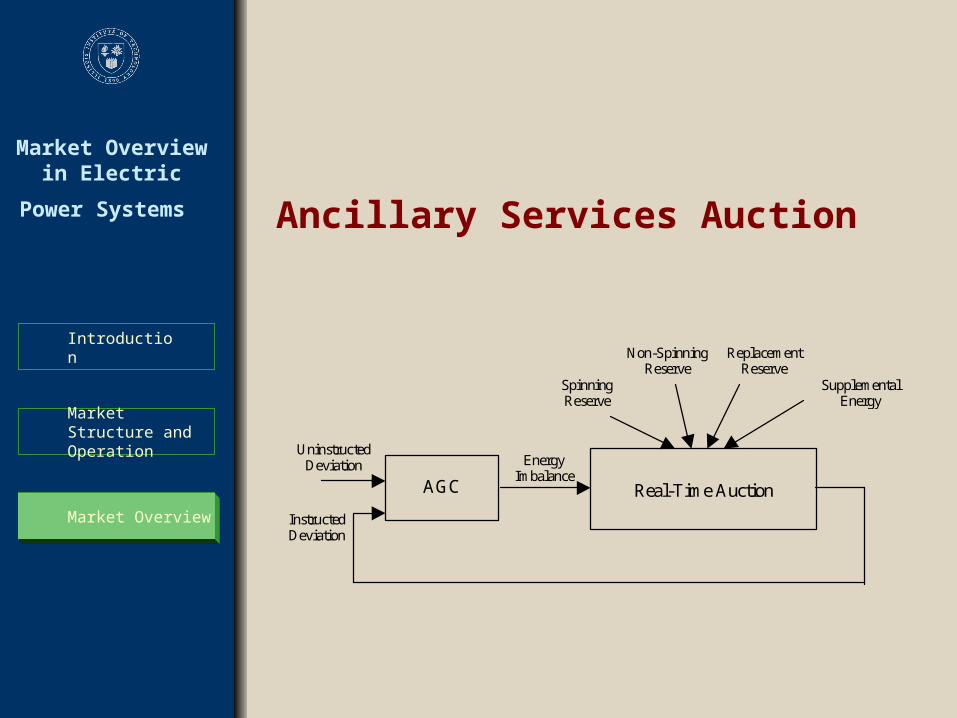
Ancillary Services Auction
EnergyImbalance
AGC Real-Time Auction
SpinningReserve
Non-SpinningReserve
ReplacementReserve
SupplementalEnergy
UninstructedDeviation
InstructedDeviation
Market Overview in Electric Power
Systems
Market Structure and Operation
Introduction
Market Overview
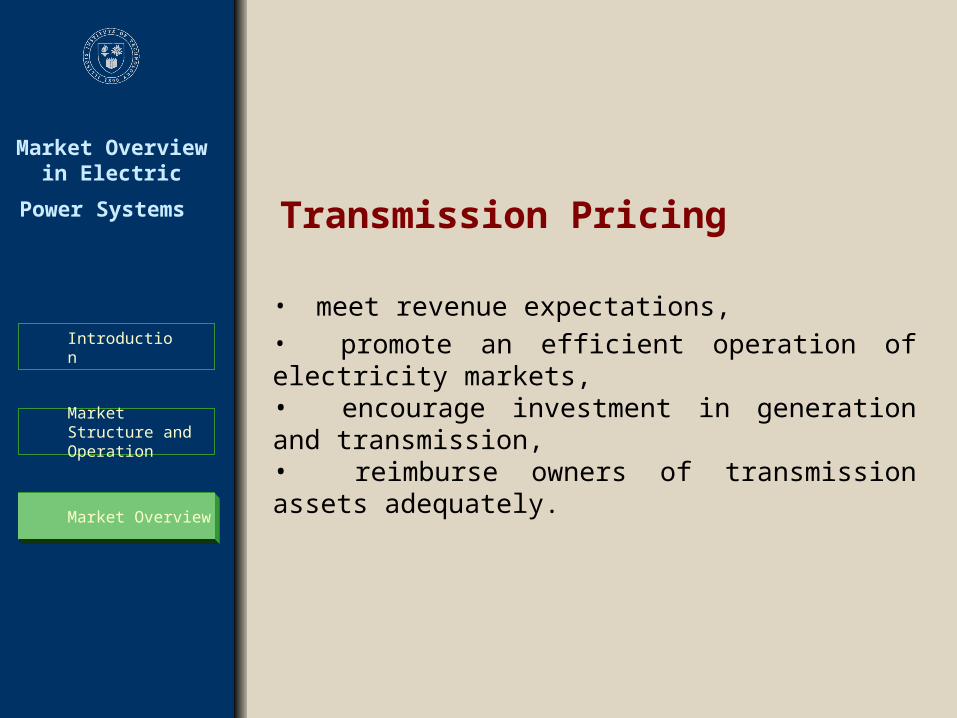
• meet revenue expectations,
Market Overview
Transmission Pricing
• promote an efficient operation of electricity markets, • encourage investment in generation and transmission, • reimburse owners of transmission assets adequately.

Market Overview in Electric Power
Systems
Market Structure and Operation
Introduction
Market Overview
Introduction
Source: EIA
Market Overview in Electric Power
Systems
Market Structure and Operation
Introduction
Market Overview
Thank You
Mohammad Shahidehpour