market data and sddp modelling brian bull ([email protected])
TRANSCRIPT

2
Three apparently unrelated topics
- The joys of modern dentistry
- Half-hourly data in the EC’s Centralised Dataset – now published as an SQL database
- SDDP modelling at the EC (as used in the Auckland 400 kV draft decision)

3
The Centralised Dataset
• The EC is tasked to publish the Centralised Dataset periodically and distribute it to participants – “The purpose of the Centralised Dataset is to support efficient planning processes by ensuring the collection and maintenance of historical information required to make decisions on transmission and transmission alternatives.”
• First release was published in July 2005; second release in July 2006
• Three main sections:– Network configuration data – system load flow models (PSS/E, DigSilent),
line diagrams, circuit breaker information– Hydrological data – weekly and monthly inflows at various sites, 1931-2005– Half-hourly data
– Meter data (HVDC flows, active power by GXP, reactive power by GXP, generation by grid injection point)
– Bids and offers– Prices– Binding constraints

4
Gnash
• Program for accessing half-hourly data, distributed with the CDS
• Purpose-built program coded in Fortran
• Loads half-hourly data from a bewildering variety of source formats and enables you to view or dump the results
• Appearance can be forbidding (see next slide)
• Slightly disturbing oral fixation
• Very useful for reading and collating data, but not really set up for doing analysis – in the past we have preferred to dump Gnash output to a flat file and analyse it in another program such as Matlab

5
Gnash (screenshot)
• …

6
MySQL Halfhourly Database
• The 2006 Centralised Dataset now includes an MySQL database containing the half-hourly data, as well as Gnash
• Gnash remains the most authoritative and ‘official’ version, but MySQL can often be more convenient for analysis
• MySQL is a free, very popular, multiplatform SQL system
– Often used in websites, but used for many other purposes as well– No special server hardware necessary, it will run on your desktop machine– GUI front-end is available for Windows (see next slide)– Or you can use Microsoft Access as a front-end if you prefer
• Allows users to run queries like this:select * from offers
where bidder='GENE'
and grid_injection_point='HLY2201'
and record_date='2005-03-04';

7
MySQL (screenshot)
• [text]

8
What is in the SQL database?
• Data include:– Half-hourly prices by node, extending back to late 1996– Half-hourly metering data, extending back to late 1996– Half-hourly offer data by node, extending back to mid 2002– Half-hourly binding constraint data, mid 1998 through mid 2005.
• Some summary tables added for convenience– Regional offtake totals (Auckland, North Isthmus, Waikato, etc, etc)– Daily and monthly (unweighted) mean prices by node
• Additional error checking and cleaning– Dummy prices indicating missing or invalid data removed (e.g. -9999)– Initial and final runs of zeros in price data removed– Records with all values missing removed– Etc, etc

9
What kind of queries are supported?
• Here are some examples:
– show final prices at the Pakuranga node in $/MWh for each trading period on 4 March 2005
– show the maximum price at each node in the course of a given day
– show a list of pricing nodes in the North Island, excluding generation nodes
– show Genesis's offers for all 48 trading periods at Huntly on 4 March 2005
– show the offtake in kW at Woodville in each trading period of 4 March 2005
– show the offtake (expressed as an average power in kW) for each region of NZ in trading period 25 on 4 March 2005
– show load by trading period on 4 March 2005 for all nodes where the price rose above $100/MWh
– show the most commonly binding constraints over the period covered

10
Installing the database• If you are already working with MySQL, it is very easy
– Only issue is that you will need plenty of free hard drive space – I recommend 20 GB at time of installation
• If not, you would just need to install MySQL first
– Can run on your desktop PC – no need for a dedicated server machine
– Installation package can be downloaded from the internet – instructions included in CDS
– Plenty of good online help available
• One small glitch appeared after release. The installer for the MySQL database is zipped; for some reason the UltimateZip program included with the CDS will not unzip it. Use WinZip (I have only tried v10)
• If you want the Centralised Dataset and don’t have it, contact me or Brian Kirtlan ([email protected]) for your free copy

11
Next steps
• EC is working on an add-on to the database, providing the ability to produce various graphs of half-hourly data (offer stacks, nodal price traces, etc).
– Temporarily on back burner – hoping to include in next CDS release if people express interest
• Much work still to be done on naming and classifying metering data
– Many series from many sources – some as yet unnamed, others may be named wrongly and need to be corrected
– Improving the metadata around metering is an important work programme for us
• Want to have consistent labelling of nodes throughout MySQL database (would facilitate queries joining multiple tables)
• NWC Ltd are busily producing data products based on metering and pricing information
12
And now for something completely different…
13
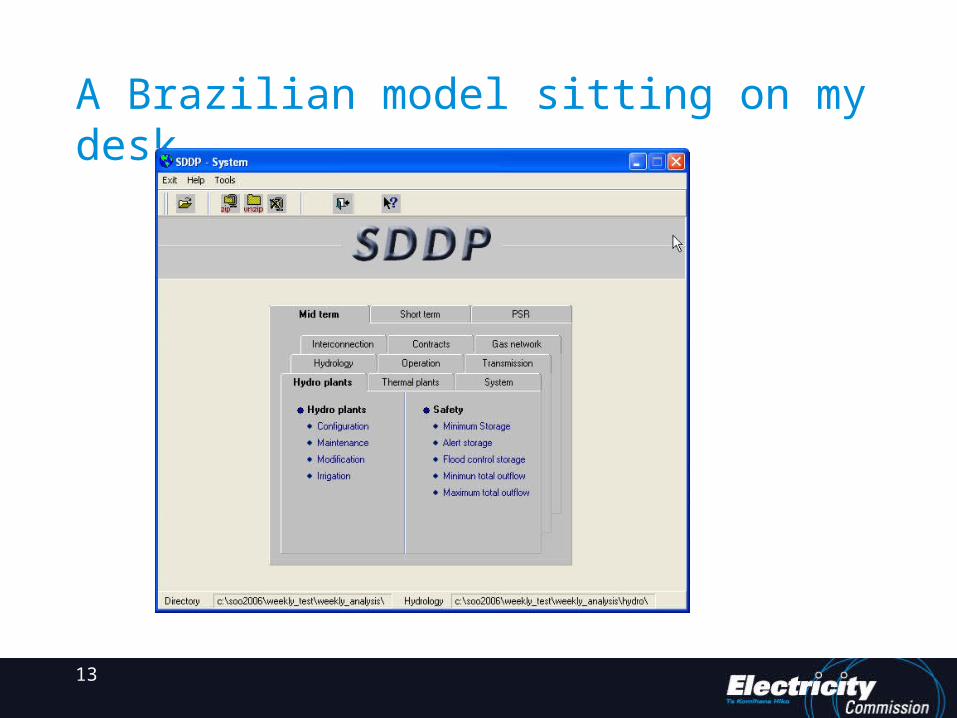
A Brazilian model sitting on my desk…

14
SDDP• SDDP is a widely-used model produced by PSR (a software company
based in Rio de Janeiro)
– “a hydrothermal dispatch model with representation of the transmission network used for short, medium and long term operation studies”
• SDDP is a least-cost model (like Spectra) rather than a market simulation
– The operating policy for each hydro plant is determined using an optimisation technique called stochastic dual dynamic programming (hence SDDP)
– The criterion is least expected cost, including thermal fuel costs, variable O&M costs, penalties for breaching defined constraints, etc, etc
• The EC uses SDDP to model New Zealand’s electricity system
– Calculates the pattern of dispatch to meet predicted loads, on a time step varying from hourly to monthly
– Some ability to model transmission, though not to the level of power systems analysis (PSA)

15
SDDP at the Electricity Commission
• First used for Waitaki water rights submission
• Model was then further developed for use in analysing Transpower’s Auckland 400 kV grid investment proposal
– SDDP model was used for one specific part of the analysis only: the estimation of loss costs
– SDDP was used to prepare a dispatch pattern for each generation scenario, which was then run through the EC’s purpose-built Loadflow software to estimate loss costs under each transmission scenario
• The Initial Statement of Opportunities (SOO), published in 2005, used Spectra for generation modelling. The new SOO will use SDDP.
– SDDP will be used to evaluate generation scenarios, in terms of unserved energy (USE) and net present value of costs incurred
• SDDP has also been found useful for various one-off analyses (for example, analysing the economic viability of the proposed Onslow-Manorburn pumped storage scheme)

16
How does SDDP compare to Spectra?• Some big advantages
– SDDP is more flexible (our perception is that Spectra has some inconvenient hard-coded limitations – for example, restrictions on new thermal plants in the South Island)
– SDDP can be used to model the AC grid at various levels of detail (will discuss the options later if time permits), whereas Spectra does not model transmission, apart from the HVDC link
– SDDP can be run with an hourly time step
– PSR provide good support for SDDP
• But some disadvantages too
– In the New Zealand context, Spectra has been used for some time and the model is well understood and validated – whereas our SDDP model is still in development
– SDDP executes much slower than Spectra
– I’m not kidding, it really is a lot slower
– Only 5 load blocks are modelled (Spectra had 14)

17
How’s your Portuguese?• SDDP manuals are in (usually) good English
• Some datafiles still use Portuguese
• Wouldn’t it be nice if the abbreviation for ‘spilled outflow’ was, say, ‘spill’, rather than ‘qverti’

18
Time frame in our SDDP models
• Three options: monthly time step, weekly time step, or hourly time step
• EC needs to run models over a 30-year period, which means using the monthly time step (weekly time step is limited to about ~7 years)
– note, test runs comparing weekly and monthly time steps have produced quite similar results – so this may not be a big issue
• In the Auckland 400 kV analysis, we used Tom Halliburton’s ‘SDDP Looper’ program to ‘have our cake and eat it too’
– firstly do a monthly run over a long period (25 / 30 years)
– the Looper then invokes SDDP to do an hourly run for the first week of each month, generating a detailed dispatch
– does the job, although SDDP takes a looong time to execute in this mode
– still, at least the constant CPU and hard disk activity of multiple PCs over a period of several weeks kept the office warm

19
AC transmission modelling in SDDP
• SDDP provides a range of options for modelling AC transmission
– Simplest and quickest option: no AC constraints at all, and losses are modelled by pro-rating demand forecast inputs, rather than within the model. (Effectively this is what was done for Auckland 400 kV GIT analysis)
– Can add AC thermal constraints to the model, optionally varying by season (Transpower currently reworking this aspect of the model)
– Can add AC group constraints for a more realistic model of AC limitations
– Can add modelling of AC line losses within SDDP (this slows down execution considerably, as dispatch is optimised accordingly).
• We are also doing some development work on a regional transmission model, with 17 regions (Auckland, HLY/WKM/WRK, Taranaki, etc), incorporating current AC constraints, inter- (but not intra-) regional AC losses, and potential future augmentations

20
Next steps• Field trip to Brazil?
• Continue to improve model, in conjunction with Transpower – bug fixes, augmentations, spelling corrections in datafiles, etc, etc
• Continue updating SDDP’s inputs – demand forecasts, hydrological inflow records, lists of generating plants, etc, etc
• Continue to develop utilities for running SDDP, producing inputs and post-processing outputs
• Use SDDP for 2007 SOO (will doubtless be a learning experience)
• Develop regional model
• Another in-development project – using SDDP to build up a ‘lookup table’ of runs, so that the net costs in a year with given levels of load, generation, and HVDC transfer capacity can be estimated by interpolation from the lookup table rather than by running SDDP
• ‘Parallel SDDP’ supposed to be coming out soon (?)