market basket analysis for a supermarket based on frequent itemset...
TRANSCRIPT
Market Basket Analysis for a Supermarket based on Frequent
Itemset Mining
Loraine Charlet Annie M.C.1 and Ashok Kumar D2
1 Department of Computer Science, Government Arts College
Trichy, India
2 Department of Computer Science, Government Arts College
Trichy, India
Abstract Market basket analysis is an important component of analytical
system in retail organizations to determine the placement of
goods, designing sales promotions for different segments of
customers to improve customer satisfaction and hence the profit
of the supermarket. These issues for a leading supermarket are
addressed here using frequent itemset mining. The frequent
itemsets are mined from the market basket database using the
efficient K-Apriori algorithm and then the association rules are
generated.
Keywords: Association Rules, Frequent Itemsets, K-Apriori,
Market Basket Analysis.
1. Introduction
One of the challenges for companies that have invested
heavily in customer data collection is how to extract
important information from their vast customer databases
and product feature databases, in order to gain competitive
advantage. Several aspects of market basket analysis have
been studied in academic literature, such as using customer
interest profile and interests on particular products for one-
to-one marketing [1], purchasing patterns in a multi-store
environment [2] to improve the sales. Market basket
analysis has been intensively used in many companies as a
means to discover product associations and base a
retailer’s promotion strategy on them.
Informed decision can be made easily about
product placement, pricing, promotion, profitability and
also finds out, if there are any successful products that
have no significant related elements. Similar products can
be found so those can be placed near each other or it can
be cross-sold.
A retailer must know the needs of customers and
adapt to them. Market basket analysis is one possible way
to find out which items can be put together. Market basket
analyses gives retailer good information about related sales
on group of goods basis Customers who buy s bread often
also buy several products related to bread like milk, butter
or jam. It makes sense that these groups are placed side by
side in a retail center so that customers can access them
quickly. Such related groups of goods also must be located
side-by-side in order to remind customers of related items
and to lead them through the center in a logical manner.
Market basket analysis is one of the data mining
methods [3] focusing on discovering purchasing patterns
by extracting associations or co-occurrences from a store’s
transactional data. Market basket analysis determines the
products which are bought together and to reorganize the
supermarket layout, and also to design promotional
campaigns such that products’ purchase can be improved.
Hence, the Market consumer behaviors need to be
analyzed, which can be done through different data mining
techniques.
Data mining finds interesting patterns from
databases such as association rules, correlations, sequences,
classifiers, clusters and many more of which the mining of
association rules is one of the most popular problems.
Association rule mining finds interesting association or
correlation relationships among a large set of data items.
Association rules are derived from the frequent itemsets
using support and confidence as threshold levels. The sets
of items which have minimum support are known as
Frequent Itemset. The support of an itemset is defined as
the proportion of transactions in the data set which contain
the itemset. Confidence is defined as the measure of
certainty or trustworthiness associated with each
discovered pattern. Association rules derived depends on
confidence. Frequent itemset generation is done using data
mining algorithms like Apriori [4], FP-Growth Algorithm
[5], Eclat [6] and K-Apriori [7]. Apriori algorithm for
frequent itemset mining is given below.
IJCSI International Journal of Computer Science Issues, Vol. 9, Issue 5, No 3, September 2012 ISSN (Online): 1694-0814 www.IJCSI.org 257
Copyright (c) 2012 International Journal of Computer Science Issues. All Rights Reserved.
Apriori algorithm for Frequent Itemset Mining
Cdn : Candidate itemset of size n
Ln: frequent itemset of size n
L1 = {frequent items};
For (n=1; Ln != ; n++)
Do begin
Cdn+1 = candidates generated from Ln;
For each transaction T in database do
Increment the count of all candidates in Cdn+1 that are
contained in T
Ln+1= candidates in Cdn+1 with min_support
End
Return
Apriori algorithm is a level-wise, breadth-first
algorithm which counts transactions Apriori algorithm
uses prior knowledge of frequent itemset properties.
Apriori uses an iterative approach known as a level-wise
search, in which n-itemsets are used to explore (n+1)-
itemsets. To improve the efficiency of the level-wise
generation of frequent itemsets Apriori property is used
here. Apriori property insists that all non-empty subsets of
a frequent itemset must also be frequent. This is made
possible because of the anti-monotone property of support
measure - the support for an itemset never exceeds the
support for its subsets. A two-step process consists of join
and prune actions are done iteratively.
The most influential algorithm for efficient
association rule discovery from market databases is K-
Apriori which uses the above mentioned Apriori property.
This algorithm shows good performance with sparse
datasets hence it is considered. The K-Apriori algorithm
extracts a set of frequent itemsets from the data, and then
pulls out the rules with the highest information content for
different groups of customers by dividing the customers in
different clusters.
2. Anantha store description
Market basket analysis can be used to learn more about
customer behavior. The methodology of market basket
analysis in Anantha stores is to discover the selling
documents with the items for the transactions. Here the
Copy bills are the selling documents considered here. This
logic is valid for item-related market basket analysis.
Anantha stores are a supermarket that has for years among
the top supermarkets in the Tirunelveli city. Anantha
stores are organized in eight separate sections.
(a)Household items (b) Fruits and vegetables (c)Bakery (d)
Kitchen wares (e)Toys (f)Gifts, (g)Textiles and
(h)Pharmacy.
The household section includes more than 700
items with different brands and prices. This is the main
section of this store which provides the major revenue. It
provides approximately 75% of the profit for this
supermarket.
Customers include small retail shops, products'
agents and normal individuals. The supermarket makes
almost 45% of its sales revenues by selling goods in
wholesale for small retail shops. Then, 18% revenue
comes from hotels and remaining 37% from the normal
retailers. Wholesale has business relations with more than
250 buyers, and Wholesale issues approximately 3000
invoices with total 2,200 items weekly. Retail sells goods
to about 600 end consumers daily.
2.1. Marketing and sales promotion campaigns
When sales campaigns are prepared, promoted
items must be chosen very carefully. The main goal of a
campaign is to entice customers to visit Anantha Stores
and to buy more than they usually do. Margins on
promoted items are usually cut; therefore, additional non-
promoted items with higher margins should be sold
together with promoted items. Therefore, the related items
must be chosen to make effective promotions such that
promoted items must generate sales of non-promoted items.
Customers who buy a kitchen appliance often also buy
several other kitchen appliances. It makes sense that these
groups are placed side by side in a retail center so that
customers can access them quickly. Such related groups of
goods also must be located side-by-side in order to remind
customers of related items and to lead them through the
center in a logical manner. When different additional
brands are sold together with the basic brands, the revenue
from the basic brands is not decreasing, but increasing.
2.2. Information systems
Market basket analysis targets customer baskets in
order to monitor buying patterns and improve customer
satisfaction (Microstrategy: Business Intelligence in the
Retail Industry, Microstrategy World 2003 Conference,
Las Vegas, 2003). Market basket analysis is an important
component of analytical CRM in retail organizations. By
analysing, recurring patterns in order to offer related goods
together can be found and therefore the sales can be
increased. Sales on different levels of goods classifications
and on different customer segments can be tracked easily.
Market basket analysis will be taken into consideration to
improve the sales in Anantha Store.
Different analyses and reports were performed in
Anantha store' transactional information systems, much of
the analytical data was held in Excel spreadsheets and
Access databases. The inventory levels of each item in the
supermarket on a monthly basis are stored in Access
database and enables detailed inventory analyses and
detection of critical items. All the time it tries to use
adequate analytical and data mining methodologies in
IJCSI International Journal of Computer Science Issues, Vol. 9, Issue 5, No 3, September 2012 ISSN (Online): 1694-0814 www.IJCSI.org 258
Copyright (c) 2012 International Journal of Computer Science Issues. All Rights Reserved.
order to improve the whole system of business reporting.
Key success factors such as net margin, net margin per
item, net margin per customer, number of new customers
are measured and reported on monthly basis.
2.3. Binary data Pre-processing
Market Basket Data is taken from Anantha Store,
Tirunelveli, TN, India for the duration of 7 months from
July 2011 till January 2012. Anantha Store is one of the
largest departmental stores in Tirunelveli city, Tamil Nadu,
India.
In this dissertation, the transaction is observed from
copy bills or invoice copies which contain the items
purchased by different customers. Copy bill is the
duplicate copy of the bills generated in the system which is
used for future reference. Each copy bill is considered as a
transaction. On an average 962 transactions are done per
day. There are around 850 household items, 45 vegetables,
90 bakery products, 290 kitchen wares, 450 toys and gifts.
Since the household section provides major profit of the
store, household items are considered for this market
basket analysis. Using the copy bills item names’ are
coded as I1 to I850 for the different transactions which is
numbered as TR00001 to TR09620 for 10 days. The data
are converted into a 9620X302 binary data. For easy and
effective processing matrix format is considered with
Transactions as rows and the item names’ as columns for
the binary data.
For a specific transaction i, if an item j is purchased
then the matrix position (i,j) is made as 1. If the item j is
not purchased in the transaction i then the matrix position
(i,j) will be made as 0. Some dummy transactions will be
there with no items, it should be rejected. The goal is to
find the frequent items which occur together and so
transactions with one or two items is rejected for
effectiveness. Transactions with more number of items
will provide useful information about customers’
behaviour.
2.4. Customer segmentation
The complexity and especially the diversity of phenomena
have forced society to organize the customers based on
their similarities on their purchase behavior. Clustering
partition a data set into several dis-joint groups such that
points in the same group are similar to each other
according to some similarity metric. Clustering is useful to
build and identify the different clusters or segments of a
market.
In K-Apriori algorithm, initially the binary data is
clustered such that the customers are categorized and then
the clusters’ frequent itemsets are generated. The binary
data is clustered using the standard K-means algorithm
based on the linear wiener transformation. Binary data is
linearly wiener transformed and then clustered using the
K-means algorithm which is described in section III as
separate functions with names wiener() for wiener
transformation and kmeans() for K-means algorithm. K-
Apriori algorithm addresses different customer groups’
satisfaction using this clustering property.
3. K-Apriori algorithm
K-Apriori [7] is based on the Apriori property and the
Association rule generation procedure of the Apriori
algorithm. Initially, the binary data is transformed into real
domain using linear Wiener transformation. The Wiener
transformed data is partitioned using the multi-pass K-
means algorithm. Then the Apriori procedure is executed
for the K clusters in which the sets of items which are
greater than minimum support (min_sup) are found
iteratively. Using these frequent itemsets based on
confidence, Association rules are derived. The items in
the clusters are very similar, so that multiple and high
informative frequent itemsets are effectively generated in
the K-Apriori algorithm. The K-Apriori algorithm is given
as follows
K-Apriori Algorithm for Frequent Itemset Mining
Input: Binary data matrix X of size p x q, K
Output: Frequent Itemsets and Association rules
//Binary data is transformed to real data using Wiener
transformation on a vector basis.
V = Call function wiener2 (Xi)
// Xi is a vector i of X
//Calculate K clusters (C1, C2, …CK) for V using
K-means algorithm
{C1, C2, …CK }= Call function kmeans (V, K)
For each cluster Ci
Cdn : Candidate itemset of size n
Ln: frequent itemset of size n
L1 = {frequent items};
For (n=1; Ln != ; n++)
IJCSI International Journal of Computer Science Issues, Vol. 9, Issue 5, No 3, September 2012 ISSN (Online): 1694-0814 www.IJCSI.org 259
Copyright (c) 2012 International Journal of Computer Science Issues. All Rights Reserved.
Do begin
Cdn+1 = candidates generated from Ln;
For each transaction T in database do
Increment the count of all candidates in Cdn+1 which are
contained in T
Ln+1= candidates in Cdn+1 with min_support
End
are the frequent itemsets generated
End
End
Function wiener2 (Xi)
Input : Binary data vector Xi of size 1 X q
Output : Transformed data vector Yi of size 1 X q
Step 1: Calculate the mean µ for the input vector Xi around each
element
∑ where is
the local neighborhood of each element
Step 2: Calculate the variance around each element for the
vector
∑ -
where is the local neighborhood of each element
Step 3: Perform wiener transformation for each element in the
vector using equation Y based on its neighborhood
where is the average of all the local estimated variances.
Function kmeans (V, K)
Input: Wiener Transformed data matrix V and number of
clusters K.
Output: K clusters
Step 1: Choose initial cluster centroids Z1, Z2,…, ZK randomly
from the N points; X1, X2, … Xp , Xi Rq
where q is the number of features/attributes
Step 2: Assign point Xi, i = 1, 2, …, p to cluster Cj,
where j = 1,2,…,K, if and only if || Xi – Zj|| < || Xi –
Zt||, t = 1, 2,…,K. and j ≠ t. Ties are resolved arbitrarily.
Step3: Compute the new cluster centroids
Z1*,Z2*,…,ZK* as
∑
∑
where i = 1, 2,…,K, and =Number of points in Cj.
Step 4: If Zi* = Zi , i = 1, 2,…, K then terminate. Otherwise Zi
Zi* and go to step 2.
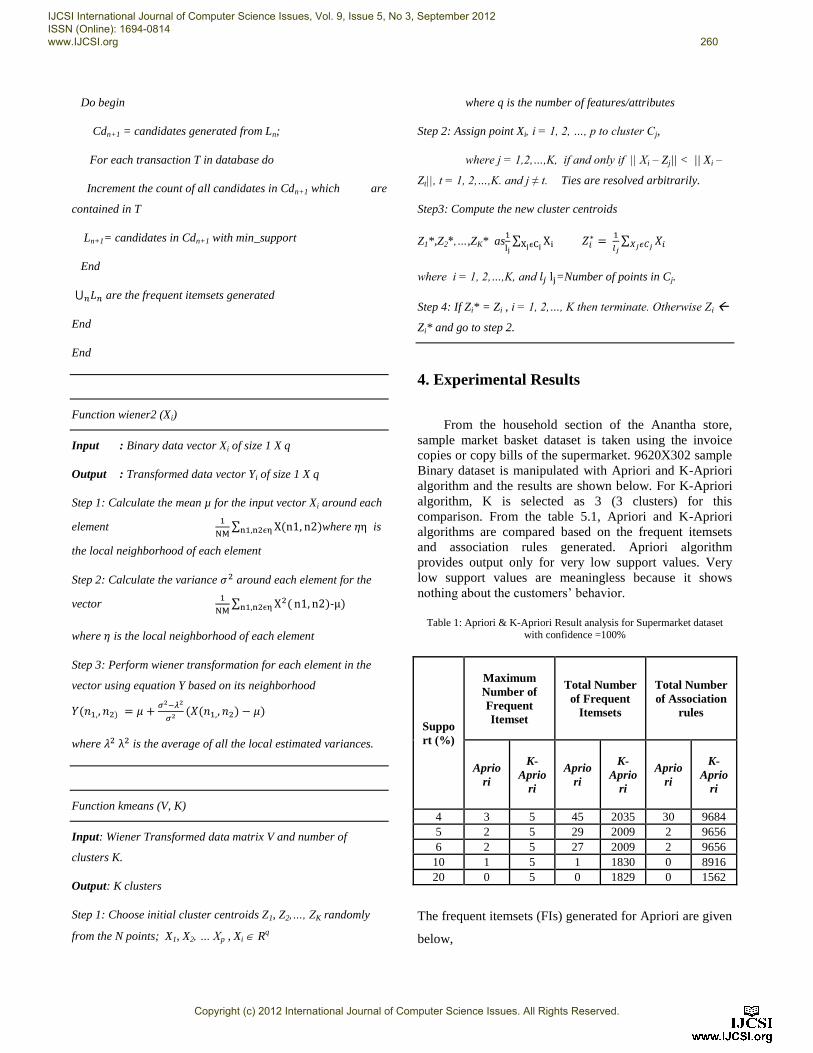
4. Experimental Results
From the household section of the Anantha store,
sample market basket dataset is taken using the invoice
copies or copy bills of the supermarket. 9620X302 sample
Binary dataset is manipulated with Apriori and K-Apriori
algorithm and the results are shown below. For K-Apriori
algorithm, K is selected as 3 (3 clusters) for this
comparison. From the table 5.1, Apriori and K-Apriori
algorithms are compared based on the frequent itemsets
and association rules generated. Apriori algorithm
provides output only for very low support values. Very
low support values are meaningless because it shows
nothing about the customers’ behavior.
Table 1: Apriori & K-Apriori Result analysis for Supermarket dataset with confidence =100%
Suppo
rt (%)
Maximum
Number of
Frequent
Itemset
Total Number
of Frequent
Itemsets
Total Number
of Association
rules
Aprio
ri
K-
Aprio
ri
Aprio
ri
K-
Aprio
ri
Aprio
ri
K-
Aprio
ri
4 3 5 45 2035 30 9684
5 2 5 29 2009 2 9656
6 2 5 27 2009 2 9656
10 1 5 1 1830 0 8916
20 0 5 0 1829 0 1562
The frequent itemsets (FIs) generated for Apriori are given
below,
IJCSI International Journal of Computer Science Issues, Vol. 9, Issue 5, No 3, September 2012 ISSN (Online): 1694-0814 www.IJCSI.org 260
Copyright (c) 2012 International Journal of Computer Science Issues. All Rights Reserved.
1-itemset are 3 11 12 13 15
20 22 23 24 25 26
29 32 34 35 39 40
44 47 50 61 179 190
291 293 297
2-itemset is[22, 23].
Association Rules (ARs) generated are
I2223 and I23I22
are the 2 exact rules of K-Apriori algorithm for 50%
support. It implies that
“if I22 item is purchased, then I23 will be purchased” and
“ if I23 item is purchased together, then I22 will be
purchased” with 100% confidence.
Apriori algorithm implies that I22 and I23 items
are frequently purchased together with 100% confidence
for 5% of the population. Only one 2-itemset is generated
with twenty two 1-itemsets. Apriori algorithm provides 3-
itemsets for 4% support and 2-itemsets for 5% support.
K-Apriori provides 5-itemsets upto 20% support
values. Apriori derives only 2 ARs for 5% support which
provides no useful customer information and nothing for
higher support values. But, K-Apriori generates 1830 FIs
for 10% and 20% support respectively. To get the
consumer behaviour of the store at least 40% support is
needed but with Apriori it is impossible. It is possible for
K-Apriori in higher support values.
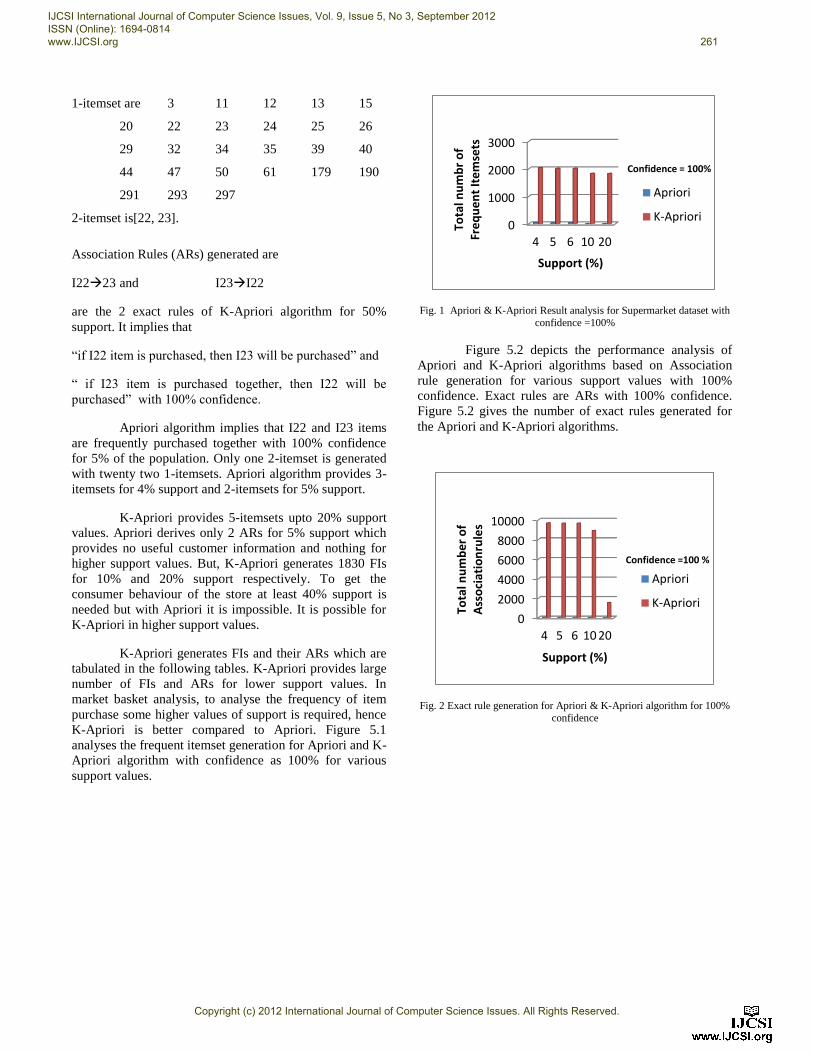
K-Apriori generates FIs and their ARs which are
tabulated in the following tables. K-Apriori provides large
number of FIs and ARs for lower support values. In
market basket analysis, to analyse the frequency of item
purchase some higher values of support is required, hence
K-Apriori is better compared to Apriori. Figure 5.1
analyses the frequent itemset generation for Apriori and K-
Apriori algorithm with confidence as 100% for various
support values.
Fig. 1 Apriori & K-Apriori Result analysis for Supermarket dataset with
confidence =100%
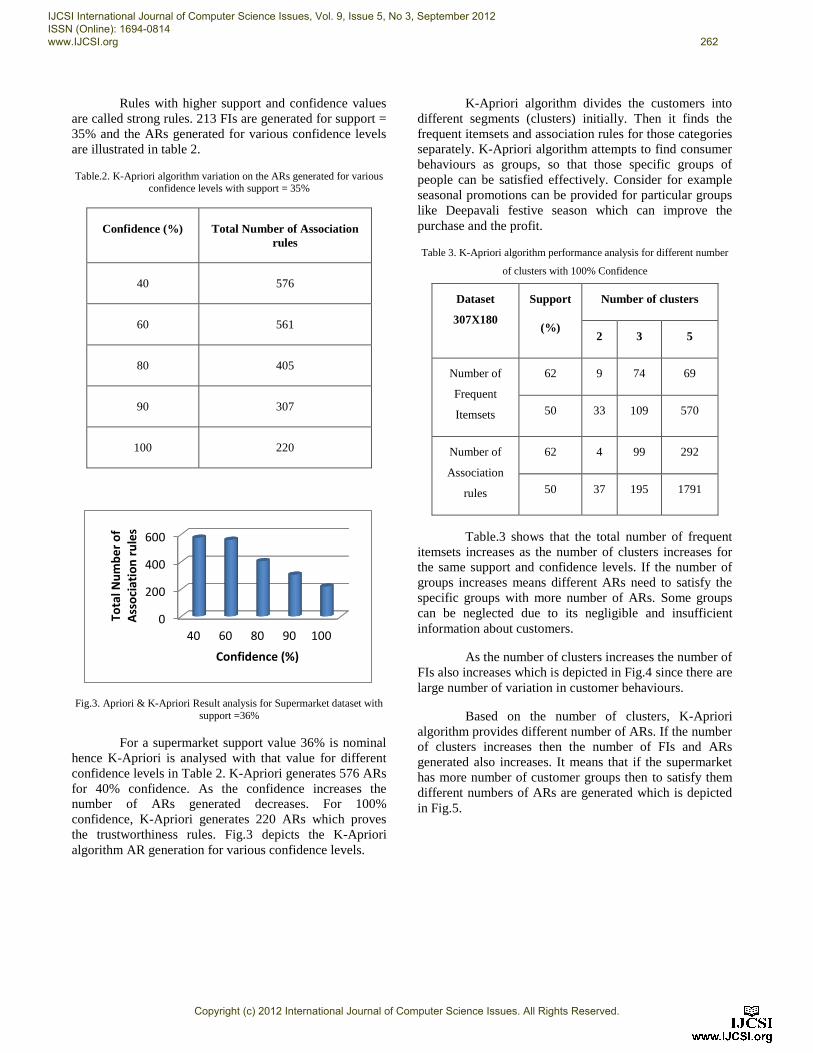
Figure 5.2 depicts the performance analysis of
Apriori and K-Apriori algorithms based on Association
rule generation for various support values with 100%
confidence. Exact rules are ARs with 100% confidence.
Figure 5.2 gives the number of exact rules generated for
the Apriori and K-Apriori algorithms.
Fig. 2 Exact rule generation for Apriori & K-Apriori algorithm for 100%
confidence
0
1000
2000
3000
4 5 6 10 20
Tota
l nu
mb
r o
f
Fre
qu
en
t It
em
sets
Support (%)
Confidence = 100%
Apriori
K-Apriori
0
2000
4000
6000
8000
10000
4 5 6 10 20
Tota
l nu
mb
er
of
A
sso
ciat
ion
rule
s
Support (%)
Confidence =100 %
Apriori
K-Apriori
IJCSI International Journal of Computer Science Issues, Vol. 9, Issue 5, No 3, September 2012 ISSN (Online): 1694-0814 www.IJCSI.org 261
Copyright (c) 2012 International Journal of Computer Science Issues. All Rights Reserved.
Rules with higher support and confidence values
are called strong rules. 213 FIs are generated for support =
35% and the ARs generated for various confidence levels
are illustrated in table 2.
Table.2. K-Apriori algorithm variation on the ARs generated for various confidence levels with support = 35%
Confidence (%) Total Number of Association
rules
40 576
60 561
80 405
90 307
100 220
Fig.3. Apriori & K-Apriori Result analysis for Supermarket dataset with
support =36%
For a supermarket support value 36% is nominal
hence K-Apriori is analysed with that value for different
confidence levels in Table 2. K-Apriori generates 576 ARs
for 40% confidence. As the confidence increases the
number of ARs generated decreases. For 100%
confidence, K-Apriori generates 220 ARs which proves
the trustworthiness rules. Fig.3 depicts the K-Apriori
algorithm AR generation for various confidence levels.
K-Apriori algorithm divides the customers into
different segments (clusters) initially. Then it finds the
frequent itemsets and association rules for those categories
separately. K-Apriori algorithm attempts to find consumer
behaviours as groups, so that those specific groups of
people can be satisfied effectively. Consider for example
seasonal promotions can be provided for particular groups
like Deepavali festive season which can improve the
purchase and the profit.
Table 3. K-Apriori algorithm performance analysis for different number
of clusters with 100% Confidence
Dataset
307X180
Support
(%)
Number of clusters
2 3 5
Number of
Frequent
Itemsets
62 9 74 69
50 33 109 570
Number of
Association
rules
62 4 99 292
50 37 195 1791
Table.3 shows that the total number of frequent
itemsets increases as the number of clusters increases for
the same support and confidence levels. If the number of
groups increases means different ARs need to satisfy the
specific groups with more number of ARs. Some groups
can be neglected due to its negligible and insufficient
information about customers.
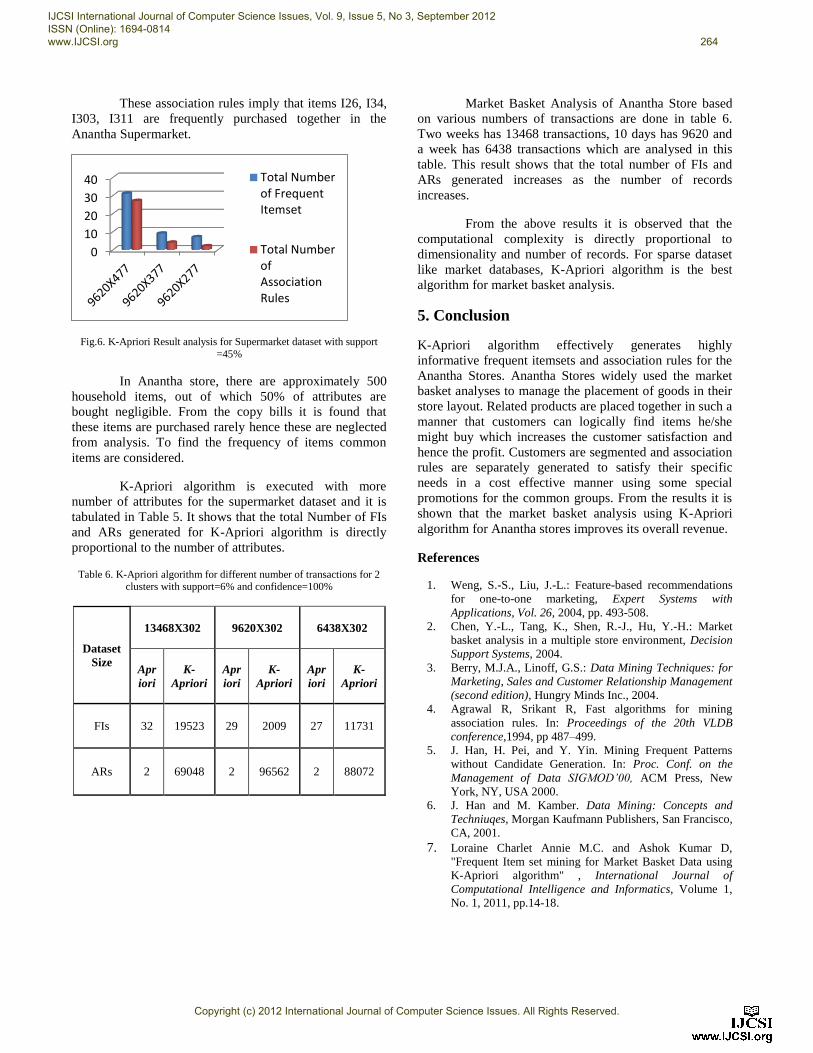
As the number of clusters increases the number of
FIs also increases which is depicted in Fig.4 since there are
large number of variation in customer behaviours.
Based on the number of clusters, K-Apriori
algorithm provides different number of ARs. If the number
of clusters increases then the number of FIs and ARs
generated also increases. It means that if the supermarket
has more number of customer groups then to satisfy them
different numbers of ARs are generated which is depicted
in Fig.5.
0
200
400
600
40 60 80 90 100
Tota
l Nu
mb
er
of
A
sso
ciat
ion
ru
les
Confidence (%)
IJCSI International Journal of Computer Science Issues, Vol. 9, Issue 5, No 3, September 2012 ISSN (Online): 1694-0814 www.IJCSI.org 262
Copyright (c) 2012 International Journal of Computer Science Issues. All Rights Reserved.
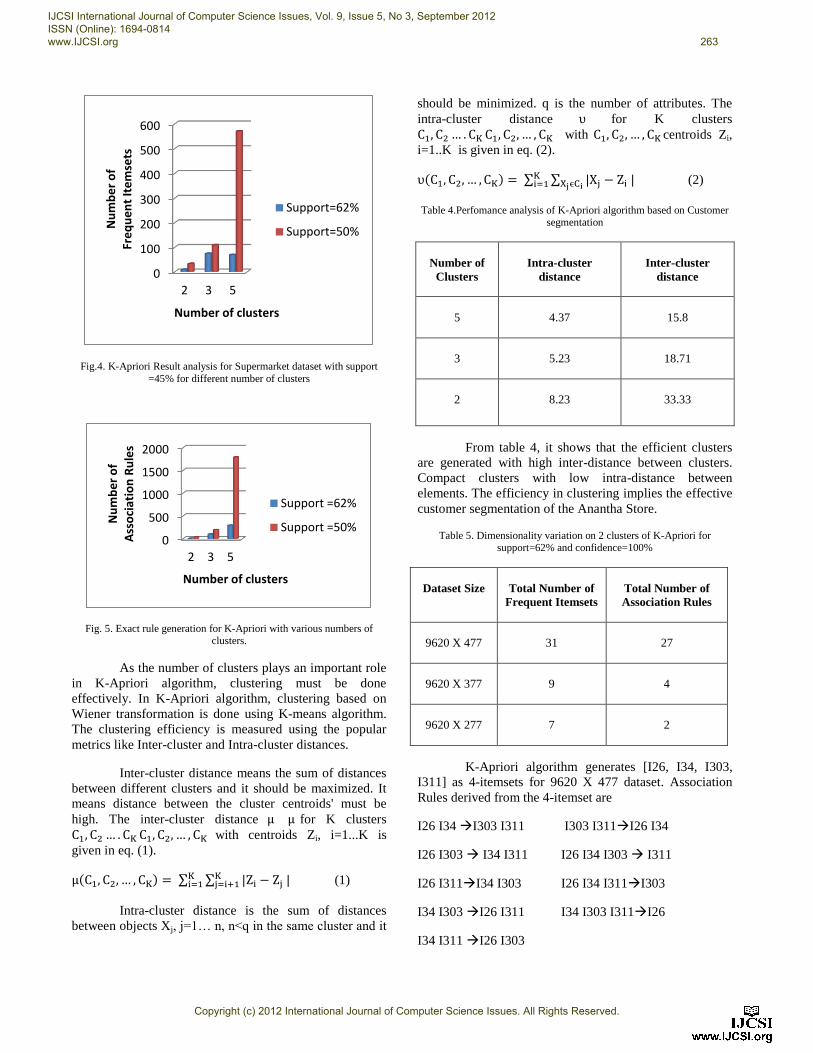
Fig.4. K-Apriori Result analysis for Supermarket dataset with support
=45% for different number of clusters
Fig. 5. Exact rule generation for K-Apriori with various numbers of clusters.
As the number of clusters plays an important role
in K-Apriori algorithm, clustering must be done
effectively. In K-Apriori algorithm, clustering based on
Wiener transformation is done using K-means algorithm.
The clustering efficiency is measured using the popular
metrics like Inter-cluster and Intra-cluster distances.
Inter-cluster distance means the sum of distances
between different clusters and it should be maximized. It
means distance between the cluster centroids' must be
high. The inter-cluster distance for K clusters
with centroids Zi, i=1...K is
given in eq. (1).
∑ ∑
(1)
Intra-cluster distance is the sum of distances
between objects Xj, j=1… n, n<q in the same cluster and it
should be minimized. q is the number of attributes. The
intra-cluster distance for K clusters
with centroids Zi,
i=1..K is given in eq. (2).
∑ ∑
(2)
Table 4.Perfomance analysis of K-Apriori algorithm based on Customer segmentation
Number of
Clusters
Intra-cluster
distance
Inter-cluster
distance
5 4.37 15.8
3 5.23 18.71
2 8.23 33.33
From table 4, it shows that the efficient clusters
are generated with high inter-distance between clusters.
Compact clusters with low intra-distance between
elements. The efficiency in clustering implies the effective
customer segmentation of the Anantha Store.
Table 5. Dimensionality variation on 2 clusters of K-Apriori for support=62% and confidence=100%
Dataset Size Total Number of
Frequent Itemsets
Total Number of
Association Rules
9620 X 477 31 27
9620 X 377 9 4
9620 X 277 7 2
K-Apriori algorithm generates [I26, I34, I303,
I311] as 4-itemsets for 9620 X 477 dataset. Association
Rules derived from the 4-itemset are
I26 I34 I303 I311 I303 I311I26 I34
I26 I303 I34 I311 I26 I34 I303 I311
I26 I311I34 I303 I26 I34 I311I303
I34 I303 I26 I311 I34 I303 I311I26
I34 I311 I26 I303
0
100
200
300
400
500
600
2 3 5
Nu
mb
er
of
Fr
eq
ue
nt
Ite
mse
ts
Number of clusters
Support=62%
Support=50%
0
500
1000
1500
2000
2 3 5
Nu
mb
er
of
A
sso
ciat
ion
Ru
les
Number of clusters
Support =62%
Support =50%
IJCSI International Journal of Computer Science Issues, Vol. 9, Issue 5, No 3, September 2012 ISSN (Online): 1694-0814 www.IJCSI.org 263
Copyright (c) 2012 International Journal of Computer Science Issues. All Rights Reserved.
These association rules imply that items I26, I34,
I303, I311 are frequently purchased together in the
Anantha Supermarket.
Fig.6. K-Apriori Result analysis for Supermarket dataset with support
=45%
In Anantha store, there are approximately 500
household items, out of which 50% of attributes are
bought negligible. From the copy bills it is found that
these items are purchased rarely hence these are neglected
from analysis. To find the frequency of items common
items are considered.
K-Apriori algorithm is executed with more
number of attributes for the supermarket dataset and it is
tabulated in Table 5. It shows that the total Number of FIs
and ARs generated for K-Apriori algorithm is directly
proportional to the number of attributes.
Table 6. K-Apriori algorithm for different number of transactions for 2 clusters with support=6% and confidence=100%
Dataset
Size
13468X302 9620X302 6438X302
Apr
iori
K-
Apriori
Apr
iori
K-
Apriori
Apr
iori
K-
Apriori
FIs 32 19523 29 2009 27 11731
ARs 2 69048 2 96562 2 88072
Market Basket Analysis of Anantha Store based
on various numbers of transactions are done in table 6.
Two weeks has 13468 transactions, 10 days has 9620 and
a week has 6438 transactions which are analysed in this
table. This result shows that the total number of FIs and
ARs generated increases as the number of records
increases.
From the above results it is observed that the
computational complexity is directly proportional to
dimensionality and number of records. For sparse dataset
like market databases, K-Apriori algorithm is the best
algorithm for market basket analysis.
5. Conclusion
K-Apriori algorithm effectively generates highly
informative frequent itemsets and association rules for the
Anantha Stores. Anantha Stores widely used the market
basket analyses to manage the placement of goods in their
store layout. Related products are placed together in such a
manner that customers can logically find items he/she
might buy which increases the customer satisfaction and
hence the profit. Customers are segmented and association
rules are separately generated to satisfy their specific
needs in a cost effective manner using some special
promotions for the common groups. From the results it is
shown that the market basket analysis using K-Apriori
algorithm for Anantha stores improves its overall revenue.
References
1. Weng, S.-S., Liu, J.-L.: Feature-based recommendations
for one-to-one marketing, Expert Systems with
Applications, Vol. 26, 2004, pp. 493-508.
2. Chen, Y.-L., Tang, K., Shen, R.-J., Hu, Y.-H.: Market
basket analysis in a multiple store environment, Decision
Support Systems, 2004.
3. Berry, M.J.A., Linoff, G.S.: Data Mining Techniques: for
Marketing, Sales and Customer Relationship Management
(second edition), Hungry Minds Inc., 2004.
4. Agrawal R, Srikant R, Fast algorithms for mining
association rules. In: Proceedings of the 20th VLDB
conference,1994, pp 487–499.
5. J. Han, H. Pei, and Y. Yin. Mining Frequent Patterns
without Candidate Generation. In: Proc. Conf. on the
Management of Data SIGMOD’00, ACM Press, New
York, NY, USA 2000.
6. J. Han and M. Kamber. Data Mining: Concepts and
Techniuqes, Morgan Kaufmann Publishers, San Francisco,
CA, 2001.
7. Loraine Charlet Annie M.C. and Ashok Kumar D,
"Frequent Item set mining for Market Basket Data using
K-Apriori algorithm" , International Journal of
Computational Intelligence and Informatics, Volume 1,
No. 1, 2011, pp.14-18.
0
10
20
30
40 Total Numberof FrequentItemset
Total NumberofAssociationRules
IJCSI International Journal of Computer Science Issues, Vol. 9, Issue 5, No 3, September 2012 ISSN (Online): 1694-0814 www.IJCSI.org 264
Copyright (c) 2012 International Journal of Computer Science Issues. All Rights Reserved.