market analysis worldwide and u.s. outsourced print and ... · 15 united states bpo document...
TRANSCRIPT

Filing Information: September 2010, IDC #224913, Volume: 1Hardcopy Peripherals: Document Solutions: Market Analysis
M A R K E T A N A L Y S I S
W o r l d w i d e a n d U . S . O u t s o u r c e d P r i n t a n d D o c u m e n t S e r v i c e s 2 0 1 0 – 2 0 1 4 F o r e c a s t a n d A n a l y s i sMichael Orasin Angèle Boyd
I D C O P I N I O NThe outsourced print/imaging services market is projected to grow 6.9% in the United States and 7.6% worldwide in 2010, having grown 8.1% and 6.1% in 2009 in the United States and worldwide, respectively. Even with a tightening economy, IDC expects specific segments of the outsourced print/imaging market will continue to grow. This is a fundamental response by the market to trim costs in the production and utilization of documents. The economic conditions in both the United States and overseas will impact growth in 2010 and 2011. Opportunities for outsourced print/imaging services providers include the following:
Although the United States continues to dominate the market for print services (both basic and managed print service [MPS]), it will have the lowest 2009–2014 compound annual growth rate, 9.8%, compared with Canada, which will grow at 16.9%,closely followed by Asia/Pacific (excluding Japan) growing at 15.9%.
The 2009–2014 compound annual growth rate for managed print services will be higher within medium-sized (100–499 employees) and large (500–999employees) companies than very large companies (1,000+ employees). This trend will be true for all regions.
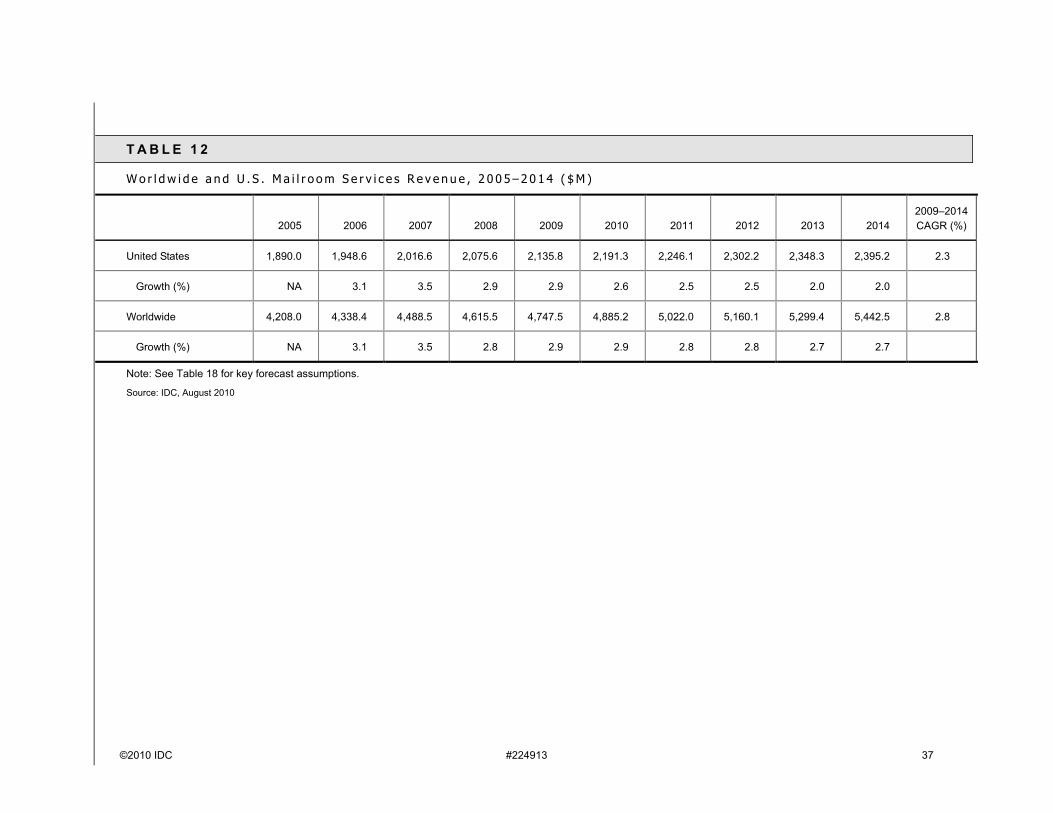
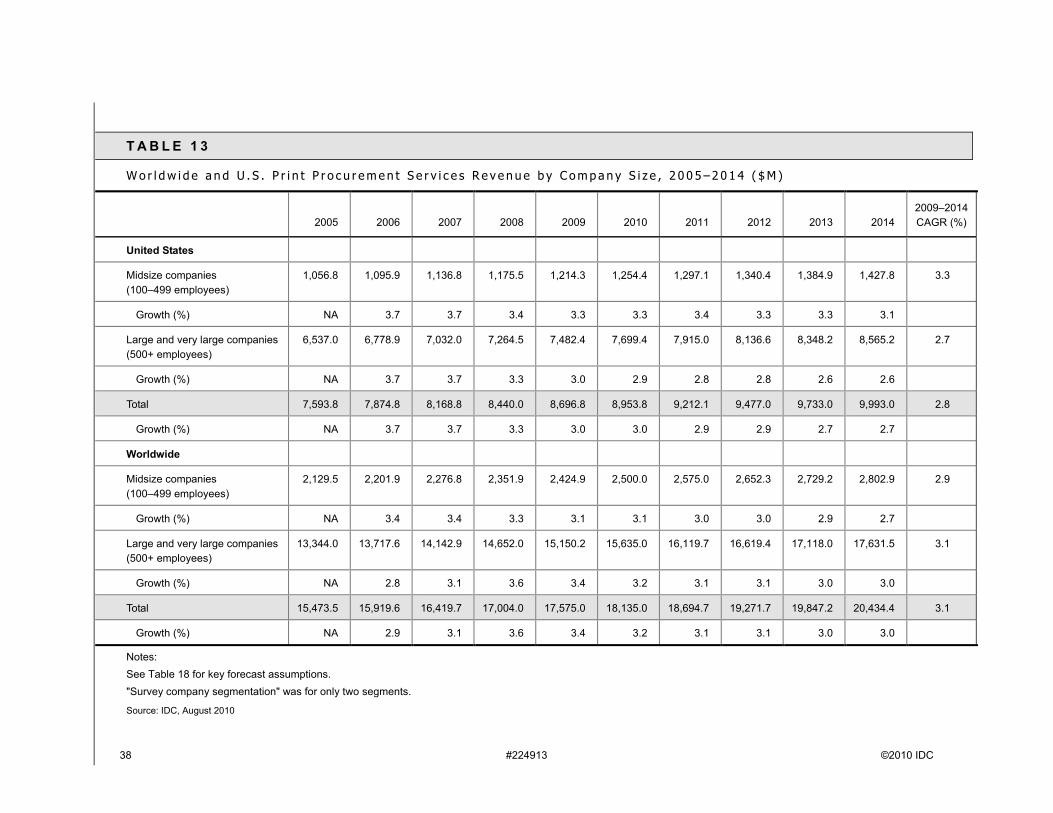
Mature service segments such as in-house production print and mailroom services will see only modest growth over the next five years with CAGRs of 3.2% and 2.3%, respectively, for the United States and 3.2% and 2.8%, respectively, worldwide. Print procurement services are expected to slowly decline with CAGRs of 2.8% for the United States and 3.1% worldwide.
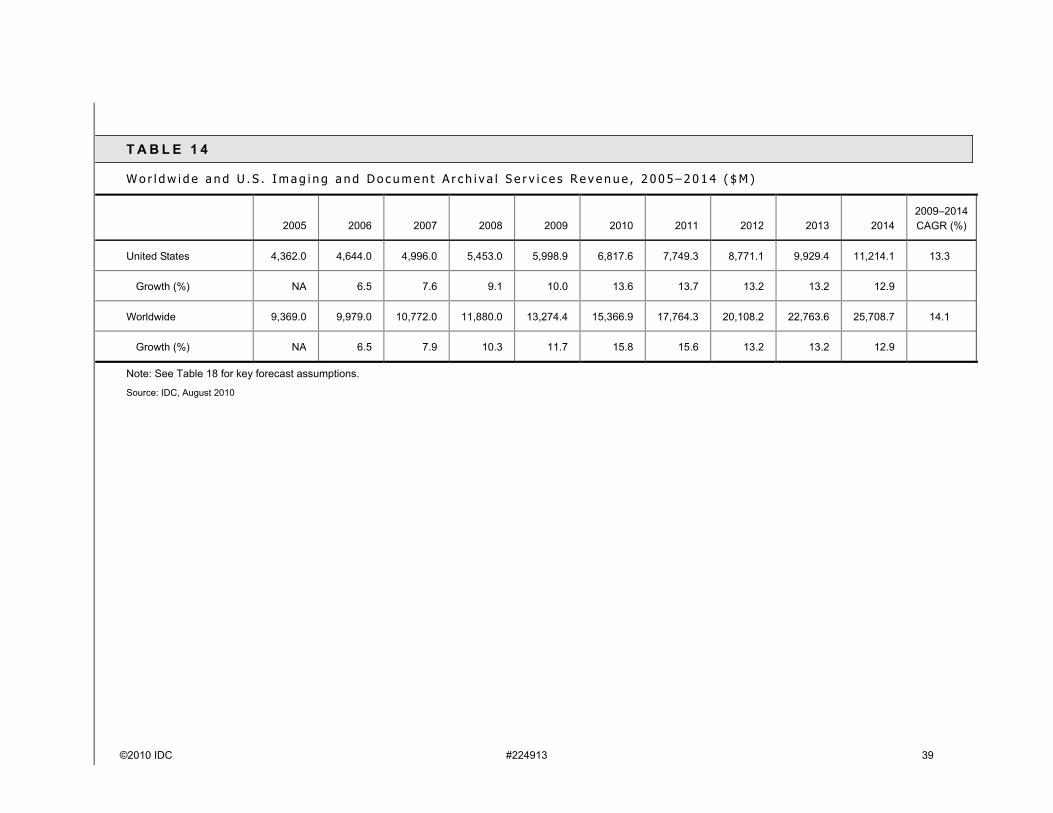
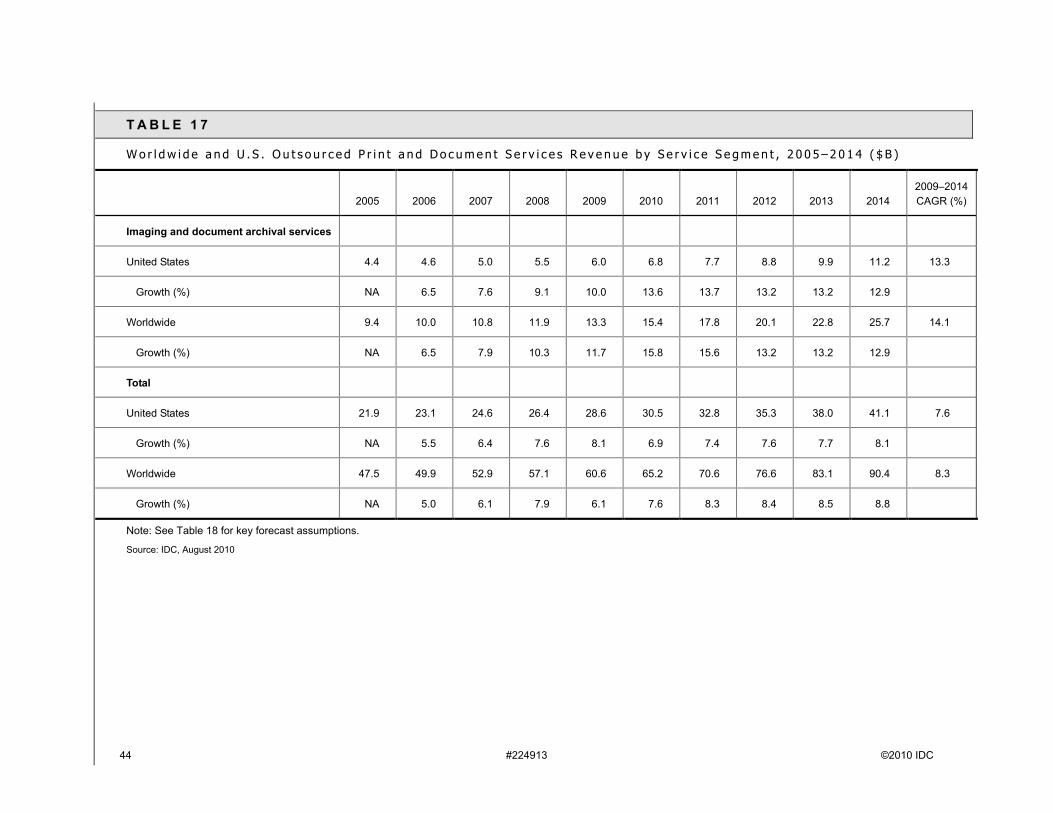
Imaging and document archival services will continue to grow over the next five years, with the U.S. market at 13.3% and the worldwide market at 14.1% These CAGRs represent increases over the prior forecast.
Although the economic conditions over the past year have impacted business process document outsourcing, the market remains a huge opportunity, growing from $23.4 billion to $29.4 billion in the United States and $31.7 billion to $42billion worldwide. These revenue numbers reflect 2009–2014 CAGRs of 4.7% and 5.8%, respectively, for the forecast period. It should be noted that this segment forecast has some overlap with the total print and document services market size and forecast. This is because imaging and document archival services are often embedded in this segment.G
loba
l Hea
dqua
rter
s: 5
Spe
en S
tree
t Fr
amin
gham
, MA
017
01 U
SA
P.5
08.8
72.8
200
F.
508.
935.
4015
w
ww
.idc.
com

#224913 ©2010 IDC
T A B L E O F C O N T E N T S
P
In This Study 1
Methodology ............................................................................................................................................. 1Services Segment Definitions................................................................................................................... 1
Situat ion Overview 3
Market Trends by Service Segment.......................................................................................................... 3Overall Market Trends ....................................................................................................................... 5Mailroom Services ............................................................................................................................. 8Print Procurement Services ............................................................................................................... 9Imaging and Document Archival Services ......................................................................................... 9Business Processing Outsourcing Document Services ..................................................................... 10
Vendor Shares and Growth ...................................................................................................................... 11Market Commentary and Vendor Analysis ........................................................................................ 11
Future Out look 16
Key Notes to Understand in the Forecast ................................................................................................. 16Forecast and Assumptions ....................................................................................................................... 16
Print Services (Basic and Managed Print) 2010–2014 Forecast ....................................................... 16In-House Production Print Services 2010–2014 Forecast ................................................................. 35Mailroom Services 2010–2014 Forecast ........................................................................................... 35Print Procurement Services 2010–2014 Forecast ............................................................................. 35Imaging and Document Archival Services 2010–2014 Forecast ....................................................... 35Business Processing Outsourcing Document Services 2010–2014 Forecast ................................... 35Print and Document Services 2010–2014 Forecast by Segment ...................................................... 35Assumptions ...................................................................................................................................... 35
Market Context ......................................................................................................................................... 53
Essential Guidance 60
Learn More 61
Related Research..................................................................................................................................... 61Methodology ............................................................................................................................................. 61
Historical Market Values and Exchange Rates.................................................................................. 61
©2010 IDC #224913
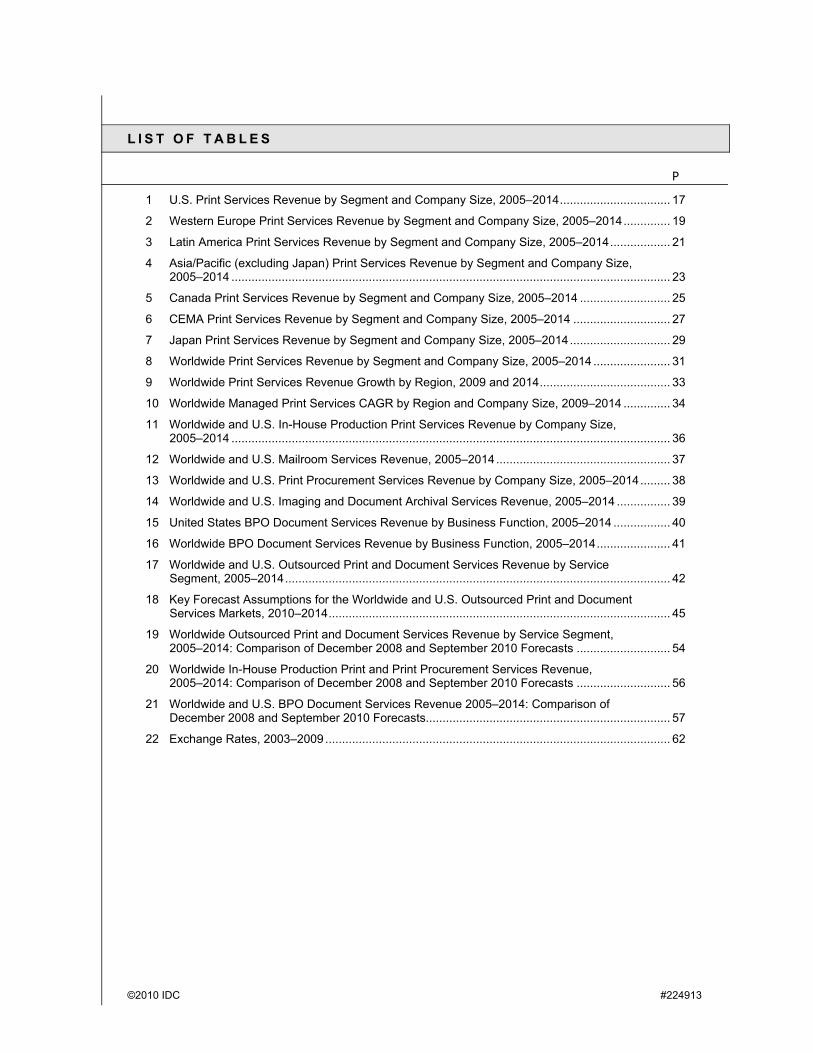
L I S T O F T A B L E S
P
1 U.S. Print Services Revenue by Segment and Company Size, 2005–2014................................. 17
2 Western Europe Print Services Revenue by Segment and Company Size, 2005–2014.............. 19
3 Latin America Print Services Revenue by Segment and Company Size, 2005–2014.................. 21
4 Asia/Pacific (excluding Japan) Print Services Revenue by Segment and Company Size, 2005–2014 ................................................................................................................................... 23
5 Canada Print Services Revenue by Segment and Company Size, 2005–2014 ........................... 25
6 CEMA Print Services Revenue by Segment and Company Size, 2005–2014 ............................. 27
7 Japan Print Services Revenue by Segment and Company Size, 2005–2014.............................. 29
8 Worldwide Print Services Revenue by Segment and Company Size, 2005–2014 ....................... 31
9 Worldwide Print Services Revenue Growth by Region, 2009 and 2014....................................... 33
10 Worldwide Managed Print Services CAGR by Region and Company Size, 2009–2014 .............. 34
11 Worldwide and U.S. In-House Production Print Services Revenue by Company Size, 2005–2014 ................................................................................................................................... 36
12 Worldwide and U.S. Mailroom Services Revenue, 2005–2014.................................................... 37
13 Worldwide and U.S. Print Procurement Services Revenue by Company Size, 2005–2014......... 38
14 Worldwide and U.S. Imaging and Document Archival Services Revenue, 2005–2014 ................ 39
15 United States BPO Document Services Revenue by Business Function, 2005–2014 ................. 40
16 Worldwide BPO Document Services Revenue by Business Function, 2005–2014...................... 41
17 Worldwide and U.S. Outsourced Print and Document Services Revenue by Service Segment, 2005–2014................................................................................................................... 42
18 Key Forecast Assumptions for the Worldwide and U.S. Outsourced Print and Document Services Markets, 2010–2014...................................................................................................... 45
19 Worldwide Outsourced Print and Document Services Revenue by Service Segment, 2005–2014: Comparison of December 2008 and September 2010 Forecasts ............................ 54
20 Worldwide In-House Production Print and Print Procurement Services Revenue, 2005–2014: Comparison of December 2008 and September 2010 Forecasts ............................ 56
21 Worldwide and U.S. BPO Document Services Revenue 2005–2014: Comparison of December 2008 and September 2010 Forecasts......................................................................... 57
22 Exchange Rates, 2003–2009 ....................................................................................................... 62
#224913 ©2010 IDC
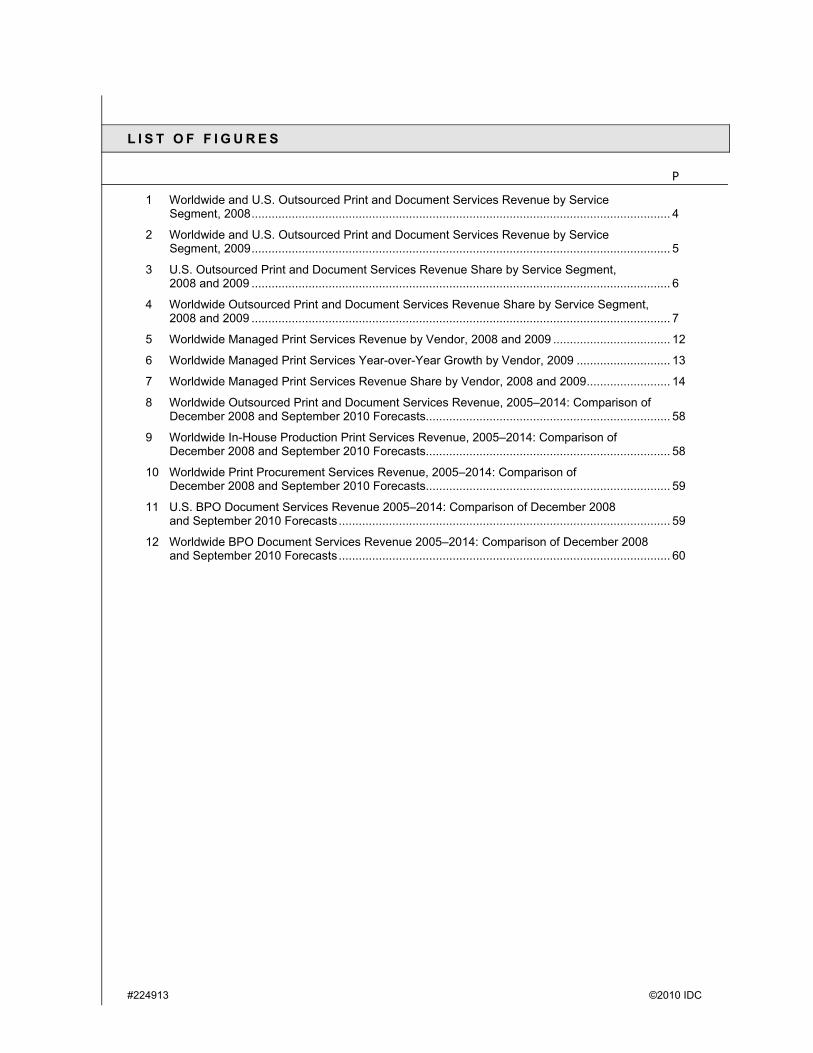
L I S T O F F I G U R E S
P
1 Worldwide and U.S. Outsourced Print and Document Services Revenue by Service Segment, 2008............................................................................................................................. 4
2 Worldwide and U.S. Outsourced Print and Document Services Revenue by Service Segment, 2009............................................................................................................................. 5
3 U.S. Outsourced Print and Document Services Revenue Share by Service Segment, 2008 and 2009 ............................................................................................................................. 6
4 Worldwide Outsourced Print and Document Services Revenue Share by Service Segment, 2008 and 2009 ............................................................................................................................. 7
5 Worldwide Managed Print Services Revenue by Vendor, 2008 and 2009 ................................... 12
6 Worldwide Managed Print Services Year-over-Year Growth by Vendor, 2009 ............................ 13
7 Worldwide Managed Print Services Revenue Share by Vendor, 2008 and 2009......................... 14
8 Worldwide Outsourced Print and Document Services Revenue, 2005–2014: Comparison of December 2008 and September 2010 Forecasts......................................................................... 58
9 Worldwide In-House Production Print Services Revenue, 2005–2014: Comparison of December 2008 and September 2010 Forecasts......................................................................... 58
10 Worldwide Print Procurement Services Revenue, 2005–2014: Comparison of December 2008 and September 2010 Forecasts......................................................................... 59
11 U.S. BPO Document Services Revenue 2005–2014: Comparison of December 2008 and September 2010 Forecasts................................................................................................... 59
12 Worldwide BPO Document Services Revenue 2005–2014: Comparison of December 2008 and September 2010 Forecasts................................................................................................... 60
©2010 IDC #224913 1
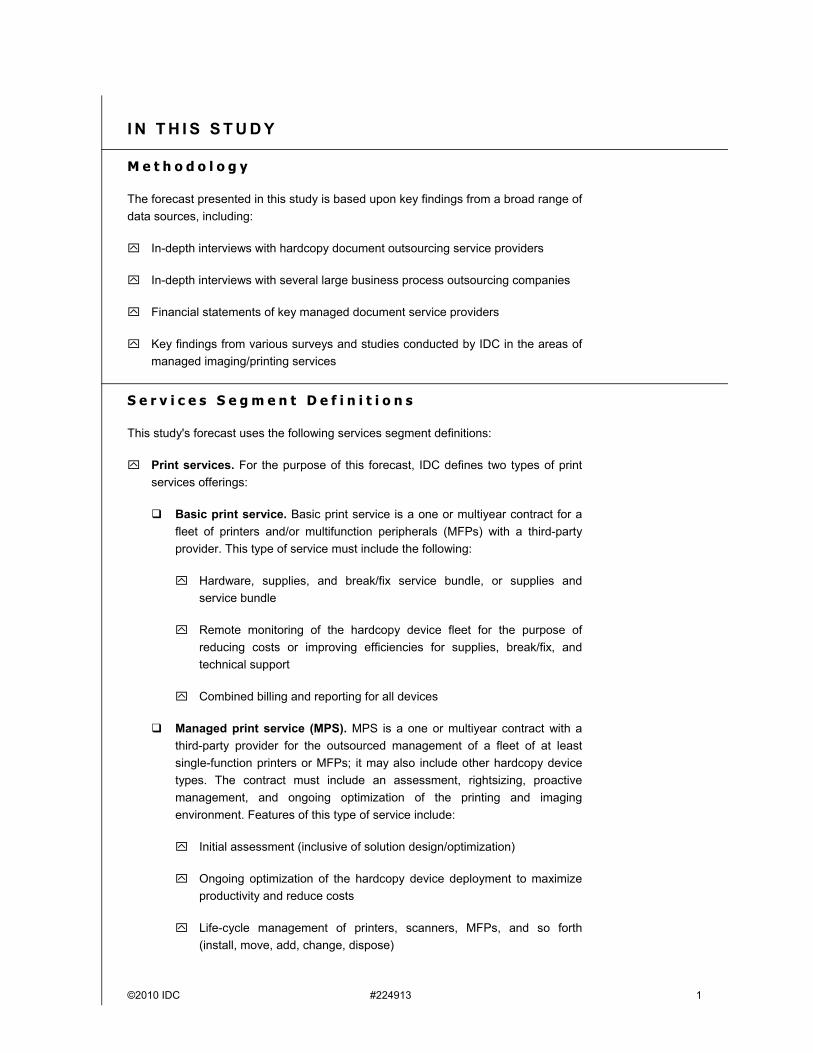
I N T H I S S T U D Y
M e t h o d o l o g y
The forecast presented in this study is based upon key findings from a broad range of data sources, including:
In-depth interviews with hardcopy document outsourcing service providers
In-depth interviews with several large business process outsourcing companies
Financial statements of key managed document service providers
Key findings from various surveys and studies conducted by IDC in the areas of managed imaging/printing services
S e r v i c e s S e g m e n t D e f i n i t i o n s
This study's forecast uses the following services segment definitions:
Print services. For the purpose of this forecast, IDC defines two types of print services offerings:
Basic print service. Basic print service is a one or multiyear contract for a fleet of printers and/or multifunction peripherals (MFPs) with a third-party provider. This type of service must include the following:
Hardware, supplies, and break/fix service bundle, or supplies and service bundle
Remote monitoring of the hardcopy device fleet for the purpose of reducing costs or improving efficiencies for supplies, break/fix, and technical support
Combined billing and reporting for all devices
Managed print service (MPS). MPS is a one or multiyear contract with a third-party provider for the outsourced management of a fleet of at least single-function printers or MFPs; it may also include other hardcopy device types. The contract must include an assessment, rightsizing, proactive management, and ongoing optimization of the printing and imaging environment. Features of this type of service include:
Initial assessment (inclusive of solution design/optimization)
Ongoing optimization of the hardcopy device deployment to maximize productivity and reduce costs
Life-cycle management of printers, scanners, MFPs, and so forth (install, move, add, change, dispose)
2 #224913 ©2010 IDC
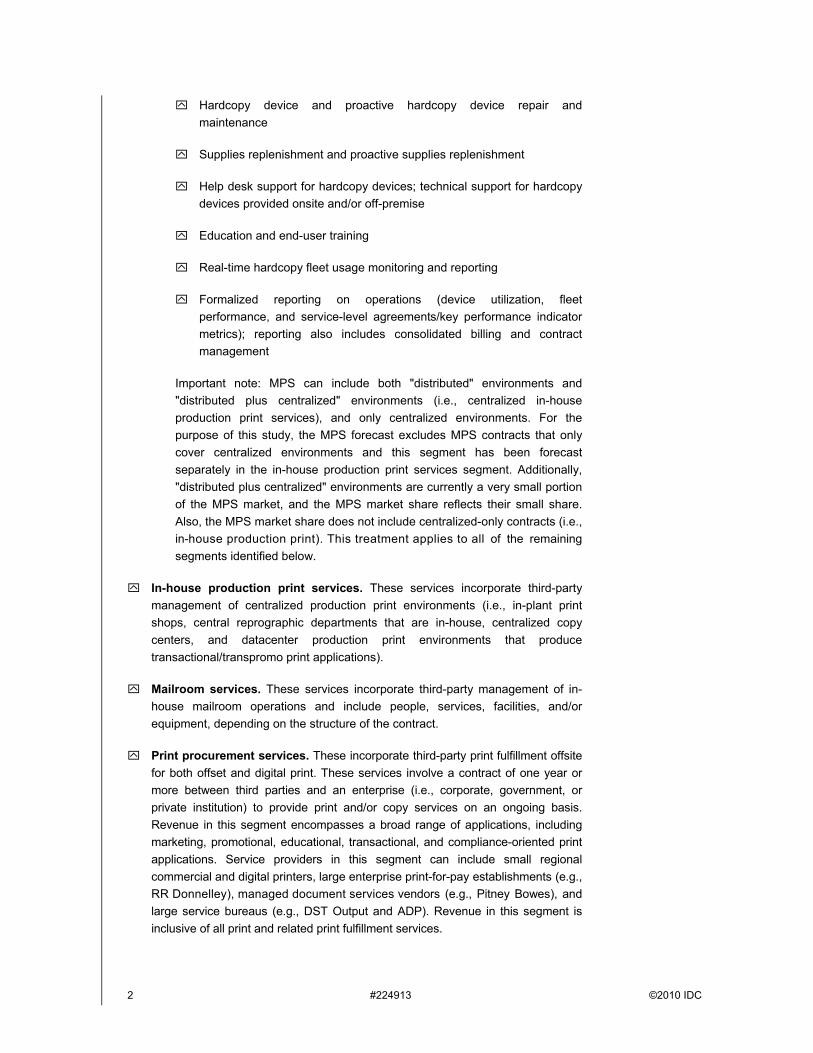
Hardcopy device and proactive hardcopy device repair and maintenance
Supplies replenishment and proactive supplies replenishment
Help desk support for hardcopy devices; technical support for hardcopy devices provided onsite and/or off-premise
Education and end-user training
Real-time hardcopy fleet usage monitoring and reporting
Formalized reporting on operations (device utilization, fleet performance, and service-level agreements/key performance indicatormetrics); reporting also includes consolidated billing and contract management
Important note: MPS can include both "distributed" environments and "distributed plus centralized" environments (i.e., centralized in-house production print services), and only centralized environments. For the purpose of this study, the MPS forecast excludes MPS contracts that only cover centralized environments and this segment has been forecast separately in the in-house production print services segment. Additionally, "distributed plus centralized" environments are currently a very small portion of the MPS market, and the MPS market share reflects their small share. Also, the MPS market share does not include centralized-only contracts (i.e., in-house production print). This treatment applies to all of the remaining segments identified below.
In-house production print services. These services incorporate third-party management of centralized production print environments (i.e., in-plant print shops, central reprographic departments that are in-house, centralized copy centers, and datacenter production print environments that produce transactional/transpromo print applications).
Mailroom services. These services incorporate third-party management of in-house mailroom operations and include people, services, facilities, and/or equipment, depending on the structure of the contract.
Print procurement services. These incorporate third-party print fulfillment offsite for both offset and digital print. These services involve a contract of one year or more between third parties and an enterprise (i.e., corporate, government, or private institution) to provide print and/or copy services on an ongoing basis. Revenue in this segment encompasses a broad range of applications, including marketing, promotional, educational, transactional, and compliance-oriented print applications. Service providers in this segment can include small regional commercial and digital printers, large enterprise print-for-pay establishments (e.g., RR Donnelley), managed document services vendors (e.g., Pitney Bowes), and large service bureaus (e.g., DST Output and ADP). Revenue in this segment is inclusive of all print and related print fulfillment services.
©2010 IDC #224913 3
Note: Print procurement services may also entail consulting services designed to optimize print fulfillment that enables aggregation of print spend, centralization of print procurement processes, and utilization of the spot market (i.e., capitalizing on lower pricing driven by print providers that have idle presses and digital printers) for print purchasing. Depending on the nature of the contract, these services may also encompass consulting that is designed to optimize print-related communications to drive faster customer/recipient response times and/or to reduce operational costs (e.g., demands on call centers) via more effective customer communications.
Imaging and document archival services. These incorporate outsourced services for capturing and storing documents. These services can be deployed either onsite or offsite and are unique in that they are provided to enterprises that continue to manage their own document processes (accounts payable, invoicing, etc.) yet have determined that an outsourcing contract to handle the physical capture and storage of information best meets their needs.
Business process outsourcing (BPO) document services. This segment refers to the specific input, management, and output of documents associated with business process outsourcing contracts. This segment reflects a subset of fully outsourced business functions to companies such as IBM, HP, and Accenture. Because there is overlap with several of the other services segments,the forecast associated with this service is shown separately rather than included in the overall print and document services forecast.
Note: Throughout this study, we refer to several company size segments. The following definitions apply to the various company segments:
Medium-sized companies are defined as having 100–499 employees at all locations in a country.
Large companies are defined as having 500–999 employees at all locations in a country.
Very large companies are defined as having 1,000+ employees at all locations in a country.
S I T U A T I O N O V E R V I E W
M a r k e t T r e n d s b y S e r v i c e S e g m e n t
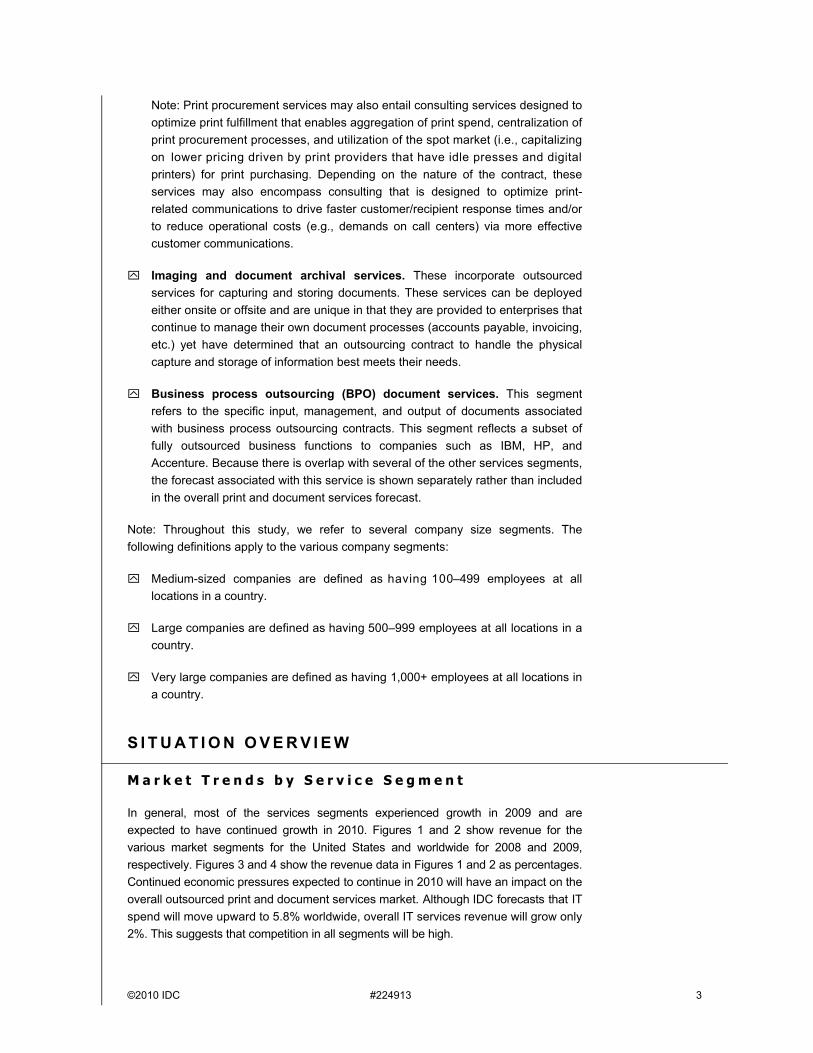
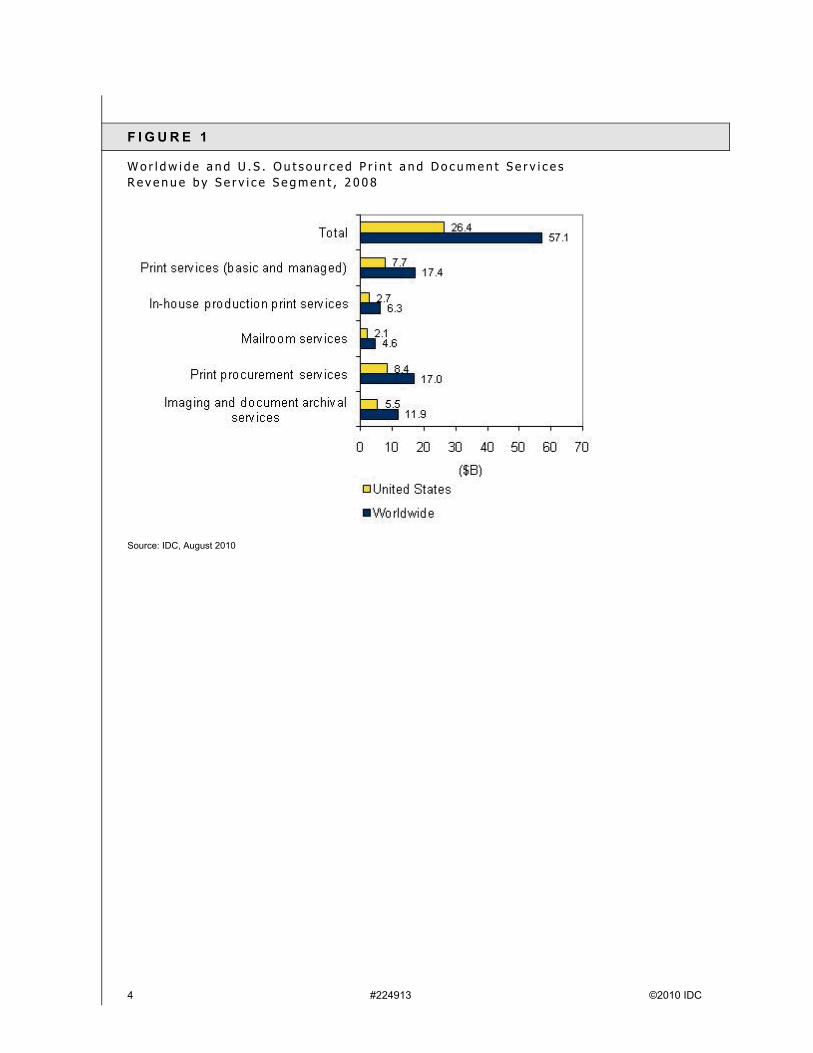
In general, most of the services segments experienced growth in 2009 and are expected to have continued growth in 2010. Figures 1 and 2 show revenue for thevarious market segments for the United States and worldwide for 2008 and 2009,respectively. Figures 3 and 4 show the revenue data in Figures 1 and 2 as percentages. Continued economic pressures expected to continue in 2010 will have an impact on the overall outsourced print and document services market. Although IDC forecasts that IT spend will move upward to 5.8% worldwide, overall IT services revenue will grow only 2%. This suggests that competition in all segments will be high.
4 #224913 ©2010 IDC
F I G U R E 1
W o r l d w i d e a n d U . S . O u t s o u r c e d P r i n t a n d D o c u m e n t S e r v i c e s R e v e n u e b y S e r v i c e S e g m e n t , 2 0 0 8
Source: IDC, August 2010
©2010 IDC #224913 5
F I G U R E 2
W o r l d w i d e a n d U . S . O u t s o u r c e d P r i n t a n d D o c u m e n t S e r v i c e s R e v e n u e b y S e r v i c e S e g m e n t , 2 0 0 9
Source: IDC, August 2010
Overall Market Trends
Excluding business process outsourcing document services, print services — basicand managed print combined — continue to dominate the U.S. and worldwide services markets in size and growth. Revenue from print services (basic and MPS) grew from $7.7 billion in 2008 to $8.9 billion in the United States in 2009, representing a YoY growth of 15.2%, up slightly from 2008 growth of 14.4%. Worldwide revenue growth for print services grew from $17.4 billion to $18.5 billion, representing a YoY growth of 6.4%. This was down from 2008, which had YoY growth of 14.1%. IDC attributes the U.S. growth to increased competition by multiple vendors in both basic and MPS print services. On a worldwide basis, their initiatives were less successful due to both the economic climate and the restructuring of existing programs or new launches of programs by vendors.
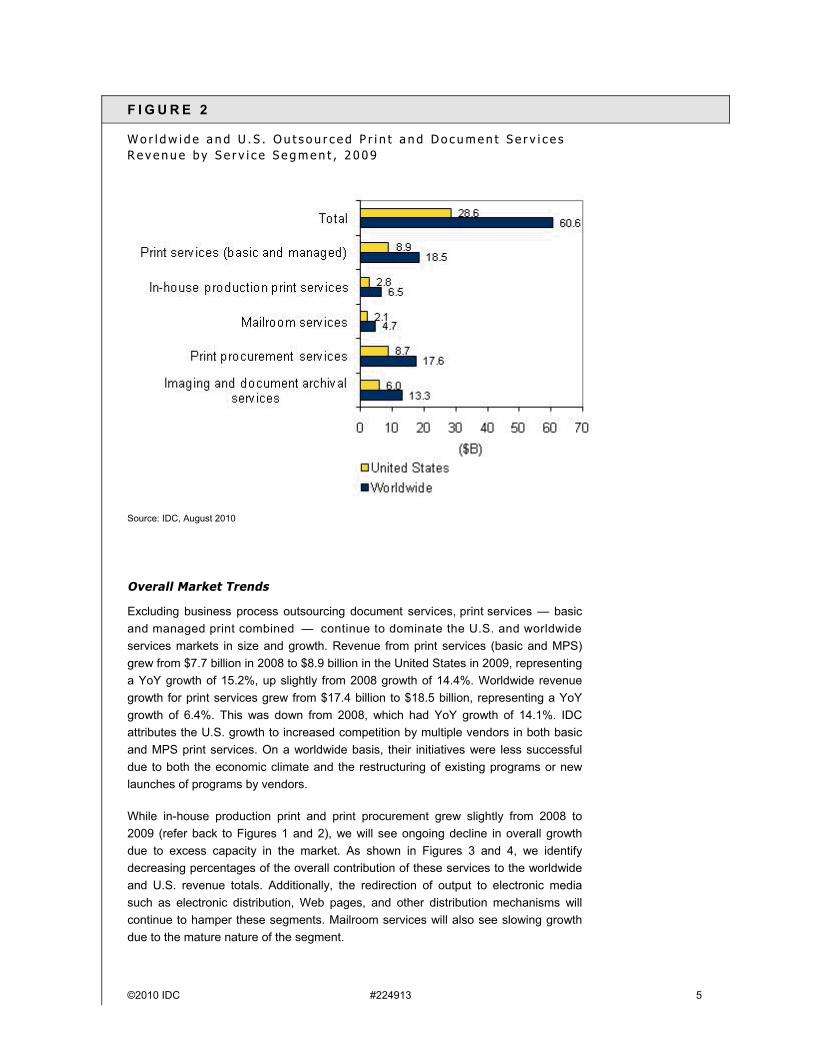
While in-house production print and print procurement grew slightly from 2008 to 2009 (refer back to Figures 1 and 2), we will see ongoing decline in overall growth due to excess capacity in the market. As shown in Figures 3 and 4, we identify decreasing percentages of the overall contribution of these services to the worldwide and U.S. revenue totals. Additionally, the redirection of output to electronic media such as electronic distribution, Web pages, and other distribution mechanisms willcontinue to hamper these segments. Mailroom services will also see slowing growth due to the mature nature of the segment.

6 #224913 ©2010 IDC
One bright spot in overall trends is the imaging and document archival services segment. Overall growth from 2008 through 2009 was 10% and 11.7%, respectively,for the United States and worldwide.
F I G U R E 3
U . S . O u t s o u r c e d P r i n t a n d D o c u m e n t S e r v i c e s R e v e n u e S h a r e b y S e r v i c e S e g m e n t , 2 0 0 8 a n d 2 0 0 9
Source: IDC, August 2010
©2010 IDC #224913 7
F I G U R E 4
W o r l d w i d e O u t s o u r c e d P r i n t a n d D o c u m e n t S e r v i c e s R e v e n u e S h a r e b y S e r v i c e S e g m e n t , 2 0 0 8 a n d 2 0 0 9
Source: IDC, August 2010
Pr int Serv ices
IDC believes that print services, both basic and managed, will be the growth engine for hardcopy vendors for several reasons. These include:
Consideration rates by companies to adopt basic and managed print services arerelatively low. IDC research shows that penetration rates worldwide are averaging about 25%, ranging from a low of 16% for midsize companies (100–499 employees) to penetration rates of 28% for both large companies (500–999
8 #224913 ©2010 IDC
employees) and very large companies (1,000+ employees). While IDC research finds that companies not having outsourcing contracts contend that they have in-house systems or have never considered outsourcing, we believe that even these organizations will continue to be aggressively targeted by vendors.
Improvements in device manageability of both printers and MFP devices enable outsourcing providers to support heterogeneous output infrastructures.
Although the five-year projected growth for managed print services will continue in very large companies — in the United States at 4.4% and worldwide at 6.3%— the greater opportunity for growth will be in medium-sized and large companies. Medium-sized companies' five-year projected growth is 23.3% in the United States and 23% worldwide. Large companies' projected growth is expected to be 14.6% in the United States and 14% worldwide. These double-digit growth rates will be driven by vendors increasing their investments in their indirect channels and creating programs that have the benefits of MPS while being "consumable" by medium-sized to large enterprises.
In-House Product ion Pr int Serv ices
The in-house production print component of this overall segment has seen a steady decline in growth both in the United States and worldwide beginning in 2007 and continuing through the length of this forecast period.
Key factors contributing to this decline include:
A reduction of investment or complete elimination of in-plant, CRD, and other in-house printing operations caused by the ongoing cost of these operations and shrinking usage
A continued shift to distributed print to both workgroup and departmental devices that have been optimized during the MPS process
Increased capacity in the commercial printing market, which will continue to drive more jobs offsite and have customer firms seeking to leverage external print and distribution vendors
Slow growth, which is also attributed to the ongoing shift from offset to digital, and the increasing adoption rate of external print providers to leverage more and more digital devices having an impact on internal digital device investments
Mailroom Services
Mailroom services represent a mature segment of the overall document outsourcing market. Facilities management of generic "white" mail services have been a corporate fixture in both the U.S. and European markets for years. This is in contrast to emerging specialized mailroom services that are associated with transaction processing. An example of a specialized mailroom service would be a processing center where customer bills and payments are sent to be indexed, imaged, and processed by an accounts receivable system.
There are a number of trends that are constraining growth in this market, including:

©2010 IDC #224913 9
The increased utilization of alternative communications tools including electronic mail, personalized Web pages, blogs, and wikis continues to impact and erode the utilization of physical mail as a preferred method of communication.
"Opting out" legislation enables both companies and individuals to control what type of physical unsolicited mail they wish to receive.
Increasing adoption of online banking and bill payments is having a negative impact on specialized mailroom services that target transactional documents.IDC believes that this is primarily a generational trend being leveraged primarily by people under the age of 50; however, the increased ease of online processing and secure transactional systems will continue to affect transactional mail services.
Nonetheless, there is a trend by suppliers to help extend their mailroom offerings. Mailroom and transactional processing suppliers are initiating improved communications mechanisms to help individuals and corporations communicate with others. Providing expertise in personalized communications as well as optimization of traditional mailroom operations can help entities improve the effectiveness of their communication programs as well as reduce overall costs.
Print Procurement Services
Although print procurement services will remain a relatively large market, it will experience a continued decline in overall growth. Factors influencing this include the following:
The overall market continues to have excess capacity, making it extremely competitive, and this is compounded by eroding margins.
The fragmented nature of the print market will force print providers to seek out preferred contracts with enterprises at lower prices. These contracts will also need to include additional services to help manage costs and leverage digital technologies.
With excess capacity comes the opportunity to differentiate. Print procurement services need to comprehend which vertical markets present the most opportunity and to customize their capacity to meet unique vertical requirements and reduce overall costs.
Imaging and Document Archival Services
This market segment continues to see both growth and transformation as corporations, driven by the need to reduce transactional processing costs and also to adhere to regulatory document retention schedules, adopt these services.
IDC believes that several factors will provide this segment with continued growth. These include:
The scope of document archival services is expanding beyond traditional "transactional" documents and now is helping to address other internal
10 #224913 ©2010 IDC
documents such as email and intellectual property. By leveraging and expanding the "management" capabilities of traditional archival systems, companies are optimizing internal processes and reducing overall retention costs.
The sheer volume of hardcopy documents remains unabated, and even when the hardcopy documents are replaced with electronic formats, the need for indexing and management remain.
Companies are increasingly relying on external organizations to establish auditable processes for handling transactional documents in order to share in the risk and management of regulated processes.
The increasing pace of documents from hardcopy to electronic requires security environments beyond secure hardcopy storage locations. This trend, while complementing the growth of document archival services, will increasingly become more competitive as corporations work to decide which documents, either hardcopy or electronic, should be externally archived versus documents that require internal administration. Imaging and document archival service providers will need to "blur"the physical location of archiving while providing secure access to all documents under their control.
Business Processing Outsourcing Document Services
BPO document services continue to represent a significant opportunity for those hardcopy vendors that are able to forge partnerships with the major BPO outsourcersor have their own BPO services. The key distinction between this service and the imaging and archival service described previously is that these services focus on the document processing associated with the core business function outsourcing service itself (e.g., HR, finance outsourcing). Additionally, BPO can span multiple print and document services covered in this study, including mailroom services, document capture technologies, image recognition and processing, document archival services and, finally, print services. This focus yields a broad set of highly interconnected services that are focused on optimizing a specific business function.
As a result, our forecasts for BPO document services and general imaging anddocument archival services will overlap. The overall business process outsourcingmarket trends from 2008 to 2009 had a negative impact on this market segment both in the United States and worldwide. In the United States from 2008 to 2009, the market declined by 6.2%, with revenue decreasing from $25 billion to $23.4 billion,respectively. Worldwide growth was impacted less but still in a negative way.Worldwide revenue from 2008 to 2009 declined by 4.3%, reflecting a revenue loss from $33.1 billion to $31.7 billion.
The reasons attributed to these outcomes include:
Technology solutions often associated with BPO are not fully addressing the processes involved, and thus sub-optimizing the expected returns from the BPO contract, and oftentimes complex and costly hardcopy and electronic document flow optimization within the BPO contract

©2010 IDC #224913 11
Overall postponement of outsourcing decisions by large companies due to the economic slowdown
A retrenchment to regional BPO outsourcing implementation rather than global implementations due to the lack of provider expertise in addressing domain-specific or geographical insights
IDC expects this market to recover over the period of this forecast, however, at a much slower rate. The forecast CAGR for 2009–2014 is expected to be 4.7% and 5.8%, respectively, for the United States and worldwide.
V e n d o r S h a r e s a n d G r o w t h
Market Commentary and Vendor Analysis
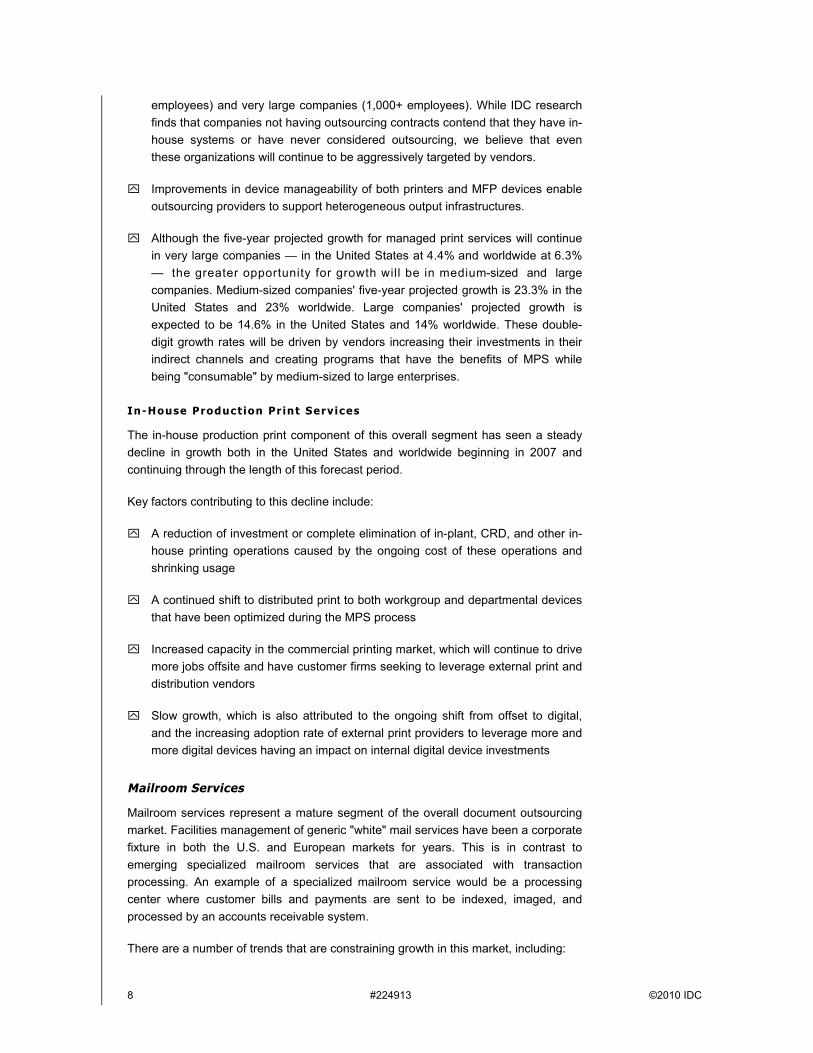
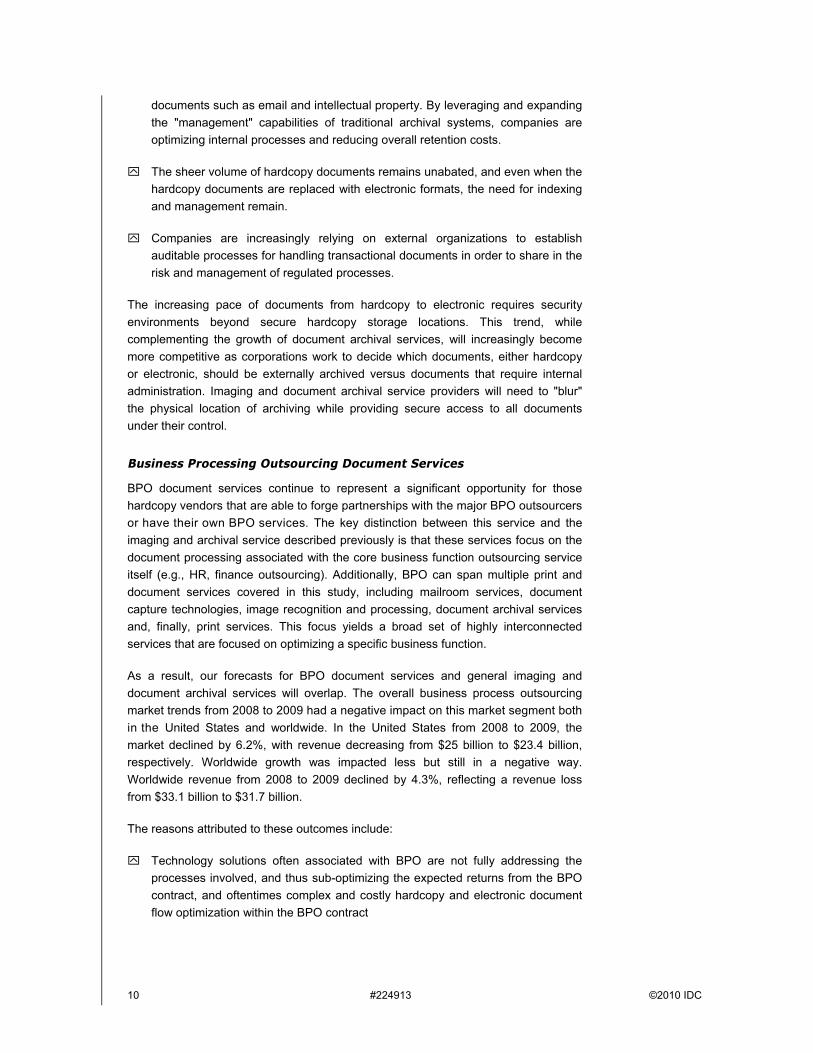
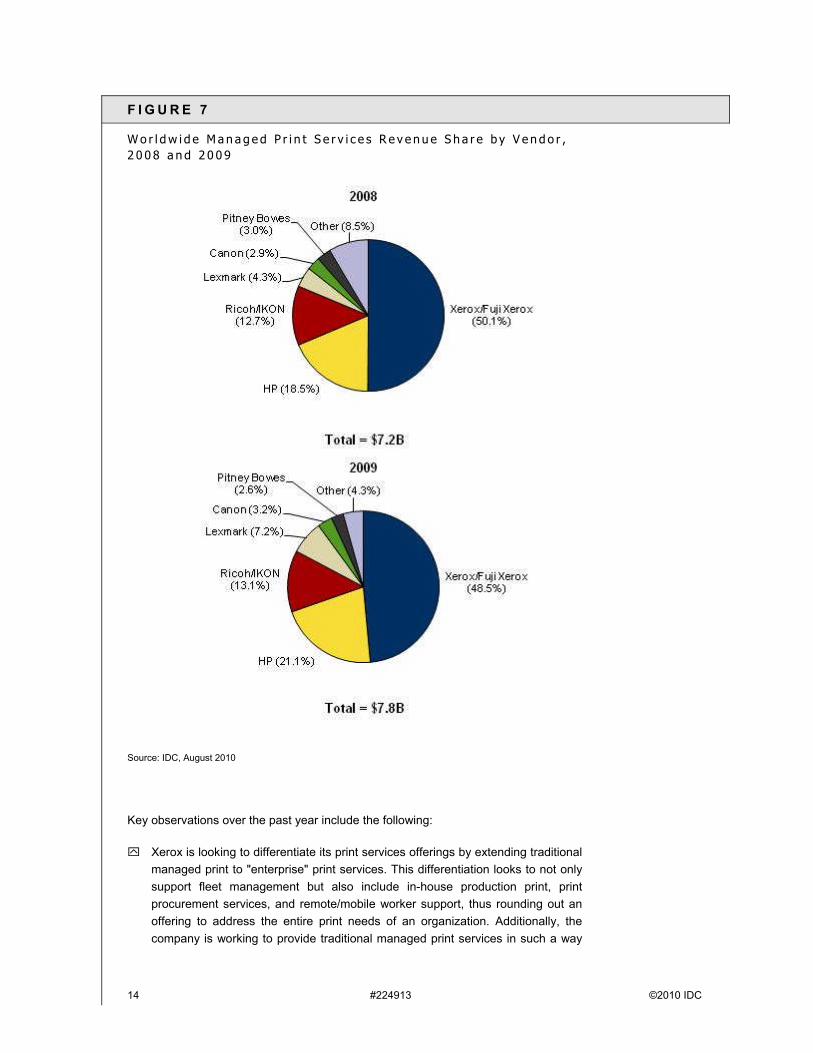
Figure 5 shows the managed print services revenue (excluding basic services) vendor ranking worldwide for both 2008 and 2009, while Figure 6 shows year-over-year growth for each vendor, and Figure 7 shows vendor percent shares. Xerox /Fuji Xerox continues to hold a commanding lead in the managed print services market, followed by HP, Ricoh/IKON, Lexmark, and Canon. Lexmark is a standout with 80% YoY increase in its managed print services revenue followed by HP, Canon, and Ricoh/IKON with YOY growth rates of 23.3%, 19.9%, and 12.0%, respectively. Figure 7 shows worldwide vendor shares for 2008 and 2009. Xerox/Fuji Xerox lost market share but still retains the largest market share at 48.5%. Gainers in market share include HP (21.1%), Ricoh/IKON (13.1%), Lexmark (7.2%), and Canon (3.2%).
The vendor responses to the overall outsourced print and document services marketplace have been both significant and varied. Leaders such as Xerox, HP, Ricoh, and Lexmark have continued to refine their offerings to not only completely address the print services segment but also bolster their offerings in other services segments. Other vendors such as Canon, Toshiba, Konica Minolta, and Kyocera Mita are also aggressively optimizing their portfolios to adjust to market demands.
12 #224913 ©2010 IDC
F I G U R E 5
W o r l d w i d e M a n a g e d P r i n t S e r v i c e s R e v e n u e b y V e n d o r , 2 0 0 8 a n d 2 0 0 9
Source: IDC, August 2010
©2010 IDC #224913 13
F I G U R E 6
W o r l d w i d e M a n a g e d P r i n t S e r v i c e s Y e a r - o v e r - Y e a r G r o w t h b y V e n d o r , 2 0 0 9
Source: IDC, August 2010
14 #224913 ©2010 IDC
F I G U R E 7
W o r l d w i d e M a n a g e d P r i n t S e r v i c e s R e v e n u e S h a r e b y V e n d o r , 2 0 0 8 a n d 2 0 0 9
Source: IDC, August 2010
Key observations over the past year include the following:
Xerox is looking to differentiate its print services offerings by extending traditional managed print to "enterprise" print services. This differentiation looks to not only support fleet management but also include in-house production print, print procurement services, and remote/mobile worker support, thus rounding out an offering to address the entire print needs of an organization. Additionally, the company is working to provide traditional managed print services in such a way

©2010 IDC #224913 15
as to enable channel partners to aggressively meet the needs of large and medium-sized companies. This "channel MPS strategy" looks to bring the entire functionality of MPS for very large enterprises to the channel community by leveraging "cloud" technology to deliver its capabilities. Finally, Xerox is realigning its BPO document outsourcing portfolio to leverage the expertise and delivery capabilities that it obtained in its acquisition of ACS.
HP has developed a two-pronged strategy for MPS, which looks to address the very large enterprise and medium-sized to large companies supported by its channel. Specific programs have been initiated to bolster its channel capabilities while also looking to align its traditional IT outsourcing capabilities through its direct channel to increase services to very large customers. The company has also committed a significant amount of money to enhance its internal services delivery capabilities. The company continues to leverage its EDS acquisition to expand its BPO document outsourcing capabilities. Finally, the company announced a number of extensions to its print and document services portfolio including:
HP MPS Smart Decision Suite, which leverages an SAP framework for integrating various MPS components with its enterprise services infrastructure
ePrint Enterprise mobile printing solution for BlackBerry users who need to print from public locations
Extensions for onsite outsourcing of print/copy and mailroom services plus datacenter print outsourcing services, as well as a virtual print center for off-premise print services
Ricoh, with its acquisition of IKON, is working to expand its services discussion "beyond managed print." The company is working to deliver enhanced document services for imaging and document management. Additionally, the company is effectively leveraging change management expertise to ensure successful deployment of its services to contracted customers.
Lexmark has been aggressively pursuing its managed print services strategy through its direct and indirect channels. Its MPS strategy includes vertical industry focus, strong global execution capabilities, a focus on reducing paper in business processes and, most recently, a well-thought-out acquisition of content management provider Perceptive Software to expand to adjacent services and to leverage its MPS contracts. The company boasts a single and global deliveryinfrastructure for its outsourced managed print services contracts. Additionally, the company's entire fleet of enterprise devices, both MFP and single function printers, are enabled with capabilities to help customers enforce optimized print strategies.

16 #224913 ©2010 IDC
F U T U R E O U T L O O K
K e y N o t e s t o U n d e r s t a n d i n t h e F o r e c a s t
To provide our CIS clients with a more granular view of the worldwide print and outsourced document services market, we have implemented the following changes to the forecast:
For print services, we provide market forecasts for both basic and managed print services (see the Services Segment Definitions section) broken out by company size. We provide these forecasts for each of the major regions.
Both the in-house production print and the print procurement forecasts will be noticeably higher than our previous forecasts since this year we also include medium-sized companies, which were not included in the past.
The imaging and document archival services forecast overlaps with the BPO document outsourced processing services forecast.
We have broken out key functional processes within the business process document outsourced services forecast, which aligns with IDC's BPO services forecast. This information will provide insights into areas of growth and opportunity in the various targeted functional areas.
F o r e c a s t a n d A s s u m p t i o n s
Print Services (Basic and Managed Print) 2010–2014 Forecast
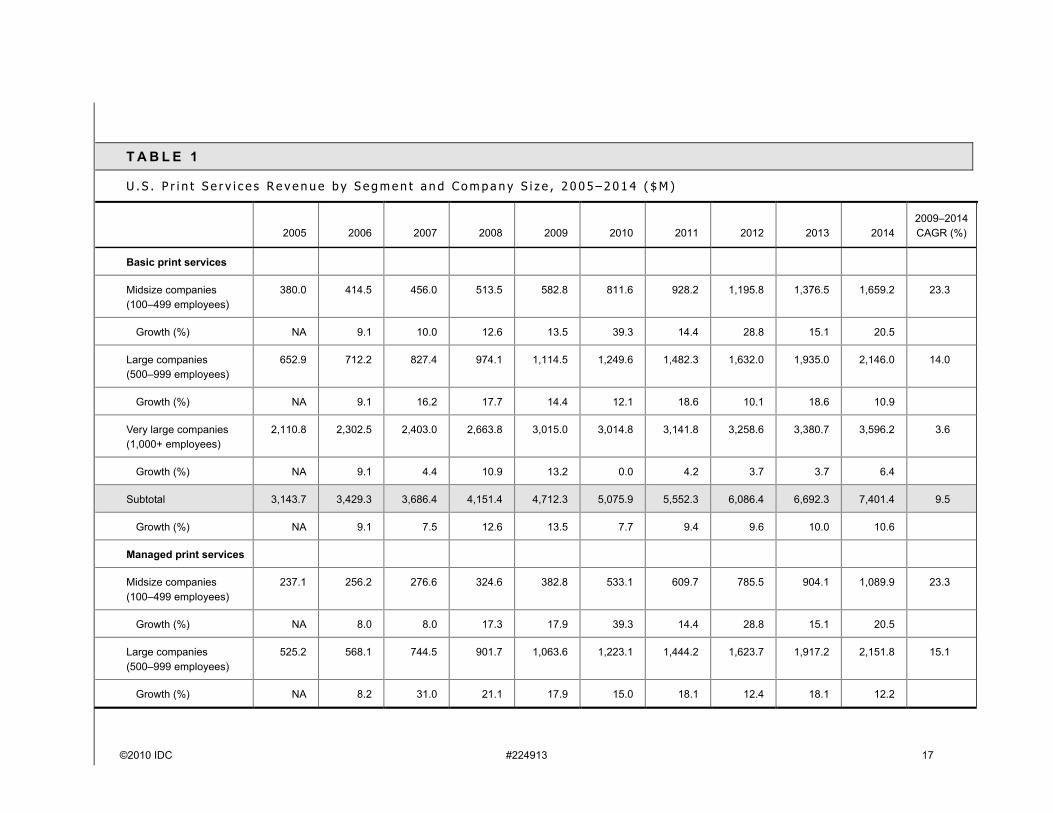
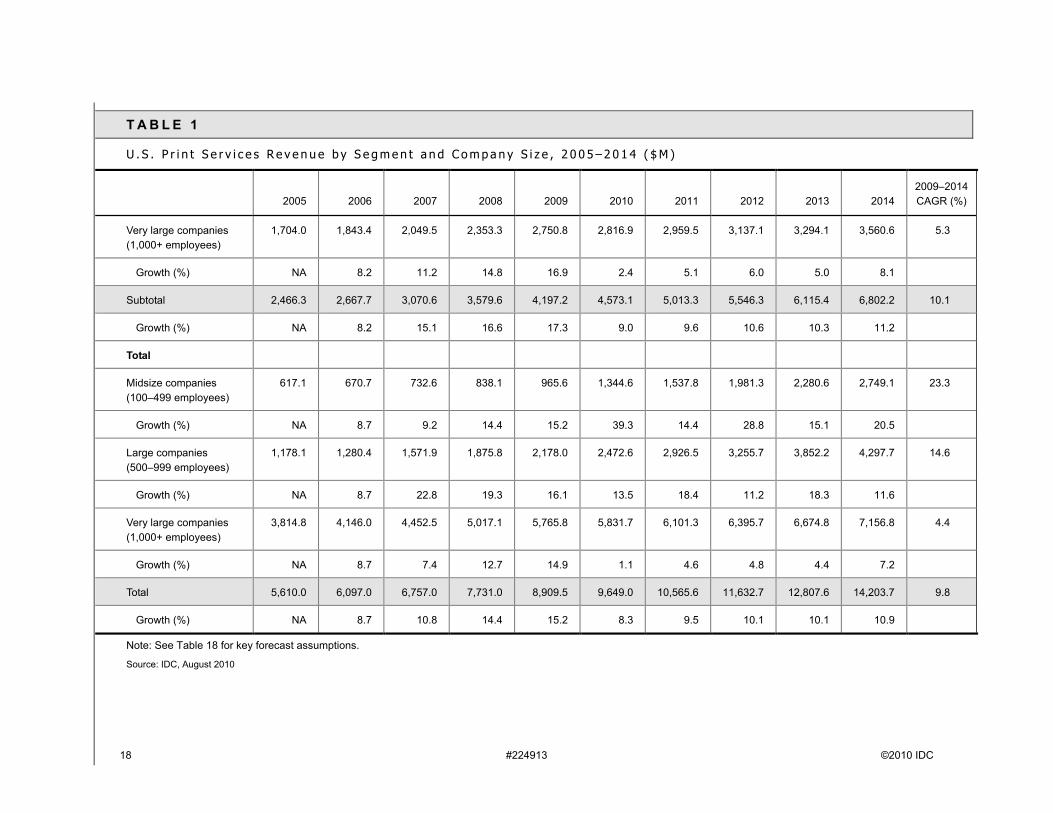
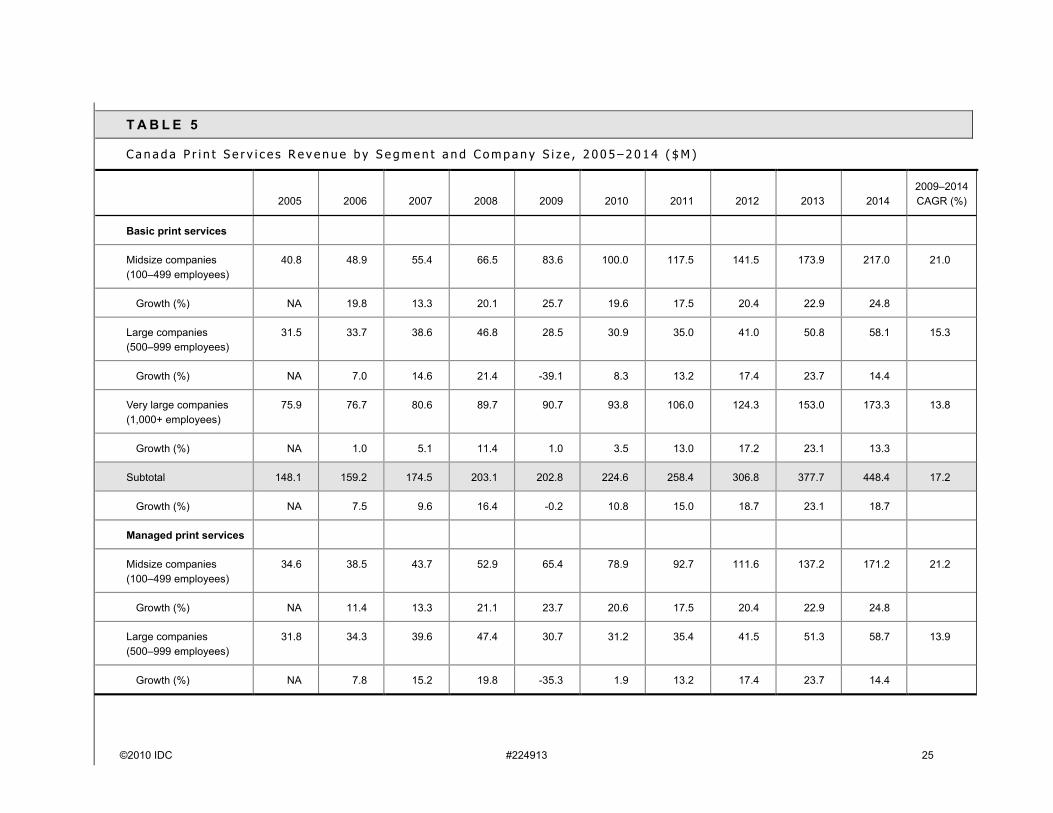
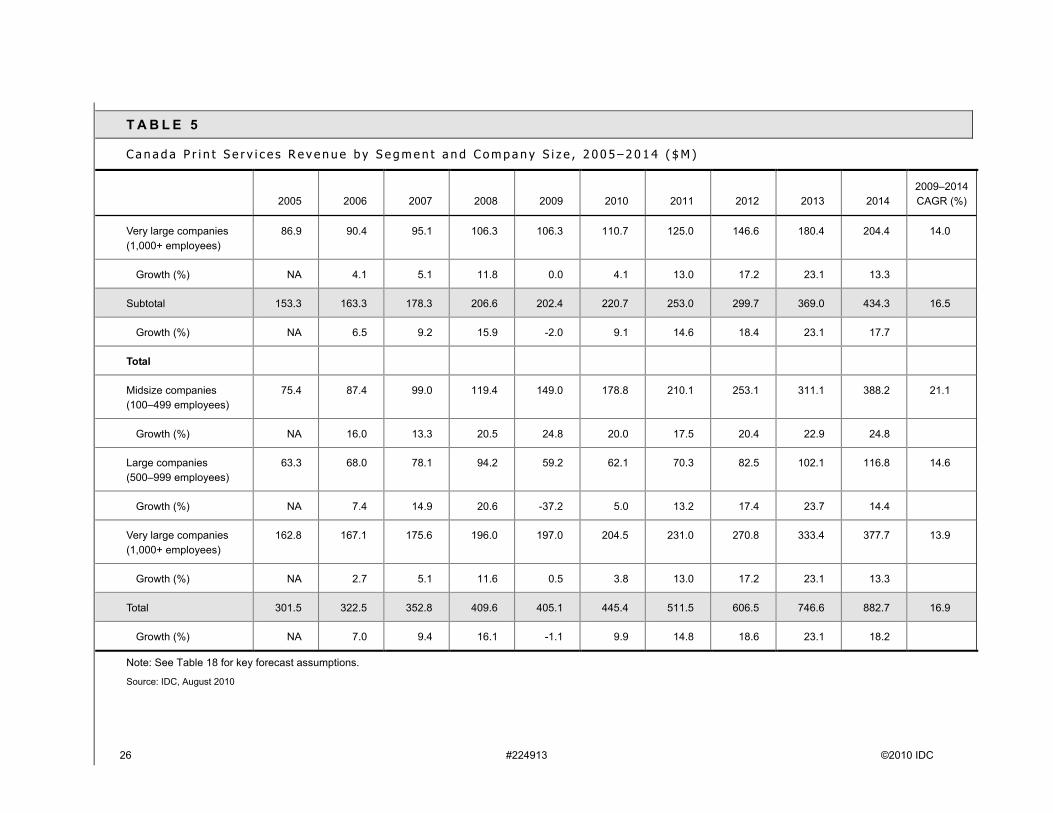
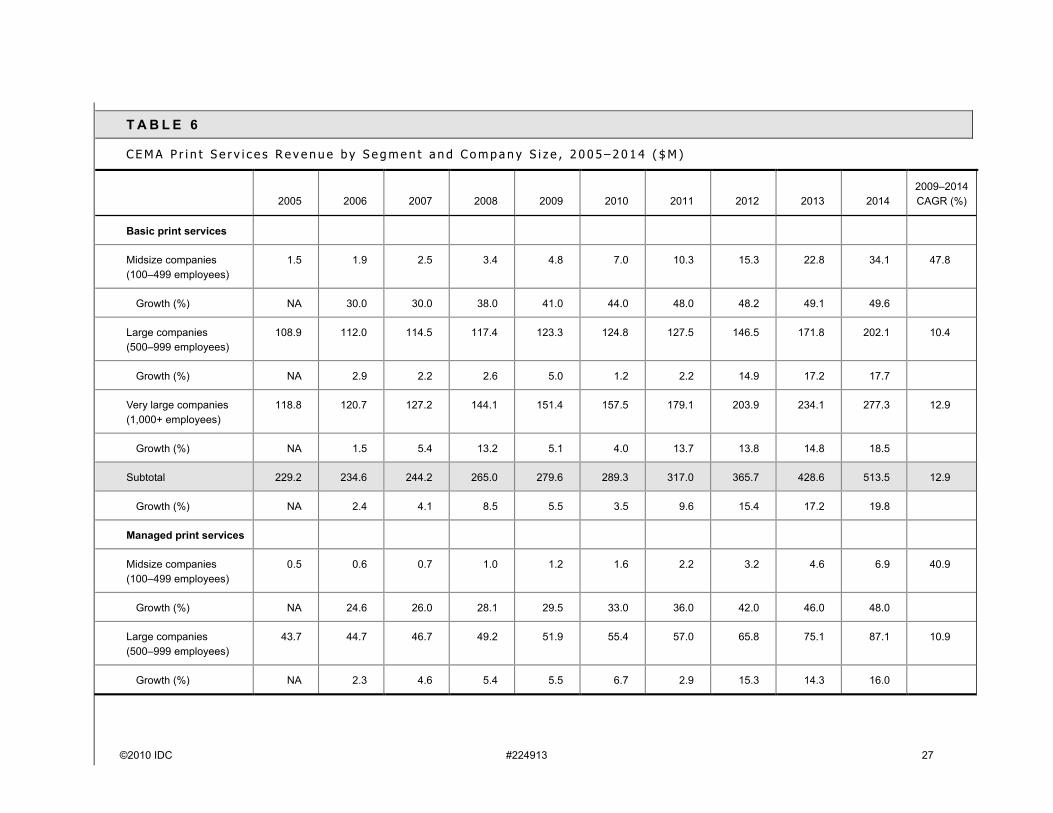
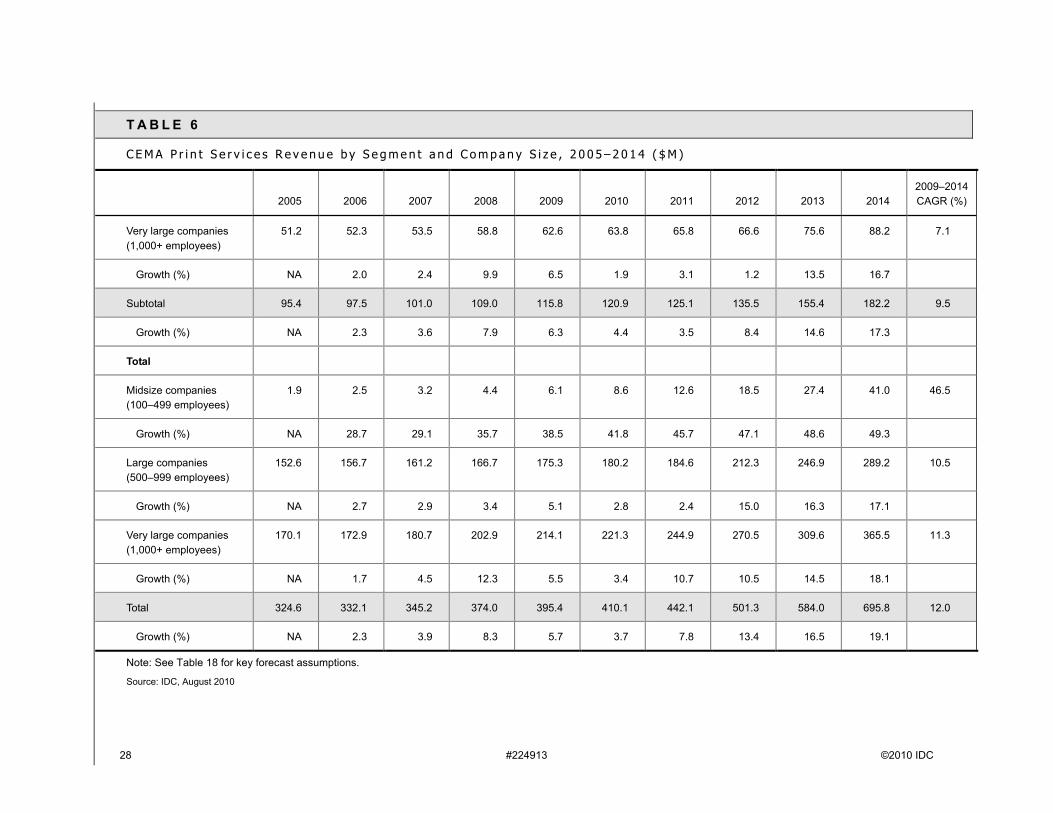
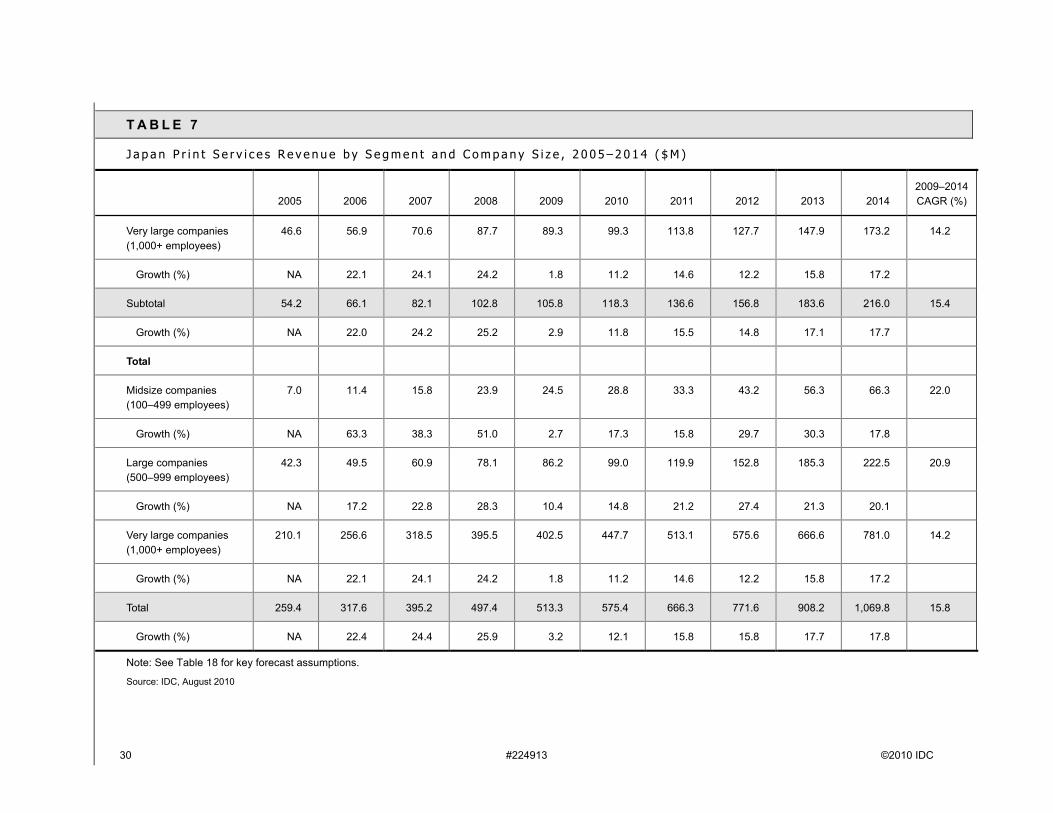
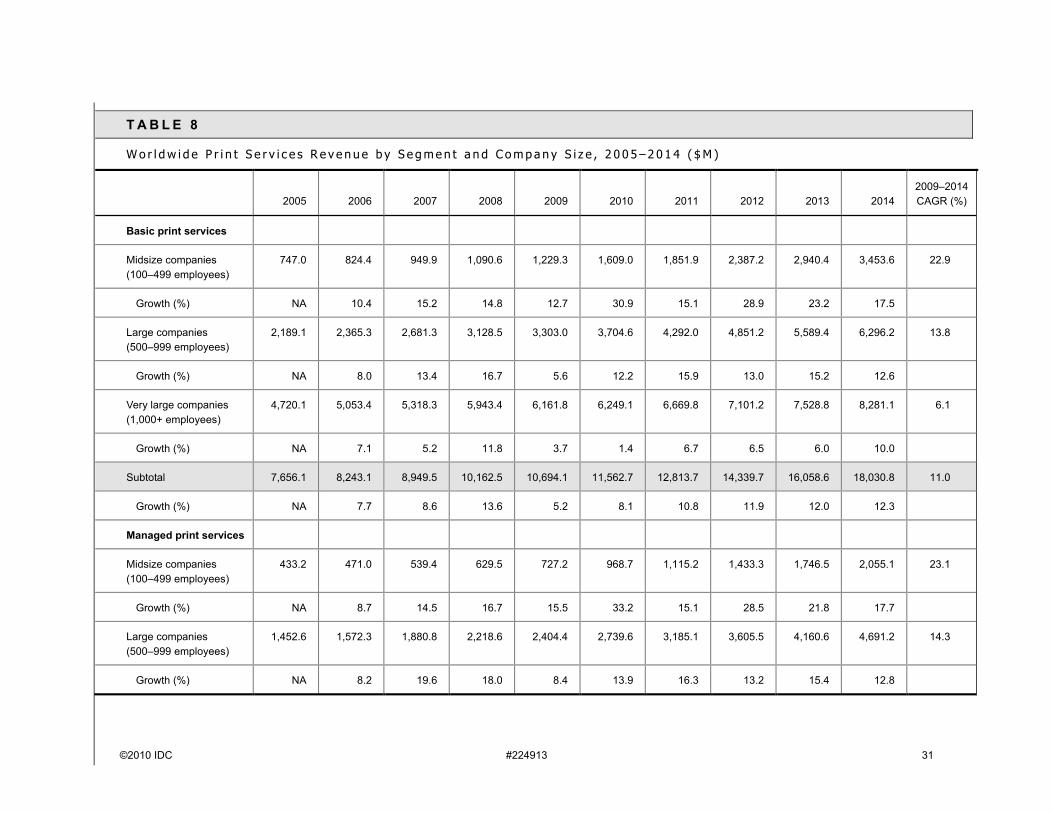
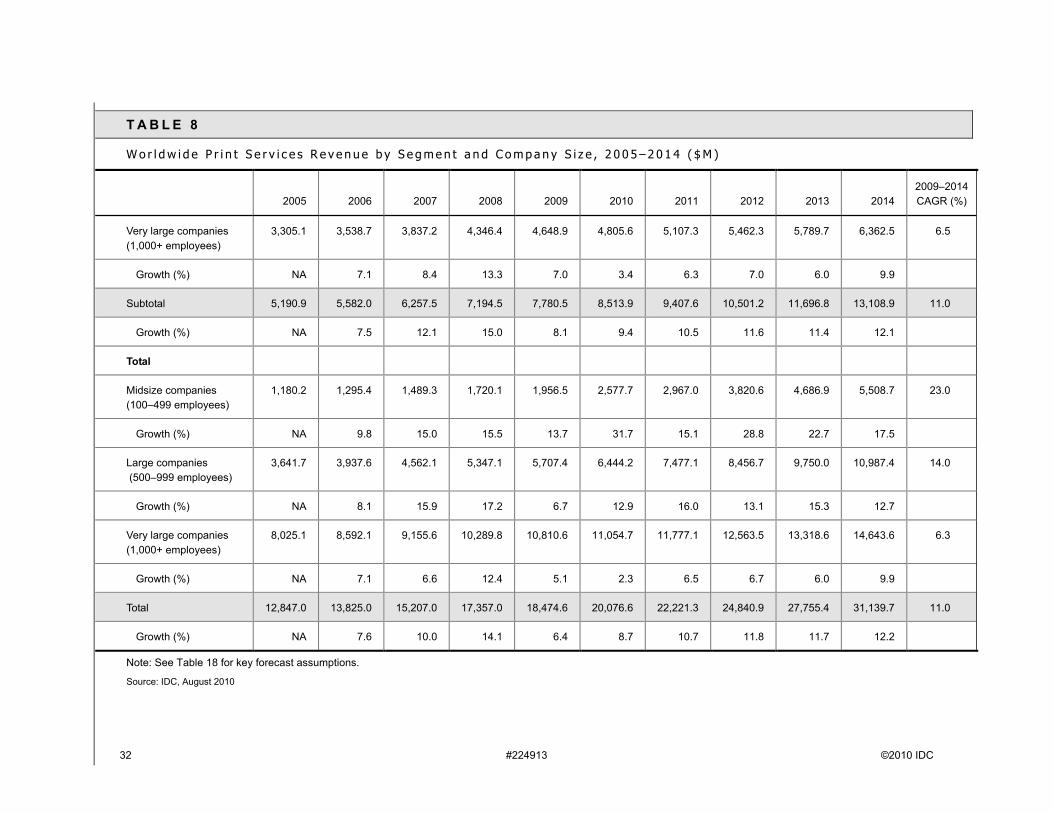
Tables 1–7 reflect IDC's print services forecast for 2010–2014. Table 8 provides the worldwide consolidated forecast for all regions. This year we have separated out basic print services and managed print services (see the Services Segment Definitions section). Additionally, we have segmented each of the service types by company size with insights into where growth is occurring.
©2010 IDC #224913 17
T A B L E 1
U . S . P r i n t S e r v i c e s R e v e n u e b y S e g m e n t a n d C o m p a n y S i z e , 2 0 0 5 – 2 0 1 4 ( $ M )
2005 2006 2007 2008 2009 2010 2011 2012 2013 20142009–2014 CAGR (%)
Basic print services
Midsize companies (100–499 employees)
380.0 414.5 456.0 513.5 582.8 811.6 928.2 1,195.8 1,376.5 1,659.2 23.3
Growth (%) NA 9.1 10.0 12.6 13.5 39.3 14.4 28.8 15.1 20.5
Large companies (500–999 employees)
652.9 712.2 827.4 974.1 1,114.5 1,249.6 1,482.3 1,632.0 1,935.0 2,146.0 14.0
Growth (%) NA 9.1 16.2 17.7 14.4 12.1 18.6 10.1 18.6 10.9
Very large companies (1,000+ employees)
2,110.8 2,302.5 2,403.0 2,663.8 3,015.0 3,014.8 3,141.8 3,258.6 3,380.7 3,596.2 3.6
Growth (%) NA 9.1 4.4 10.9 13.2 0.0 4.2 3.7 3.7 6.4
Subtotal 3,143.7 3,429.3 3,686.4 4,151.4 4,712.3 5,075.9 5,552.3 6,086.4 6,692.3 7,401.4 9.5
Growth (%) NA 9.1 7.5 12.6 13.5 7.7 9.4 9.6 10.0 10.6
Managed print services
Midsize companies (100–499 employees)
237.1 256.2 276.6 324.6 382.8 533.1 609.7 785.5 904.1 1,089.9 23.3
Growth (%) NA 8.0 8.0 17.3 17.9 39.3 14.4 28.8 15.1 20.5
Large companies (500–999 employees)
525.2 568.1 744.5 901.7 1,063.6 1,223.1 1,444.2 1,623.7 1,917.2 2,151.8 15.1
Growth (%) NA 8.2 31.0 21.1 17.9 15.0 18.1 12.4 18.1 12.2
18 #224913 ©2010 IDC
T A B L E 1
U . S . P r i n t S e r v i c e s R e v e n u e b y S e g m e n t a n d C o m p a n y S i z e , 2 0 0 5 – 2 0 1 4 ( $ M )
2005 2006 2007 2008 2009 2010 2011 2012 2013 20142009–2014 CAGR (%)
Very large companies (1,000+ employees)
1,704.0 1,843.4 2,049.5 2,353.3 2,750.8 2,816.9 2,959.5 3,137.1 3,294.1 3,560.6 5.3
Growth (%) NA 8.2 11.2 14.8 16.9 2.4 5.1 6.0 5.0 8.1
Subtotal 2,466.3 2,667.7 3,070.6 3,579.6 4,197.2 4,573.1 5,013.3 5,546.3 6,115.4 6,802.2 10.1
Growth (%) NA 8.2 15.1 16.6 17.3 9.0 9.6 10.6 10.3 11.2
Total
Midsize companies (100–499 employees)
617.1 670.7 732.6 838.1 965.6 1,344.6 1,537.8 1,981.3 2,280.6 2,749.1 23.3
Growth (%) NA 8.7 9.2 14.4 15.2 39.3 14.4 28.8 15.1 20.5
Large companies (500–999 employees)
1,178.1 1,280.4 1,571.9 1,875.8 2,178.0 2,472.6 2,926.5 3,255.7 3,852.2 4,297.7 14.6
Growth (%) NA 8.7 22.8 19.3 16.1 13.5 18.4 11.2 18.3 11.6
Very large companies (1,000+ employees)
3,814.8 4,146.0 4,452.5 5,017.1 5,765.8 5,831.7 6,101.3 6,395.7 6,674.8 7,156.8 4.4
Growth (%) NA 8.7 7.4 12.7 14.9 1.1 4.6 4.8 4.4 7.2
Total 5,610.0 6,097.0 6,757.0 7,731.0 8,909.5 9,649.0 10,565.6 11,632.7 12,807.6 14,203.7 9.8
Growth (%) NA 8.7 10.8 14.4 15.2 8.3 9.5 10.1 10.1 10.9
Note: See Table 18 for key forecast assumptions.
Source: IDC, August 2010
©2010 IDC #224913 19
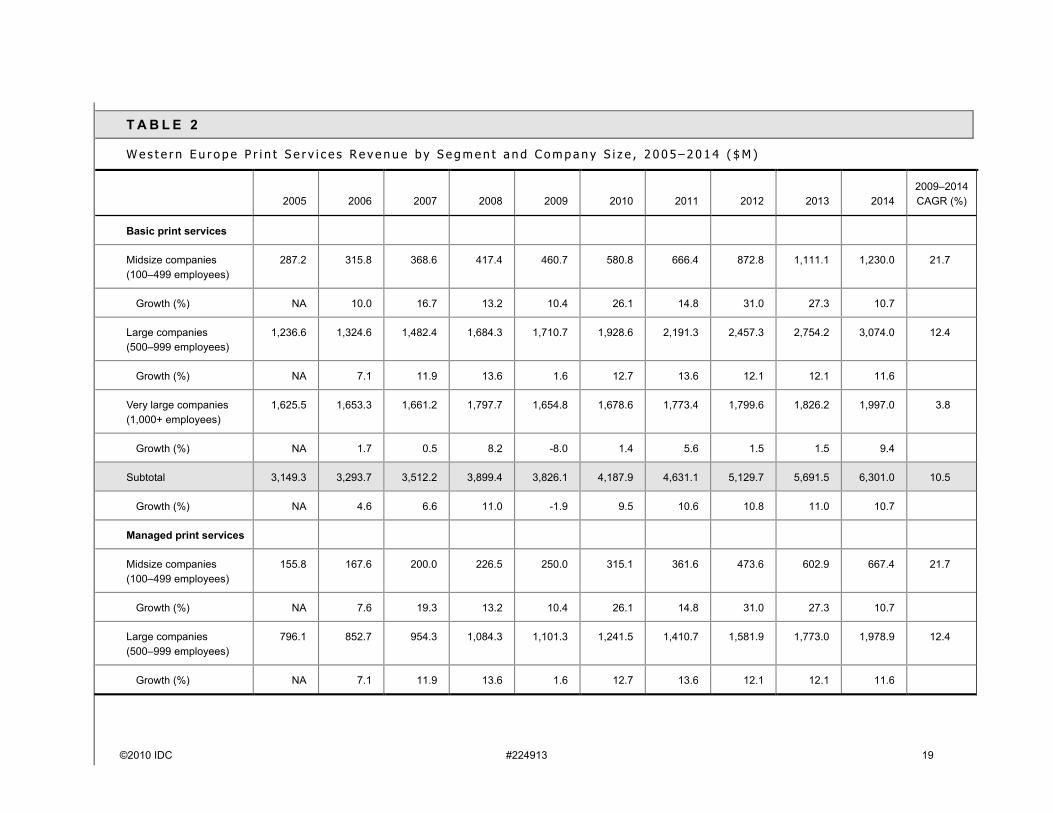
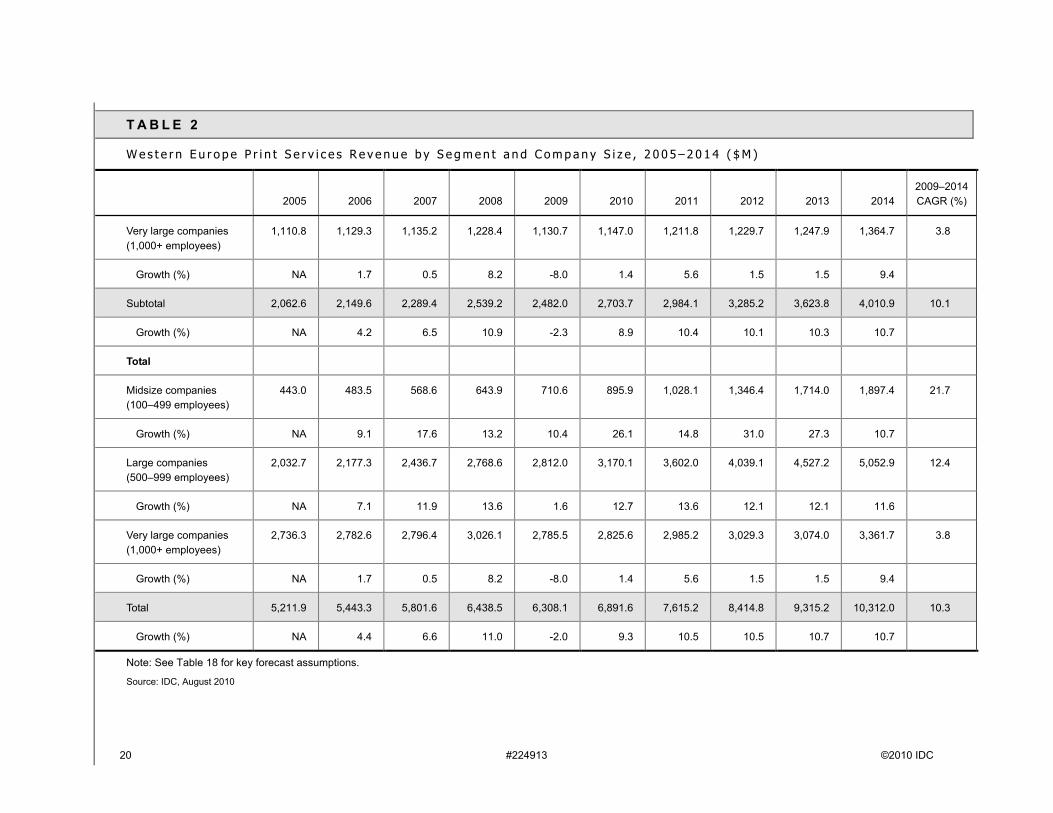
T A B L E 2
W e s t e r n E u r o p e P r i n t S e r v i c e s R e v e n u e b y S e g m e n t a n d C o m p a n y S i z e , 2 0 0 5 – 2 0 1 4 ( $ M )
2005 2006 2007 2008 2009 2010 2011 2012 2013 20142009–2014 CAGR (%)
Basic print services
Midsize companies (100–499 employees)
287.2 315.8 368.6 417.4 460.7 580.8 666.4 872.8 1,111.1 1,230.0 21.7
Growth (%) NA 10.0 16.7 13.2 10.4 26.1 14.8 31.0 27.3 10.7
Large companies (500–999 employees)
1,236.6 1,324.6 1,482.4 1,684.3 1,710.7 1,928.6 2,191.3 2,457.3 2,754.2 3,074.0 12.4
Growth (%) NA 7.1 11.9 13.6 1.6 12.7 13.6 12.1 12.1 11.6
Very large companies (1,000+ employees)
1,625.5 1,653.3 1,661.2 1,797.7 1,654.8 1,678.6 1,773.4 1,799.6 1,826.2 1,997.0 3.8
Growth (%) NA 1.7 0.5 8.2 -8.0 1.4 5.6 1.5 1.5 9.4
Subtotal 3,149.3 3,293.7 3,512.2 3,899.4 3,826.1 4,187.9 4,631.1 5,129.7 5,691.5 6,301.0 10.5
Growth (%) NA 4.6 6.6 11.0 -1.9 9.5 10.6 10.8 11.0 10.7
Managed print services
Midsize companies (100–499 employees)
155.8 167.6 200.0 226.5 250.0 315.1 361.6 473.6 602.9 667.4 21.7
Growth (%) NA 7.6 19.3 13.2 10.4 26.1 14.8 31.0 27.3 10.7
Large companies (500–999 employees)
796.1 852.7 954.3 1,084.3 1,101.3 1,241.5 1,410.7 1,581.9 1,773.0 1,978.9 12.4
Growth (%) NA 7.1 11.9 13.6 1.6 12.7 13.6 12.1 12.1 11.6
20 #224913 ©2010 IDC
T A B L E 2
W e s t e r n E u r o p e P r i n t S e r v i c e s R e v e n u e b y S e g m e n t a n d C o m p a n y S i z e , 2 0 0 5 – 2 0 1 4 ( $ M )
2005 2006 2007 2008 2009 2010 2011 2012 2013 20142009–2014 CAGR (%)
Very large companies (1,000+ employees)
1,110.8 1,129.3 1,135.2 1,228.4 1,130.7 1,147.0 1,211.8 1,229.7 1,247.9 1,364.7 3.8
Growth (%) NA 1.7 0.5 8.2 -8.0 1.4 5.6 1.5 1.5 9.4
Subtotal 2,062.6 2,149.6 2,289.4 2,539.2 2,482.0 2,703.7 2,984.1 3,285.2 3,623.8 4,010.9 10.1
Growth (%) NA 4.2 6.5 10.9 -2.3 8.9 10.4 10.1 10.3 10.7
Total
Midsize companies (100–499 employees)
443.0 483.5 568.6 643.9 710.6 895.9 1,028.1 1,346.4 1,714.0 1,897.4 21.7
Growth (%) NA 9.1 17.6 13.2 10.4 26.1 14.8 31.0 27.3 10.7
Large companies (500–999 employees)
2,032.7 2,177.3 2,436.7 2,768.6 2,812.0 3,170.1 3,602.0 4,039.1 4,527.2 5,052.9 12.4
Growth (%) NA 7.1 11.9 13.6 1.6 12.7 13.6 12.1 12.1 11.6
Very large companies (1,000+ employees)
2,736.3 2,782.6 2,796.4 3,026.1 2,785.5 2,825.6 2,985.2 3,029.3 3,074.0 3,361.7 3.8
Growth (%) NA 1.7 0.5 8.2 -8.0 1.4 5.6 1.5 1.5 9.4
Total 5,211.9 5,443.3 5,801.6 6,438.5 6,308.1 6,891.6 7,615.2 8,414.8 9,315.2 10,312.0 10.3
Growth (%) NA 4.4 6.6 11.0 -2.0 9.3 10.5 10.5 10.7 10.7
Note: See Table 18 for key forecast assumptions.
Source: IDC, August 2010

©2010 IDC #224913 21
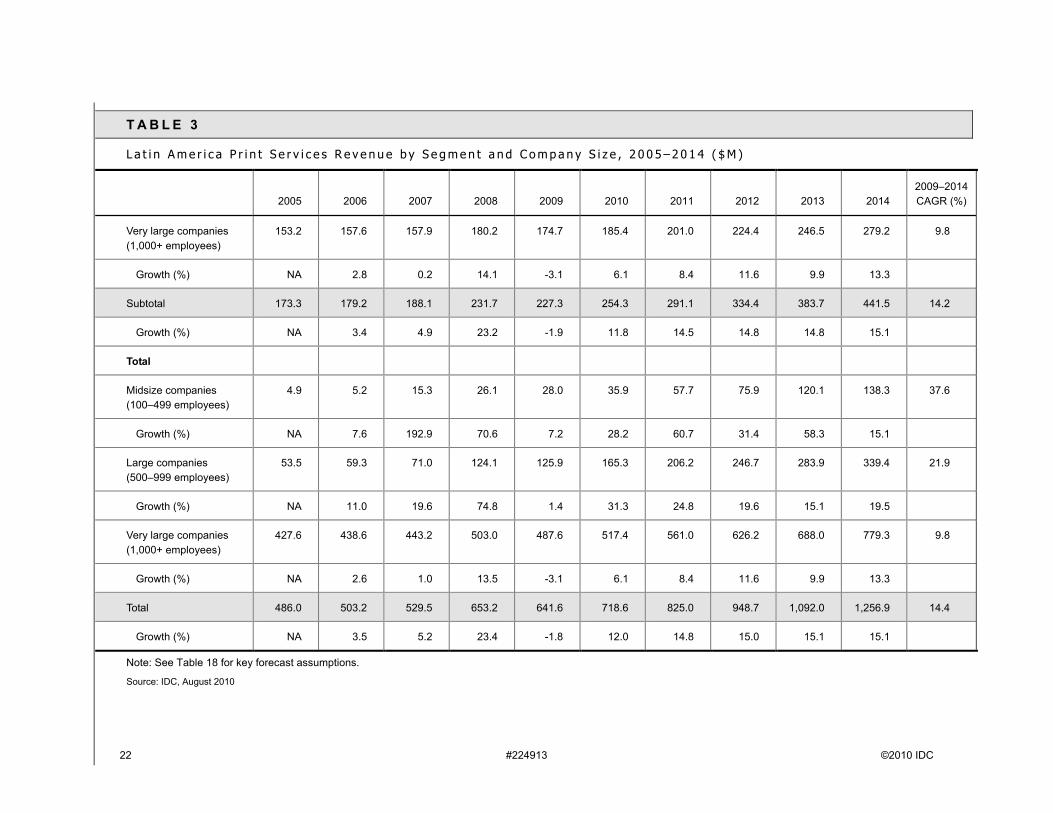
T A B L E 3
L a t i n A m e r i c a P r i n t S e r v i c e s R e v e n u e b y S e g m e n t a n d C o m p a n y S i z e , 2 0 0 5 – 2 0 1 4 ( $ M )
2005 2006 2007 2008 2009 2010 2011 2012 2013 20142009–2014 CAGR (%)
Basic print services
Midsize companies (100–499 employees)
3.3 3.6 10.4 17.7 19.7 24.3 39.1 51.3 81.2 93.5 36.6
Growth (%) NA 9.5 187.8 70.6 11.4 23.4 60.7 31.4 58.3 15.1
Large companies (500–999 employees)
34.9 39.3 45.8 81.1 81.7 108.0 134.8 161.2 185.6 221.8 22.1
Growth (%) NA 12.6 16.4 77.2 0.7 32.3 24.8 19.6 15.1 19.5
Very large companies (1,000+ employees)
274.4 281.0 285.3 322.8 312.9 332.0 360.0 401.8 441.4 500.0 9.8
Growth (%) NA 2.4 1.5 13.1 -3.1 6.1 8.4 11.6 9.9 13.3
Subtotal 312.6 324.0 341.4 421.6 414.3 464.4 533.8 614.4 708.3 815.4 14.5
Growth (%) NA 3.6 5.4 23.5 -1.7 12.1 15.0 15.1 15.3 15.1
Managed print services
Midsize companies (100–499 employees)
1.6 1.6 5.0 8.5 8.3 11.6 18.7 24.6 38.9 44.7 40.0
Growth (%) NA 3.6 204.1 70.6 -1.5 39.6 60.7 31.4 58.3 15.1
Large companies (500–999 employees)
18.5 20.0 25.2 43.0 44.2 57.2 71.4 85.4 98.3 117.5 21.6
Growth (%) NA 8.0 26.1 70.5 2.9 29.5 24.8 19.6 15.1 19.5
22 #224913 ©2010 IDC
T A B L E 3
L a t i n A m e r i c a P r i n t S e r v i c e s R e v e n u e b y S e g m e n t a n d C o m p a n y S i z e , 2 0 0 5 – 2 0 1 4 ( $ M )
2005 2006 2007 2008 2009 2010 2011 2012 2013 20142009–2014 CAGR (%)
Very large companies (1,000+ employees)
153.2 157.6 157.9 180.2 174.7 185.4 201.0 224.4 246.5 279.2 9.8
Growth (%) NA 2.8 0.2 14.1 -3.1 6.1 8.4 11.6 9.9 13.3
Subtotal 173.3 179.2 188.1 231.7 227.3 254.3 291.1 334.4 383.7 441.5 14.2
Growth (%) NA 3.4 4.9 23.2 -1.9 11.8 14.5 14.8 14.8 15.1
Total
Midsize companies (100–499 employees)
4.9 5.2 15.3 26.1 28.0 35.9 57.7 75.9 120.1 138.3 37.6
Growth (%) NA 7.6 192.9 70.6 7.2 28.2 60.7 31.4 58.3 15.1
Large companies (500–999 employees)
53.5 59.3 71.0 124.1 125.9 165.3 206.2 246.7 283.9 339.4 21.9
Growth (%) NA 11.0 19.6 74.8 1.4 31.3 24.8 19.6 15.1 19.5
Very large companies (1,000+ employees)
427.6 438.6 443.2 503.0 487.6 517.4 561.0 626.2 688.0 779.3 9.8
Growth (%) NA 2.6 1.0 13.5 -3.1 6.1 8.4 11.6 9.9 13.3
Total 486.0 503.2 529.5 653.2 641.6 718.6 825.0 948.7 1,092.0 1,256.9 14.4
Growth (%) NA 3.5 5.2 23.4 -1.8 12.0 14.8 15.0 15.1 15.1
Note: See Table 18 for key forecast assumptions.
Source: IDC, August 2010
©2010 IDC #224913 23
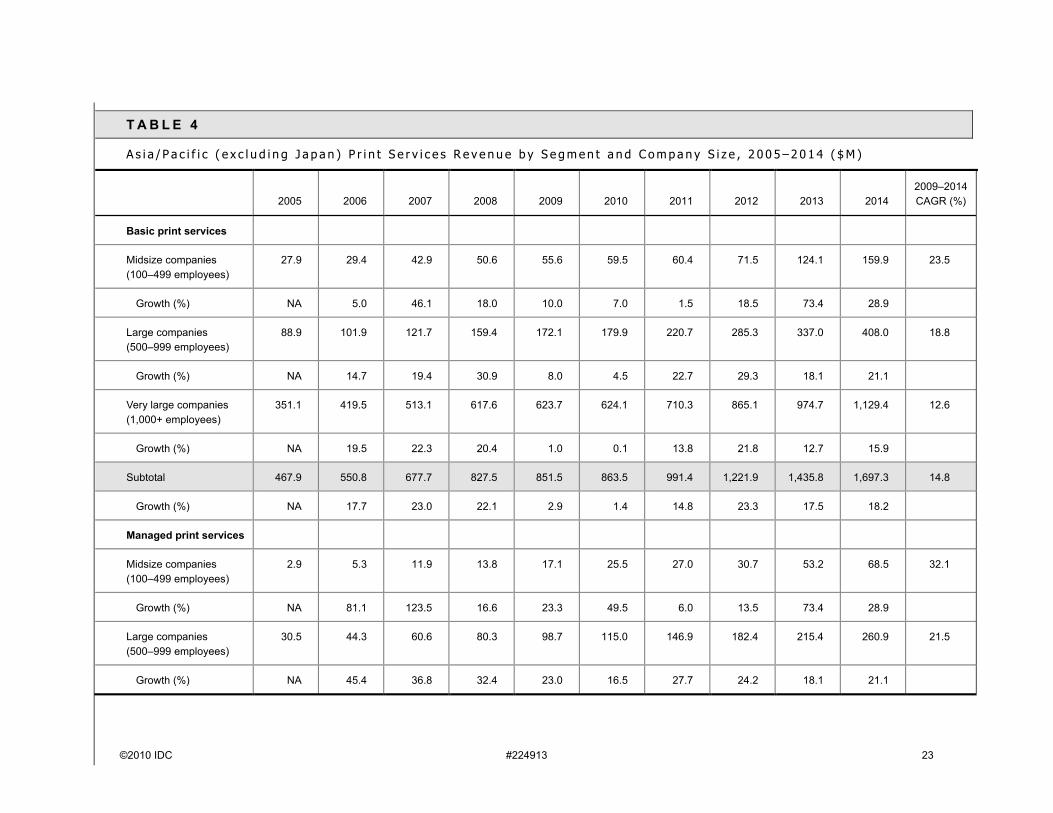
T A B L E 4
A s i a / P a c i f i c ( e x c l u d i n g J a p a n ) P r i n t S e r v i c e s R e v e n u e b y S e g m e n t a n d C o m p a n y S i z e , 2 0 0 5 – 2 0 1 4 ( $ M )
2005 2006 2007 2008 2009 2010 2011 2012 2013 20142009–2014 CAGR (%)
Basic print services
Midsize companies (100–499 employees)
27.9 29.4 42.9 50.6 55.6 59.5 60.4 71.5 124.1 159.9 23.5
Growth (%) NA 5.0 46.1 18.0 10.0 7.0 1.5 18.5 73.4 28.9
Large companies (500–999 employees)
88.9 101.9 121.7 159.4 172.1 179.9 220.7 285.3 337.0 408.0 18.8
Growth (%) NA 14.7 19.4 30.9 8.0 4.5 22.7 29.3 18.1 21.1
Very large companies (1,000+ employees)
351.1 419.5 513.1 617.6 623.7 624.1 710.3 865.1 974.7 1,129.4 12.6
Growth (%) NA 19.5 22.3 20.4 1.0 0.1 13.8 21.8 12.7 15.9
Subtotal 467.9 550.8 677.7 827.5 851.5 863.5 991.4 1,221.9 1,435.8 1,697.3 14.8
Growth (%) NA 17.7 23.0 22.1 2.9 1.4 14.8 23.3 17.5 18.2
Managed print services
Midsize companies (100–499 employees)
2.9 5.3 11.9 13.8 17.1 25.5 27.0 30.7 53.2 68.5 32.1
Growth (%) NA 81.1 123.5 16.6 23.3 49.5 6.0 13.5 73.4 28.9
Large companies (500–999 employees)
30.5 44.3 60.6 80.3 98.7 115.0 146.9 182.4 215.4 260.9 21.5
Growth (%) NA 45.4 36.8 32.4 23.0 16.5 27.7 24.2 18.1 21.1
24 #224913 ©2010 IDC
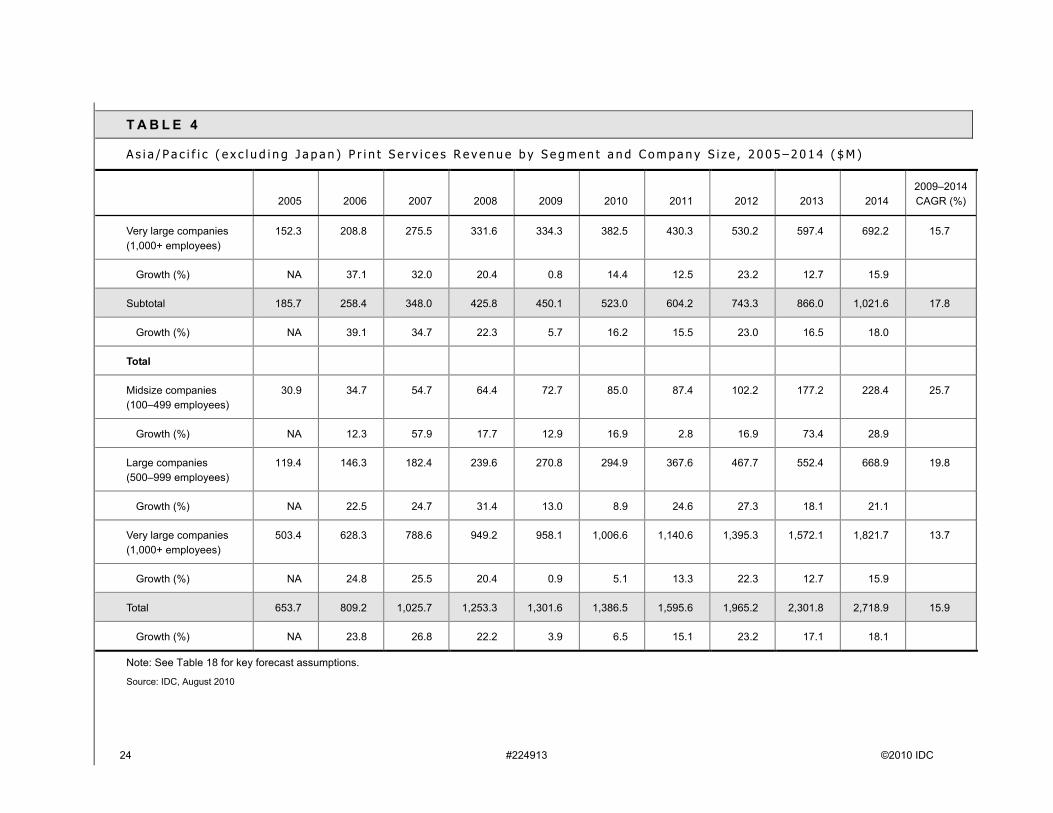
T A B L E 4
A s i a / P a c i f i c ( e x c l u d i n g J a p a n ) P r i n t S e r v i c e s R e v e n u e b y S e g m e n t a n d C o m p a n y S i z e , 2 0 0 5 – 2 0 1 4 ( $ M )
2005 2006 2007 2008 2009 2010 2011 2012 2013 20142009–2014 CAGR (%)
Very large companies (1,000+ employees)
152.3 208.8 275.5 331.6 334.3 382.5 430.3 530.2 597.4 692.2 15.7
Growth (%) NA 37.1 32.0 20.4 0.8 14.4 12.5 23.2 12.7 15.9
Subtotal 185.7 258.4 348.0 425.8 450.1 523.0 604.2 743.3 866.0 1,021.6 17.8
Growth (%) NA 39.1 34.7 22.3 5.7 16.2 15.5 23.0 16.5 18.0
Total
Midsize companies (100–499 employees)
30.9 34.7 54.7 64.4 72.7 85.0 87.4 102.2 177.2 228.4 25.7
Growth (%) NA 12.3 57.9 17.7 12.9 16.9 2.8 16.9 73.4 28.9
Large companies (500–999 employees)
119.4 146.3 182.4 239.6 270.8 294.9 367.6 467.7 552.4 668.9 19.8
Growth (%) NA 22.5 24.7 31.4 13.0 8.9 24.6 27.3 18.1 21.1
Very large companies (1,000+ employees)
503.4 628.3 788.6 949.2 958.1 1,006.6 1,140.6 1,395.3 1,572.1 1,821.7 13.7
Growth (%) NA 24.8 25.5 20.4 0.9 5.1 13.3 22.3 12.7 15.9
Total 653.7 809.2 1,025.7 1,253.3 1,301.6 1,386.5 1,595.6 1,965.2 2,301.8 2,718.9 15.9
Growth (%) NA 23.8 26.8 22.2 3.9 6.5 15.1 23.2 17.1 18.1
Note: See Table 18 for key forecast assumptions.
Source: IDC, August 2010
©2010 IDC #224913 25
T A B L E 5
C a n a d a P r i n t S e r v i c e s R e v e n u e b y S e g m e n t a n d C o m p a n y S i z e , 2 0 0 5 – 2 0 1 4 ( $ M )
2005 2006 2007 2008 2009 2010 2011 2012 2013 20142009–2014 CAGR (%)
Basic print services
Midsize companies (100–499 employees)
40.8 48.9 55.4 66.5 83.6 100.0 117.5 141.5 173.9 217.0 21.0
Growth (%) NA 19.8 13.3 20.1 25.7 19.6 17.5 20.4 22.9 24.8
Large companies (500–999 employees)
31.5 33.7 38.6 46.8 28.5 30.9 35.0 41.0 50.8 58.1 15.3
Growth (%) NA 7.0 14.6 21.4 -39.1 8.3 13.2 17.4 23.7 14.4
Very large companies (1,000+ employees)
75.9 76.7 80.6 89.7 90.7 93.8 106.0 124.3 153.0 173.3 13.8
Growth (%) NA 1.0 5.1 11.4 1.0 3.5 13.0 17.2 23.1 13.3
Subtotal 148.1 159.2 174.5 203.1 202.8 224.6 258.4 306.8 377.7 448.4 17.2
Growth (%) NA 7.5 9.6 16.4 -0.2 10.8 15.0 18.7 23.1 18.7
Managed print services
Midsize companies (100–499 employees)
34.6 38.5 43.7 52.9 65.4 78.9 92.7 111.6 137.2 171.2 21.2
Growth (%) NA 11.4 13.3 21.1 23.7 20.6 17.5 20.4 22.9 24.8
Large companies (500–999 employees)
31.8 34.3 39.6 47.4 30.7 31.2 35.4 41.5 51.3 58.7 13.9
Growth (%) NA 7.8 15.2 19.8 -35.3 1.9 13.2 17.4 23.7 14.4
26 #224913 ©2010 IDC
T A B L E 5
C a n a d a P r i n t S e r v i c e s R e v e n u e b y S e g m e n t a n d C o m p a n y S i z e , 2 0 0 5 – 2 0 1 4 ( $ M )
2005 2006 2007 2008 2009 2010 2011 2012 2013 20142009–2014 CAGR (%)
Very large companies (1,000+ employees)
86.9 90.4 95.1 106.3 106.3 110.7 125.0 146.6 180.4 204.4 14.0
Growth (%) NA 4.1 5.1 11.8 0.0 4.1 13.0 17.2 23.1 13.3
Subtotal 153.3 163.3 178.3 206.6 202.4 220.7 253.0 299.7 369.0 434.3 16.5
Growth (%) NA 6.5 9.2 15.9 -2.0 9.1 14.6 18.4 23.1 17.7
Total
Midsize companies (100–499 employees)
75.4 87.4 99.0 119.4 149.0 178.8 210.1 253.1 311.1 388.2 21.1
Growth (%) NA 16.0 13.3 20.5 24.8 20.0 17.5 20.4 22.9 24.8
Large companies (500–999 employees)
63.3 68.0 78.1 94.2 59.2 62.1 70.3 82.5 102.1 116.8 14.6
Growth (%) NA 7.4 14.9 20.6 -37.2 5.0 13.2 17.4 23.7 14.4
Very large companies (1,000+ employees)
162.8 167.1 175.6 196.0 197.0 204.5 231.0 270.8 333.4 377.7 13.9
Growth (%) NA 2.7 5.1 11.6 0.5 3.8 13.0 17.2 23.1 13.3
Total 301.5 322.5 352.8 409.6 405.1 445.4 511.5 606.5 746.6 882.7 16.9
Growth (%) NA 7.0 9.4 16.1 -1.1 9.9 14.8 18.6 23.1 18.2
Note: See Table 18 for key forecast assumptions.
Source: IDC, August 2010
©2010 IDC #224913 27
T A B L E 6
C E M A P r i n t S e r v i c e s R e v e n u e b y S e g m e n t a n d C o m p a n y S i z e , 2 0 0 5 – 2 0 1 4 ( $ M )
2005 2006 2007 2008 2009 2010 2011 2012 2013 20142009–2014 CAGR (%)
Basic print services
Midsize companies (100–499 employees)
1.5 1.9 2.5 3.4 4.8 7.0 10.3 15.3 22.8 34.1 47.8
Growth (%) NA 30.0 30.0 38.0 41.0 44.0 48.0 48.2 49.1 49.6
Large companies (500–999 employees)
108.9 112.0 114.5 117.4 123.3 124.8 127.5 146.5 171.8 202.1 10.4
Growth (%) NA 2.9 2.2 2.6 5.0 1.2 2.2 14.9 17.2 17.7
Very large companies (1,000+ employees)
118.8 120.7 127.2 144.1 151.4 157.5 179.1 203.9 234.1 277.3 12.9
Growth (%) NA 1.5 5.4 13.2 5.1 4.0 13.7 13.8 14.8 18.5
Subtotal 229.2 234.6 244.2 265.0 279.6 289.3 317.0 365.7 428.6 513.5 12.9
Growth (%) NA 2.4 4.1 8.5 5.5 3.5 9.6 15.4 17.2 19.8
Managed print services
Midsize companies (100–499 employees)
0.5 0.6 0.7 1.0 1.2 1.6 2.2 3.2 4.6 6.9 40.9
Growth (%) NA 24.6 26.0 28.1 29.5 33.0 36.0 42.0 46.0 48.0
Large companies (500–999 employees)
43.7 44.7 46.7 49.2 51.9 55.4 57.0 65.8 75.1 87.1 10.9
Growth (%) NA 2.3 4.6 5.4 5.5 6.7 2.9 15.3 14.3 16.0
28 #224913 ©2010 IDC
T A B L E 6
C E M A P r i n t S e r v i c e s R e v e n u e b y S e g m e n t a n d C o m p a n y S i z e , 2 0 0 5 – 2 0 1 4 ( $ M )
2005 2006 2007 2008 2009 2010 2011 2012 2013 20142009–2014 CAGR (%)
Very large companies (1,000+ employees)
51.2 52.3 53.5 58.8 62.6 63.8 65.8 66.6 75.6 88.2 7.1
Growth (%) NA 2.0 2.4 9.9 6.5 1.9 3.1 1.2 13.5 16.7
Subtotal 95.4 97.5 101.0 109.0 115.8 120.9 125.1 135.5 155.4 182.2 9.5
Growth (%) NA 2.3 3.6 7.9 6.3 4.4 3.5 8.4 14.6 17.3
Total
Midsize companies (100–499 employees)
1.9 2.5 3.2 4.4 6.1 8.6 12.6 18.5 27.4 41.0 46.5
Growth (%) NA 28.7 29.1 35.7 38.5 41.8 45.7 47.1 48.6 49.3
Large companies (500–999 employees)
152.6 156.7 161.2 166.7 175.3 180.2 184.6 212.3 246.9 289.2 10.5
Growth (%) NA 2.7 2.9 3.4 5.1 2.8 2.4 15.0 16.3 17.1
Very large companies (1,000+ employees)
170.1 172.9 180.7 202.9 214.1 221.3 244.9 270.5 309.6 365.5 11.3
Growth (%) NA 1.7 4.5 12.3 5.5 3.4 10.7 10.5 14.5 18.1
Total 324.6 332.1 345.2 374.0 395.4 410.1 442.1 501.3 584.0 695.8 12.0
Growth (%) NA 2.3 3.9 8.3 5.7 3.7 7.8 13.4 16.5 19.1
Note: See Table 18 for key forecast assumptions.
Source: IDC, August 2010

©2010 IDC #224913 29
T A B L E 7
J a p a n P r i n t S e r v i c e s R e v e n u e b y S e g m e n t a n d C o m p a n y S i z e , 2 0 0 5 – 2 0 1 4 ( $ M )
2005 2006 2007 2008 2009 2010 2011 2012 2013 20142009–2014 CAGR (%)
Basic print services
Midsize companies (100–499 employees)
6.3 10.3 14.3 21.5 22.1 25.9 30.1 39.0 50.8 59.8 22.0
Growth (%) NA 63.3 38.3 51.0 2.7 17.3 15.8 29.7 30.3 17.8
Large companies (500–999 employees)
35.4 41.5 50.9 65.4 72.2 82.8 100.4 127.9 155.0 186.2 20.9
Growth (%) NA 17.2 22.8 28.3 10.4 14.8 21.2 27.4 21.3 20.1
Very large companies (1,000+ employees)
163.5 199.7 247.9 307.7 313.3 348.4 399.3 447.9 518.8 607.8 14.2
Growth (%) NA 22.1 24.1 24.2 1.8 11.2 14.6 12.2 15.8 17.2
Subtotal 205.2 251.5 313.1 394.6 407.5 457.2 529.7 614.8 724.6 853.8 15.9
Growth (%) NA 22.6 24.5 26.1 3.3 12.2 15.9 16.1 17.9 17.8
Managed print services
Midsize companies (100–499 employees)
0.7 1.1 1.5 2.3 2.4 2.8 3.3 4.2 5.5 6.5 22.0
Growth (%) NA 63.3 38.3 51.0 2.7 17.3 15.8 29.7 30.3 17.8
Large companies(500–999 employees)
6.9 8.1 9.9 12.7 14.1 16.1 19.6 24.9 30.2 36.3 20.9
Growth (%) NA 17.2 22.8 28.3 10.4 14.8 21.2 27.4 21.3 20.1
30 #224913 ©2010 IDC
T A B L E 7
J a p a n P r i n t S e r v i c e s R e v e n u e b y S e g m e n t a n d C o m p a n y S i z e , 2 0 0 5 – 2 0 1 4 ( $ M )
2005 2006 2007 2008 2009 2010 2011 2012 2013 20142009–2014 CAGR (%)
Very large companies (1,000+ employees)
46.6 56.9 70.6 87.7 89.3 99.3 113.8 127.7 147.9 173.2 14.2
Growth (%) NA 22.1 24.1 24.2 1.8 11.2 14.6 12.2 15.8 17.2
Subtotal 54.2 66.1 82.1 102.8 105.8 118.3 136.6 156.8 183.6 216.0 15.4
Growth (%) NA 22.0 24.2 25.2 2.9 11.8 15.5 14.8 17.1 17.7
Total
Midsize companies (100–499 employees)
7.0 11.4 15.8 23.9 24.5 28.8 33.3 43.2 56.3 66.3 22.0
Growth (%) NA 63.3 38.3 51.0 2.7 17.3 15.8 29.7 30.3 17.8
Large companies (500–999 employees)
42.3 49.5 60.9 78.1 86.2 99.0 119.9 152.8 185.3 222.5 20.9
Growth (%) NA 17.2 22.8 28.3 10.4 14.8 21.2 27.4 21.3 20.1
Very large companies (1,000+ employees)
210.1 256.6 318.5 395.5 402.5 447.7 513.1 575.6 666.6 781.0 14.2
Growth (%) NA 22.1 24.1 24.2 1.8 11.2 14.6 12.2 15.8 17.2
Total 259.4 317.6 395.2 497.4 513.3 575.4 666.3 771.6 908.2 1,069.8 15.8
Growth (%) NA 22.4 24.4 25.9 3.2 12.1 15.8 15.8 17.7 17.8
Note: See Table 18 for key forecast assumptions.
Source: IDC, August 2010
©2010 IDC #224913 31
T A B L E 8
W o r l d w i d e P r i n t S e r v i c e s R e v e n u e b y S e g m e n t a n d C o m p a n y S i z e , 2 0 0 5 – 2 0 1 4 ( $ M )
2005 2006 2007 2008 2009 2010 2011 2012 2013 20142009–2014 CAGR (%)
Basic print services
Midsize companies (100–499 employees)
747.0 824.4 949.9 1,090.6 1,229.3 1,609.0 1,851.9 2,387.2 2,940.4 3,453.6 22.9
Growth (%) NA 10.4 15.2 14.8 12.7 30.9 15.1 28.9 23.2 17.5
Large companies (500–999 employees)
2,189.1 2,365.3 2,681.3 3,128.5 3,303.0 3,704.6 4,292.0 4,851.2 5,589.4 6,296.2 13.8
Growth (%) NA 8.0 13.4 16.7 5.6 12.2 15.9 13.0 15.2 12.6
Very large companies (1,000+ employees)
4,720.1 5,053.4 5,318.3 5,943.4 6,161.8 6,249.1 6,669.8 7,101.2 7,528.8 8,281.1 6.1
Growth (%) NA 7.1 5.2 11.8 3.7 1.4 6.7 6.5 6.0 10.0
Subtotal 7,656.1 8,243.1 8,949.5 10,162.5 10,694.1 11,562.7 12,813.7 14,339.7 16,058.6 18,030.8 11.0
Growth (%) NA 7.7 8.6 13.6 5.2 8.1 10.8 11.9 12.0 12.3
Managed print services
Midsize companies (100–499 employees)
433.2 471.0 539.4 629.5 727.2 968.7 1,115.2 1,433.3 1,746.5 2,055.1 23.1
Growth (%) NA 8.7 14.5 16.7 15.5 33.2 15.1 28.5 21.8 17.7
Large companies (500–999 employees)
1,452.6 1,572.3 1,880.8 2,218.6 2,404.4 2,739.6 3,185.1 3,605.5 4,160.6 4,691.2 14.3
Growth (%) NA 8.2 19.6 18.0 8.4 13.9 16.3 13.2 15.4 12.8
32 #224913 ©2010 IDC
T A B L E 8
W o r l d w i d e P r i n t S e r v i c e s R e v e n u e b y S e g m e n t a n d C o m p a n y S i z e , 2 0 0 5 – 2 0 1 4 ( $ M )
2005 2006 2007 2008 2009 2010 2011 2012 2013 20142009–2014 CAGR (%)
Very large companies (1,000+ employees)
3,305.1 3,538.7 3,837.2 4,346.4 4,648.9 4,805.6 5,107.3 5,462.3 5,789.7 6,362.5 6.5
Growth (%) NA 7.1 8.4 13.3 7.0 3.4 6.3 7.0 6.0 9.9
Subtotal 5,190.9 5,582.0 6,257.5 7,194.5 7,780.5 8,513.9 9,407.6 10,501.2 11,696.8 13,108.9 11.0
Growth (%) NA 7.5 12.1 15.0 8.1 9.4 10.5 11.6 11.4 12.1
Total
Midsize companies (100–499 employees)
1,180.2 1,295.4 1,489.3 1,720.1 1,956.5 2,577.7 2,967.0 3,820.6 4,686.9 5,508.7 23.0
Growth (%) NA 9.8 15.0 15.5 13.7 31.7 15.1 28.8 22.7 17.5
Large companies(500–999 employees)
3,641.7 3,937.6 4,562.1 5,347.1 5,707.4 6,444.2 7,477.1 8,456.7 9,750.0 10,987.4 14.0
Growth (%) NA 8.1 15.9 17.2 6.7 12.9 16.0 13.1 15.3 12.7
Very large companies (1,000+ employees)
8,025.1 8,592.1 9,155.6 10,289.8 10,810.6 11,054.7 11,777.1 12,563.5 13,318.6 14,643.6 6.3
Growth (%) NA 7.1 6.6 12.4 5.1 2.3 6.5 6.7 6.0 9.9
Total 12,847.0 13,825.0 15,207.0 17,357.0 18,474.6 20,076.6 22,221.3 24,840.9 27,755.4 31,139.7 11.0
Growth (%) NA 7.6 10.0 14.1 6.4 8.7 10.7 11.8 11.7 12.2
Note: See Table 18 for key forecast assumptions.
Source: IDC, August 2010
©2010 IDC #224913 33
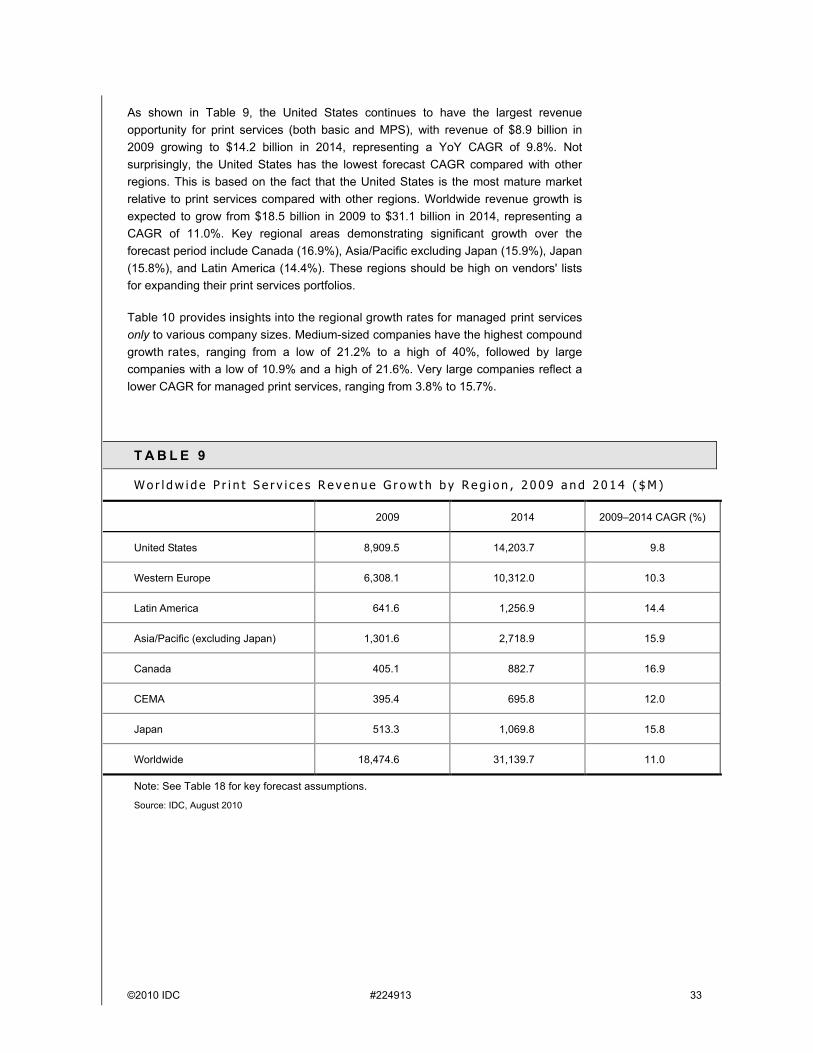
As shown in Table 9, the United States continues to have the largest revenue opportunity for print services (both basic and MPS), with revenue of $8.9 billion in 2009 growing to $14.2 billion in 2014, representing a YoY CAGR of 9.8%. Not surprisingly, the United States has the lowest forecast CAGR compared with other regions. This is based on the fact that the United States is the most mature market relative to print services compared with other regions. Worldwide revenue growth is expected to grow from $18.5 billion in 2009 to $31.1 billion in 2014, representing a CAGR of 11.0%. Key regional areas demonstrating significant growth over the forecast period include Canada (16.9%), Asia/Pacific excluding Japan (15.9%), Japan (15.8%), and Latin America (14.4%). These regions should be high on vendors' lists for expanding their print services portfolios.
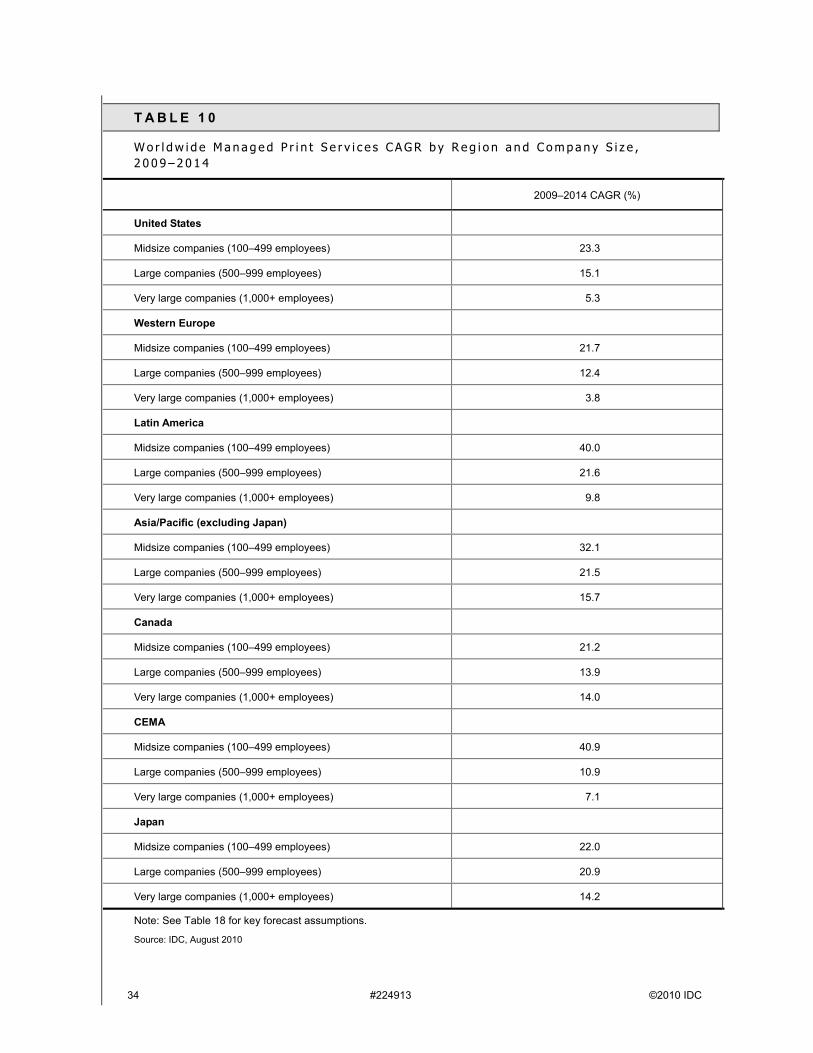
Table 10 provides insights into the regional growth rates for managed print services only to various company sizes. Medium-sized companies have the highest compoundgrowth rates, ranging from a low of 21.2% to a high of 40%, followed by large companies with a low of 10.9% and a high of 21.6%. Very large companies reflect a lower CAGR for managed print services, ranging from 3.8% to 15.7%.
T A B L E 9
W o r l d w i d e P r i n t S e r v i c e s R e v e n u e G r o w t h b y R e g i o n , 2 0 0 9 a n d 2 0 1 4 ( $ M )
2009 2014 2009–2014 CAGR (%)
United States 8,909.5 14,203.7 9.8
Western Europe 6,308.1 10,312.0 10.3
Latin America 641.6 1,256.9 14.4
Asia/Pacific (excluding Japan) 1,301.6 2,718.9 15.9
Canada 405.1 882.7 16.9
CEMA 395.4 695.8 12.0
Japan 513.3 1,069.8 15.8
Worldwide 18,474.6 31,139.7 11.0
Note: See Table 18 for key forecast assumptions.
Source: IDC, August 2010
34 #224913 ©2010 IDC
T A B L E 1 0
W o r l d w i d e M a n a g e d P r i n t S e r v i c e s C A G R b y R e g i o n a n d C o m p a n y S i z e , 2 0 0 9 – 2 0 1 4
2009–2014 CAGR (%)
United States
Midsize companies (100–499 employees) 23.3
Large companies (500–999 employees) 15.1
Very large companies (1,000+ employees) 5.3
Western Europe
Midsize companies (100–499 employees) 21.7
Large companies (500–999 employees) 12.4
Very large companies (1,000+ employees) 3.8
Latin America
Midsize companies (100–499 employees) 40.0
Large companies (500–999 employees) 21.6
Very large companies (1,000+ employees) 9.8
Asia/Pacific (excluding Japan)
Midsize companies (100–499 employees) 32.1
Large companies (500–999 employees) 21.5
Very large companies (1,000+ employees) 15.7
Canada
Midsize companies (100–499 employees) 21.2
Large companies (500–999 employees) 13.9
Very large companies (1,000+ employees) 14.0
CEMA
Midsize companies (100–499 employees) 40.9
Large companies (500–999 employees) 10.9
Very large companies (1,000+ employees) 7.1
Japan
Midsize companies (100–499 employees) 22.0
Large companies (500–999 employees) 20.9
Very large companies (1,000+ employees) 14.2
Note: See Table 18 for key forecast assumptions.
Source: IDC, August 2010

©2010 IDC #224913 35
In-House Production Print Services 2010–2014 Forecast
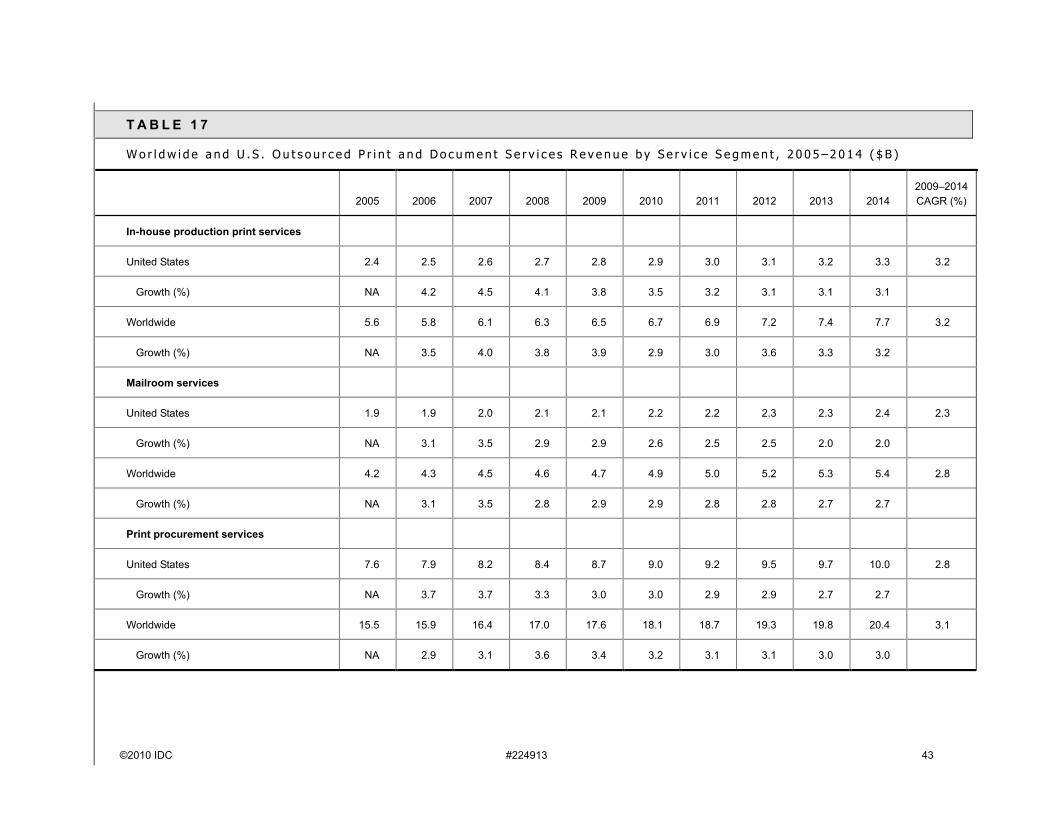
In-house production print is expected to grow on a worldwide basis from $6.5 billion to $7.7 billion from 2009 through 2014 at a compound annual rate of 3.2% (see Table 11).
Mailroom Services 2010–2014 Forecast
Mailroom services is expected to grow on a worldwide basis from $4.7 billion to $5.4 billion from 2009 through 2014 at a compound annual rate of 2.8% (see Table 12).
Print Procurement Services 2010–2014 Forecast
Print procurement services is expected to grow on a worldwide basis from $17.6 billion to $20.4 billion from 2009 through 2014 at a compound annual rate of 3.1% (see Table 13).
Imaging and Document Archival Services 2010–2014 Forecast
Imaging and document archival services is expected to grow on a worldwide basis from $13.3 billion to $25.7 billion from 2009 through 2014 at a compound annual rate of 14.1% (see Table 14).
Business Processing Outsourcing Document Services 2010–2014 Forecast
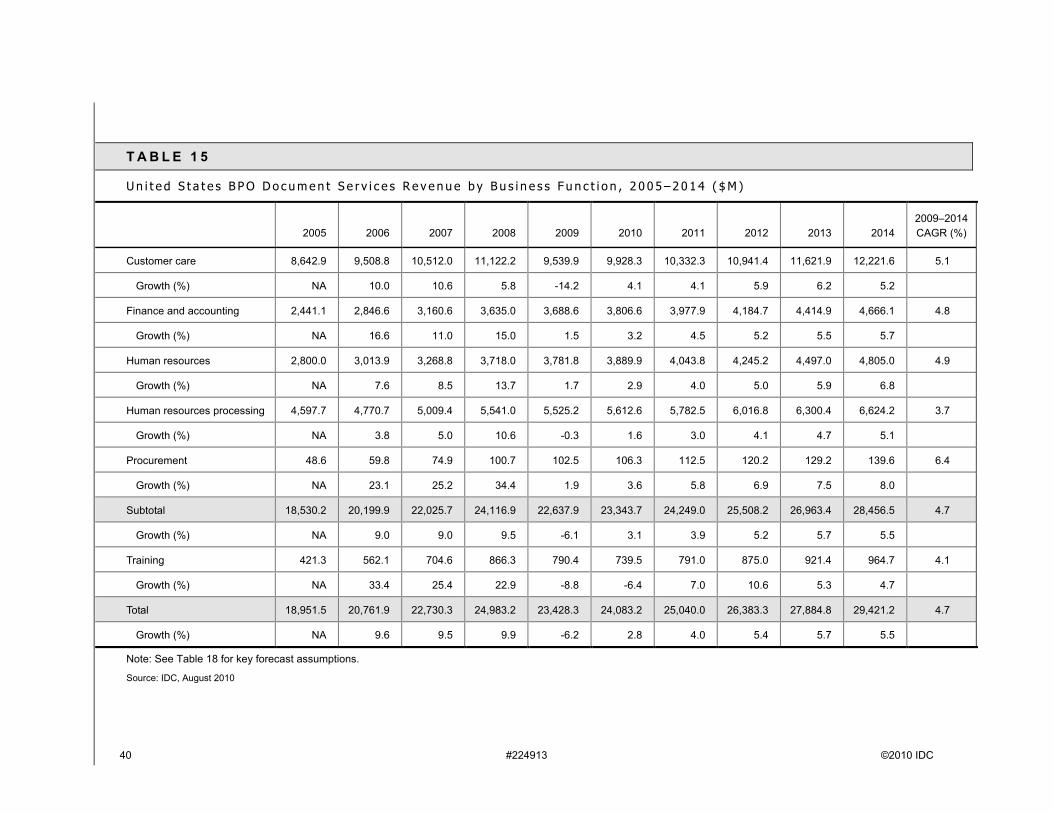
U.S. BPO document services is expected to grow from $23.4 billion to $29.4 billion from 2009 through 2014 at a compound annual rate of 4.7% (see Table 15).
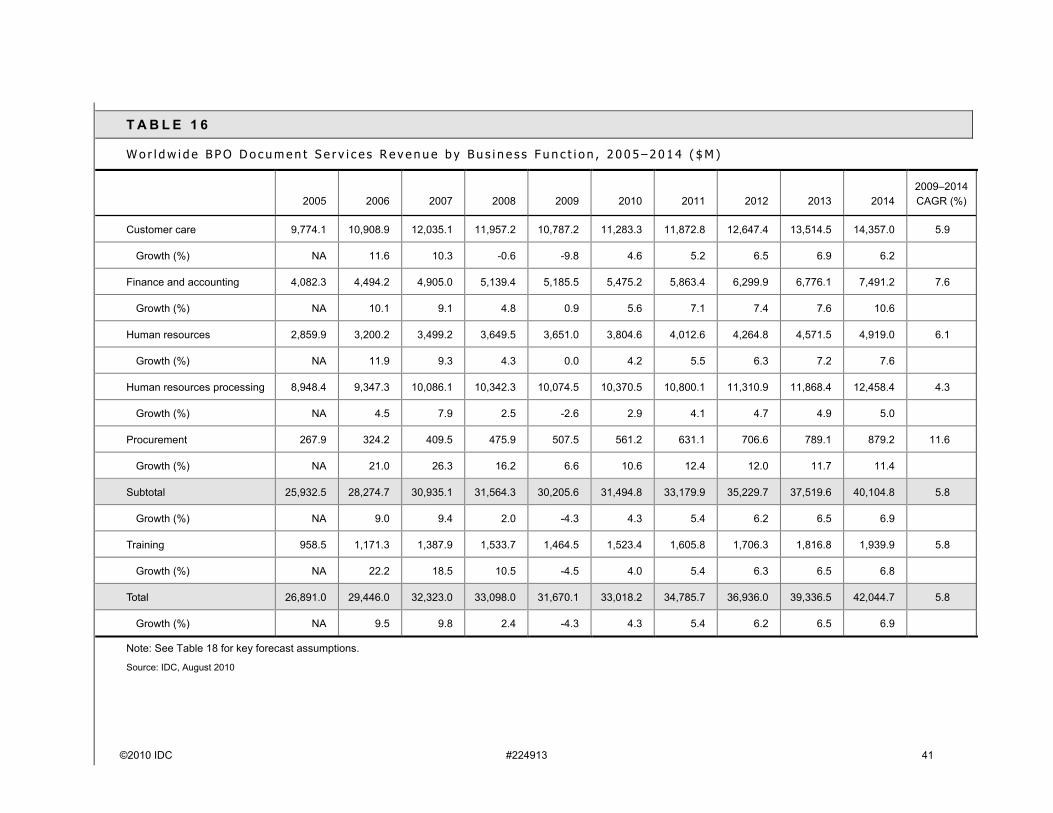
Worldwide BPO document services is expected to grow from $31.7 billion to $42 billion from 2009 through 2014 at a compound annual rate of 5.8% (see Table 16).
Print and Document Services 2010–2014 Forecast by Segment
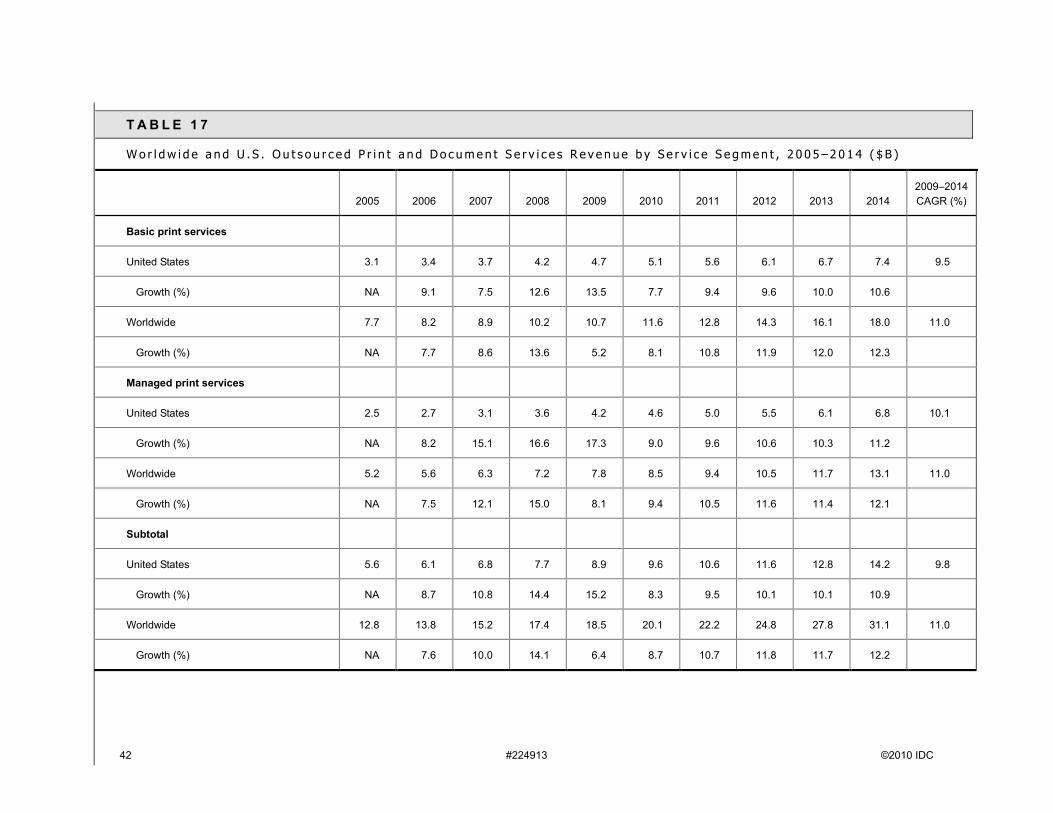
Table 17 provides the U.S. and worldwide outsourced print and document services revenue forecast by services segment.
Assumptions
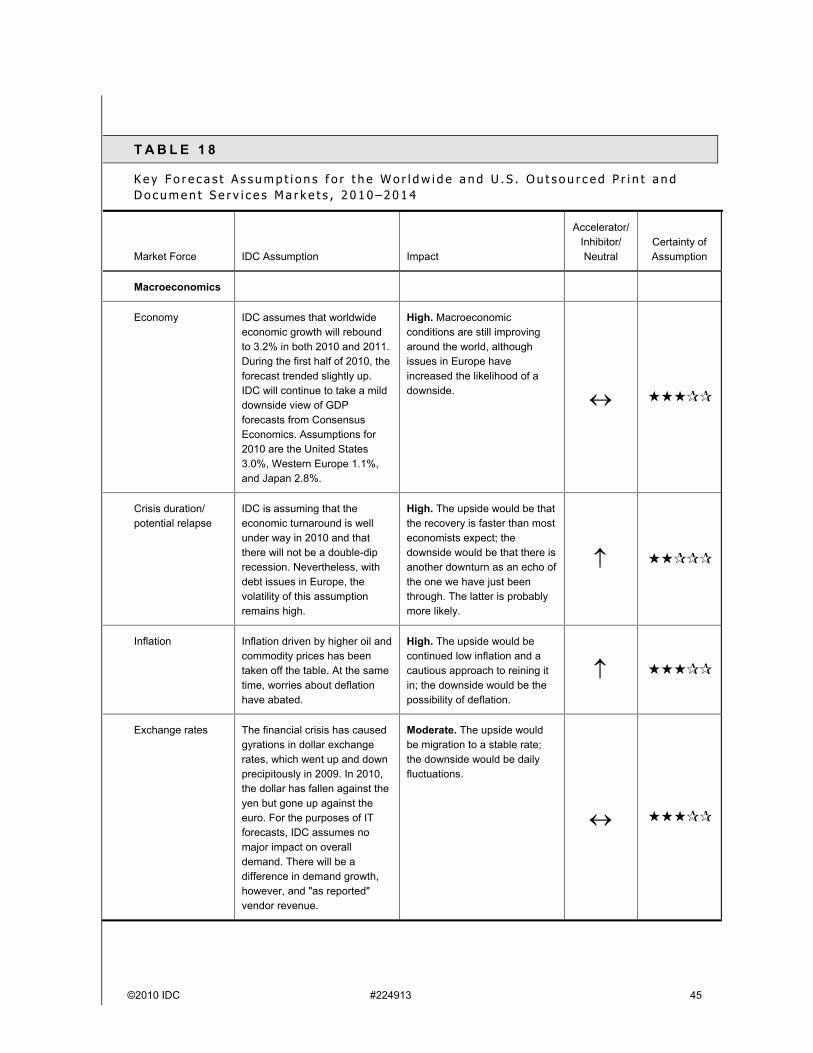
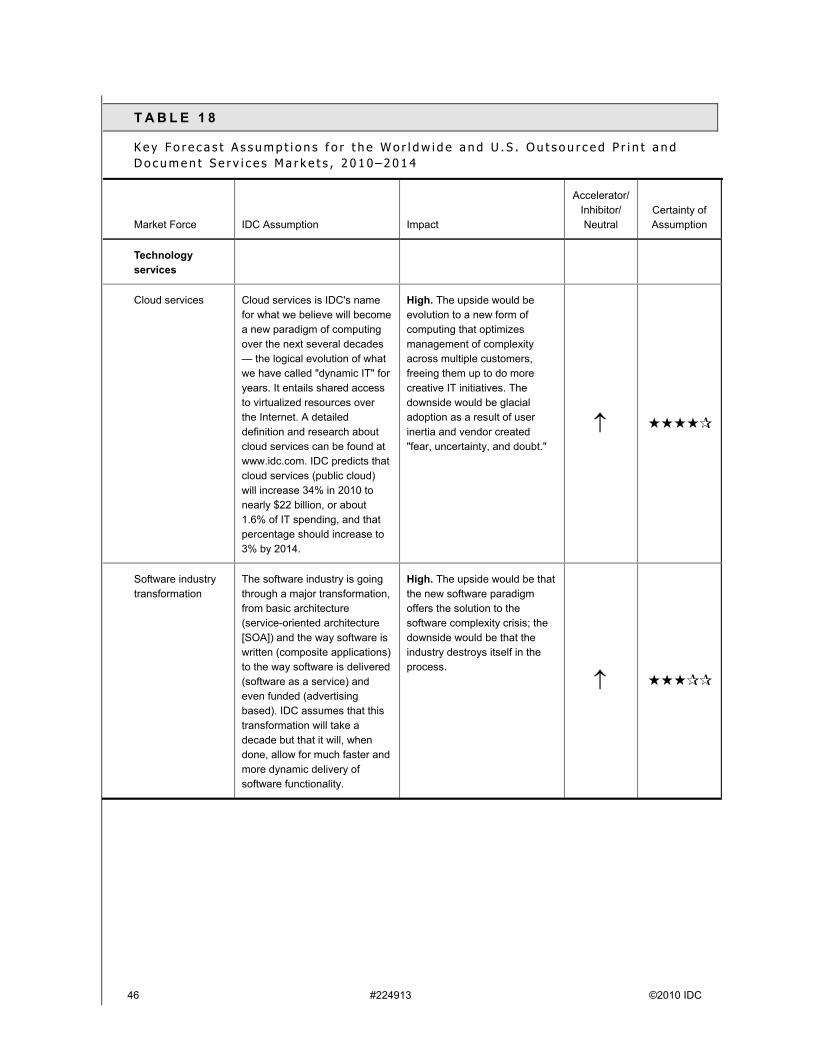
Table 18 lists the key assumptions used to generate this forecast.

36 #224913 ©2010 IDC
T A B L E 1 1
W o r l d w i d e a n d U . S . I n - H o u s e P r o d u c t i o n P r i n t S e r v i c e s R e v e n u e b y C o m p a n y S i z e , 2 0 0 5 – 2 0 1 4 ( $ M )
2005 2006 2007 2008 2009 2010 2011 2012 2013 20142009–2014 CAGR (%)
United States
Midsize companies (100–499 employees)
593.0 618.6 645.3 676.5 703.6 730.3 755.2 778.6 802.7 826.8 3.3
Growth (%) NA 4.3 4.3 4.8 4.0 3.8 3.4 3.1 3.1 3.0
Large and very large companies (500+ employees)
1,812.0 1,887.0 1,974.0 2,050.0 2,125.9 2,198.1 2,268.5 2,339.9 2,412.5 2,487.2 3.2
Growth (%) NA 4.1 4.6 3.9 3.7 3.4 3.2 3.2 3.1 3.1
Total 2,405.0 2,505.6 2,619.3 2,726.5 2,829.4 2,928.5 3,023.6 3,118.5 3,215.2 3,314.0 3.2
Growth (%) NA 4.2 4.5 4.1 3.8 3.5 3.2 3.1 3.1 3.1
Worldwide
Midsize companies (100–499 employees)
1,483.8 1,549.1 1,615.7 1,685.2 1,752.6 1,804.7 1,864.4 1,938.5 2,010.2 2,082.5 3.5
Growth (%) NA 4.4 4.3 4.3 4.0 3.0 3.3 4.0 3.7 3.6
Large and very large companies (500+ employees)
4,149.0 4,279.0 4,443.0 4,606.0 4,785.0 4,922.4 5,065.5 5,241.4 5,409.0 5,576.5 3.1
Growth (%) NA 3.1 3.8 3.7 3.9 2.9 2.9 3.5 3.2 3.1
Total 5,632.8 5,828.1 6,058.7 6,291.2 6,537.6 6,727.1 6,929.9 7,179.9 7,419.2 7,658.9 3.2
Growth (%) NA 3.5 4.0 3.8 3.9 2.9 3.0 3.6 3.3 3.2
Notes:See Table 18 for key forecast assumptions."Survey company segmentation" was for only two segments.
Source: IDC, August 2010
©2010 IDC #224913 37
T A B L E 1 2
W o r l d w i d e a n d U . S . M a i l r o o m S e r v i c e s R e v e n u e , 2 0 0 5 – 2 0 1 4 ( $ M )
2005 2006 2007 2008 2009 2010 2011 2012 2013 20142009–2014 CAGR (%)
United States 1,890.0 1,948.6 2,016.6 2,075.6 2,135.8 2,191.3 2,246.1 2,302.2 2,348.3 2,395.2 2.3
Growth (%) NA 3.1 3.5 2.9 2.9 2.6 2.5 2.5 2.0 2.0
Worldwide 4,208.0 4,338.4 4,488.5 4,615.5 4,747.5 4,885.2 5,022.0 5,160.1 5,299.4 5,442.5 2.8
Growth (%) NA 3.1 3.5 2.8 2.9 2.9 2.8 2.8 2.7 2.7
Note: See Table 18 for key forecast assumptions.
Source: IDC, August 2010
38 #224913 ©2010 IDC
T A B L E 1 3
W o r l d w i d e a n d U . S . P r i n t P r o c u r e m e n t S e r v i c e s R e v e n u e b y C o m p a n y S i z e , 2 0 0 5 – 2 0 1 4 ( $ M )
2005 2006 2007 2008 2009 2010 2011 2012 2013 20142009–2014 CAGR (%)
United States
Midsize companies (100–499 employees)
1,056.8 1,095.9 1,136.8 1,175.5 1,214.3 1,254.4 1,297.1 1,340.4 1,384.9 1,427.8 3.3
Growth (%) NA 3.7 3.7 3.4 3.3 3.3 3.4 3.3 3.3 3.1
Large and very large companies (500+ employees)
6,537.0 6,778.9 7,032.0 7,264.5 7,482.4 7,699.4 7,915.0 8,136.6 8,348.2 8,565.2 2.7
Growth (%) NA 3.7 3.7 3.3 3.0 2.9 2.8 2.8 2.6 2.6
Total 7,593.8 7,874.8 8,168.8 8,440.0 8,696.8 8,953.8 9,212.1 9,477.0 9,733.0 9,993.0 2.8
Growth (%) NA 3.7 3.7 3.3 3.0 3.0 2.9 2.9 2.7 2.7
Worldwide
Midsize companies (100–499 employees)
2,129.5 2,201.9 2,276.8 2,351.9 2,424.9 2,500.0 2,575.0 2,652.3 2,729.2 2,802.9 2.9
Growth (%) NA 3.4 3.4 3.3 3.1 3.1 3.0 3.0 2.9 2.7
Large and very large companies (500+ employees)
13,344.0 13,717.6 14,142.9 14,652.0 15,150.2 15,635.0 16,119.7 16,619.4 17,118.0 17,631.5 3.1
Growth (%) NA 2.8 3.1 3.6 3.4 3.2 3.1 3.1 3.0 3.0
Total 15,473.5 15,919.6 16,419.7 17,004.0 17,575.0 18,135.0 18,694.7 19,271.7 19,847.2 20,434.4 3.1
Growth (%) NA 2.9 3.1 3.6 3.4 3.2 3.1 3.1 3.0 3.0
Notes:See Table 18 for key forecast assumptions."Survey company segmentation" was for only two segments.
Source: IDC, August 2010
©2010 IDC #224913 39
T A B L E 1 4
W o r l d w i d e a n d U . S . I m a g i n g a n d D o c u m e n t A r c h i v a l S e r v i c e s R e v e n u e , 2 0 0 5 – 2 0 1 4 ( $ M )
2005 2006 2007 2008 2009 2010 2011 2012 2013 20142009–2014 CAGR (%)
United States 4,362.0 4,644.0 4,996.0 5,453.0 5,998.9 6,817.6 7,749.3 8,771.1 9,929.4 11,214.1 13.3
Growth (%) NA 6.5 7.6 9.1 10.0 13.6 13.7 13.2 13.2 12.9
Worldwide 9,369.0 9,979.0 10,772.0 11,880.0 13,274.4 15,366.9 17,764.3 20,108.2 22,763.6 25,708.7 14.1
Growth (%) NA 6.5 7.9 10.3 11.7 15.8 15.6 13.2 13.2 12.9
Note: See Table 18 for key forecast assumptions.
Source: IDC, August 2010
40 #224913 ©2010 IDC
T A B L E 1 5
U n i t e d S t a t e s B P O D o c u m e n t S e r v i c e s R e v e n u e b y B u s i n e s s F u n c t i o n , 2 0 0 5 – 2 0 1 4 ( $ M )
2005 2006 2007 2008 2009 2010 2011 2012 2013 20142009–2014 CAGR (%)
Customer care 8,642.9 9,508.8 10,512.0 11,122.2 9,539.9 9,928.3 10,332.3 10,941.4 11,621.9 12,221.6 5.1
Growth (%) NA 10.0 10.6 5.8 -14.2 4.1 4.1 5.9 6.2 5.2
Finance and accounting 2,441.1 2,846.6 3,160.6 3,635.0 3,688.6 3,806.6 3,977.9 4,184.7 4,414.9 4,666.1 4.8
Growth (%) NA 16.6 11.0 15.0 1.5 3.2 4.5 5.2 5.5 5.7
Human resources 2,800.0 3,013.9 3,268.8 3,718.0 3,781.8 3,889.9 4,043.8 4,245.2 4,497.0 4,805.0 4.9
Growth (%) NA 7.6 8.5 13.7 1.7 2.9 4.0 5.0 5.9 6.8
Human resources processing 4,597.7 4,770.7 5,009.4 5,541.0 5,525.2 5,612.6 5,782.5 6,016.8 6,300.4 6,624.2 3.7
Growth (%) NA 3.8 5.0 10.6 -0.3 1.6 3.0 4.1 4.7 5.1
Procurement 48.6 59.8 74.9 100.7 102.5 106.3 112.5 120.2 129.2 139.6 6.4
Growth (%) NA 23.1 25.2 34.4 1.9 3.6 5.8 6.9 7.5 8.0
Subtotal 18,530.2 20,199.9 22,025.7 24,116.9 22,637.9 23,343.7 24,249.0 25,508.2 26,963.4 28,456.5 4.7
Growth (%) NA 9.0 9.0 9.5 -6.1 3.1 3.9 5.2 5.7 5.5
Training 421.3 562.1 704.6 866.3 790.4 739.5 791.0 875.0 921.4 964.7 4.1
Growth (%) NA 33.4 25.4 22.9 -8.8 -6.4 7.0 10.6 5.3 4.7
Total 18,951.5 20,761.9 22,730.3 24,983.2 23,428.3 24,083.2 25,040.0 26,383.3 27,884.8 29,421.2 4.7
Growth (%) NA 9.6 9.5 9.9 -6.2 2.8 4.0 5.4 5.7 5.5
Note: See Table 18 for key forecast assumptions.
Source: IDC, August 2010
©2010 IDC #224913 41
T A B L E 1 6
W o r l d w i d e B P O D o c u m e n t S e r v i c e s R e v e n u e b y B u s i n e s s F u n c t i o n , 2 0 0 5 – 2 0 1 4 ( $ M )
2005 2006 2007 2008 2009 2010 2011 2012 2013 20142009–2014 CAGR (%)
Customer care 9,774.1 10,908.9 12,035.1 11,957.2 10,787.2 11,283.3 11,872.8 12,647.4 13,514.5 14,357.0 5.9
Growth (%) NA 11.6 10.3 -0.6 -9.8 4.6 5.2 6.5 6.9 6.2
Finance and accounting 4,082.3 4,494.2 4,905.0 5,139.4 5,185.5 5,475.2 5,863.4 6,299.9 6,776.1 7,491.2 7.6
Growth (%) NA 10.1 9.1 4.8 0.9 5.6 7.1 7.4 7.6 10.6
Human resources 2,859.9 3,200.2 3,499.2 3,649.5 3,651.0 3,804.6 4,012.6 4,264.8 4,571.5 4,919.0 6.1
Growth (%) NA 11.9 9.3 4.3 0.0 4.2 5.5 6.3 7.2 7.6
Human resources processing 8,948.4 9,347.3 10,086.1 10,342.3 10,074.5 10,370.5 10,800.1 11,310.9 11,868.4 12,458.4 4.3
Growth (%) NA 4.5 7.9 2.5 -2.6 2.9 4.1 4.7 4.9 5.0
Procurement 267.9 324.2 409.5 475.9 507.5 561.2 631.1 706.6 789.1 879.2 11.6
Growth (%) NA 21.0 26.3 16.2 6.6 10.6 12.4 12.0 11.7 11.4
Subtotal 25,932.5 28,274.7 30,935.1 31,564.3 30,205.6 31,494.8 33,179.9 35,229.7 37,519.6 40,104.8 5.8
Growth (%) NA 9.0 9.4 2.0 -4.3 4.3 5.4 6.2 6.5 6.9
Training 958.5 1,171.3 1,387.9 1,533.7 1,464.5 1,523.4 1,605.8 1,706.3 1,816.8 1,939.9 5.8
Growth (%) NA 22.2 18.5 10.5 -4.5 4.0 5.4 6.3 6.5 6.8
Total 26,891.0 29,446.0 32,323.0 33,098.0 31,670.1 33,018.2 34,785.7 36,936.0 39,336.5 42,044.7 5.8
Growth (%) NA 9.5 9.8 2.4 -4.3 4.3 5.4 6.2 6.5 6.9
Note: See Table 18 for key forecast assumptions.
Source: IDC, August 2010
42 #224913 ©2010 IDC
T A B L E 1 7
W o r l d w i d e a n d U . S . O u t s o u r c e d P r i n t a n d D o c u m e n t S e r v i c e s R e v e n u e b y S e r v i c e S e g m e n t , 2 0 0 5 – 2 0 1 4 ( $ B )
2005 2006 2007 2008 2009 2010 2011 2012 2013 20142009–2014 CAGR (%)
Basic print services
United States 3.1 3.4 3.7 4.2 4.7 5.1 5.6 6.1 6.7 7.4 9.5
Growth (%) NA 9.1 7.5 12.6 13.5 7.7 9.4 9.6 10.0 10.6
Worldwide 7.7 8.2 8.9 10.2 10.7 11.6 12.8 14.3 16.1 18.0 11.0
Growth (%) NA 7.7 8.6 13.6 5.2 8.1 10.8 11.9 12.0 12.3
Managed print services
United States 2.5 2.7 3.1 3.6 4.2 4.6 5.0 5.5 6.1 6.8 10.1
Growth (%) NA 8.2 15.1 16.6 17.3 9.0 9.6 10.6 10.3 11.2
Worldwide 5.2 5.6 6.3 7.2 7.8 8.5 9.4 10.5 11.7 13.1 11.0
Growth (%) NA 7.5 12.1 15.0 8.1 9.4 10.5 11.6 11.4 12.1
Subtotal
United States 5.6 6.1 6.8 7.7 8.9 9.6 10.6 11.6 12.8 14.2 9.8
Growth (%) NA 8.7 10.8 14.4 15.2 8.3 9.5 10.1 10.1 10.9
Worldwide 12.8 13.8 15.2 17.4 18.5 20.1 22.2 24.8 27.8 31.1 11.0
Growth (%) NA 7.6 10.0 14.1 6.4 8.7 10.7 11.8 11.7 12.2
©2010 IDC #224913 43
T A B L E 1 7
W o r l d w i d e a n d U . S . O u t s o u r c e d P r i n t a n d D o c u m e n t S e r v i c e s R e v e n u e b y S e r v i c e S e g m e n t , 2 0 0 5 – 2 0 1 4 ( $ B )
2005 2006 2007 2008 2009 2010 2011 2012 2013 20142009–2014 CAGR (%)
In-house production print services
United States 2.4 2.5 2.6 2.7 2.8 2.9 3.0 3.1 3.2 3.3 3.2
Growth (%) NA 4.2 4.5 4.1 3.8 3.5 3.2 3.1 3.1 3.1
Worldwide 5.6 5.8 6.1 6.3 6.5 6.7 6.9 7.2 7.4 7.7 3.2
Growth (%) NA 3.5 4.0 3.8 3.9 2.9 3.0 3.6 3.3 3.2
Mailroom services
United States 1.9 1.9 2.0 2.1 2.1 2.2 2.2 2.3 2.3 2.4 2.3
Growth (%) NA 3.1 3.5 2.9 2.9 2.6 2.5 2.5 2.0 2.0
Worldwide 4.2 4.3 4.5 4.6 4.7 4.9 5.0 5.2 5.3 5.4 2.8
Growth (%) NA 3.1 3.5 2.8 2.9 2.9 2.8 2.8 2.7 2.7
Print procurement services
United States 7.6 7.9 8.2 8.4 8.7 9.0 9.2 9.5 9.7 10.0 2.8
Growth (%) NA 3.7 3.7 3.3 3.0 3.0 2.9 2.9 2.7 2.7
Worldwide 15.5 15.9 16.4 17.0 17.6 18.1 18.7 19.3 19.8 20.4 3.1
Growth (%) NA 2.9 3.1 3.6 3.4 3.2 3.1 3.1 3.0 3.0
44 #224913 ©2010 IDC
T A B L E 1 7
W o r l d w i d e a n d U . S . O u t s o u r c e d P r i n t a n d D o c u m e n t S e r v i c e s R e v e n u e b y S e r v i c e S e g m e n t , 2 0 0 5 – 2 0 1 4 ( $ B )
2005 2006 2007 2008 2009 2010 2011 2012 2013 20142009–2014 CAGR (%)
Imaging and document archival services
United States 4.4 4.6 5.0 5.5 6.0 6.8 7.7 8.8 9.9 11.2 13.3
Growth (%) NA 6.5 7.6 9.1 10.0 13.6 13.7 13.2 13.2 12.9
Worldwide 9.4 10.0 10.8 11.9 13.3 15.4 17.8 20.1 22.8 25.7 14.1
Growth (%) NA 6.5 7.9 10.3 11.7 15.8 15.6 13.2 13.2 12.9
Total
United States 21.9 23.1 24.6 26.4 28.6 30.5 32.8 35.3 38.0 41.1 7.6
Growth (%) NA 5.5 6.4 7.6 8.1 6.9 7.4 7.6 7.7 8.1
Worldwide 47.5 49.9 52.9 57.1 60.6 65.2 70.6 76.6 83.1 90.4 8.3
Growth (%) NA 5.0 6.1 7.9 6.1 7.6 8.3 8.4 8.5 8.8
Note: See Table 18 for key forecast assumptions.
Source: IDC, August 2010
©2010 IDC #224913 45
T A B L E 1 8
K e y F o r e c a s t A s s u m p t i o n s f o r t h e W o r l d w i d e a n d U . S . O u t s o u r c e d P r i n t a n d D o c u m e n t S e r v i c e s M a r k e t s , 2 0 1 0 – 2 0 1 4
Market Force IDC Assumption Impact
Accelerator/Inhibitor/Neutral
Certainty of Assumption
Macroeconomics
Economy IDC assumes that worldwide economic growth will rebound to 3.2% in both 2010 and 2011. During the first half of 2010, the forecast trended slightly up. IDC will continue to take a mild downside view of GDP forecasts from Consensus Economics. Assumptions for 2010 are the United States 3.0%, Western Europe 1.1%, and Japan 2.8%.
High. Macroeconomic conditions are still improving around the world, although issues in Europe have increased the likelihood of a downside.
Crisis duration/potential relapse
IDC is assuming that the economic turnaround is well under way in 2010 and that there will not be a double-dip recession. Nevertheless, with debt issues in Europe, the volatility of this assumption remains high.
High. The upside would be that the recovery is faster than most economists expect; the downside would be that there is another downturn as an echo of the one we have just been through. The latter is probably more likely.
Inflation Inflation driven by higher oil and commodity prices has been taken off the table. At the same time, worries about deflation have abated.
High. The upside would be continued low inflation and a cautious approach to reining it in; the downside would be the possibility of deflation.
Exchange rates The financial crisis has caused gyrations in dollar exchange rates, which went up and down precipitously in 2009. In 2010, the dollar has fallen against the yen but gone up against the euro. For the purposes of IT forecasts, IDC assumes no major impact on overall demand. There will be a difference in demand growth, however, and "as reported"vendor revenue.
Moderate. The upside would be migration to a stable rate; the downside would be daily fluctuations.
46 #224913 ©2010 IDC
T A B L E 1 8
K e y F o r e c a s t A s s u m p t i o n s f o r t h e W o r l d w i d e a n d U . S . O u t s o u r c e d P r i n t a n d D o c u m e n t S e r v i c e s M a r k e t s , 2 0 1 0 – 2 0 1 4
Market Force IDC Assumption Impact
Accelerator/Inhibitor/Neutral
Certainty of Assumption
Technology services
Cloud services Cloud services is IDC's name for what we believe will become a new paradigm of computing over the next several decades — the logical evolution of what we have called "dynamic IT" for years. It entails shared access to virtualized resources over the Internet. A detailed definition and research about cloud services can be found at www.idc.com. IDC predicts that cloud services (public cloud) will increase 34% in 2010 to nearly $22 billion, or about 1.6% of IT spending, and that percentage should increase to 3% by 2014.
High. The upside would be evolution to a new form of computing that optimizes management of complexity across multiple customers, freeing them up to do more creative IT initiatives. The downside would be glacial adoption as a result of user inertia and vendor created "fear, uncertainty, and doubt."
Software industry transformation
The software industry is going through a major transformation, from basic architecture (service-oriented architecture [SOA]) and the way software is written (composite applications) to the way software is delivered (software as a service) and even funded (advertising based). IDC assumes that this transformation will take a decade but that it will, when done, allow for much faster and more dynamic delivery of software functionality.
High. The upside would be that the new software paradigm offers the solution to the software complexity crisis; the downside would be that the industry destroys itself in the process.

©2010 IDC #224913 47
T A B L E 1 8
K e y F o r e c a s t A s s u m p t i o n s f o r t h e W o r l d w i d e a n d U . S . O u t s o u r c e d P r i n t a n d D o c u m e n t S e r v i c e s M a r k e t s , 2 0 1 0 – 2 0 1 4
Market Force IDC Assumption Impact
Accelerator/Inhibitor/Neutral
Certainty of Assumption
Service industry transformation
This is a long, slow process involving the rise of offshore IT services, the increased integration of IT services inside business services, and the advent of new service delivery models. Most firms have developed a multishoring capability and blended pricing model and are now working on ways to standardize on technologies and methodologies, deliver services online or in new form factors, invest in datacenters, and expand into business services. Despite the race to automate service creation and delivery, there is a looming talent shortage. The economic crisis will be good for outsourcing markets but bad for project-based services.
High. The upside would be a stimulation of the IT services market via online delivery of services, which would drive up demand and accelerate a migration of internal spending to external spending; the downside would be general industry disruption and customer confusion.
Sector impact
Services Services markets, down nearly 3% in 2009, should rebound to close to 2% growth in 2010 and 4% in 2011. The rebound will be strongest in implementation services as new projects come online.
High. The upside would be companies reducing head count to cut fixed costs and relying on services firms for labor; the downside would be retrenchment on external spending before cutting staff.
Overall outsourcing service developments
Market transition Awareness of managed document services is rising, particularly in the area of managed print services.
High. Adoption of managed document services/document outsourcing will increase.
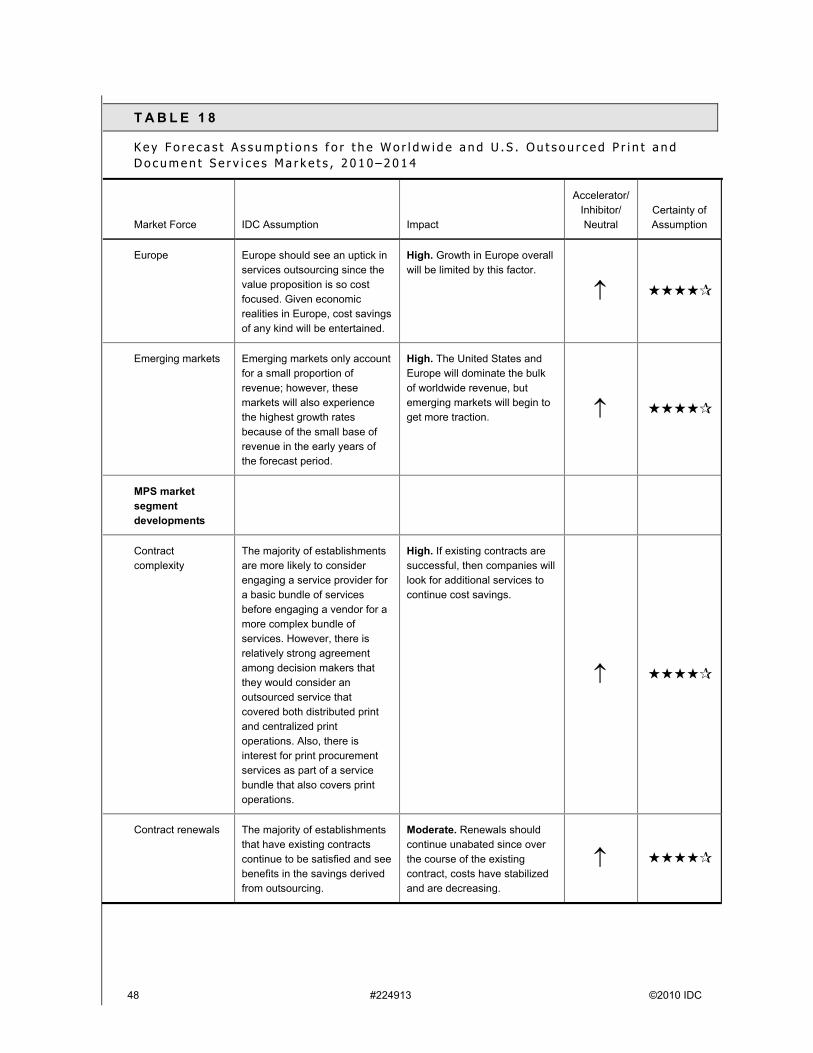
48 #224913 ©2010 IDC
T A B L E 1 8
K e y F o r e c a s t A s s u m p t i o n s f o r t h e W o r l d w i d e a n d U . S . O u t s o u r c e d P r i n t a n d D o c u m e n t S e r v i c e s M a r k e t s , 2 0 1 0 – 2 0 1 4
Market Force IDC Assumption Impact
Accelerator/Inhibitor/Neutral
Certainty of Assumption
Europe Europe should see an uptick in services outsourcing since the value proposition is so cost focused. Given economic realities in Europe, cost savings of any kind will be entertained.
High. Growth in Europe overall will be limited by this factor.
Emerging markets Emerging markets only account for a small proportion of revenue; however, these markets will also experience the highest growth rates because of the small base of revenue in the early years of the forecast period.
High. The United States and Europe will dominate the bulk of worldwide revenue, but emerging markets will begin to get more traction.
MPS market segment developments
Contract complexity
The majority of establishments are more likely to consider engaging a service provider for a basic bundle of services before engaging a vendor for a more complex bundle of services. However, there is relatively strong agreement among decision makers that they would consider an outsourced service that covered both distributed print and centralized print operations. Also, there is interest for print procurement services as part of a service bundle that also covers print operations.
High. If existing contracts are successful, then companies will look for additional services to continue cost savings.
Contract renewals The majority of establishments that have existing contracts continue to be satisfied and see benefits in the savings derived from outsourcing.
Moderate. Renewals should continue unabated since over the course of the existing contract, costs have stabilized and are decreasing.
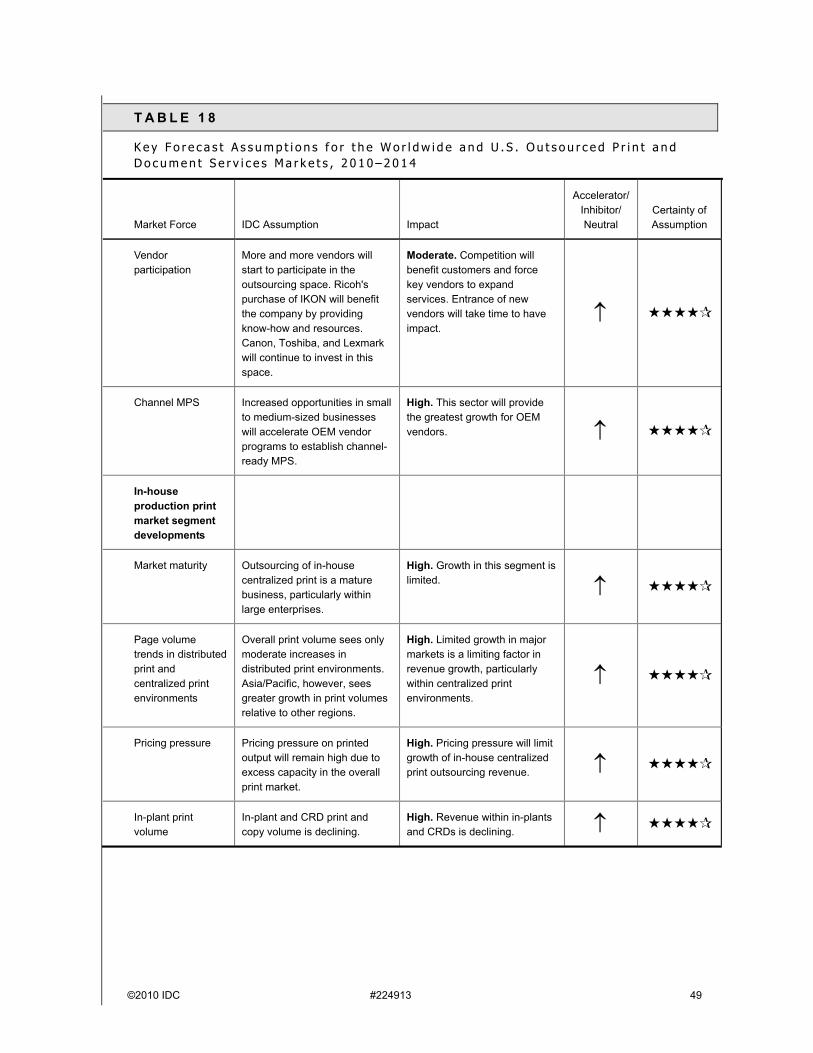
©2010 IDC #224913 49
T A B L E 1 8
K e y F o r e c a s t A s s u m p t i o n s f o r t h e W o r l d w i d e a n d U . S . O u t s o u r c e d P r i n t a n d D o c u m e n t S e r v i c e s M a r k e t s , 2 0 1 0 – 2 0 1 4
Market Force IDC Assumption Impact
Accelerator/Inhibitor/Neutral
Certainty of Assumption
Vendor participation
More and more vendors will start to participate in the outsourcing space. Ricoh's purchase of IKON will benefit the company by providing know-how and resources. Canon, Toshiba, and Lexmark will continue to invest in this space.
Moderate. Competition will benefit customers and force key vendors to expand services. Entrance of newvendors will take time to have impact.
Channel MPS Increased opportunities in small to medium-sized businesses will accelerate OEM vendor programs to establish channel-ready MPS.
High. This sector will provide the greatest growth for OEM vendors.
In-house production print market segment developments
Market maturity Outsourcing of in-house centralized print is a mature business, particularly within large enterprises.
High. Growth in this segment is limited.
Page volume trends in distributed print and centralized print environments
Overall print volume sees only moderate increases in distributed print environments. Asia/Pacific, however, sees greater growth in print volumes relative to other regions.
High. Limited growth in major markets is a limiting factor in revenue growth, particularly within centralized print environments.
Pricing pressure Pricing pressure on printed output will remain high due to excess capacity in the overall print market.
High. Pricing pressure will limit growth of in-house centralized print outsourcing revenue.
In-plant print volume
In-plant and CRD print and copy volume is declining.
High. Revenue within in-plants and CRDs is declining.
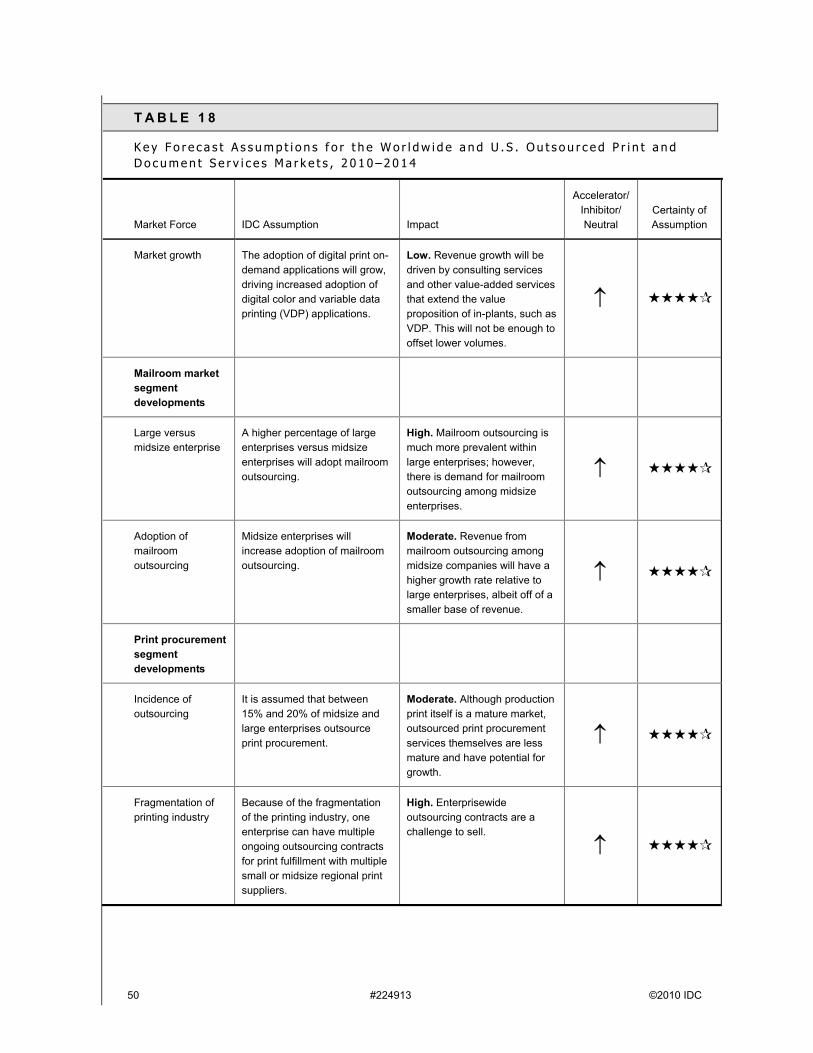
50 #224913 ©2010 IDC
T A B L E 1 8
K e y F o r e c a s t A s s u m p t i o n s f o r t h e W o r l d w i d e a n d U . S . O u t s o u r c e d P r i n t a n d D o c u m e n t S e r v i c e s M a r k e t s , 2 0 1 0 – 2 0 1 4
Market Force IDC Assumption Impact
Accelerator/Inhibitor/Neutral
Certainty of Assumption
Market growth The adoption of digital print on-demand applications will grow, driving increased adoption of digital color and variable data printing (VDP) applications.
Low. Revenue growth will be driven by consulting services and other value-added services that extend the value proposition of in-plants, such as VDP. This will not be enough to offset lower volumes.
Mailroom market segment developments
Large versus midsize enterprise
A higher percentage of large enterprises versus midsize enterprises will adopt mailroom outsourcing.
High. Mailroom outsourcing is much more prevalent within large enterprises; however, there is demand for mailroom outsourcing among midsize enterprises.
Adoption of mailroom outsourcing
Midsize enterprises will increase adoption of mailroom outsourcing.
Moderate. Revenue from mailroom outsourcing among midsize companies will have a higher growth rate relative to large enterprises, albeit off of a smaller base of revenue.
Print procurement segment developments
Incidence of outsourcing
It is assumed that between 15% and 20% of midsize and large enterprises outsource print procurement.
Moderate. Although production print itself is a mature market, outsourced print procurement services themselves are less mature and have potential for growth.
Fragmentation of printing industry
Because of the fragmentation of the printing industry, one enterprise can have multiple ongoing outsourcing contracts for print fulfillment with multiple small or midsize regional print suppliers.
High. Enterprisewide outsourcing contracts are a challenge to sell.
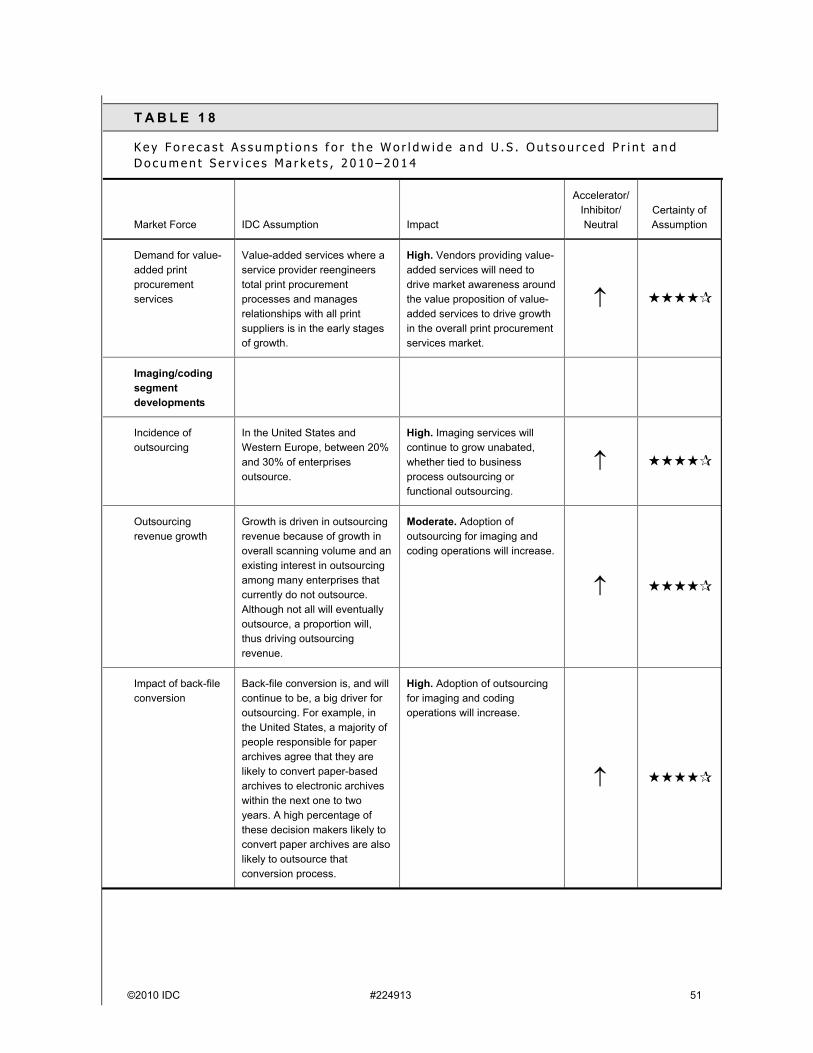
©2010 IDC #224913 51
T A B L E 1 8
K e y F o r e c a s t A s s u m p t i o n s f o r t h e W o r l d w i d e a n d U . S . O u t s o u r c e d P r i n t a n d D o c u m e n t S e r v i c e s M a r k e t s , 2 0 1 0 – 2 0 1 4
Market Force IDC Assumption Impact
Accelerator/Inhibitor/Neutral
Certainty of Assumption
Demand for value-added print procurement services
Value-added services where a service provider reengineers total print procurement processes and manages relationships with all print suppliers is in the early stages of growth.
High. Vendors providing value-added services will need to drive market awareness around the value proposition of value-added services to drive growth in the overall print procurement services market.
Imaging/coding segment developments
Incidence of outsourcing
In the United States and Western Europe, between 20% and 30% of enterprises outsource.
High. Imaging services will continue to grow unabated, whether tied to business process outsourcing or functional outsourcing.
Outsourcing revenue growth
Growth is driven in outsourcing revenue because of growth in overall scanning volume and an existing interest in outsourcing among many enterprises that currently do not outsource. Although not all will eventually outsource, a proportion will, thus driving outsourcing revenue.
Moderate. Adoption of outsourcing for imaging and coding operations will increase.
Impact of back-file conversion
Back-file conversion is, and will continue to be, a big driver for outsourcing. For example, in the United States, a majority of people responsible for paper archives agree that they are likely to convert paper-based archives to electronic archives within the next one to two years. A high percentage of these decision makers likely to convert paper archives are also likely to outsource that conversion process.
High. Adoption of outsourcing for imaging and coding operations will increase.
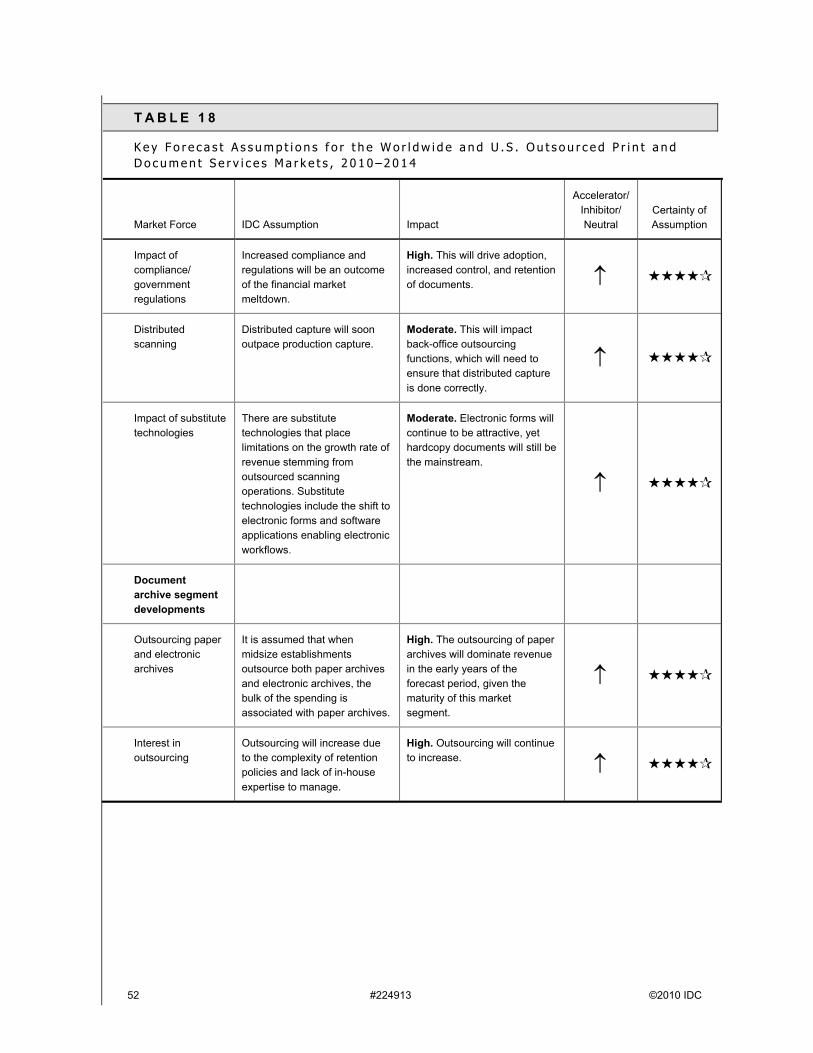
52 #224913 ©2010 IDC
T A B L E 1 8
K e y F o r e c a s t A s s u m p t i o n s f o r t h e W o r l d w i d e a n d U . S . O u t s o u r c e d P r i n t a n d D o c u m e n t S e r v i c e s M a r k e t s , 2 0 1 0 – 2 0 1 4
Market Force IDC Assumption Impact
Accelerator/Inhibitor/Neutral
Certainty of Assumption
Impact of compliance/government regulations
Increased compliance and regulations will be an outcome of the financial market meltdown.
High. This will drive adoption, increased control, and retention of documents.
Distributed scanning
Distributed capture will soon outpace production capture.
Moderate. This will impact back-office outsourcing functions, which will need to ensure that distributed capture is done correctly.
Impact of substitute technologies
There are substitute technologies that place limitations on the growth rate of revenue stemming from outsourced scanning operations. Substitute technologies include the shift to electronic forms and software applications enabling electronic workflows.
Moderate. Electronic forms will continue to be attractive, yet hardcopy documents will still be the mainstream.
Document archive segment developments
Outsourcing paper and electronic archives
It is assumed that when midsize establishments outsource both paper archives and electronic archives, the bulk of the spending is associated with paper archives.
High. The outsourcing of paper archives will dominate revenue in the early years of the forecast period, given the maturity of this market segment.
Interest in outsourcing
Outsourcing will increase due to the complexity of retention policies and lack of in-house expertise to manage.
High. Outsourcing will continue to increase.

©2010 IDC #224913 53
T A B L E 1 8
K e y F o r e c a s t A s s u m p t i o n s f o r t h e W o r l d w i d e a n d U . S . O u t s o u r c e d P r i n t a n d D o c u m e n t S e r v i c e s M a r k e t s , 2 0 1 0 – 2 0 1 4
Market Force IDC Assumption Impact
Accelerator/Inhibitor/Neutral
Certainty of Assumption
Business process outsourcing
Business outsourcing: large enterprises
Large enterprises, particularly international firms, will expand outsourced services to trusted BPO players.
Moderate. This is business as usual for large enterprises today.
Business outsourcing: midsize enterprises
Midsize enterprises will be wooed by BPO players that are recasting their offerings to meet specific needs of this market.
High. These should represent a significant opportunity for both large and regional BPO players.
Legend: very low, low, moderate, high, very high
Source: IDC, August 2010
M a r k e t C o n t e x t
The market forecast has changed, and Tables 19–21 and Figures 8–12 reflect the differences in the 2008 (see Worldwide and U.S. Outsourced Print and Document Services 2008–2012 Forecast and Analysis, IDC #215289, December 2008) and 2010 forecasts.
Both the in-house production print and print procurement forecasts are noticeably higher than our previous forecasts since this year we also include medium-sized companies, which were not counted in the past.
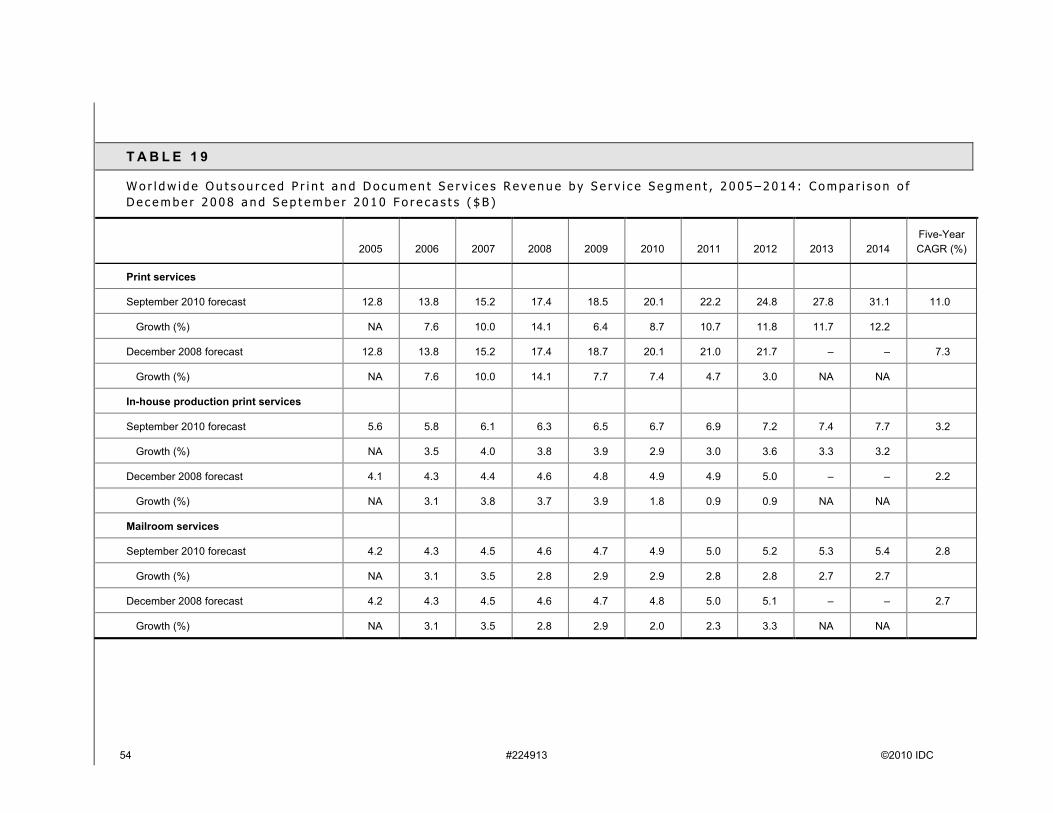
54 #224913 ©2010 IDC
T A B L E 1 9
W o r l d w i d e O u t s o u r c e d P r i n t a n d D o c u m e n t S e r v i c e s R e v e n u e b y S e r v i c e S e g m e n t , 2 0 0 5 – 2 0 1 4 : C o m p a r i s o n o f D e c e m b e r 2 0 0 8 a n d S e p t e m b e r 2 0 1 0 F o r e c a s t s ( $ B )
2005 2006 2007 2008 2009 2010 2011 2012 2013 2014Five-Year CAGR (%)
Print services
September 2010 forecast 12.8 13.8 15.2 17.4 18.5 20.1 22.2 24.8 27.8 31.1 11.0
Growth (%) NA 7.6 10.0 14.1 6.4 8.7 10.7 11.8 11.7 12.2
December 2008 forecast 12.8 13.8 15.2 17.4 18.7 20.1 21.0 21.7 – – 7.3
Growth (%) NA 7.6 10.0 14.1 7.7 7.4 4.7 3.0 NA NA
In-house production print services
September 2010 forecast 5.6 5.8 6.1 6.3 6.5 6.7 6.9 7.2 7.4 7.7 3.2
Growth (%) NA 3.5 4.0 3.8 3.9 2.9 3.0 3.6 3.3 3.2
December 2008 forecast 4.1 4.3 4.4 4.6 4.8 4.9 4.9 5.0 – – 2.2
Growth (%) NA 3.1 3.8 3.7 3.9 1.8 0.9 0.9 NA NA
Mailroom services
September 2010 forecast 4.2 4.3 4.5 4.6 4.7 4.9 5.0 5.2 5.3 5.4 2.8
Growth (%) NA 3.1 3.5 2.8 2.9 2.9 2.8 2.8 2.7 2.7
December 2008 forecast 4.2 4.3 4.5 4.6 4.7 4.8 5.0 5.1 – – 2.7
Growth (%) NA 3.1 3.5 2.8 2.9 2.0 2.3 3.3 NA NA
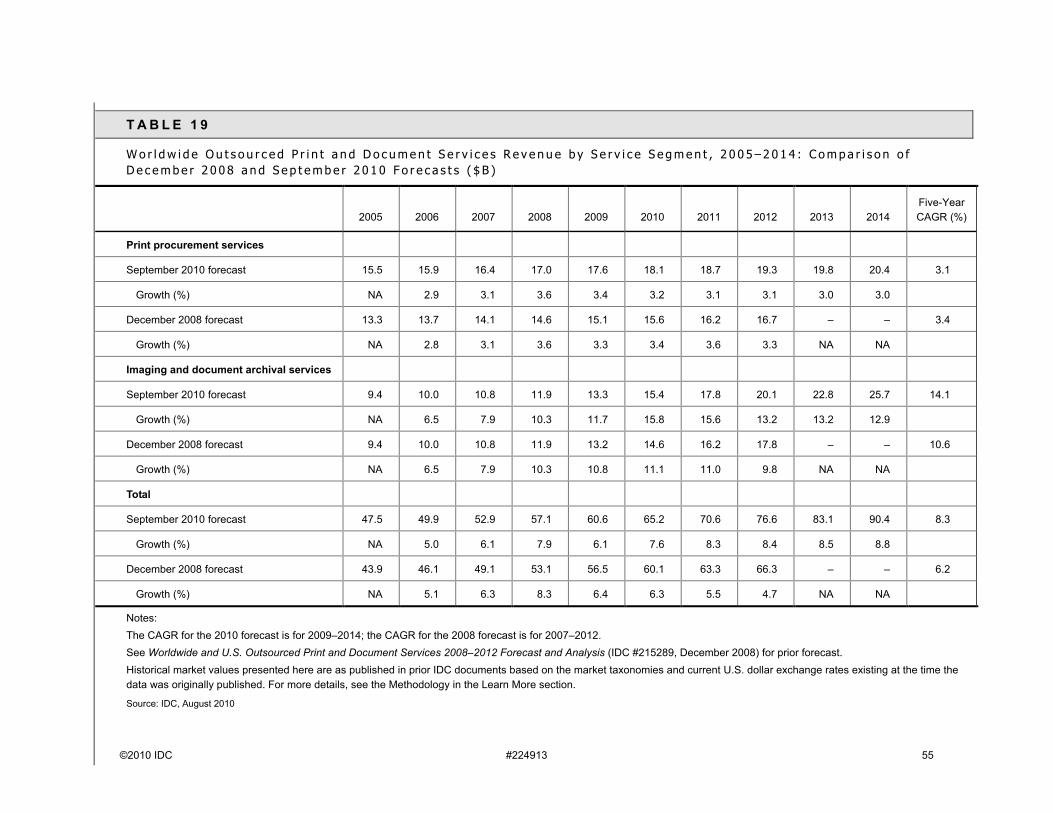
©2010 IDC #224913 55
T A B L E 1 9
W o r l d w i d e O u t s o u r c e d P r i n t a n d D o c u m e n t S e r v i c e s R e v e n u e b y S e r v i c e S e g m e n t , 2 0 0 5 – 2 0 1 4 : C o m p a r i s o n o f D e c e m b e r 2 0 0 8 a n d S e p t e m b e r 2 0 1 0 F o r e c a s t s ( $ B )
2005 2006 2007 2008 2009 2010 2011 2012 2013 2014Five-Year CAGR (%)
Print procurement services
September 2010 forecast 15.5 15.9 16.4 17.0 17.6 18.1 18.7 19.3 19.8 20.4 3.1
Growth (%) NA 2.9 3.1 3.6 3.4 3.2 3.1 3.1 3.0 3.0
December 2008 forecast 13.3 13.7 14.1 14.6 15.1 15.6 16.2 16.7 – – 3.4
Growth (%) NA 2.8 3.1 3.6 3.3 3.4 3.6 3.3 NA NA
Imaging and document archival services
September 2010 forecast 9.4 10.0 10.8 11.9 13.3 15.4 17.8 20.1 22.8 25.7 14.1
Growth (%) NA 6.5 7.9 10.3 11.7 15.8 15.6 13.2 13.2 12.9
December 2008 forecast 9.4 10.0 10.8 11.9 13.2 14.6 16.2 17.8 – – 10.6
Growth (%) NA 6.5 7.9 10.3 10.8 11.1 11.0 9.8 NA NA
Total
September 2010 forecast 47.5 49.9 52.9 57.1 60.6 65.2 70.6 76.6 83.1 90.4 8.3
Growth (%) NA 5.0 6.1 7.9 6.1 7.6 8.3 8.4 8.5 8.8
December 2008 forecast 43.9 46.1 49.1 53.1 56.5 60.1 63.3 66.3 – – 6.2
Growth (%) NA 5.1 6.3 8.3 6.4 6.3 5.5 4.7 NA NA
Notes:The CAGR for the 2010 forecast is for 2009–2014; the CAGR for the 2008 forecast is for 2007–2012.See Worldwide and U.S. Outsourced Print and Document Services 2008–2012 Forecast and Analysis (IDC #215289, December 2008) for prior forecast.Historical market values presented here are as published in prior IDC documents based on the market taxonomies and current U.S. dollar exchange rates existing at the time the data was originally published. For more details, see the Methodology in the Learn More section.
Source: IDC, August 2010
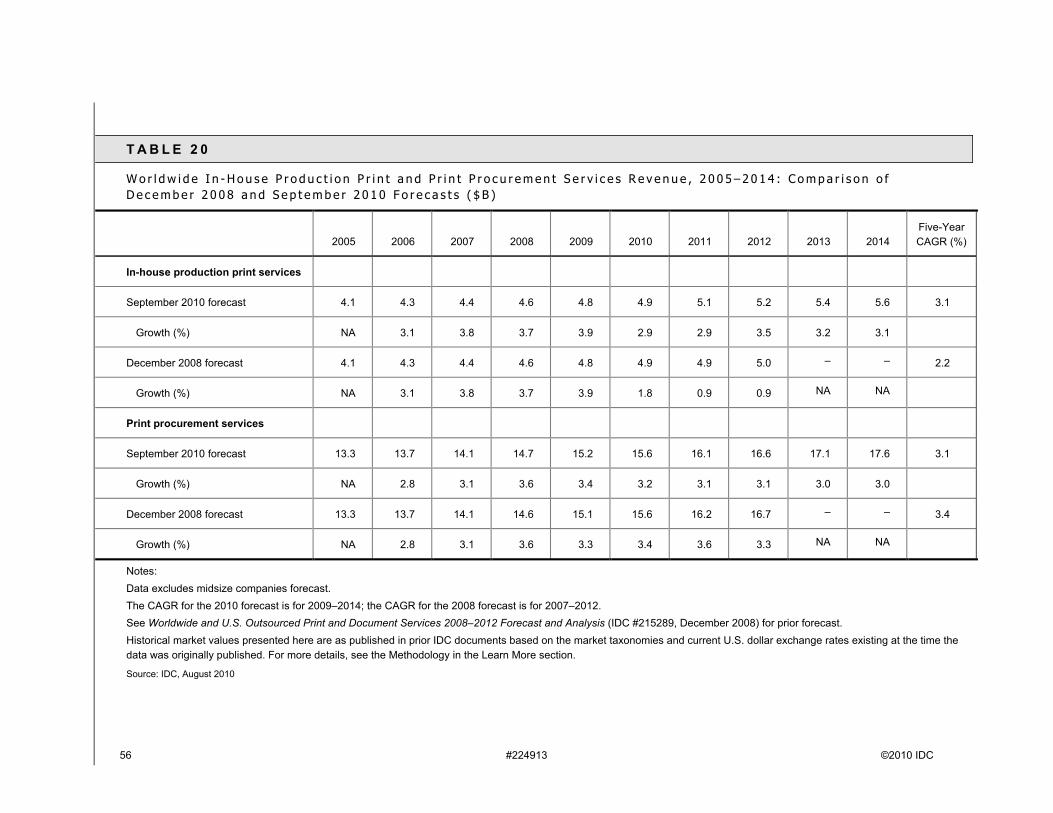
56 #224913 ©2010 IDC
T A B L E 2 0
W o r l d w i d e I n - H o u s e P r o d u c t i o n P r i n t a n d P r i n t P r o c u r e m e n t S e r v i c e s R e v e n u e , 2 0 0 5 – 2 0 1 4 : C o m p a r i s o n o f D e c e m b e r 2 0 0 8 a n d S e p t e m b e r 2 0 1 0 F o r e c a s t s ( $ B )
2005 2006 2007 2008 2009 2010 2011 2012 2013 2014Five-Year CAGR (%)
In-house production print services
September 2010 forecast 4.1 4.3 4.4 4.6 4.8 4.9 5.1 5.2 5.4 5.6 3.1
Growth (%) NA 3.1 3.8 3.7 3.9 2.9 2.9 3.5 3.2 3.1
December 2008 forecast 4.1 4.3 4.4 4.6 4.8 4.9 4.9 5.0 – – 2.2
Growth (%) NA 3.1 3.8 3.7 3.9 1.8 0.9 0.9 NA NA
Print procurement services
September 2010 forecast 13.3 13.7 14.1 14.7 15.2 15.6 16.1 16.6 17.1 17.6 3.1
Growth (%) NA 2.8 3.1 3.6 3.4 3.2 3.1 3.1 3.0 3.0
December 2008 forecast 13.3 13.7 14.1 14.6 15.1 15.6 16.2 16.7 – – 3.4
Growth (%) NA 2.8 3.1 3.6 3.3 3.4 3.6 3.3 NA NA
Notes:Data excludes midsize companies forecast.The CAGR for the 2010 forecast is for 2009–2014; the CAGR for the 2008 forecast is for 2007–2012.See Worldwide and U.S. Outsourced Print and Document Services 2008–2012 Forecast and Analysis (IDC #215289, December 2008) for prior forecast.Historical market values presented here are as published in prior IDC documents based on the market taxonomies and current U.S. dollar exchange rates existing at the time the data was originally published. For more details, see the Methodology in the Learn More section.
Source: IDC, August 2010
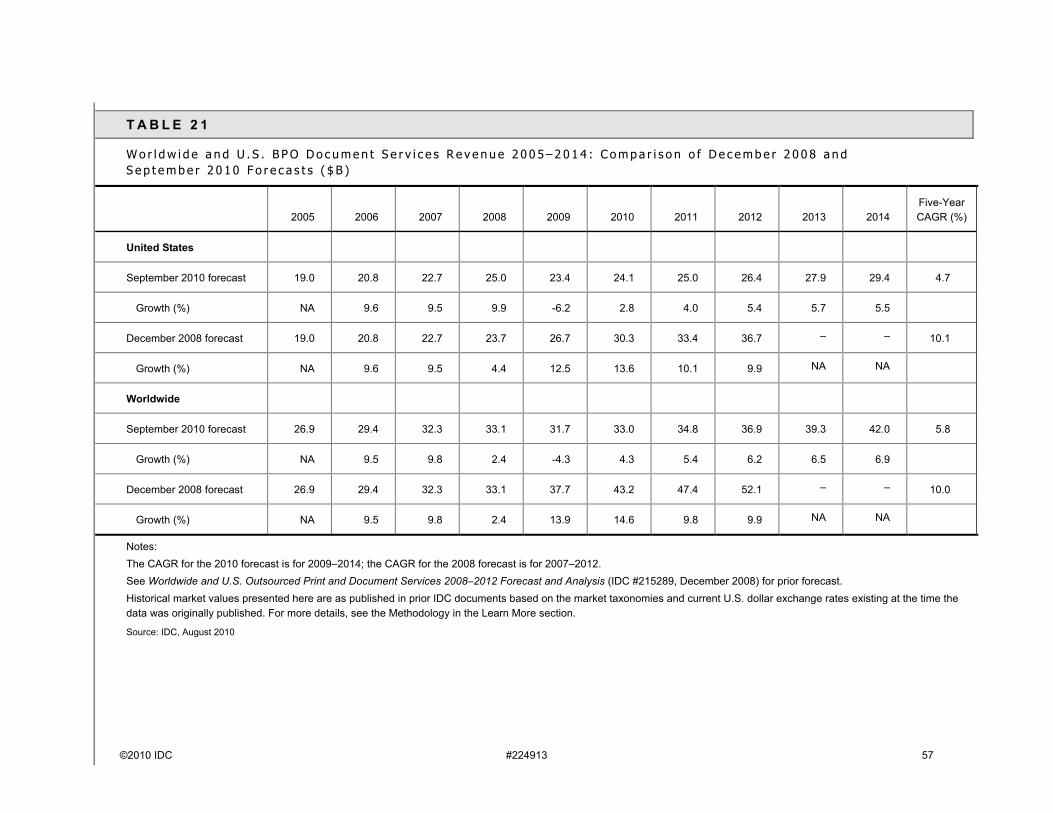
©2010 IDC #224913 57
T A B L E 2 1
W o r l d w i d e a n d U . S . B P O D o c u m e n t S e r v i c e s R e v e n u e 2 0 0 5 – 2 0 1 4 : C o m p a r i s o n o f D e c e m b e r 2 0 0 8 a n d S e p t e m b e r 2 0 1 0 F o r e c a s t s ( $ B )
2005 2006 2007 2008 2009 2010 2011 2012 2013 2014Five-Year CAGR (%)
United States
September 2010 forecast 19.0 20.8 22.7 25.0 23.4 24.1 25.0 26.4 27.9 29.4 4.7
Growth (%) NA 9.6 9.5 9.9 -6.2 2.8 4.0 5.4 5.7 5.5
December 2008 forecast 19.0 20.8 22.7 23.7 26.7 30.3 33.4 36.7 – – 10.1
Growth (%) NA 9.6 9.5 4.4 12.5 13.6 10.1 9.9 NA NA
Worldwide
September 2010 forecast 26.9 29.4 32.3 33.1 31.7 33.0 34.8 36.9 39.3 42.0 5.8
Growth (%) NA 9.5 9.8 2.4 -4.3 4.3 5.4 6.2 6.5 6.9
December 2008 forecast 26.9 29.4 32.3 33.1 37.7 43.2 47.4 52.1 – – 10.0
Growth (%) NA 9.5 9.8 2.4 13.9 14.6 9.8 9.9 NA NA
Notes:The CAGR for the 2010 forecast is for 2009–2014; the CAGR for the 2008 forecast is for 2007–2012.See Worldwide and U.S. Outsourced Print and Document Services 2008–2012 Forecast and Analysis (IDC #215289, December 2008) for prior forecast.Historical market values presented here are as published in prior IDC documents based on the market taxonomies and current U.S. dollar exchange rates existing at the time the data was originally published. For more details, see the Methodology in the Learn More section.
Source: IDC, August 2010
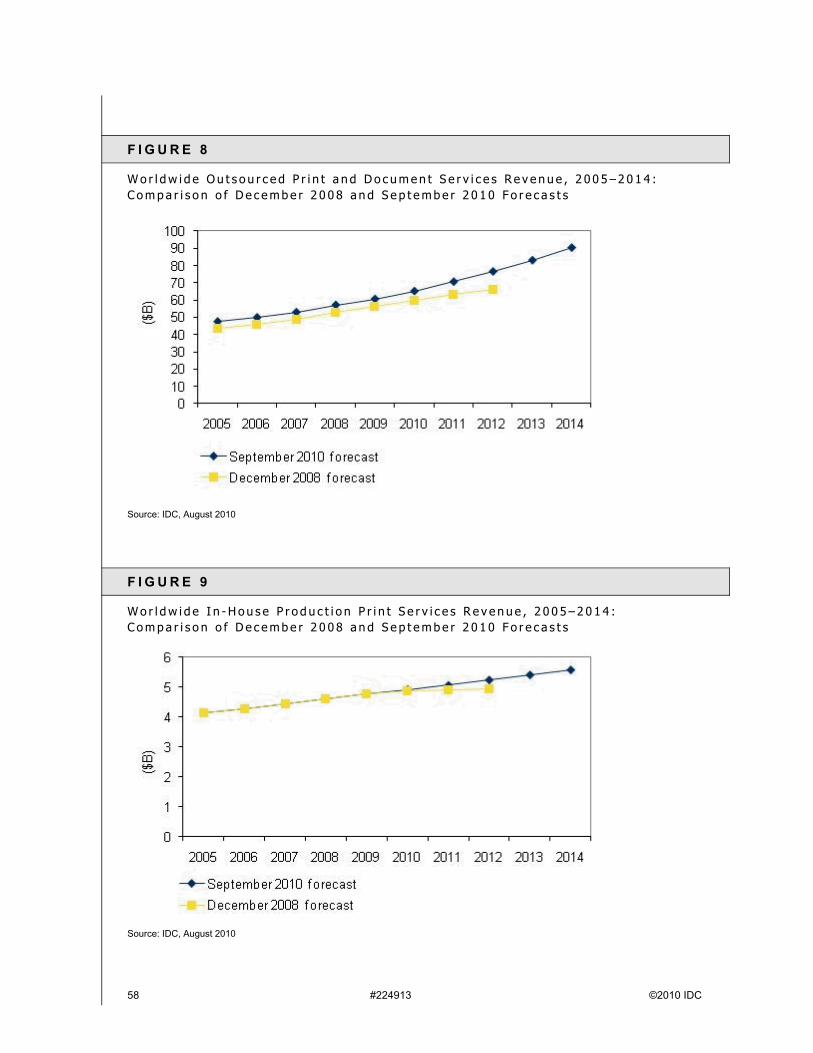
58 #224913 ©2010 IDC
F I G U R E 8
W o r l d w i d e O u t s o u r c e d P r i n t a n d D o c u m e n t S e r v i c e s R e v e n u e , 2 0 0 5 – 2 0 1 4 : C o m p a r i s o n o f D e c e m b e r 2 0 0 8 a n d S e p t e m b e r 2 0 1 0 F o r e c a s t s
Source: IDC, August 2010
F I G U R E 9
W o r l d w i d e I n - H o u s e P r o d u c t i o n P r i n t S e r v i c e s R e v e n u e , 2 0 0 5 – 2 0 1 4 : C o m p a r i s o n o f D e c e m b e r 2 0 0 8 a n d S e p t e m b e r 2 0 1 0 F o r e c a s t s
Source: IDC, August 2010
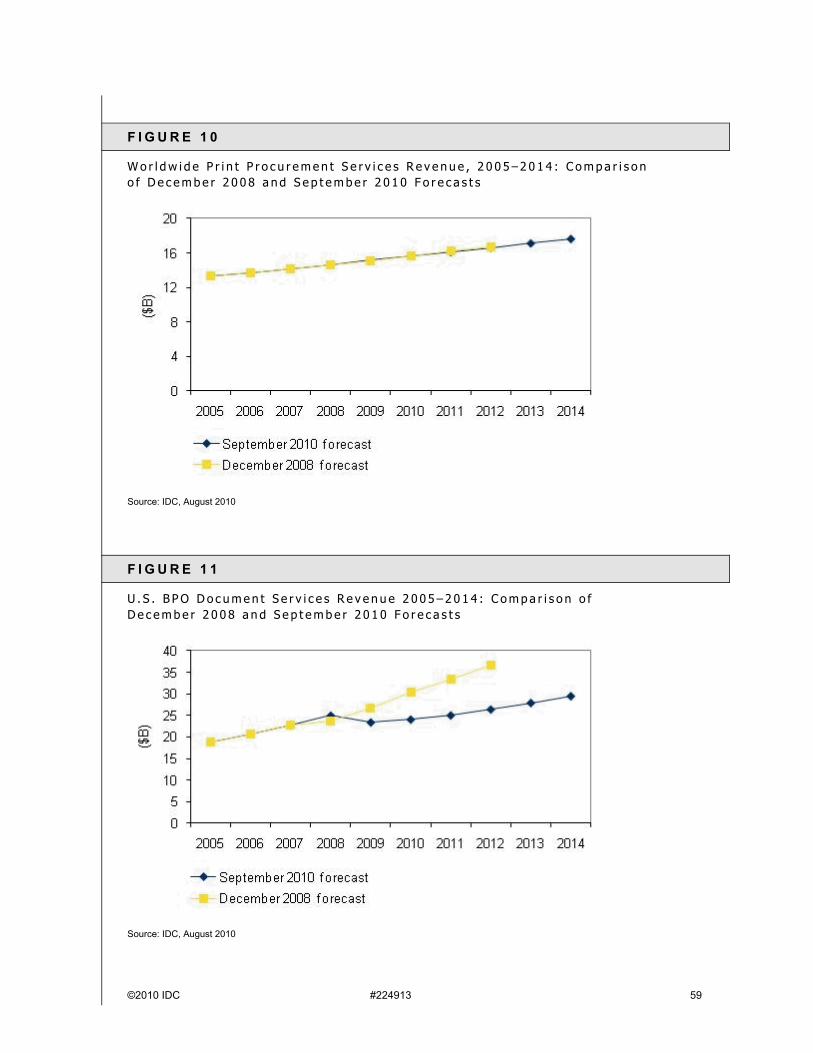
©2010 IDC #224913 59
F I G U R E 1 0
W o r l d w i d e P r i n t P r o c u r e m e n t S e r v i c e s R e v e n u e , 2 0 0 5 – 2 0 1 4 : C o m p a r i s o n o f D e c e m b e r 2 0 0 8 a n d S e p t e m b e r 2 0 1 0 F o r e c a s t s
Source: IDC, August 2010
F I G U R E 1 1
U . S . B P O D o c u m e n t S e r v i c e s R e v e n u e 2 0 0 5 – 2 0 1 4 : C o m p a r i s o n o f D e c e m b e r 2 0 0 8 a n d S e p t e m b e r 2 0 1 0 F o r e c a s t s
Source: IDC, August 2010
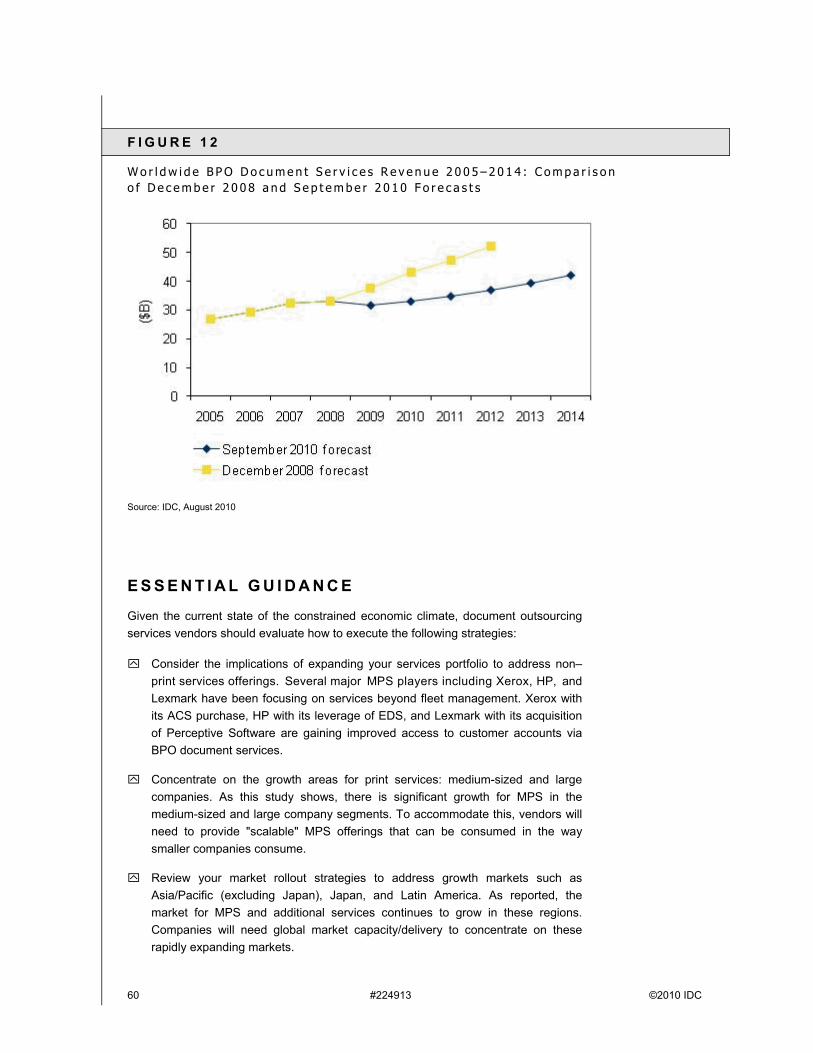
60 #224913 ©2010 IDC
F I G U R E 1 2
W o r l d w i d e B P O D o c u m e n t S e r v i c e s R e v e n u e 2 0 0 5 – 2 0 1 4 : C o m p a r i s o n o f D e c e m b e r 2 0 0 8 a n d S e p t e m b e r 2 0 1 0 F o r e c a s t s
Source: IDC, August 2010
E S S E N T I A L G U I D A N C E
Given the current state of the constrained economic climate, document outsourcing services vendors should evaluate how to execute the following strategies:
Consider the implications of expanding your services portfolio to address non–print services offerings. Several major MPS players including Xerox, HP, and Lexmark have been focusing on services beyond fleet management. Xerox with its ACS purchase, HP with its leverage of EDS, and Lexmark with its acquisition of Perceptive Software are gaining improved access to customer accounts via BPO document services.
Concentrate on the growth areas for print services: medium-sized and large companies. As this study shows, there is significant growth for MPS in the medium-sized and large company segments. To accommodate this, vendors will need to provide "scalable" MPS offerings that can be consumed in the way smaller companies consume.
Review your market rollout strategies to address growth markets such as Asia/Pacific (excluding Japan), Japan, and Latin America. As reported, the market for MPS and additional services continues to grow in these regions.Companies will need global market capacity/delivery to concentrate on these rapidly expanding markets.

©2010 IDC #224913 61
Beyond MPS there is a very large market for improved business process optimization. Vendors should focus on all company sizes to address this and develop appropriate capabilities to support customer requirements.
Cloud computing and the value proposition that it offers from a scalable delivery perspective should be an important topic in services discussions betweenvendors and customers. The ability to provide service to corporations of all sizes will be a significant advantage to those vendors with cloud offerings,
L E A R N M O R E
R e l a t e d R e s e a r c h
Worldwide and U.S. MPS and Other Services — Demand by Company Size and Vertical Industry (IDC #224732, August 2010)
WW/U.S. MPS — Software Solutions, Hardcopy Devices, And Toner by Company Size And Vertical Industry (IDC #224733, August 2010)
WW/U.S. MPS — Adoption Drivers By Company Size, Vertical Industry, Year Contract Was Signed (IDC #224682, August 2010)
HP Makes Significant Enhancements to Its Enterprise MPS Offering (IDC #223578, June 2010)
Xerox Enterprise Print Services Enable Mobile Worker Printing — P&G to Benefit(IDC #223360, May 2010)
Ricoh "Brings the Best Together" at National Dealer Meeting (IDC #223343, May 2010)
FedEx Office, Canon Inc. and HP Sign Collaborative Deal — The Significance and Outlook (IDC #lcUS22310510, April 2010)
IDC MarketScape: Worldwide Managed Print Services 2010 Hardcopy Vendor Analysis (IDC #222872, April 2010)
ITEX 2010: A Conference in Transition (IDC #222510, March 2010)
Xerox Formalizes Its Enterprise Print Services Offering (IDC #lcUS22078809, November 2009)
M e t h o d o l o g y
Historical Market Values and Exchange Rates
Historical market values presented here are as published in prior IDC documents based on the market taxonomies and current U.S. dollar exchange rates existing at the time the data was originally published. For markets other than the United States, these as-published values are therefore based on a different exchange rate each year.
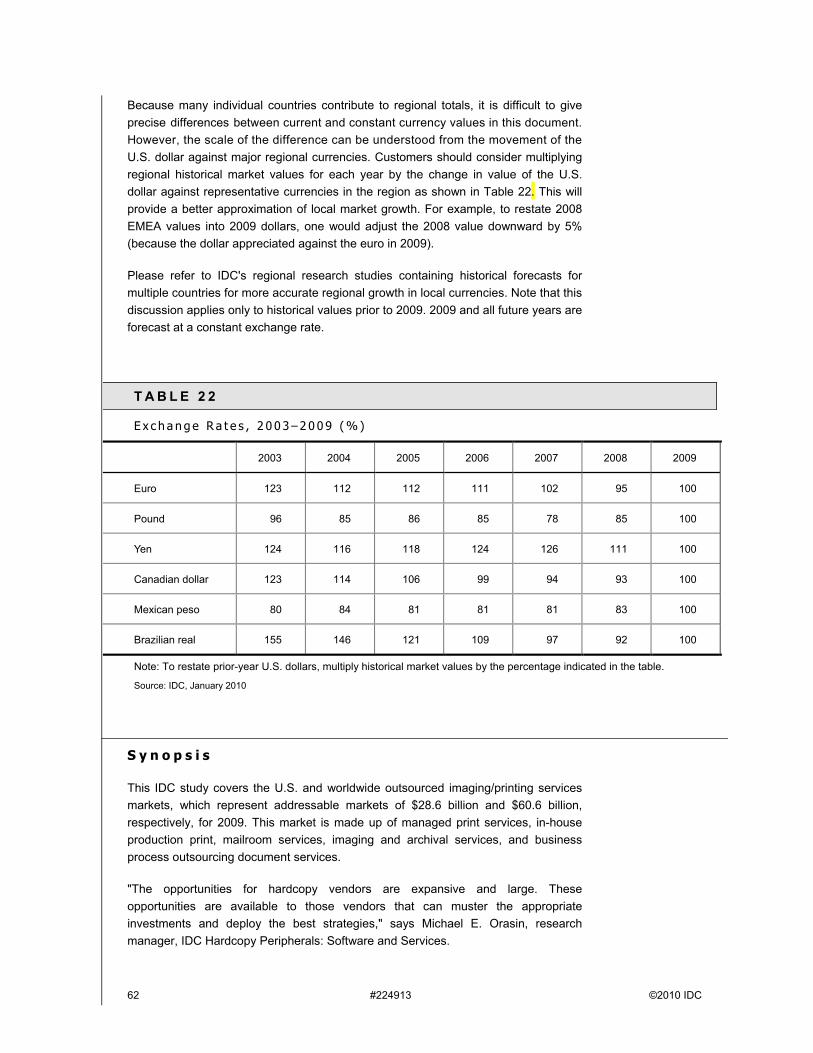
62 #224913 ©2010 IDC
Because many individual countries contribute to regional totals, it is difficult to give precise differences between current and constant currency values in this document. However, the scale of the difference can be understood from the movement of the U.S. dollar against major regional currencies. Customers should consider multiplying regional historical market values for each year by the change in value of the U.S. dollar against representative currencies in the region as shown in Table 22. This will provide a better approximation of local market growth. For example, to restate 2008 EMEA values into 2009 dollars, one would adjust the 2008 value downward by 5% (because the dollar appreciated against the euro in 2009).
Please refer to IDC's regional research studies containing historical forecasts for multiple countries for more accurate regional growth in local currencies. Note that this discussion applies only to historical values prior to 2009. 2009 and all future years are forecast at a constant exchange rate.
T A B L E 2 2
E x c h a n g e R a t e s , 2 0 0 3 – 2 0 0 9 ( % )
2003 2004 2005 2006 2007 2008 2009
Euro 123 112 112 111 102 95 100
Pound 96 85 86 85 78 85 100
Yen 124 116 118 124 126 111 100
Canadian dollar 123 114 106 99 94 93 100
Mexican peso 80 84 81 81 81 83 100
Brazilian real 155 146 121 109 97 92 100
Note: To restate prior-year U.S. dollars, multiply historical market values by the percentage indicated in the table.
Source: IDC, January 2010
S y n o p s i s
This IDC study covers the U.S. and worldwide outsourced imaging/printing services markets, which represent addressable markets of $28.6 billion and $60.6 billion,respectively, for 2009. This market is made up of managed print services, in-house production print, mailroom services, imaging and archival services, and business process outsourcing document services.
"The opportunities for hardcopy vendors are expansive and large. Theseopportunities are available to those vendors that can muster the appropriate investments and deploy the best strategies," says Michael E. Orasin, research manager, IDC Hardcopy Peripherals: Software and Services.
©2010 IDC #224913 63
C o p y r i g h t N o t i c e
This IDC research document was published as part of an IDC continuous intelligence service, providing written research, analyst interactions, telebriefings, and conferences. Visit www.idc.com to learn more about IDC subscription and consulting services. To view a list of IDC offices worldwide, visit www.idc.com/offices. Please contact the IDC Hotline at 800.343.4952, ext. 7988 (or +1.508.988.7988) or [email protected] for information on applying the price of this document toward the purchase of an IDC service or for information on additional copies or Web rights.
Copyright 2010 IDC. Reproduction is forbidden unless authorized. All rights reserved.