mapinfo proviewer user guide - eden consulting business insight products such as mapinfo...
TRANSCRIPT
MapInfo ProViewer10.5
USER GUIDE

Information in this document is subject to change without notice and does not represent a commitment on the part of the vendor or its representatives. No part of this document may be reproduced or transmitted in any form or by any means, electronic or mechanical, including photocopying, without the written permission of Pitney Bowes Software Inc., One Global View, Troy, New York 12180-8399.©2010 Pitney Bowes Software Inc. All rights reserved. MapInfo, Group 1 Software, and MapInfo ProViewer are trademarks of Pitney Bowes Software Inc. All other marks and trademarks are property of their respective holders.United States:Phone: 518.285.6000Fax: 518.285.6070Sales: 800.327.8627Government Sales: 800.619.2333Technical Support: 518.285.7283Technical Support Fax: 518.285.6080pbinsight.comCanada:Phone: 416.594.5200Fax: 416.594.5201Sales: 800.268.3282Technical Support:.518.285.7283Technical Support Fax: 518.285.6080pbinsight.caEurope/United Kingdom:Phone: +44.1753.848.200Fax: +44.1753.621.140 Technical Support: +44.1753.848.229 pbinsight.co.ukAsia Pacific/Australia:Phone: +61.2.9437.6255Fax: +61.2.9439.1773Technical Support: 1.800.648.899pbinsight.com.auContact information for all Pitney Bowes Software Inc. offices is located at: http://www.pbinsight.com/about/contact-us.Adobe Acrobat® is a registered trademark of Adobe Systems Incorporated in the United States.Products named herein may be trademarks of their respective manufacturers and are hereby recognized. Trademarked names are used editorially, to the benefit of the trademark owner, with no intent to infringe on the trademark.July 2010

MapInfo ProViewer 10.5 3 User Guide
Table of Contents
Chapter 1: Introduction to MapInfo ProViewer . . . . . . . . . . . . . . . . . . . . . . . . . . . . . . . . . . . . . . . . . . . . . . . . . . 5
System Requirements. . . . . . . . . . . . . . . . . . . . . . . . . . . . . . . . . . . . . . . . . . . . . . . . . . . . .6Installing MapInfo ProViewer . . . . . . . . . . . . . . . . . . . . . . . . . . . . . . . . . . . . . . . . . . . . . . .6What’s New in MapInfo ProViewer? . . . . . . . . . . . . . . . . . . . . . . . . . . . . . . . . . . . . . . . . .7
New in Proviewer 10.5 . . . . . . . . . . . . . . . . . . . . . . . . . . . . . . . . . . . . . . . . . . . . . . . . . . .7Displaying a Map in MapInfo ProViewer . . . . . . . . . . . . . . . . . . . . . . . . . . . . . . . . . . . . .13Understanding the ProViewer Toolbar . . . . . . . . . . . . . . . . . . . . . . . . . . . . . . . . . . . . . .14A Brief Tour of the World.wor Workspace . . . . . . . . . . . . . . . . . . . . . . . . . . . . . . . . . . .15
Using the Select Icon . . . . . . . . . . . . . . . . . . . . . . . . . . . . . . . . . . . . . . . . . . . . . . . . . . .15Using the Statistics Icon. . . . . . . . . . . . . . . . . . . . . . . . . . . . . . . . . . . . . . . . . . . . . . . . .16Using the Ruler Icon. . . . . . . . . . . . . . . . . . . . . . . . . . . . . . . . . . . . . . . . . . . . . . . . . . . .16Using the Zoom Icons . . . . . . . . . . . . . . . . . . . . . . . . . . . . . . . . . . . . . . . . . . . . . . . . . .17Displaying the Map Legend . . . . . . . . . . . . . . . . . . . . . . . . . . . . . . . . . . . . . . . . . . . . . .17
Getting Online Help. . . . . . . . . . . . . . . . . . . . . . . . . . . . . . . . . . . . . . . . . . . . . . . . . . . . . .18Getting Technical Support . . . . . . . . . . . . . . . . . . . . . . . . . . . . . . . . . . . . . . . . . . . . . . .18Want to do more? . . . . . . . . . . . . . . . . . . . . . . . . . . . . . . . . . . . . . . . . . . . . . . . . . . . . . . .19
Appendix A: Glossary . . . . . . . . . . . . . . . . . . . . . . . . . . . . . . . . . . . . . . . . . . . . . . . 20Index . . . . . . . . . . . . . . . . . . . . . . . . . . . . . . . . . . . . . . . . . . . . . . . . . . . . . . . . . . . . . 23

MapInfo ProViewer 10.5 4 User Guide

1
Introduction to MapInfo ProViewerMapInfo ProViewer provides an easy way to see, print, and share electronic desktop maps. This convenient map viewer opens tables created using Pitney Bowes Business Insight products such as MapInfo Professional or MapXtreme and displays them in Map and Browser windows. It also opens workspaces and re-creates Map, Browser, Graph, and Layout windows exactly as they were created in MapInfo Professional. Using this product you can display and print maps and workspaces created in any version of the Pitney Bowes Business Insight product line.
The purpose of this chapter is to familiarize you with the basics of MapInfo ProViewer and provide resources for you to become familiar with it. You can also get installation assistance from Technical Support, if necessary, using information in this document.
System Requirements . . . . . . . . . . . . . . . . . . . . . . . . . . . . . . . . . . . .6Installing MapInfo ProViewer . . . . . . . . . . . . . . . . . . . . . . . . . . . . . .6What’s New in MapInfo ProViewer? . . . . . . . . . . . . . . . . . . . . . . . . .7Displaying a Map in MapInfo ProViewer . . . . . . . . . . . . . . . . . . . .13Understanding the ProViewer Toolbar . . . . . . . . . . . . . . . . . . . . . .14A Brief Tour of the World.wor Workspace . . . . . . . . . . . . . . . . . . .15Getting Online Help . . . . . . . . . . . . . . . . . . . . . . . . . . . . . . . . . . . . .18Getting Technical Support. . . . . . . . . . . . . . . . . . . . . . . . . . . . . . . .18Want to do more?. . . . . . . . . . . . . . . . . . . . . . . . . . . . . . . . . . . . . . .19
Chapter 1: Introduction to MapInfo ProViewerSystem Requirements
System RequirementsThe following are supported operating systems with MapInfo ProViewer:
• Windows XP Professional SP3 • Windows Vista Ultimate SP2• Windows 7 Ultimate• Windows 7 Ultimate 64-bit • Windows 2008 Server• Windows 2008 Server with XenServer
Dependencies and Prerequisites
The MapInfo ProViewer install wizard checks for the following and prompts you if not already on your system; you can choose to have the install wizard install these requirements, or cancel the installation if you do not want to proceed.
• Microsoft Office Access database engine 2007 – the Access 2007 drivers (ACE)• Microsoft .NET Framework 3.5 SP1
Installing MapInfo ProViewerTo install MapInfo ProViewer:
1. Go to the directory where ProViewer is located and do the following: • Windows XP, 2008– double-click the Setup.exe file to start the installation process. • Vista, Windows 7 – right-click the Setup.exe file and select Run as administrator from the
popup menu to install using elevated privileges. A prompt for permission to continue displays. Click Allow or Yes to proceed (if you do not respond and the message times-out, the install is unsuccessful).
The wizard begins to lead you through the installation process.
2. If the following is not already installed on your system, then a prompt displays to install it:• Microsoft Office Access database engine• Microsoft .NET FrameworkClick Install. If you see a message that you require to reboot, click Yes. You must reboot to continue with the installation.
3. In the Welcome screen, click Next.
4. In the License Information screen, click I accept, and then click Next.
5. In the Customer Information screen, type in your user and organization names in the fields provided. Click Next.
6. In the Destination Folder screen, click Next to accept the default path or click Change to select a new path.
7. In the Ready to Install screen, click Install to begin the file transfer.
8. In the Completed screen, click Finish to complete the installation of MapInfo ProViewer.
MapInfo ProViewer 10.5 6 User Guide

Chapter 1: Introduction to MapInfo ProViewerWhat’s New in MapInfo ProViewer?
What’s New in MapInfo ProViewer?This section contains information about the new features of ProViewer.
New in Proviewer 10.5
Cursors have a new Look
Cursors have been updated to have an improved look. Their behaviors have not changed only how they look has changed.
Printing to an Offscreen Bitmap
The Advanced Printing Options dialog box (select File > Print and click Advanced) includes a new 3rd output method in addition to Print Directly to Device and Print using Enhanced Metafile (EMF). This can be useful to control transparency and color, particularly for raster images:
Print using Offscreen Bitmap (OSBM)This printing process generates offscreen bitmap of your MapInfo Professional image before sending it to the printer. Offscreen bitmap is invoked depending upon the type of translucent content in the map and enhanced rendering state of the window. However, setting OSBM from this window means that while printing Offscreen bitmaps (OSBM) will be selected regardless of the translucency and anti alias settings.
Support for Equidistant Cylindrical Projection
The Equidistant Cylindrical projection (also called the Equirectangular projection, geographic projection, Plate Carrée or Carte Parallelogrammatique projection or CPP) is a very simple map projection attributed to Marinus of Tyre, who Ptolemy claims invented the projection about 100 AD. The projection maps meridians to equally spaced vertical straight lines, and circles of latitude to evenly spread horizontal straight lines. The projection is neither equal area nor conformal. Because of the distortions introduced by this projection, it has little use in navigation or cadastral mapping and finds its main use in thematic mapping. In particular, the Plate Carrée used often in computer applications that process global maps, because of the particularly simple relationship between the position of an image pixel on the map and its corresponding geographic location on Earth.
The Plate Carrée (French, for "flat square"), is the special case where standard parallel is zero.
MapInfo ProViewer 10.5 7 User Guide

Chapter 1: Introduction to MapInfo ProViewerWhat’s New in MapInfo ProViewer?
The following examples are of PRJ entries for Plate Caar and Equidistant Cylindrical projection centered at 46.5 degree Standard Parallel (used in France):
"Plate Carree WGS84", 33, 104, 7, 0, 0, 0, 0"Equidistant Cylindrical 46.5 Degree WGS84", 33, 104, 7, 0, 46.5, 0, 0
Support for new Coordinate System and Datums
There are enhancements for European, French, Australian, Finnish, United States, Slovenian and Zambian coordinate systems.
Australian Coordinate Systems
We have added new Australian coordinate systems:
• "Longitude / Latitude (Victoria GDA94)", 2001, 116, 132, -26.8, 154, -43.8• "SA - Lambert Conformal Conic (GDA94)", 3, 116, 7, 135, -32, -28, -36, 1000000, 2000000
Danish Coordinate Systems
We have updated and added Danish coordinate systems:
• "UTM Zone 32 Euref89\p25832", 8, 115, 7, 9.0, 0, 0.9996, 500000, 0• "UTM Zone 33 Euref89\p25833", 8, 115, 7, 15.0, 0, 0.9996, 500000, 0• "DKTM1 - Western Jylland\p4093", 8, 115, 7, 9, 0, 0.99998, 200000, 5000000• "DKTM2 - Eastern Jylland and Fyn\p4094", 8, 115, 7, 10, 0, 0.99998, 400000, 5000000• "DKTM3 - Sjaelland\p4095", 8, 115, 7, 11.75, 0, 0.99998, 600000, 5000000• "DKTM4 - Bornholm\p4096", 8, 115, 7, 15, 0, 1.00000, 800000, 5000000• "KP2000 Jylland-Fyn\p18401", 8, 115, 7, 9.5, 0, 0.99995, 200000, 0• "KP2000 Sjaelland\p18402", 8, 115, 7, 12.0, 0, 0.99995, 500000, 0• "KP2000 Bornholm\p18403", 8, 115, 7, 15.0, 0, 1.00000, 900000, 0• "UTM Zone 32 (ED 50)\p23032", 8, 28, 7, 9, 0, 0.9996, 500000, 0• "UTM Zone 33 (ED 50)\p23033", 8, 28, 7, 15, 0, 0.9996, 500000, 0• "System 34 Jylland-Fyn\p34003", 21, 28, 7, 9, 0, 0.9996, 500000, 0• "System 34 Sjaelland\p34005", 22, 28, 7, 9, 0, 0.9996, 500000, 0• "System 45 Bornholm\p45001", 23, 28, 7, 15, 0, 0.9996, 500000, 0
Projection Name Proj
ectio
n Ty
pe
Dat
um
Uni
ts
Orig
in, L
ongi
tude
Orig
in, L
atitu
de
Stan
dard
Par
alle
l 1
Stan
dard
Par
alle
l 2
Azi
mut
h
Scal
e Fa
ctor
Fals
e Ea
stin
g
Fals
e N
orth
ing
Ran
ge
Equidistant Cylindrical 33 X X X X X X
MapInfo ProViewer 10.5 8 User Guide

Chapter 1: Introduction to MapInfo ProViewerWhat’s New in MapInfo ProViewer?
Danish Bounded Coordinate Systems• "Bounded UTM Zone 32 ETRS89\p25832", 2008, 115, 7, 9.0, 0, 0.9996, 500000, 0, 50000.0,
5750000.0, 1050000.0, 6750000.0• "Bounded UTM Zone 33 ETRS89\p25833", 2008, 115, 7, 15.0, 0, 0.9996, 500000, 0, -200000.0,
5750000.0, 800000.0, 6750000.0• "Bounded DKTM1 - Western Jylland\p4093", 2008, 115, 7, 9, 0, 0.99998, 200000, 5000000, 0,
750000, 1000000, 1750000• "Bounded DKTM2 - Eastern Jylland and Fyn\p4094", 2008, 115, 7, 10, 0, 0.99998, 400000,
5000000, 0, 750000, 1000000, 1750000• "Bounded DKTM3 - Sjaelland\p4095", 2008, 115, 7, 11.75, 0, 0.99998, 600000, 5000000, 0,
750000, 1000000, 1750000• "Bounded DKTM4 - Bornholm\p4096", 2008, 115, 7, 15, 0, 1.00000, 800000, 5000000, 0,
750000, 1000000, 1750000• "Bounded KP2000 Jylland-Fyn\p18401", 2008, 115, 7, 9.5, 0, 0.99995, 200000, 0, -200000.0,
5750000.0, 800000.0, 6750000.0• "Bounded KP2000 Sjaelland\p18402", 2008, 115, 7, 12.0, 0, 0.99995, 500000, 0, -200000.0,
5750000.0, 800000.0, 6750000.0• "Bounded KP2000 Bornholm\p18403", 2008, 115, 7, 15.0, 0, 1.00000, 900000, 0, -200000.0,
5750000.0, 800000.0, 6750000.0• "Bounded UTM Zone 32 (ED 50)\p23032", 2008, 28, 7, 9, 0, 0.9996, 500000, 0, 50000.0,
5750000.0, 1050000.0, 6750000.0,• "Bounded UTM Zone 33 (ED 50)\p23033", 2008, 28, 7, 15, 0, 0.9996, 500000, 0, -200000.0,
5750000.0, 800000.0, 6750000.0• "Bounded System 34 Jylland-Fyn\p34003", 2021, 28, 7, 9, 0, 0.9996, 500000, 0, -700000.0, -
300000, 300000, 700000• "Bounded System 34 Sjaelland\p34005", 2022, 28, 7, 9, 0, 0.9996, 500000, 0, -700000.0, -
300000, 300000, 700000• "Bounded System 45 Bornholm\p45001", 2023, 28, 7, 15, 0, 0.9996, 500000, 0, -700000.0, -
300000, 300000, 700000
European Projection
We have added a new European projection system:
• "Longitude / Latitude (EUREF89)\p4258",1, 115
French Coordinate System
We have added a new French coordinate system:
• "Longitude / Latitude (RGF93)\p4171", 1, 33
Finnish Coordinate Systems
We have added new Finnish coordinate systems:
• "Finnish KKJ Zone 0\p3386", 2024, 1016, 7, 18, 0, 1, 500000, 0, 0, 6000000, 1500000, 8000000• "Finnish KKJ Zone 5\p3387", 2024, 1016, 7, 33, 0, 1, 5500000, 0, 4000000, 6000000, 6000000,
8000000
MapInfo ProViewer 10.5 9 User Guide
Chapter 1: Introduction to MapInfo ProViewerWhat’s New in MapInfo ProViewer?
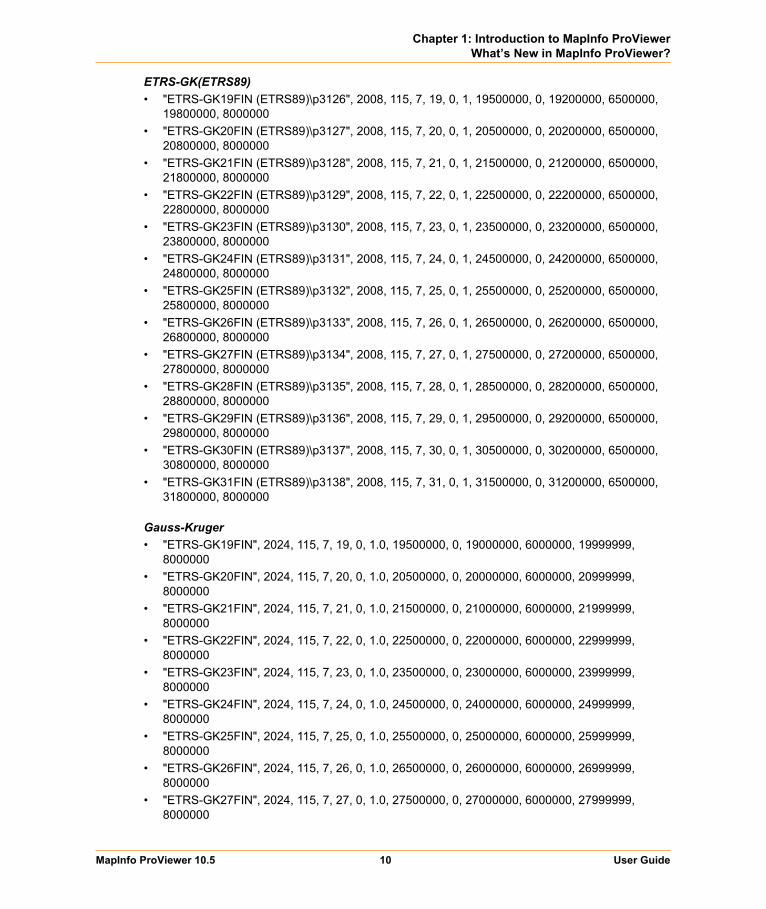
ETRS-GK(ETRS89)• "ETRS-GK19FIN (ETRS89)\p3126", 2008, 115, 7, 19, 0, 1, 19500000, 0, 19200000, 6500000,
19800000, 8000000 • "ETRS-GK20FIN (ETRS89)\p3127", 2008, 115, 7, 20, 0, 1, 20500000, 0, 20200000, 6500000,
20800000, 8000000• "ETRS-GK21FIN (ETRS89)\p3128", 2008, 115, 7, 21, 0, 1, 21500000, 0, 21200000, 6500000,
21800000, 8000000• "ETRS-GK22FIN (ETRS89)\p3129", 2008, 115, 7, 22, 0, 1, 22500000, 0, 22200000, 6500000,
22800000, 8000000• "ETRS-GK23FIN (ETRS89)\p3130", 2008, 115, 7, 23, 0, 1, 23500000, 0, 23200000, 6500000,
23800000, 8000000• "ETRS-GK24FIN (ETRS89)\p3131", 2008, 115, 7, 24, 0, 1, 24500000, 0, 24200000, 6500000,
24800000, 8000000• "ETRS-GK25FIN (ETRS89)\p3132", 2008, 115, 7, 25, 0, 1, 25500000, 0, 25200000, 6500000,
25800000, 8000000• "ETRS-GK26FIN (ETRS89)\p3133", 2008, 115, 7, 26, 0, 1, 26500000, 0, 26200000, 6500000,
26800000, 8000000• "ETRS-GK27FIN (ETRS89)\p3134", 2008, 115, 7, 27, 0, 1, 27500000, 0, 27200000, 6500000,
27800000, 8000000• "ETRS-GK28FIN (ETRS89)\p3135", 2008, 115, 7, 28, 0, 1, 28500000, 0, 28200000, 6500000,
28800000, 8000000• "ETRS-GK29FIN (ETRS89)\p3136", 2008, 115, 7, 29, 0, 1, 29500000, 0, 29200000, 6500000,
29800000, 8000000• "ETRS-GK30FIN (ETRS89)\p3137", 2008, 115, 7, 30, 0, 1, 30500000, 0, 30200000, 6500000,
30800000, 8000000• "ETRS-GK31FIN (ETRS89)\p3138", 2008, 115, 7, 31, 0, 1, 31500000, 0, 31200000, 6500000,
31800000, 8000000
Gauss-Kruger• "ETRS-GK19FIN", 2024, 115, 7, 19, 0, 1.0, 19500000, 0, 19000000, 6000000, 19999999,
8000000• "ETRS-GK20FIN", 2024, 115, 7, 20, 0, 1.0, 20500000, 0, 20000000, 6000000, 20999999,
8000000• "ETRS-GK21FIN", 2024, 115, 7, 21, 0, 1.0, 21500000, 0, 21000000, 6000000, 21999999,
8000000• "ETRS-GK22FIN", 2024, 115, 7, 22, 0, 1.0, 22500000, 0, 22000000, 6000000, 22999999,
8000000• "ETRS-GK23FIN", 2024, 115, 7, 23, 0, 1.0, 23500000, 0, 23000000, 6000000, 23999999,
8000000• "ETRS-GK24FIN", 2024, 115, 7, 24, 0, 1.0, 24500000, 0, 24000000, 6000000, 24999999,
8000000• "ETRS-GK25FIN", 2024, 115, 7, 25, 0, 1.0, 25500000, 0, 25000000, 6000000, 25999999,
8000000• "ETRS-GK26FIN", 2024, 115, 7, 26, 0, 1.0, 26500000, 0, 26000000, 6000000, 26999999,
8000000• "ETRS-GK27FIN", 2024, 115, 7, 27, 0, 1.0, 27500000, 0, 27000000, 6000000, 27999999,
8000000
MapInfo ProViewer 10.5 10 User Guide
Chapter 1: Introduction to MapInfo ProViewerWhat’s New in MapInfo ProViewer?
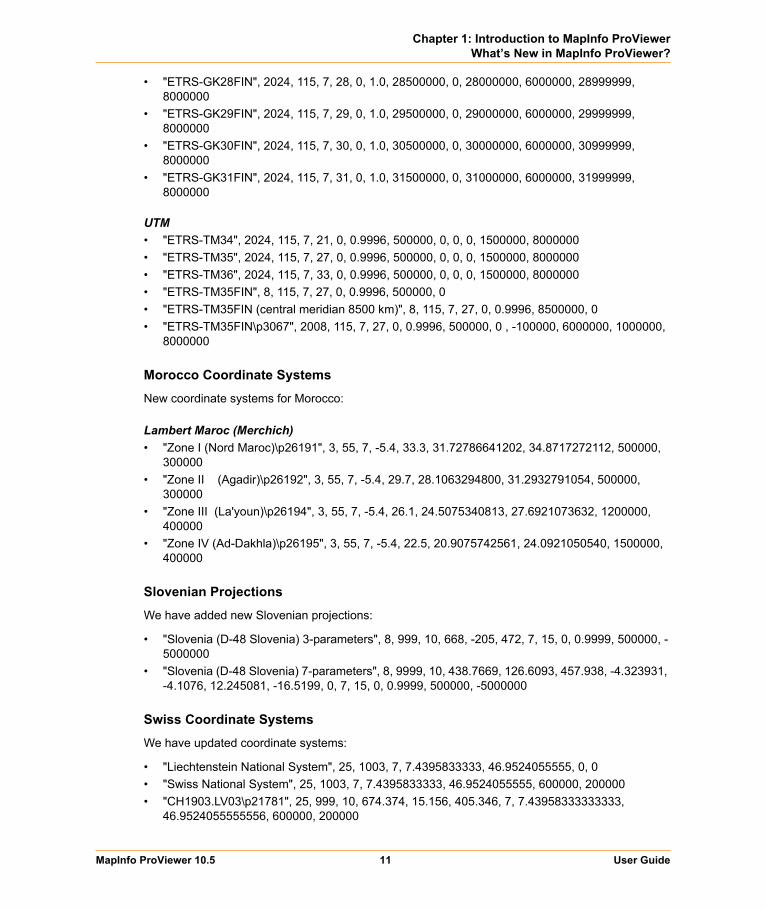
• "ETRS-GK28FIN", 2024, 115, 7, 28, 0, 1.0, 28500000, 0, 28000000, 6000000, 28999999, 8000000
• "ETRS-GK29FIN", 2024, 115, 7, 29, 0, 1.0, 29500000, 0, 29000000, 6000000, 29999999, 8000000
• "ETRS-GK30FIN", 2024, 115, 7, 30, 0, 1.0, 30500000, 0, 30000000, 6000000, 30999999, 8000000
• "ETRS-GK31FIN", 2024, 115, 7, 31, 0, 1.0, 31500000, 0, 31000000, 6000000, 31999999, 8000000
UTM• "ETRS-TM34", 2024, 115, 7, 21, 0, 0.9996, 500000, 0, 0, 0, 1500000, 8000000• "ETRS-TM35", 2024, 115, 7, 27, 0, 0.9996, 500000, 0, 0, 0, 1500000, 8000000• "ETRS-TM36", 2024, 115, 7, 33, 0, 0.9996, 500000, 0, 0, 0, 1500000, 8000000• "ETRS-TM35FIN", 8, 115, 7, 27, 0, 0.9996, 500000, 0• "ETRS-TM35FIN (central meridian 8500 km)", 8, 115, 7, 27, 0, 0.9996, 8500000, 0• "ETRS-TM35FIN\p3067", 2008, 115, 7, 27, 0, 0.9996, 500000, 0 , -100000, 6000000, 1000000,
8000000
Morocco Coordinate Systems
New coordinate systems for Morocco:
Lambert Maroc (Merchich)• "Zone I (Nord Maroc)\p26191", 3, 55, 7, -5.4, 33.3, 31.72786641202, 34.8717272112, 500000,
300000• "Zone II (Agadir)\p26192", 3, 55, 7, -5.4, 29.7, 28.1063294800, 31.2932791054, 500000,
300000• "Zone III (La'youn)\p26194", 3, 55, 7, -5.4, 26.1, 24.5075340813, 27.6921073632, 1200000,
400000• "Zone IV (Ad-Dakhla)\p26195", 3, 55, 7, -5.4, 22.5, 20.9075742561, 24.0921050540, 1500000,
400000
Slovenian Projections
We have added new Slovenian projections:
• "Slovenia (D-48 Slovenia) 3-parameters", 8, 999, 10, 668, -205, 472, 7, 15, 0, 0.9999, 500000, -5000000
• "Slovenia (D-48 Slovenia) 7-parameters", 8, 9999, 10, 438.7669, 126.6093, 457.938, -4.323931, -4.1076, 12.245081, -16.5199, 0, 7, 15, 0, 0.9999, 500000, -5000000
Swiss Coordinate Systems
We have updated coordinate systems:
• "Liechtenstein National System", 25, 1003, 7, 7.4395833333, 46.9524055555, 0, 0• "Swiss National System", 25, 1003, 7, 7.4395833333, 46.9524055555, 600000, 200000• "CH1903.LV03\p21781", 25, 999, 10, 674.374, 15.156, 405.346, 7, 7.43958333333333,
46.9524055555556, 600000, 200000
MapInfo ProViewer 10.5 11 User Guide

Chapter 1: Introduction to MapInfo ProViewerWhat’s New in MapInfo ProViewer?
• "CH1903.LV03C\p21782", 25, 999, 10, 674.374, 15.156, 405.346, 7, 7.43958333333333, 46.9524055555556, 0, 0
• "CH1903plus.LV95\p2056", 25, 999, 10, 674.374, 15.156, 405.346, 7, 7.43958333333333, 46.9524055555556, 2600000, 1200000
United States of America (USA) Coordinate Systems
We have added new USA coordinate systems:
• "California Teale Albers NAD27", 9, 62, 7, -120, 0, 34, 40.5, 0, -4000000 • "California Teale Albers NAD83", 9, 74, 7, -120, 0, 34, 40.5, 0, -4000000
Zambia Projections
We have added new Zambian projections:
Gauss-Kruger Arc1950• "Gauss-Kruger LO 24 Arc1950", 8, 5, 7, 24, 0, 1, 0, 0 • "Gauss-Kruger LO 25 Arc1950", 8, 5, 7, 25, 0, 1, 0, 0 • "Gauss-Kruger LO 26 Arc1950", 8, 5, 7, 26, 0, 1, 0, 0 • "Gauss-Kruger LO 27 Arc1950", 8, 5, 7, 27, 0, 1, 0, 0 • "Gauss-Kruger LO 28 Arc1950", 8, 5, 7, 28, 0, 1, 0, 0 • "Gauss-Kruger LO 29 Arc1950", 8, 5, 7, 29, 0, 1, 0, 0 • "Gauss-Kruger LO 30 Arc1950", 8, 5, 7, 30, 0, 1, 0, 0
Gauss-Kruger Arc1950 (**Affine Transformation, False Coords)• "Gauss-Kruger LO 24 Arc1950", 8, 1005, 7, 24, 0.9996, 1, 500000, 10000000 • "Gauss-Kruger LO 25 Arc1950", 8, 1005, 7, 25, 0.9996, 1, 500000, 10000000 • "Gauss-Kruger LO 26 Arc1950", 8, 1005, 7, 26, 0.9996, 1, 500000, 10000000 • "Gauss-Kruger LO 27 Arc1950", 8, 1005, 7, 27, 0.9996, 1, 500000, 10000000 • "Gauss-Kruger LO 28 Arc1950", 8, 1005, 7, 28, 0.9996, 1, 500000, 10000000 • "Gauss-Kruger LO 29 Arc1950", 8, 1005, 7, 29, 0.9996, 1, 500000, 10000000 • "Gauss-Kruger LO 30 Arc1950", 8, 1005, 7, 30, 0.9996, 1, 500000, 10000000
Gauss-Kruger Arc1950 (No Affine Transformation, False Coords) • "Gauss-Kruger LO 24 Arc1950", 8, 5, 7, 24, 0, 0.9996, 500000, 10000000 • "Gauss-Kruger LO 25 Arc1950", 8, 5, 7, 25, 0, 0.9996, 500000, 10000000 • "Gauss-Kruger LO 26 Arc1950", 8, 5, 7, 26, 0, 0.9996, 500000, 10000000 • "Gauss-Kruger LO 27 Arc1950", 8, 5, 7, 27, 0, 0.9996, 500000, 10000000 • "Gauss-Kruger LO 28 Arc1950", 8, 5, 7, 28, 0, 0.9996, 500000, 10000000 • "Gauss-Kruger LO 29 Arc1950", 8, 5, 7, 29, 0, 0.9996, 500000, 10000000 • "Gauss-Kruger LO 30 Arc1950", 8, 5, 7, 30, 0, 0.9996, 500000, 10000000
MapInfo ProViewer 10.5 12 User Guide
Chapter 1: Introduction to MapInfo ProViewerDisplaying a Map in MapInfo ProViewer
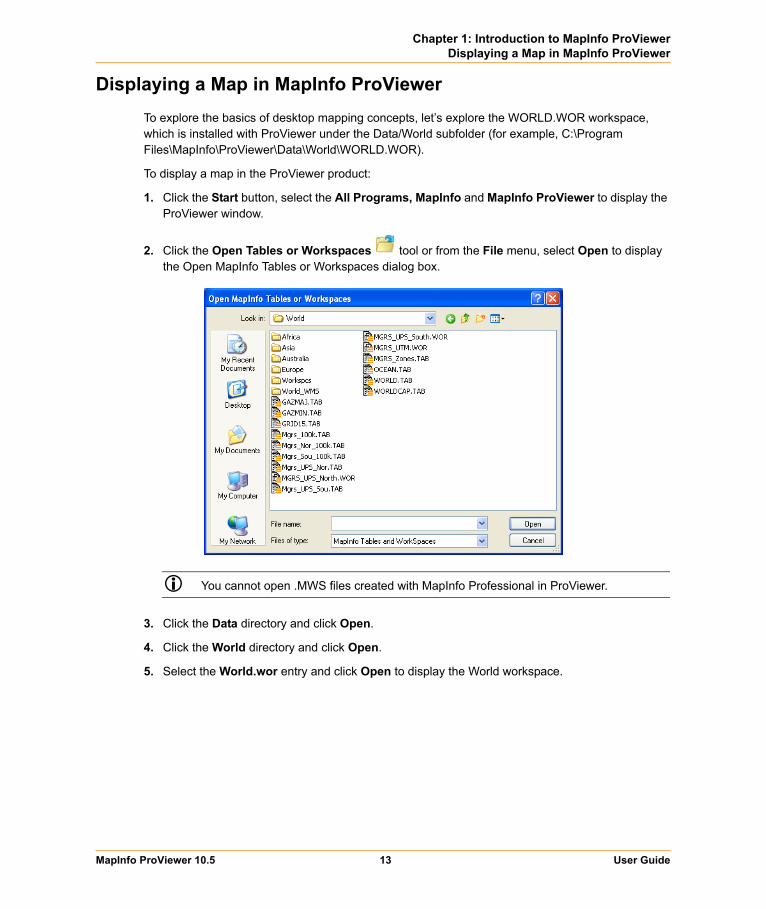
Displaying a Map in MapInfo ProViewerTo explore the basics of desktop mapping concepts, let’s explore the WORLD.WOR workspace, which is installed with ProViewer under the Data/World subfolder (for example, C:\Program Files\MapInfo\ProViewer\Data\World\WORLD.WOR).
To display a map in the ProViewer product:
1. Click the Start button, select the All Programs, MapInfo and MapInfo ProViewer to display the ProViewer window.
2. Click the Open Tables or Workspaces tool or from the File menu, select Open to display the Open MapInfo Tables or Workspaces dialog box.
You cannot open .MWS files created with MapInfo Professional in ProViewer.
3. Click the Data directory and click Open.
4. Click the World directory and click Open.
5. Select the World.wor entry and click Open to display the World workspace.
MapInfo ProViewer 10.5 13 User Guide

Chapter 1: Introduction to MapInfo ProViewerUnderstanding the ProViewer Toolbar
Understanding the ProViewer ToolbarThe toolbar icons at the top of the MapInfo ProViewer window can help you perform mapping work easily and efficiently. The Help System contains a detailed explanation of each icon.
Open Tables or Workspace
Print Window Help
Select Zoom In Zoom Out
Change View Grabber Info Tool
Drag Map Window Ruler Show/Hide Legend
Label HotLink Show/Hide Statistics
Boundary Select Marquee Select Radius Select
Polygon Select Graph Select Unselect All
Invert Selection
MapInfo ProViewer 10.5 14 User Guide

Chapter 1: Introduction to MapInfo ProViewerA Brief Tour of the World.wor Workspace
A Brief Tour of the World.wor WorkspaceUse the WORLD.WOR workspace, installed with ProViewer, to review the map layers and experiment with these icons to become familiar with their functionality. You can think of a workspace as a map with transparencies stacked on top of it. Each layer contains data that pertains to the entire map. For example, WORLD.WOR includes the Ocean, the Countries, and the World Capitals layers.
The WORLD.WOR workspace is located under the Data/World subfolder where ProViewer is installed (for example, C:\Program Files\MapInfo\ProViewer\Data\World\WORLD.WOR).
Using the Select Icon
Click the Select tool and then position the cursor over any region to display the name of the region. There are several selection icons that allow you to select map features and group regions for display. See the Help System for more about the specific properties of each icon.
MapInfo ProViewer 10.5 15 User Guide
Chapter 1: Introduction to MapInfo ProViewerA Brief Tour of the World.wor Workspace
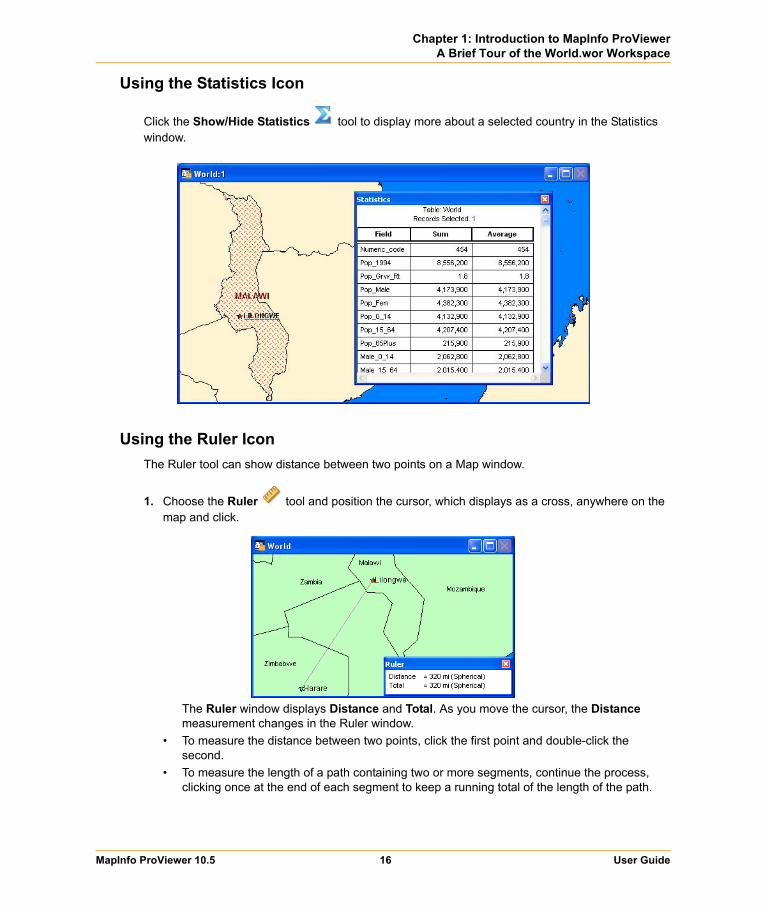
Using the Statistics Icon
Click the Show/Hide Statistics tool to display more about a selected country in the Statistics window.
Using the Ruler IconThe Ruler tool can show distance between two points on a Map window.
1. Choose the Ruler tool and position the cursor, which displays as a cross, anywhere on the map and click.
The Ruler window displays Distance and Total. As you move the cursor, the Distance measurement changes in the Ruler window.
• To measure the distance between two points, click the first point and double-click the second.
• To measure the length of a path containing two or more segments, continue the process, clicking once at the end of each segment to keep a running total of the length of the path.
MapInfo ProViewer 10.5 16 User Guide

Chapter 1: Introduction to MapInfo ProViewerA Brief Tour of the World.wor Workspace
Using the Zoom IconsThe Zoom options give you control over the display of the Map window.
1. Open a Map window and click the Zoom-in tool. Position the cursor anywhere on the map.
Full featured Pitney Bowes Software Inc. products allow you to determine the range (for example 0 to 3 miles, 2 to 5 miles) at which each layer is visible in a Map window.
2. To see the effect of zooming click the Zoom in icon anywhere on the map. The map redraws at the new zoom level. Notice that the information changes in the Zoom section of the Status Bar to reflect a new zoom level.
3. To specify the zoom level of the map, click the Change View tool and enter a new zoom level.
At different zoom levels, new information displays on the map reflecting the visibility of the different map layers that comprise WORLD.WOR.
Displaying the Map LegendThe map’s legend explains the meaning of the different shapes, colors, and fill patterns.
1. Open a Map window and click the Show/Hide Legend tool or select the Options menu and the Show/Hide Legend command.
MapInfo ProViewer 10.5 17 User Guide

Chapter 1: Introduction to MapInfo ProViewerGetting Online Help
Not all maps have legends.
2. Choose the Map menu option and the Previous View command to return the map from the beginning.
We have provided the icon descriptions, the Glossary, and the online help to support you as you navigate through more mapping adventures!
Getting Online HelpUse ProViewer‘s comprehensive online Help, including sections on menu commands and dialog box descriptions, to answer your ProViewer questions.
Getting Technical Support If you encounter problems installing MapInfo ProViewer, our technical support specialists can help. Technical Support for MapInfo ProViewer is limited to installation issues. For workspace-related issues, see the MapInfo Professional user who created the workspace.
To contact the office nearest you, refer to the Support > Contact Support section on our website:
http://www.pbinsight.com/support/contact-support/
MapInfo ProViewer 10.5 18 User Guide

Chapter 1: Introduction to MapInfo ProViewerWant to do more?
Want to do more?Consider...
MapInfo Professional, the premier desktop mapping product for business and government. MapInfo Professional allows users to access their own data to see relationships between data and geography, answering questions such as...
• Where are my best customers located?• Where should I place my next sales office?• How can I increase my sales?
MapInfo Professional answers these questions in a straightforward manner, reducing the time it takes to make smarter decisions.
MapInfo ProViewer 10.5 19 User Guide

A
GlossaryThis section contains a list of terms we use to describe ProViewer features and capabilities.
Chapter A: Glossary
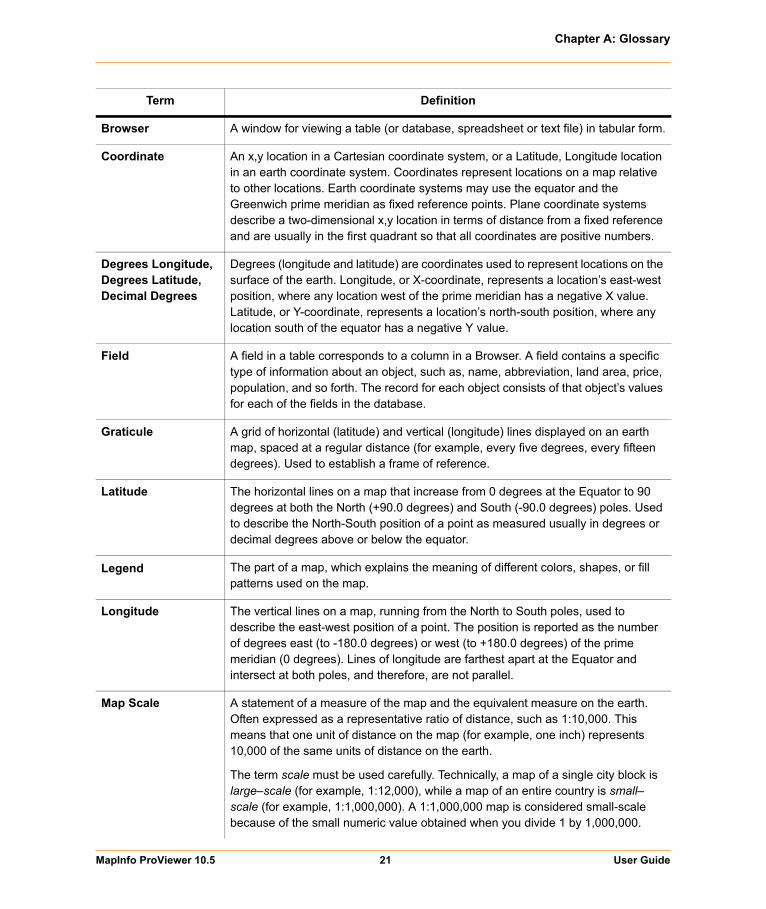
Term Definition
Browser A window for viewing a table (or database, spreadsheet or text file) in tabular form.
Coordinate An x,y location in a Cartesian coordinate system, or a Latitude, Longitude location in an earth coordinate system. Coordinates represent locations on a map relative to other locations. Earth coordinate systems may use the equator and the Greenwich prime meridian as fixed reference points. Plane coordinate systems describe a two-dimensional x,y location in terms of distance from a fixed reference and are usually in the first quadrant so that all coordinates are positive numbers.
Degrees Longitude, Degrees Latitude, Decimal Degrees
Degrees (longitude and latitude) are coordinates used to represent locations on the surface of the earth. Longitude, or X-coordinate, represents a location’s east-west position, where any location west of the prime meridian has a negative X value. Latitude, or Y-coordinate, represents a location’s north-south position, where any location south of the equator has a negative Y value.
Field A field in a table corresponds to a column in a Browser. A field contains a specific type of information about an object, such as, name, abbreviation, land area, price, population, and so forth. The record for each object consists of that object’s values for each of the fields in the database.
Graticule A grid of horizontal (latitude) and vertical (longitude) lines displayed on an earth map, spaced at a regular distance (for example, every five degrees, every fifteen degrees). Used to establish a frame of reference.
Latitude The horizontal lines on a map that increase from 0 degrees at the Equator to 90 degrees at both the North (+90.0 degrees) and South (-90.0 degrees) poles. Used to describe the North-South position of a point as measured usually in degrees or decimal degrees above or below the equator.
Legend The part of a map, which explains the meaning of different colors, shapes, or fill patterns used on the map.
Longitude The vertical lines on a map, running from the North to South poles, used to describe the east-west position of a point. The position is reported as the number of degrees east (to -180.0 degrees) or west (to +180.0 degrees) of the prime meridian (0 degrees). Lines of longitude are farthest apart at the Equator and intersect at both poles, and therefore, are not parallel.
Map Scale A statement of a measure of the map and the equivalent measure on the earth. Often expressed as a representative ratio of distance, such as 1:10,000. This means that one unit of distance on the map (for example, one inch) represents 10,000 of the same units of distance on the earth.
The term scale must be used carefully. Technically, a map of a single city block is large–scale (for example, 1:12,000), while a map of an entire country is small–scale (for example, 1:1,000,000). A 1:1,000,000 map is considered small-scale because of the small numeric value obtained when you divide 1 by 1,000,000.
MapInfo ProViewer 10.5 21 User Guide

Chapter A: Glossary
Map window A window that allows you to view a table as a map.
Node An end-point of a line object, or an end-point of a line segment which is part of a polyline or region object.
Raster Image A type of computerized picture consisting of row after row of tiny dots (pixels). Raster images are sometimes known as bitmaps. Aerial photographs and satellite imagery are common types of raster data found in GIS. A computer image can be represented in raster format or in vector format. See Vector Image on page 22.
Record All the information about one object in a database or table. A record in a table corresponds to a row in a Browser.
Selection A data item or set of data items chosen for inspection and/or analysis. Regardless of the kinds of windows on the screen, selections can be made using the Select and SQL Select Query commands in MapInfo Professional’s Query menu. In Browsers and Map windows, items can be placed in the selection set by clicking on them individually. Map windows also have special tools for selecting multiple items on a spatial basis.
Status Bar A bar at the bottom of the screen that displays messages that help in using MapInfo Professional. The StatusBar also displays messages that pertain to the active window. In a Map window, the StatusBar indicates what layer is editable, the zoom display of the map, and the status of Snap and Digitizing modes. In a Browser window, the StatusBar indicates the number of records currently displaying and the total number of records. In a Layout window, the StatusBar indicates the zoom display as a percentage of the actual size of the map.
Table A table is made up of data in rows and columns. Each row contains information about a particular geographic feature, event, etc. Each column contains a particular kind of information about the items in the table. You can display tables with graphic information stored in them as maps.
Vector Image A coordinate-based data structure commonly used to represent map features. Each object is represented as a list of sequential x,y coordinates. Attributes may be associated with the objects. A computer image can be represented in vector format or in raster format. See Raster Image on page 22.
Workspace A saved configuration of open MapInfo tables and windows.
Zoom Layering A setting that determines the range (for example, 0–3 miles, 2–5 miles, etc.) at which a layer is visible in a Map window.
Term Definition
MapInfo ProViewer 10.5 22 User Guide

Index
BBrowser windows
defined 21
Ccoordinates
defined 21
Ddegrees latitude definition 21degrees longitude definition 21Displaying a Map 13
Ffields definition 21
Ggraticule definition 21
HHelp
getting online 18
Llatitude definition 21Legend, displaying a map’s 17longitude, defined 21
Mmap scale
defined 21Map windows
defined 22Map, displaying in ProViewer 13MapInfo Professional
technical support 18MapInfo Professional, getting more out of maps
with 19
Nnodes
defined 22
PProViewer
displaying a map in 13installing 6understanding the toolbar 14
Rraster images
defined 22record definition 22Ruler icon 16
SSelect icon 15Statistics icon 16status bar
defined 22support
technical support 18
Ttables
defined 22technical support
obtaining 18Technical Support, getting 18Toolbar
using the Ruler icon 16using the Select icon 15using the Statistics icon 16using the Zoom icons 17
Toolbar, icons in 14
MapInfo ProViewer 10.5 23 User Guide

Vvector image definition 22
Wworkspaces
defined 22
ZZoom icons 17zoom layering
defined 22
MapInfo ProViewer 10.5 24 User Guide