map “pictionary” - phoenix college · maps latitude • lines run east – west • main...
TRANSCRIPT

MAP “PICTIONARY”
M A P S Latitude
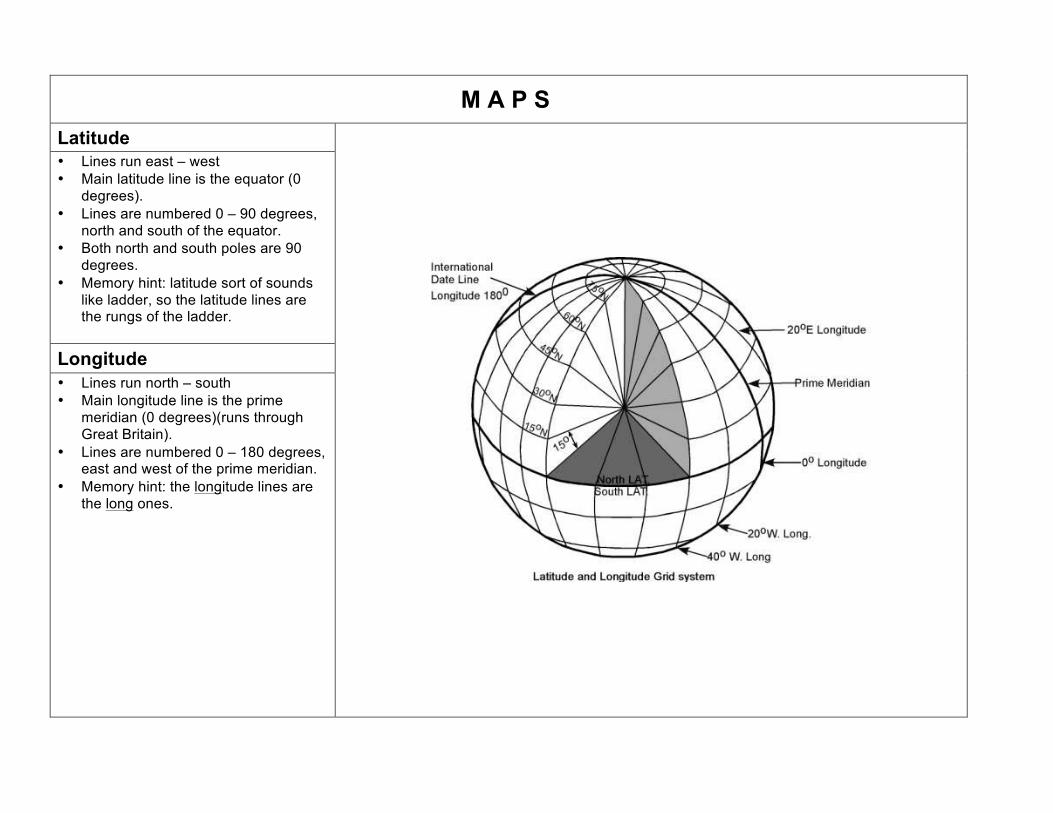
• Lines run east – west • Main latitude line is the equator (0
degrees). • Lines are numbered 0 – 90 degrees,
north and south of the equator. • Both north and south poles are 90
degrees. • Memory hint: latitude sort of sounds
like ladder, so the latitude lines are the rungs of the ladder.
Longitude • Lines run north – south • Main longitude line is the prime
meridian (0 degrees)(runs through Great Britain).
• Lines are numbered 0 – 180 degrees, east and west of the prime meridian.
• Memory hint: the longitude lines are the long ones.
North arrow
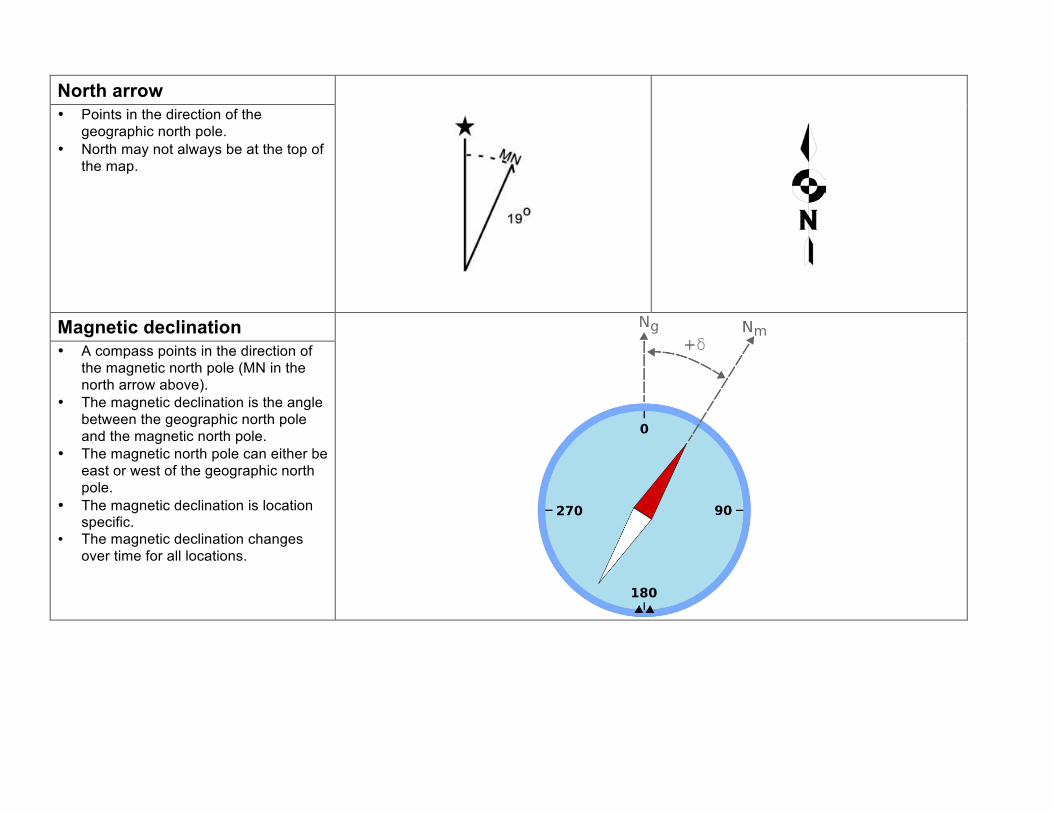
• Points in the direction of the geographic north pole.
• North may not always be at the top of the map.
Magnetic declination
• A compass points in the direction of the magnetic north pole (MN in the north arrow above).
• The magnetic declination is the angle between the geographic north pole and the magnetic north pole.
• The magnetic north pole can either be east or west of the geographic north pole.
• The magnetic declination is location specific.
• The magnetic declination changes over time for all locations.

SCALES
Verbal
“ 1 inch equals 1 mile” • Is map specific.
Graphic
• Units may be in feet, miles, meters or kilometers.
• Is map specific. Fractional or Ratio
1:63,360 or 1/63,360
• Example: 1 : 63,360 (1 = distance on map; 63,360 = corresponding distance in reality).
• Unitless (can use anything, as in: 1 peanut on the map = 63,360 peanuts in reality).
• Is map specific.
Public Land Survey System (PLSS)
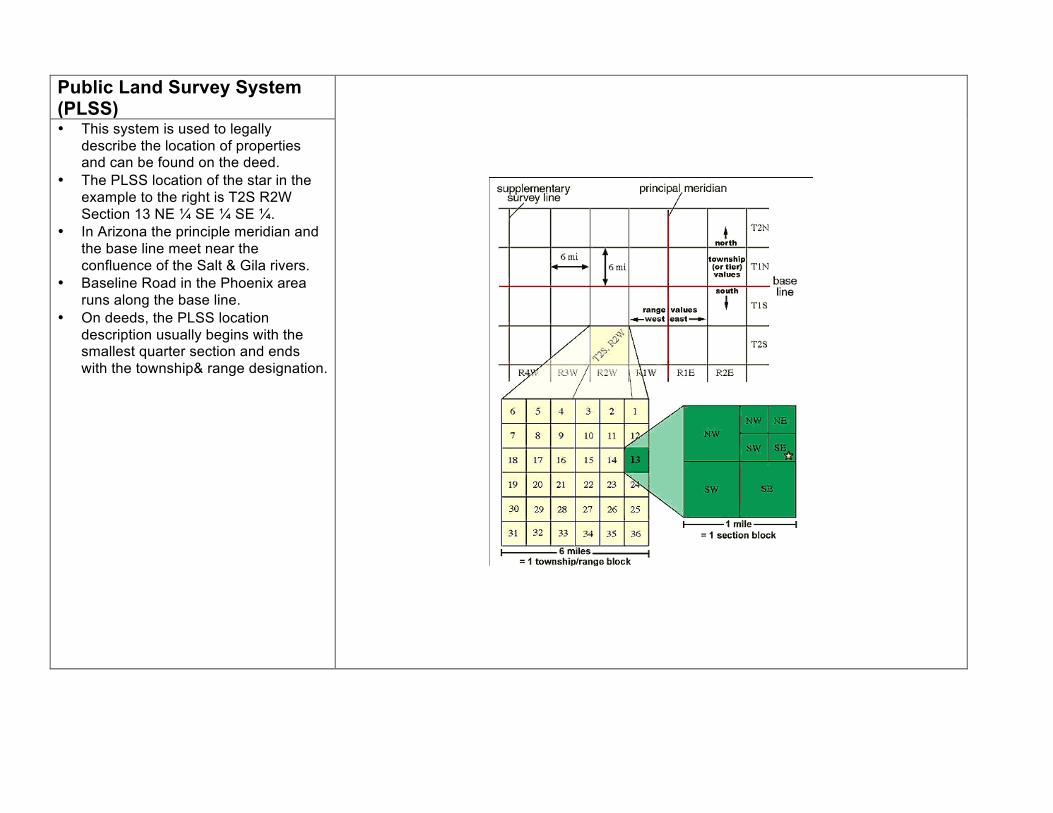
• This system is used to legally describe the location of properties and can be found on the deed.
• The PLSS location of the star in the example to the right is T2S R2W Section 13 NE ¼ SE ¼ SE ¼.
• In Arizona the principle meridian and the base line meet near the confluence of the Salt & Gila rivers.
• Baseline Road in the Phoenix area runs along the base line.
• On deeds, the PLSS location description usually begins with the smallest quarter section and ends with the township& range designation.
Township
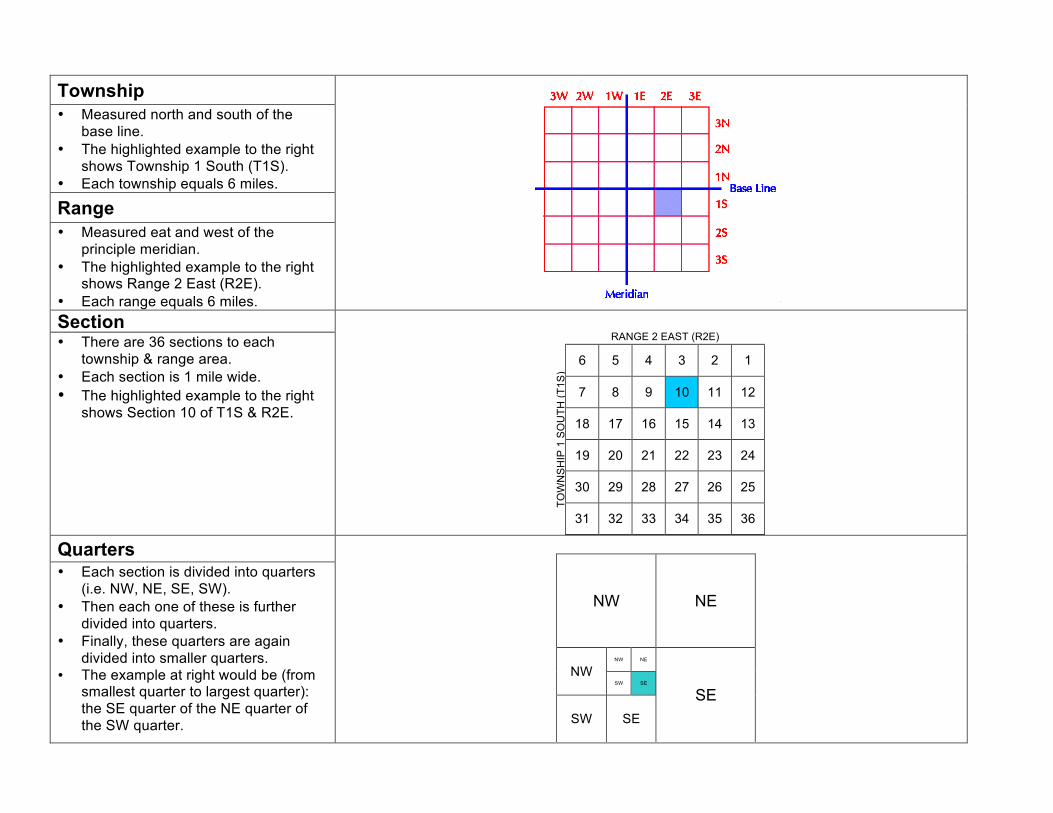
• Measured north and south of the base line.
• The highlighted example to the right shows Township 1 South (T1S).
• Each township equals 6 miles.
Range • Measured eat and west of the
principle meridian. • The highlighted example to the right
shows Range 2 East (R2E). • Each range equals 6 miles. Section
RANGE 2 EAST (R2E)
TOW
NS
HIP
1 S
OU
TH (T
1S)
6 5 4 3 2 1
7 8 9 10 11 12
18 17 16 15 14 13
19 20 21 22 23 24
30 29 28 27 26 25
31 32 33 34 35 36
• There are 36 sections to each township & range area.
• Each section is 1 mile wide. • The highlighted example to the right
shows Section 10 of T1S & R2E.
Quarters
NW NE
NW NW NE
SE SW SE
SW SE
• Each section is divided into quarters (i.e. NW, NE, SE, SW).
• Then each one of these is further divided into quarters.
• Finally, these quarters are again divided into smaller quarters.
• The example at right would be (from smallest quarter to largest quarter): the SE quarter of the NE quarter of the SW quarter.
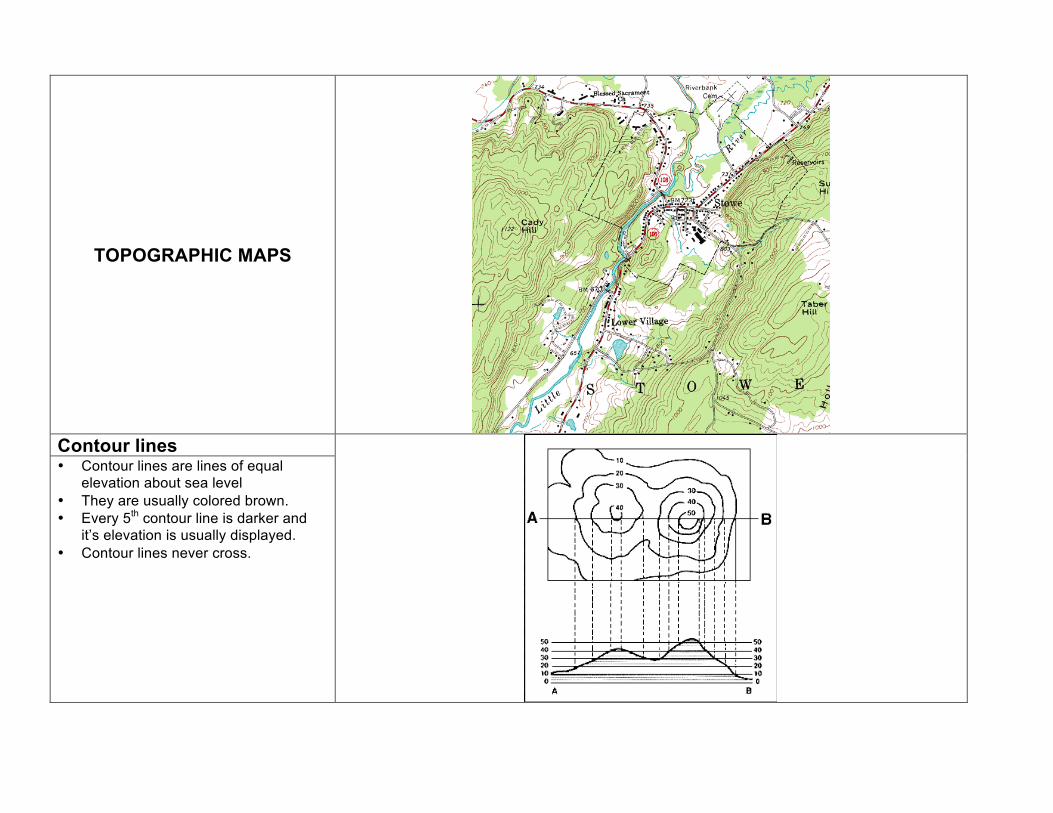
TOPOGRAPHIC MAPS
Contour lines
• Contour lines are lines of equal elevation about sea level
• They are usually colored brown. • Every 5th contour line is darker and
it’s elevation is usually displayed. • Contour lines never cross.

Hachure lines
• Hachure lines are special contour lines that represent depressions in the land surface.
Contour interval
• The contour interval is the difference in elevation between two contour lines.
• The contour interval is map specific. • This can be calculated by using the
elevation shown for two contour lines and dividing the difference in elevation by the number of lines inbetween them, or
• Usually all topographic maps will have the contour interval in the map legend by the scales (see example)
Steepness
• The relative steepness of an area on a topographic map can be determined by looking at how close the contour lines are.
• The closer the lines are spaced indicates a steep slope.
• The farther apart the lines are spaced indicates a gentle slope.
• See examples to the right.

Gradient
• The gradient is a measurement of the steepness of an area.
• It can be calculated by dividing the difference in elevation between 2 points and dividing it by the horizontal distance between the 2 points.
• In the example to the right, the gradient is:
100 ft = 200 feet/mile 0.5 miles
Streams and the Rule of V’s
• When contour lines meet a stream or a wash, the contour lines form a “V” which point upstream or up slope
• The main stream in the center of the map to the right flows from right to left.

Hills
• Hills, mountains, etc. are represented as a series of round contour lines.
• For large mountains, the contour lines still circle back but it may take several maps to accomplish this.
• The relative steepness of the hill slopes can be determined by how closely spaced the lines are.
• The elevation for the top of the hill or mountain is sometimes provided.
Cliffs
• Cliff are represent by contour lines that are extremely close together.
• Sometimes it result in areas of just brown color.
Buildings
• Buildings are represented as squares or rectangles.
High density areas • When the density of buildings is too
great, developed areas are shown in light red.
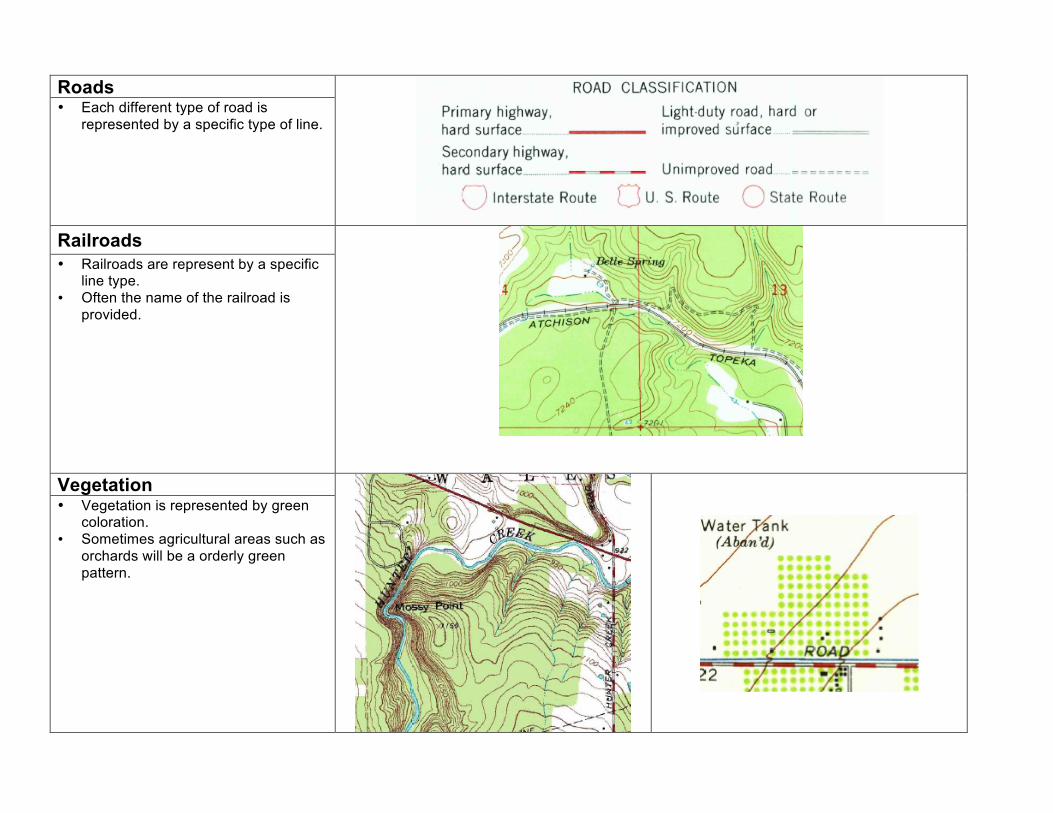
Roads
• Each different type of road is represented by a specific type of line.
Railroads
• Railroads are represent by a specific line type.
• Often the name of the railroad is provided.
Vegetation
• Vegetation is represented by green coloration.
• Sometimes agricultural areas such as orchards will be a orderly green pattern.
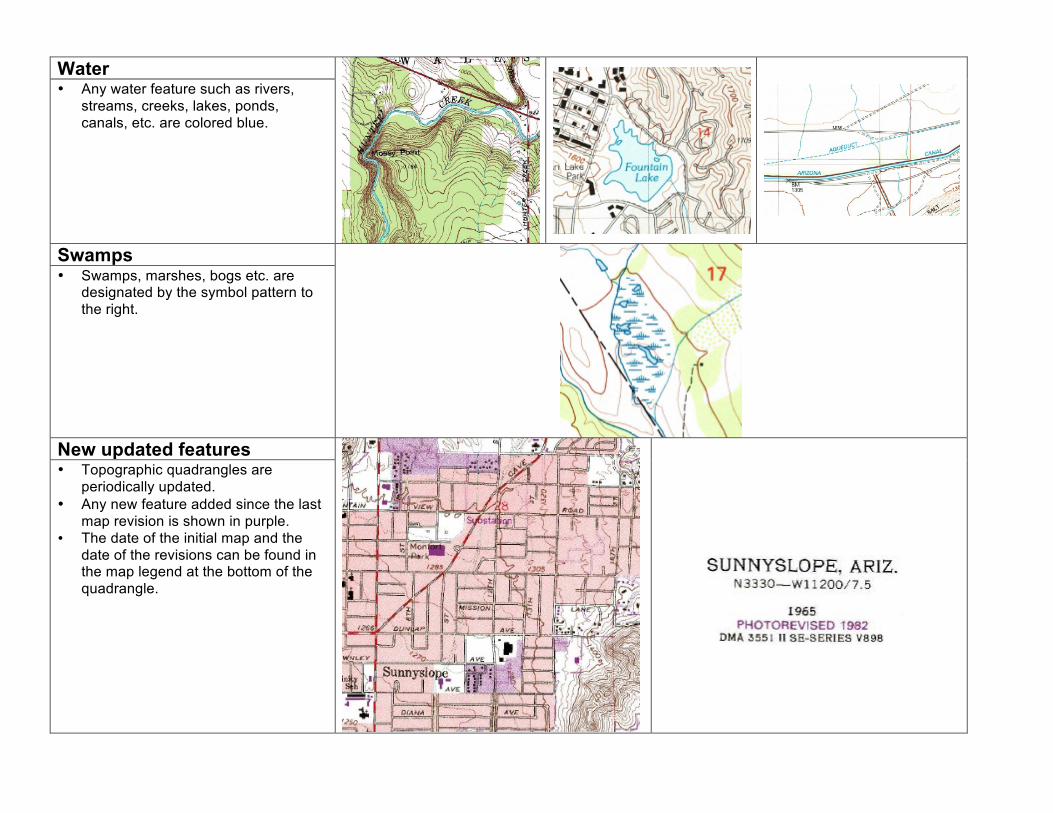
Water
• Any water feature such as rivers, streams, creeks, lakes, ponds, canals, etc. are colored blue.
Swamps
• Swamps, marshes, bogs etc. are designated by the symbol pattern to the right.
New updated features
• Topographic quadrangles are periodically updated.
• Any new feature added since the last map revision is shown in purple.
• The date of the initial map and the date of the revisions can be found in the map legend at the bottom of the quadrangle.
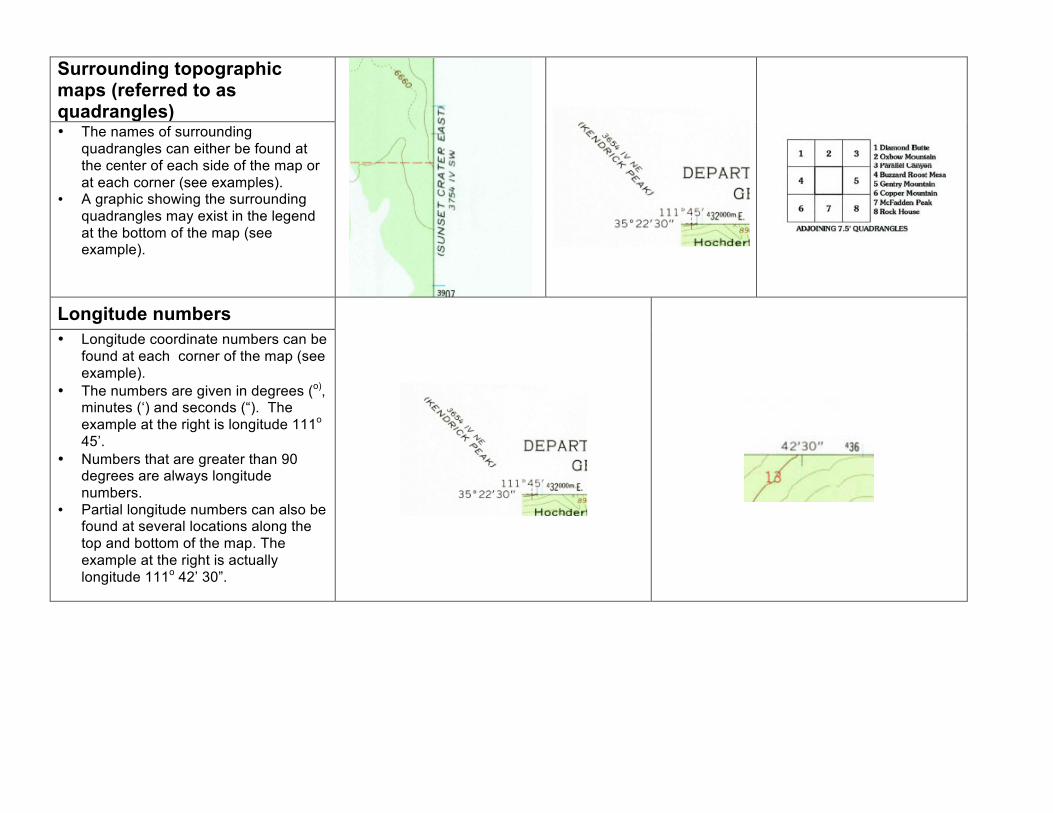
Surrounding topographic maps (referred to as quadrangles)
• The names of surrounding quadrangles can either be found at the center of each side of the map or at each corner (see examples).
• A graphic showing the surrounding quadrangles may exist in the legend at the bottom of the map (see example).
Longitude numbers
• Longitude coordinate numbers can be found at each corner of the map (see example).
• The numbers are given in degrees (o), minutes (‘) and seconds (“). The example at the right is longitude 111o 45’.
• Numbers that are greater than 90 degrees are always longitude numbers.
• Partial longitude numbers can also be found at several locations along the top and bottom of the map. The example at the right is actually longitude 111o 42’ 30”.
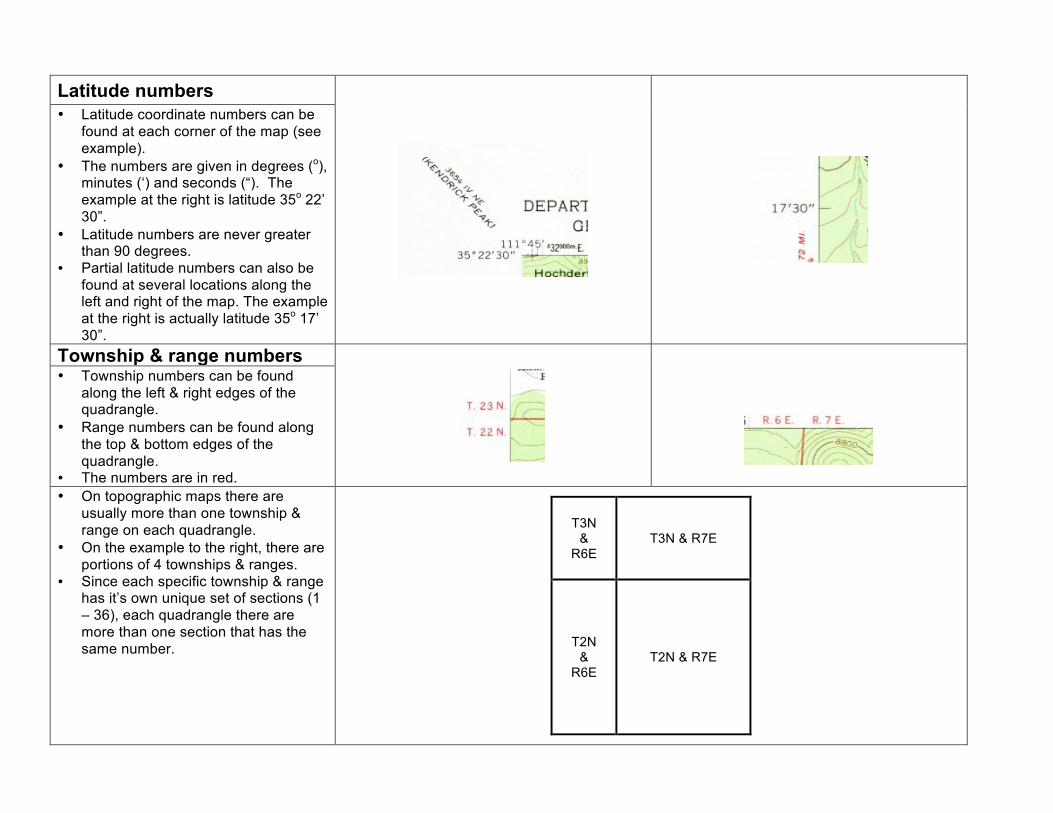
Latitude numbers
• Latitude coordinate numbers can be found at each corner of the map (see example).
• The numbers are given in degrees (o), minutes (‘) and seconds (“). The example at the right is latitude 35o 22’ 30”.
• Latitude numbers are never greater than 90 degrees.
• Partial latitude numbers can also be found at several locations along the left and right of the map. The example at the right is actually latitude 35o 17’ 30”.
Township & range numbers
• Township numbers can be found along the left & right edges of the quadrangle.
• Range numbers can be found along the top & bottom edges of the quadrangle.
• The numbers are in red. • On topographic maps there are
usually more than one township & range on each quadrangle.
• On the example to the right, there are portions of 4 townships & ranges.
• Since each specific township & range has it’s own unique set of sections (1 – 36), each quadrangle there are more than one section that has the same number.
T3N &
R6E T3N & R7E
T2N &
R6E T2N & R7E

Section numbers
• Section numbers are red and are centered within each section.
• Remember, since each topographic map contains portions of more than 1 Township & Range, there will be 2 sections with the same number.
Finding topographic maps To find and download topographic maps: http://store.usgs.gov/b2c_usgs/usgs/maplocator/(ctype=areaDetails&xcm=r3standardpitrex_prd&carea=%24ROOT&layout=6_1_61_48&uiarea=2)/.do
Map symbols For a complete list of topographic map symbols: http://egsc.usgs.gov/isb/pubs/booklets/symbols/topomapsymbols.pdf
DIAGRAM CREDIT Contour interval http://raider.mountunion.edu/~mcnaugma/topographic%20maps/contour.htm Contour lines http://egsc.usgs.gov/isb/pubs/teachers-packets/mapshow/activity4.html Depression http://www.ramblers.ab.ca/public/outdoortopics/mapcompass.asp Latitude & longitude http://www.nwic.edu/tenrm/spring2002/landgeol/lab1.htm Magnetic declination http://en.wikipedia.org/wiki/File:Magnetic_declination.svg North arrow http://www.clker.com/clipart-north-arrow.html North arrow and magnetic declination
http://www.google.com/imgres?hl=en&tbo=d&sig=105233084450650835823&biw=1280&bih=802&tbm=isch&tbnid=RhnxjfkaZOArbM:&imgrefurl=http://www.nwic.edu/tenrm/spring2002/landgeol/lab1.htm&docid=f81DHnOiSD4GTM&imgurl=http://www.nwic.edu/tenrm/spring2002/landgeol/lab1_files/image006.jpg&w=94&h=196&ei=cp3DUKPiB6W30AHQlICAAQ&zoom=1&iact=hc&vpx=212&vpy=505&dur=664&hovh=156&hovw=75&tx=61&ty=82&page=2&tbnh=154&tbnw=74&start=33&ndsp=37&ved=1t:429,r:63,s:0,i:276
Scale types http://www.colorado.edu/geography/gcraft/notes/cartocom/elements.html Steepness http://commons.wvc.edu/rdawes/G101OCL/Labs/TopoMapsLab.html Topographic map http://en.wikipedia.org/wiki/File:Topographic_map_example.png Township & range http://www.rootsweb.ancestry.com/~mnwabash/survey.htm Township and range http://geology.isu.edu/geostac/Field_Exercise/topomaps/plss.htm