map of livelihood zones in mauritaniafews.net/sites/default/files/documents/reports/mr lh profiles...
TRANSCRIPT

FEWS NET Washington
www.fews.net
FEWS NET is a USAID-funded activity. The content of this report does not
necessarily reflect the view of the United States Agency for International
Development or the United States government.
MAURITANIA Livelihood Profiles May 2015
MAP OF LIVELIHOOD ZONES IN MAURITANIA
MAURITANIA Livelihood Profile May 2015
Famine Early Warning Systems Network ii
TABLE OF CONTENTS
Map of Livelihood Zones in Mauritania ........................................................................................................................................ i
Acknowledgments ....................................................................................................................................................................... v
Acronyms, Abbreviations, and Terminology ............................................................................................................................... vi
Overview of the Household Economy Approach ......................................................................................................................... 7
The Household Economy Approach in Mauritania ...................................................................................................................... 8
Rural Livelihoods in Mauritania ................................................................................................................................................... 9
Overview of Sources of Food and Income ................................................................................................................................. 11
Nomadic Pastoralism (Zone 1) ................................................................................................................................................... 13
Zone description .................................................................................................................................................................... 13
Market access ........................................................................................................................................................................ 13
Seasonal calendar .................................................................................................................................................................. 13
Drivers of wealth ................................................................................................................................................................... 14
Sources of food, income, and expenditures .......................................................................................................................... 14
Hazards and coping strategies ............................................................................................................................................... 16
Mining and Pastoralism (Zone 2) ............................................................................................................................................... 17
Zone description .................................................................................................................................................................... 17
Market access ........................................................................................................................................................................ 17
Seasonal calendar .................................................................................................................................................................. 17
Drivers of wealth ................................................................................................................................................................... 18
Sources of food, Income, and expenditures .......................................................................................................................... 18
Main sources of food, income, and expenditures of poor households ................................................................................. 20
Hazards and coping strategies ............................................................................................................................................... 21
Coastal Fishing (Zone 4) ............................................................................................................................................................. 22
Zone description .................................................................................................................................................................... 22
Market access ........................................................................................................................................................................ 22
Seasonal calendar .................................................................................................................................................................. 22
Drivers of wealth ................................................................................................................................................................... 23
Sources of food, income, and expenditures .......................................................................................................................... 23
Main sources of food, income, and expenditures of poor households ................................................................................. 24
Hazards and coping strategies ............................................................................................................................................... 24
Pastoralism and Trade (Zone 5) ................................................................................................................................................. 25
Zone description .................................................................................................................................................................... 25
Market access ........................................................................................................................................................................ 25
Seasonal calendar .................................................................................................................................................................. 25
Drivers of wealth ................................................................................................................................................................... 26
Sources of food, income, and expenditures .......................................................................................................................... 26
Main sources of food, income, and expenditures of poor households ................................................................................. 27
Hazards and coping strategies ............................................................................................................................................... 28
Transhumant Pastoralism (Zone 6) ............................................................................................................................................ 29
Zone description .................................................................................................................................................................... 29
Market access ........................................................................................................................................................................ 29
Seasonal calendar .................................................................................................................................................................. 29
Drivers of wealth ................................................................................................................................................................... 30
Sources of food, income, and expenditures .......................................................................................................................... 30
Main sources of food, income, and expenditures of poor households ................................................................................. 31

MAURITANIA Livelihood Profile May 2015
Famine Early Warning Systems Network iii
Hazards and coping strategies ............................................................................................................................................... 32
Agro-Pastoral (Zone 7) ............................................................................................................................................................... 33
Zone description .................................................................................................................................................................... 33
Market access ........................................................................................................................................................................ 33
Seasonal calendar .................................................................................................................................................................. 33
Drivers of wealth ................................................................................................................................................................... 34
Sources of food, income, and expenditures .......................................................................................................................... 34
Main sources of food, income, and expenditures of poor households ................................................................................. 35
Hazards and coping strategies ............................................................................................................................................... 36
Senegal River Valley (Zone 8) ..................................................................................................................................................... 37
Zone description .................................................................................................................................................................... 37
Market access ........................................................................................................................................................................ 37
Seasonal calendar .................................................................................................................................................................. 37
Drivers of wealth ................................................................................................................................................................... 38
Sources of food, income, and expenditures .......................................................................................................................... 39
Main sources of food, income, and expenditures of poor households ................................................................................. 40
Hazards and coping strategies ............................................................................................................................................... 40
Rainfed Cultivation (Zone 9) ...................................................................................................................................................... 42
Zone description .................................................................................................................................................................... 42
Market access ........................................................................................................................................................................ 42
Seasonal calendar .................................................................................................................................................................. 42
Drivers of wealth ................................................................................................................................................................... 43
Sources of food, income, and expenditures .......................................................................................................................... 43
Main sources of food, income, and expenditures of poor households ................................................................................. 44
Hazards and coping strategies ............................................................................................................................................... 45
Annex 1: Purposive Sampling: Villages Visited by Livelihood Zone ........................................................................................... 46
Annex 2: List of Field Team Participants .................................................................................................................................... 47
LIST OF FIGURES Figure 1 Size and types of cropped areas in Mauritania .............................................................................................................. 9 Figure 2 Overview of sources of food for wealth groups in Mauritania .................................................................................... 11 Figure 3 Overview of sources of income for wealth groups in Mauritania ............................................................................... 12 Figure 4 Overview of total income (in MRO 10,000) by wealth group and livelihood zone in Mauritania ............................... 12 Figure 5 Seasonal calendar for the Nomadic Pastoralism Zone ................................................................................................ 14 Figure 6 Breakdown of sources of food by wealth group in the Nomadic Pastoralism Zone .................................................... 15 Figure 7 Breakdown of sources of income by wealth group in the Nomadic Pastoralism Zone ............................................... 15 Figure 8 Breakdown of expenditures by wealth group in the Nomadic Pastoralism Zone........................................................ 15 Figure 9 Food access calendar for poor households in the Nomadic Pastoralism Zone............................................................ 16 Figure 10 Seasonal calendar for the Mining and Pastoralism Zone ........................................................................................... 18 Figure 11 Breakdown of sources of food by wealth group in the Mining and Pastoralism Zone .............................................. 19 Figure 12 Breakdown of sources of income by wealth group in the Mining and Pastoralism Zone ......................................... 19 Figure 13 Breakdown of household expenditures by wealth group in the Mining and Pastoralism Zone ................................ 20 Figure 14 Main food, income, and expenditure cycles of poor households in the Mining and Pastoralism Zone .................... 21 Figure 15 Seasonal calendar for the Coastal Fishing Zone......................................................................................................... 22 Figure 16 Breakdown of sources of food by wealth group in the Coastal Fishing Zone ............................................................ 23 Figure 17 Breakdown of sources of income by wealth group in the Coastal Fishing Zone ....................................................... 23 Figure 18 Breakdown of expenditures by wealth group in the Coastal Fishing Zone ................................................................ 24 Figure 19 Main food, income, and expenditure cycles of poor households in the Coastal Fishing Zone .................................. 24

MAURITANIA Livelihood Profile May 2015
Famine Early Warning Systems Network iv
Figure 20 Seasonal calendar for the Pastoralism and Trade Zone ............................................................................................. 25 Figure 21 Breakdown of sources of food by wealth group in the Pastoralism and Trade Zone ................................................ 26 Figure 22 Breakdown of sources of income by wealth group in the Pastoralism and Trade Zone ........................................... 26 Figure 23 Breakdown of expenditures in the Pastoralism and Trade Zone ............................................................................... 27 Figure 24 Main food, income, and expenditure cycles of poor households in the Pastoralism and Trade Zone ...................... 28 Figure 25 Seasonal calendar for the Transhumant Pastoralism Zone ....................................................................................... 30 Figure 26 Breakdown of sources of food by wealth group in the Transhumant Pastoralism Zone ........................................... 31 Figure 27 Breakdown of sources of income by wealth group in the Transhumant Pastoralism Zone ...................................... 31 Figure 28 Breakdown of expenditures by wealth group in the Transhumant Pastoralism Zone .............................................. 31 Figure 29 Main food, income, and expenditure cycles of poor households in the Transhumant Pastoralism Zone................. 32 Figure 30 Seasonal calendar for the Agro-Pastoral Zone........................................................................................................... 34 Figure 31 Breakdown of sources of food by wealth group in the Agro-Pastoral Zone .............................................................. 35 Figure 32 Breakdown of sources of income by wealth group in the Agro-Pastoral Zone ......................................................... 35 Figure 33 Breakdown of expenditures by wealth group in the Agro-Pastoral Zone .................................................................. 35 Figure 34 Main food, income, and expenditure cycles of poor households in the Agro-Pastoral Zone .................................... 36 Figure 35 Seasonal calendar for the Senegal River Valley Zone ................................................................................................ 38 Figure 36 Breakdown of sources of food by wealth group in the Senegal River Valley Zone.................................................... 39 Figure 37 Breakdown of sources of income by wealth group in the Senegal River Valley Zone ............................................... 39 Figure 38 Breakdown of expenditures by wealth group in the Senegal River Valley Zone ....................................................... 40 Figure 39 Main food, income, and expenditure cycles of poor households in the Senegal River Valley Zone ......................... 40 Figure 40 Seasonal calendar for the Rainfed Cultivation Zone .................................................................................................. 43 Figure 41 Breakdown of sources of food by wealth group in the Rainfed Cultivation Zone ..................................................... 44 Figure 42 Breakdown of sources of income by wealth group in the Rainfed Cultivation Zone ................................................. 44 Figure 43 Breakdown of expenditures by wealth group in the Rainfed Cultivation Zone ......................................................... 45 Figure 44 Main food, income, and expenditure cycles of poor households in the Rainfed Cultivation Zone ........................... 45
LIST OF TABLES Table 1 Drivers of wealth in the Nomadic Pastoralism Zone ..................................................................................................... 14 Table 2 Drivers of wealth in the Mining and Pastoralism Zone ................................................................................................. 18 Table 3 Drivers of wealth in the Coastal Fishing Zone ............................................................................................................... 23 Table 4 Drivers of wealth in the Pastoralism and Trade Zone ................................................................................................... 26 Table 5 Drivers of wealth in the Transhumant Pastoralism Zone .............................................................................................. 30 Table 6 Drivers of wealth in the Agro-Pastoral Zone ................................................................................................................. 34 Table 7 Drivers of wealth in the Senegal River Valley Zone ....................................................................................................... 38 Table 8 Drivers of wealth in the Rainfed Cultivation Zone ........................................................................................................ 43

MAURITANIA Livelihood Profile May 2015
Famine Early Warning Systems Network v
ACKNOWLEDGMENTS This "rapid baseline" assessment, which will form part of the knowledge base for FEW NET’s food security monitoring activities in Mauritania, was led by Maman Bachir Yacouba (FEWS NET) with technical support from Yelli Gandega (FEWS NET) and conducted in conjunction with FEW NET’s main partners in Mauritania, namely the national Food Security Commission (Commissariat à la Sécurité Alimentaire), the Rural Development Ministry, the Food and Agriculture Organization (FAO), Action Against Hunger (ACF), Oxfam, the Association for Nutrition and Development (Association pour la Nutrition et le Développement - ANED), and the NGO ACORD (Agency for Cooperation and Research in Development). We would like to personally thank team members Faye Ousmane, Brahim Ould Beye, Mouhamed Ould Bacar, Mohamed Ould Baha, Abdarahmane Ould Ahmedou, Mohamed Ould Tourad, Mouhamed Lemine Ould Mafoud, Abdoulaye Dia, Diougou Seck, Sall Mohamed Djibril, Kane Oumar, Barry Abdoulaye Mamadou, Salikou Ould Aghoub, and Ahmed Baba Ould Deid for their tireless efforts to help establish the livelihood profiles. Lastly, we wish to thank all members of the village community involved in collecting the field data for their patience, without which this data collection and analysis would not have been possible. We extend special thanks to the FEWS NET team in Mauritania and, in particular, to Dr. Sy Hamady Samba, FEWS NET’s Technical Country Director in Mauritania, who gave us the benefit of his extensive field experience, Raby Ly, the Office Manager, who spared no effort to help facilitate every step of our work, and Mamadou Issa, the Project Driver, for his ready availability and graciousness.

MAURITANIA Livelihood Profile May 2015
Famine Early Warning Systems Network vi
ACRONYMS, ABBREVIATIONS, AND TERMINOLOGY ACF Action Contre la Faim (Action Against Hunger) ACORD Agency for Cooperation and Research in Development ANED Association pour la Nutrition et le Développement (Association for Nutrition and Development) CSA Commissariat à la Sécurité Alimentaire (Food Security Commission) Diéri Rainfed farming area FEWS NET Famine Early Warning Systems Network FEG Food Economy Group FAO Food and Agriculture Organization (of the United Nations) HEA Household Economy Approach ITF Intertropical front MDR Ministère du Développement Rural (Ministry of Rural Development) Moughataa Level 2 administrative unit (department) MGO Mauritanian ouguiya NGO Nongovernmental organization SNIM Société Nationale Industrielle et Minière (National Industrial and Mining Company) SONADER Société Nationale de Développement Rural (National Rural Development Company) Walo Floodplain farming area WFP World Food Programme (of the United Nations) Wilaya Level 1 administrative unit (Arabic for region)

MAURITANIA Livelihood Profile May 2015
Famine Early Warning Systems Network 7
OVERVIEW OF THE HOUSEHOLD ECONOMY APPROACH The Household Economy Approach (HEA) is a livelihood-based analytical framework for studying the ways in which households gain access to the consumer goods they need to survive and maintain their livelihoods. Thus, this approach helps to establish household food and nonfood needs and to identify appropriate means of assistance in the form of short- or long-term emergency assistance, development, or reform programs. The HEA is an analytical framework; it is not a specific data collection method. The HEA defines the type of data to be collected and the way in which to analyze the data to provide answers to a particular set of questions. It is a framework for organizing a vast array of information including, but not limited to, local knowledge, census data, and crop or agropastoral production data. The HEA serves as a means of making practical use of any existing secondary sources of information, as well as sources of primary data. The HEA defines a livelihood zone as a geographic area in which households meet their basic survival needs, mainly for food and income, in relatively similar ways. Thus, they represent similar wealth groups with similar asset bases and relatively similar patterns of consumption. These similarities hold true in both normal and bad years. The coping strategies devised in response to shocks within the same livelihood zone are also relatively similar. The livelihood profiles presented in this report help facilitate livelihood and food security analysis and monitoring efforts. They provide a geographic context and database for establishing monitoring systems and interpreting the relative importance of monitoring data on production, prices, and other indicators. They are points of reference against which observations on current conditions can be compared. They also describe how livelihoods and food security may be affected by shocks. The profiles presented on the following pages furnish detailed quantitative data on the sources of food and income and coping strategies of the three wealth groups in each livelihood zone in Mauritania, as well as on drivers of wealth, expenditures, seasonal calendars, and the food access of poor households. For more information on the HEA approach, visit: http://www.fews.net or download “Application of the Livelihood Zone Maps and Profiles for Food Security Analysis and Early Warning.”

MAURITANIA Livelihood Profile May 2015
Famine Early Warning Systems Network 8
THE HOUSEHOLD ECONOMY APPROACH IN MAURITANIA In 2001, FEWS NET conducted an HEA training workshop in Mauritania with technical support from the Food Economy Group (FEG). The workshop’s dual objectives were to build the capacity of food security stakeholders and FEWS NET’s own regional staff and to establish Mauritania’s first food economy zone map. In 2004/05, FEWS NET and its partners (the CSA (Food Security Commission), FAO, World Food Programme/WFP, and NGOs) developed simple livelihood profiles based on the seven food economy zones defined in 2001. The degree of quantification of sources of food and income in these simple profiles was comparatively less detailed than in standard profiles and the quantification was relative and proportional rather than absolute. In addition, the data were based on interviews conducted at the “moughataa” (department) level and in one or two representative villages. In 2013, FEWS NET organized a workshop followed by a field visit in conjunction with Action Against Hunger (ACF) to update the food economy zone map. A livelihood zone map was drawn up with input from the Mauritanian government and various partners. This update divided Mauritania into nine distinct livelihood zones. In 2014, FEWS NET established rapid livelihood profiles for eight of Mauritania’s nine livelihood zones with the help of the CSA, FAO, ACF, and other partners. A four-day training workshop was held in Nouakchott from May 4-7, 2014, followed by a field mission to representative wilayas (regions) from May 8-21, 2014, including 32 villages selected from a purposive sample of “typical local villages” (see Annex 1 for a list of wilayas and villages visited by the mission). The selected villages were visited by a team of food security experts for the collection of quantitative data for profiling purposes. The HEA yields an assessment based on the different wealth groups in each livelihood zone. Wealth groups are typically defined in terms of their land and livestock holdings, capital, education, skills, available supply of labor, and/or social capital. While a household’s place of residence is a determining factor in its options for obtaining food and generating income, wealth is the main deciding factor in a household’s ability to take advantage of the available options in any given area. For example, better-off households obviously have larger landholdings that generally produce larger harvests and make those households more food-secure than their poorer neighbors. The reference year used for the purposes of this exercise was the last full consumption year (2013 or 2013/14), which was marked by near-average rainfall conditions, a stable epidemiological situation, an acceptable level of pasture production compared with the average, and staple food prices at levels relatively close to the five-year average. Zone 3 (Pastoralism – Oases and Wadis), for which a group of partners, including FEWS NET, had previously established a detailed profile in March 2014, was not included in the scope of work. The baseline profile for Zone 3 developed as part of this activity is available in French on FEWS NET’s website.
MAURITANIA Livelihood Profile May 2015
Famine Early Warning Systems Network 9
RURAL LIVELIHOODS IN MAURITANIA Climatic conditions in Mauritania basically depend on the interaction of the following three quasi-permanent subtropical highs or anticyclones:
The Azores High or Anticyclone, producing the northern trade winds (cool winds laden with water vapor whose effect is limited to the western edge of Mauritania);
The Sahara Anticyclone, producing the harmattan winds (hot, dry winds in the east part of the country); and
The Saint-Helena Anticyclone, producing the monsoons (warm, extremely humid winds in southwestern areas of the country).
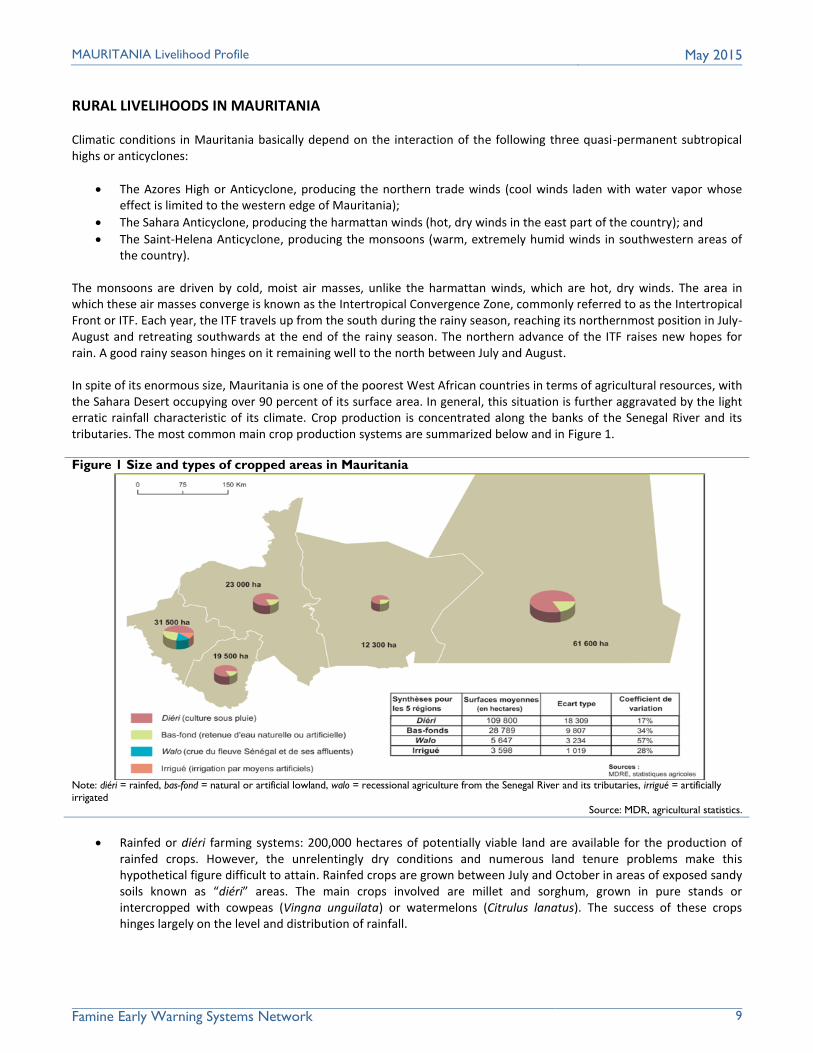
The monsoons are driven by cold, moist air masses, unlike the harmattan winds, which are hot, dry winds. The area in which these air masses converge is known as the Intertropical Convergence Zone, commonly referred to as the Intertropical Front or ITF. Each year, the ITF travels up from the south during the rainy season, reaching its northernmost position in July-August and retreating southwards at the end of the rainy season. The northern advance of the ITF raises new hopes for rain. A good rainy season hinges on it remaining well to the north between July and August. In spite of its enormous size, Mauritania is one of the poorest West African countries in terms of agricultural resources, with the Sahara Desert occupying over 90 percent of its surface area. In general, this situation is further aggravated by the light erratic rainfall characteristic of its climate. Crop production is concentrated along the banks of the Senegal River and its tributaries. The most common main crop production systems are summarized below and in Figure 1.
Figure 1 Size and types of cropped areas in Mauritania
Note: diéri = rainfed, bas-fond = natural or artificial lowland, walo = recessional agriculture from the Senegal River and its tributaries, irrigué = artificially
irrigated
Source: MDR, agricultural statistics.
Rainfed or diéri farming systems: 200,000 hectares of potentially viable land are available for the production of rainfed crops. However, the unrelentingly dry conditions and numerous land tenure problems make this hypothetical figure difficult to attain. Rainfed crops are grown between July and October in areas of exposed sandy soils known as “diéri” areas. The main crops involved are millet and sorghum, grown in pure stands or intercropped with cowpeas (Vingna unguilata) or watermelons (Citrulus lanatus). The success of these crops hinges largely on the level and distribution of rainfall.
MAURITANIA Livelihood Profile May 2015
Famine Early Warning Systems Network 10
Floodplain or walo farming systems: The cultivation of walo crops depends on runoff from the flooding of the Senegal River and its various tributaries. Up to approximately 200,000 hectares of land are planted in these crops, with a potential viable cropping area of 250,000 hectares, depending on the flood stage of the river. Flood recession crops (sorghum, maize, and cowpeas), which depend both on the flooding of the river (the flood level and duration of the flooding period) and on the flood recession period, are grown in the off-season (from November to March). Planting dates and crop calendars are closely correlated with the rate of fall of the river.
Irrigated farming systems: The Mauritanian government embarked on an ambitious development program for the Senegal River Valley in 1967 in conjunction with the neighboring states of Mali and Senegal in an effort to improve food self-sufficiency and, thus, improve the standard of living of its population. This development policy was dictated by the haphazard nature of crop production due to the country’s precarious climatic conditions. The result was the development and operationalization of small village-level irrigation schemes (PPV – petits périmètres villageois) and large-scale irrigation systems (GP – grands périmètres) growing rice during the rainy season and maize or sorghum during the hot or cold off-season.
Lowland farming systems: Crops are grown in areas behind small dams and in wadi beds. The area planted in these crops is about 10,000 hectares, with potential expansion to another 20,000 hectares. This is a variation on floodplain farming systems in which crops are grown on the banks of wadis and in flood-spreading areas. Under downstream farming systems, crops are planted directly in the bed of a stream or river whose waters are retained by an earthen dam serving as a type of controlled dike.
Oasis farming systems: Dates are the main crop grown under oasis farming systems, intercropped with pulses, forage plants (alfalfa), and other cereal crops (wheat and barley).
Livestock-raising systems: The leading rural livelihood in Mauritania is livestock-raising, characterized by four main production systems:
Nomadic pastoral systems;
Transhumant pastoral and agropastoral systems;
Agropastoral systems with a mix of farming and sedentary livestock-raising activities; and
Extensive urban systems and semi-intensive systems. Most livestock-raising systems are extensive systems that over the past few years have evolved into other forms such as intensive feedlots for sheep (generally operated by women for periods of three to six months) and sedentary systems in which all types of animals are raised together within a few kilometers radius from the village. The most severe shocks to the livestock sector were in the two drought years, 1978-79 and 1984-85, when livestock herds in general and cattle herds in particular were decimated. However, these herds have since been rebuilt and livestock-raising remains an important economic activity well-suited to the different environmental conditions found in Mauritania.
Most cattle herds are confined to the southern part of the country, beginning at the 150-mm isohyet.
Small ruminants (sheep and goats) are found in all parts of the country, with heavy concentrations in the south-east.
For the most part, nomadic camel herds roam north of the 40-mm isohyet, with the largest concentrations found on the coast, drawn by the salt pastures in that area highly sought after by camels and dromedaries.
MAURITANIA Livelihood Profile May 2015
Famine Early Warning Systems Network 11
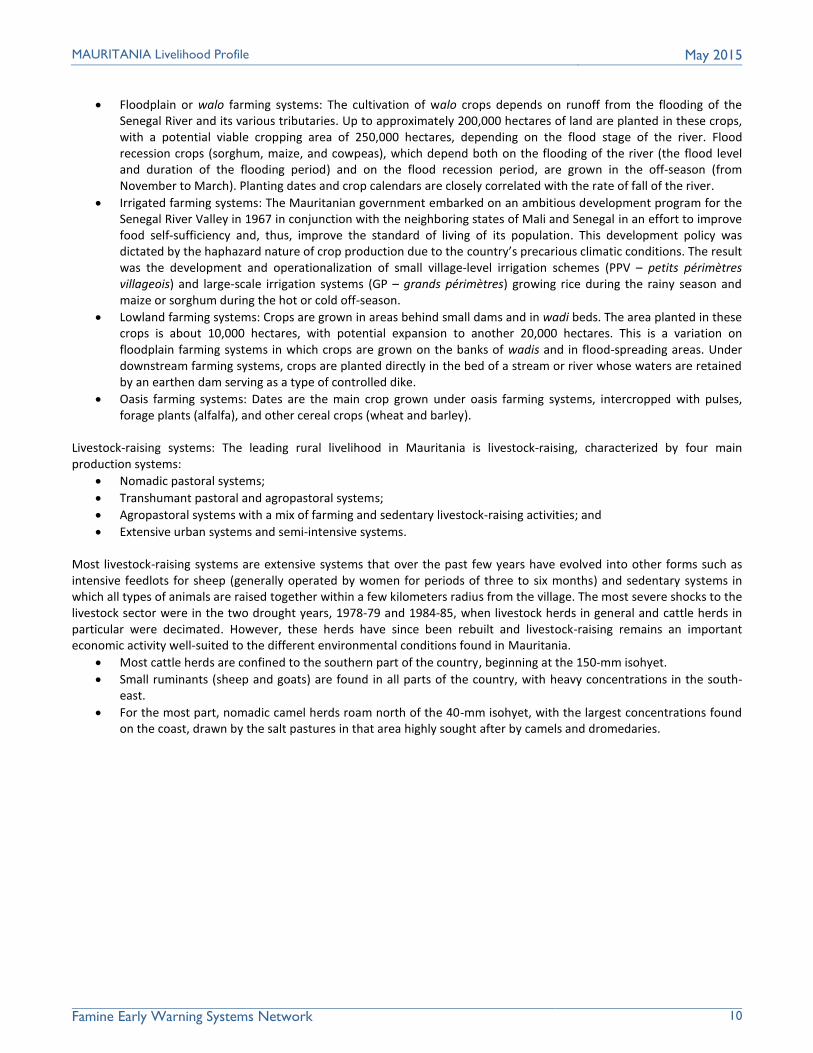
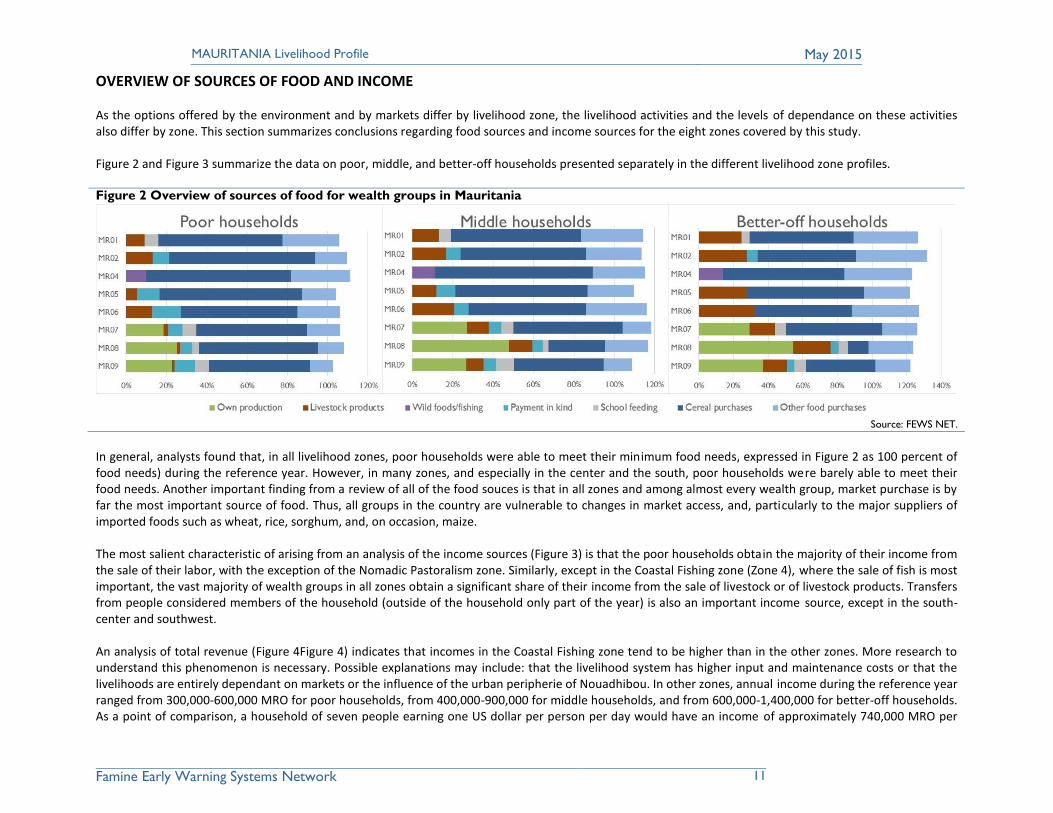
OVERVIEW OF SOURCES OF FOOD AND INCOME As the options offered by the environment and by markets differ by livelihood zone, the livelihood activities and the levels of dependance on these activities also differ by zone. This section summarizes conclusions regarding food sources and income sources for the eight zones covered by this study. Figure 2 and Figure 3 summarize the data on poor, middle, and better-off households presented separately in the different livelihood zone profiles. Figure 2 Overview of sources of food for wealth groups in Mauritania
Source: FEWS NET.
In general, analysts found that, in all livelihood zones, poor households were able to meet their minimum food needs, expressed in Figure 2 as 100 percent of food needs) during the reference year. However, in many zones, and especially in the center and the south, poor households were barely able to meet their food needs. Another important finding from a review of all of the food souces is that in all zones and among almost every wealth group, market purchase is by far the most important source of food. Thus, all groups in the country are vulnerable to changes in market access, and, particularly to the major suppliers of imported foods such as wheat, rice, sorghum, and, on occasion, maize. The most salient characteristic of arising from an analysis of the income sources (Figure 3) is that the poor households obtain the majority of their income from the sale of their labor, with the exception of the Nomadic Pastoralism zone. Similarly, except in the Coastal Fishing zone (Zone 4), where the sale of fish is most important, the vast majority of wealth groups in all zones obtain a significant share of their income from the sale of livestock or of livestock products. Transfers from people considered members of the household (outside of the household only part of the year) is also an important income source, except in the south-center and southwest. An analysis of total revenue (Figure 4Figure 4) indicates that incomes in the Coastal Fishing zone tend to be higher than in the other zones. More research to understand this phenomenon is necessary. Possible explanations may include: that the livelihood system has higher input and maintenance costs or that the livelihoods are entirely dependant on markets or the influence of the urban peripherie of Nouadhibou. In other zones, annual income during the reference year ranged from 300,000-600,000 MRO for poor households, from 400,000-900,000 for middle households, and from 600,000-1,400,000 for better-off households. As a point of comparison, a household of seven people earning one US dollar per person per day would have an income of approximately 740,000 MRO per

MAURITANIA Livelihood Profile May 2015
Famine Early Warning Systems Network 12
year (according to the average MRO-USD exchange rate from July 2013 to June 2014). This helps to demonstrate the importance of distinguishing between poverty and food insecurity in Mauritania. Figure 3 Overview of sources of income for wealth groups in Mauritania
Source: FEWS NET.
Figure 4 Overview of total income (in MRO 10,000) by wealth group and livelihood zone in Mauritania
Source: FEWS NET.
Mauritania’s livelihood zones are described individually in more detail in the following section.
MAURITANIA Livelihood Profile May 2015
Famine Early Warning Systems Network 13
NOMADIC PASTORALISM (ZONE 1)
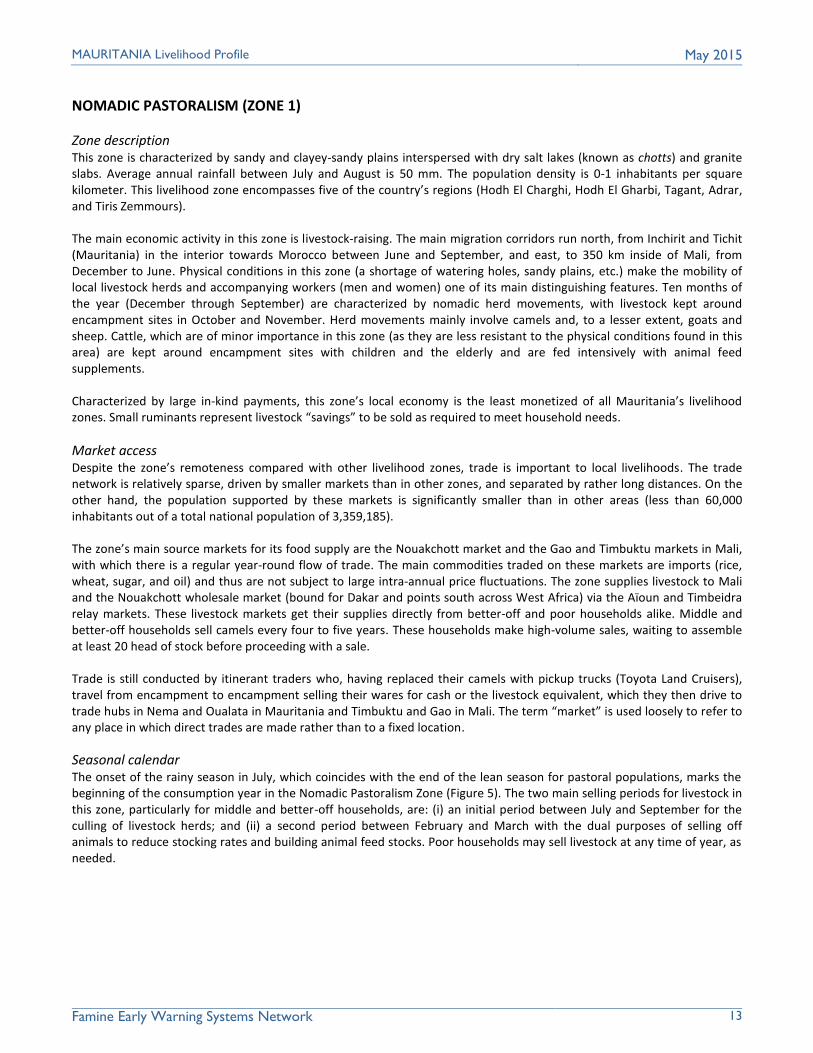
Zone description This zone is characterized by sandy and clayey-sandy plains interspersed with dry salt lakes (known as chotts) and granite slabs. Average annual rainfall between July and August is 50 mm. The population density is 0-1 inhabitants per square kilometer. This livelihood zone encompasses five of the country’s regions (Hodh El Charghi, Hodh El Gharbi, Tagant, Adrar, and Tiris Zemmours). The main economic activity in this zone is livestock-raising. The main migration corridors run north, from Inchirit and Tichit (Mauritania) in the interior towards Morocco between June and September, and east, to 350 km inside of Mali, from December to June. Physical conditions in this zone (a shortage of watering holes, sandy plains, etc.) make the mobility of local livestock herds and accompanying workers (men and women) one of its main distinguishing features. Ten months of the year (December through September) are characterized by nomadic herd movements, with livestock kept around encampment sites in October and November. Herd movements mainly involve camels and, to a lesser extent, goats and sheep. Cattle, which are of minor importance in this zone (as they are less resistant to the physical conditions found in this area) are kept around encampment sites with children and the elderly and are fed intensively with animal feed supplements. Characterized by large in-kind payments, this zone’s local economy is the least monetized of all Mauritania’s livelihood zones. Small ruminants represent livestock “savings” to be sold as required to meet household needs.
Market access Despite the zone’s remoteness compared with other livelihood zones, trade is important to local livelihoods. The trade network is relatively sparse, driven by smaller markets than in other zones, and separated by rather long distances. On the other hand, the population supported by these markets is significantly smaller than in other areas (less than 60,000 inhabitants out of a total national population of 3,359,185). The zone’s main source markets for its food supply are the Nouakchott market and the Gao and Timbuktu markets in Mali, with which there is a regular year-round flow of trade. The main commodities traded on these markets are imports (rice, wheat, sugar, and oil) and thus are not subject to large intra-annual price fluctuations. The zone supplies livestock to Mali and the Nouakchott wholesale market (bound for Dakar and points south across West Africa) via the Aïoun and Timbeidra relay markets. These livestock markets get their supplies directly from better-off and poor households alike. Middle and better-off households sell camels every four to five years. These households make high-volume sales, waiting to assemble at least 20 head of stock before proceeding with a sale. Trade is still conducted by itinerant traders who, having replaced their camels with pickup trucks (Toyota Land Cruisers), travel from encampment to encampment selling their wares for cash or the livestock equivalent, which they then drive to trade hubs in Nema and Oualata in Mauritania and Timbuktu and Gao in Mali. The term “market” is used loosely to refer to any place in which direct trades are made rather than to a fixed location.
Seasonal calendar The onset of the rainy season in July, which coincides with the end of the lean season for pastoral populations, marks the beginning of the consumption year in the Nomadic Pastoralism Zone (Figure 5). The two main selling periods for livestock in this zone, particularly for middle and better-off households, are: (i) an initial period between July and September for the culling of livestock herds; and (ii) a second period between February and March with the dual purposes of selling off animals to reduce stocking rates and building animal feed stocks. Poor households may sell livestock at any time of year, as needed.

MAURITANIA Livelihood Profile May 2015
Famine Early Warning Systems Network 14
Figure 5 Seasonal calendar for the Nomadic Pastoralism Zone
Seasons
Rainy season r r r r r r
Dry season d d d d d d d d d d d d d d d d d d d
Lean season l l l l l l l l
Livestock-raising
At homestead 1 1 1 1
Lactation 2 2 2 2 2 2 2 2 2 2 2 2 2 2
Livestock sales 1 1 1 1 1 1 1 1 1 1 1 1
Hazards
Civil insecurity 2 2 2 2 2 2 2 2 2 2 2 2 2 2 2 2 2 2 2 2 2 2 2 2
Drought 1 1 1 1
peak peak
JuneJuly Aug Sept Oct Nov Dec Jan Feb Mar Apr May
Source: FEWS NET.
Drivers of wealth The population of this zone is relatively evenly divided, with a somewhat larger proportion of better-off households. This is due to the demands of the nomadic pastoral system, whereby any household failing to protect its livestock is no longer able to survive in this area and will abandon this production system. Measures of wealth in this zone are based on the type and size of household livestock holdings. The burden and cost of maintaining camel herds limit poor households’ access to camel holdings, a sign of wealth in this zone. However, they still engage in the same nomadic movements as middle and better-off households. Table 1 shows the concentration of wealth among middle and better-off households, which account for a majority of the population of this zone. The difference in household size reflects the necessary balance among the three wealth groups to sustain the household economy in this zone. Middle and better-off households generally own more animals than can be managed with family labor alone. Thus they employ year-round herdsmen from poor households in other livelihood zones, to whom they provide room and board. Middle households have a single such worker, while better-off households will have two or three. The large size of their herds and the effort required to ensure their maintenance have prompted a number of better-off households to resort to the use of vehicles. The importance of vehicles lies mainly in how they enable herdsmen to transport water to give livestock access to pastures without any natural watering holes. They are also used to transport animal feed and to facilitate direct access to markets in Nouakchott, Morocco, or Mali.
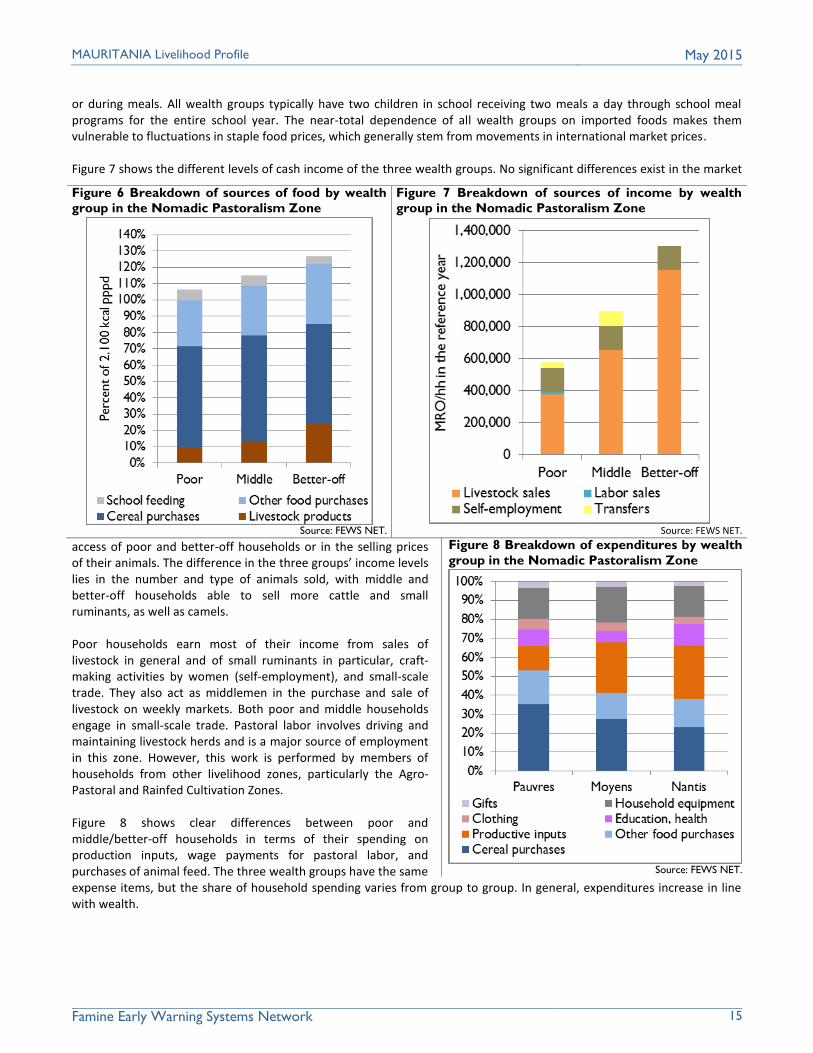
Sources of food, income, and expenditures An analysis of the coverage of minimum household energy needs shows all wealth groups able to meet their energy needs in the reference year (Figure 6). The dietary habits of nomadic households have changed since the establishment of the 2004/05 profile, as reflected in the sharp reduction in the share of animal products from household livestock production as a source of food in favor of purchased supplies of cereals (rice and wheat), sugar, and oil. All wealth groups rely on market purchase to meet over 90 percent of their energy needs. Milk has become a secondary food source, consumed mainly after
Table 1 Drivers of wealth in the Nomadic Pastoralism
Zone
Drivers Poor Middle Better-off
Percentage of households (%) 20-40 25-35 25-50
Household size (#) 6-8 8-9 9-11
Livestock holdings (#)
Sheep 20-50 130-205 300-675
Goats 10-50 20-60 50-150
Cattle 5-15 25-60 50-300
Camels 0 20-100 80-400
Horses 0 1-2 2-3
Other productive assets (#)
Vehicles 0 0 0-1 Source: FEWS NET.
MAURITANIA Livelihood Profile May 2015
Famine Early Warning Systems Network 15
or during meals. All wealth groups typically have two children in school receiving two meals a day through school meal programs for the entire school year. The near-total dependence of all wealth groups on imported foods makes them vulnerable to fluctuations in staple food prices, which generally stem from movements in international market prices. Figure 7 shows the different levels of cash income of the three wealth groups. No significant differences exist in the market
access of poor and better-off households or in the selling prices of their animals. The difference in the three groups’ income levels lies in the number and type of animals sold, with middle and better-off households able to sell more cattle and small ruminants, as well as camels. Poor households earn most of their income from sales of livestock in general and of small ruminants in particular, craft-making activities by women (self-employment), and small-scale trade. They also act as middlemen in the purchase and sale of livestock on weekly markets. Both poor and middle households engage in small-scale trade. Pastoral labor involves driving and maintaining livestock herds and is a major source of employment in this zone. However, this work is performed by members of households from other livelihood zones, particularly the Agro-Pastoral and Rainfed Cultivation Zones. Figure 8 shows clear differences between poor and middle/better-off households in terms of their spending on production inputs, wage payments for pastoral labor, and purchases of animal feed. The three wealth groups have the same expense items, but the share of household spending varies from group to group. In general, expenditures increase in line with wealth.
Figure 6 Breakdown of sources of food by wealth
group in the Nomadic Pastoralism Zone
Source: FEWS NET.
Figure 7 Breakdown of sources of income by wealth
group in the Nomadic Pastoralism Zone
Source: FEWS NET.
Figure 8 Breakdown of expenditures by wealth
group in the Nomadic Pastoralism Zone
Source: FEWS NET.

MAURITANIA Livelihood Profile May 2015
Famine Early Warning Systems Network 16
Poor households spend more on staple foods than the other two groups, which prevents them from making capital outlays on purchases of production inputs for example, the largest of which involve cattle and camels. However, like middle and better-off households, poor households also invest in their children’s health and education. All three groups make very large outlays on household supplies (tea, batteries, etc.) and other foodstuffs (sugar, oil, etc.), which is indicative of the standard of living of nomadic households.
Main sources of food, income, and expenditures of poor households The main staple foods for poor households are rice and wheat, which are consumed year-round (Figure 9). Milk consumption is limited to a five-month period, when households have access to animal products. Unlike middle and better-off households, poor households have three main selling periods for their livestock, coinciding with the lean season for farming populations (August-September), the year-end holiday season (December), and the lean season for pastoral populations (March-April). They also engage in year-round self-employment. Outlays on livestock inputs increase during the lean season. Figure 9 Food access calendar for poor households in the Nomadic Pastoralism Zone
Staple foods
Rice mp mp mp mp mp mp mp mp mp mp mp mp mp mp mp mp mp mp mp mp mp mp mp mp
Wheat mp mp mp mp mp mp mp mp mp mp mp mp mp mp mp mp mp mp mp mp mp mp mp mp
Milk op op op op op op op op op op
Income
Livestock sales 1 1 1 1 1 1 1 1 1 1
Self-employment 2 2 2 2 2 2 2 2 2 2 2 2 2 2 2 2 2 2 2 2 2 2 2 2
Petty trade 1 1 1 1 1 1 1 1 1 1 1 1 1 1 1 1 1 1 1 1 1 1 1 1
Expenditures
Staple foods 2 2 2 2 2 2 2 2 2 2 2 2 2 2 2 2 2 2 2 2 2 2 2 2
Inputs 1 1 1 1 1 1 1 1
Legend op op Own production mp mp Market purchase ik ik In-kind c c Gathering
JuneJuly Aug Sept Oct Nov Dec Jan Feb Mar Apr May
Source: FEWS NET.
Hazards and coping strategies Drought is the most frequent hazard. It limits mobility by aggravating existing shortages of animal watering holes, which are already a critical problem even in a normal year. The lack of pastures and watering holes in bad rainfall years will trigger heavy sales of animals, particularly by poor households with little maneuvering room. Livestock disease outbreaks can kill excessive numbers of animals, depleting the productive assets of households in this zone. They can also weaken market demand for local livestock. Coping strategies used mainly by poor households with limited means and a limited ability to bear the cost of maintaining their herds for long periods of time include earlier than usual migration, a shift to alternate migration routes, taking livestock farther than usual into Guinea or Senegal, and the thinning of their herds.

MAURITANIA Livelihood Profile May 2015
Famine Early Warning Systems Network 17
MINING AND PASTORALISM (ZONE 2)
Zone description This zone is characterized by areas with plains, mountains, and dunes, and sandy and rocky soils. Average annual rainfall between August and September is around 100 mm. Thus, average cumulative rainfall is too low to support farming activities but high enough to sustain vegetation, consisting mostly of desert shrub and bush-covered steppes. Poor water access for household, livestock, and agricultural use results in a low population density of less than one inhabitant per square kilometer. However, the mining sector has enormous potential. Mauritania is Africa’s second largest exporter of iron and ranks thirteenth in the world. Its national mining company, SNIM (Société Nationale Industrielle et Minière), exported 11 million metric tons of iron in 2008. Most working mines are located along the coast and in this northern area of Mauritania. This livelihood zone includes parts of the Inchirit, Tiris Zemmour, Dakhl, and Nouadhibou regions or wilayas. Most mining operations are industrial mines at sites scattered across the area. Households in the settlements gradually forming around these mining sites earn their livelihoods mainly from skilled and unskilled work in the mines and from relatively intensive and peri-urban camel- and goat-raising activities. A working railway line built in 1963 for the extraction and shipping of iron is operated by the national enterprise in charge of marketing the iron. The railroad also transports water into the area and carries both passengers and goods. Thus the railroad is the area’s main supply line for drinking water, supplying the entire area with water with each trip. The associated construction activities and supplies of goods and services brought in by the SNIM were designed to stimulate business activity in this zone. In fact, certain small-scale entrepreneurs and local suppliers profit from these business opportunities. In addition, multiplier effects in the form of purchases by workers from local shops and businesses stimulate trade, the craft industry (the tertiary sector), and possibly the manufacturing sector.
Market access The railway line between Zouerate and Nouadhibou ensures the conduct of business and trade. The flow of trade in food (including imports) and livestock is two-way, with food supplies shipped from Nouadhibou to Zouerate and livestock shipped in the opposite direction. Poor households do very little business on the area’s major food markets (Akjout, Atar, and Zouerate); their role is limited to that of consumers. Peri-urban livestock-raising activities afford no job opportunities for poor households, as they rely exclusively on family labor. Thus, the labor market basically involves skilled and unskilled work in the mines. Skilled laborers are hired under full-time employment contracts, while unskilled laborers are generally hired as temporary or casual workers.
Seasonal calendar Mining operations in this area have a stable volume of activity, though there could be a few slack periods for unskilled job seekers (who may get only three or four days of work in a particular month). Demand outstrips the available supply of labor from resident households in this area (making the zone a net importer of labor). The second most important activity in this area is livestock-raising, both as a source of income from livestock sales and as a source of food from milk production. Livestock-raising is equally important for poor, middle, and better-off households. With income generation by local households unaffected by seasonal factors and the dependence of the local population on imported commodities, minimal intra-annual fluctuations are seen in household income and prices, which explains the lack of a lean season in this zone. The selected reference year for the Mining and Pastoralism Zone runs from January 2013 through December 2013 (Figure 10). The decision to use the calendar year is attributable to the urban nature of this zone and the role played by the mining sector in the local economy. All economic activities revolve around the mining industry and are pursued year-round. Accordingly, their lack of mobility obliges households in this livelihood zone to feed and water their livestock with purchased supplies of high-cost animal feed and water for part of the year, between May and the beginning of August.

MAURITANIA Livelihood Profile May 2015
Famine Early Warning Systems Network 18
Figure 10 Seasonal calendar for the Mining and Pastoralism Zone
Seasons
Rainy season r r r r
Dry season d d d d d d d d d d d d d d d d d d d d
Lean season l l l l l l l
Livestock-raising
Livestock sales 1 1 1 1 1 1 1 1 1 1 1 1
Lactation 2 2 2 2 2 2 2 2 2 2 2 2
Other
Work in the mines 1 1 1 1 1 1 1 1 1 1 1 1 1 1 1 1 1 1 1 1 1 1 1 1
Hazards
Drought 1 1 1 1
Drop in ore prices 2 2 2 2 2 2 2 2 2 2 2 2 2 2 2 2 2 2 2 2 2 2 2 2
DecJan Feb Mar Apr May June July Aug Sept Oct Nov
Source: FEWS NET.
Drivers of wealth Poor households account for approximately half of all households in this zone ( Table 2). Poor and middle households have only unskilled workers, unlike better-off households, whose members include at least one skilled worker. Access to income from formal employment and skilled labor provides middle and better-off households with the extra income needed to purchase and maintain larger herds of more lucrative animals (camels). Most goat-raising activities are small-scale operations, which explains the lack of any visible difference in the small
ruminant holdings of poor, middle, and better-off households.
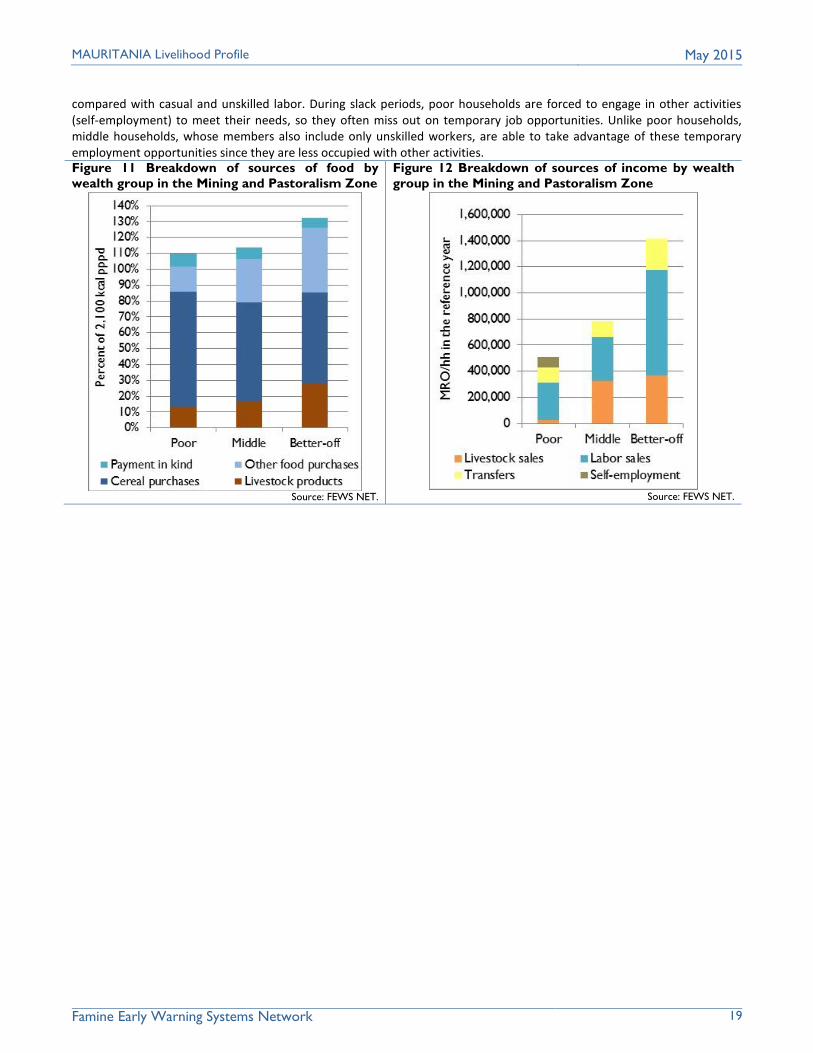
Sources of food, Income, and expenditures The breakdown of food sources is relatively similar for all wealth groups and is relatively diversified compared with other livelihood zones. All three wealth groups are market-dependent for 90-100 percent of their supply of dietary staples (rice and
wheat) and other foods (sugar, oil, milk, and meat). Area households also consume milk produced by their own animal herds, though only between September and February. In-kind payments are considered food consumed by household members outside the home while engaged in short-term seasonal labor migration, working in a mine, etc. In general, all three wealth groups are able to meet their annual energy needs. However, they are almost entirely market-dependent and vulnerable to fluctuations in food prices on international markets (Figure 11). Income sources in the zone are rather limited. Despite this, poor households earn sufficient income to purchase almost all of their minimum caloric needs (Figure 12). The difference in wealth groups’ incomes lies in their proceeds from the sale of livestock and employment income. Disparities in their employment income are due to the difference in pay for skilled labor
Drivers Poor Middle Better-off
Percentage of households (%) 40-60 25-35 15-25
Household size (#) 5-7 6-8 8-9
Livestock holdings (#)
Goats 5-20 10-20 25-35
Camels 0 10-20 20-40
Other productive assets (#)
Skilled labor 0 0-1 1-2
Unskilled labor 1 1 0-2
Table 2 Drivers of wealth in the Mining and Pastoralism
Zone
Source: FEWS NET.
Drivers Poor Middle Better-off
Percentage of households (%) 40-60 25-35 15-25
Household size (#) 5-7 6-8 8-9
Livestock holdings (#)
Goats 5-20 10-20 25-35
Camels 0 10-20 20-40
Other productive assets (#)
Skilled labor 0 0-1 1-2
Unskilled labor 1 1 0-2
MAURITANIA Livelihood Profile May 2015
Famine Early Warning Systems Network 19
compared with casual and unskilled labor. During slack periods, poor households are forced to engage in other activities (self-employment) to meet their needs, so they often miss out on temporary job opportunities. Unlike poor households, middle households, whose members also include only unskilled workers, are able to take advantage of these temporary employment opportunities since they are less occupied with other activities. Figure 11 Breakdown of sources of food by
wealth group in the Mining and Pastoralism Zone
Source: FEWS NET.
Figure 12 Breakdown of sources of income by wealth
group in the Mining and Pastoralism Zone
Source: FEWS NET.
MAURITANIA Livelihood Profile May 2015
Famine Early Warning Systems Network 20
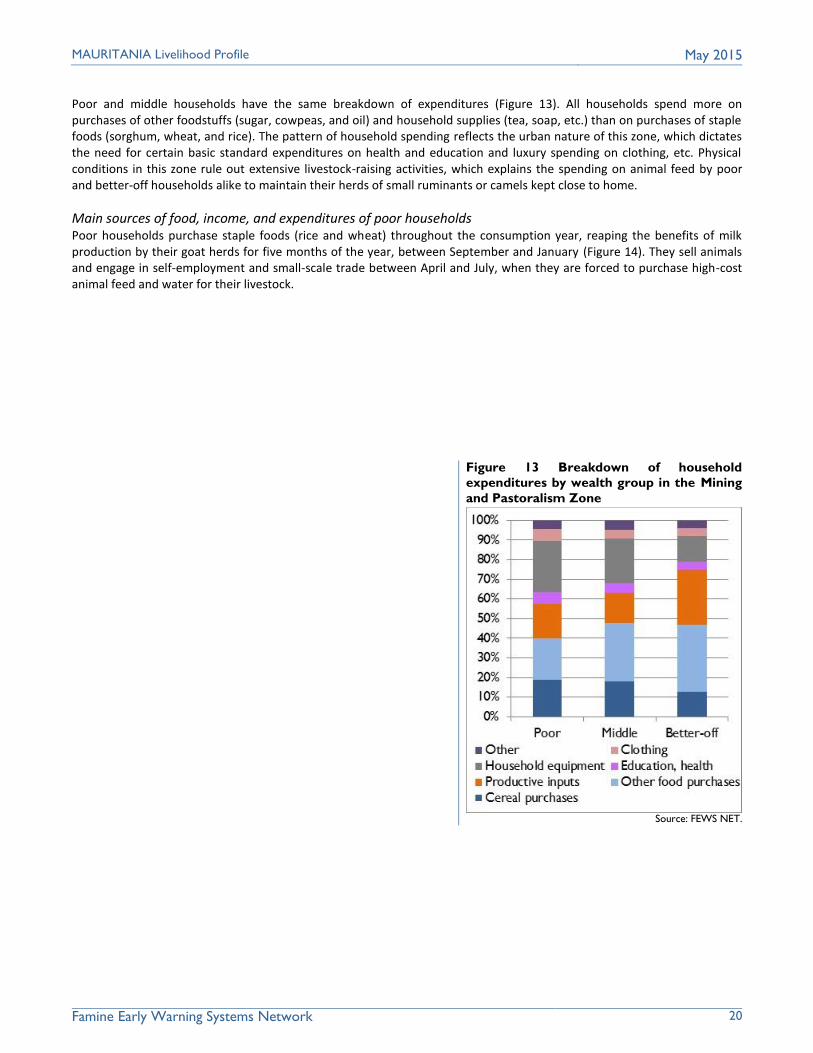
Poor and middle households have the same breakdown of expenditures (Figure 13). All households spend more on purchases of other foodstuffs (sugar, cowpeas, and oil) and household supplies (tea, soap, etc.) than on purchases of staple foods (sorghum, wheat, and rice). The pattern of household spending reflects the urban nature of this zone, which dictates the need for certain basic standard expenditures on health and education and luxury spending on clothing, etc. Physical conditions in this zone rule out extensive livestock-raising activities, which explains the spending on animal feed by poor and better-off households alike to maintain their herds of small ruminants or camels kept close to home.
Main sources of food, income, and expenditures of poor households Poor households purchase staple foods (rice and wheat) throughout the consumption year, reaping the benefits of milk production by their goat herds for five months of the year, between September and January (Figure 14). They sell animals and engage in self-employment and small-scale trade between April and July, when they are forced to purchase high-cost animal feed and water for their livestock.
Figure 13 Breakdown of household
expenditures by wealth group in the Mining
and Pastoralism Zone
Source: FEWS NET.

MAURITANIA Livelihood Profile May 2015
Famine Early Warning Systems Network 21
Figure 14 Main food, income, and expenditure cycles of poor households in the Mining and Pastoralism Zone
Staple foods
Rice mp mp mp mp mp mp mp mp mp mp mp mp mp mp mp mp mp mp mp mp
Wheat mp mp mp mp mp mp mp mp mp mp mp mp mp mp mp mp
Milk op op op op op op op op op op
Income
Livestock sales 1 1 1 1 1 1 1 1
Self employment 2 2 2 2 2 2 2 2 2 2 2 2
Petty trade 1 1 1 1 1 1 1 1 1 1 1 1
Expenditures
Staple foods 2 2 2 2 2 2 2 2 2 2 2 2 2 2 2 2 2 2 2 2 2 2 2 2
Inputs 1 1 1 1 1 1 1 1 1 1 1 1 1 1 1
Legend op op Own production mp mp Market purchase ik ik In-kind c c Gathering
Nov DecMay June July Aug Sept OctJan Feb Mar Apr
Source: FEWS NET.
Hazards and coping strategies This zone is hit by droughts relatively infrequently, about once every five years. The most noticeable impact of drought is on access to water for livestock and the higher than usual cost of animal feed. Local households will consume hardly any milk from their animals during drought years, replacing it with powdered milk or cereals. While the lack or replacement of milk produced by household livestock herds is not a major issue, the decline in livestock prices triggered by the heavier volume of animal sales could present a problem for poor households, which may not have enough animals to sell to offset their higher than usual herd maintenance costs. World market prices for ore in general and for iron and uranium ore in particular do not often fall, but when they do the impact is quite significant. In particular, this event affects the demand for temporary labor used by the mining industry to handle an overly large workload or growth in business. These temporary jobs are generally filled with day laborers. The main low-cost coping strategies used by local households include cutting certain nonessential spending and replacing more expensive foods with less expensive items (that is, substituting wheat for rice). In difficult years, many poor households migrate earlier or longer than usual to work on farms in areas with lowland agriculture, on the banks of wadis, and in oasis areas more intensively than usual.
MAURITANIA Livelihood Profile May 2015
Famine Early Warning Systems Network 22
COASTAL FISHING (ZONE 4)
Zone description The west coast of Mauritania is a desert area with inland dunes and infertile, dry, sandy soils. The area gets less than 50 mm of rain per year between July and September. Thus most of the area’s plant cover consists of desert and/or halophytic plant species, including mangrove and tamarisk (salt cedar) trees. Lacking a sufficient supply of fresh water for farming, even with irrigation, and with its ready access to the sea, this zone’s main economic activity is fishing. A relatively well-developed international tourism industry exists in the Banc d’Argain area, a nature reserve where traditional fishermen earn a profit by renting small boats known as “pirogues” to tourists. There are two coastal fishing areas: an open area in which the use of pirogues and nets is permitted and a closed area in which only fishing lines can be used as a protective measure. The closed area is considered a protected area, particularly for reproduction.
The zone has two main fishing seasons, separated by a biological rest period to allow fish to breed. The first season runs from October to March and the second from May to August. Women produce handicrafts during the breeding season and work in cooperatives year-round. This livelihood zone is adjacent to Mauritania’s two largest cities: the capital Nouakchott, with a population of approximately 750,000, and Nouadhibou, with a population of approximately 90,000-100,000. However, this rural livelihood zone has a low population density of roughly one inhabitant per square kilometer, with most of its population concentrated in the area between the sea and the road between Nouakchott and Nouadhibou and in peri-urban areas. Thus, as a sideline, some market garden crops are grown in outlying areas of the two cities, where there is better access to fresh water and markets for these perishable crops.
Market access Trade in this area is extremely brisk despite its low market density. Nouakchott and Nouadhibou serve as ports of entry for imported foods and tourists and shipping ports for exports of mineral ore. Prices for cereals and other foodstuffs are relatively stable throughout the year. Most of the working population in this rural area (and, in many cases, in outlying areas of Nouadhibou) is engaged in fishing and related activities. Seasonal workers and newcomers from other parts of the country work in this livelihood zone, engaged in fishing or in fish trade, buying fish from poor households for export to other areas through a network of middlemen.
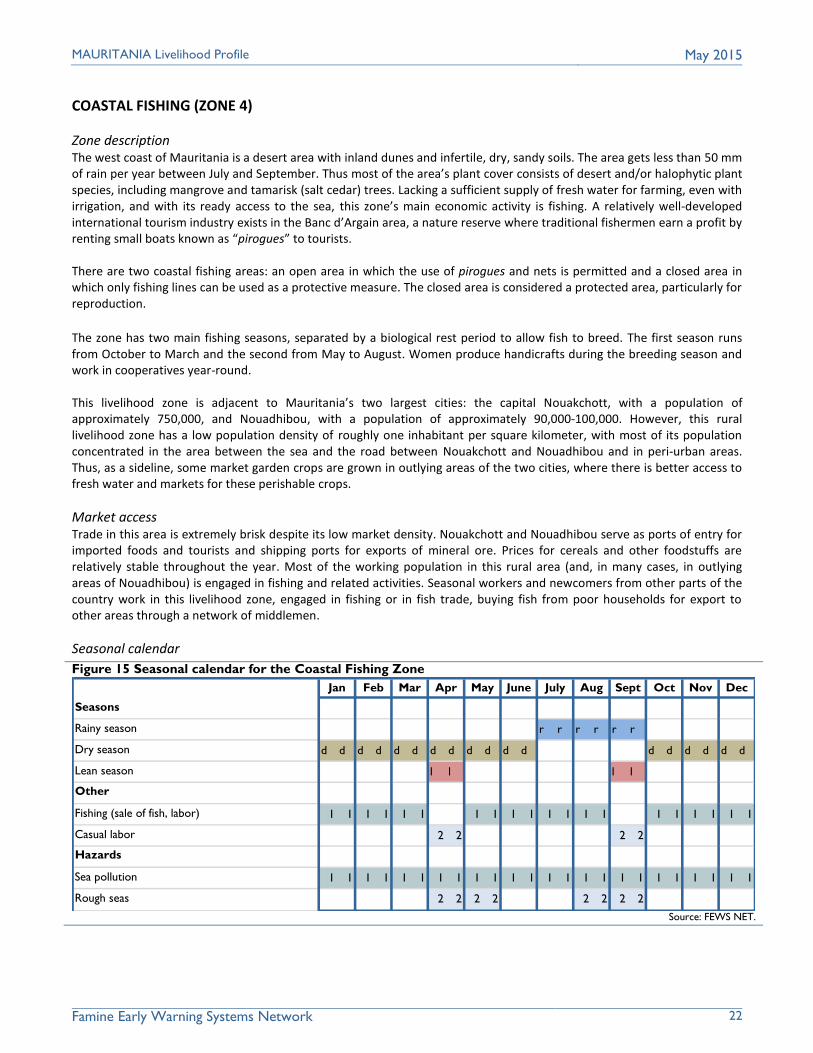
Seasonal calendar
Figure 15 Seasonal calendar for the Coastal Fishing Zone
Seasons
Rainy season r r r r r r
Dry season d d d d d d d d d d d d d d d d d d
Lean season l l l l
Other
Fishing (sale of fish, labor) 1 1 1 1 1 1 1 1 1 1 1 1 1 1 1 1 1 1 1 1
Casual labor 2 2 2 2
Hazards
Sea pollution 1 1 1 1 1 1 1 1 1 1 1 1 1 1 1 1 1 1 1 1 1 1 1 1
Rough seas 2 2 2 2 2 2 2 2
DecJan Feb Mar Apr May June July Aug Sept Oct Nov
Source: FEWS NET.

MAURITANIA Livelihood Profile May 2015
Famine Early Warning Systems Network 23
As in the Mining and Pastoralism Zone, with its relatively stable year-round access to food and income, this zone has hardly any lean season. Thus, the seasonal calendar coincides with the calendar year, running from January through December (Figure 15). However, demand for labor for commercial fishing activities is limited in April and September, when both fishing is officially closed. Local casual employment and rural-urban labor migration are the only options for poor households during this time.
Drivers of wealth The difference between wealth groups in this zone lies in their access to production inputs for fishing (Table 3). Middle and better-off households own small boats with motors (pirogues) and employ family labor or hired workers. The typical household size is more or less the same for all wealth groups, though middle and better-off households will oftentimes include an additional one or two live-in workers. Poor households own fishing nets well-suited to small-scale fishing activities but earn most of their income working for middle and better-off households in their fishing operations under informal arrangements. The pay of laborers from poor households is prorated based on the value of the total fish catch after deducting corresponding production costs (taxes, fuel, boat rental fees, etc.)
Sources of food, income, and expenditures The breakdowns of the sources of food and income of poor, middle, and better-off households are similar. According to Figure 16, all wealth groups in this zone met their minimum energy needs in the reference year. The diets of virtually all households in this zone consist of rice and wheat, which are consumed year-round, complemented by milk, meat, vegetables, and fish. Except for fish, all food supplies are purchased on the market. Thus in general, dietary diversity is better in this zone than in the country’s other livelihood zones. All households depend on purchased food supplies to meet practically all their food consumption needs and on the sale of fish for virtually all their income (Figure 17). Organized groups of women from poor and middle households fashion handicrafts for sale to the tourism industry, whose contribution as a source of household income is eclipsed by proceeds from the sale of fish and income from other self-employment opportunities.
Table 3 Drivers of wealth in the Coastal Fishing Zone
Drivers Poor Middle Better-off
Percentage of households
(%)
50-70 20-35 10-15
Household size (#) 6-7 7-8 9-11
Other productive assets (#)
Fishing nets 1 1-2 1-4
Motorized boats (pirogues) 0 1-2 2-4 Source: FEWS NET.
Figure 16 Breakdown of sources of food by wealth
group in the Coastal Fishing Zone
Source: FEWS NET.
Figure 17 Breakdown of sources of income by wealth
group in the Coastal Fishing Zone
Source: FEWS NET.

MAURITANIA Livelihood Profile May 2015
Famine Early Warning Systems Network 24
The main distinction between wealth groups in this zone lies in their pattern of spending (Error! Reference source not found.). Poor households spend a significantly larger share of their income on food (50 percent versus approximately 30 percent for middle and better-off households), while the latter two groups spend significantly more on inputs for fishing activities (nets, boat repairs, fuel, labor, and taxes).
Main sources of food, income, and expenditures of poor households
The collection and sale of wood and charcoal, market gardening (in peri-urban areas), and craft-making are year-round activities for women. Men engage in these activities during the biological rest period, when the fishing season is closed. They also look for casual employment in their local area or in the city. Poor households continue to spend on fishing inputs for the repair or replacement of fishing nets and lines while the fishing season is closed (Figure 19). Figure 19 Main food, income, and expenditure cycles of poor households in the Coastal Fishing Zone
Staple foods
Rice mp mp mp mp mp mp mp mp mp mp mp mp mp mp mp mp mp mp mp mp mp mp mp mp
Wheat mp mp mp mp mp mp mp mp mp mp mp mp mp mp mp mp mp mp mp mp mp mp mp mp
Fish c c c c c c c c c c c c c c c c c c c c
Income
Sale of fish 1 1 1 1 1 1 1 1 1 1 1 1 1 1 1 1 1 1 1 1
Casual labor/self-employment 2 2 2 2 2 2 2 2
Expenditures
Food 1 1 1 1 1 1 1 1 1 1 1 1 1 1 1 1 1 1 1 1 1 1 1 1
Inputs 2 2 2 2 2 2 2 2 2 2 2 2 2 2 2 2 2 2 2 2 2 2 2 2
Legend op op Own production mp mp Market purchase ik ik In-kind c c Gathering
DecJan Feb Mar Apr May June July Aug Sept Oct Nov
Source: FEWS NET.
Hazards and coping strategies The main hazards in this zone are winds and floods, which create rough seas. This reduces the size of fish catches and indirectly reduces the incomes of poor households unable to work during periods of bad weather. However, these conditions last for only a few days at a time and do not pose any major food security risks. Under these circumstances, poor households cut their nonessential spending and, in the worst-case scenario, seek urban employment in Nouakchott and Nouadhibou. Such strategies generally suffice to meet basic household needs.
Figure 18 Breakdown of expenditures by wealth
group in the Coastal Fishing Zone
Source: FEWS NET.
MAURITANIA Livelihood Profile May 2015
Famine Early Warning Systems Network 25
PASTORALISM AND TRADE (ZONE 5)
Zone description This zone covers part of the wilayas of Trarza and Brakna and is characterized by dunes with sandy soil and average annual rainfall of between 200-250 mm from July to September of each year. Vegetation is dominated by Balanites aegyptiaca, Leptadenia pyrotechnica, and grasses (Cencuris biflorus). These conditions provide livestock with sufficient pasture and brush. The population is small, with a low population density of about two inhabitants per square kilometer.
Market access The main economic activities are livestock-raising and trade, primarily of animals. Livestock-raising is extensive; the main animals raised are camels, cattle, and goats. The zone's livestock markets in Boutilimit, Ouad Naga, and Kendelek are the main goat and cattle assembly markets for all of Mauritania. Markets in this zone regulate animal flows throughout the country, redirecting supply according to demand. Demand comes not only from large-scale traders in Nouakchott but also from traders in countries like Senegal and Gambia. Livestock are sold throughout the year, with a peak period ahead of the pastoral lean season from January through March, allowing households to earn additional income to purchase livestock feed, drinking water, and foodstuffs as needed. The other peak period on the market runs from the Ramadan celebrations through Eid al-Adha, which in recent years has been from July through October. Markets are so accessible that poor households benefit from all of the area's advantages in terms of favorable livestock sale prices. Poor households regularly engage in livestock trade by buying small rumainants, fattening them, and reselling them. The zone's largest labor market supports pastoralism and consists primarily of animal herders. Workers may be paid in kind (usually in animals), in cash, or both, depending on the shepherd.
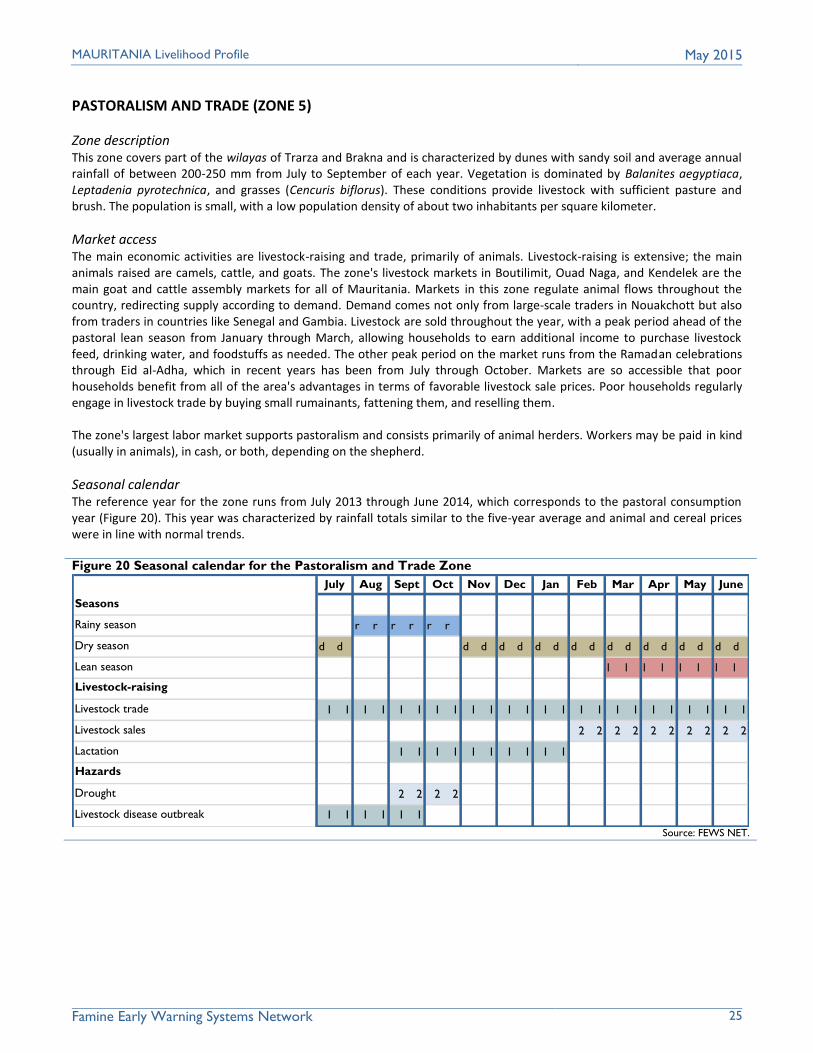
Seasonal calendar The reference year for the zone runs from July 2013 through June 2014, which corresponds to the pastoral consumption year (Figure 20). This year was characterized by rainfall totals similar to the five-year average and animal and cereal prices were in line with normal trends. Figure 20 Seasonal calendar for the Pastoralism and Trade Zone
Seasons
Rainy season r r r r r r
Dry season d d d d d d d d d d d d d d d d d d
Lean season l l l l l l l l
Livestock-raising
Livestock trade 1 1 1 1 1 1 1 1 1 1 1 1 1 1 1 1 1 1 1 1 1 1 1 1
Livestock sales 2 2 2 2 2 2 2 2 2 2
Lactation 1 1 1 1 1 1 1 1 1 1
Hazards
Drought 2 2 2 2
Livestock disease outbreak 1 1 1 1 1 1
JuneJuly Aug Sept Oct Nov Dec Jan Feb Mar Apr May
Source: FEWS NET.
MAURITANIA Livelihood Profile May 2015
Famine Early Warning Systems Network 26
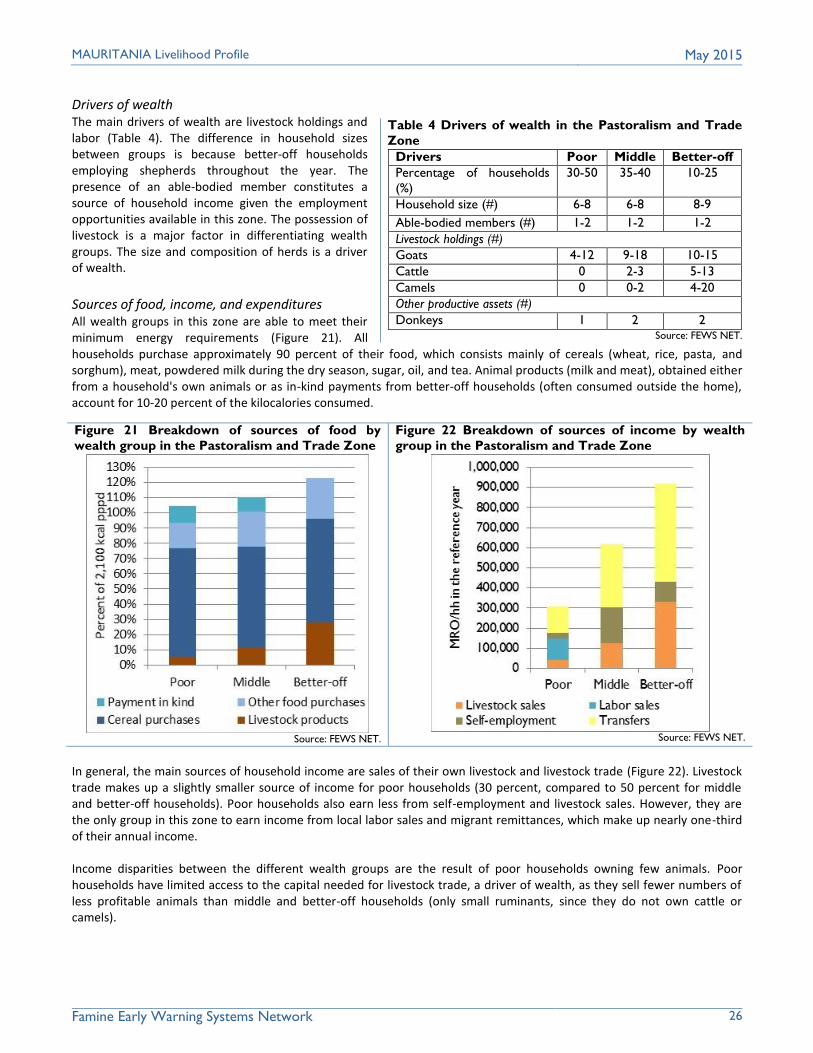
Drivers of wealth The main drivers of wealth are livestock holdings and labor (Table 4). The difference in household sizes between groups is because better-off households employing shepherds throughout the year. The presence of an able-bodied member constitutes a source of household income given the employment opportunities available in this zone. The possession of livestock is a major factor in differentiating wealth groups. The size and composition of herds is a driver of wealth.
Sources of food, income, and expenditures All wealth groups in this zone are able to meet their minimum energy requirements (Figure 21). All households purchase approximately 90 percent of their food, which consists mainly of cereals (wheat, rice, pasta, and sorghum), meat, powdered milk during the dry season, sugar, oil, and tea. Animal products (milk and meat), obtained either from a household's own animals or as in-kind payments from better-off households (often consumed outside the home), account for 10-20 percent of the kilocalories consumed.
In general, the main sources of household income are sales of their own livestock and livestock trade (Figure 22). Livestock trade makes up a slightly smaller source of income for poor households (30 percent, compared to 50 percent for middle and better-off households). Poor households also earn less from self-employment and livestock sales. However, they are the only group in this zone to earn income from local labor sales and migrant remittances, which make up nearly one-third of their annual income. Income disparities between the different wealth groups are the result of poor households owning few animals. Poor households have limited access to the capital needed for livestock trade, a driver of wealth, as they sell fewer numbers of less profitable animals than middle and better-off households (only small ruminants, since they do not own cattle or camels).
Table 4 Drivers of wealth in the Pastoralism and Trade
Zone
Drivers Poor Middle Better-off
Percentage of households
(%)
30-50 35-40 10-25
Household size (#) 6-8 6-8 8-9
Able-bodied members (#) 1-2 1-2 1-2
Livestock holdings (#)
Goats 4-12 9-18 10-15
Cattle 0 2-3 5-13
Camels 0 0-2 4-20
Other productive assets (#)
Donkeys 1 2 2 Source: FEWS NET.
Figure 21 Breakdown of sources of food by
wealth group in the Pastoralism and Trade Zone
Source: FEWS NET.
Figure 22 Breakdown of sources of income by wealth
group in the Pastoralism and Trade Zone
Source: FEWS NET.
MAURITANIA Livelihood Profile May 2015
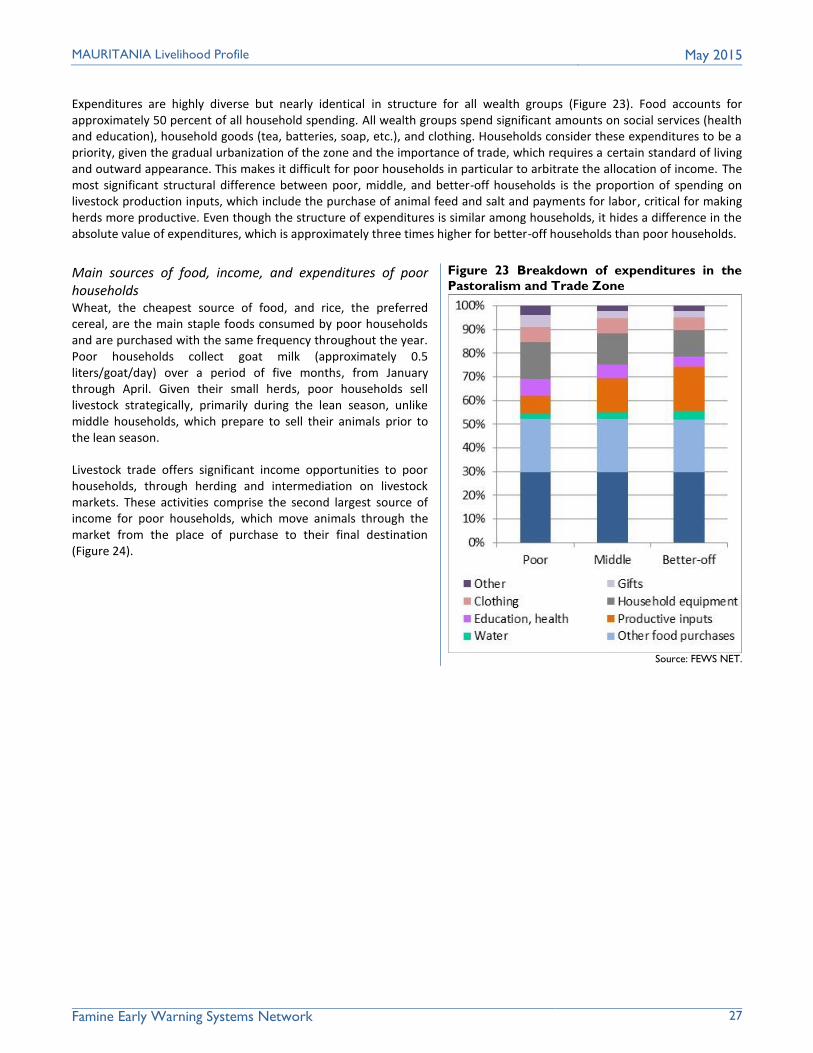
Famine Early Warning Systems Network 27
Expenditures are highly diverse but nearly identical in structure for all wealth groups (Figure 23). Food accounts for approximately 50 percent of all household spending. All wealth groups spend significant amounts on social services (health and education), household goods (tea, batteries, soap, etc.), and clothing. Households consider these expenditures to be a priority, given the gradual urbanization of the zone and the importance of trade, which requires a certain standard of living and outward appearance. This makes it difficult for poor households in particular to arbitrate the allocation of income. The most significant structural difference between poor, middle, and better-off households is the proportion of spending on livestock production inputs, which include the purchase of animal feed and salt and payments for labor, critical for making herds more productive. Even though the structure of expenditures is similar among households, it hides a difference in the absolute value of expenditures, which is approximately three times higher for better-off households than poor households.
Main sources of food, income, and expenditures of poor households Wheat, the cheapest source of food, and rice, the preferred cereal, are the main staple foods consumed by poor households and are purchased with the same frequency throughout the year. Poor households collect goat milk (approximately 0.5 liters/goat/day) over a period of five months, from January through April. Given their small herds, poor households sell livestock strategically, primarily during the lean season, unlike middle households, which prepare to sell their animals prior to the lean season.
Livestock trade offers significant income opportunities to poor households, through herding and intermediation on livestock markets. These activities comprise the second largest source of income for poor households, which move animals through the market from the place of purchase to their final destination (Figure 24).
Figure 23 Breakdown of expenditures in the
Pastoralism and Trade Zone
Source: FEWS NET.
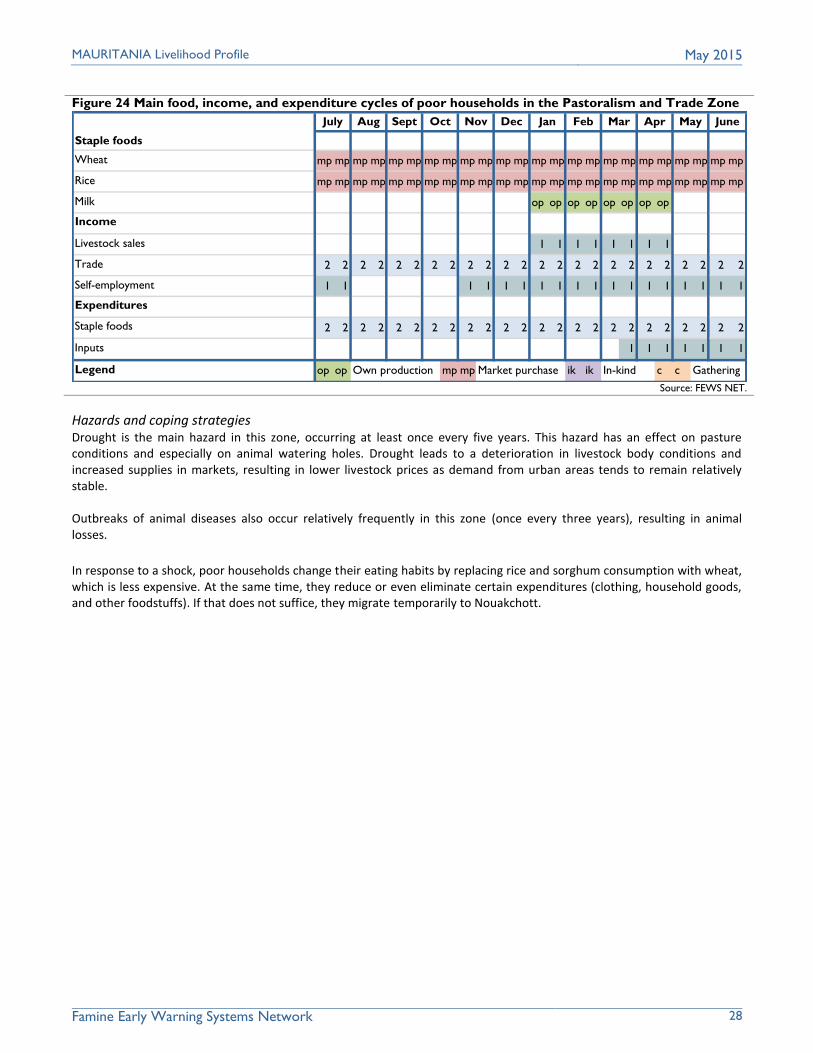
MAURITANIA Livelihood Profile May 2015
Famine Early Warning Systems Network 28
Figure 24 Main food, income, and expenditure cycles of poor households in the Pastoralism and Trade Zone
Staple foods
Wheat mp mp mp mp mp mp mp mp mp mp mp mp mp mp mp mp mp mp mp mp mp mp mp mp
Rice mp mp mp mp mp mp mp mp mp mp mp mp mp mp mp mp mp mp mp mp mp mp mp mp
Milk op op op op op op op op
Income
Livestock sales 1 1 1 1 1 1 1 1
Trade 2 2 2 2 2 2 2 2 2 2 2 2 2 2 2 2 2 2 2 2 2 2 2 2
Self-employment 1 1 1 1 1 1 1 1 1 1 1 1 1 1 1 1 1 1
Expenditures
Staple foods 2 2 2 2 2 2 2 2 2 2 2 2 2 2 2 2 2 2 2 2 2 2 2 2
Inputs 1 1 1 1 1 1 1
Legend op op Own production mp mp Market purchase ik ik In-kind c c Gathering
JuneJuly Aug Sept Oct Nov Dec Jan Feb Mar Apr May
Source: FEWS NET.
Hazards and coping strategies Drought is the main hazard in this zone, occurring at least once every five years. This hazard has an effect on pasture conditions and especially on animal watering holes. Drought leads to a deterioration in livestock body conditions and increased supplies in markets, resulting in lower livestock prices as demand from urban areas tends to remain relatively stable. Outbreaks of animal diseases also occur relatively frequently in this zone (once every three years), resulting in animal losses.
In response to a shock, poor households change their eating habits by replacing rice and sorghum consumption with wheat, which is less expensive. At the same time, they reduce or even eliminate certain expenditures (clothing, household goods, and other foodstuffs). If that does not suffice, they migrate temporarily to Nouakchott.

MAURITANIA Livelihood Profile May 2015
Famine Early Warning Systems Network 29
TRANSHUMANT PASTORALISM (ZONE 6)
Zone description This small zone, which covers part of Trarza and Brakna, is characterized by dunes and savannahs, with average annual rainfall of around 100 mm between July and September. There is little diversity in ground vegetation, which is dominated by Acacia senegal (white gum). The zone has a population density of around four inhabitants per square kilometer. With few opportunities for farming, enough rainfall to fill watering holes, and a small amount of pasture and brush, the zone's main activity is raising camels, cattle, and goats. As pasture and brush production is not sufficient to sustain herds throughout the year, the zone is considered a corridor for transhumant animals, particularly cattle. The two types of transhumance are: “local” or “inner transhumance,” which depends on the availability of pasture and watering holes located within 25-50 km of pastoralists’ homes and occurs between November and February; and “far” or “outer transhumance,” which occurs between March and August and can take pastoralists as far as 400 km from their home base toward Senegal. Transhumance therefore occurs ten months of the year, but only involves able-bodied household members and shepherds. Middle and better-off households sell milk during this period, as transhumant migration offers them access to other milk markets and urban centers. Remittances are very common in this zone. Remittances from large- and small-scale traders living in Mauritania's major urban centers are a significant source of income for all wealth groups.
Market access There is a north-south road in the western part of the zone and a west-east road toward the southern part of the zone. The animals found on the two main livestock markets in Rosso and Aleg come from this zone but also in large part from the Pastoralism and Trade Zone to the north. Animal flows move toward Senegal in the south. Livestock sales peak during the lean season, particularly from April through June. The zone's cereal supplies come from the Rosso markets, which sell dry cereals (sorghum, rice) from the Senegal River Valley and even imported foods from Senegal and Nouakchott (wheat, Asian rice). Pastoralism generates the greatest demand for unskilled labor in the zone, mainly for herding and managing livestock. Pastoral labor is often paid in kind (goats) and according to periods of transhumant migration. This offers a way for poor local households to reconstitute their herds, as shepherds from other zones sell the goats they receive as in-kind payments before returning home. Poor households in this and neighboring zones are therefore well-represented on the goat market but less so on the camel and cattle markets.
Seasonal calendar The consumption period corresponds to the pastoral consumption year, beginning with the rains in July and ending with the end of the dry season in June (Figure 25). With animals moving away from household meeting points, households only consume milk for three months.

MAURITANIA Livelihood Profile May 2015
Famine Early Warning Systems Network 30
Figure 25 Seasonal calendar for the Transhumant Pastoralism Zone
Seasons
Rainy season r r r r r r
Dry season d d d d d d d d d d d d d d d d d d
Lean season l l l l l l
Livestock-raising
Transhumant migration 1 1 1 1 1 1 1 1 1 1 1 1 1 1 1 1 1 1 1 1
Livestock sales 2 2 2 2 2 2 2 2 2 2
Lactation 1 1 1 1 1 1
Hazards
Drought 2 2 2 2
Brush fire 1 1 1 1
JuneJuly Aug Sept Oct Nov Dec Jan Feb Mar Apr May
Source: FEWS NET.
Drivers of wealth Middle and better-off households make up the large majority of households in the zone (Table 5). They represent a significant middle class that generates demand for unskilled labor from poor households in this zone and elsewhere. The transhumant pastoralism system requires a minimum number of animals for survival, which is why livestock holdings are slightly higher here than in other pastoral zones, especially among poor households. The number and type of animals owned is also a criteria for wealth. Every household aspires to possess cattle and then camels. Finally, moving larger transhumant herds, as better-off and sometimes middle households do, requires more shepherds than the available supply. Access to unskilled labor is therefore a driver of wealth in this zone.
Sources of food, income, and expenditures Purchased rice and wheat make up nearly the same amount of energy consumed (55-60 percent) for all households in the zone (Figure 26). The proportions of energy from other purchased foods (cowpeas, sugar, meat, and milk: 20-40 percent) and products from households' own animals (milk and meat: 10-25 percent) rise slightly with increased wealth. Poor households consume cowpeas as a substitute for meat. Foods consumed by households outside of the home are considered in-kind payments. All households have the opportunity to increase their cash income as needed. For example, in the reference year, all wealth groups held on to animals, as they did not reach the critical point of needing to sell them. Thus animals are available to sell during more difficult years.
Livestock and labor sales and remittances from household members working outside the zone are the most important sources of income for all wealth groups (Figure 27). The sale of dairy products is another important source of income for middle and better-off households. However, pastoral labor is the main source of income for poor households, which earn almost nothing from sales of animal products. Small-scale trading is an activity reserved for poor and middle households. Finally, only poor households engage in self-employment, particularly in handicrafts.
Table 5 Drivers of wealth in the Transhumant
Pastoralism Zone
Drivers Poor Middle Better-off
Percentage of
households (%)
25-30 40-50 25-30
Household size (#) 6-7 6-8 7-12
Livestock holdings (#)
Goats 8-20 20-25 20-45
Cattle 2-5 20 50
Camels 0 0 19
Other productive assets (#)
Donkeys 3 5 6 Source: FEWS NET.

MAURITANIA Livelihood Profile May 2015
Famine Early Warning Systems Network 31
Figure 26 Breakdown of sources of food by wealth
group in the Transhumant Pastoralism Zone
Source: FEWS NET.
Figure 27 Breakdown of sources of income by
wealth group in the Transhumant Pastoralism
Zone
Source: FEWS NET.
The three wealth groups share the same types of expenditures but with differences in their proportions (Figure 28). Because of their absolute wealth, better-off households spend a relatively smaller proportion of their total expenditures on food than do poor households, especially for rice and wheat. This is despite the fact that better-off households are larger and their consumption (in terms of number of kilocalories per person) is similar to that of poor households. The most striking difference between poor households and middle and better-off households is the former’s absence of spending on production inputs. However, poor households do spend on education, health, and household goods to maintain an acceptable standard of living in society.
Main sources of food, income, and expenditures of poor households Rice and wheat are the main staple foods for poor households, which consume them along with purchased oil, sugar, cowpeas, and powdered milk throughout the year, even during the lean season (Figure 29). Households consume milk produced by their own animals for only three months due the migration of livestock, which begins in November/December and continues until the end of the growing season. Poor households do not produce enough milk to sell, despite high demand around transhumant migration camps. Poor households manage livestock throughout the year and herd animals during the transhumant migration period. They primarily sell livestock during the lean season. Households purchase inputs such as minerals or salt and animal de-worming treatments, primarily before and after the rainy season.
Figure 28 Breakdown of expenditures by
wealth group in the Transhumant
Pastoralism Zone
Source: FEWS NET.

MAURITANIA Livelihood Profile May 2015
Famine Early Warning Systems Network 32
Hazards and coping strategies Drought occurs once or twice every five years. A major hazard in this zone is brush fires, which occur when pasture levels are at their lowest (January to February). Serious brush fires occur in regular, two-year cycles, destroying the little pasture that exists and making it difficult to access watering holes, constituting a major obstacle. When these hazards occur, households react to and cope with the effects. Transhumant herds migrate earlier than usual, and households can change the direction of their movements, both inside and outside the country. Outside the country, they can migrate as far as Guinea; inside the country, they can move to the Senegal River Valley. Households are primarily impacted by increased expenditures on labor and animal feed, necessary for transhumant migration and for maintaining their animals. To cover these additional expenditures, households reduce spending on nonessential items (sugar, milk, tea, etc.).
Figure 29 Main food, income, and expenditure cycles of poor households in the Transhumant Pastoralism
Zone
Staple foods
Rice mp mp mp mp mp mp mp mp mp mp mp mp mp mp mp mp mp mp mp mp mp mp mp mp
Wheat mp mp mp mp mp mp mp mp mp mp mp mp mp mp mp mp mp mp mp mp mp mp mp mp
Milk mp mp mp mp mp mp op op op op op op mp mp mp mp mp mp mp mp mp mp mp mp
Income
Livestock sales 1 1 1 1 1 1
Pastoral labor 2 2 2 2 2 2 2 2 2 2 2 2 2 2 2 2 2 2 2 2 2 2 2 2
Petty trade 1 1 1 1 1 1 1 1 1 1 1 1 1 1 1 1 1 1
Expenditures
Staple foods 2 2 2 2 2 2 2 2 2 2 2 2 2 2 2 2 2 2 2 2 2 2 2 2
Inputs 1 1 1 1 1 1 1 1 1 1
Legend op op Own production mp mp Market purchase ik ik In-kind c c Gathering
JuneJuly Aug Sept Oct Nov Dec Jan Feb Mar Apr May
Source: FEWS NET.

MAURITANIA Livelihood Profile May 2015
Famine Early Warning Systems Network 33
AGRO-PASTORAL (ZONE 7)
Zone description The Agro-Pastoral Zone is relatively large, including, from west to east, the two Hodhs, Assaba, Tagant, Guidimaka, Gorgol, and Brakna. The zone has an average population size, with a density of approximately 15 inhabitants per square kilometer. Rainfall totals average around 250 mm per year but can vary widely and are hardly sufficient for growing millet or sorghum. The zone is characterized by slightly hilly plains with clayey and sandy, non-dune soils. Vegetation consists of tree steppes with sparse woody shrubs, dominated by Combret unglutinosum and Balanites aegyptiaca. Grass cover is made up of Cenchrus biflorus. The agricultural production system in the zone is dominated by diéri (rainfed crops), with spaces suitable for farming in lowland areas behind natural or artificial dams. The zone would have greater agricultural potential had several dams not collapsed. Farming is mainly performed using household labor and rarely with animal traction. In fact, the most significant difference between this zone and Zone 9 called “Rainfed Agriculture” is the predominance of lowland farming.
Market access Markets in this zone are busier than in other zones, in terms of sales of both foodstuffs and livestock. The zone supplies livestock to the markets in Nouakchott and Nouadhibou, as well as Dakar (Senegal) and Kayes (Mali), through the markets in eastern Nema in the wilaya of Hodh Elh Chargui and Aïoun in the wilaya of Hodh El Gharbi. Sales peak between April and June/July. Cereal supplies come from the markets in Nioro and Nara (Mali), but the zone also supplies the Nouakchott market with cereals through Gorgol and Guidimaka markets in the central and western parts of the zone. The market affects the zone asymmetrically due to the relatively good roads connecting reference markets, though there are no secondary or tertiary roads. Households in villages close to the markets therefore have easier access to markets than other households, which must go through intermediaries to sell their animals and crops. Labor is primarily pastoral and related to herding and managing livestock, primarily herds that belong to households in urban centers outside the zone.
Seasonal calendar Livestock-rearing is transhumant, dominated by grazing animals such as cattle and small ruminants. Animals migrate within the zone from December to May. Despite the fact that livestock sales make up a large portion of income (especially among better-off households), the agricultural calendar defines the zone's consumption calendar, which begins with the harvests in October (Figure 30).
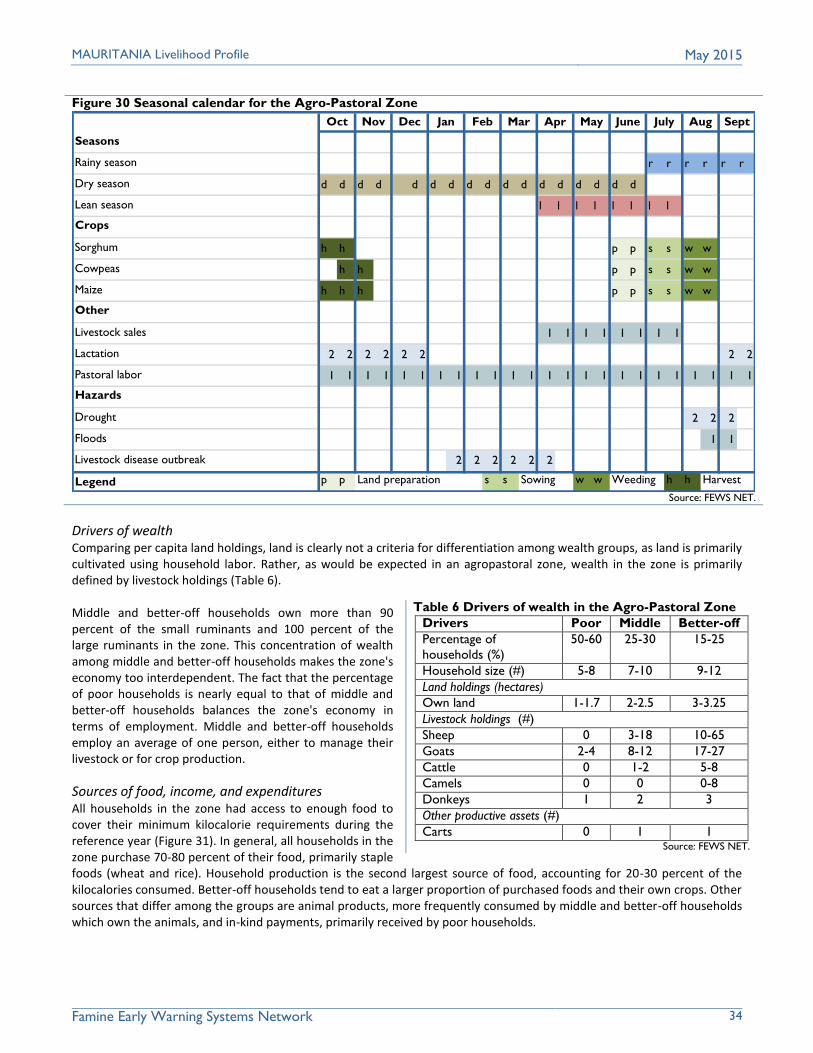
MAURITANIA Livelihood Profile May 2015
Famine Early Warning Systems Network 34
Figure 30 Seasonal calendar for the Agro-Pastoral Zone
Seasons
Rainy season r r r r r r
Dry season d d d d d d d d d d d d d d d d d
Lean season l l l l l l l l
Crops
Sorghum h h p p s s w w
Cowpeas h h p p s s w w
Maize h h h p p s s w w
Other
Livestock sales 1 1 1 1 1 1 1 1
Lactation 2 2 2 2 2 2 2 2
Pastoral labor 1 1 1 1 1 1 1 1 1 1 1 1 1 1 1 1 1 1 1 1 1 1 1 1
Hazards
Drought 2 2 2
Floods 1 1
Livestock disease outbreak 2 2 2 2 2 2
Legend p p Land preparation s s Sowing w w Weeding h h Harvest
SeptOct Nov Dec Jan Feb Mar Apr May June July Aug
Source: FEWS NET.
Drivers of wealth Comparing per capita land holdings, land is clearly not a criteria for differentiation among wealth groups, as land is primarily cultivated using household labor. Rather, as would be expected in an agropastoral zone, wealth in the zone is primarily defined by livestock holdings (Table 6). Middle and better-off households own more than 90 percent of the small ruminants and 100 percent of the large ruminants in the zone. This concentration of wealth among middle and better-off households makes the zone's economy too interdependent. The fact that the percentage of poor households is nearly equal to that of middle and better-off households balances the zone's economy in terms of employment. Middle and better-off households employ an average of one person, either to manage their livestock or for crop production.
Sources of food, income, and expenditures All households in the zone had access to enough food to cover their minimum kilocalorie requirements during the reference year (Figure 31). In general, all households in the zone purchase 70-80 percent of their food, primarily staple foods (wheat and rice). Household production is the second largest source of food, accounting for 20-30 percent of the kilocalories consumed. Better-off households tend to eat a larger proportion of purchased foods and their own crops. Other sources that differ among the groups are animal products, more frequently consumed by middle and better-off households which own the animals, and in-kind payments, primarily received by poor households.
Table 6 Drivers of wealth in the Agro-Pastoral Zone
Drivers Poor Middle Better-off
Percentage of
households (%)
50-60 25-30 15-25
Household size (#) 5-8 7-10 9-12
Land holdings (hectares)
Own land 1-1.7 2-2.5 3-3.25
Livestock holdings (#)
Sheep 0 3-18 10-65
Goats 2-4 8-12 17-27
Cattle 0 1-2 5-8
Camels 0 0 0-8
Donkeys 1 2 3
Other productive assets (#)
Carts 0 1 1 Source: FEWS NET.
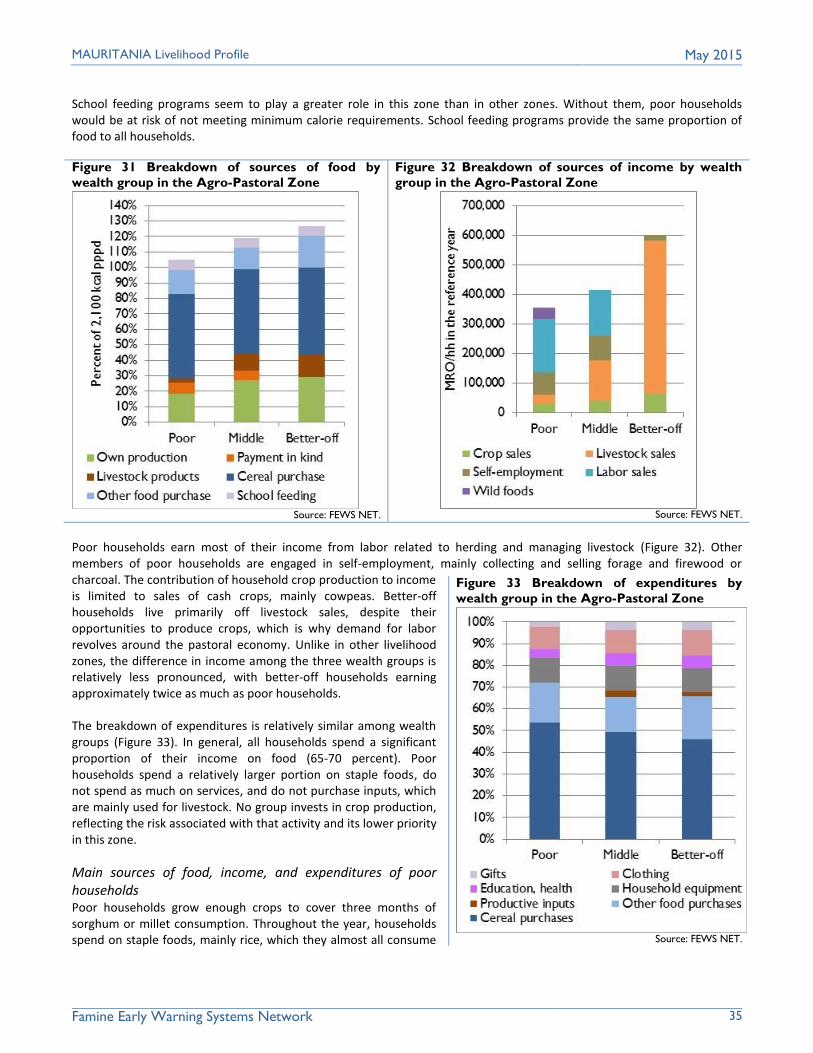
MAURITANIA Livelihood Profile May 2015
Famine Early Warning Systems Network 35
School feeding programs seem to play a greater role in this zone than in other zones. Without them, poor households would be at risk of not meeting minimum calorie requirements. School feeding programs provide the same proportion of food to all households.
Figure 31 Breakdown of sources of food by
wealth group in the Agro-Pastoral Zone
Source: FEWS NET.
Figure 32 Breakdown of sources of income by wealth
group in the Agro-Pastoral Zone
Source: FEWS NET.
Poor households earn most of their income from labor related to herding and managing livestock (Figure 32). Other members of poor households are engaged in self-employment, mainly collecting and selling forage and firewood or charcoal. The contribution of household crop production to income is limited to sales of cash crops, mainly cowpeas. Better-off households live primarily off livestock sales, despite their opportunities to produce crops, which is why demand for labor revolves around the pastoral economy. Unlike in other livelihood zones, the difference in income among the three wealth groups is relatively less pronounced, with better-off households earning approximately twice as much as poor households. The breakdown of expenditures is relatively similar among wealth groups (Figure 33). In general, all households spend a significant proportion of their income on food (65-70 percent). Poor households spend a relatively larger portion on staple foods, do not spend as much on services, and do not purchase inputs, which are mainly used for livestock. No group invests in crop production, reflecting the risk associated with that activity and its lower priority in this zone.
Main sources of food, income, and expenditures of poor households Poor households grow enough crops to cover three months of sorghum or millet consumption. Throughout the year, households spend on staple foods, mainly rice, which they almost all consume
Figure 33 Breakdown of expenditures by
wealth group in the Agro-Pastoral Zone
Source: FEWS NET.
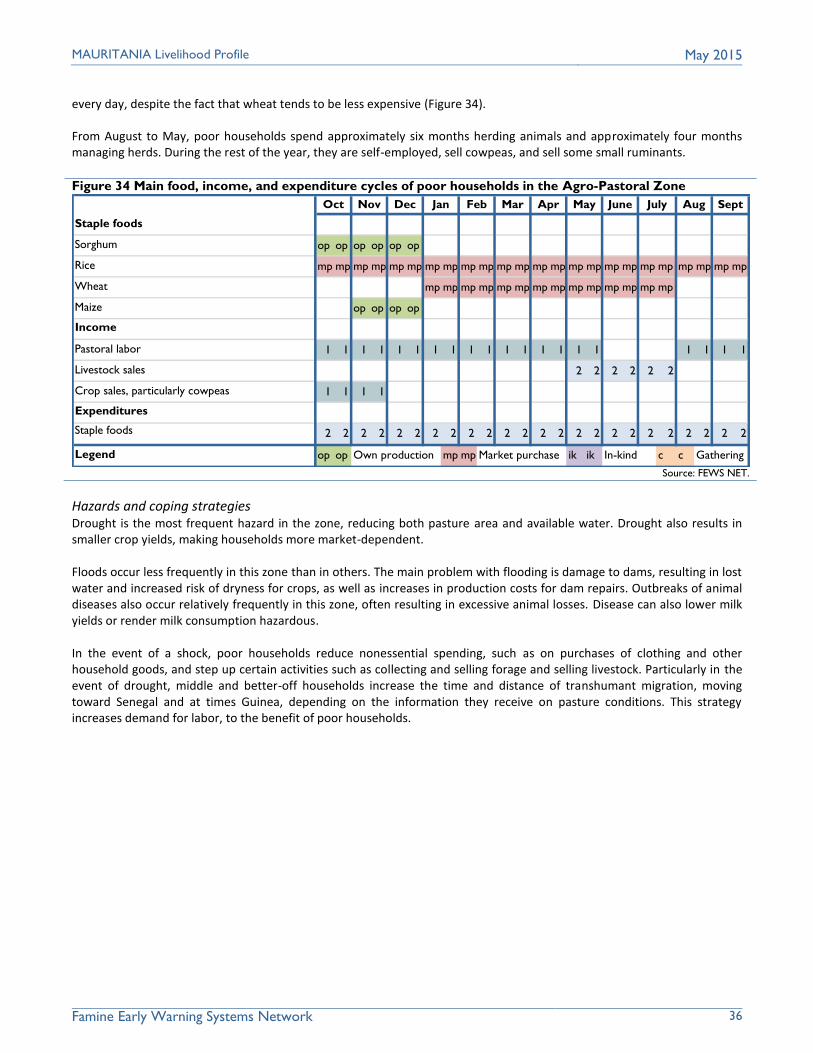
MAURITANIA Livelihood Profile May 2015
Famine Early Warning Systems Network 36
every day, despite the fact that wheat tends to be less expensive (Figure 34).
From August to May, poor households spend approximately six months herding animals and approximately four months managing herds. During the rest of the year, they are self-employed, sell cowpeas, and sell some small ruminants.
Hazards and coping strategies Drought is the most frequent hazard in the zone, reducing both pasture area and available water. Drought also results in smaller crop yields, making households more market-dependent. Floods occur less frequently in this zone than in others. The main problem with flooding is damage to dams, resulting in lost water and increased risk of dryness for crops, as well as increases in production costs for dam repairs. Outbreaks of animal diseases also occur relatively frequently in this zone, often resulting in excessive animal losses. Disease can also lower milk yields or render milk consumption hazardous. In the event of a shock, poor households reduce nonessential spending, such as on purchases of clothing and other household goods, and step up certain activities such as collecting and selling forage and selling livestock. Particularly in the event of drought, middle and better-off households increase the time and distance of transhumant migration, moving toward Senegal and at times Guinea, depending on the information they receive on pasture conditions. This strategy increases demand for labor, to the benefit of poor households.
Figure 34 Main food, income, and expenditure cycles of poor households in the Agro-Pastoral Zone
Staple foods
Sorghum op op op op op op
Rice mp mp mp mp mp mp mp mp mp mp mp mp mp mp mp mp mp mp mp mp mp mp mp mp
Wheat mp mp mp mp mp mp mp mp mp mp mp mp mp mp
Maize op op op op
Income
Pastoral labor 1 1 1 1 1 1 1 1 1 1 1 1 1 1 1 1 1 1 1 1
Livestock sales 2 2 2 2 2 2
Crop sales, particularly cowpeas 1 1 1 1
Expenditures
Staple foods 2 2 2 2 2 2 2 2 2 2 2 2 2 2 2 2 2 2 2 2 2 2 2 2
Legend op op Own production mp mp Market purchase ik ik In-kind c c Gathering
SeptOct Nov Dec Jan Feb Mar Apr May June July Aug
Source: FEWS NET.

MAURITANIA Livelihood Profile May 2015
Famine Early Warning Systems Network 37
SENEGAL RIVER VALLEY (ZONE 8) Zone description The Senegal River Valley is located in the southwestern part of the country along the border with Senegal, in the southern reaches of the wilayas of Trarza, Brakna, Gorgol, and Guidimaka. The zone receives less rain than the eastern part of the country, with average annual rainfall of 250-300 mm. It has a relatively flat relief, consisting of decantation and alluvial plains. Vegetation consists of prized species such as Panicum laetum and Panicum subalbidum. Regular flooding of the Senegal River, easy access to water and pasture, the ease of cross-border trade with Senegal, and high demand for labor all attract people to the zone, which has a population density of 15 inhabitants per square kilometer. Agriculture is the main economic activity in the zone. Irrigated crops are harvested in June; flood recession crops are harvested in November-December; rainfed crops are harvested in October-November; and market garden produce is harvested from March to June. With urbanization and changes in eating habits, irrigated market garden crops (cabbage, eggplants, mint, etc.) have seen a relative boom in demand. The Mauritanian government has begun to develop irrigated perimeters along and throughout the entire Senegal River Valley. The gross land area developed with water management is expected to be approximately 42,000 hectares (MDR 2001). Through financial institutions, SONADER (Société Nationale de Développement Rural) freely offers loans to purchase inputs needed for the production of crops, especially rice, which comprise the largest expenditure in the zone. Because of overexploitation, the land in this zone has the highest infestation of pests and weeds (Typha) in the country, which requires a lot of maintenance and use of pesticides and herbicides by all wealth groups.
Market access The zone's geographic location gives it an advantage in terms of trade networks and flows with active markets in Senegal. The cross-border market plays a very important role in the zone's economy. Trade is done almost as much in West African francs as in ouguiyas, despite the fact that trading in West African francs is illegal. The zone receives imported foodstuffs (wheat, sugar, oil) from Nouakchott and Senegal. These foodstuffs and locally produced rice supply Nouakchott first, followed by the rest of the country. Fish is sent to neighboring zones. Livestock on the zone's markets are mainly sold for local consumption. The majority of animals pass through the zone en route to Senegal, where they spend the transhumant migration period or are sold. For this reason, most poor households, which do not have the means to transport their crops to larger markets, sell to intermediaries or on local markets. Middle and better-off households start to sell their livestock in October, when animal body conditions are very good, whereas poor households sell more animals at the start of the lean season.
Seasonal calendar Due to the importance of agriculture, the consumption year starts with the harvests in October. The zone's seasonal calendar shows farming activities distributed throughout the year. However, the lean season occurs before the end of the consumption year, given the importance of labor to poor households' incomes and the weak demand for labor from April through June. Demand for labor is related to the production of rainfed crops (sorghum and cowpeas). Irrigated crops are produced using household labor. Livestock-raising is also important in the zone. Fishing is mainly practiced by a small population of poor riverside households, but it is not typical of the livelihood zone. The reference year for this zone is October 2013 to September 2014, and rainfall, harvests, and pasture levels were considered normal (Figure 35).

MAURITANIA Livelihood Profile May 2015
Famine Early Warning Systems Network 38
Figure 35 Seasonal calendar for the Senegal River Valley Zone
Seasons
Rainy season r r r r r r r r
Dry season d d d d d d d d d d d d d d d d
Lean season l l l l l l
Crops
Rice h h p p s s h h p p s s
Sorghum h h h h h h s s w w
Vegetables h h h h h h h h
Other
Fishing 1 1 1 1 1 1 1 1 1 1 1 1
Crop sales 2 2 2 2 2 2 2 2 2
Livestock sales 1 1 1 1 1 1 1 1 1 1 1 1
Hazards
Drought 2 2 2 2
Floods 1 1 1 1
Legend p p Land preparation s s Sowing w w Weeding h h Harvest
SeptOct Nov Dec Jan Feb Mar Apr May June July Aug
Source: FEWS NET.
Drivers of wealth Poor households comprise 40-60 percent of households in the zone, but poor people comprise less than 50 percent of the total population given the relatively small size of poor households (Table 7). The country's agricultural policy reform gave poor households relatively similar access to land as that enjoyed by middle and better-off households. The difference between wealth groups is related to land that middle and better-off households purchased from other beneficiaries (who remained in large cities) after the distribution of land by SONADER. Given per capita landholdings, land is not a driver of wealth in the zone.
Poor households own carts and sometimes water pumps, which are essential for irrigated rice production. Middle and better-off households use carts to transport crops to the most profitable markets in the zone, indicating that market access may be a driver of wealth. Without a functional water pump and money to purchase fuel oil, poor households do not have reliable access to a second growing season, limiting opportunities to develop their land. Wealth groups are mainly distinguished by their ownership of marketable livestock, almost all of which are owned by middle and better-off households. Land reserved for pasture is relatively limited or located far from villages because of the importance of agriculture in the zone.
Table 7 Drivers of wealth in the Senegal River Valley Zone
Drivers Poor Middle Better-off
Percentage of households (%) 40-60 25-35 10-25
Household size (#) 6-9 7-10 8-10
Land holdings (hectares)
Total land owned 0.50.75 0.8-1.5 2-2.5
Irrigated land 0-0.3 0.5-0.8 0.75-1
Livestock holdings (#)
Sheep 0 0 4-10
Goats 2-6 5-9 15-20
Cattle 0 2-10 12-25
Donkeys 1 2 2
Other productive assets (#)
Carts 0 1 1
Plows 1 1 1
Water pumps 0-1 1 1 Source: FEWS NET.

MAURITANIA Livelihood Profile May 2015
Famine Early Warning Systems Network 39
Sources of food, income, and expenditures During the reference year, all wealth groups had access to the minimum amount of kilocalories needed to survive (Figure 36). The breakdowns of sources of food and income vary widely among the different wealth groups in this zone. The most significant difference is in the market dependence of poor households (70 percent of kilocalories), particularly for the purchase of rice, sorghum, and wheat. Middle and better-off households purchase approximately 40 percent of their food, especially foods with high nutritional value, such as meat, sugar, milk, oil, and vegetables. They earn most of their income from selling their own crops. Around 50 percent of the kilocalories they consume come from their own crops, compared to around 25 percent among poor households.
Middle and better-off households’ ability to produce rice during two growing seasons could explain this difference. They also benefit from the milk produced by their own animals. All households benefit equally from school canteens and in-kind payments, either for local work or through the migration of household members to urban centers.
The primary source of income for all wealth groups is the sale of crops, particularly rice and market garden produce (Figure 37). As seasonal credits must be repaid just after the rice harvest, a large portion of these sales, even at times by middle and better-off households, occurs at a time when cereal prices are at their lowest.
Income from labor is mainly earned locally, especially among poor households, but also includes remittances from family members working in urban centers, particularly among middle and better-off households. Demand for local labor is mostly related to agriculture. One member of a poor household normally goes to work in fields owned by middle or better-off households during the land preparation and harvesting phases. The importance of animal sales among middle and better-off households shows that the primary function of livestock is diversification of income. The breakdown of expenditures is also relatively similar among wealth groups (Figure 38). In general, households in this zone spend relatively little on staple foods (rice, sorghum, and wheat) compared to other zones (less than 10 percent of total expenditures). Given the importance of crop production, the main expenditure in the zone is the purchase of agricultural inputs (seeds, pesticides, fertilizers). Even poor households spend on these items. Middle and better-off households also spend on water pump maintenance and fuel oil, labor, and, sometimes, tractors.
Figure 36 Breakdown of sources of food by
wealth group in the Senegal River Valley Zone
Source: FEWS NET.
Figure 37 Breakdown of sources of income by wealth
group in the Senegal River Valley Zone
Source: FEWS NET.
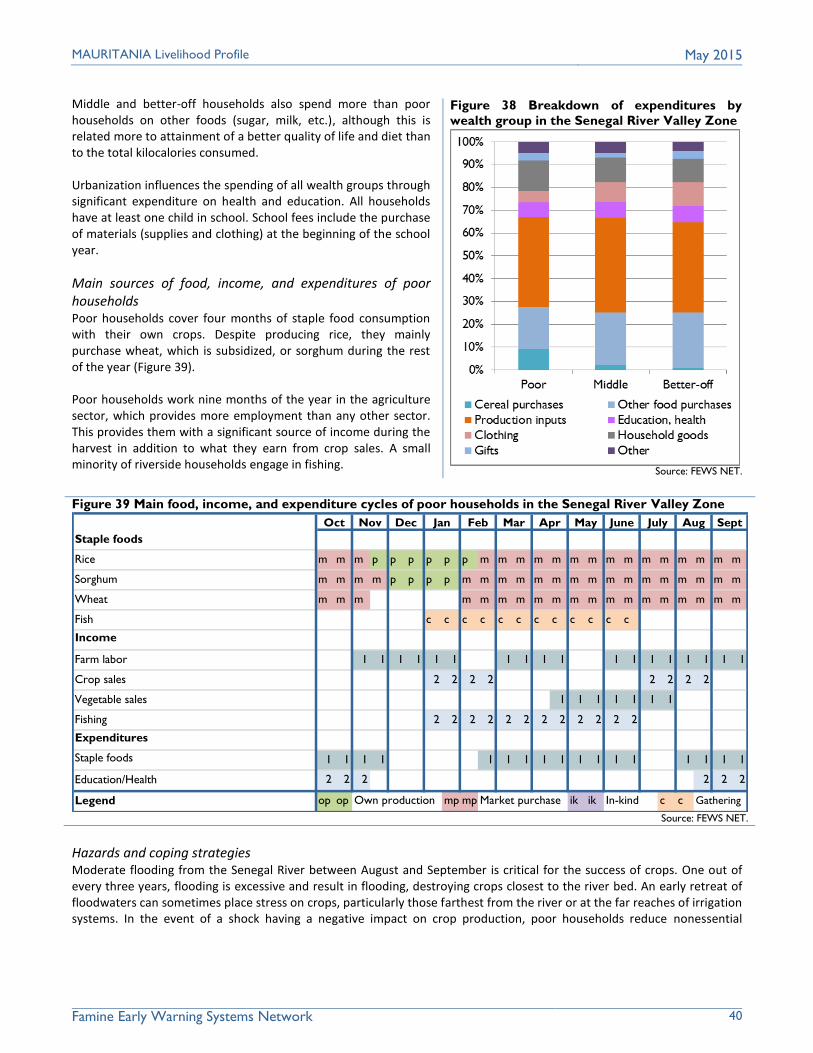
MAURITANIA Livelihood Profile May 2015
Famine Early Warning Systems Network 40
Middle and better-off households also spend more than poor households on other foods (sugar, milk, etc.), although this is related more to attainment of a better quality of life and diet than to the total kilocalories consumed. Urbanization influences the spending of all wealth groups through significant expenditure on health and education. All households have at least one child in school. School fees include the purchase of materials (supplies and clothing) at the beginning of the school year.
Main sources of food, income, and expenditures of poor households Poor households cover four months of staple food consumption with their own crops. Despite producing rice, they mainly purchase wheat, which is subsidized, or sorghum during the rest of the year (Figure 39). Poor households work nine months of the year in the agriculture sector, which provides more employment than any other sector. This provides them with a significant source of income during the harvest in addition to what they earn from crop sales. A small minority of riverside households engage in fishing.
Hazards and coping strategies Moderate flooding from the Senegal River between August and September is critical for the success of crops. One out of every three years, flooding is excessive and result in flooding, destroying crops closest to the river bed. An early retreat of floodwaters can sometimes place stress on crops, particularly those farthest from the river or at the far reaches of irrigation systems. In the event of a shock having a negative impact on crop production, poor households reduce nonessential
Figure 38 Breakdown of expenditures by
wealth group in the Senegal River Valley Zone
Source: FEWS NET.
Figure 39 Main food, income, and expenditure cycles of poor households in the Senegal River Valley Zone
Staple foods
Rice m m m p p p p p p m m m m m m m m m m m m m m m
Sorghum m m m m p p p p m m m m m m m m m m m m m m m m
Wheat m m m m m m m m m m m m m m m m m m m
Fish c c c c c c c c c c c c
Income
Farm labor 1 1 1 1 1 1 1 1 1 1 1 1 1 1 1 1 1 1
Crop sales 2 2 2 2 2 2 2 2
Vegetable sales 1 1 1 1 1 1 1
Fishing 2 2 2 2 2 2 2 2 2 2 2 2
Expenditures
Staple foods 1 1 1 1 1 1 1 1 1 1 1 1 1 1 1 1 1
Education/Health 2 2 2 2 2 2
Legend op op Own production mp mp Market purchase ik ik In-kind c c Gathering
Oct Nov Dec Jan Feb Aug SeptMar Apr May June July
Source: FEWS NET.

MAURITANIA Livelihood Profile May 2015
Famine Early Warning Systems Network 41
spending on clothing, household goods, and some foods. There is a strong tendency, especially among poor households, to replace popular but more expensive foods (rice or sorghum) with ones that are less popular but less expensive (wheat).

MAURITANIA Livelihood Profile May 2015
Famine Early Warning Systems Network 42
RAINFED CULTIVATION (ZONE 9)
Zone description The country's rainiest zone is located in the southwest, in the southern parts of the wilayas of Guidimaka, Assaba, Hodh El Chargui, and Hodh El Gharbi. However, average rainfall totals of 400 mm per year (less toward the northern part of the zone) are highly variable and still relatively low. Because of this, average crop production potential in the zone remains relatively marginal. In fact, the label “Rainfed Cultivation” is relative and may refer more to environmental conditions that could be long gone. Rather, it is significant to note that income from livestock sales is even greater in this zone than in the neighboring “Agropastoral” zone. Perhaps this Rainfed Cultivation zone is merely a zone in which the environmental conditions are relatively more favorable to agropastoralism. Another difference between the Agropastoral Zone and this Rainfed Cultivation zone is the relatively greater dependence in this rainfed agriculture zone on rainfed crops than on lowland cropping, though both are present. The topography is varied, with non-dune sand formations and slightly hilly plains characterized by sparse woody shrubs and dominated by Combretum glutinosum. Balanites aegyptiaca, Acacia senegal, and Zizyphus mauritania are also found in basins. The regs (rocky desert areas) generally have a sparse cover of Acacia ehrenbergiana shrubs. Population density is relatively low, at approximately six inhabitants per square kilometer. Rainfed cultivation (diéri) of cereal crops (sorghum, millet) and cowpeas is the main economic activity in the zone. In the areas that receive the least rainfall (north of the 200-mm isohyet, known as the natural border for non-irrigated cereal production), crops are grown in the many wadis. Livestock-raising, the second largest economic activity, is semi-extensive. Herds are made up of cattle and small ruminants, with a high concentration of animals in the eastern part of the zone, in Hodh El Chargui. Unlike in other zones, women and young people play an important role in the economic activities of this zone, working in all income-generating sectors.
Market access Trade flows and networks are highly developed in the zone, providing employment opportunities (agricultural and pastoral) for poor households. This zone provides locally produced cereals and cowpeas to Nouakchott and Mauritania in general and is a transit point for these foods and others arriving from Mali. The zone's livestock supply the markets of Nouakchott, Kayes/Bamako (Mali), and Dakar (Senegal). Cross-border trade influences the economies of households in the zone, as all wealth groups share a strong presence on the markets.
Seasonal calendar Agricultural labor is done over a five-month period, primarily by men. Urban labor and transhumant pastoralism occurs outside the zone for another five-month period. Women and young people go to urban centers to work as domestic staff.
Livestock are sold between March and June, ahead of and during the lean season. Most households, particularly poor households, sell their crops (especially cowpeas) just after the harvest in November. Poor households also gather leaves and collect straw from December to April, though the income from these activities is relatively small.

MAURITANIA Livelihood Profile May 2015
Famine Early Warning Systems Network 43
Figure 40 Seasonal calendar for the Rainfed Cultivation Zone
Seasons
Rainy season r r r r r r r r
Dry season d d d d d d d d d d d d d d d d
Lean season l l l l l l
Crops
Sorghum H H H H P P P S S W W
Millet H H H P P P S S W W
Cowpeas H H H P P P S S W W
Other
Livestock sales 1 1 1 1 1 1 1 1
Lactation 2 2 2 2 2 2 2 2
Pastoral or urban labor 1 1 1 1 1 1 1 1 1 1
Crop sales 2 2 2 2 2 2
Hazards
Drought 1 1 1 1
Floods 2 2
Crop pests/straying animals 1 1 1
Legend p p Land preparation s s Sowing w w Weeding h h Harvest
SeptOct Nov Dec Jan Feb Mar Apr May June July Aug
Source: FEWS NET.
Drivers of wealth Land is not a driver of wealth as would be expected in an agricultural zone. Rather, the greatest difference between wealth groups is in livestock holdings (Table 8), as would be expected in an agropastoral zone. One hundred percent of large ruminants and more than 80 percent of small ruminants are owned by middle and better-off households. Poor households own a core breeding herd of small ruminants supported by the terms of the local livestock sharing systems and in-kind payments. This system allows households to both sell a certain number of small ruminants each year and maintain a small breeding herd. Due to their concern with maintaining wealth within their households, middle and better-off households are larger than poor households. It is easy for a group of poor people to create separate households, as they have no property to share other than land, which is not the most desirable asset. Middle and better-off households also own carts, which improve their access to markets compared to the poor.
Sources of food, income, and expenditures While all wealth groups were able to meet their food needs during the consumption year, poor households had less access to food in this zone than in other zones in the country (Figure 41). Even though it is called the Rainfed Cultivation Zone, this
Table 8 Drivers of wealth in the Rainfed Cultivation
Zone
Drivers Poor Middle Better-off
Percentage of households
(%)
40-55 25-35 15-25
Household size 7-8 8-9 11-12
Land holdings(hectares)
Own land 0.7-1 1.3-2.5 2.4-4
Livestock holdings (#)
Sheep 1-5 10-20 30-35
Goats 3-7 9-16 20-30
Cattle 0 3-5 7-10
Donkeys 1 2 3
Other productive assets (#)
Carts 0 1 1-2 Source: FEWS NET.
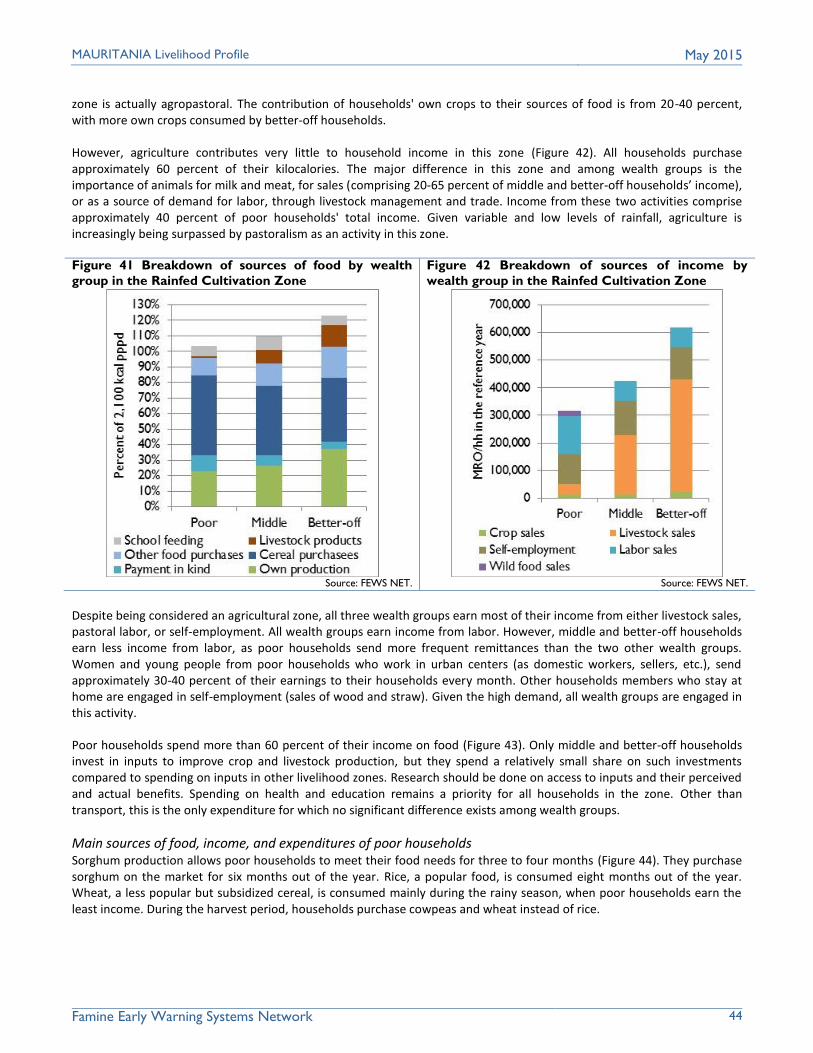
MAURITANIA Livelihood Profile May 2015
Famine Early Warning Systems Network 44
zone is actually agropastoral. The contribution of households' own crops to their sources of food is from 20-40 percent, with more own crops consumed by better-off households. However, agriculture contributes very little to household income in this zone (Figure 42). All households purchase approximately 60 percent of their kilocalories. The major difference in this zone and among wealth groups is the importance of animals for milk and meat, for sales (comprising 20-65 percent of middle and better-off households’ income), or as a source of demand for labor, through livestock management and trade. Income from these two activities comprise approximately 40 percent of poor households' total income. Given variable and low levels of rainfall, agriculture is increasingly being surpassed by pastoralism as an activity in this zone. Figure 41 Breakdown of sources of food by wealth
group in the Rainfed Cultivation Zone
Source: FEWS NET.
Figure 42 Breakdown of sources of income by
wealth group in the Rainfed Cultivation Zone
Source: FEWS NET.
Despite being considered an agricultural zone, all three wealth groups earn most of their income from either livestock sales, pastoral labor, or self-employment. All wealth groups earn income from labor. However, middle and better-off households earn less income from labor, as poor households send more frequent remittances than the two other wealth groups. Women and young people from poor households who work in urban centers (as domestic workers, sellers, etc.), send approximately 30-40 percent of their earnings to their households every month. Other households members who stay at home are engaged in self-employment (sales of wood and straw). Given the high demand, all wealth groups are engaged in this activity.
Poor households spend more than 60 percent of their income on food (Figure 43). Only middle and better-off households invest in inputs to improve crop and livestock production, but they spend a relatively small share on such investments compared to spending on inputs in other livelihood zones. Research should be done on access to inputs and their perceived and actual benefits. Spending on health and education remains a priority for all households in the zone. Other than transport, this is the only expenditure for which no significant difference exists among wealth groups.
Main sources of food, income, and expenditures of poor households Sorghum production allows poor households to meet their food needs for three to four months (Figure 44). They purchase sorghum on the market for six months out of the year. Rice, a popular food, is consumed eight months out of the year. Wheat, a less popular but subsidized cereal, is consumed mainly during the rainy season, when poor households earn the least income. During the harvest period, households purchase cowpeas and wheat instead of rice.

MAURITANIA Livelihood Profile May 2015
Famine Early Warning Systems Network 45
Agricultural labor entails land preparation, sowing, weeding, and harvesting activities. Agricultural activities span a seven-month period, with a break in September. Despite producing relatively fewer crops than the middle or better-off, poor households sell some of their crops during the harvest, at the lowest prices of the year, either to pay back debts or to meet basic needs. Figure 44 Main food, income, and expenditure cycles of poor households in the Rainfed Cultivation Zone
Staple foods
Sorghum p p p p p p p m m m m m m m m m m m
Rice m m m m m m m m m m m m m m m m
Wheat m m m m m m
Cowpeas p p
Income
Agricultual labor 1 1 1 1 1 1 1 1 1 1 1 1
Self-employment 2 2 2 2 2 2 2 2 2 2
Livestock management 1 1 1 1 1 1 1 1 1 1
Crop sales 2 2 2 2 2 2
Expenditures
Staple foods 1 1 1 1 1 1 1 1 1 1 1 1 1 1 1 1 1 1 1 1
Education 2 2 2 2
Legend op op Own production mp mp Market purchase ik ik In-kind c c Gathering
Oct Nov Dec Jan Feb Aug SeptMar Apr May June July
Source: FEWS NET.
Hazards and coping strategies Drought occurs frequently in the zone, particularly in August, and has serious effects on crop production, pasture, and animal watering holes. This situation is accompanied by a widespread increase in cereal prices on the market from March through August of the following year, and, at the same time, a drop in livestock prices, particularly for small ruminants, with markets oversupplied in animals in poor condition. Crop pests are a recurring hazard in the zone, mainly infecting cash crops. Damage from pests has led to a considerable decline in cowpea crops over the last five years. Crop pests and the straying of animals partially explain why households have begun to abandon agriculture in this zone. In the event of drought, poor households eliminate spending on nonessential items such as household goods, clothing, etc. They also consume less rice in favor of wheat, a less expensive cereal. More members of poor households also migrate to look for work or stay away for longer periods of time.
Figure 43 Breakdown of expenditures by
wealth group in the Rainfed Cultivation Zone
Source: FEWS NET.

MAURITANIA Livelihood Profile May 2015
Famine Early Warning Systems Network 46
ANNEX 1: PURPOSIVE SAMPLING: VILLAGES VISITED BY LIVELIHOOD ZONE
Zone Village Moughataa Wilaya
MR01 Madhloum Aïoun Hodh El Gharbi
Boujnah Aïoun Hodh El Gharbi
Barkewe Timbedra Hodh Charghi
Legleye Timbedra Hodh Charghi
MR02 Boulenoir Nouadhibou Dakhlet Nouadhibou
Dewass Elghaiche Akjoujt Inchiri
Wad Chebka Nouadhibou Dakhlet Nouadhibou
MR04 Iwik Nouadhibou Dakhlet Nouadhibou
Nouamghar Nouadhibou Dakhlet Nouadhibou
Teichet Nouadhibou Dakhlet Nouadhibou
R'gueiba Nouadhibou Dakhlet Nouadhibou
MR05 Barafat Arafat Trarza
Boulenwar Nouadhibou Nouadhibou
Bir el Bene Trarza
Naim R’Kiz Trarza
MR06 EL Aref Mederdra Trarza
Tew vigh Mederdra Trarza
Mabrouk Mederdra Trarza
Bounaama Mederdra Trarza
MR07 Bir Masoud Tintane Hodh El Gharbi
Edebay el mehroude Tintane Hodh El Gharbi
Gaate L'emhar Tamchekett Hodh El Gharbi
Igeurjan l'ehchiche Tamchekett Hodh El Gharbi
MR08 Bezoul R’kiz Trarza
um elghoura R’kiz Trarza
Amara R’kiz Trarza
Tchamben Rosso Trarza
MR09 Sambou Tintane Hodh El Gharbi
Brayme Tintane Hodh El Gharbi
Akwawin Tintane Hodh El Gharbi
Lembeidie Tintane Hodh El Gharbi
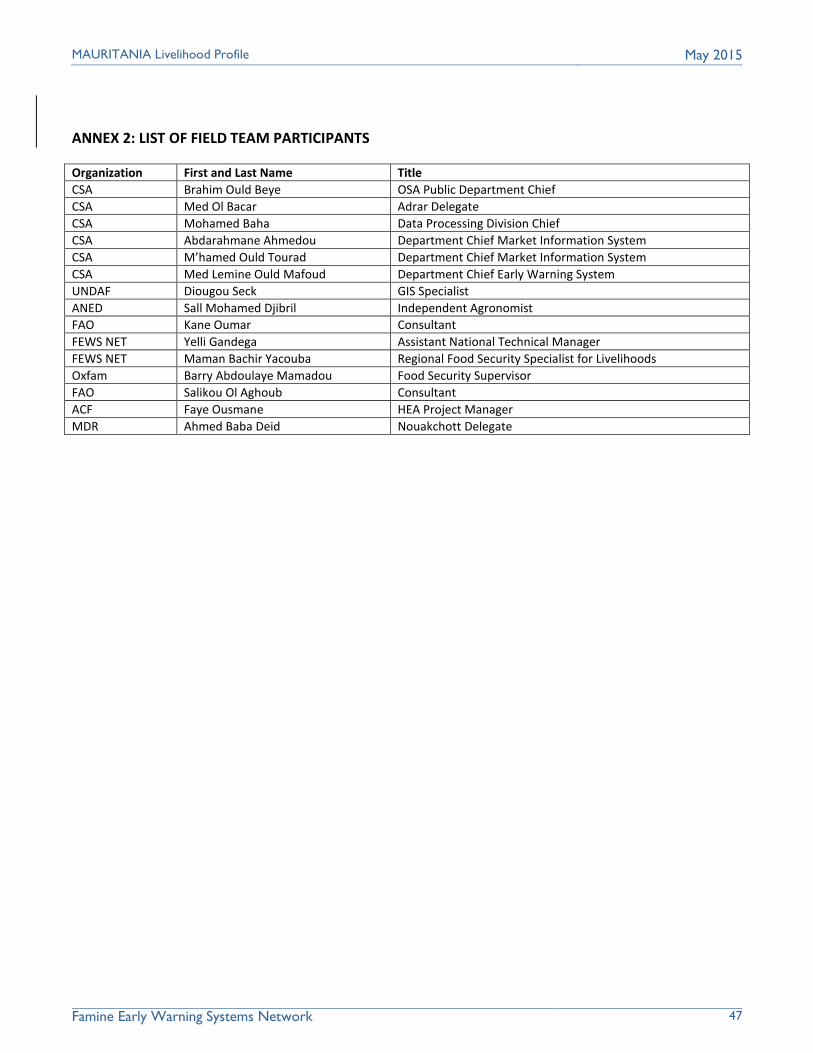
MAURITANIA Livelihood Profile May 2015
Famine Early Warning Systems Network 47
ANNEX 2: LIST OF FIELD TEAM PARTICIPANTS
Organization First and Last Name Title
CSA Brahim Ould Beye OSA Public Department Chief
CSA Med Ol Bacar Adrar Delegate
CSA Mohamed Baha Data Processing Division Chief
CSA Abdarahmane Ahmedou Department Chief Market Information System
CSA M’hamed Ould Tourad Department Chief Market Information System
CSA Med Lemine Ould Mafoud Department Chief Early Warning System
UNDAF Diougou Seck GIS Specialist
ANED Sall Mohamed Djibril Independent Agronomist
FAO Kane Oumar Consultant
FEWS NET Yelli Gandega Assistant National Technical Manager
FEWS NET Maman Bachir Yacouba Regional Food Security Specialist for Livelihoods
Oxfam Barry Abdoulaye Mamadou Food Security Supervisor
FAO Salikou Ol Aghoub Consultant
ACF Faye Ousmane HEA Project Manager
MDR Ahmed Baba Deid Nouakchott Delegate