manya chugh, deerwood elementary - district...
TRANSCRIPT
Hanna Leuck, , D
eerwood Elem
entary
Manya Chugh, D
eerwood Elem
entary
2015-16 Final BudgetFiscal Year Ending June 30, 2016
inDEpEnDEnt sCHooL DistriCt 196Rosemount-Apple Valley-Eagan Public Schools
Dakota County • Rosemount, Minnesota
www.district196.org
Educating our students
to reach their full potential

Table of Contents
Page
Budget Message i
Community Budget Guide
Our Dis trict 1
Dis trict 196 by the Numbers 2
Our Students 3
Achievement 4
Our School Board and Staff 5
Our Strategies and Goals 6
Our Budget 7
Budget Funds 8
Genera l Fund 9
Genera l Fund by Program 10
Genera l Fund by Object 11
Genera l Fund History 12
Our Revenue Sources 13
Property Taxes 14
Budget FAQs and Contact Information 15
Financia l
Summary of Funds 16
Genera l Fund
Al l Sub‐Accounts 17
Genera l Account 18
Specia l Education Account 19
Qual i ty Compensation Account 20
Pupi l Transportation Account 21
Capi ta l Expenditure Account 22
Specia l Revenue Funds
Food Service 23
Community Education 24
Capita l Projects ‐ Bui lding Construction Fund 25
Debt Service Funds
Regular 26
Other Post‐Employment Benefi ts (OPEB) 27
Proprietary Funds ‐ Interna l Service Funds 28
Fiduciary Funds
Agency 29
Trust 30
Informational
Budget Calendar 31
Student
Enrol lment by Year 32
Enrol lment by Si te 33
Enrol lment by Grade 34
Average Dai ly Membership by Year 35
Staffing
Employees by Class i fication 36
Si te Staffing Al locations 37
Financia l
Fund Balances Governmenta l Funds 38
Changes in Fund Balances of Governmenta l Funds 39
Glossary 40

2015‐16 Final Budget Independent School District No. 196
i
January 4, 2016 To the School Board, citizens, and employees of Independent School District 196 INTRODUCTION Pursuant to the Minnesota Statute 123B.77, the Finance Department submitted 2015‐16 Preliminary Budget for Independent School District 196 for your consideration and approval at the June 22, 2015. The purpose of the final budget is to make adjustments to the preliminary budget based on data that has been finalized or been updated since the original budget was approved. This budget seeks to continue fulfilling the district’s mission of “educating our students to reach their full potential,” while striving to keep expenditures and the taxpayer burden to a minimum. REPORT FORMAT This budget document is presented in three sections:
Community Budget Guide – provides a executive of the remaining two sections described below
Financial Section – provides an overview and analysis of each of the District’s funds
Informational Section – provides selected financial, demographic, and economic data on a multi‐year comparative basis REPORTING ENTITY AND ITS SERVICES The district was incorporated in 1950 and serves a portion of nine suburban communities within Dakota County located on the southeastern edge of the Minneapolis/St. Paul metropolitan area. The district provides a full range of public education services appropriate to grade levels ranging from pre‐kindergarten through grade 12. FINANCIAL AND BUDGETARY CONTROL The management of the district is responsible for establishing and maintaining internal controls designed to ensure that the assets and resources of the district are protected from theft, misuse or losses. The internal control system is designed to provide reasonable, but not absolute, assurance that these objectives are met. The concept of reasonable assurance recognizes that: 1) the cost of a control should not exceed the benefits likely to be derived, and 2) the valuation of the costs and benefits requires estimates and judgments by management. The district’s budget process is based, first, on development of a budget projection model that attempts to project resources and expenses over a multiple‐year period. The budget projection is used by the School Board and the administration to determine budget parameters and staffing guidelines. This budget has been prepared in accordance with the budget parameters and personnel staffing guidelines approved by the School Board on February 9, 2015. Legal budgetary control is at the fund level, however directors, principals, coordinators and other budget managers are responsible for monitoring their budget centers within each of the funds. All appropriations lapse at year‐end. BUDGET PROCESS AND ASSUMPTIONS The district operates in a decentralized or site‐based environment. Annually, schools receive three different allocations from the district to support their operations: staffing, instructional and capital expenditure. Other programs, such as curriculum materials, major maintenance projects, special education program and facilities and grounds maintenance are centrally managed. A majority of the allocations to the schools are driven by student enrollment and per student allocations reviewed by the School Board.
Staffing Allocation Staff is allocated to each site based on the staffing guidelines and ratios developed by the administration and reviewed by the School Board. The 2015‐16 staffing allocations were approved by the School Board on February 9, 2015, using October 1, 2015 enrollment counts. School principals and department managers are responsible for staffing their building or department according to their allocations.
2015‐16 Final Budget Independent School District No. 196
ii
Employee salaries used in the budget are initially calculated by the Finance Department using the contract salaries for all employee groups that have an approved contract and verified by school principals and other administrators. If an employee group has not settled a contract at the time the budget is the salaries are estimated based on specific budget guidelines as determined by the School Board. Employee benefits are estimated using a variety of techniques. Retirement benefits, social security and workers’ compensation premium budgets are calculated as specified percentages of salaries. Budgets for health, dental, life insurance and the tax sheltered annuity match are estimated based on the projected number of employees reported by school principals and other budget administrators, premium information provided by the insurance carriers and current employee contracts. For groups that have no contract but for which there is a limit on the district contribution, increase in the maximum district contribution is based on budget guidelines as determined by the School Board on February 9, 2015.
Non‐Salary Allocations for Schools
Instructional Allocations ‐ Consistent with the School Board‐approved budget‐planning parameters, the 2015‐16 instructional allocations to the schools have been increased by 2 percent to reflect a 2 percent inflationary adjustment.
Staff Development – In addition to the instructional allocations schools receive $8 per pupil for staff development activities.
Cocurricular staffing and supplies – Middle and high schools receive cocurricular staffing and supplies allocations to support their cocurricular programs. Cocurricular staffing allocations for 2015‐16 school year have been increased by 2.4 percent to reflect contract. Cocurricular supplies allocations for 2015‐16 school year have been increased to reflect a 2 percent inflationary adjustment.
Compensatory Education Allocations – 2015‐16 allocations are based on estimates prepared by the Minnesota Department of Education, these estimates are based on the district’s actual enrollment and actual free‐and‐reduced‐price lunch counts on October 1, 2014.
Basic Skills per pupil allocations for grades K‐8 remain at the 2012‐13 level: $40.50 per pupil unit for non‐Title I elementary and middle schools and $20.25 for Title I elementary schools.
Learning and Development Program – School districts are required to reserve a portion of the general education formula revenue to reduce and maintain class size in elementary grades, with first priority on kindergarten, first‐, second‐, and third‐grade class sizes. The allocations for each school were based on actual October 1, 2015 enrollment counts.
Administrative and support department non‐salary budgets were determined by each department head based on parameters established by the School Board, and then reviewed and approved by the superintendent or the director of finance and operations. For 2015‐16, the inflationary adjustment for non‐salary budgets is 2 percent except for budget items, such as heating fuel and electricity, which are based on recent trends and industry directions.
Revenues Estimates are prepared by the Finance Department based on state statutes, using the actual October 1, 2015. The per pupil unit allowance for the 2015‐16 school year is $5,948. The per pupil unit formula allowance for the 2014‐15 school year was $5,831. The amount set aside for pupil transportation for the current school year is $277.18, or 4.66 percent of the formula allowance. The projected adjusted pupil units for the 2015‐16 school year is 30,006.16.
DESCRIPTION OF FUNDS The existence of the various district funds has been established by the Minnesota Department of Education. Each fund is accounted for as an independent entity. Descriptions of the funds included in this report are as follows:
Governmental Funds
General Fund – Used to account for all financial resources except those required to be accounted for in another fund. The district maintains five sub‐accounts within the General Fund: Operating, Transportation, Capital, Quality Compensation, and Special Education.
Capital Projects – Building Construction Fund ‐ Used to account for financial resources used for the acquisition or construction of major capital facilities authorized by bond issue or capital project levies.
Debt Service Fund – Used to account for the accumulation of resources for, and payment of, general obligation long‐term debt principal, interest and related costs. The district maintains a separate Other Post‐Employment Benefits (OPEB) account within the debt service fund to account for OPEB‐related debt activity. All other debt service is recorded in the general debt service account.
Food Service Special Revenue Fund – The food service special revenue fund is primarily used to account for the district’s child nutrition program.
Community Service Special Revenue Fund – The community service special revenue fund is used to account for services provided to residents in the areas of recreation, civic activities, nonpublic pupils, adult or early childhood programs, or other similar services.
2015‐16 Final Budget Independent School District No. 196
iii
Proprietary Funds
Internal Service Funds – Internal service funds account for the financing of goods or services provided by one department to other departments or agencies of the government, or to other governments, on a cost‐reimbursement basis. The district has established four internal service funds: Severance Benefits, Other Post‐Employment Benefits, Self‐Insured Dental, and Self‐Insured Health.
Fiduciary Funds
Employee Benefit Trust Fund – The district maintains an employee benefit trust fund used to administer resources received and held by the district as the trustee for employees participating in the district’s flexible benefit plan (Internal Revenue Code § 125 Cafeteria Plan).
Scholarship Private‐Purpose Trust Fund – The scholarship private‐purpose trust fund is used to account for resources held in trust to be used by various other third parties to award scholarships to students.
Agency Funds – Agency funds are established to account for cash and other assets held by the district as the agent for others. The district maintains two agency funds used to account for a Graduate Credit Program (a continuing education program organized for the benefit of district certified staff) and Local Collaborative Time Study (LCTS) grant funds.
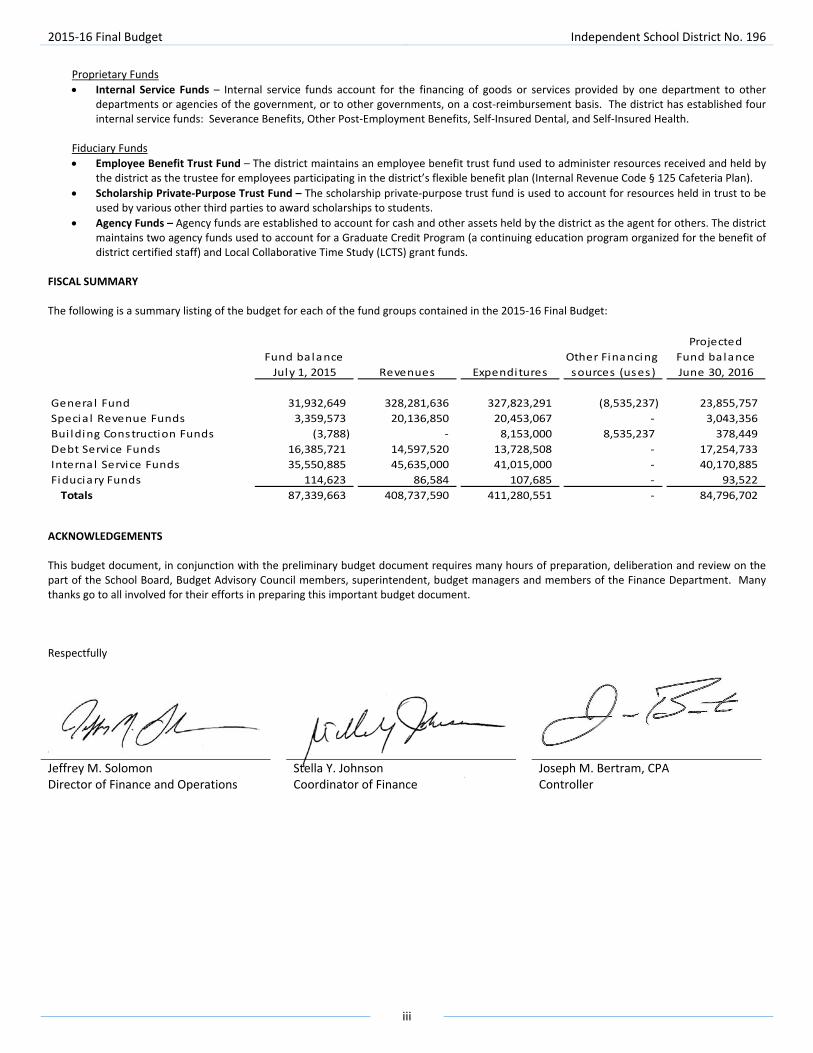
FISCAL SUMMARY The following is a summary listing of the budget for each of the fund groups contained in the 2015‐16 Final Budget:
Projected
Fund balance Other Financing Fund balance
July 1, 2015 Revenues Expenditures sources (uses ) June 30, 2016
Genera l Fund 31,932,649 328,281,636 327,823,291 (8,535,237) 23,855,757
Specia l Revenue Funds 3,359,573 20,136,850 20,453,067 ‐ 3,043,356
Bui lding Construction Funds (3,788) ‐ 8,153,000 8,535,237 378,449
Debt Service Funds 16,385,721 14,597,520 13,728,508 ‐ 17,254,733
Internal Service Funds 35,550,885 45,635,000 41,015,000 ‐ 40,170,885
Fiduciary Funds 114,623 86,584 107,685 ‐ 93,522
Totals 87,339,663 408,737,590 411,280,551 ‐ 84,796,702
ACKNOWLEDGEMENTS This budget document, in conjunction with the preliminary budget document requires many hours of preparation, deliberation and review on the part of the School Board, Budget Advisory Council members, superintendent, budget managers and members of the Finance Department. Many thanks go to all involved for their efforts in preparing this important budget document. Respectfully
Jeffrey M. Solomon Stella Y. Johnson Joseph M. Bertram, CPADirector of Finance and Operations Coordinator of Finance Controller


A Budget Guide For Our Community
2015-16
independent school district 196Rosemount-Apple Valley-Eagan Public Schools
Educating our students to reach their full potential
#196

1Independent School District 196 2015-16 Community Budget Guide
Braddock
Corporate boundary
Interstate
U.S. Hwy.
State Hwy.
County Hwy.
�
1225
7
2
3
424
11
9
13
32
34
��40
��
8
1435
22
6
20 1
15
5 21
231033
16
17
18
31
30�1
�2
Map also available at http://www.district196.org/District/EducationSchools/Boundary_Search.cfm
Burnsville
VermillionTownship
Coates
InverGrove
Heights
Rosemount
Thom
as
Lake
Rd.
McAndrews Rd.
Deerwood Dr.
Rah
n R
d.
Cliff Rd.
Diffley Rd.
John
ny C
ake
Rd.
Southcross Dr.
Palomino D
r.
Portla
nd A
ve.
Minn.Zoo
Dodd Rd.
Empire Township
Whitney Dr.
Haye
s Rd.
160th St.
Foliage
Ave.Gannon Ave.
140th St.
Gal
axie
Ave
.
Ced
ar A
ve.
Dodd
Rd.
145th St.
Apple Valley
160th St.
132nd St.
Gar
den
View
Dr.
Shan
non
Pkw
y. Canada
Ave.
Blai
ne A
ve.
Eagan
Yankee Doodle Rd.
Wescott Rd. Northview Park Rd.
Lone Oak Rd.Le
ton
Ave.
Elrene Rd.
Dod
d R
d.
55
149
5535W35E
4211
35W
35E
3
3
35E
42
42
3
42
3
52
52
52
Barn
es A
ve.
Courthouse Blvd.
135th St.
Pilo
t Kno
b R
d.
Ced
a r A
ve.
Chica
go A
ve.
Akro
n Av
e.
Dia
mon
d Pa
th
55
55
56
communications/maps/maps-b/w/15-16 Updated District Map.epsDistrict 196 Graphics/7-1-2015
Courthouse Blvd.
Pilo
t Kno
b R
d. Elementary Schools 1 Deerwood 2 Echo Park 3 Greenleaf 4 Highland 5 Northview 6 Oak Ridge 7 Parkview 8 Pinewood 9 Red Pine 10 Rosemount 11 Shannon Park 12 Southview 13 Thomas Lake 14 Westview 15 Woodland
Elementary Magnet Schools 16 Cedar Park Science,
Tech., Engineering and Math (STEM) School
17 Diamond Path School of International Studies
18 Glacier Hills School of Arts and Science
Middle Schools 20 Black Hawk 21 Dakota Hills 22 Falcon Ridge 23 Rosemount 24 Scott Highlands 25 Valley Middle - School of STEM
High Schools 30 Apple Valley 31 Eagan 32 Eastview 33 Rosemount 34 School of Environmental Studies 35 Area Learning Center
Special Education School 40 Dakota Ridge
District Offices Cedar Valley Learning Center Dakota Valley Learning Center
�
Lakeville
77
�1
�2
INDEPENDENT SCHOOL DISTRICT 196Rosemount-Apple Valley-Eagan Public Schools
Educating our students to reach their full potential
District Map(2015-16)
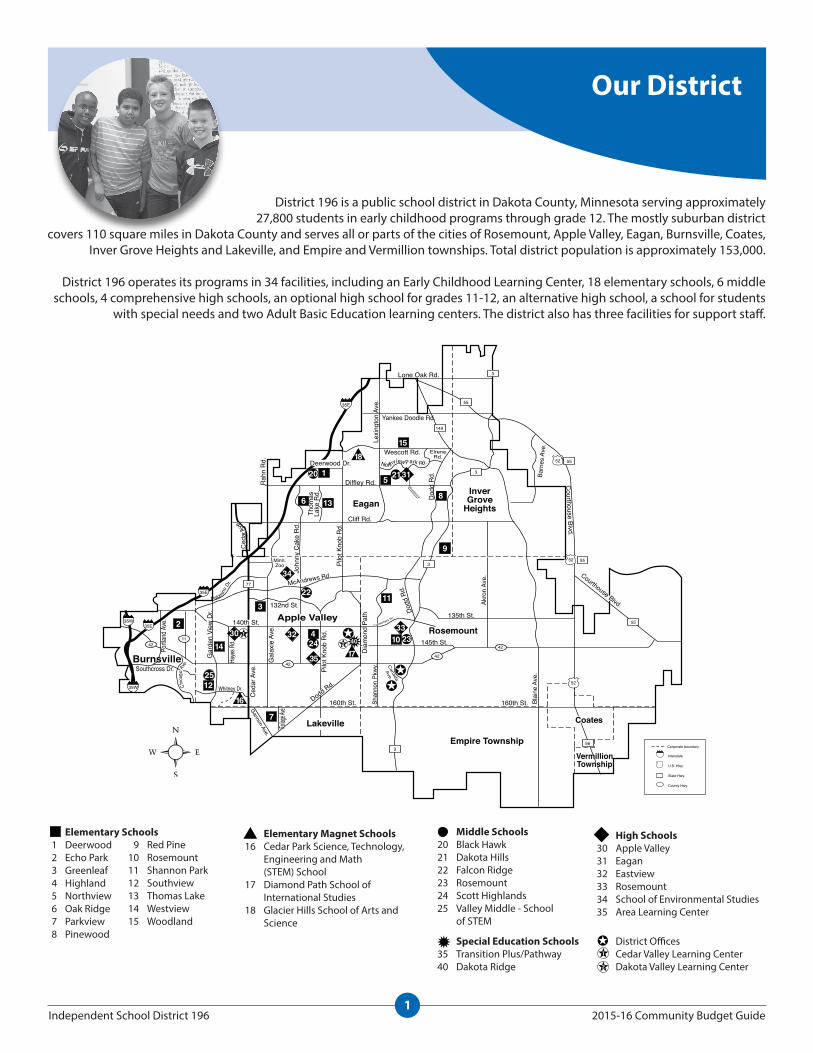
Our District
district 196 is a public school district in dakota county, Minnesota serving approximately 27,800 students in early childhood programs through grade 12. the mostly suburban district
covers 110 square miles in dakota county and serves all or parts of the cities of rosemount, Apple Valley, eagan, Burnsville, coates, inver Grove heights and lakeville, and empire and Vermillion townships. total district population is approximately 153,000.
district 196 operates its programs in 34 facilities, including an early childhood learning center, 18 elementary schools, 6 middle schools, 4 comprehensive high schools, an optional high school for grades 11-12, an alternative high school, a school for students
with special needs and two Adult Basic education learning centers. the district also has three facilities for support staff.
Middle Schools 20 Black hawk 21 dakota hills 22 Falcon ridge 23 rosemount 24 scott highlands 25 Valley Middle - school
of steM
Elementary Magnet Schools 16 cedar park science, technology,
engineering and Math (steM) school
17 diamond path school of international studies
18 Glacier hills school of Arts and science
1
2
district offices cedar Valley learning center dakota Valley learning center
Special Education Schools 35 transition plus/pathway 40 dakota ridge
High Schools 30 Apple Valley 31 eagan 32 eastview 33 rosemount 34 school of environmental studies 35 Area learning center
Elementary Schools 1 deerwood 2 echo park 3 Greenleaf 4 highland 5 northview 6 oak ridge 7 parkview 8 pinewood
9 red pine 10 rosemount 11 shannon park 12 southview 13 thomas lake 14 Westview 15 Woodland
2Independent School District 196 2015-16 Community Budget Guide
13
District 196 By the Numbers
33687
2520024.4
3
712 33
15
40
43
5,921
90
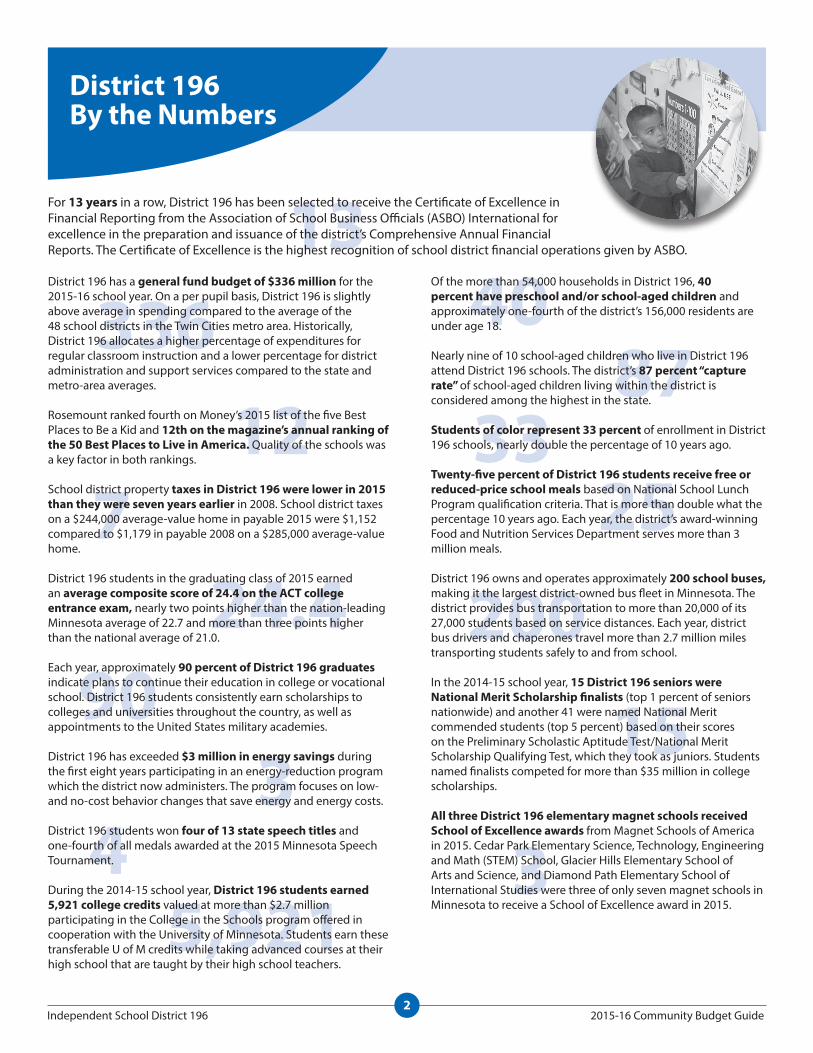
For 13 years in a row, district 196 has been selected to receive the certificate of excellence in Financial reporting from the Association of school Business officials (AsBo) international for excellence in the preparation and issuance of the district’s comprehensive Annual Financial reports. the certificate of excellence is the highest recognition of school district financial operations given by AsBo.
district 196 has a general fund budget of $336 million for the 2015-16 school year. on a per pupil basis, district 196 is slightly above average in spending compared to the average of the 48 school districts in the twin cities metro area. historically, district 196 allocates a higher percentage of expenditures for regular classroom instruction and a lower percentage for district administration and support services compared to the state and metro-area averages.
rosemount ranked fourth on Money’s 2015 list of the five Best places to Be a Kid and 12th on the magazine’s annual ranking of the 50 Best Places to Live in America. Quality of the schools was a key factor in both rankings.
school district property taxes in District 196 were lower in 2015 than they were seven years earlier in 2008. school district taxes on a $244,000 average-value home in payable 2015 were $1,152 compared to $1,179 in payable 2008 on a $285,000 average-value home.
district 196 students in the graduating class of 2015 earned an average composite score of 24.4 on the ACT college entrance exam, nearly two points higher than the nation-leading Minnesota average of 22.7 and more than three points higher than the national average of 21.0.
each year, approximately 90 percent of District 196 graduates indicate plans to continue their education in college or vocational school. district 196 students consistently earn scholarships to colleges and universities throughout the country, as well as appointments to the United states military academies.
district 196 has exceeded $3 million in energy savings during the first eight years participating in an energy-reduction program which the district now administers. the program focuses on low- and no-cost behavior changes that save energy and energy costs.
district 196 students won four of 13 state speech titles and one-fourth of all medals awarded at the 2015 Minnesota speech tournament.
during the 2014-15 school year, District 196 students earned 5,921 college credits valued at more than $2.7 million participating in the college in the schools program offered in cooperation with the University of Minnesota. students earn these transferable U of M credits while taking advanced courses at their high school that are taught by their high school teachers.
of the more than 54,000 households in district 196, 40 percent have preschool and/or school-aged children and approximately one-fourth of the district’s 156,000 residents are under age 18.
nearly nine of 10 school-aged children who live in district 196 attend district 196 schools. the district’s 87 percent “capture rate” of school-aged children living within the district is considered among the highest in the state.
Students of color represent 33 percent of enrollment in district 196 schools, nearly double the percentage of 10 years ago.
Twenty-five percent of District 196 students receive free or reduced-price school meals based on national school lunch program qualification criteria. that is more than double what the percentage 10 years ago. each year, the district’s award-winning Food and nutrition services department serves more than 3 million meals.
district 196 owns and operates approximately 200 school buses, making it the largest district-owned bus fleet in Minnesota. the district provides bus transportation to more than 20,000 of its 27,000 students based on service distances. each year, district bus drivers and chaperones travel more than 2.7 million miles transporting students safely to and from school.
in the 2014-15 school year, 15 District 196 seniors were National Merit Scholarship finalists (top 1 percent of seniors nationwide) and another 41 were named national Merit commended students (top 5 percent) based on their scores on the preliminary scholastic Aptitude test/national Merit scholarship Qualifying test, which they took as juniors. students named finalists competed for more than $35 million in college scholarships.
All three District 196 elementary magnet schools received School of Excellence awards from Magnet schools of America in 2015. cedar park elementary science, technology, engineering and Math (steM) school, Glacier hills elementary school of Arts and science, and diamond path elementary school of international studies were three of only seven magnet schools in Minnesota to receive a school of excellence award in 2015.

3Independent School District 196 2015-16 Community Budget Guide
Our Students
district 196 has an increasingly diverse population of students with a variety of needs. it is the district’s mission to educate our students to reach their full potential. numbers below are based on the district’s October 1, 2015 Official Enrollment Report.
English Learners (EL): 1,696 • 6.10% of all students, compared to a 2013-14 Minnesota
average of 6.9% • More than 87 languages spoken by families living in the
district
Special Education: 4,263 • 15.34% of all students qualify to receive special education
services, compared to a 2013-14 Minnesota average of 14.9%
Gifted and Talented: 2,802 • 10.08% of all students qualify to participate in the district’s
Gifted and talented program
Federal Title I Program • nine district 196 elementary schools receive federal
title i funds to improve the achievement of educationally disadvantaged students
Free or Reduced-Price School Meals • 23.46% of district 196 students qualify to receive free or
reduced-price school meals compared to 38.0% of students statewide in 2013-14
Student Ethnicity
5-Year Enrollment History
district 196 enrollment has remained stable, with changes less than 1% per year, since the 2003-04 school year.
district 196 enrollment is projected to remain stable over the next five years, increasing less than 0.7% per year.
Total Students: 27,790 (10-1-15) • Fourth largest public school district in Minnesota • early childhood special education: 505 (1.81% of students) • center-Based special education: 812 (2.92%) • Grades K - 5: 11,955 (43.01% of students) • Grades 6 - 8: 6,040 (21.73% of students) • Grades 9 - 12: 8,478 (30.53% of students)
5-Year Enrollment Projections
American Indian1.08%
Asian10.37%
Hispanic8.49%
Black13.18%
White68.88%
October 1 enrollment
Year Enrollment2010-11 27,4512011-12 27,4042012-13 27,1682013-14 27,2022014-15 27,4122015-16 27,790
20,000
22,000
24,000
26,000
28,000
30,000
2011-12 2012-13 2013-14 2014-15 2015-16
27,404 27,168 27,202 27,412 27,790
5-Year Enrollment History
October 1 Projections
Year Projection
2016-17 27,8792017-18 28,0772018-19 28,1532019-20 28,2372020-21 28,444
20,000
22,000
24,000
26,000
28,000
30,000
2016-17 2017-18 2018-19 2019-20 2020-21
27,879 28,077 28,153 28,237 28,444
5-Year Enrollment Projections
4Independent School District 196 2015-16 Community Budget Guide
Achievement
district 196 students have a tradition of outstanding achievement both in and out of the classroom. they win a large number of state and national awards in a variety of curricular and cocurricular competitions, and earn scholarships to colleges and universities throughout the country, as well as appointments to United states military academies.
district 196 students consistently score well above average on state and national assessments and graduate at a high rate (see bottom table).
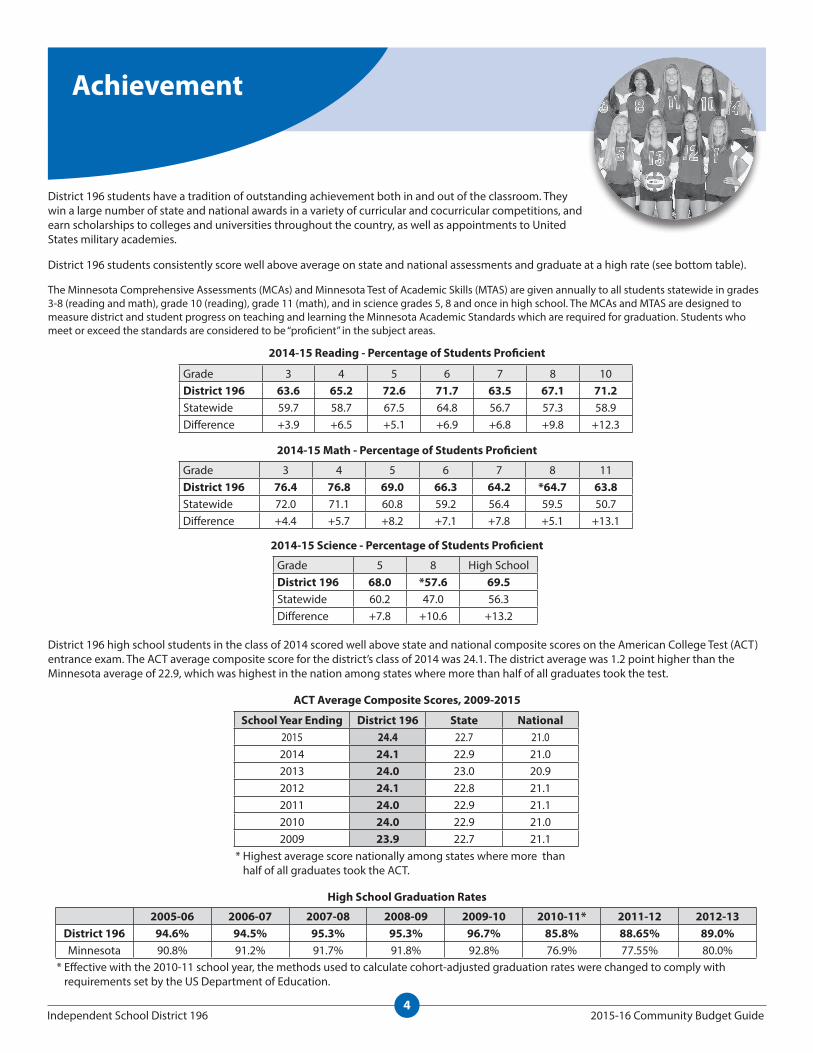
the Minnesota comprehensive Assessments (McAs) and Minnesota test of Academic skills (MtAs) are given annually to all students statewide in grades 3-8 (reading and math), grade 10 (reading), grade 11 (math), and in science grades 5, 8 and once in high school. the McAs and MtAs are designed to measure district and student progress on teaching and learning the Minnesota Academic standards which are required for graduation. students who meet or exceed the standards are considered to be “proficient” in the subject areas.
district 196 high school students in the class of 2014 scored well above state and national composite scores on the American college test (Act) entrance exam. the Act average composite score for the district’s class of 2014 was 24.1. the district average was 1.2 point higher than the Minnesota average of 22.9, which was highest in the nation among states where more than half of all graduates took the test.
Grade 3 4 5 6 7 8 11District 196 76.4 76.8 69.0 66.3 64.2 *64.7 63.8statewide 72.0 71.1 60.8 59.2 56.4 59.5 50.7difference +4.4 +5.7 +8.2 +7.1 +7.8 +5.1 +13.1
Grade 5 8 high schoolDistrict 196 68.0 *57.6 69.5statewide 60.2 47.0 56.3difference +7.8 +10.6 +13.2
2014-15 Math - Percentage of Students Proficient
2014-15 Science - Percentage of Students Proficient
2014-15 Reading - Percentage of Students Proficient
Grade 3 4 5 6 7 8 10District 196 63.6 65.2 72.6 71.7 63.5 67.1 71.2statewide 59.7 58.7 67.5 64.8 56.7 57.3 58.9difference +3.9 +6.5 +5.1 +6.9 +6.8 +9.8 +12.3
ACT Average Composite Scores, 2009-2015
School Year Ending District 196 State National2015 24.4 22.7 21.02014 24.1 22.9 21.02013 24.0 23.0 20.92012 24.1 22.8 21.12011 24.0 22.9 21.12010 24.0 22.9 21.02009 23.9 22.7 21.1
* highest average score nationally among states where more than half of all graduates took the Act.
* effective with the 2010-11 school year, the methods used to calculate cohort-adjusted graduation rates were changed to comply with requirements set by the Us department of education.
High School Graduation Rates
2005-06 2006-07 2007-08 2008-09 2009-10 2010-11* 2011-12 2012-13District 196 94.6% 94.5% 95.3% 95.3% 96.7% 85.8% 88.65% 89.0%Minnesota 90.8% 91.2% 91.7% 91.8% 92.8% 76.9% 77.55% 80.0%
5Independent School District 196 2015-16 Community Budget Guide
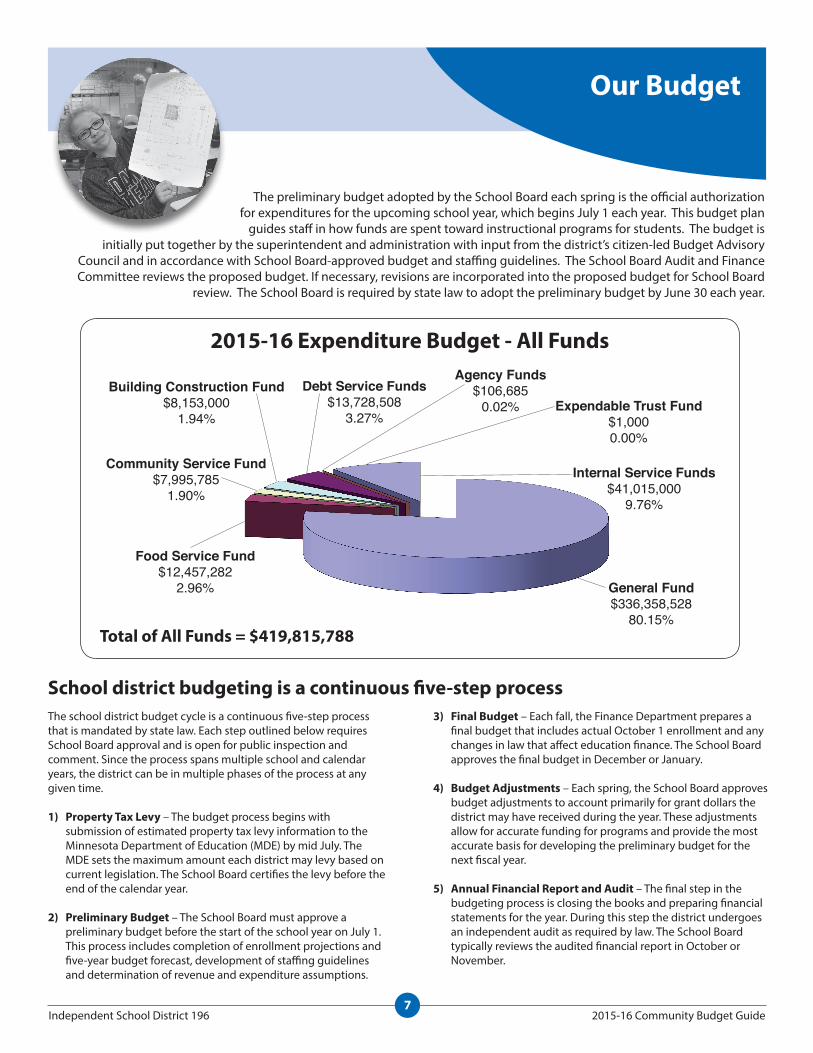
the graph shows the number of staff employed by the school district. the majority of the district’s 3,693 employees are teachers (licensed staff) and classified (non-licensed) staff who provide support to the classroom.
Total Employees by Classification
Our School Board and Staff
the school Board is the governing body of the district, responsible for developing policy to ensure the proper care, management and control of district affairs, and supporting the mission of educating our students to reach their full potential. the board approves staff hiring, sets the annual
local school levy, approves expenditures and educational programs (curriculum), and
otherwise ensures that proper facilities and equipment are available to support teaching and learning in the district.
the seven school Board members are elected at large in odd-numbered years and serve four-year terms. the board typically
holds regular meetings on the second and fourth Monday of each month, as well as workshops, committee meetings and
public hearings, as needed. the public is invited to attend board meetings and may address items on the agenda and during the
open forum and special communication portions of the meeting.
Licensed Staff Classified Staff SchoolAdministrators
District-Level Administrators
Bus Drivers/Chaperones/Mechanics
Food & Nutrition Workers
Jackie Magnuson rob duchscher Art coulson Bob schutte
Joel Albright Gary huusko Mike roseen Jane K. Berenz, superintendent
2,051
1,118
79 39238 168
6Independent School District 196 2015-16 Community Budget Guide
Our Strategies and Goals
in spring 2011, superintendent Jane K. Berenz established the district 196 strategic planning task Force and charged the group to develop a vision for education that will guide district goals through 2016. the 60-member task force included parents, staff, school Board members and leaders from the local business, civic and faith communities. task force members first attended informational meetings to establish a shared base of knowledge about the district, then facilitator-led planning meetings to develop the belief statements and strategies and goals that were approved by the school Board in december 2011 as outlined below.
belief statements
We believe…• students come first• All students can learn• high expectations inspire students and staff to excel• learning is maximized in a safe, respectful and inclusive
environment• A well-rounded education includes opportunities in
academics, the arts and athletics• learning is a lifelong pursuit• effective management of resources is critical• partnerships and collaboration enhance educational
programming• A culture of innovation and continuous improvement
prepares students to be college or career ready• An informed and engaged community guides effective
decision-making
strategy One: TEACHING AND LEARNING
Deliver a high-quality instructional program that anticipates and meets the needs of all learners
• identify and implement essential learning in all content areas for early childhood through grade 12 (e-12) which will be clearly aligned, viable, relevant, rigorous, and understood by staff, students, and parents
• identify and implement effective and engaging instructional strategies that are connected to a rigorous curriculum to maximize learning for all students
• support learning for all students and guide instruction by designing and implementing a balanced assessment program which is both summative and formative
• develop a systematic process of intervention and enrichment in all schools within a district 196 response to intervention framework, ensuring every student receives the time and support needed to master or exceed essential learning
• continue to ensure high-quality teachers through differentiated professional development, effective evaluation and support that promotes collaboration, continuous learning, research-based instructional practices and growth in student achievement
strategy two: EARLY LEARNING
strategy four: PARTNERSHIPS
Develop and implement sustainable strategies to increase collaboration between the district and community partners
• establish a structure that will support new and existing partnerships
• increase partnerships by enhancing relationships among schools and between schools and the community
strategy three: EDuCATIONAL EquITY
Provide a well-aligned continuum of high-quality, culturally responsive, early learning (birth to grade 3) services to meet the needs of all students
• coordinate and align educational experiences between early childhood services (birth to kindergarten) and elementary schools (kindergarten to grade 3)
• offer a continuum of high-quality, culturally responsive, early learning services to meet all students’ needs
• investigate and develop strategies for outreach, community engagement and collaboration
implement a systemic process that increases achievement for all students by addressing equitable access to opportunities in our schools and programs
• increase cultural proficiency across the district
• increase access and participation for all students in cocurricular activities and learning opportunities
• ensure access and increase participation in programs that prepare students for college
• develop a systemic process to recruit and retain diverse and culturally proficient staff to reflect the diversity of the student population
• distribute resources for schools based on multiple factors including student needs (e-12)
7Independent School District 196 2015-16 Community Budget Guide
Our Budget
the preliminary budget adopted by the school Board each spring is the official authorization for expenditures for the upcoming school year, which begins July 1 each year. this budget plan
guides staff in how funds are spent toward instructional programs for students. the budget is initially put together by the superintendent and administration with input from the district’s citizen-led Budget Advisory
council and in accordance with school Board-approved budget and staffing guidelines. the school Board Audit and Finance committee reviews the proposed budget. if necessary, revisions are incorporated into the proposed budget for school Board
review. the school Board is required by state law to adopt the preliminary budget by June 30 each year.
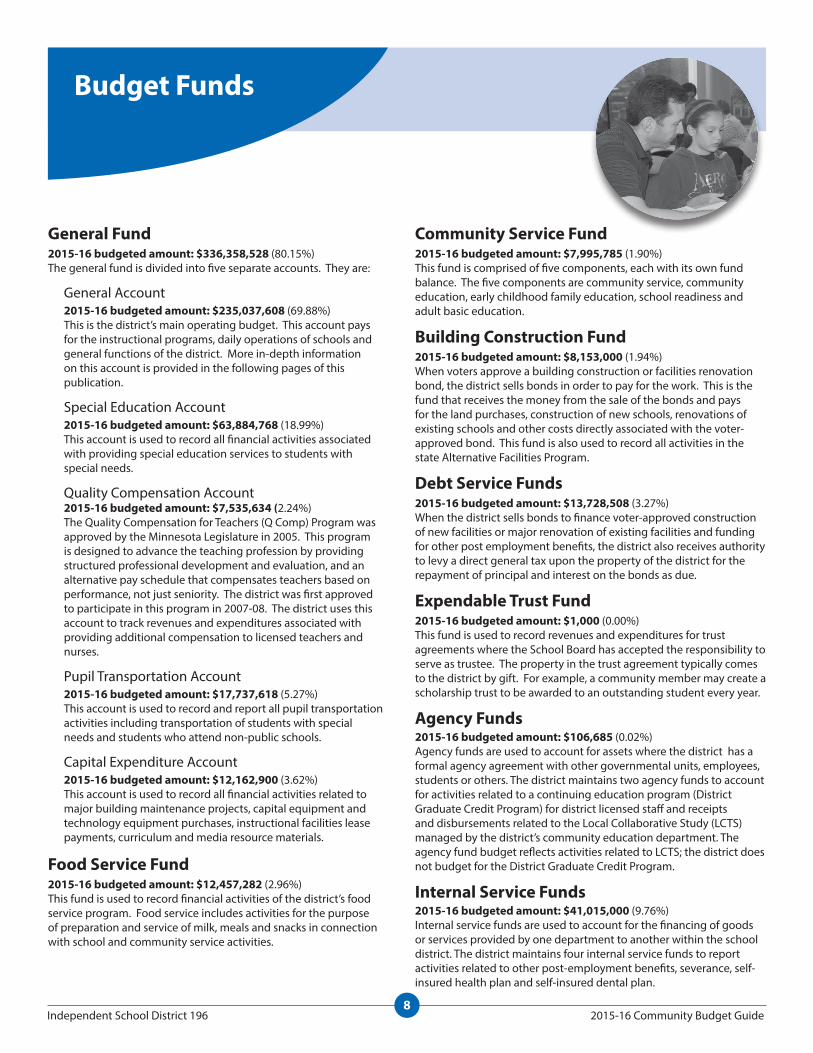
2015-16 Expenditure Budget - All Funds
Total of All Funds = $419,815,788
the school district budget cycle is a continuous five-step process that is mandated by state law. each step outlined below requires school Board approval and is open for public inspection and comment. since the process spans multiple school and calendar years, the district can be in multiple phases of the process at any given time.
1) Property Tax Levy – the budget process begins with submission of estimated property tax levy information to the Minnesota department of education (Mde) by mid July. the Mde sets the maximum amount each district may levy based on current legislation. the school Board certifies the levy before the end of the calendar year.
2) Preliminary Budget – the school Board must approve a preliminary budget before the start of the school year on July 1. this process includes completion of enrollment projections and five-year budget forecast, development of staffing guidelines and determination of revenue and expenditure assumptions.
School district budgeting is a continuous five-step process3) Final Budget – each fall, the Finance department prepares a
final budget that includes actual october 1 enrollment and any changes in law that affect education finance. the school Board approves the final budget in december or January.
4) Budget Adjustments – each spring, the school Board approves budget adjustments to account primarily for grant dollars the district may have received during the year. these adjustments allow for accurate funding for programs and provide the most accurate basis for developing the preliminary budget for the next fiscal year.
5) Annual Financial Report and Audit – the final step in the budgeting process is closing the books and preparing financial statements for the year. during this step the district undergoes an independent audit as required by law. the school Board typically reviews the audited financial report in october or november.
Community Service Fund$7,995,785
1.90%
Building Construction Fund$8,153,000
1.94%
Food Service Fund$12,457,282
2.96% General Fund$336,358,528
80.15%
Internal Service Funds$41,015,000
9.76%
Agency Funds$106,685
0.02% Expendable Trust Fund$1,0000.00%
Debt Service Funds$13,728,508
3.27%
8Independent School District 196 2015-16 Community Budget Guide
Budget Funds
General Fund2015-16 budgeted amount: $336,358,528 (80.15%)the general fund is divided into five separate accounts. they are:
General Account2015-16 budgeted amount: $235,037,608 (69.88%)this is the district’s main operating budget. this account pays for the instructional programs, daily operations of schools and general functions of the district. More in-depth information on this account is provided in the following pages of this publication.
special education Account2015-16 budgeted amount: $63,884,768 (18.99%)this account is used to record all financial activities associated with providing special education services to students with special needs.
Quality compensation Account2015-16 budgeted amount: $7,535,634 (2.24%)the Quality compensation for teachers (Q comp) program was approved by the Minnesota legislature in 2005. this program is designed to advance the teaching profession by providing structured professional development and evaluation, and an alternative pay schedule that compensates teachers based on performance, not just seniority. the district was first approved to participate in this program in 2007-08. the district uses this account to track revenues and expenditures associated with providing additional compensation to licensed teachers and nurses.
pupil transportation Account2015-16 budgeted amount: $17,737,618 (5.27%)this account is used to record and report all pupil transportation activities including transportation of students with special needs and students who attend non-public schools.
capital expenditure Account 2015-16 budgeted amount: $12,162,900 (3.62%)this account is used to record all financial activities related to major building maintenance projects, capital equipment and technology equipment purchases, instructional facilities lease payments, curriculum and media resource materials.
Food Service Fund2015-16 budgeted amount: $12,457,282 (2.96%)this fund is used to record financial activities of the district’s food service program. Food service includes activities for the purpose of preparation and service of milk, meals and snacks in connection with school and community service activities.
Community Service Fund2015-16 budgeted amount: $7,995,785 (1.90%)this fund is comprised of five components, each with its own fund balance. the five components are community service, community education, early childhood family education, school readiness and adult basic education.
Building Construction Fund2015-16 budgeted amount: $8,153,000 (1.94%)When voters approve a building construction or facilities renovation bond, the district sells bonds in order to pay for the work. this is the fund that receives the money from the sale of the bonds and pays for the land purchases, construction of new schools, renovations of existing schools and other costs directly associated with the voter-approved bond. this fund is also used to record all activities in the state Alternative Facilities program.
Debt Service Funds 2015-16 budgeted amount: $13,728,508 (3.27%)When the district sells bonds to finance voter-approved construction of new facilities or major renovation of existing facilities and funding for other post employment benefits, the district also receives authority to levy a direct general tax upon the property of the district for the repayment of principal and interest on the bonds as due.
Expendable Trust Fund2015-16 budgeted amount: $1,000 (0.00%)this fund is used to record revenues and expenditures for trust agreements where the school Board has accepted the responsibility to serve as trustee. the property in the trust agreement typically comes to the district by gift. For example, a community member may create a scholarship trust to be awarded to an outstanding student every year.
Agency Funds2015-16 budgeted amount: $106,685 (0.02%)Agency funds are used to account for assets where the district has a formal agency agreement with other governmental units, employees, students or others. the district maintains two agency funds to account for activities related to a continuing education program (district Graduate credit program) for district licensed staff and receipts and disbursements related to the local collaborative study (lcts) managed by the district’s community education department. the agency fund budget reflects activities related to lcts; the district does not budget for the district Graduate credit program.
Internal Service Funds2015-16 budgeted amount: $41,015,000 (9.76%)internal service funds are used to account for the financing of goods or services provided by one department to another within the school district. the district maintains four internal service funds to report activities related to other post-employment benefits, severance, self-insured health plan and self-insured dental plan.

9Independent School District 196 2015-16 Community Budget Guide
the 2015-16 general fund budget was developed to support the district’s mission to educate our students to reach their full potential and beliefs (see p.6).
• Student Instruction: $238,465,743 (70.90%)
All costs associated with the teaching of students, the interaction between teachers and students in the classroom and cocurricular activities at the kindergarten, elementary and secondary levels. it also includes services for alternative education, special education, bilingual and other compensatory instructional programs.
• Student Support Services: $50,844,928 (15.12%)
this includes all costs associated with operating a school, including student transportation, school office, assessment and testing, guidance, counseling, nursing services and instructional administration. instructional administration includes the directors of elementary and secondary education, and teaching and learning. it also includes the costs of their immediate offices, including those individuals in direct support of the administrator.
• Sites and Buildings: $25,837,450 (7.69%)
this includes all costs for the acquisition, operation, maintenance, repair and remodeling of all facilities and grounds of the school district. it also includes salary and benefits of the district’s building chiefs, custodial staff, groundskeepers and maintenance specialists, and utilities.
• District Support Services: $11,738,295 (3.49%)
this includes expenses for services provided centrally by the district, such as human resources, business services, communication, purchasing, mail processing, technology support and legal services.
• Alternative Facilities and other Permanent Transfers: $8,535,237 (2.53%)
A majority of these transfers is due to a change in how the district is required to report revenues from the Alternative Facilities program levy. Beginning in spring 2008, districts were instructed to report the Alternative Facilities program levy as revenue in the general fund and then transfer that revenue to the building construction fund. this transfer is recorded in the general fund as an expenditure. expenditures funded by the Alternative Facilities program levy are recorded in the building construction fund. in addition, the school Board also approved transfers from the general fund to provide additional support for early childhood screening which is a part of the community service Fund.
• Administration: $936,875 (0.27%)
this includes the costs for general district administration. General district administration includes the school Board and the superintendent.
General Fund
the majority of general fund expenditures are for student instruction and support services. the general fund is the district’s main operating budget and
is the fund over which our school Board has the most discretion.
Total General Fund = $336,358,528
2015-16 General Fund Expenditures
Sites & Buildings$25,837,450
7.69%
District Support Services
$11,738,2953.49%
Student Support Services
$50,844,92815.12%
Student Instruction$238,465,743
70.90%
Administration$936,875
0.27%
Alternative Facilities and other
Permanent Transfers$8,535,237
2.53%
10Independent School District 196 2015-16 Community Budget Guide
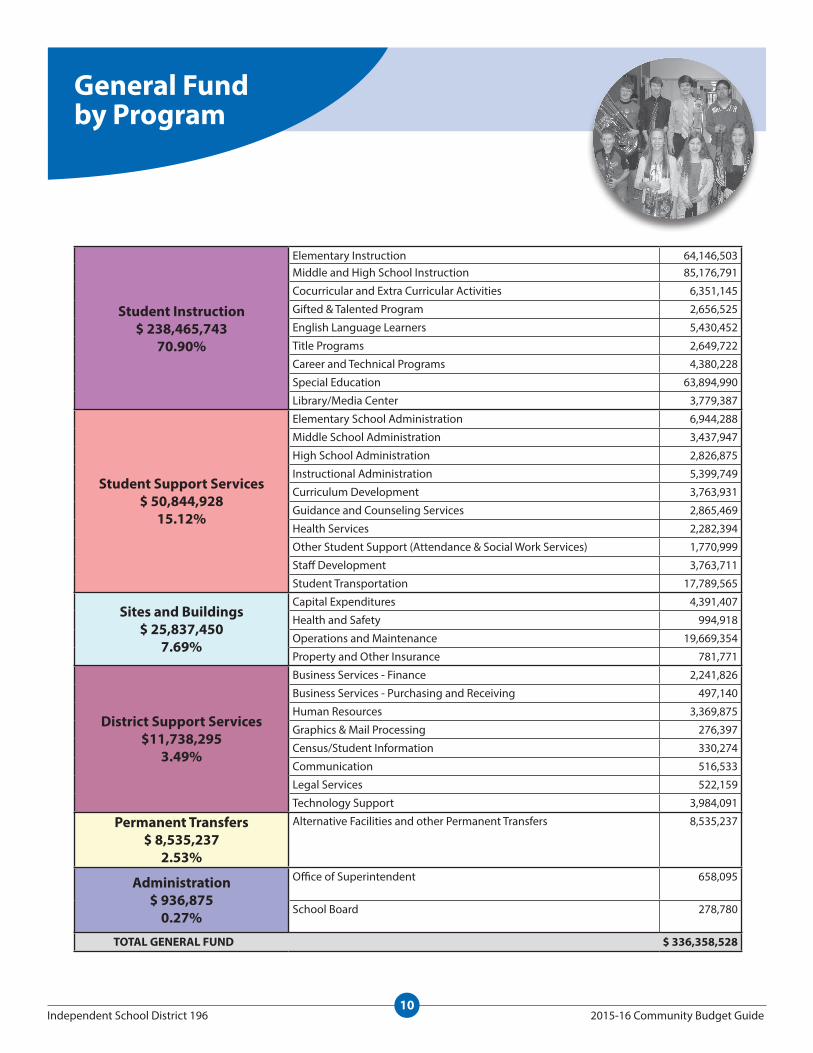
General Fund by Program
Student Instruction$ 238,465,743
70.90%
elementary instruction 64,146,503 Middle and high school instruction 85,176,791
cocurricular and extra curricular Activities 6,351,145
Gifted & talented program 2,656,525
english language learners 5,430,452
title programs 2,649,722
career and technical programs 4,380,228
special education 63,894,990
library/Media center 3,779,387
Student Support Services$ 50,844,928
15.12%
elementary school Administration 6,944,288
Middle school Administration 3,437,947
high school Administration 2,826,875
instructional Administration 5,399,749
curriculum development 3,763,931
Guidance and counseling services 2,865,469
health services 2,282,394
other student support (Attendance & social Work services) 1,770,999
staff development 3,763,711
student transportation 17,789,565
Sites and Buildings$ 25,837,450
7.69%
capital expenditures 4,391,407
health and safety 994,918
operations and Maintenance 19,669,354
property and other insurance 781,771
District Support Services$11,738,295
3.49%
Business services - Finance 2,241,826
Business services - purchasing and receiving 497,140
human resources 3,369,875
Graphics & Mail processing 276,397
census/student information 330,274
communication 516,533
legal services 522,159
technology support 3,984,091
Permanent Transfers$ 8,535,237
2.53%
Alternative Facilities and other permanent transfers 8,535,237
Administration$ 936,875
0.27%
office of superintendent 658,095
school Board 278,780
TOTAL GENERAL FuND $ 336,358,528
11Independent School District 196 2015-16 Community Budget Guide
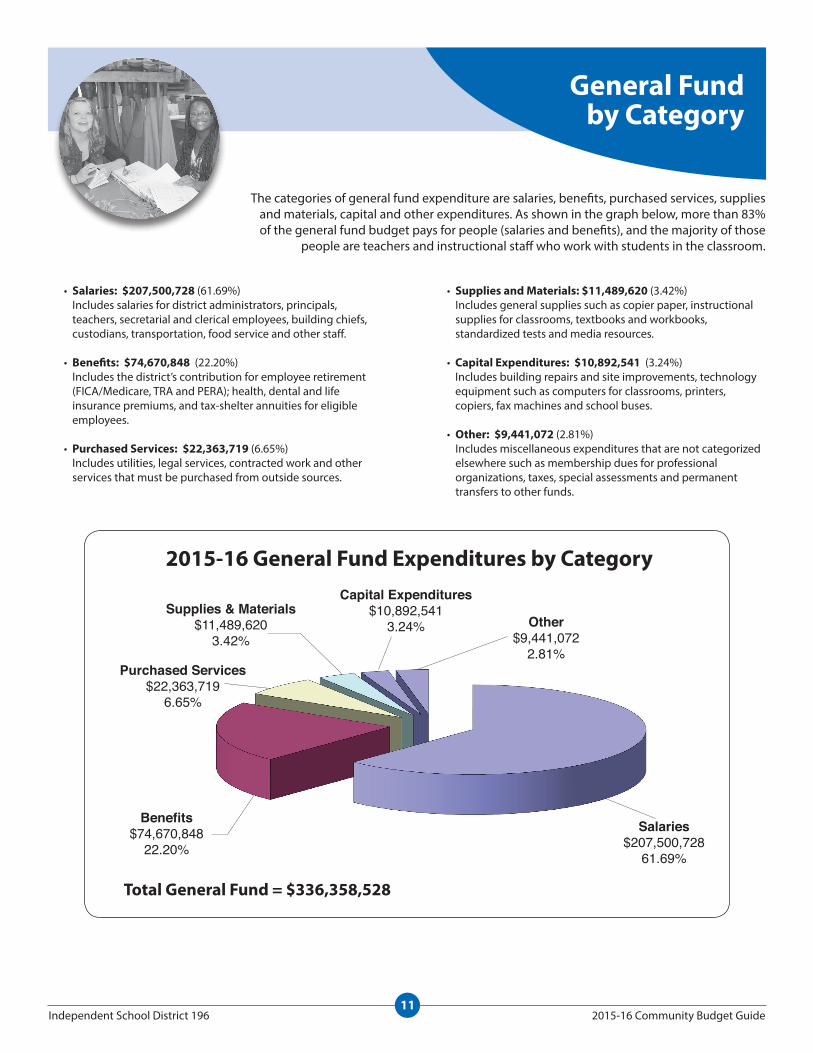
General Fund by Category
• Salaries: $207,500,728 (61.69%) includes salaries for district administrators, principals, teachers, secretarial and clerical employees, building chiefs, custodians, transportation, food service and other staff.
• Benefits: $74,670,848 (22.20%) includes the district’s contribution for employee retirement (FicA/Medicare, trA and perA); health, dental and life insurance premiums, and tax-shelter annuities for eligible employees.
• Purchased Services: $22,363,719 (6.65%) includes utilities, legal services, contracted work and other services that must be purchased from outside sources.
the categories of general fund expenditure are salaries, benefits, purchased services, supplies and materials, capital and other expenditures. As shown in the graph below, more than 83% of the general fund budget pays for people (salaries and benefits), and the majority of those
people are teachers and instructional staff who work with students in the classroom.
• Supplies and Materials: $11,489,620 (3.42%) includes general supplies such as copier paper, instructional supplies for classrooms, textbooks and workbooks, standardized tests and media resources.
• Capital Expenditures: $10,892,541 (3.24%) includes building repairs and site improvements, technology equipment such as computers for classrooms, printers, copiers, fax machines and school buses.
• Other: $9,441,072 (2.81%) includes miscellaneous expenditures that are not categorized elsewhere such as membership dues for professional organizations, taxes, special assessments and permanent transfers to other funds.
Supplies & Materials$11,489,620
3.42%
Purchased Services$22,363,719
6.65%
Capital Expenditures$10,892,541
3.24%
Benefits$74,670,848
22.20%Salaries
$207,500,72861.69%
Other$9,441,072
2.81%
2015-16 General Fund Expenditures by Category
Total General Fund = $336,358,528
12Independent School District 196 2015-16 Community Budget Guide
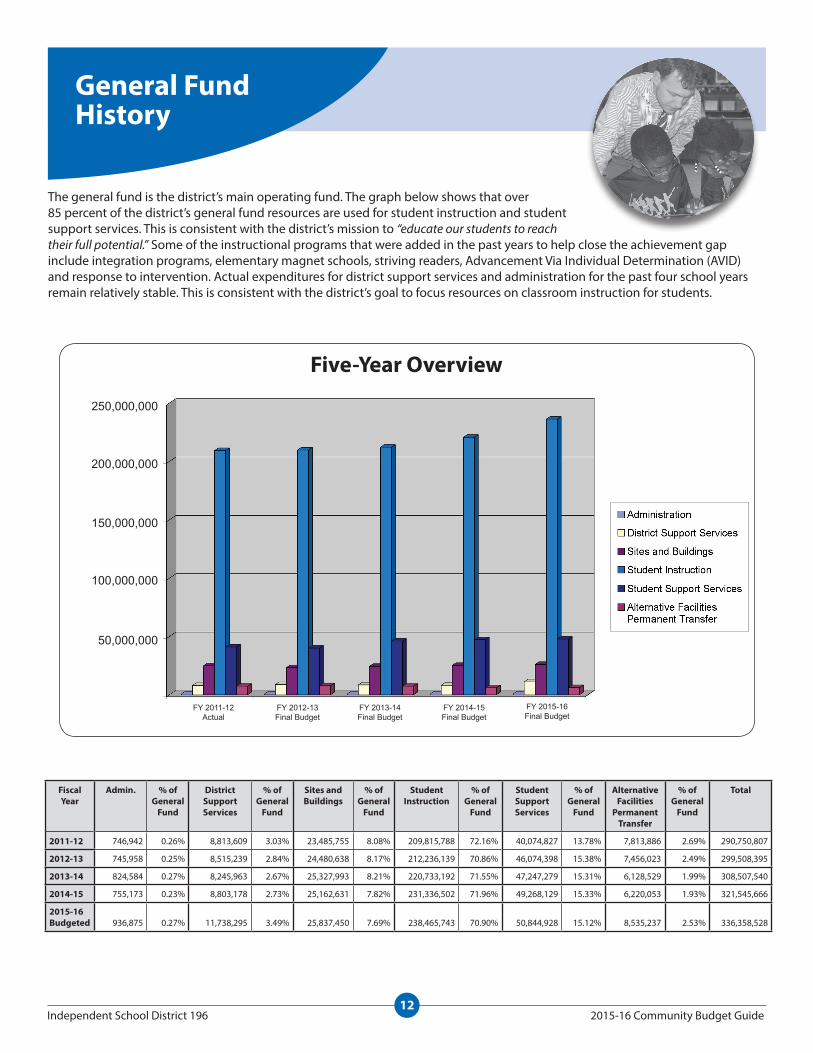
General Fund History
the general fund is the district’s main operating fund. the graph below shows that over 85 percent of the district’s general fund resources are used for student instruction and student support services. this is consistent with the district’s mission to “educate our students to reach their full potential.” some of the instructional programs that were added in the past years to help close the achievement gap include integration programs, elementary magnet schools, striving readers, Advancement Via individual determination (AVid) and response to intervention. Actual expenditures for district support services and administration for the past four school years remain relatively stable. this is consistent with the district’s goal to focus resources on classroom instruction for students.
FiscalYear
Admin. % of General
Fund
District Support Services
% of General
Fund
Sites and Buildings
% of General
Fund
Student Instruction
% of General
Fund
Student Support Services
% of General
Fund
Alternative Facilities
Permanent Transfer
% of General
Fund
Total
2011-12 746,942 0.26% 8,813,609 3.03% 23,485,755 8.08% 209,815,788 72.16% 40,074,827 13.78% 7,813,886 2.69% 290,750,807
2012-13 745,958 0.25% 8,515,239 2.84% 24,480,638 8.17% 212,236,139 70.86% 46,074,398 15.38% 7,456,023 2.49% 299,508,395
2013-14 824,584 0.27% 8,245,963 2.67% 25,327,993 8.21% 220,733,192 71.55% 47,247,279 15.31% 6,128,529 1.99% 308,507,540
2014-15 755,173 0.23% 8,803,178 2.73% 25,162,631 7.82% 231,336,502 71.96% 49,268,129 15.33% 6,220,053 1.93% 321,545,666
2015-16Budgeted 936,875 0.27% 11,738,295 3.49% 25,837,450 7.69% 238,465,743 70.90% 50,844,928 15.12% 8,535,237 2.53% 336,358,528
Five-Year Overview
250,000,000
200,000,000
150,000,000
100,000,000
50,000,000
FY 2015-16 Final Budget
FY 2011-12 Actual
FY 2012-13 Final Budget
FY 2013-14 Final Budget
FY 2014-15 Final Budget
13Independent School District 196 2015-16 Community Budget Guide
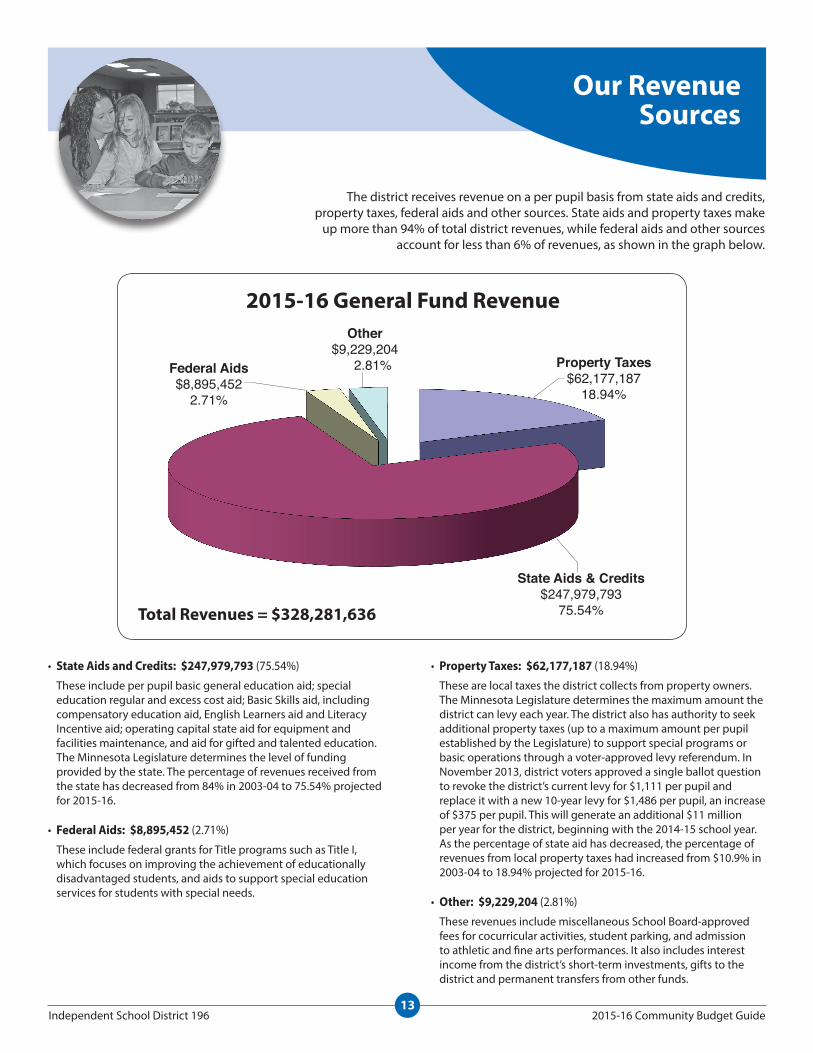
Our Revenue Sources
• State Aids and Credits: $247,979,793 (75.54%)
these include per pupil basic general education aid; special education regular and excess cost aid; Basic skills aid, including compensatory education aid, english learners aid and literacy incentive aid; operating capital state aid for equipment and facilities maintenance, and aid for gifted and talented education. the Minnesota legislature determines the level of funding provided by the state. the percentage of revenues received from the state has decreased from 84% in 2003-04 to 75.54% projected for 2015-16.
• Federal Aids: $8,895,452 (2.71%)
these include federal grants for title programs such as title i, which focuses on improving the achievement of educationally disadvantaged students, and aids to support special education services for students with special needs.
the district receives revenue on a per pupil basis from state aids and credits, property taxes, federal aids and other sources. state aids and property taxes make
up more than 94% of total district revenues, while federal aids and other sources account for less than 6% of revenues, as shown in the graph below.
• Property Taxes: $62,177,187 (18.94%)
these are local taxes the district collects from property owners. the Minnesota legislature determines the maximum amount the district can levy each year. the district also has authority to seek additional property taxes (up to a maximum amount per pupil established by the legislature) to support special programs or basic operations through a voter-approved levy referendum. in november 2013, district voters approved a single ballot question to revoke the district’s current levy for $1,111 per pupil and replace it with a new 10-year levy for $1,486 per pupil, an increase of $375 per pupil. this will generate an additional $11 million per year for the district, beginning with the 2014-15 school year. As the percentage of state aid has decreased, the percentage of revenues from local property taxes had increased from $10.9% in 2003-04 to 18.94% projected for 2015-16.
• Other: $9,229,204 (2.81%)
these revenues include miscellaneous school Board-approved fees for cocurricular activities, student parking, and admission to athletic and fine arts performances. it also includes interest income from the district’s short-term investments, gifts to the district and permanent transfers from other funds.
Other$9,229,204
2.81%Federal Aids$8,895,452
2.71%
State Aids & Credits$247,979,793
75.54%
Property Taxes$62,177,187
18.94%
2015-16 General Fund Revenue
Total Revenues = $328,281,636

14Independent School District 196 2015-16 Community Budget Guide
Property Taxes
school district property tax levies are limited by state law. the Minnesota department of education computes the levy limitation for each school district based on current legislation and formulas. the school district then certifies the levy to the county auditor, the county sends out tax statements to individual property owners, collects the taxes and makes payments to the school district.
For 2015-16, the voter-approved levies for the district’s general fund total $29.9 million before state aids and credits; levies based on school Board decisions total $48.7 million before state aids and credits.
the chart below shows the average home value for the district and the corresponding school tax from calendar year 2008 to calendar year 2015. home values within the district have been declining the last three years following statewide property value trends.
property taxes are determined by the taxable market value of the property (determined by the county assessor), class rate percentages set in law for each category of property (such as residential homestead, residential non-homestead, apartments, etc.) and state-paid property tax aids and credits. these state-paid property tax aids and credits reduce the actual amount of tax paid by property owners.
the two types of property tax levies are: • Voter-approved levies – these include building bond and
operating levy referendum votes. • levies resulting from school Board decisions – levy limitations
are calculated by the Minnesota department of education based on current legislation and formulas. the school Board can approve levy amounts up to but not exceeding the limits established by the state. examples include the safe schools levy, alternative facilities levy, health and safety levy, etc.
School Taxes Payable on Average Value Home
Macintosh HD:Users:barb:Library:Caches:TemporaryItems:Outlook Temp:Tax Estimator TNT Pay 15.xlsx
284,871 278,570 256,714
239,506 232,258 216,768 224,629
243,700 1,179 1,144
1,186 1,145 1,128 1,066
1,153 1,152
$0
$200
$400
$600
$800
$1,000
$1,200
$1,400
$0
$50,000
$100,000
$150,000
$200,000
$250,000
$300,000
2008 2009 2010 2011 2012 2013 2014 2015
Scho
ol T
ax
Hom
e Va
lue
Payable Tax Year
School Taxes Payable on Avg. Value Home
Avg Home in ISD 196 School Tax
15Independent School District 196 2015-16 Community Budget Guide
Below are answers to some commonly asked questions regarding the school district budget and finances.
Budget FAqs and Contact Info
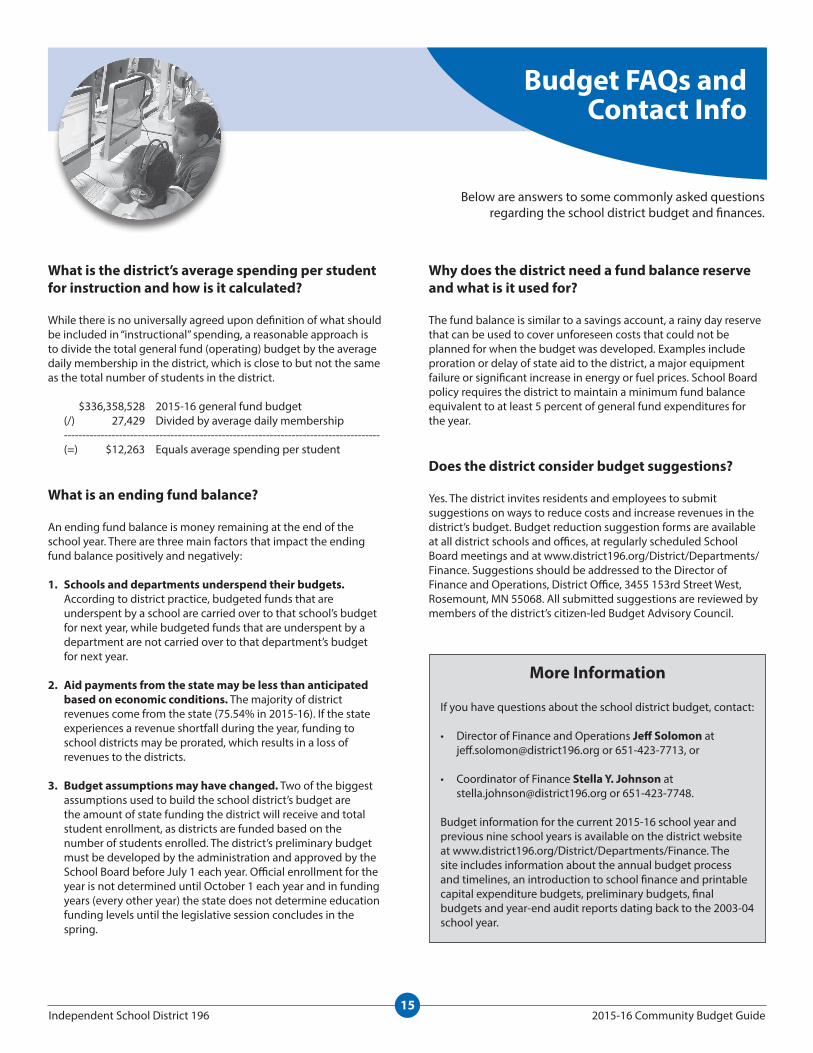
What is the district’s average spending per student for instruction and how is it calculated?
While there is no universally agreed upon definition of what should be included in “instructional” spending, a reasonable approach is to divide the total general fund (operating) budget by the average daily membership in the district, which is close to but not the same as the total number of students in the district.
$336,358,528 2015-16 general fund budget (/) 27,429 divided by average daily membership -------------------------------------------------------------------------------------- (=) $12,263 equals average spending per student
What is an ending fund balance?
An ending fund balance is money remaining at the end of the school year. there are three main factors that impact the ending fund balance positively and negatively:
1. Schools and departments underspend their budgets. According to district practice, budgeted funds that are underspent by a school are carried over to that school’s budget for next year, while budgeted funds that are underspent by a department are not carried over to that department’s budget for next year.
2. Aid payments from the state may be less than anticipated based on economic conditions. the majority of district revenues come from the state (75.54% in 2015-16). if the state experiences a revenue shortfall during the year, funding to school districts may be prorated, which results in a loss of revenues to the districts.
3. Budget assumptions may have changed. two of the biggest assumptions used to build the school district’s budget are the amount of state funding the district will receive and total student enrollment, as districts are funded based on the number of students enrolled. the district’s preliminary budget must be developed by the administration and approved by the school Board before July 1 each year. official enrollment for the year is not determined until october 1 each year and in funding years (every other year) the state does not determine education funding levels until the legislative session concludes in the spring.
More Information
if you have questions about the school district budget, contact:
• director of Finance and operations Jeff Solomon at [email protected] or 651-423-7713, or
• coordinator of Finance Stella Y. Johnson at [email protected] or 651-423-7748.
Budget information for the current 2015-16 school year and previous nine school years is available on the district website at www.district196.org/district/departments/Finance. the site includes information about the annual budget process and timelines, an introduction to school finance and printable capital expenditure budgets, preliminary budgets, final budgets and year-end audit reports dating back to the 2003-04 school year.
Why does the district need a fund balance reserve and what is it used for?
the fund balance is similar to a savings account, a rainy day reserve that can be used to cover unforeseen costs that could not be planned for when the budget was developed. examples include proration or delay of state aid to the district, a major equipment failure or significant increase in energy or fuel prices. school Board policy requires the district to maintain a minimum fund balance equivalent to at least 5 percent of general fund expenditures for the year.
Does the district consider budget suggestions?
Yes. the district invites residents and employees to submit suggestions on ways to reduce costs and increase revenues in the district’s budget. Budget reduction suggestion forms are available at all district schools and offices, at regularly scheduled school Board meetings and at www.district196.org/district/departments/Finance. suggestions should be addressed to the director of Finance and operations, district office, 3455 153rd street West, rosemount, Mn 55068. All submitted suggestions are reviewed by members of the district’s citizen-led Budget Advisory council.

Financial Section

2015‐16 Final Budget Independent School District No. 196
16
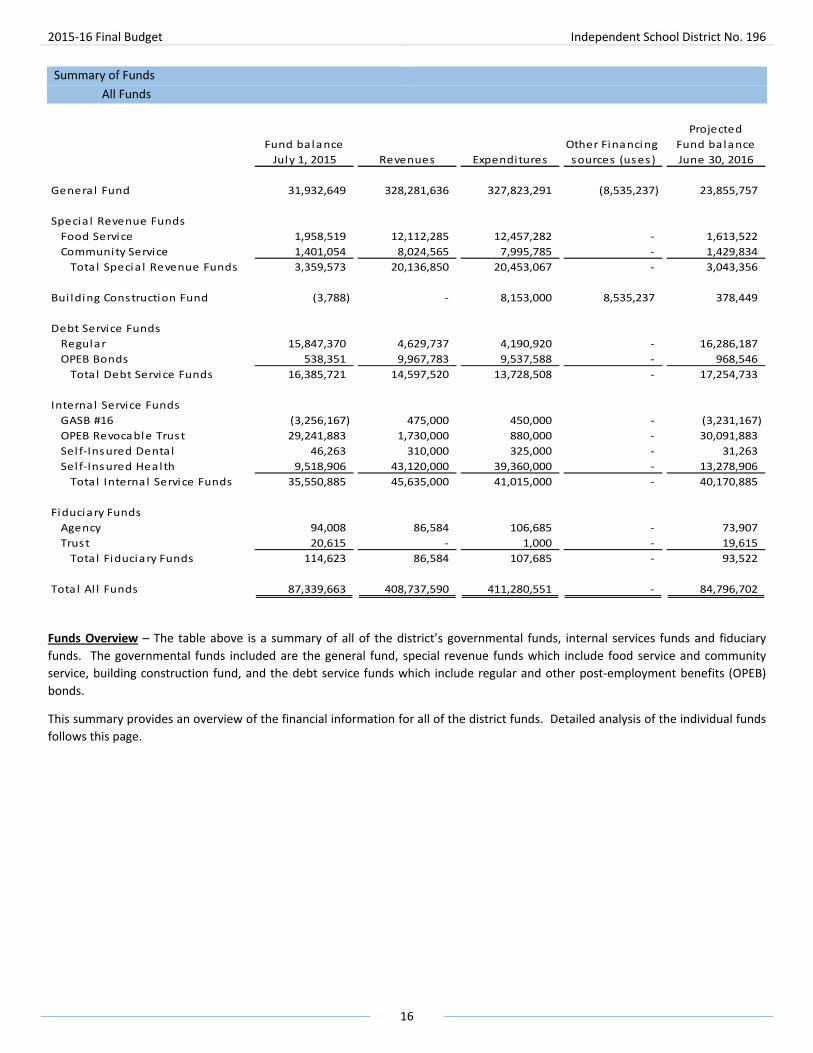
Summary of Funds
All Funds
Projected
Fund balance Other Financing Fund balance
July 1, 2015 Revenues Expenditures sources (uses ) June 30, 2016
Genera l Fund 31,932,649 328,281,636 327,823,291 (8,535,237) 23,855,757
Specia l Revenue Funds
Food Service 1,958,519 12,112,285 12,457,282 ‐ 1,613,522
Community Service 1,401,054 8,024,565 7,995,785 ‐ 1,429,834
Tota l Specia l Revenue Funds 3,359,573 20,136,850 20,453,067 ‐ 3,043,356
Bui lding Construction Fund (3,788) ‐ 8,153,000 8,535,237 378,449
Debt Service Funds
Regular 15,847,370 4,629,737 4,190,920 ‐ 16,286,187
OPEB Bonds 538,351 9,967,783 9,537,588 ‐ 968,546
Tota l Debt Service Funds 16,385,721 14,597,520 13,728,508 ‐ 17,254,733
Internal Service Funds
GASB #16 (3,256,167) 475,000 450,000 ‐ (3,231,167)
OPEB Revocable Trust 29,241,883 1,730,000 880,000 ‐ 30,091,883
Sel f‐Insured Denta l 46,263 310,000 325,000 ‐ 31,263
Sel f‐Insured Health 9,518,906 43,120,000 39,360,000 ‐ 13,278,906
Tota l Internal Service Funds 35,550,885 45,635,000 41,015,000 ‐ 40,170,885
Fiduciary Funds
Agency 94,008 86,584 106,685 ‐ 73,907
Trust 20,615 ‐ 1,000 ‐ 19,615
Tota l Fiduciary Funds 114,623 86,584 107,685 ‐ 93,522
Tota l Al l Funds 87,339,663 408,737,590 411,280,551 ‐ 84,796,702
Funds Overview – The table above is a summary of all of the district’s governmental funds, internal services funds and fiduciary
funds. The governmental funds included are the general fund, special revenue funds which include food service and community
service, building construction fund, and the debt service funds which include regular and other post‐employment benefits (OPEB)
bonds.
This summary provides an overview of the financial information for all of the district funds. Detailed analysis of the individual funds
follows this page.
2015‐16 Final Budget Independent School District No. 196
17
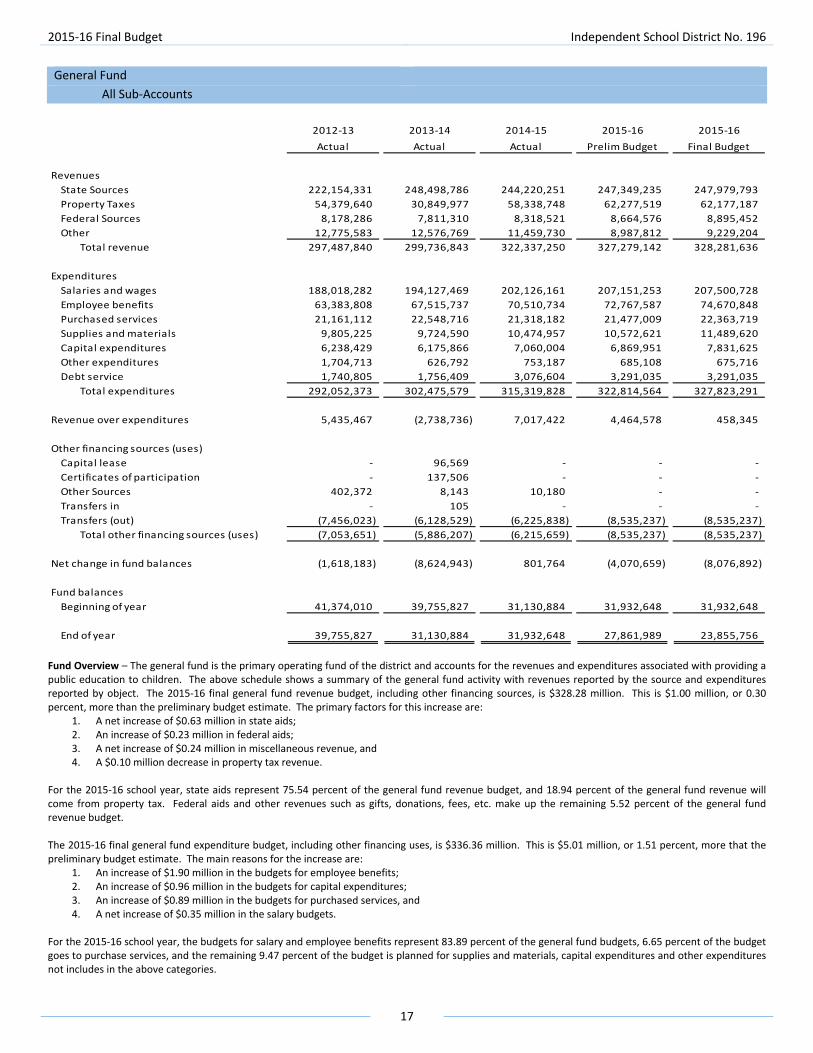
General Fund
All Sub‐Accounts
2012‐13 2013‐14 2014‐15 2015‐16 2015‐16
Actual Actual Actual Prelim Budget Final Budget
Revenues
State Sources 222,154,331 248,498,786 244,220,251 247,349,235 247,979,793
Property Taxes 54,379,640 30,849,977 58,338,748 62,277,519 62,177,187
Federal Sources 8,178,286 7,811,310 8,318,521 8,664,576 8,895,452
Other 12,775,583 12,576,769 11,459,730 8,987,812 9,229,204
Total revenue 297,487,840 299,736,843 322,337,250 327,279,142 328,281,636
Expenditures
Salaries and wages 188,018,282 194,127,469 202,126,161 207,151,253 207,500,728
Employee benefits 63,383,808 67,515,737 70,510,734 72,767,587 74,670,848
Purchased services 21,161,112 22,548,716 21,318,182 21,477,009 22,363,719
Supplies and materials 9,805,225 9,724,590 10,474,957 10,572,621 11,489,620
Capital expenditures 6,238,429 6,175,866 7,060,004 6,869,951 7,831,625
Other expenditures 1,704,713 626,792 753,187 685,108 675,716
Debt service 1,740,805 1,756,409 3,076,604 3,291,035 3,291,035
Total expenditures 292,052,373 302,475,579 315,319,828 322,814,564 327,823,291
Revenue over expenditures 5,435,467 (2,738,736) 7,017,422 4,464,578 458,345
Other financing sources (uses)
Capital lease ‐ 96,569 ‐ ‐ ‐
Certificates of participation ‐ 137,506 ‐ ‐ ‐
Other Sources 402,372 8,143 10,180 ‐ ‐
Transfers in ‐ 105 ‐ ‐ ‐
Transfers (out) (7,456,023) (6,128,529) (6,225,838) (8,535,237) (8,535,237)
Total other financing sources (uses) (7,053,651) (5,886,207) (6,215,659) (8,535,237) (8,535,237)
Net change in fund balances (1,618,183) (8,624,943) 801,764 (4,070,659) (8,076,892)
Fund balances
Beginning of year 41,374,010 39,755,827 31,130,884 31,932,648 31,932,648
End of year 39,755,827 31,130,884 31,932,648 27,861,989 23,855,756
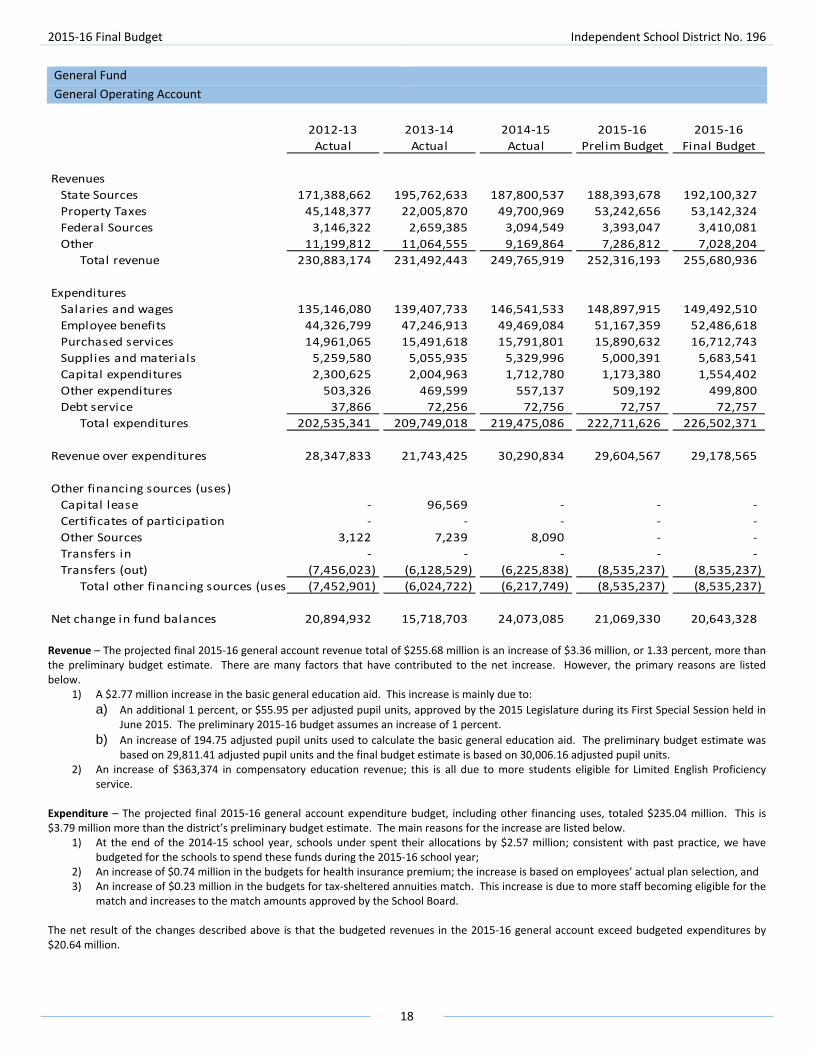
Fund Overview – The general fund is the primary operating fund of the district and accounts for the revenues and expenditures associated with providing a public education to children. The above schedule shows a summary of the general fund activity with revenues reported by the source and expenditures reported by object. The 2015‐16 final general fund revenue budget, including other financing sources, is $328.28 million. This is $1.00 million, or 0.30 percent, more than the preliminary budget estimate. The primary factors for this increase are:
1. A net increase of $0.63 million in state aids; 2. An increase of $0.23 million in federal aids; 3. A net increase of $0.24 million in miscellaneous revenue, and 4. A $0.10 million decrease in property tax revenue.
For the 2015‐16 school year, state aids represent 75.54 percent of the general fund revenue budget, and 18.94 percent of the general fund revenue will come from property tax. Federal aids and other revenues such as gifts, donations, fees, etc. make up the remaining 5.52 percent of the general fund revenue budget. The 2015‐16 final general fund expenditure budget, including other financing uses, is $336.36 million. This is $5.01 million, or 1.51 percent, more that the preliminary budget estimate. The main reasons for the increase are:
1. An increase of $1.90 million in the budgets for employee benefits; 2. An increase of $0.96 million in the budgets for capital expenditures; 3. An increase of $0.89 million in the budgets for purchased services, and 4. A net increase of $0.35 million in the salary budgets.
For the 2015‐16 school year, the budgets for salary and employee benefits represent 83.89 percent of the general fund budgets, 6.65 percent of the budget goes to purchase services, and the remaining 9.47 percent of the budget is planned for supplies and materials, capital expenditures and other expenditures not includes in the above categories.
2015‐16 Final Budget Independent School District No. 196
18
General Fund
General Operating Account
2012‐13 2013‐14 2014‐15 2015‐16 2015‐16
Actual Actual Actual Prelim Budget Final Budget
Revenues
State Sources 171,388,662 195,762,633 187,800,537 188,393,678 192,100,327
Property Taxes 45,148,377 22,005,870 49,700,969 53,242,656 53,142,324
Federal Sources 3,146,322 2,659,385 3,094,549 3,393,047 3,410,081
Other 11,199,812 11,064,555 9,169,864 7,286,812 7,028,204
Total revenue 230,883,174 231,492,443 249,765,919 252,316,193 255,680,936
Expenditures
Salaries and wages 135,146,080 139,407,733 146,541,533 148,897,915 149,492,510
Employee benefits 44,326,799 47,246,913 49,469,084 51,167,359 52,486,618
Purchased services 14,961,065 15,491,618 15,791,801 15,890,632 16,712,743
Supplies and materials 5,259,580 5,055,935 5,329,996 5,000,391 5,683,541
Capital expenditures 2,300,625 2,004,963 1,712,780 1,173,380 1,554,402
Other expenditures 503,326 469,599 557,137 509,192 499,800
Debt service 37,866 72,256 72,756 72,757 72,757
Total expenditures 202,535,341 209,749,018 219,475,086 222,711,626 226,502,371
Revenue over expenditures 28,347,833 21,743,425 30,290,834 29,604,567 29,178,565
Other financing sources (uses)
Capital lease ‐ 96,569 ‐ ‐ ‐
Certificates of participation ‐ ‐ ‐ ‐ ‐
Other Sources 3,122 7,239 8,090 ‐ ‐
Transfers in ‐ ‐ ‐ ‐ ‐
Transfers (out) (7,456,023) (6,128,529) (6,225,838) (8,535,237) (8,535,237)
Total other financing sources (uses (7,452,901) (6,024,722) (6,217,749) (8,535,237) (8,535,237)
Net change in fund balances 20,894,932 15,718,703 24,073,085 21,069,330 20,643,328
Revenue – The projected final 2015‐16 general account revenue total of $255.68 million is an increase of $3.36 million, or 1.33 percent, more than the preliminary budget estimate. There are many factors that have contributed to the net increase. However, the primary reasons are listed below.
1) A $2.77 million increase in the basic general education aid. This increase is mainly due to:
a) An additional 1 percent, or $55.95 per adjusted pupil units, approved by the 2015 Legislature during its First Special Session held in June 2015. The preliminary 2015‐16 budget assumes an increase of 1 percent.
b) An increase of 194.75 adjusted pupil units used to calculate the basic general education aid. The preliminary budget estimate was based on 29,811.41 adjusted pupil units and the final budget estimate is based on 30,006.16 adjusted pupil units.
2) An increase of $363,374 in compensatory education revenue; this is all due to more students eligible for Limited English Proficiency service.
Expenditure – The projected final 2015‐16 general account expenditure budget, including other financing uses, totaled $235.04 million. This is $3.79 million more than the district’s preliminary budget estimate. The main reasons for the increase are listed below.
1) At the end of the 2014‐15 school year, schools under spent their allocations by $2.57 million; consistent with past practice, we have budgeted for the schools to spend these funds during the 2015‐16 school year;
2) An increase of $0.74 million in the budgets for health insurance premium; the increase is based on employees’ actual plan selection, and 3) An increase of $0.23 million in the budgets for tax‐sheltered annuities match. This increase is due to more staff becoming eligible for the
match and increases to the match amounts approved by the School Board. The net result of the changes described above is that the budgeted revenues in the 2015‐16 general account exceed budgeted expenditures by $20.64 million.

2015‐16 Final Budget Independent School District No. 196
19
General Fund
Special Education Account
2012‐13 2013‐14 2014‐15 2015‐16 2015‐16
Actual Actual Actual Prelim Budget Final Budget
Revenues
State Sources 27,001,667 28,303,711 31,831,268 32,601,007 29,898,439
Property Taxes ‐ ‐ ‐ ‐ ‐
Federal Sources 5,031,964 5,151,925 5,223,972 5,271,529 5,485,371
Other 343,268 281,736 995,942 500,000 1,000,000
Total revenue 32,376,899 33,737,372 38,051,181 38,372,536 36,383,810
Expenditures
Salaries and wages 40,271,928 42,049,618 42,722,989 44,898,492 44,631,428
Employee benefits 14,481,805 15,533,730 16,123,636 16,262,380 16,693,452
Purchased services 1,099,319 1,128,806 1,099,740 1,276,813 1,343,012
Supplies and materials 518,965 658,085 497,010 738,484 793,889
Capital expenditures 298,461 301,674 496,933 239,728 298,871
Other expenditures 37,097 105,029 108,972 124,116 124,116
Debt service ‐ ‐ ‐ ‐ ‐
Total expenditures 56,707,574 59,776,942 61,049,280 63,540,013 63,884,768
Revenue over expenditures (24,330,675) (26,039,571) (22,998,098) (25,167,477) (27,500,958)
Other financing sources (uses)
Capital lease ‐ ‐ ‐ ‐ ‐
Certificates of participation ‐ ‐ ‐ ‐ ‐
Other Sources ‐ ‐ ‐ ‐ ‐
Transfers in ‐ ‐ ‐ ‐ ‐
Transfers (out) ‐ ‐ ‐ ‐ ‐
Total other financing sources (uses ‐ ‐ ‐ ‐ ‐
Net change in fund balances (24,330,675) (26,039,571) (22,998,098) (25,167,477) (27,500,958)
Revenue – The projected final 2015‐16 special education account revenues totaled $36.8 million. This is $1.99 million, or 5.18 percent, less than the preliminary estimate. This decrease is chiefly due to the following two factors:
1) A $0.50 million increase in reimbursements from third party (private insurance companies, Minnesota Department of Health and Human Services, etc.) for services provided by the district special education staff;
2) An increase of $0.21 million in federal special education aids. Federal special education aids are based on actual expenditures eligible for federal aid, and
3) A reduction of $2.70 million in state special education aid based on updated expenditure estimates, current funding formula, statewide adjustment (proration) factor and growth factor estimate.
Expenditure – The updated expenditure budget estimate for the special education account is $63.88 million. This is $$0.35 million, or 0.54 percent, more than the preliminary budget estimate. Almost half, or $164,008, of the increase is due to adjustments made to the salary and employee benefits budgets to reflect actual employees’ choice of insurance coverage and the district’s contributions toward employees’ health insurance premium and tax‐sheltered annuities match per School Board approved employment contracts. The net result of the changes describe above is that budgeted expenditures in the special education account exceed budgeted revenues by $27.50 million. This is $2.33 million more than the preliminary estimate of $25.17 million deficit spending.
2015‐16 Final Budget Independent School District No. 196
20
General Fund
Quality Compensation Account
2012‐13 2013‐14 2014‐15 2015‐16 2015‐16
Actual Actual Actual Prelim Budget Final Budget
Revenues
State Sources 5,020,852 5,084,095 4,599,842 5,022,941 5,496,440
Property Taxes 2,185,723 2,071,319 1,994,804 2,151,799 2,151,799
Federal Sources ‐ ‐ ‐ ‐ ‐
Other ‐ ‐ ‐ ‐ ‐
Total revenue 7,206,575 7,155,414 6,594,646 7,174,740 7,648,239
Expenditures
Salaries and wages 5,790,567 5,831,920 6,064,815 6,194,559 6,155,650
Employee benefits 1,175,770 1,242,858 1,246,812 1,350,227 1,348,984
Purchased services 50,454 46,831 60,713 31,300 27,200
Supplies and materials 11,795 13,474 12,354 3,100 3,100
Capital expenditures 12,588 ‐ 400 400
Other expenditures 938 235 ‐ 300 300
Debt service ‐ ‐ ‐ ‐ ‐
Total expenditures 7,042,112 7,135,318 7,384,694 7,579,886 7,535,634
Revenue over expenditures 164,463 20,095 (790,048) (405,146) 112,605
Other financing sources (uses)
Capital lease ‐ ‐ ‐ ‐ ‐
Certificates of participation ‐ ‐ ‐ ‐ ‐
Other Sources ‐ ‐ ‐ ‐ ‐
Transfers in ‐ ‐ ‐ ‐ ‐
Transfers (out) ‐ ‐ ‐ ‐ ‐
Total other financing sources (uses ‐ ‐ ‐ ‐ ‐
Net change in fund balances 164,463 20,095 (790,048) (405,146) 112,605
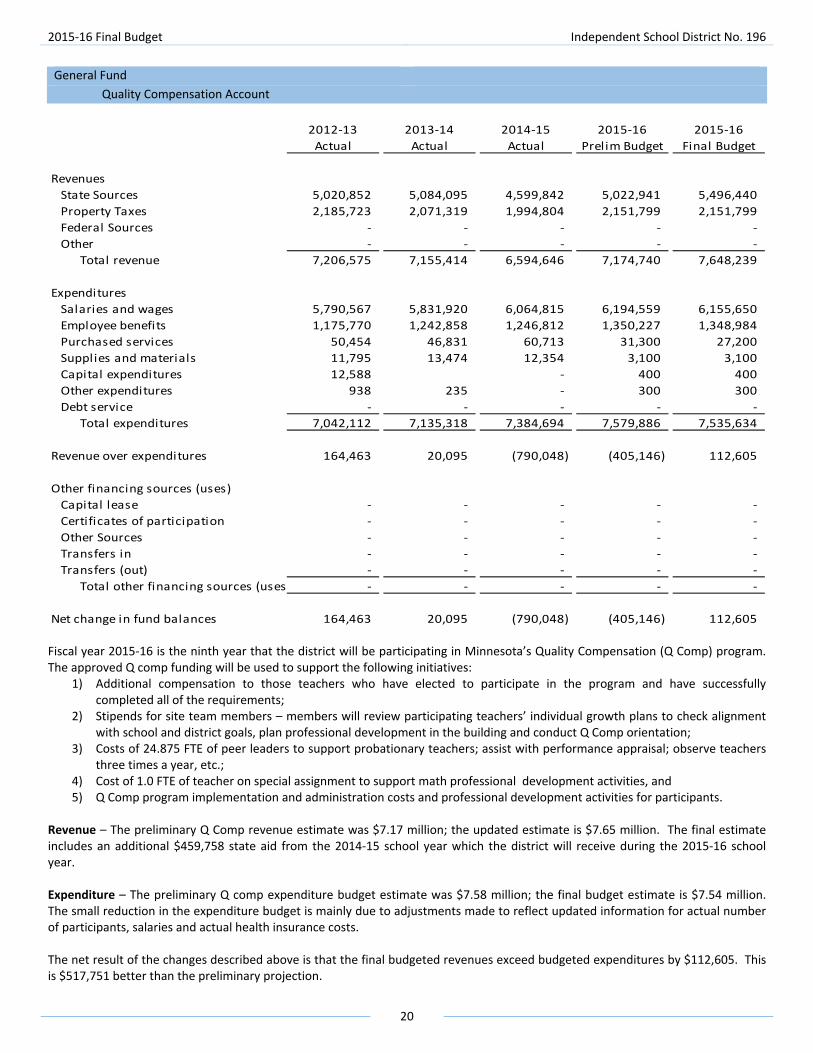
Fiscal year 2015‐16 is the ninth year that the district will be participating in Minnesota’s Quality Compensation (Q Comp) program. The approved Q comp funding will be used to support the following initiatives:
1) Additional compensation to those teachers who have elected to participate in the program and have successfully completed all of the requirements;
2) Stipends for site team members – members will review participating teachers’ individual growth plans to check alignment with school and district goals, plan professional development in the building and conduct Q Comp orientation;
3) Costs of 24.875 FTE of peer leaders to support probationary teachers; assist with performance appraisal; observe teachers three times a year, etc.;
4) Cost of 1.0 FTE of teacher on special assignment to support math professional development activities, and 5) Q Comp program implementation and administration costs and professional development activities for participants.
Revenue – The preliminary Q Comp revenue estimate was $7.17 million; the updated estimate is $7.65 million. The final estimate includes an additional $459,758 state aid from the 2014‐15 school year which the district will receive during the 2015‐16 school year. Expenditure – The preliminary Q comp expenditure budget estimate was $7.58 million; the final budget estimate is $7.54 million. The small reduction in the expenditure budget is mainly due to adjustments made to reflect updated information for actual number of participants, salaries and actual health insurance costs. The net result of the changes described above is that the final budgeted revenues exceed budgeted expenditures by $112,605. This is $517,751 better than the preliminary projection.
2015‐16 Final Budget Independent School District No. 196
21
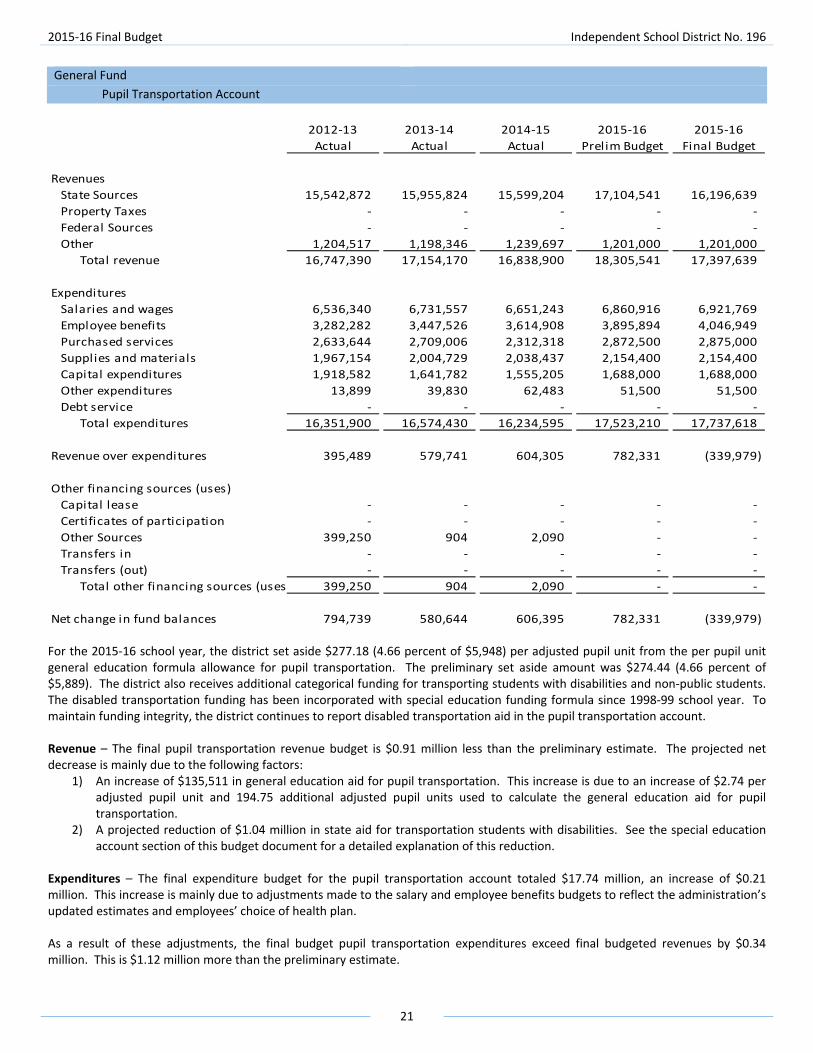
General Fund
Pupil Transportation Account
2012‐13 2013‐14 2014‐15 2015‐16 2015‐16
Actual Actual Actual Prelim Budget Final Budget
Revenues
State Sources 15,542,872 15,955,824 15,599,204 17,104,541 16,196,639
Property Taxes ‐ ‐ ‐ ‐ ‐
Federal Sources ‐ ‐ ‐ ‐ ‐
Other 1,204,517 1,198,346 1,239,697 1,201,000 1,201,000
Total revenue 16,747,390 17,154,170 16,838,900 18,305,541 17,397,639
Expenditures
Salaries and wages 6,536,340 6,731,557 6,651,243 6,860,916 6,921,769
Employee benefits 3,282,282 3,447,526 3,614,908 3,895,894 4,046,949
Purchased services 2,633,644 2,709,006 2,312,318 2,872,500 2,875,000
Supplies and materials 1,967,154 2,004,729 2,038,437 2,154,400 2,154,400
Capital expenditures 1,918,582 1,641,782 1,555,205 1,688,000 1,688,000
Other expenditures 13,899 39,830 62,483 51,500 51,500
Debt service ‐ ‐ ‐ ‐ ‐
Total expenditures 16,351,900 16,574,430 16,234,595 17,523,210 17,737,618
Revenue over expenditures 395,489 579,741 604,305 782,331 (339,979)
Other financing sources (uses)
Capital lease ‐ ‐ ‐ ‐ ‐
Certificates of participation ‐ ‐ ‐ ‐ ‐
Other Sources 399,250 904 2,090 ‐ ‐
Transfers in ‐ ‐ ‐ ‐ ‐
Transfers (out) ‐ ‐ ‐ ‐ ‐
Total other financing sources (uses 399,250 904 2,090 ‐ ‐
Net change in fund balances 794,739 580,644 606,395 782,331 (339,979)
For the 2015‐16 school year, the district set aside $277.18 (4.66 percent of $5,948) per adjusted pupil unit from the per pupil unit general education formula allowance for pupil transportation. The preliminary set aside amount was $274.44 (4.66 percent of $5,889). The district also receives additional categorical funding for transporting students with disabilities and non‐public students. The disabled transportation funding has been incorporated with special education funding formula since 1998‐99 school year. To maintain funding integrity, the district continues to report disabled transportation aid in the pupil transportation account. Revenue – The final pupil transportation revenue budget is $0.91 million less than the preliminary estimate. The projected net decrease is mainly due to the following factors:
1) An increase of $135,511 in general education aid for pupil transportation. This increase is due to an increase of $2.74 per adjusted pupil unit and 194.75 additional adjusted pupil units used to calculate the general education aid for pupil transportation.
2) A projected reduction of $1.04 million in state aid for transportation students with disabilities. See the special education account section of this budget document for a detailed explanation of this reduction.
Expenditures – The final expenditure budget for the pupil transportation account totaled $17.74 million, an increase of $0.21 million. This increase is mainly due to adjustments made to the salary and employee benefits budgets to reflect the administration’s updated estimates and employees’ choice of health plan. As a result of these adjustments, the final budget pupil transportation expenditures exceed final budgeted revenues by $0.34 million. This is $1.12 million more than the preliminary estimate.
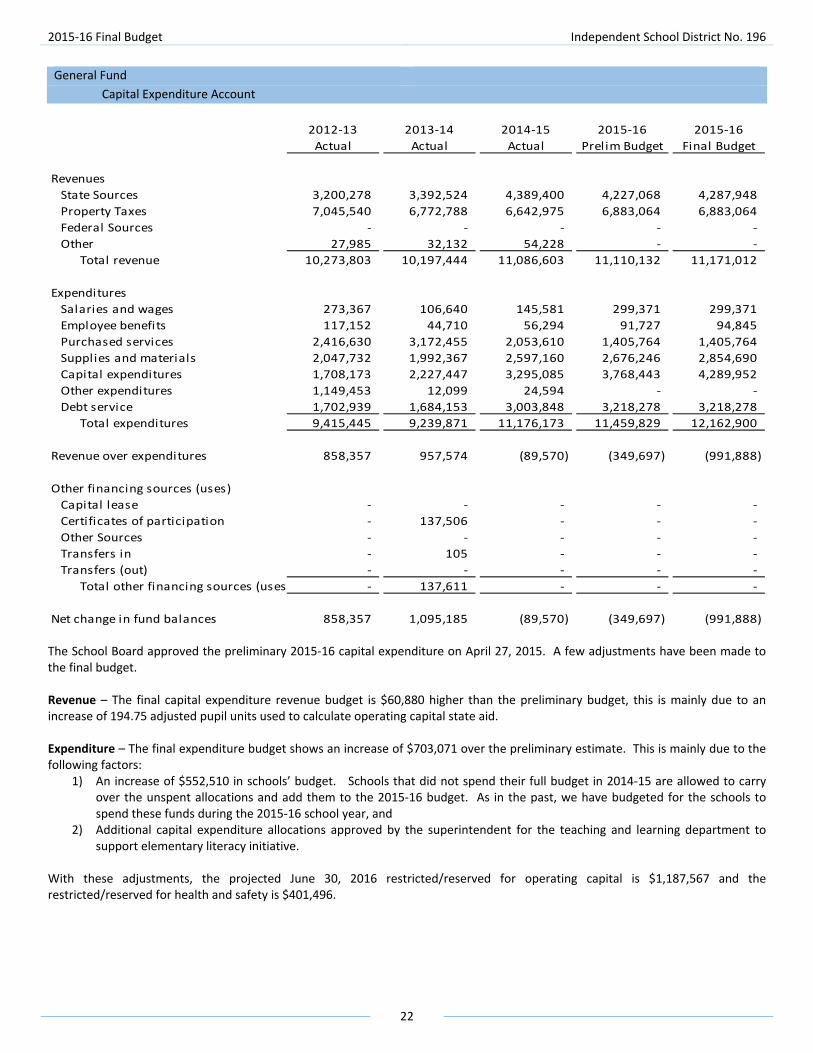
2015‐16 Final Budget Independent School District No. 196
22
General Fund
Capital Expenditure Account
2012‐13 2013‐14 2014‐15 2015‐16 2015‐16
Actual Actual Actual Prelim Budget Final Budget
Revenues
State Sources 3,200,278 3,392,524 4,389,400 4,227,068 4,287,948
Property Taxes 7,045,540 6,772,788 6,642,975 6,883,064 6,883,064
Federal Sources ‐ ‐ ‐ ‐ ‐
Other 27,985 32,132 54,228 ‐ ‐
Total revenue 10,273,803 10,197,444 11,086,603 11,110,132 11,171,012
Expenditures
Salaries and wages 273,367 106,640 145,581 299,371 299,371
Employee benefits 117,152 44,710 56,294 91,727 94,845
Purchased services 2,416,630 3,172,455 2,053,610 1,405,764 1,405,764
Supplies and materials 2,047,732 1,992,367 2,597,160 2,676,246 2,854,690
Capital expenditures 1,708,173 2,227,447 3,295,085 3,768,443 4,289,952
Other expenditures 1,149,453 12,099 24,594 ‐ ‐
Debt service 1,702,939 1,684,153 3,003,848 3,218,278 3,218,278
Total expenditures 9,415,445 9,239,871 11,176,173 11,459,829 12,162,900
Revenue over expenditures 858,357 957,574 (89,570) (349,697) (991,888)
Other financing sources (uses)
Capital lease ‐ ‐ ‐ ‐ ‐
Certificates of participation ‐ 137,506 ‐ ‐ ‐
Other Sources ‐ ‐ ‐ ‐ ‐
Transfers in ‐ 105 ‐ ‐ ‐
Transfers (out) ‐ ‐ ‐ ‐ ‐
Total other financing sources (uses ‐ 137,611 ‐ ‐ ‐
Net change in fund balances 858,357 1,095,185 (89,570) (349,697) (991,888)
The School Board approved the preliminary 2015‐16 capital expenditure on April 27, 2015. A few adjustments have been made to the final budget. Revenue – The final capital expenditure revenue budget is $60,880 higher than the preliminary budget, this is mainly due to an increase of 194.75 adjusted pupil units used to calculate operating capital state aid. Expenditure – The final expenditure budget shows an increase of $703,071 over the preliminary estimate. This is mainly due to the following factors:
1) An increase of $552,510 in schools’ budget. Schools that did not spend their full budget in 2014‐15 are allowed to carry over the unspent allocations and add them to the 2015‐16 budget. As in the past, we have budgeted for the schools to spend these funds during the 2015‐16 school year, and
2) Additional capital expenditure allocations approved by the superintendent for the teaching and learning department to support elementary literacy initiative.
With these adjustments, the projected June 30, 2016 restricted/reserved for operating capital is $1,187,567 and the restricted/reserved for health and safety is $401,496.

2015‐16 Final Budget Independent School District No. 196
23
Food Service Fund
Special Revenue Fund
2012‐13 2013‐14 2014‐15 2015‐16 2015‐16
Actual Actual Actual Prelim Budget Final Budget
Revenues
Other 6,548,851 6,521,967 6,381,914 6,499,412 6,502,968
Federal sources 3,984,706 4,215,285 4,406,814 4,815,255 4,974,593
State Sources 398,037 405,390 581,450 496,620 634,724
Total revenue 10,931,595 11,142,642 11,370,177 11,811,287 12,112,285
Expenditures
Salaries and wages 3,952,881 4,041,569 4,104,946 4,168,923 3,994,438
Employee benefits 1,098,092 1,228,400 1,260,302 1,448,492 1,348,469
Purchased services 436,610 450,249 555,959 579,104 603,783
Supplies and materials 5,206,884 5,520,898 5,577,771 5,607,736 5,896,092
Capital expenditures 150,934 153,687 278,059 680,000 600,000
Other expenditures 13,387 12,240 10,985 14,500 14,500
Total expenditures 10,858,789 11,407,043 11,788,021 12,498,755 12,457,282
Revenue over expenditures 72,806 (264,402) (417,844) (687,468) (344,997)
Other financing sources (uses)
Other Sources ‐ 2,154 ‐ ‐ ‐
Net change in fund balances 72,806 (262,248) (417,844) (687,468) (344,997)
Fund balances
Beginning of year 2,565,805 2,638,611 2,376,363 1,958,519 1,958,519
End of year 2,638,611 2,376,363 1,958,519 1,271,051 1,613,522
Fund Overview – The food service special revenue fund is used to account for all financial activities of the district’s food and nutrition program. The food service special revenue fund is self‐sustaining. All costs of the food and nutrition programs are covered by receipts from sales to students and adults, and reimbursements from federal and state governments. The last increase in school lunch prices was in 2013‐14 school year. Those prices remained the same for the 2014‐15 school year. In May 2015, the School Board approved $0.10 school lunch price increase for the 2015‐16 school year. Elementary lunches are priced at $2.40 per lunch, middle school students will pay $2.45 per lunch, the per lunch price for high school students is $2.55 and adult lunches are priced at $3.60. Prices for breakfast will remain at the 2013‐14 level. Elementary breakfast is priced at $1.45, middle school students will pay $1.50 per breakfast, the per breakfast price for high school students is $1.50 and adult breakfast is $1.95. Revenue – The final food service revenue projection is $300,998 more that our preliminary estimate. The projected increase is chiefly due to projected increase of $297,442 in federal and state aids. This increase is mainly due to federal and state reimbursement rates increases for the 2015‐16 school year, and projected increase in USDA commodities. The district is required to report the value of the USDA commodities received as revenue and as expenditure when they are used for meal preparation. Expenditure – The revised food service expenditure budget is $41,473 less than the preliminary estimate. This decrease is mainly due to a combination of the following factors:
1) The final budget estimate for salary and employee benefits budgets is $274,508 less than the preliminary estimate. The adjustments are made to reflect updated salary estimate for cafeteria workers, corresponding statutory benefits (FICA, PERA and workers’ compensation premium). Budgets for tax‐sheltered annuities match and health insurance premium have also been adjusted to reflect employees’ plan selection;
2) An increase of $313,035 in the budgets for purchased services and supplies and materials. A majority of this increase is in the budget for food to reflected high food cost and additional costs as a result of increased usage of fresh fruit and produce, and
3) A decrease of $80,000 in the budget for cafeteria/kitchen improvement. As a result of these adjustments, food service fund expenditures are projected to exceed revenues by $344,997. We anticipate that the June 30, 2016 food service fund balance will be $1.61 million.

2015‐16 Final Budget Independent School District No. 196
24
Community Service Fund
Special Revenue Fund
2012‐13 2013‐14 2014‐15 2015‐16 2015‐16
Actual Actual Actual Prel im Budget Fina l Budget
Revenues
Other 5,518,844 5,840,424 3,484,755 3,361,871 3,467,514
State sources 2,159,955 3,036,599 2,465,568 2,520,335 2,833,655
Property taxes 1,661,685 856,143 1,683,323 1,656,886 1,671,169
Federa l sources 126,816 96,715 95,578 53,910 52,227
Tota l revenue 9,467,301 9,829,881 7,729,224 7,593,002 8,024,565
Expenditures
Sa laries and wages 4,713,690 4,704,016 4,717,303 4,828,309 4,862,198
Employee benefi ts 1,467,645 1,385,962 1,413,606 1,489,208 1,517,906
Purchased services 3,111,452 3,260,104 1,063,367 1,098,927 1,128,054
Suppl ies and materia ls 384,979 379,202 378,107 412,693 426,356
Capita l expenditures 40,222 17,676 145,510 38,600 55,990
Other expenditures 3,792 4,898 3,687 5,305 5,281
Tota l expenditures 9,721,780 9,751,859 7,721,580 7,873,042 7,995,785
Revenue over expenditures (254,480) 78,022 7,644 (280,040) 28,780
Other financing sources (uses)
Transfers in 111,605 107,854 5,785 ‐ ‐
Net change in fund balances (142,875) 185,877 13,429 (280,040) 28,780
Fund balances
Beginning of year 1,344,624 1,201,749 1,387,626 1,401,055 1,401,055
End of year 1,201,749 1,387,626 1,401,055 1,121,015 1,429,835
Fund Overview – The community service fund is used to record all financial activities of the community service program. The community service fund is comprised of five components, each with its own fund balance. The five components are: 1) Community Education – general, 2) Community Education – early childhood screen and aids to non‐public students, 3) Early Childhood Family Education, 4) School Readiness, and 5) Adult Basic Education. Revenue – Several adjustments were made to the revenue budget that resulted in a net increase of $431,563 when compared to the preliminary estimate. This net increase is mainly due to the following factors:
1) An increase of $284,169 in state aid to support school readiness programs. The increase is due to additional funding provided by the 2015 Legislature during its First Special Session held in June 2015.
2) An increase of $49,226 in state aid for early childhood family education programs. This increase was also provided by the 2015 Legislature during its First Special Session held in June 2015.
3) A net increase of $105,643 in the budgets for miscellaneous fees, tuition, gifts and bequests, facility rental, etc.
Expenditure – The revised expenditure budget is $122,743 more than the original estimate. Many adjustments were made to expenditure items to reflect the district’s latest estimates. The major adjustments are summarized below.
1) The budgets for salary and employee benefits show a net increase of $62,287 to reflect updated estimates for staffing needs to support program offerings and employees’ choice of health plan.
2) The budgets for purchased services and supplies and materials show a net increase of $42,790. A majority of the increase is in the budgets for transportation chargebacks and instructional supplies to support the program offerings planned for the school year.
3) The revised budget estimates for capital expenditure increased by $17,390, mainly for office furniture and equipment such as stand‐up work stations and computers.
As a result of these budget adjustments, the updated 2015‐16 revenues for the community service fund are projected to exceed expenditures by $28,780. The projected fund balance on June 30, 2016 is $1.43 million. Of this amount, $374,804 is restricted/reserved for Adult Basic Education, $407,424 is restricted/reserved for Early Childhood Family Education, $84,425 is restricted/reserved for School Readiness and $2,927 for early childhood screening and non‐public pupils. The remaining $563,254 is restricted/reserved for general community education which includes after‐school youth enrichment and youth development programs, disabled adults programs, and adult and youth enrichment programs.
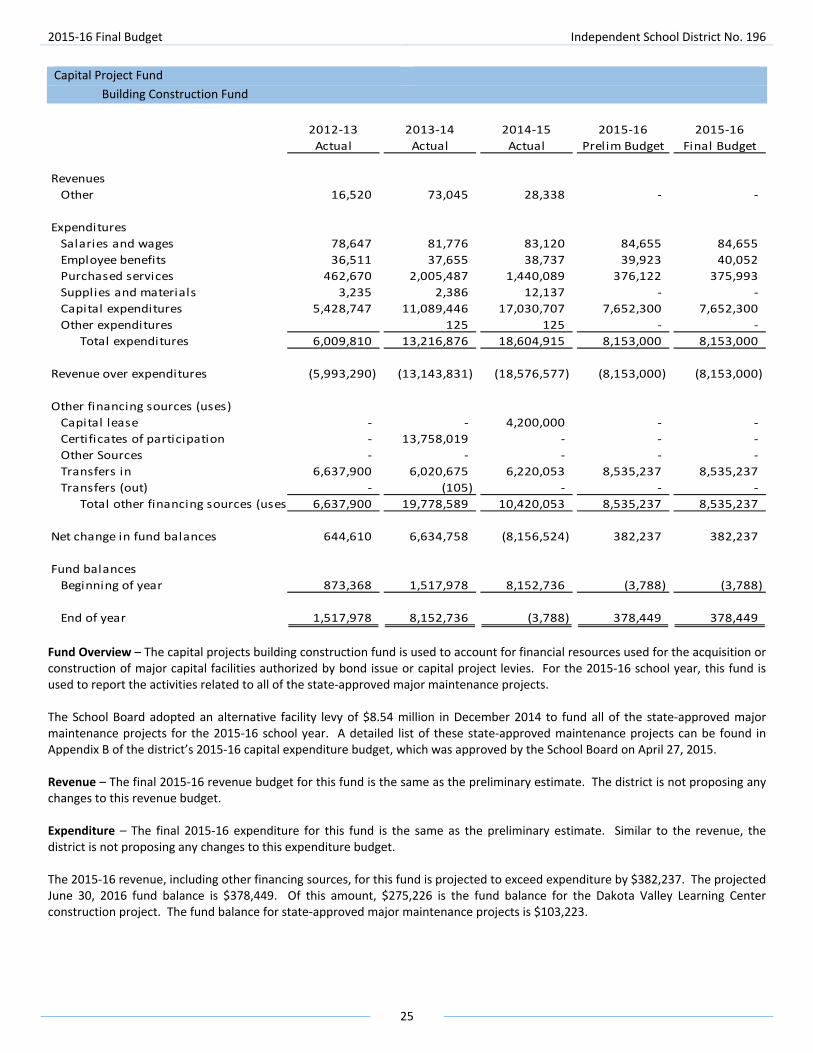
2015‐16 Final Budget Independent School District No. 196
25
Capital Project Fund
Building Construction Fund
2012‐13 2013‐14 2014‐15 2015‐16 2015‐16
Actual Actual Actual Prelim Budget Final Budget
Revenues
Other 16,520 73,045 28,338 ‐ ‐
Expenditures
Salaries and wages 78,647 81,776 83,120 84,655 84,655
Employee benefits 36,511 37,655 38,737 39,923 40,052
Purchased services 462,670 2,005,487 1,440,089 376,122 375,993
Supplies and materials 3,235 2,386 12,137 ‐ ‐
Capital expenditures 5,428,747 11,089,446 17,030,707 7,652,300 7,652,300
Other expenditures 125 125 ‐ ‐
Total expenditures 6,009,810 13,216,876 18,604,915 8,153,000 8,153,000
Revenue over expenditures (5,993,290) (13,143,831) (18,576,577) (8,153,000) (8,153,000)
Other financing sources (uses)
Capital lease ‐ ‐ 4,200,000 ‐ ‐
Certificates of participation ‐ 13,758,019 ‐ ‐ ‐
Other Sources ‐ ‐ ‐ ‐ ‐
Transfers in 6,637,900 6,020,675 6,220,053 8,535,237 8,535,237
Transfers (out) ‐ (105) ‐ ‐ ‐
Total other financing sources (uses 6,637,900 19,778,589 10,420,053 8,535,237 8,535,237
Net change in fund balances 644,610 6,634,758 (8,156,524) 382,237 382,237
Fund balances
Beginning of year 873,368 1,517,978 8,152,736 (3,788) (3,788)
End of year 1,517,978 8,152,736 (3,788) 378,449 378,449
Fund Overview – The capital projects building construction fund is used to account for financial resources used for the acquisition or construction of major capital facilities authorized by bond issue or capital project levies. For the 2015‐16 school year, this fund is used to report the activities related to all of the state‐approved major maintenance projects. The School Board adopted an alternative facility levy of $8.54 million in December 2014 to fund all of the state‐approved major maintenance projects for the 2015‐16 school year. A detailed list of these state‐approved maintenance projects can be found in Appendix B of the district’s 2015‐16 capital expenditure budget, which was approved by the School Board on April 27, 2015. Revenue – The final 2015‐16 revenue budget for this fund is the same as the preliminary estimate. The district is not proposing any changes to this revenue budget. Expenditure – The final 2015‐16 expenditure for this fund is the same as the preliminary estimate. Similar to the revenue, the district is not proposing any changes to this expenditure budget. The 2015‐16 revenue, including other financing sources, for this fund is projected to exceed expenditure by $382,237. The projected June 30, 2016 fund balance is $378,449. Of this amount, $275,226 is the fund balance for the Dakota Valley Learning Center construction project. The fund balance for state‐approved major maintenance projects is $103,223.
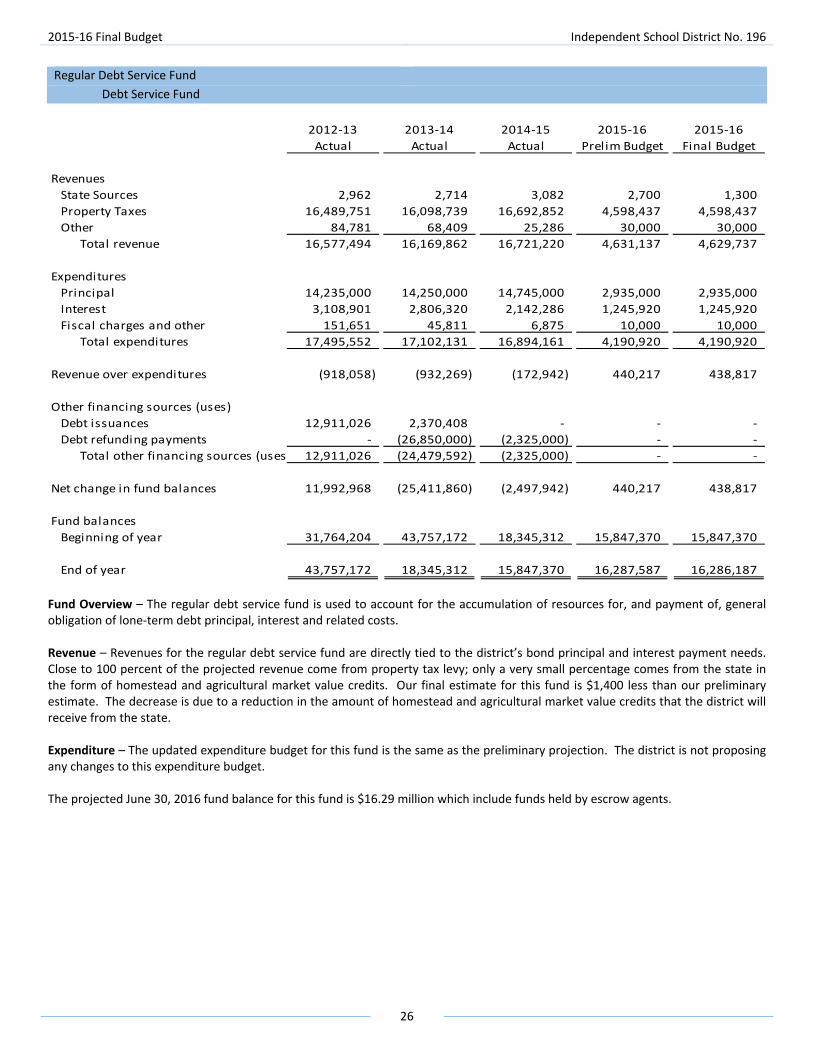
2015‐16 Final Budget Independent School District No. 196
26
Regular Debt Service Fund
Debt Service Fund
2012‐13 2013‐14 2014‐15 2015‐16 2015‐16
Actual Actual Actual Prelim Budget Final Budget
Revenues
State Sources 2,962 2,714 3,082 2,700 1,300
Property Taxes 16,489,751 16,098,739 16,692,852 4,598,437 4,598,437
Other 84,781 68,409 25,286 30,000 30,000
Total revenue 16,577,494 16,169,862 16,721,220 4,631,137 4,629,737
Expenditures
Principal 14,235,000 14,250,000 14,745,000 2,935,000 2,935,000
Interest 3,108,901 2,806,320 2,142,286 1,245,920 1,245,920
Fiscal charges and other 151,651 45,811 6,875 10,000 10,000
Total expenditures 17,495,552 17,102,131 16,894,161 4,190,920 4,190,920
Revenue over expenditures (918,058) (932,269) (172,942) 440,217 438,817
Other financing sources (uses)
Debt issuances 12,911,026 2,370,408 ‐ ‐ ‐
Debt refunding payments ‐ (26,850,000) (2,325,000) ‐ ‐
Total other financing sources (uses 12,911,026 (24,479,592) (2,325,000) ‐ ‐
Net change in fund balances 11,992,968 (25,411,860) (2,497,942) 440,217 438,817
Fund balances
Beginning of year 31,764,204 43,757,172 18,345,312 15,847,370 15,847,370
End of year 43,757,172 18,345,312 15,847,370 16,287,587 16,286,187
Fund Overview – The regular debt service fund is used to account for the accumulation of resources for, and payment of, general obligation of lone‐term debt principal, interest and related costs. Revenue – Revenues for the regular debt service fund are directly tied to the district’s bond principal and interest payment needs. Close to 100 percent of the projected revenue come from property tax levy; only a very small percentage comes from the state in the form of homestead and agricultural market value credits. Our final estimate for this fund is $1,400 less than our preliminary estimate. The decrease is due to a reduction in the amount of homestead and agricultural market value credits that the district will receive from the state. Expenditure – The updated expenditure budget for this fund is the same as the preliminary projection. The district is not proposing any changes to this expenditure budget. The projected June 30, 2016 fund balance for this fund is $16.29 million which include funds held by escrow agents.
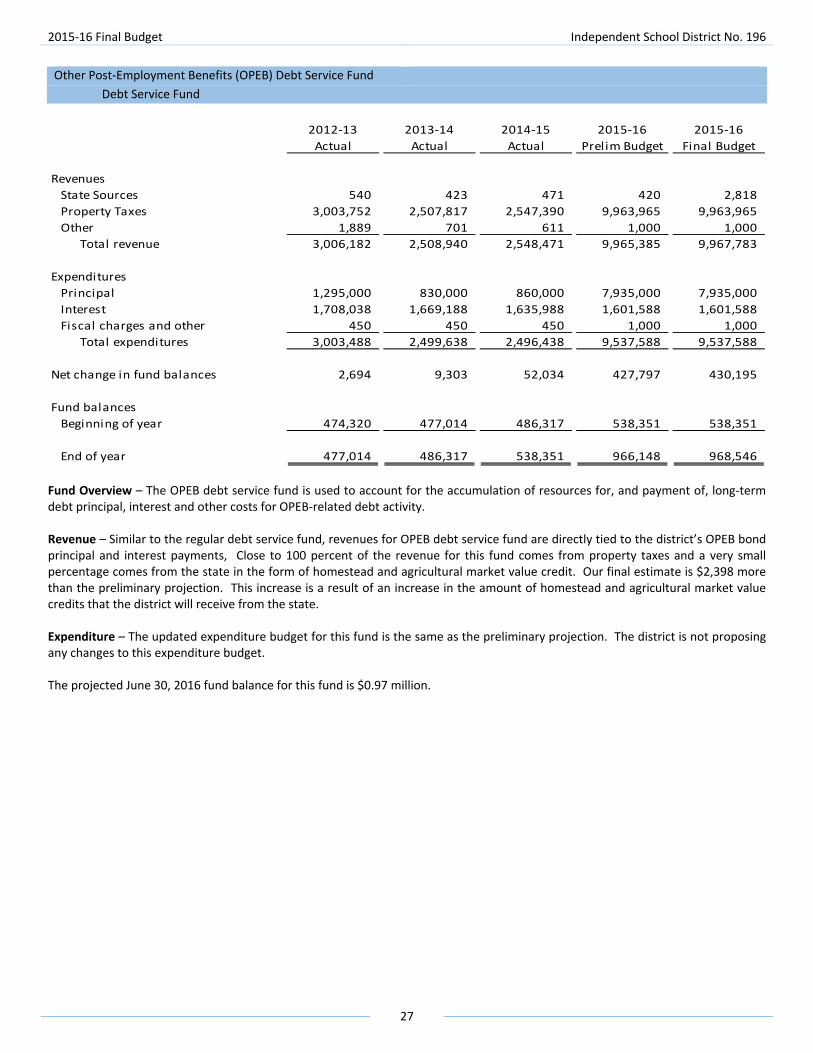
2015‐16 Final Budget Independent School District No. 196
27
Other Post‐Employment Benefits (OPEB) Debt Service Fund
Debt Service Fund
2012‐13 2013‐14 2014‐15 2015‐16 2015‐16
Actual Actual Actual Prelim Budget Final Budget
Revenues
State Sources 540 423 471 420 2,818
Property Taxes 3,003,752 2,507,817 2,547,390 9,963,965 9,963,965
Other 1,889 701 611 1,000 1,000
Total revenue 3,006,182 2,508,940 2,548,471 9,965,385 9,967,783
Expenditures
Principal 1,295,000 830,000 860,000 7,935,000 7,935,000
Interest 1,708,038 1,669,188 1,635,988 1,601,588 1,601,588
Fiscal charges and other 450 450 450 1,000 1,000
Total expenditures 3,003,488 2,499,638 2,496,438 9,537,588 9,537,588
Net change in fund balances 2,694 9,303 52,034 427,797 430,195
Fund balances
Beginning of year 474,320 477,014 486,317 538,351 538,351
End of year 477,014 486,317 538,351 966,148 968,546
Fund Overview – The OPEB debt service fund is used to account for the accumulation of resources for, and payment of, long‐term debt principal, interest and other costs for OPEB‐related debt activity. Revenue – Similar to the regular debt service fund, revenues for OPEB debt service fund are directly tied to the district’s OPEB bond principal and interest payments, Close to 100 percent of the revenue for this fund comes from property taxes and a very small percentage comes from the state in the form of homestead and agricultural market value credit. Our final estimate is $2,398 more than the preliminary projection. This increase is a result of an increase in the amount of homestead and agricultural market value credits that the district will receive from the state. Expenditure – The updated expenditure budget for this fund is the same as the preliminary projection. The district is not proposing any changes to this expenditure budget. The projected June 30, 2016 fund balance for this fund is $0.97 million.

2015‐16 Final Budget Independent School District No. 196
28
Internal Service Funds
Proprietary Funds
2012‐13 2013‐14 2014‐15 2015‐16 2015‐16
Actual Actual Actual Prelim Budget Final Budget
Revenues
Other
GASB #16 717,424 988,038 1,477,202 475,000 475,000
OPEB Revocable Trust 6,131,959 8,741,750 2,121,068 1,730,000 1,730,000
Self‐Insured Dental Plan 331,921 283,743 293,560 310,000 310,000
Self‐Insured Health Plan 36,788,832 40,847,947 42,131,820 43,120,000 43,120,000
Total revenue 43,970,136 50,861,477 46,023,650 45,635,000 45,635,000
Expenditures
Salaries and wages
GASB #16 1,478,662 951,132 711,440 450,000 450,000
Employee Benefits
OPEB Revocable Trust 5,505,012 5,462,592 5,688,650 880,000 880,000
Self‐Insured Dental Plan 278,842 313,130 326,845 325,000 325,000
Self‐Insured Health Plan 32,968,260 36,241,201 41,746,751 39,360,000 39,360,000
Total expenditures 40,230,775 42,968,054 48,473,686 41,015,000 41,015,000
Revenue over expenditures 3,739,361 7,893,423 (2,450,036) 4,620,000 4,620,000
Other financing sources (uses)
Transfers in
Self‐Insured Health Plan 706,518 ‐ ‐ ‐ ‐
Net change in fund balances 4,445,879 7,893,423 (2,450,036) 4,620,000 4,620,000
Fund balances
Beginning of year 25,661,620 30,107,499 38,000,922 35,550,886 35,550,886
End of year 30,107,499 38,000,922 35,550,886 40,170,886 40,170,886
Fund Overview – An internal service fund is used to account for the financing of goods or services by one department to another within the school district or to other governmental units on a cost‐reimbursement basis. School districts are not required to use internal service funds. The most common use of an internal service fund by school district is for self‐insurance programs. The district maintains four internal service funds to report activities related to other post‐employment benefits, severance, self‐insured health and self‐insured dental. The schedule shows the actual and projected fund balances for the district’s four internal service funds.
2012‐13 2013‐14 2014‐15 2015‐16 2015‐16
Actual Actual Actual Prelim Budget Final Budget
Fund balance
GASB #16 (4,058,835) (4,021,929) (3,256,167) (3,231,167) (3,231,167)
OPEB Revocable Trust 29,530,308 32,809,467 29,241,883 30,091,883 30,091,883
Self‐Insured Dental Plan 108,935 79,548 46,263 31,263 31,263
Self‐Insured Health Plan 4,527,091 9,133,836 9,518,907 13,278,907 13,278,907
Total Fund Balance 30,107,499 38,000,922 35,550,886 40,170,886 40,170,886
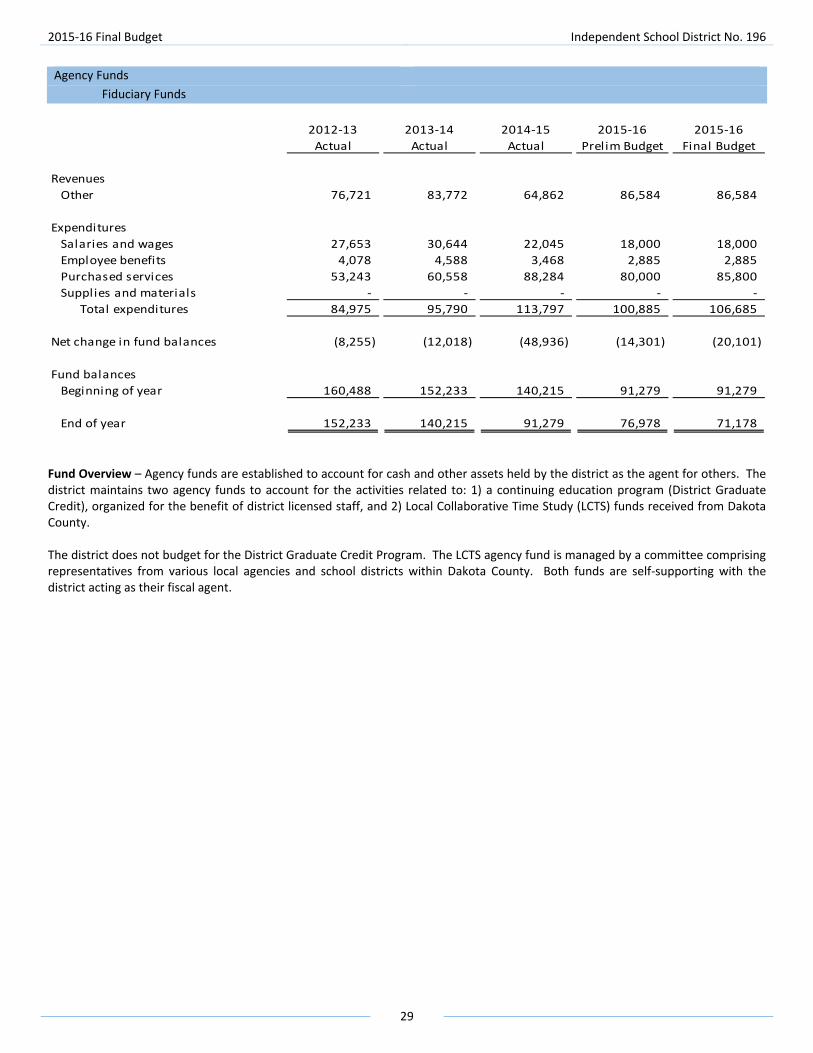
2015‐16 Final Budget Independent School District No. 196
29
Agency Funds
Fiduciary Funds
2012‐13 2013‐14 2014‐15 2015‐16 2015‐16
Actual Actual Actual Prelim Budget Final Budget
Revenues
Other 76,721 83,772 64,862 86,584 86,584
Expenditures
Salaries and wages 27,653 30,644 22,045 18,000 18,000
Employee benefits 4,078 4,588 3,468 2,885 2,885
Purchased services 53,243 60,558 88,284 80,000 85,800
Supplies and materials ‐ ‐ ‐ ‐ ‐
Total expenditures 84,975 95,790 113,797 100,885 106,685
Net change in fund balances (8,255) (12,018) (48,936) (14,301) (20,101)
Fund balances
Beginning of year 160,488 152,233 140,215 91,279 91,279
End of year 152,233 140,215 91,279 76,978 71,178
Fund Overview – Agency funds are established to account for cash and other assets held by the district as the agent for others. The district maintains two agency funds to account for the activities related to: 1) a continuing education program (District Graduate Credit), organized for the benefit of district licensed staff, and 2) Local Collaborative Time Study (LCTS) funds received from Dakota County. The district does not budget for the District Graduate Credit Program. The LCTS agency fund is managed by a committee comprising representatives from various local agencies and school districts within Dakota County. Both funds are self‐supporting with the district acting as their fiscal agent.
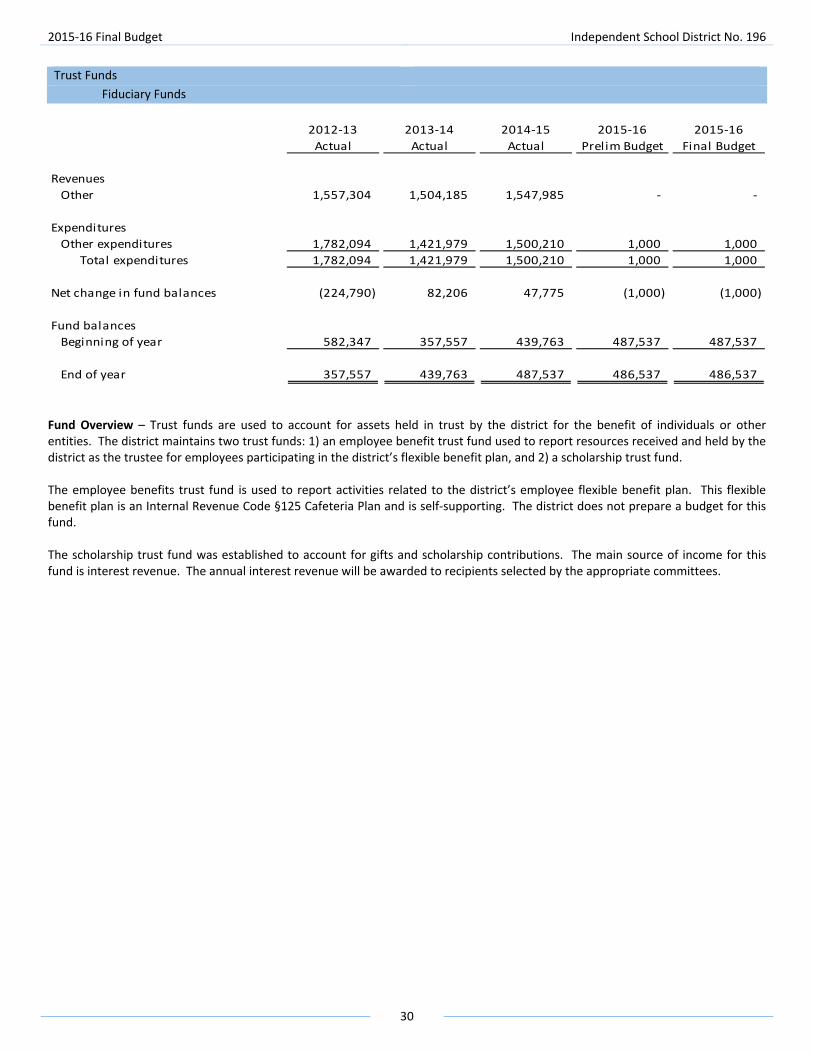
2015‐16 Final Budget Independent School District No. 196
30
Trust Funds
Fiduciary Funds
2012‐13 2013‐14 2014‐15 2015‐16 2015‐16
Actual Actual Actual Prelim Budget Final Budget
Revenues
Other 1,557,304 1,504,185 1,547,985 ‐ ‐
Expenditures
Other expenditures 1,782,094 1,421,979 1,500,210 1,000 1,000
Total expenditures 1,782,094 1,421,979 1,500,210 1,000 1,000
Net change in fund balances (224,790) 82,206 47,775 (1,000) (1,000)
Fund balances
Beginning of year 582,347 357,557 439,763 487,537 487,537
End of year 357,557 439,763 487,537 486,537 486,537
Fund Overview – Trust funds are used to account for assets held in trust by the district for the benefit of individuals or other entities. The district maintains two trust funds: 1) an employee benefit trust fund used to report resources received and held by the district as the trustee for employees participating in the district’s flexible benefit plan, and 2) a scholarship trust fund. The employee benefits trust fund is used to report activities related to the district’s employee flexible benefit plan. This flexible benefit plan is an Internal Revenue Code §125 Cafeteria Plan and is self‐supporting. The district does not prepare a budget for this fund. The scholarship trust fund was established to account for gifts and scholarship contributions. The main source of income for this fund is interest revenue. The annual interest revenue will be awarded to recipients selected by the appropriate committees.


Informational Section


2015‐16 Final Budget Independent School District No. 196
31
Budget Calendar: Completion Date Persons Responsible Activities
September 18, 2015 Coordinator of Finance Notification to schools of carryovers/deficits and final budget timelines
September 18, 2015 Coordinator of Finance Notification to district office budget administrator of final budget timelines
October 1, 2015 Principals, Student Information Superrvisor, Directors of Elementary and Secondary Education
Verify schools’ actual October 1 enrollment
October 1‐5, 2015 Coordinator of Finance, Controller Update schools’ instructional and staffing allocations in MyBudgetFile to reflect actual October 1 enrollment
October 6, 2015 Coordinator of Finance, Controller MyBudgetFile available for final budget revisions
October 12‐16, 2015 Elementary Principals, Middle School Principals, High School Principals, Program Administrators/Coordinators
MyBudgetFile refresher and work sessions
October 19, 2015 Elementary Principals, District‐level Administrators, Middle School Principals, High School Principals
Complete and submit final budget for superintendent’s and/or directors’ review and approval
October 26, 2015 Superintendent’s Cabinet Review and approve budgets submitted by their direct reports; inform coordinator of finance when ready for processing
November 23, 2015 Director of Finance and Operations, Coordinator of Finance, Controller, Superintendent, Superintendent’s Cabinet
Prepare draft copy of final budget for review with superintendent and superintendent’s Cabinet
December 14, 2015 Audit/Finance Committee Review draft copy of the proposed final budget
December 14, 2015 Director of Finance and Operations, Coordinator of Finance
First presentation of the proposed final budget to the School Board
January 4, 2016 Director of Finance and Operations, Coordinator of Finance
Final presentation and approval of the proposed final budget to the School Board

2015‐16 Final Budget Independent School District No. 196
32
Enrollment by Year:
Center‐Based Annual
as of Early Specia l Increase
October 1, Chi ldhood Kindergarten Elementary Secondary Education Tota l (Decrease)
2006 419 1,834 11,650 13,318 819 28,040 ‐0.81%
2007 417 1,785 11,537 13,320 814 27,873 ‐0.60%
2008 445 1,879 11,484 13,035 840 27,683 ‐0.68%
2009 440 1,818 11,555 12,792 842 27,447 ‐0.85%
2010 406 1,891 11,531 12,786 840 27,454 0.03%
2011 427 1,902 11,608 12,649 817 27,403 ‐0.19%
2012 469 1,873 11,622 12,433 771 27,168 ‐0.86%
2013 475 1,782 11,781 12,430 734 27,202 0.13%
2014 509 1,920 11,910 12,302 771 27,412 0.77%
2015 505 1,910 12,065 12,498 813 27,791 1.38%
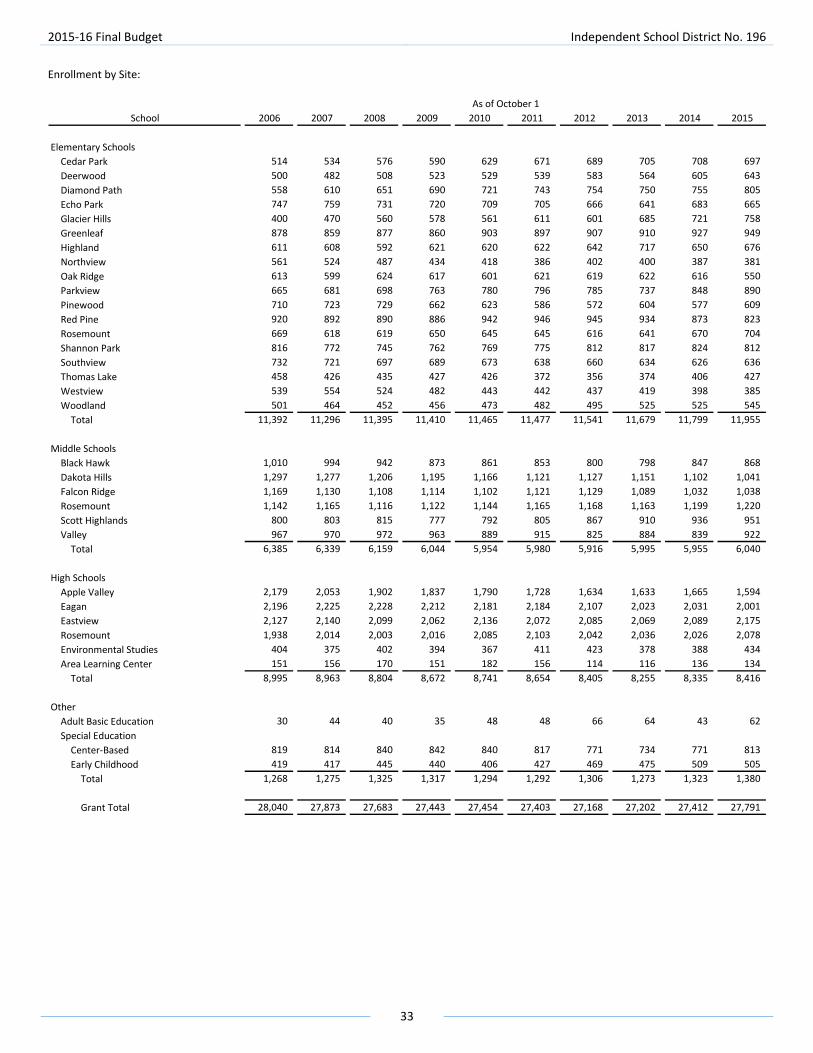
2015‐16 Final Budget Independent School District No. 196
33
Enrollment by Site:
School 2006 2007 2008 2009 2010 2011 2012 2013 2014 2015
Elementary Schools
Cedar Park 514 534 576 590 629 671 689 705 708 697
Deerwood 500 482 508 523 529 539 583 564 605 643
Diamond Path 558 610 651 690 721 743 754 750 755 805
Echo Park 747 759 731 720 709 705 666 641 683 665
Glacier Hills 400 470 560 578 561 611 601 685 721 758
Greenleaf 878 859 877 860 903 897 907 910 927 949
Highland 611 608 592 621 620 622 642 717 650 676
Northview 561 524 487 434 418 386 402 400 387 381
Oak Ridge 613 599 624 617 601 621 619 622 616 550
Parkview 665 681 698 763 780 796 785 737 848 890
Pinewood 710 723 729 662 623 586 572 604 577 609
Red Pine 920 892 890 886 942 946 945 934 873 823
Rosemount 669 618 619 650 645 645 616 641 670 704
Shannon Park 816 772 745 762 769 775 812 817 824 812
Southview 732 721 697 689 673 638 660 634 626 636
Thomas Lake 458 426 435 427 426 372 356 374 406 427
Westview 539 554 524 482 443 442 437 419 398 385
Woodland 501 464 452 456 473 482 495 525 525 545
Total 11,392 11,296 11,395 11,410 11,465 11,477 11,541 11,679 11,799 11,955
Middle Schools
Black Hawk 1,010 994 942 873 861 853 800 798 847 868
Dakota Hills 1,297 1,277 1,206 1,195 1,166 1,121 1,127 1,151 1,102 1,041
Falcon Ridge 1,169 1,130 1,108 1,114 1,102 1,121 1,129 1,089 1,032 1,038
Rosemount 1,142 1,165 1,116 1,122 1,144 1,165 1,168 1,163 1,199 1,220
Scott Highlands 800 803 815 777 792 805 867 910 936 951
Valley 967 970 972 963 889 915 825 884 839 922
Total 6,385 6,339 6,159 6,044 5,954 5,980 5,916 5,995 5,955 6,040
High Schools
Apple Valley 2,179 2,053 1,902 1,837 1,790 1,728 1,634 1,633 1,665 1,594
Eagan 2,196 2,225 2,228 2,212 2,181 2,184 2,107 2,023 2,031 2,001
Eastview 2,127 2,140 2,099 2,062 2,136 2,072 2,085 2,069 2,089 2,175
Rosemount 1,938 2,014 2,003 2,016 2,085 2,103 2,042 2,036 2,026 2,078
Environmental Studies 404 375 402 394 367 411 423 378 388 434
Area Learning Center 151 156 170 151 182 156 114 116 136 134
Total 8,995 8,963 8,804 8,672 8,741 8,654 8,405 8,255 8,335 8,416
Other
Adult Basic Education 30 44 40 35 48 48 66 64 43 62
Special Education
Center‐Based 819 814 840 842 840 817 771 734 771 813
Early Childhood 419 417 445 440 406 427 469 475 509 505
Total 1,268 1,275 1,325 1,317 1,294 1,292 1,306 1,273 1,323 1,380
Grant Total 28,040 27,873 27,683 27,443 27,454 27,403 27,168 27,202 27,412 27,791
As of October 1
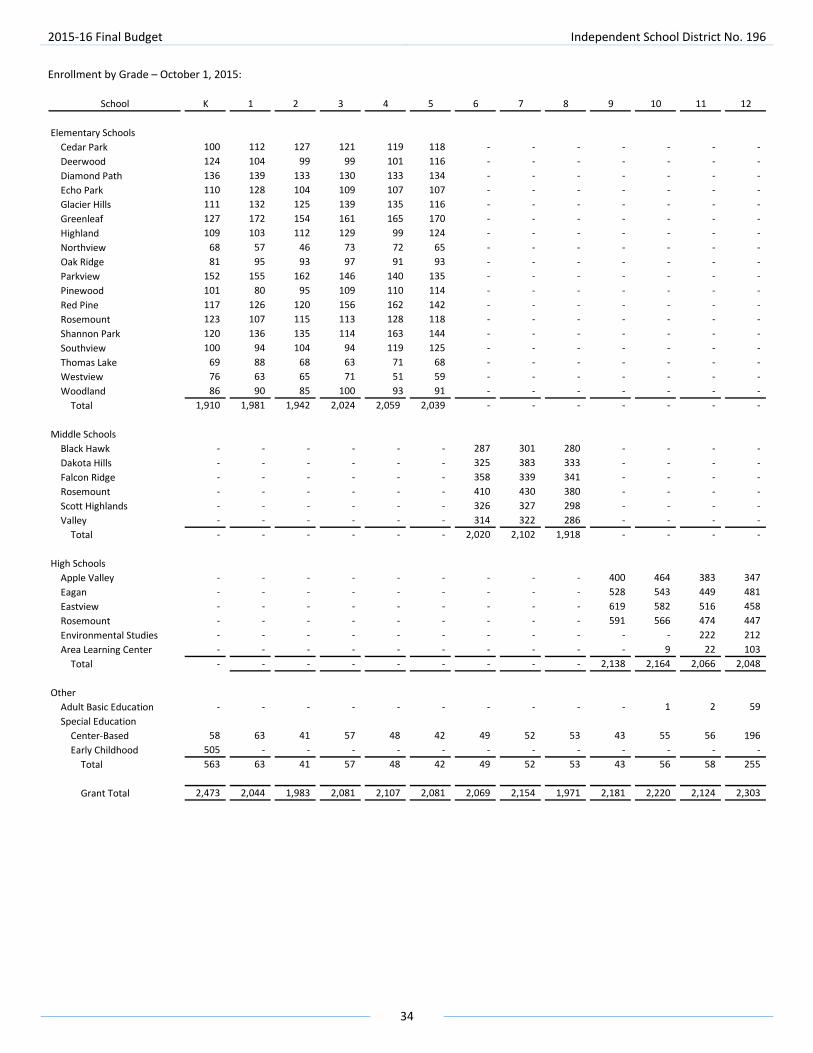
2015‐16 Final Budget Independent School District No. 196
34
Enrollment by Grade – October 1, 2015:
School K 1 2 3 4 5 6 7 8 9 10 11 12
Elementary Schools
Cedar Park 100 112 127 121 119 118 ‐ ‐ ‐ ‐ ‐ ‐ ‐
Deerwood 124 104 99 99 101 116 ‐ ‐ ‐ ‐ ‐ ‐ ‐
Diamond Path 136 139 133 130 133 134 ‐ ‐ ‐ ‐ ‐ ‐ ‐
Echo Park 110 128 104 109 107 107 ‐ ‐ ‐ ‐ ‐ ‐ ‐
Glacier Hills 111 132 125 139 135 116 ‐ ‐ ‐ ‐ ‐ ‐ ‐
Greenleaf 127 172 154 161 165 170 ‐ ‐ ‐ ‐ ‐ ‐ ‐
Highland 109 103 112 129 99 124 ‐ ‐ ‐ ‐ ‐ ‐ ‐
Northview 68 57 46 73 72 65 ‐ ‐ ‐ ‐ ‐ ‐ ‐
Oak Ridge 81 95 93 97 91 93 ‐ ‐ ‐ ‐ ‐ ‐ ‐
Parkview 152 155 162 146 140 135 ‐ ‐ ‐ ‐ ‐ ‐ ‐
Pinewood 101 80 95 109 110 114 ‐ ‐ ‐ ‐ ‐ ‐ ‐
Red Pine 117 126 120 156 162 142 ‐ ‐ ‐ ‐ ‐ ‐ ‐
Rosemount 123 107 115 113 128 118 ‐ ‐ ‐ ‐ ‐ ‐ ‐
Shannon Park 120 136 135 114 163 144 ‐ ‐ ‐ ‐ ‐ ‐ ‐
Southview 100 94 104 94 119 125 ‐ ‐ ‐ ‐ ‐ ‐ ‐
Thomas Lake 69 88 68 63 71 68 ‐ ‐ ‐ ‐ ‐ ‐ ‐
Westview 76 63 65 71 51 59 ‐ ‐ ‐ ‐ ‐ ‐ ‐
Woodland 86 90 85 100 93 91 ‐ ‐ ‐ ‐ ‐ ‐ ‐
Total 1,910 1,981 1,942 2,024 2,059 2,039 ‐ ‐ ‐ ‐ ‐ ‐ ‐
Middle Schools
Black Hawk ‐ ‐ ‐ ‐ ‐ ‐ 287 301 280 ‐ ‐ ‐ ‐
Dakota Hills ‐ ‐ ‐ ‐ ‐ ‐ 325 383 333 ‐ ‐ ‐ ‐
Falcon Ridge ‐ ‐ ‐ ‐ ‐ ‐ 358 339 341 ‐ ‐ ‐ ‐
Rosemount ‐ ‐ ‐ ‐ ‐ ‐ 410 430 380 ‐ ‐ ‐ ‐
Scott Highlands ‐ ‐ ‐ ‐ ‐ ‐ 326 327 298 ‐ ‐ ‐ ‐
Valley ‐ ‐ ‐ ‐ ‐ ‐ 314 322 286 ‐ ‐ ‐ ‐
Total ‐ ‐ ‐ ‐ ‐ ‐ 2,020 2,102 1,918 ‐ ‐ ‐ ‐
High Schools
Apple Valley ‐ ‐ ‐ ‐ ‐ ‐ ‐ ‐ ‐ 400 464 383 347
Eagan ‐ ‐ ‐ ‐ ‐ ‐ ‐ ‐ ‐ 528 543 449 481
Eastview ‐ ‐ ‐ ‐ ‐ ‐ ‐ ‐ ‐ 619 582 516 458
Rosemount ‐ ‐ ‐ ‐ ‐ ‐ ‐ ‐ ‐ 591 566 474 447
Environmental Studies ‐ ‐ ‐ ‐ ‐ ‐ ‐ ‐ ‐ ‐ ‐ 222 212
Area Learning Center ‐ ‐ ‐ ‐ ‐ ‐ ‐ ‐ ‐ ‐ 9 22 103
Total ‐ ‐ ‐ ‐ ‐ ‐ ‐ ‐ ‐ 2,138 2,164 2,066 2,048
Other
Adult Basic Education ‐ ‐ ‐ ‐ ‐ ‐ ‐ ‐ ‐ ‐ 1 2 59
Special Education
Center‐Based 58 63 41 57 48 42 49 52 53 43 55 56 196
Early Childhood 505 ‐ ‐ ‐ ‐ ‐ ‐ ‐ ‐ ‐ ‐ ‐ ‐
Total 563 63 41 57 48 42 49 52 53 43 56 58 255
Grant Total 2,473 2,044 1,983 2,081 2,107 2,081 2,069 2,154 1,971 2,181 2,220 2,124 2,303
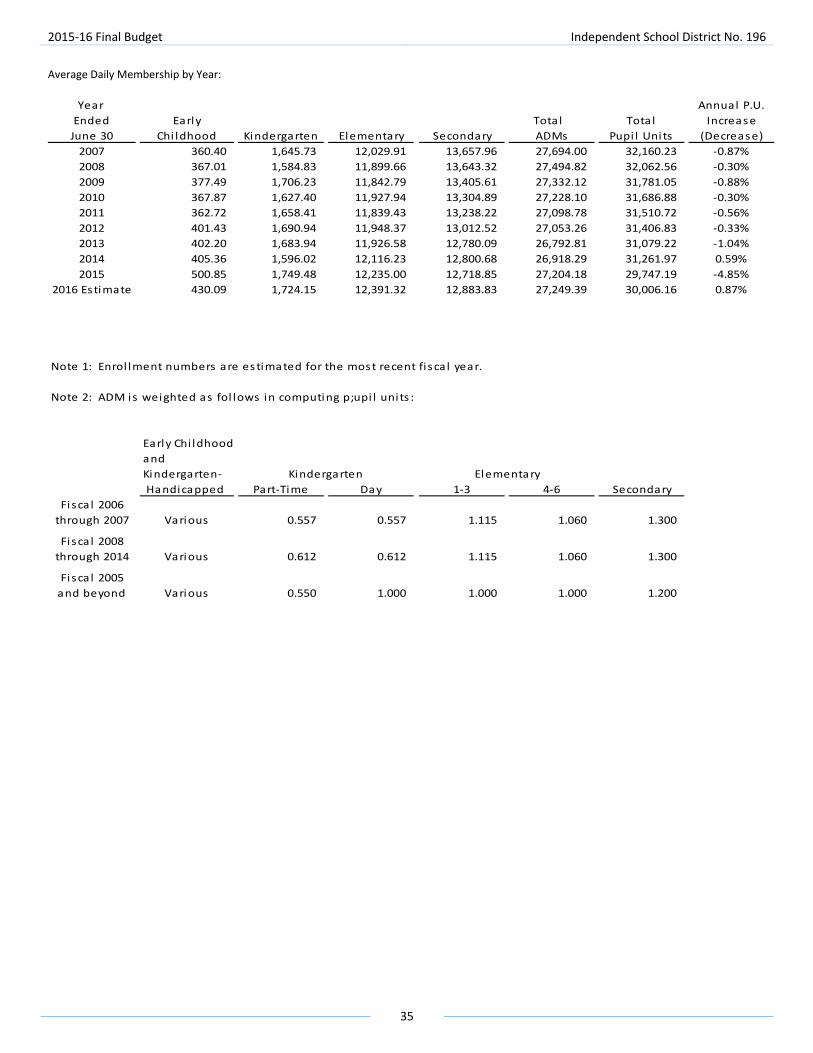
2015‐16 Final Budget Independent School District No. 196
35
Average Daily Membership by Year:
Year Annual P.U.
Ended Early Tota l Tota l Increase
June 30 Chi ldhood Kindergarten Elementary Secondary ADMs Pupi l Units (Decrease)
2007 360.40 1,645.73 12,029.91 13,657.96 27,694.00 32,160.23 ‐0.87%
2008 367.01 1,584.83 11,899.66 13,643.32 27,494.82 32,062.56 ‐0.30%
2009 377.49 1,706.23 11,842.79 13,405.61 27,332.12 31,781.05 ‐0.88%
2010 367.87 1,627.40 11,927.94 13,304.89 27,228.10 31,686.88 ‐0.30%
2011 362.72 1,658.41 11,839.43 13,238.22 27,098.78 31,510.72 ‐0.56%
2012 401.43 1,690.94 11,948.37 13,012.52 27,053.26 31,406.83 ‐0.33%
2013 402.20 1,683.94 11,926.58 12,780.09 26,792.81 31,079.22 ‐1.04%
2014 405.36 1,596.02 12,116.23 12,800.68 26,918.29 31,261.97 0.59%
2015 500.85 1,749.48 12,235.00 12,718.85 27,204.18 29,747.19 ‐4.85%
2016 Estimate 430.09 1,724.15 12,391.32 12,883.83 27,249.39 30,006.16 0.87%
Note 1: Enrol lment numbers are estimated for the most recent fi sca l year.
Note 2: ADM i s weighted as fol lows in computing p;upi l units :
Early Chi ldhood
and
Kindergarten‐
Handicapped Part‐Time Day 1‐3 4‐6 Secondary
Fisca l 2006
through 2007 Various 0.557 0.557 1.115 1.060 1.300
Fisca l 2008
through 2014 Various 0.612 0.612 1.115 1.060 1.300
Fisca l 2005
and beyond Various 0.550 1.000 1.000 1.000 1.200
ElementaryKindergarten
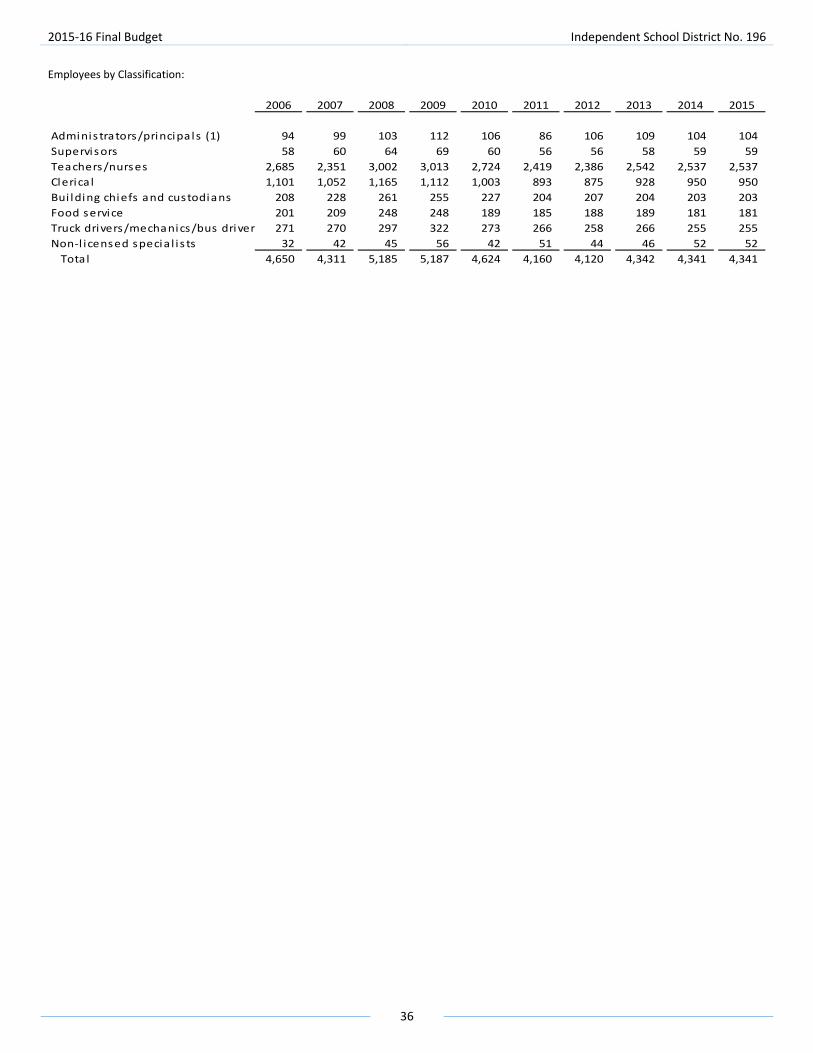
2015‐16 Final Budget Independent School District No. 196
36
Employees by Classification:
2006 2007 2008 2009 2010 2011 2012 2013 2014 2015
Adminis trators/principa ls (1) 94 99 103 112 106 86 106 109 104 104
Supervisors 58 60 64 69 60 56 56 58 59 59
Teachers/nurses 2,685 2,351 3,002 3,013 2,724 2,419 2,386 2,542 2,537 2,537
Clerica l 1,101 1,052 1,165 1,112 1,003 893 875 928 950 950
Bui lding chiefs and custodians 208 228 261 255 227 204 207 204 203 203
Food service 201 209 248 248 189 185 188 189 181 181
Truck drivers/mechanics/bus driver 271 270 297 322 273 266 258 266 255 255
Non‐l i censed specia l i s ts 32 42 45 56 42 51 44 46 52 52
Tota l 4,650 4,311 5,185 5,187 4,624 4,160 4,120 4,342 4,341 4,341

2015‐16 Final Budget Independent School District No. 196
37
Site Staffing Allocations:
October 1 Enrollm
ent
Adminstrator/Principal
Assistant Administrator
Counsler/Dean
Classroom Teachers
Specialists
Gifted and Talented
Technology Assistant
Nurse
12‐Month Secretary
10‐Month Secretary
10‐Month Clerk
Cam
pus Security
Totals
Elementary SchoolsCedar Park 697 1.00 0.57 ‐ 27.53 5.49 0.50 ‐ 0.88 1.00 0.94 4.19 ‐ 42.09 Deerwood 643 1.00 0.74 ‐ 25.50 5.28 0.60 ‐ 0.88 1.00 0.90 3.86 ‐ 39.76 Diamond Path 805 1.00 0.66 ‐ 31.92 6.31 0.50 ‐ 0.88 1.00 1.09 4.84 ‐ 48.18 Echo Park 665 1.00 0.68 ‐ 26.41 5.18 0.40 ‐ 0.88 1.00 0.92 4.00 ‐ 40.45 Glacier Hills 758 1.00 0.68 ‐ 29.93 5.90 0.50 ‐ 0.88 1.00 1.04 4.55 ‐ 45.48 Greenleaf 949 1.00 0.77 ‐ 37.41 7.29 0.50 ‐ 0.88 1.00 1.28 5.70 ‐ 55.83 Highland 676 1.00 0.85 ‐ 26.66 5.61 0.70 ‐ 0.88 1.00 0.96 4.06 ‐ 41.72 Northview 381 1.00 0.65 ‐ 14.94 3.86 0.60 ‐ 0.88 1.00 0.90 3.45 ‐ 27.27 Oak Ridge 550 1.00 0.58 ‐ 21.73 4.40 0.40 ‐ 0.88 1.00 0.90 3.45 ‐ 34.34 Parkview 890 1.00 0.73 ‐ 35.43 6.81 0.50 ‐ 0.88 1.00 1.20 5.35 ‐ 52.89 Pinewood 609 1.00 0.59 ‐ 23.89 4.88 0.70 ‐ 0.88 1.00 0.90 3.66 ‐ 37.49 Red Pine 823 1.00 0.67 ‐ 32.21 6.36 0.70 ‐ 0.88 1.00 1.11 4.95 ‐ 48.87 Rosemount 704 1.00 0.67 ‐ 27.82 5.59 0.50 ‐ 0.88 1.00 0.97 4.23 ‐ 42.65 Shannon Park 812 1.00 0.88 ‐ 32.04 6.64 0.70 ‐ 0.88 1.00 1.13 4.88 ‐ 49.14 Southview 636 1.00 0.65 ‐ 25.03 5.05 0.60 ‐ 0.88 1.00 0.90 3.82 ‐ 38.93 Thomas Lake 427 1.00 0.59 ‐ 17.00 3.89 0.50 ‐ 0.88 1.00 0.90 3.45 ‐ 29.21 Westview 385 1.00 0.58 ‐ 15.33 3.83 0.40 ‐ 0.88 1.00 0.90 3.45 ‐ 27.36 Woodland 545 1.00 0.63 ‐ 21.49 4.39 0.70 ‐ 0.88 1.00 0.90 3.45 ‐ 34.44
Totals 11,955 18.00 12.16 ‐ 472.25 96.75 10.00 ‐ 15.75 18.00 17.85 75.33 ‐ 736.09
Middle SchoolsBlack Hawk 868 2.07 ‐ 2.00 32.06 2.70 0.90 0.45 0.94 2.00 0.65 3.32 ‐ 47.08 Dakota Hills 1,041 2.08 ‐ 2.00 38.45 3.40 0.90 0.45 0.94 2.00 0.65 3.98 ‐ 54.85 Falcon Ridge 1,038 2.08 ‐ 2.00 38.34 3.60 0.90 0.45 0.94 2.00 0.65 3.97 ‐ 54.93 Rosemount 1,220 2.10 ‐ 2.00 45.06 3.90 0.90 0.45 0.94 2.00 0.76 4.66 ‐ 62.77 Scott Highlands 951 2.08 ‐ 2.00 35.13 3.65 0.90 0.45 0.94 2.00 0.65 3.64 ‐ 51.42 Valley Middle 922 2.07 ‐ 2.00 34.05 2.70 0.90 0.45 0.94 2.00 0.65 3.53 ‐ 49.29
Totals 6,040 12.48 ‐ 12.00 223.09 19.95 5.40 2.70 5.63 12.00 4.01 23.09 ‐ 320.35
High SchoolsApple Valley 1,594 4.10 ‐ 3.58 62.69 4.31 ‐ 0.45 1.00 4.00 2.07 3.81 2.00 88.01 Eagan 2,001 4.10 ‐ 4.50 78.23 4.71 ‐ 0.45 1.00 4.00 2.60 4.79 2.00 106.37 Eastview 2,175 4.22 ‐ 4.89 84.86 4.90 ‐ 0.45 1.00 4.00 2.83 5.20 2.00 114.34 Rosemount 2,078 4.15 ‐ 4.67 81.16 4.76 ‐ 0.45 1.00 4.00 2.70 4.97 2.00 109.87 SES 434 1.00 ‐ 0.98 16.53 0.45 ‐ 0.23 0.81 1.00 1.35 ‐ ‐ 22.35 ALC 134 0.50 ‐ ‐ 5.64 ‐ ‐ ‐ 0.25 1.00 0.90 0.68 1.00 9.97
Totals 8,416 18.06 ‐ 18.61 329.11 19.12 ‐ 2.03 5.06 18.00 12.46 19.45 9.00 450.90
Grand Totals 26,411 48.54 12.16 30.61 1,024.45 135.83 15.40 4.73 26.44 48.00 34.32 117.87 9.00 1,507.34
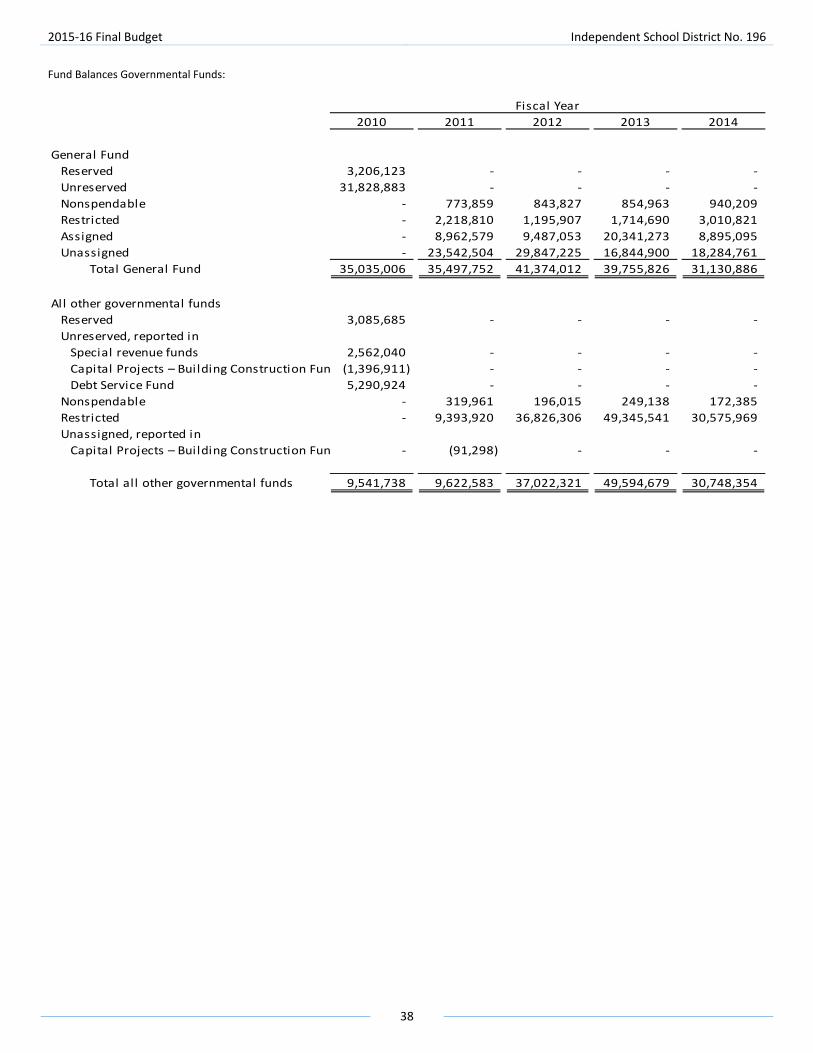
2015‐16 Final Budget Independent School District No. 196
38
Fund Balances Governmental Funds:
2010 2011 2012 2013 2014
General Fund
Reserved 3,206,123 ‐ ‐ ‐ ‐
Unreserved 31,828,883 ‐ ‐ ‐ ‐
Nonspendable ‐ 773,859 843,827 854,963 940,209
Restricted ‐ 2,218,810 1,195,907 1,714,690 3,010,821
Assigned ‐ 8,962,579 9,487,053 20,341,273 8,895,095
Unassigned ‐ 23,542,504 29,847,225 16,844,900 18,284,761
Total General Fund 35,035,006 35,497,752 41,374,012 39,755,826 31,130,886
All other governmental funds
Reserved 3,085,685 ‐ ‐ ‐ ‐
Unreserved, reported in
Special revenue funds 2,562,040 ‐ ‐ ‐ ‐
Capital Projects – Building Construction Fun (1,396,911) ‐ ‐ ‐ ‐
Debt Service Fund 5,290,924 ‐ ‐ ‐ ‐
Nonspendable ‐ 319,961 196,015 249,138 172,385
Restricted ‐ 9,393,920 36,826,306 49,345,541 30,575,969
Unassigned, reported in
Capital Projects – Building Construction Fun ‐ (91,298) ‐ ‐ ‐
Total all other governmental funds 9,541,738 9,622,583 37,022,321 49,594,679 30,748,354
Fiscal Year
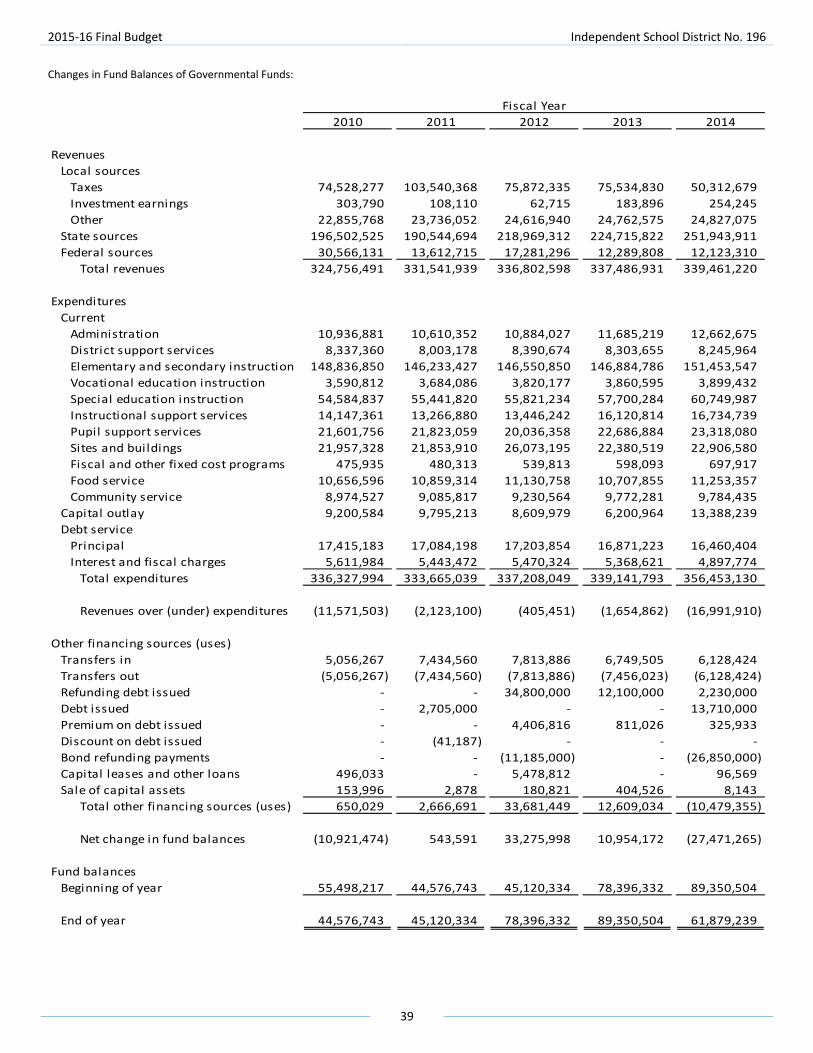
2015‐16 Final Budget Independent School District No. 196
39
Changes in Fund Balances of Governmental Funds:
2010 2011 2012 2013 2014
Revenues
Local sources
Taxes 74,528,277 103,540,368 75,872,335 75,534,830 50,312,679
Investment earnings 303,790 108,110 62,715 183,896 254,245
Other 22,855,768 23,736,052 24,616,940 24,762,575 24,827,075
State sources 196,502,525 190,544,694 218,969,312 224,715,822 251,943,911
Federal sources 30,566,131 13,612,715 17,281,296 12,289,808 12,123,310
Total revenues 324,756,491 331,541,939 336,802,598 337,486,931 339,461,220
Expenditures
Current
Administration 10,936,881 10,610,352 10,884,027 11,685,219 12,662,675
District support services 8,337,360 8,003,178 8,390,674 8,303,655 8,245,964
Elementary and secondary instruction 148,836,850 146,233,427 146,550,850 146,884,786 151,453,547
Vocational education instruction 3,590,812 3,684,086 3,820,177 3,860,595 3,899,432
Special education instruction 54,584,837 55,441,820 55,821,234 57,700,284 60,749,987
Instructional support services 14,147,361 13,266,880 13,446,242 16,120,814 16,734,739
Pupil support services 21,601,756 21,823,059 20,036,358 22,686,884 23,318,080
Sites and buildings 21,957,328 21,853,910 26,073,195 22,380,519 22,906,580
Fiscal and other fixed cost programs 475,935 480,313 539,813 598,093 697,917
Food service 10,656,596 10,859,314 11,130,758 10,707,855 11,253,357
Community service 8,974,527 9,085,817 9,230,564 9,772,281 9,784,435
Capital outlay 9,200,584 9,795,213 8,609,979 6,200,964 13,388,239
Debt service
Principal 17,415,183 17,084,198 17,203,854 16,871,223 16,460,404
Interest and fiscal charges 5,611,984 5,443,472 5,470,324 5,368,621 4,897,774
Total expenditures 336,327,994 333,665,039 337,208,049 339,141,793 356,453,130
Revenues over (under) expenditures (11,571,503) (2,123,100) (405,451) (1,654,862) (16,991,910)
Other financing sources (uses)
Transfers in 5,056,267 7,434,560 7,813,886 6,749,505 6,128,424
Transfers out (5,056,267) (7,434,560) (7,813,886) (7,456,023) (6,128,424)
Refunding debt issued ‐ ‐ 34,800,000 12,100,000 2,230,000
Debt issued ‐ 2,705,000 ‐ ‐ 13,710,000
Premium on debt issued ‐ ‐ 4,406,816 811,026 325,933
Discount on debt issued ‐ (41,187) ‐ ‐ ‐
Bond refunding payments ‐ ‐ (11,185,000) ‐ (26,850,000)
Capital leases and other loans 496,033 ‐ 5,478,812 ‐ 96,569
Sale of capital assets 153,996 2,878 180,821 404,526 8,143
Total other financing sources (uses) 650,029 2,666,691 33,681,449 12,609,034 (10,479,355)
Net change in fund balances (10,921,474) 543,591 33,275,998 10,954,172 (27,471,265)
Fund balances
Beginning of year 55,498,217 44,576,743 45,120,334 78,396,332 89,350,504
End of year 44,576,743 45,120,334 78,396,332 89,350,504 61,879,239
Fiscal Year


Glossary

2015‐16 Final Budget Independent School District No. 196
40
Glossary of Terms:
A Accounting Procedure: The policy and systematic arrangement of methods and operations for recording accounting information to provide internal control and produce accurate and complete records and reports. Accounting System: The total set of records and procedures which are used to record, classify and report information on the financial status and operations of an entity. Accrual Basis of Accounting: The method of accounting under which revenues are recorded when they are earned (whether or not cash is received at that time) and expenditures are recorded when goods and services are received (whether cash disbursements are made at that time or not). Adjusted Marginal Cost Pupil Units: The current pupil units or sum of 77 percent of the adjusted pupil units computed using current year data, plus 23 percent of the adjusted pupil units computed using prior year data, whichever is greater. Adjusted Net Tax Capacity (ANTC): The net tax capacity of a school district as adjusted by the sales ratio (Net Tax Capacity divided by the sales ratio). The purpose of the adjustment is to neutralize the effect of different assessment practices among the taxing jurisdiction of the state. Adjusted Pupil Units: The sum of pupil units served plus pupil units whom the district pays tuition under an agreement with another district, minus pupil units for whom the district receives tuition under an agreement with another district. Apportionment: (1) The act of apportioning; (2) An item of receipts resulting from the act of apportioning, such as state apportionment (see allotment). Assessed Valuation: A valuation set upon real estate or other property by a government as a basis for levying taxes. Assessment: (1) The process of making the official valuation of property for the purpose of taxation, and (2) The valuation placed upon property as a result of this process. Note: Assessment is sometimes used to denote the amount of taxes levied but such usage is not recommended since it fails to distinguish between the valuing process and the tax levying process. The term is also used erroneously as a synonym for special assessment. Assets: Economic resources that are owned or controlled by an entity. Audit: The result of an independent accountant’s review of the statements and footnotes to ensure compliance with generally accepted accounting principles and to render an opinion on the fairness of the financial statements. Audit Report: A report issued by an independent certified public accountant that expresses an opinion about whether the financial statements fairly present an organization’s financial position, operating results and cash flows in accordance with generally accepted accounting principles. Average Daily Attendance (ADA): The aggregate attendance of students in a school during a reporting period (normally a school year) divided by the number of days that school is in session during this period. Average Daily Membership (ADM): The aggregate membership of students in a school during a reporting period (normally a school year) divided by the number of days that school is in session during this period.
B Balance Sheet: A formal statement of assets, liabilities and equity as of a specific date. Bond: A written promise to pay a specified sum of money, called the face value or principal amount, at a specified date in the future (the maturity date), together with periodic interest at a specified rate. Bond Discount: The difference between the face value and the sales price when bonds are sold below their face value. Bond Maturity Date: The date at which a bond principal or face amount becomes payable. Bond Premium: The difference between the face value and the sales price when bonds are sold above their face value. Bond Rating: Ratings for bonds to be issued that primarily reflect the ability of the issuer to repay the bonds. Better bond ratings result in lower interest rates for the bonds issued.
2015‐16 Final Budget Independent School District No. 196
41
Bond Referendum: Funding for a proposed public building or major remodeling project submitted for local voter approval. Budget: A plan of financial operation expressing the estimates of proposed expenditures for a fiscal year and the proposed means of financing them (revenue estimates). Budgeting: Pertains to budget planning, formulation, administration, analysis and evaluation. Budget Calendar: Schedule of key dates which the School Board and administrators follow in preparation, adoption and administration of the budget.
C Capital Lease: A leasing transaction that is recorded as a purchase by the lessee; ownership is transferred to the lessee at the conclusion of the leasing agreement. Capital Outlay: An expenditure that is generally greater than $5,000 and results in ownership, control or possession of assets intended for continued use over relatively long periods of time. Cash Basis: Gross income is recognized when cash is received. Cash Basis Accounting: A system of accounting in which transactions are recorded and in which revenues and expenses are recognized only when cash is received or paid. Chart of Accounts: A list of all accounts generally used in an individual accounting system. In addition to account title, the chart includes an account number that has been assigned to each account. Accounts in the chart are arranged with accounts of a similar nature, for example, assets and liabilities. Compensatory Revenue: A portion of general education revenue based on the number of students in a school district that qualify for free or reduced‐price school meals. Contracted Services: Service rendered by personnel who are not on the payroll of the school district, including all related expenses covered by the contract. Credit: An entry on the right side of the account.
D Debt: Money owed by one party (the debtor) to a second party (creditor), generally subject to contractual terms regarding the amount and timing of repayments of principal and interest. Debt Service: Expenditures for the retirement of principal and payment of interest on debt. Debt Limit: The maximum amount of bonded debt for which a governmental unit (school district) may legally obligate itself. Debit: An entry on the left side of an account. Delinquent Taxes: Taxes remaining unpaid on and after the date on which they become delinquent by statute. Double Entry Accounting: A system of recording transactions in a way that maintains the equality of the accounting equation. Every entry made to the debit side of an account or accounts will have a corresponding amount or amounts made to the credit side.
E Elementary School: A school classified as elementary by state and local practice and composed of any span of grades not above grade eight. Preschool or kindergarten is included under this heading only if it is an integral part of an elementary school or a regularly established school system. Employee Benefits: Compensation, in addition to regular salary, provided to an employee. This may include such benefits as health insurance, life insurance, annual leave, sick leave, retirement and Social Security. Enrollment: The total number of students registered in a given school unit at a given time, generally in the fall. (October 1 in Minnesota)
2015‐16 Final Budget Independent School District No. 196
42
Entry: The record of a financial transaction in its appropriate book of accounts. Also, the act of recording a transaction in the books of accounts. Equalization: The process of (1) reducing the tax rate or tax base disparities among different taxing jurisdictions, or (2) reducing net tax disparities among different properties within the same class in a given taxing jurisdiction. Expenditures: Charges incurred, whether paid or unpaid, which are presumed to benefit the current fiscal year. For elementary/secondary schools, these include all charges for current outlays plus capital outlays and interest on school debt. Expenditures Per Pupil: Charges incurred for a particular period of time divided by a student unit of measure, such as enrollment, average daily attendance, or average daily membership. Expenses: Costs incurred in the normal course of operations.
F
Fiscal Year: The twelve‐month period of time to which the annual budget applies. All Minnesota school districts, by law, must observe a fiscal year that runs July 1 through June 30. Free School Meals: In order to qualify for free school meals, a household must submit an application. The federal government, comparing the household’s size to its income, sets guidelines. Full‐Time Equivalency (FTE): The result of a computation that divides the amount of time for a less than full‐time activity by the amount of time normally required in a corresponding full‐time activity. Fund: A sum of money or other resources segregated for the purpose of carrying on specific activities or attaining certain objectives in accordance with special regulations, restrictions or limitations, and constituting an independent fiscal and accounting entity. Fund Balance (equity): Mathematical excess of assets over liabilities. Federal Sources: Revenues received from federal government appropriations. Fiduciary Funds: Account for assets held in a trustee capacity or as an agent for individuals, organizations or other governmental units and/or funds. Formula Allowance: Minnesota’s basic general education formula allowance provided school districts with a majority of their revenue.
G General Fund: Typically the largest fund in the budget. It is comprised of money not in other funds. Most of this fund is not earmarked for specific purposes. Generally Accepted Accounting Principles (GAAP): Standard framework of guidelines for financial accounting used in any given jurisdiction; generally known as accounting standards or standard accounting practice. These include the standards, conventions and rules that accountants follow in recording and summarizing financial transactions and in the preparation of financial statements. General Obligation Bonds (GO Bonds): Bonds that the state stands behind with its taxing powers. Grant: A contribution of assets (usually cash) by one governmental unit or other organization to another. Typically these contributions are made to local governments (school districts) from state and federal governments and are usually made for specified purposes.
H High School: A secondary school offering the final years of high school work necessary for graduation, usually including grades 9‐12.
I Interest: The payment (cost) for the use of money. Internal Service Funds: Funds internal to the operation of a unit that provide a variety of services to that unit, such as a printing activity. The funds must recover the full costs of services provided through billing back.
2015‐16 Final Budget Independent School District No. 196
43
J No entries
K Kindergarten: This category of students includes transitional kindergarten, kindergarten and pre‐first‐grade students, and is traditionally found in elementary schools. Kindergarten Handicapped (or disabled): This is a special category within kindergarten that provides for increased weighting of these kindergarten students that provides more revenue to a district.
L Lease: A contract that specifies the terms under which the owner of an asset (the lessor) agrees to transfer the right to use the asset to another party (the lessee). Lessee: The party that is granted the right to use property under the terms of a lease. Lessor: The owner of property that is rented (leased) to another party. Levy: A tax imposed on property, which a school board may levy, and is limited by statute. Liabilities: Obligations measurable in monetary terms that represent amounts owed to creditors, governments, employees and other parties. Local Education Agency (LEA): See school district. Long‐Term Liabilities: Debts or other obligations that will not be paid within one year.
M Mandates: Requirements imposed by one level of government on another. Marginal Cost Pupil Unit: Used to indicate pupil count. It is a calculation whereby 77 percent of the current year pupil count is added to 23 percent of the prior year pupil count. Market Value: The value assigned to property by an assessor. The market value is intended to reflect the sales value of the property. Middle School: A secondary school following elementary school and preceding high school, usually including grades 6‐8. Minnesota Automated Reporting Student System (MARSS): A system of pupil accounting which maintains essential data elements for each public school student attending school in Minnesota and reported by school districts to the state. Minnesota Department of Education (MDE): The formal agency within the executive branch of government in Minnesota that oversees the operations of education, K‐12 education in particular. Modified Accrual Basis of Accounting: The basis of accounting under which expenditures, other than accrued interest on general long‐term debt, are recorded at the time liabilities are incurred and revenues are recorded when received in cash, except for material and/ or available revenues, which should be accrued to reflect property taxes levied and revenue earned.
N Net Tax Capacity (NTC): This value is derived by multiplying the estimated market value of each parcel by the appropriate class (use) rate for that parcel. Net Tax Liability: The amount of tax computed by subtracting tax credits from the gross tax liability. Non‐Resident Student: A student whose legal residence is outside the geographical area served by the district.
2015‐16 Final Budget Independent School District No. 196
44
O Operating Lease: A simple rental agreement where ownership is retained by the lessor at the conclusion of the leasing agreement.
P Principal (face value or maturity value): The amount that will be paid on a bond at its maturity date. Public Employees Retirement Association (PERA): This group administers pension plans that cover local, county and school district non‐teaching employees. Pupil Units: A count of resident pupils students in average daily membership. See weighted pupil units.
Q No entries
R Review and Comment: A process by which the commissioner of Minnesota Department of Education reviews and comments on the feasibility and practicality of proposed school district building projects. Refunding Bonds: Bonds issued to pay off bonds already outstanding. Reserve: An amount set aside for some specified purpose. Resident Student: A student whose legal residence is within the geographic area served by the district. Revenues: Money received by a unit from external sources net of refunds and other correcting transactions, other than from the issuance of debt, liquidation of investments, and as agency and probate trust transactions.
S
School Board: Elected or appointed body which has been created according to state law and vested with responsibilities for educational activities in the school district. School District: A unit for administration of a public‐school system often comprising several cities within a state. Social Security (FICA) Taxes: Federal Insurance Contributions Act taxes imposed on employees and employers; used mainly to provide retirement benefits. Staff Automated Reporting System (STAR): The system by which staff data elements are recorded and transmitted to the Minnesota Department of Education. Stated Rate of Interest: The rate of interest printed on the bond. Statute: A written law passed by a legislative body.
T Tax Base: The value of commercial, industrial, residential, agricultural and other properties in a school district, city, municipality and county. Tax Capacity: The value of property that school districts and other units tax. Tax Credit: A state‐allowed reduction on local property taxes. Teachers Retirement Association (TRA): A statewide public pension fund for public school teachers throughout Minnesota, except for teachers in the first class cities, and some teachers in community colleges, state universities and technical colleges. Transfer: The movement of money between funds; transfer must be consistent with legislative intent. Trial Balance: A listing of all account balances; provides a means of testing whether total debits equal total credits for all accounts.

2015‐16 Final Budget Independent School District No. 196
45
Trust Fund: A fund consisting of resources received and held by the district as trustee to be expended or invested in accordance with the conditions of the trust.
U Uniform Financial Accounting and Reporting Standards (UFARS): Minnesota’s legally prescribed set of accounting standards for all school districts. Useful Life: The term used to describe the life over which an asset is expected to be useful to the company; cost is assigned to the periods benefited from using the asset.
V No entries
W
Weighted Pupil Units: A varied weighting of pupils by grade. For example, a student in grades 1‐6 may be counted as a 1.06 pupil unit, whereas a student in grades 7‐12 may be counted as a 1.3 pupil unit.
X No entries
Y No entries
Z No entries

Libby Fischer, Deerw
ood Elementary
#196Educating our students to reach their full potentialServing all or part of Rosemount, Apple Valley, Eagan, Burnsville, Coates, Inver Grove Heights, Lakeville, and Empire and Vermillion Townships