many small steps on the road to profitable growth 30 …/media/files/r/rentokil/... · many small...
TRANSCRIPT

2010 Interim Results30 July 2010
Many small steps on the road to profitable growth
Alan Brown CEO
Katharine Rycroft IR
2
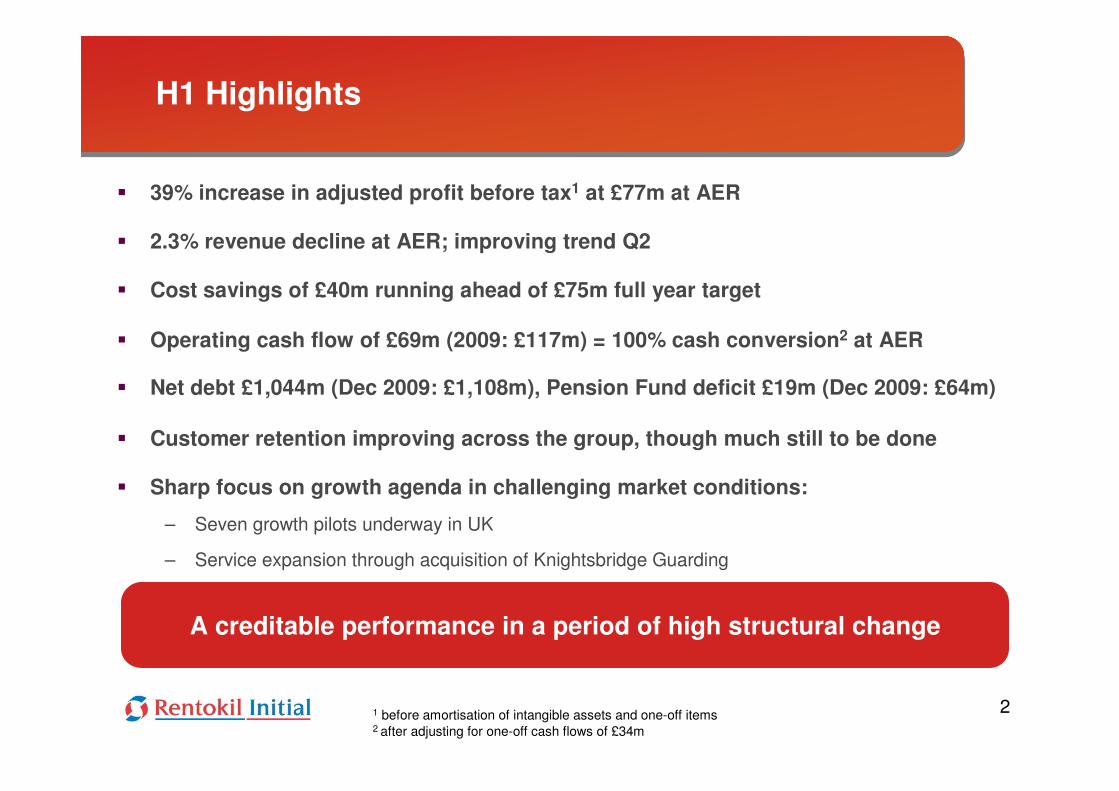
H1 Highlights
1 before amortisation of intangible assets and one-off items 2 after adjusting for one-off cash flows of £34m
A creditable performance in a period of high structural change
39% increase in adjusted profit before tax1 at £77m at AER
2.3% revenue decline at AER; improving trend Q2
Cost savings of £40m running ahead of £75m full year target
Operating cash flow of £69m (2009: £117m) = 100% cash conversion2 at AER
Net debt £1,044m (Dec 2009: £1,108m), Pension Fund deficit £19m (Dec 2009: £64m)
Customer retention improving across the group, though much still to be done
Sharp focus on growth agenda in challenging market conditions:
– Seven growth pilots underway in UK
– Service expansion through acquisition of Knightsbridge Guarding

3
CER = constant exchange ratesAER = actual exchange rates
Financial Highlights
CER = constant exchange ratesAER = actual exchange rates
Q2 H1
2010 2009 2010 2009£m £m £m £m
Revenue at CER 626.6 631.6 (0.8)% 1,229.8 1,258.3 (2.3)%
Adjusted PBITA at CER 60.7 51.3 18.3% 102.6 83.6 22.7%
Adjusted PBTA at CER 46.3 33.8 37.0% 75.8 55.2 37.3%
Adjusted PBTA at AER 46.1 33.5 37.6% 76.5 55.1 38.8%
Operating Cash Flow at AER 40.3 59.1 (31.8)% 69.0 116.7 (40.9)%

4
Textiles and Washrooms
Revenue down 1.7% - difficult trading conditions & competitive pressures, particularly France and Benelux
Profit up 12.5% reflecting impact of new management, robust cost control & restructuring
Retention3 stable at 74.8% for H1 but improvement in Q2 following France contract loss in Q1
European restructuring: – France nearing completion, Belgium completed ahead of schedule but higher implementation costs
– Garment procurement & range rationalisation programme demonstrating high potential - significant benefits from H2 2011
– Significant number of smaller projects delivering expected benefits
1 before amortisation and impairment of intangible assets and one-off items 2 % excludes central costs3 100% – (terminations & reductions for H1 annualised and expressed as a percentage of opening portfolio)

51 before amortisation and impairment of intangible assets and one-off items 2 % excludes central costs
Pest Control
Europe profit up 16% (stabilisation of Spanish business) but mixed trading conditions suppressing revenue, up 0.1%
Excellent performance from UK Pest: – Profit up 25% on 2.8% revenue growth
– Contract sales up 32.4%, job sales up 17.5%, 4.2% rise in retention to 75.4%
North America robust - profit up 5.7% on 4.5% revenue increase, sales capability now key focus
Libya: contract issues resolved, revenue & profit down consistent with contract structure
Improvement in retention – from 81.6% at June 2009 to 83.4%

6
Asia Pacific
1 before amortisation and impairment of intangible assets and one-off items 2 % excludes central costs
Asia:
– Revenue down 14.9% - exit of HK Pest contract, weaker government business in China, decline in fumigation and exit of Security businesses. Excluding these, revenue grew 0.8%
– Profit up 17.1% - revenue growth & cost savings in Malaysia, the Philippines, Indonesia, Taiwan, Thailand, China & Vietnam
– Improvement in retention – from 50.4% at June 2009 to 81.5%
Pacific:
– Revenue down 2.3% - contract revenue decline in Aus. Washrooms and Ambius, weaker residential jobbing in Pest
– Profit up 3.7% reflecting tight control on costs
– Improvement in retention – from 79.9% at June 2009 to 85.5%

7
Ambius
1 before amortisation and impairment of intangible assets and one-off items 2 % excludes central costs
Some stabilisation of market conditions, however H1 performance impacted by 2009 portfolio erosion
Revenue down 8.3%, profit down 4.2% year on year
Continued weakness in job sales across most regions
Improvement in retention from 75% to 83%, marginal improvement in gross sales
Close to achieving net gain in portfolio

8
City Link
1 before amortisation and impairment of intangible assets and one-off items
Reduction in H1 operating loss to £4.7m (H1 2009: £(7.0m))
Revenue flat on 2009, 1.8% growth in Q2
Volumes up 4% but pricing pressure continues - revenue per consignment down 4.3%
Mid-year cost savings £15m:
– Depots 84 to 77, closure of Wednesbury Hub, move from hard sided to curtain sided trailers
Delivery costs impacted by volume increase & planning inefficiencies leading to high sub-contractor costs
Reduction of sub-contractors and improvement in routing efficiency targeted for H2
Industry & customer recognition of service improvement: Triangle Report and Motor Transport Awards

9
Initial Facilities Services
1 before amortisation and impairment of intangible assets and one-off items 2 % excludes central costs
Revenue down 4.5%, of which 2.2% Retail
Cleaning, Catering & Hospitals revenue down due largely to contract losses in H2 2009
Majority of portfolio recovered by the London Underground contract win – positive contribution from Q2 2010 and progressing well
28.6% growth in profit reflecting 2009 actions to restructure and streamline operations & management
Acquisition of Knightsbridge Holdings and Perception UK for £10m (total consideration):
– Offers opportunity to cross-sell manned guarding across existing portfolio

10
H1 2010 H1 2009
Adjusted PBITA 103.1 83.4
One-off items (18.0) (14.2)
Depreciation 115.6 108.4
Non-cash items1 2.3 3.0
EBITDA 203.0 180.6
Working capital2 (48.8) 28.7
Capex2 (88.6) (99.1)
Fixed asset disposal proceeds3 3.4 6.5
Operating cash flow 69.0 116.7
1 Profit on sale of fixed assets, IFRS 2 etc.2 After one-off working capital flows of £25.0m and one-off capex flows of £9.1m relating to restructuring programmes3 Property, plant, vehicles
Operating Cash Flow

11
H1 2010 H1 2009
Operating cash flow 69.0 116.7
Cash interest (40.1) (44.0)
Cash tax (19.1) (5.0)
Free cash flow 9.8 67.7
Acquisitions & Disposals1 (4.9) (9.7)
FX 2 59.7 87.3
Decrease/ (increase) in net debt 64.6 145.3
Opening net debt (1,108.1) (1,362.2)
Closing net debt (1,043.5) (1,216.9)
Free Cash Flow and Movement in Net Debt
1 Cash consideration plus acquired debt2 Most of the group’s debt is either denominated or hedged into Euro or US Dollars

Strategy Update

13
Execution of the Strategic Plan
1. Outstanding Customer Service
3. Delivering Operational Excellence
2. Developing Capability
4. Lowest Cost and Maximum Cash
5. Profitable Growth

14
Ongoing drive on customer service: – Group State of Service 97.5% across route- based businesses
Industry & customer recognition of City Link service improvement: – Winner of ‘2010 Customer Care Award’ at Motor Industry Awards
Retention showing improving trend: – But volatility in TWS and IFS due to scale of contract losses in 2009
Progress in accountability for customer contact management across all businesses
Improvements in responsiveness, proactive customer contact, tailored propositions: – Initiatives in City Link, TWS and in UK Pest and Washrooms growth pilots
1. Customer Service

15
1. Customer Service – Retention Improvements
6 Month Annualised Retention Rate %
65.0%
67.0%
69.0%
71.0%
73.0%
75.0%
77.0%
79.0%
81.0%
83.0%
85.0%
Jun-09 Jul-09 Aug-09 Sep-09 Oct-09 Nov-09 Dec-09 Jan-10 Feb-10 Mar-10 Apr-10 May-10 Jun-10
Pest
Ambius
IFS
T&W
APAC
Continuing Ops
16
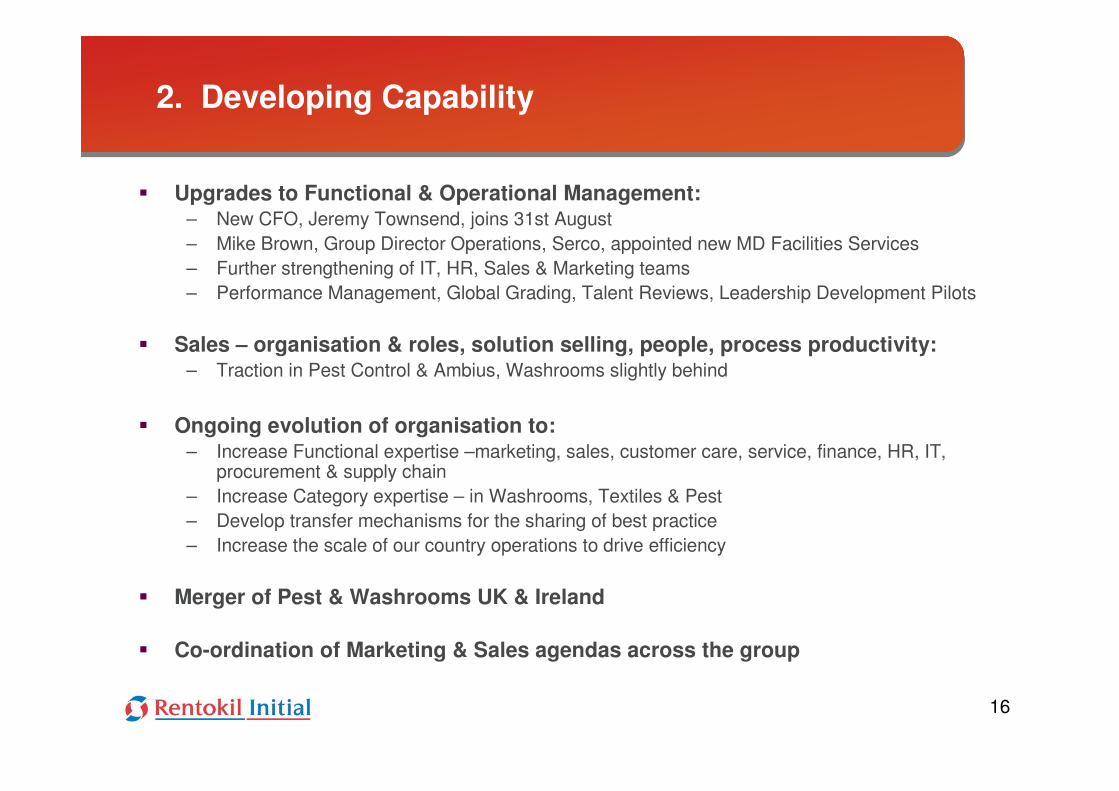
2. Developing Capability
Upgrades to Functional & Operational Management:– New CFO, Jeremy Townsend, joins 31st August – Mike Brown, Group Director Operations, Serco, appointed new MD Facilities Services– Further strengthening of IT, HR, Sales & Marketing teams – Performance Management, Global Grading, Talent Reviews, Leadership Development Pilots
Sales – organisation & roles, solution selling, people, process productivity: – Traction in Pest Control & Ambius, Washrooms slightly behind
Ongoing evolution of organisation to:– Increase Functional expertise –marketing, sales, customer care, service, finance, HR, IT,
procurement & supply chain – Increase Category expertise – in Washrooms, Textiles & Pest – Develop transfer mechanisms for the sharing of best practice – Increase the scale of our country operations to drive efficiency
Merger of Pest & Washrooms UK & Ireland
Co-ordination of Marketing & Sales agendas across the group

17
Consistent KPIs across the group, new measures to drive sales & productivity
Good progress in turnaround businesses, all focused for growth
Transfer and sharing of best practice: cross-divisional attitude improvement
Ongoing development & roll-out of common systems & processes:– iCABS roll-out driving improved control in Pest & Washrooms – Google Aps on track for completion by year end – Implementation of Navision finance system
Integration of City Link’s fragmented systems close to completion: – Over half of depots fully integrated– Benefits from improved route planning and cost reductions in H2
Route optimisation software pilots in TWS and City Link: – Benefits during 2011
3. Developing Operational Excellence

18
Ortec – Route Optimisation Pilots
PropositionSystems to optimise routes & working schedules for service agentsSet minimum planning standards, including daily time/distance targets for drivers & branchesSimulation tool for better defining of fleet types, changes of services offering and branch network
Anticipated ResultsMore efficient routes, estimated between 5-20% less time on the roadImproved customer retention through better measurement & management of service agent & branch performance
Initial Results Proven technology, branch roll-out can now be implemented Brings focus on service management discipline
3. Developing Operational Excellence

19
4. Lowest Possible Cost, Maximum Cash
£40m cost savings running ahead of £75m target, of which:– £15m - City Link depot & hub consolidation – £25m - divisional & group centre, includes £7.5m indirect procurement savings
£69m operating cash flow = 100% cash conversion at AER1: – DSO = 51 days, YOY reduction in capex from 85.4% of depreciation to 73.7% at AER
European Textiles processing productivity programme ongoing:– Belgium complete but higher implementation costs, France near completion, smaller projects
delivering benefits
Procurement savings: – High potential from garment procurement & range rationalisation programme – Significant benefits from H2 2011
Programme Olympic leading the way in administration processes improvements: – Benefits anticipated in 2012 and beyond
1 after adjusting for one-off cash flows of £34m

20
5. Profitable Growth – Current Focus & Initiatives
Laying the foundations for profitable growth from 2011 and beyond
Existing Customers – better retention, cross selling & up selling
New Customers - improved sales productivity & targeting
New Service Lines – Manned Guarding, Entotherm

21
5. Profitable Growth - Initiatives Existing Customers
Retention
Tier 3 Acct Management
Desk based field support for Tier 3
Standard review approach & systemsEscalation process
Welcome Pack process owner Tech changeover
Customer Complaint Management
Complaint recording process through dedicated team
Team owns investigation process into complaints –standard investigation process
Identify cause of failure , permanent corrective actions and lessons learned
Customer Contact Management
Proactive Account Management strategy
- Pest risk, review & recommendations
Customers tiered by premise and value
Acct Mgrs owner by premise (within Tier)
Standard Proactive review approach
- training / reporting / technical / QA
- Welcome Pack

22
5. Profitable Growth - InitiativesExisting Customers
Cross selling using Google plus Mash Up Technology
PropositionVisualisation of existing customer data based around GEO informationMerged data from existing systems and 3rd party marketing sourcesVirtual collaboration space for local cross divisional sales teams
Anticipated Results
Improved cross-selling opportunitiesPossible up-selling opportunitiesIncreased conversion from prospect to
sales
Other OpportunitiesRoute optimisation Real-time mapping informationInfestation mapping

23
5. Profitable Growth - InitiativesNew Customers - Improved Sales Productivity
Mobile Sales Device – ‘Advantage’
Proposition
Tablet device with touch screen, offline application to improve sales productivity Entire sales process (prospecting, surveying, conversion, payment) recorded in the field and offsite Access to technical & marketing supportProduce paperwork on site & get signature Standard tool for contact management & customer reviews
Key Objectives
Increased conversion rates & sales
Improved pricing / transparent price control

24
Pest Control Residential Self Service - “Click & Pay”
PropositionWeb-based sales of wasps & antsCustomer ordering & payment onlineDedicated section on website Operational model to support
Key ObjectivesTarget 40% of wasp sales from online Negligible cost per sales transaction
Initial Results100% effective end-to-end processOver 2,000 site hits in first three weeksNow selling out of hours & at weekendsTransactions set to increase from August during heavy wasp season
5. Profitable Growth - InitiativesNew Customers - Improved Sales Productivity

25
Bids & Tenders
Proposition
Identify which customers require “bids”Put in place a process to manage bids from reception to completion, and gatewaysStandard collateral library to complete bidsPricing & implementation modelAppropriately allocate Management time
Key Objectives
Greater level of bids into UK Pest, win more customers
5. Profitable Growth - InitiativesNew Customers - Improved Sales Productivity

26
Indoor Sales
Proposition
Desk based field supportMake sure opportunities are attractivePut all sales opportunities from whatever source into one pipeline - & manage itProvide surveyors with collateralTele-appoint where appropriate
Key Objectives
Field team to do more productive callsSell more than the base period
5. Profitable Growth - InitiativesNew Customers - Improved Sales Productivity

27
UK Facilities Services market worth £60bn:– Cleaning 19%, Catering 18%, Manned Guarding 14%
UK Cleaning sector moving from single service supply to bundled services & facilities management:
– Presents opportunity to strengthen integrated services offering to existing & new customers – Increases ability to up-sell and cross-sell additional group services – Strengthens and protects client relationships
Acquisition of Knightsbridge Guarding Holdings & Perception UK in June 2010– Total consideration of £10 million – £33.8m combined revenues in last financial year– Knightsbridge 17th largest security provider in the UK providing high-calibre, bespoke security for
the corporate sector – Like Lancaster, blue-chip clients based in the City of London and West End
5. Profitable Growth - Initiatives New Service Lines - Manned Guarding

28
5. Profitable Growth - Initiatives New Service Lines - Innovation
Entotherm – Award Winning Pest Treatment
Proposition
Innovative insect treatment – chemical-free, environmentally friendly, mobile
Unique to Rentokil & available across the UK
Kills all life stages of insects from eggs to fully grown adults
Winner of the ‘Best Business Award for Best Innovation in the Private Sector’
Described by judges as “a major step forward in pest control…we applaud the way Rentokil and Revival Environmental have worked together to bring this innovation to market.”

29
Outlook
Trading conditions largely unchanged – continental Europe challenging
Cost savings running ahead of £75m full year target
City Link full year profitability - heavily weighted to Q4
Good progress on debt – likely to be below £1bn by the year end
Seven growth pilots underway – updates in due course
Full year expectations unchanged, subject to potential adverse impact of
weakening Euro on translation of results to Sterling

30
Questions

31
H1 2010 H1 2009
Net interest on bank/bond/finance lease debt* (25.3) (33.6)
Net return on Pension Scheme (0.1) 2.9
Mark-to-market/forex adjustments (2.6) 2.1
Other (0.5) (1.5)
Per income statement (28.5) (30.1)
Average interest rate on bank/bond/ finance/lease debt 4.7% 5.3%
Average net debt £1,088m £1,280m
Interest
* Interest paid on forward rate agreements

32
Debt Maturity CouponNet debt at30/06/101
£m
£500mRCF
2012 LIBOR +0.5% (220)
£50m FRN
2013 LIBOR +3.25% (50)
£75mReset Bond
2013-33 LIBOR +3.98% (75)
€500mBond
2014 4.625% (409)
£300mBond
2016 5.75% (326)
+ 363
(1,044)
Net Debt
1 IAS 39 fair values 2 Headroom £280m; EBITDA / interest covenant is 4x minimum, actual 7.9x3 Cash less finance leases and other debt
2

33
H1 2010 H1 2009
Profit before tax (continuing ops) 30.9 8.2
Explanation of tax charge
Expected charge at blended rate 9.0 2.5
Recurring factors affecting tax charge 0.4 (0.5)
9.4 2.0
Unrelieved losses 0.8 1.6
One-off items 2.3 0.8
Prior year adjustments (5.3) (2.8)
Actual tax charge 7.2 1.6
Tax rate 23.3% 19.5%
Cash tax paid 19.1 5.0
Taxation
• Underlying tax rate for the full year expected to be circa 30% and favourable one-off items are likely to continue
• H1 2009 tax payments reduced by tax refunds of some £10m
£ million