manuscript - research-repository.griffith.edu.au
TRANSCRIPT

Severe Damage of a Pile Group due to Slope Failure
Author
Ong, DEL, Leung, CF, Chow, YK, Ng, TG
Published
2015
Journal Title
Journal of Geotechnical and Geoenvironmental Engineering
Version
Accepted Manuscript (AM)
DOI
https://doi.org/10.1061/(ASCE)GT.1943-5606.0001294
Copyright Statement
© 2015 American Society of Civil Engineers (ASCE). This is the author-manuscript version ofthis paper. Reproduced in accordance with the copyright policy of the publisher. Please refer tothe journal's website for access to the definitive, published version.
Downloaded from
http://hdl.handle.net/10072/375720
Griffith Research Online
https://research-repository.griffith.edu.au

1
Severe Damage of a Pile Group Due to Slope Failure 1
D E L Ong1; C F Leung
2, Y K Chow
3 and T G Ng
4 2
Abstract: A pile group consisting of four cast in-place concrete piles was 3
instrumented to measure the induced bending moment along the piles due to 4
excavation of an adjacent slope. The green field lateral soil movement profiles and the 5
lateral pile deflection profiles were monitored by in-soil and in-pile inclinometers, 6
respectively. The unexpected early arrival of rain storm prior to the year-end monsoon 7
caused the failure of the slope which resulted in the severe damage of this pile group 8
located at the slope crest. This paper examines the pre- and post-failure behavior of 9
the pile group and it is demonstrated that considering the uncracked and cracked 10
bending stiffness of the piles is vital when evaluating the progressive damage of the 11
pile group due to slope failure. 12
13
14
15
16
17
Keywords: Bending moment; Pile Group; Deflection; Excavation; Lateral soil 18
movement, Limiting soil stress, Back-analysis; Pile cracks 19
20 1Director (Acting), Research Centre for Sustainable Technologies, Faculty of Engineering, 21
Science & Computing, Swinburne University of Technology, Sarawak Campus, 93350 22 Kuching, Sarawak, Malaysia. E-mail: [email protected] 23 24 2Professor, Centre for Soft Ground Engineering, Civil Engineering Dept., National University 25
of Singapore, Singapore 117576. E-mail: [email protected] 26 27 3Professor, Centre for Soft Ground Engineering, Civil Engineering Dept., National University 28
of Singapore, Singapore 117576. E-mail: [email protected] 29 30 4Executive Director, GeoEng Consultants (S) Pte Ltd./ Golder Associates (S) Pte Ltd., 31
Singapore 329983. E-mail: [email protected] 32 33
34
Manuscript

2
Introduction 35
36 A proposed 8-storey industrial building with a one-level basement car park 37
was constructed on an approximately 15,000 m2 site in Singapore. An instrumented 38
cast in-place concrete pile group comprising four 900-mm diameter piles was 39
constructed near to the proposed access road boundary. In order to facilitate the 40
construction of an underground storage tank, excavation in front of the instrumented 41
pile group with slope gradient of 1:2.5 (vertical:horizontal) was carried out in marine 42
clay. The maximum excavation depth was about 6 m below the existing ground level. 43
Due to the unexpected early arrival of rain storm prior to the year-end monsoon 44
season, the slope failed and the resulting excessive soil movement led to failure of the 45
instrumented pile group. 46
The failure of the instrumented pile group was characterized by relatively 47
large pile deflections as a direct result of lateral soil movements due to the slope 48
failure. The field data obtained was evaluated in detail to achieve a better 49
understanding on the magnitude of limiting soil stress on a pile group to reinforce the 50
findings from centrifuge model studies on excavation-induced soil movement on a 51
single pile (Ong et al. 2006; Leung et al. 2006) and on pile groups (Ong et al. 2009, 52
2011). A numerical study was also conducted to back-analyze the field data to gain a 53
deeper understanding of the complex soil-structure interaction behavior. It should be 54
noted that the main focus of this paper is on the pile-group behavior when affected by 55
lateral soil movements and not on the cause of the slope failure. 56
Soil profile 57
Standard penetration tests (SPT) and limited numbers of in-situ vane shear 58
tests were carried out to investigate the underlying soft marine clay. Fig. 1 shows the 59
plan view of the site with locations of Borehole BH1, installed instruments and the 60

3
instrumented pile group at the site. The groundwater level was measured using a 61
standpipe piezometer installed to a depth of 25m and found to be 1 m below ground 62
level prior to the commencement of excavation. 63
Fig. 2 shows the interpreted subsurface soil profile and the geotechnical 64
properties. Underlying the 1 m thick fill layer was a 9 m thick very soft greenish grey 65
marine clay of the Kallang Formation with standard penetration resistance (N value) 66
less than 4. The underlying Old Alluvium was 2.5 m thick and comprised loose clayey 67
sand with N values of 5 and 14, followed by a 1 m thick medium dense sand with N 68
values of 14 and 38. Subsequently, a 9.5 m thick dense clayey sand with N values 69
ranging between 29 and 50 was found. BH1 was terminated in very dense clayey sand 70
where SPT refusals were recorded. 71
Instrumentation program and layout 72
In view of anticipated excavation in front of the piles, a pile group consisting 73
of four 900-mm cast in-situ concrete bored piles was instrumented to measure the 74
expected bending moment along the pile induced during and after the excavation. One 75
front pile (nearer to the excavation) and one rear pile (further away from the 76
excavation) were instrumented. Fig. 3 shows the plan and elevation views of the 77
instrumented piles in relation to the excavation. The locations of the in-pile 78
inclinometer and the strain gages are shown in Fig. 4. As it was expected that the pile 79
segment within the marine clay layer would bend more than other segments, the 80
elevations of the resistance-type strain gages along the two instrumented piles were 81
planned accordingly. To ensure that the strain gages function well under harsh and 82
damp conditions, they were carefully water-proofed using resin. The wires connecting 83
the strain gages were properly buried underground before connecting to the strain 84
meter which was programmed to automatically acquire the strain gage readings every 85

4
6 hours. An in-pile inclinometer was also installed in a rear pile to measure its pile 86
deflection profile. The conventional inclinometer casing was placed in the bored pile 87
before concreting. After concreting, baseline readings were taken. The measured pile 88
deflection profile could then be differentiated to derive the pile bending moment 89
profile. 90
Excavation sequence and construction events 91
Fig. 5 shows schematically the key events over the 2-month excavation and 92
construction period. Due to the unexpected early arrival of rain storm prior to the 93
year-end monsoon season, the slope slipped overnight after excavation of only 3.5 m 94
from the original ground level. Fig. 6 shows the slope failure at the location of 95
instrumented pile group. Henceforth, Day 0 is denoted as the day that slope failure 96
occurred. It should be noted that sheet piles and steel struts were installed at the toe of 97
the slope to protect the nearby piles only when the soil movements became 98
unexpectedly large, especially after the occurrence of the soil slip. 99
Measured in-pile and in-soil inclinometer readings 100
The in-pile inclinometer was installed in one of the rear piles prior to the 101
occurrence of soil slip. The measured rear pile deflection profiles are presented in Fig. 102
7(a). However, the in-soil inclinometer was installed 5 days after the first soil slip and 103
the lateral soil movement profiles using Day 5 readings as datum are shown in Fig. 104
7(b). At the end of the monitoring period, the maximum pile deflection and the 105
maximum lateral soil movement measured at the ground level were about 220 mm 106
and 590 mm, respectively. 107
It is noted that both the pile and soil movement profiles are generally 108
triangular in shape where the largest magnitudes are recorded at the ground level. The 109
figures also reveal that the magnitudes of pile deflection and lateral soil movements 110
5
reduce with increasing depth until about 13 m depth. Below this depth, the 111
magnitudes of lateral pile and soil movements quickly diminish due to stiffer 112
resistance offered by the medium dense sand (N value of 14) to dense clayey sand (N 113
value of 38). 114
Fig. 8 shows a comparison between the measured lateral pile deflection and 115
the lateral soil movement at various depths over the excavation period. Since both the 116
in-pile and in-soil inclinometers were located at about the same distance from the 117
excavation, the in-soil inclinometer readings could be reasonably assumed as the 118
green field lateral soil movements. Green field soil movements are the natural 119
behavior of soil movement patterns in the absence of a pile. Prior to Day 14, the 120
differences in lateral pile deflections and soil movements seemed insignificant. 121
However, after Day 14, it was evident that the lateral soil movement exceeded 122
the pile deflection within the top 10 m soft marine clay layer. The difference between 123
soil movement and pile deflection became more significant as excavation progresses. 124
At this stage, large-strain shear deformations were experienced by the soft clay as the 125
propped sheet pile wall failed in mitigating the lateral soil movements triggered by the 126
soil slip and also active lateral soil stress had been fully mobilized. Therefore, 127
increasingly more soils became plastic and subsequently flowed past the piles as 128
evidenced by the increasingly larger lateral soil movements especially after the 129
excavation had reached at least 5 m, as shown in Fig. 8. 130
Ultimate and cracking moment capacities of pile 131
As concrete is weak against tension, the concrete in the bored piles is expected 132
to crack when subject to large bending strain. As the bending rigidity (EI) of cracked 133
concrete would be smaller than that of uncracked concrete, the interpretation of 134

6
bending moment along the pile would depend on the magnitudes of the bending 135
rigidity of concrete at different stages. 136
As the soil slip was not anticipated in the pile design, only nominal 0.5% steel 137
reinforcement (ultimate tensile strength 410 N/mm2) was provided in the piles. For a 138
900-mm diameter bored pile, its ultimate bending moment capacity, Mult, is 139
determined to be about 520 kNm. On the other hand, the cracking moment, Mcr, of the 140
pile can be calculated by Eq. (1) according to Kong and Evans (1987) 141
Mcr = fctZ (1) 142
where 143
fct = tensile strength of concrete in flexure or the modulus of rupture of concrete and 144
equal to 0.623f’c0.5
(MPa) 145
f’c = characteristic strength of concrete Grade 35 (MPa), 146
Z = section modulus (=Ig/y) 147
Ig = gross moment of inertia 148
y = distance from the centroid of the section to the extreme fiber in tension 149
For the 900-mm diameter bored piles, its cracking moment is determined to be 264 150
kNm, which is about half of the pile ultimate moment value. Initial cracks would 151
develop along the pile once the cracking moment is reached. 152
Moment of inertia 153
Gross or uncracked moment of inertia, Ig 154
A pile nominally reinforced with 0.5% steel can be considered as a lightly 155
reinforced pile. Branson (1977) established that for lightly reinforced concrete 156
structures, the gross moment of inertia, Ig of the section can be used without 157
considering the contribution of the steel reinforcement. The Ig for a circular section is 158
given by 159

7
4
64g
dI
(2) 160
Fully cracked moment of inertia, Icr 161
As there is already a reliable equation developed by Kong and Evans (1987) to 162
calculate the cracked moment of inertia, Icr, of a rectangular beam section, it is thus 163
assumed that the fully cracked moment of inertia, Icr for the circular bored pile can be 164
similarly represented based on the principle of conservation of cross-sectional area. 165
For a fully cracked section, the stresses in the steel and concrete are assumed to be 166
proportional to strain. The cracked moment of inertia, Icr, of a rectangular section is 167
given by Kong and Evans (1987) as follows 168
3 2 2
3 1 '1 '
3cr e e
x x x dI bd
d d d d
(3) 169
where 170
se
c
E
E (modular ratio) 171
sA
bd (ratio of compression steel) 172
'
' sA
bd (ratio of tension steel) 173
d = effective depth 174
d’ = depth from compression zone to centroid of compression steel 175
x = depth of neutral axis 176
b = width of concrete section 177
According to Eqs. (2) and (3), the Ig and Icr of the 900-mm bored pile are 178
0.03221 m4 and 0.00607 m
4, respectively. 179
Effective moment of inertia, Ie 180

8
Bending moment is induced on a pile when subject to lateral soil movement. If 181
the bending moment exceeds the cracking moment, Mcr, of the pile, cracks would start 182
to develop. Nevertheless, the depth and width of cracks may vary, depending on the 183
final bending moment distribution along the pile. As such, the moment of inertia for 184
this partially cracked section is somewhat between Ig and Icr values. Therefore, an 185
effective moment of inertia, Ie, should be employed in the analysis of a partially 186
cracked section. By adopting an empirical equation proposed by Branson (1977), 187
Reese (1997) provided values of effective moment of inertia, Ie, that would reduce 188
gradually with increasing bending moment as follows 189
3 3
1cr cre g cr g
M MI I I I
M M
(4) 190
where Mcr and M are the cracking moment and applied moment, respectively. 191
Curvature of pile shaft 192
In the present study, the strain gages were fastened at the opposite faces of the 193
reinforcement cage and perpendicular to the excavation. As strain is a function of the 194
stress and the Young’s modulus of steel, Es, the curvature, of the pile can be 195
obtained from the sum (if different signs) or difference (if similar signs) in the 196
measured tensile strains, t, and compressive strain, c, of the steel reinforcement 197
divided by the distance between them (Poh et al. 1999) 198
'
t c
d d
(5) 199
The 75-mm diameter in-pile inclinometer tube was fastened to the bored pile 200
reinforcement cage so that both the in-pile inclinometer tube and the pile would 201
deflect in unison when subject to lateral displacement. This would then provide a 202

9
near-continuous set of data of pile curvature so as to deduce a more accurate and 203
consistent bending moment profile. 204
In general, inclinometer readings are more reliable in determining the back-205
analyzed bending moments as compared to strain gage readings, as the inclinometer 206
readings obtained along a pile are near-continuous. Poh et al. (1999) established that 207
high order polynomials are necessary to fit the measured pile deflection profiles. In 208
the present study, a 7th
order polynomial function is found to be sufficient to obtain a 209
good fit between the measured and fitted deflection profiles. Subsequently, 210
differentiating the pile deflection profile twice would give the curvature along the 211
pile. 212
Procedure to determine pile bending moment 213
With the curvature and the bending stiffness of the pile determined, the 214
bending moment, M, can be calculated based on Macaulay’s method (Kong and 215
Evans, 1987) as follows 216
M = EcIe (6) 217
In computing the bending stiffness, the value of Young’s modulus Ec is assumed to 218
remain constant (Reese, 1997). The Ec for concrete used is taken as 32 GPa. 219
As both M and Ie are mutually dependent [Eqs. (4) and (6)], an iterative 220
process is performed to obtain the two parameters. Starting from Ig, this value is then 221
substituted in Eq. (6) (where Ie=Ig). The M value obtained is then substituted in Eq. 222
(4). The Ie value obtained is substituted back in Eq. (6). These iterative steps are 223
repeated until both M and Ie register no further changes in values. This process is 224
repeated for all other elevations until the entire bending moment profile is determined. 225

10
Fig. 9 shows several computed profiles of Ie values along the length of the 226
instrumented rear pile when subject to increasing lateral soil movements for various 227
construction activities outlined in Fig. 5. Fig. 9 reveals some important observations: 228
a) On Day 0, when the 3.5 m deep excavated slope failed in front of the instrumented 229
pile group, considerable increase in pile lateral deflections was observed all the 230
way down to about 13 m depth. This depth corresponds to the soft marine clay 231
(N<4) and loose clayey sand (N<10) strata. The lateral soil movements diminished 232
beneath 13 m depth when medium dense to dense sand (30<N<50) was 233
encountered. 234
b) The rate of decrease of Ie values with respect to depth was the largest up to about 235
6 m depth which coincided with the final excavation depth in front of the 236
instrumented pile. Within this depth, the development of cracks in the pile 237
increased with increasing excavation depth owing to increasing lateral soft clay 238
movements. 239
c) Consistent patterns of concave (curved inwards) Ie profiles are observed between 240
depths of about 10 m and 17 m that correspond to the distinct change in soil layers 241
from loose clayey sand (N=5) to dense sand (N=38). This aspect will be further 242
addressed in the subsequent analysis of pile bending moment. 243
d) Further to the above observations, the rear pile seems to experience negative 244
deflection (kick-back) within the dense and very dense sand strata. The pile kick-245
back has an average magnitude of 2.6 mm with a maximum value of 3.8 mm. It 246
would seem that cracks along the pile in this region may have just been initiated, 247
presumably due to the mobilization of passive resistances to resist the increasing 248
lateral soil movements experienced by the upper portion of the pile. 249
Equivalent effective moment of inertia, Ie(equiv) 250

11
As cracks gradually develop along the pile due to increase in excavation depth 251
and thus increase in lateral soil movement, the moment of inertia of the pile is 252
expected to deteriorate further. An “equivalent” or representative average Ie(equiv) value 253
on a particular day can be determined using the average Ie values obtained between 254
Day 0 of soil slip and the day of interest. Table 1 reveals that the magnitudes of the 255
calculated Ie(equiv) values based on the iterative calculation process described earlier, 256
decrease over time due to increasing lateral soil movement imposed on the pile. Such 257
a method has also been successfully used by Reese (1997) to analyze the crack 258
behavior of laterally loaded piles. In many practical situations, the zone of maximum 259
bending moment may occupy only a small fraction of the pile length. Reese (1997) 260
reported that the errors due to the use of constant equivalent EI in the majority of 261
regions of lower bending moment were deemed to be small. As such, the average 262
Ie(equiv) method shall be used in subsequent sections to back-analyze the effect of 263
lateral soil movement on the pile using a well-established numerical method. 264
Minimum deflection and bending moment initiating pile cracks 265
As stated earlier, the cracking moment for the 900-mm diameter bored piles is 266
determined to be 264 kNm. By differentiating the appropriate measured pile 267
deflection profile twice, the corresponding pile bending moment profile that initiates 268
cracking can thus be back-analyzed as shown in Fig. 10. It is observed that the 269
maximum positive pile bending moment occurs at 13.5 m depth which coincides with 270
the distinct soil interface between depths of 10 m and 13.5 m as described earlier. At 271
this soil interface, it is expected that the pile curvature changes abruptly due to a 272
distinct increase in soil stiffness, thus inducing the maximum pile bending moment. 273
Typically, pile heads are tied to the pile cap with relatively high percentage of 274
steel. Therefore, despite experiencing bigger negative bending moment at the pile cap 275

12
level as evidenced in Fig. 10, this is often not as critical as the maximum positive 276
bending moment developed along the lower pile shaft with only nominal steel 277
reinforcement. 278
Observation of different degrees of cracking along pile length 279
Different degrees of cracking along the length of the pile can be demonstrated 280
in Fig. 11, whereby the ratio of the back-analyzed bending moment, M and the 281
cracking moment, Mcr is plotted against the ratio of the measured deflection, D and 282
the initial deflection at the onset of cracking, Di at various elevations for the back-283
analyzed pile responses between Day 0 and Day 37. 284
It is evident that three distinct zones can be identified from Fig. 11. Zone 1 can 285
be identified as the zone whereby the pile experiences minimal cracking. This 286
coincides with data points measured at 15 m depth with dense clayey sand layer 287
having N value between 29 and 50. The higher resistance offered by the sand and the 288
attenuated lateral soil movements prevents the pile from being deflected excessively. 289
The measured data points in Zone 2 are obtained from the pile responses at 290
depths of 3 m, 5 m and 9 m. It is evident that these data points are somewhat nestled 291
between the two extremes of Zones 1 and 3. These depths are dominated by the soft 292
marine clay with little soil resistance as compared to that of the sand in Zone 1. It is 293
deduced that cracking of the pile material is on-going for this zone. 294
Zone 3 represents the measured data points obtained from the pile responses at 295
depth of 12.5 m, which approximately coincides with the soil interface as described 296
earlier where maximum pile bending moment develops. As such the M/Mcr and D/Di 297
ratios are the greatest in Zone 3 as compared to those in Zones 1 and 2. 298
The pile behavior at different degrees of cracking shown in Fig. 11 shows 299
similar trends as those reported by Branson (1977). This bilinear moment-deflection 300

13
curve suggests that the pile moment capacity reduces with increasing load levels and 301
the pile deflection increases in tandem with increasing degree of cracking of the pile 302
material. This would transform the relevant segment of the pile from an initial 303
uncracked pile (Zone 1) with minimal cracking to that of an intermediately cracked 304
pile segment (Zone 2) and finally to a fully cracked pile segment (Zone 3) whereby 305
significant cracking has taken place. 306
Based on the understanding above, the cracked pile can be physically 307
represented in a schematic plot as shown in Fig. 12(a) after having experienced lateral 308
soil movements for 37 days. In this case, the concrete between cracks may still be 309
capable of carrying some tension. As a result, the actual effective moment of inertia, 310
Ie, will be somewhat in between the uncracked, Ig, and the fully cracked, Icr values. 311
Branson (1977) mentioned that in such a situation, the moment of inertia used to 312
represent the entire pile would be the average effective moment of inertia, Ie. The 313
significance of using an average Ie value for the entire pile length is to ensure a 314
smooth bending moment profile. Such a method has also been used by Reese (1997) 315
to analyse the cracking behaviour of laterally loaded piles. The method used by Reese 316
(1997) employed the average observed deflection, the applied loading and iteration to 317
find the values of the average EI and the corresponding values of maximum bending 318
moment that fitted the results. Therefore, the average Ie(equiv) values that have been 319
determined in Table 1 will now be used in the numerical back-analysis. The concept 320
of transforming the various moment inertia values of a pile due to varying crack 321
intensities to its idealized, single equivalent Ie(equiv) value for back-analysis purpose, is 322
further illustrated in Fig. 12(b). 323

14
Numerical analysis 324
The numerical method developed by Chow and Yong (1996) as described in 325
detail in Ong et al. (2006) is used to back-analyze the measured field results. The pile 326
is modeled as a series of linear elastic beam and the soil is idealized using the 327
modulus of subgrade reaction. The numerical analysis requires the knowledge of the 328
pile flexural rigidity, EpIp, the limiting soil pressures, py that acts on the pile, the 329
distribution of lateral soil stiffness, Kh with depth and the lateral soil movement 330
profile at the pile location. The rigidity of the pile cap is determined to be 2.7x10⁷ 331
kNm2. The modulus of elasticity for concrete, Ec, used is 32,040 MPa, while the 332
moment of inertia values with respect to elapsed number of days can be found in 333
Table 1. 334
In most practical situations, the post-excavation vane shear strength profiles are 335
usually not available. Leung et al. (2006) reported that the normalized limiting soil 336
stress coefficient Pn for piles subject to lateral soil movement along the pile shaft is 337
lower and as given in Eq. (7) (unlike piles subject to lateral load at or above the 338
ground level). 339
Pn = py/cu = 6 (7) 340
where 341
py = limiting soil stress 342
cu = pre-excavation vane shear strength. 343
The problem in hand is very similar to the centrifuge model study reported by 344
Leung et al. (2006) as both cases involve large-strain soil movement due to 345
excavation failure in soft clay. The Singapore marine clay is modeled as having pre-346
excavation vane shear strength, cu, of 0.25’vo, where ’vo is the effective overburden 347
stress. 348

15
The distribution of lateral soil stiffness with depth, Kh, is assumed to be 349
related to the Young’s modulus of the soil, Es, (Chow and Yong 1996), as shown in 350
Eq. (8). 351
Kh Es (8) 352
For lateral loading, Es of clay is assumed to range from 150 cu to 400 cu 353
(Poulos and Davis 1980). In the present back analysis, Es is taken as 300 cu. 354
Subsequent analyses reveal that the numerical calculation is not sensitive to the 355
magnitude of Es/cu as the problem in hand involves large-strain soil movement. 356
Instead, the more sensitive parameter would be the Pn ratio adopted in Eq. (7). 357
The input green field soil movement profiles are obtained from the in-soil 358
inclinometer readings shown in Fig. 7(b). However, based on the study of Ong et al. 359
(2009) and Lim (2001), a soil moderation factor should be considered for the rear 360
piles. Since the soil movement occurred first at the location nearer to the excavation 361
face, the front piles tend to shield the rear piles from the increasing soil movements 362
due to excavation. The progressive soil movements acting first on the front pile and 363
later on the rear pile have been captured schematically in Fig. 5. In the back-analysis 364
of centrifuge test results under similar soil and pile configuration, Ong et al. (2009) 365
established that a soil moderation factor of 0.7 should be applied to the soil movement 366
profile for the rear pile. 367
The evaluation of limiting soil stress, py and the concept of average equivalent 368
effective moment of inertia, Ie(equiv) described above, shall now be validated using the 369
numerical method mentioned earlier. 370
Calculated pile responses 371
Figs. 13 and 14 show a comparison of measured and predicted pile bending 372
moment and deflection profiles due to lateral soil movement from Day -1 to Day 14, 373

16
and from Day 16 to Day 36, respectively. In general, it can be observed that the 374
shapes of the profiles and the locations of their maxima are in good agreement. It is 375
noted that the numerical prediction generally under-estimates the maximum negative 376
bending moment values at the pile cap level. The measured maximum negative 377
bending moments are much higher due to the stiffening effect caused by the provision 378
of greater steel reinforcement to connect the pile head to the pile cap during 379
construction. However, this stiffening effect could not be exactly modeled in the 380
numerical back-analysis. 381
Since there is no in-pile inclinometer in the front pile, only discrete bending 382
moment values measured by the strain gages are plotted for comparison in Figs. 13 383
and 14. The measured average strain gage readings used for the bending moment 384
interpretation are shown in Table 2. The measured bending moment values show 385
reasonably good agreement with the bending moment profiles predicted using the 386
numerical method. 387
Figs. 13 and 14 also show the measured deflection profiles of the rear pile, 388
which was instrumented with an in-pile inclinometer. It is observed that the shapes of 389
the measured and predicted rear pile deflection profiles are generally in good 390
agreement. Nonetheless, it has also been found that the rear pile deflection profiles 391
have been slightly under-predicted between Day -1 and Day 14 (see Fig. 13), but 392
slightly over-estimated between Day 16 and Day 36 (see Fig. 14). It is established that 393
the accuracy of the calculated pile deflection profiles depends on the soil moderation 394
factor used in the numerical back-analysis. Therefore, it is to be acknowledged that 395
the value of 0.7 currently adopted seems to be a suitable average value to produce 396
comparable predicted pile deflection profiles for all the calculated Ie values in this 397
study. 398

17
For the sake of completeness, the calculated front pile deflection profiles are 399
also included in Figs. 13 and 14. However, no comparison could be made because the 400
front pile was not instrumented with an in-pile inclinometer. 401
Before Day 15 402
For relatively small lateral soil movements, Ong et al. (2006) reported that the 403
calculated pile responses depend more on the values of bending stiffness EcI adopted. 404
Since the calculated and measured pile bending moments and deflections are 405
generally comparable as illustrated in Fig. 13, the credibility of the computed average 406
Ie(equiv) values proposed in Table 1 (assuming Ec to be constant) used for the numerical 407
back-analysis is therefore justified. 408
From Day 16 onwards 409
It was evident from Fig. 8 that from Day 15 onwards, the 9 m thick soft clay 410
had moved ahead of the pile. This relative movement was more pronounced 411
especially for the first 6 m soft clay stratum, which also coincided with the 5 m 412
excavation depth. This important observation points to the onset of the soil flow 413
phenomenon, where the soil stresses are expected to have reached their limiting 414
values. Such phenomenon had been observed and documented by Leung et al. (2006), 415
thus justifying the use of Pn value of 6 in the numerical analysis, whereby reasonably 416
good agreement between calculated and measured pile responses had been 417
demonstrated (see Fig. 14). 418
Therefore from Day 15 onwards, it is strongly believed that the pile has fully 419
cracked at the Zone 3 segment as a result of increasingly larger lateral soil 420
movements. This observation is also supported by the fact that when Icr is used in the 421
numerical analysis from Day 15 onwards, reasonably good comparison between 422
calculated and measured pile responses can be observed, as demonstrated in Fig. 14. 423

18
Fig. 14 also evidently shows that the ultimate rear pile bending moment (520 424
kNm) is exceeded between Day 23 and Day 30. This postulation signifies that the 425
instrumented pile group was damaged by the excessive soil movement caused by the 426
failure of the clay slope. Therefore, the pile group is deemed unfit to carry the 427
designed column load and a replacement pile group is indeed necessary. In this case 428
study, the mobilization of pile axial load as a result of the soil movement could not be 429
practically measured from the current instrumentation program. Also, the numerical 430
method did not consider the possible development of additional axial load due to the 431
soil movement. Through observation, the soil movement occurred more significantly 432
in the lateral direction than the vertical direction. As such, it is expected that the 433
increase in the pile axial load will not be significant. 434
In summary, Fig. 15 shows the deterioration of the pile moment of inertia 435
from an initially uncracked pile to a partially cracked pile and finally to a totally 436
cracked pile due to increasing lateral soil movement as the excavation depth 437
increased. When localized excavation was carried out between Day 8 and Day 14 to 438
expose some pile heads at the toe of the slope, the deterioration of the instrumented 439
pile moment of inertia was minimal. Subsequently, when further slope excavation was 440
carried out between Day 15 and Day 18, it was observed that the deterioration of pile 441
moment of inertia continued, but at a much faster rate. Finally, Icr was reached after 442
16 days of excavation since the soil slip. From Fig. 15, it is obvious that the pile 443
moment of inertia varies due to cracking as a result of the progressive soil movements 444
experienced by the clay slope. If the variations in pile moment of inertia are not 445
considered in the analysis, the pile bending moment will be over-predicted and the 446
pile deflection will be under-predicted since the pile is assumed to be stiffer than what 447

19
it is (Ong et al., 2010). This will result in an unrealistic and over-conservative back-448
analysis. 449
Conclusions 450
The pre- and post-failure behaviors of a full-scale instrumented cast in-situ 451
concrete 4-pile group subject to excessive lateral soil movement triggered by a slope 452
failure are investigated in detail in this paper. The pile undergoes transformation from 453
initially an uncracked pile to one that is partially cracked and finally to a fully cracked 454
pile, due to large-strain lateral soil movement acting on the pile group over the 455
excavation period. With the progressive development of cracks along the pile, the 456
present study details a procedure in determining suitable average equivalent effective 457
moment of inertia, Ie(equiv) values for use in the back-analysis of the field data. 458
It is established that the computed Ie(equiv) values and the normalized limiting ratio 459
of soil stress to vane shear strength, Pn, ratio of 6 as recommended by Leung et al. 460
(2006), are suitable to be employed in the numerical method adopting the green field 461
lateral soil movements to predict the behavior of the pile group subject to increasing 462
lateral soil movements. With reasonably good agreement between the measured and 463
predicted pile bending moment as well as deflection profiles, it thus reflects the 464
validity of combining the concepts of Ie(equiv) and Pn. The consistency of the measured 465
pile behavior in the field with the results of the centrifuge tests conducted by Ong et 466
al. (2006, 2009) and Leung et al. (2006) has further reinforced the understanding of 467
the concept of soil limiting stress and the corresponding behavior of piles subject to 468
lateral soil movements. 469
References 470
Branson, D. E. (1977). Deformation of concrete structures. New York: McGraw-Hill. 471

20
472
Chow, Y. K. and Yong, K. Y. (1996). “Analysis of piles subject to lateral soil 473
movements.” J. Inst. of Eng. Singapore, 36 (2), pp. 43-49. 474
475
Kong, F. K. and Evans, R. H. (1987). Reinforced and prestressed concrete. 3rd
476
Edition. Van Nostrand Reinhold (U.K.) Co. Ltd. 477
478
Leung, C. F., Ong, D. E. L., and Chow, Y. K. (2006). “Pile behavior due to 479
excavation-induced soil movement in clay. II: Collapsed wall.” J. Geotech. 480
Geoenviron. Eng., 132(1), pp. 45-53. 481
482
Lim, J. K. (2001). “Behaviour of piles subject to excavation-induced soil movement.” 483
M.Eng Thesis, National University of Singapore. 484
485
Ong, D. E. L., Leung, C. F. and Chow, Y. K. (2006). “Pile behavior due to 486
excavation-induced soil movement in clay. I: Stable wall.” J. Geotech. Geoenviron. 487
Eng., 132(1), pp. 36-44. 488
489
Ong, D. E. L., Leung, C. F. and Chow, Y. K. (2009). “Behavior of Pile Groups 490
Subject to Excavation-Induced Soil Movement in Very Soft Clay”. J. Geotech. 491
Geoenviron. Eng., 135(10), pp. 1462-1474. 492
493
Ong, D. E. L., Leung, C. F. and Chow, Y. K. (2010). “Effect of limiting soil pressure 494
on pile group adjacent to a failed excavation”. Proc. of Int. Conf. on Geotechnical 495
Challenges in Megacities, Moscow, Russia, Vol. 3, pp. 785-792. 496
21
497
Ong, D. E. L., Leung, C. F. and Chow, Y. K. (2011). “Behavior of Pile Groups 498
Subject to Excavation-Induced Soil Movement in Very Soft Clay”. Discussion by F. 499
Castelli & Closure, J. Geotech. Geoenviron. Eng., 137(1), pp. 110-113. 500
501
Poh, T. Y., Goh, A. T. C., Wong K. S., Wong, I. H. and Poh, K. B. (1999). 502
“Determination of BM in diaphragm wall.” Field Measurements in Geomechanics, 503
Singapore, pp. 229-234. 504
505
Poulos, H. G., and Davis, E. H. (1980). Pile foundation analysis and design. John 506
Wiley & Sons, New York. 507
508
Reese, L. C. (1997). "Analysis of laterally loaded piles in weak rock”. J. Geotech. 509
Geoenviron. Eng., 33(11), pp. 1010-1017. 510

Table 1. Computed average equivalent effective moment of inertia, Ie(equiv) and
fully cracked moment of inertia, Icr
No. of days after first
soil slip
Computed moment of inertia,
I (m4)
Day -1 Ie(equiv) = 0.01921
Day 1 Ie(equiv) = 0.01486
Day 9 Ie(equiv) = 0.01003
Day 14 Ie(equiv) = 0.01000
Day 16
Icr= 0.00616
Day 18
Day 19
Day 23
Day 30
Table 1

Table 2. Measured average strain gage readings used for bending moment interpretation
Average Strain, Ɛ
Depth of strain gage in instrumented Rear Pile Depth of strain gage in instrumented Front Pile
6m 8m 9m 11m
6m 8m 9m 11m
Day -1 2.55E-05 2.15E-05 -2.08E-04 3.17E-04 -4.50E-06 -1.10E-05 -1.39E-04 2.35E-05
Day 1 1.90E-05 2.95E-05 -3.02E-04 -7.55E-05
-1.60E-05 1.22E-04 -1.12E-04 6.40E-05
Day 9 -2.66E-04 2.98E-04 4.09E-04 6.69E-04
-1.33E-03 6.40E-05 -8.05E-05 1.05E-04
Day 14 -6.69E-04 2.11E-04 4.11E-04 5.18E-04
-1.48E-03 -4.71E-04 -1.03E-04 1.14E-04
Day 16 -6.66E-04 2.22E-04 2.84E-04 8.10E-04
-1.52E-03 -7.00E-04 -8.85E-05 1.24E-04
Day 18 -6.74E-04 1.93E-04 3.97E-04 9.93E-04
-1.64E-03 -1.11E-03 -3.55E-05 9.45E-05
Day 23 -9.51E-04 2.50E-06 4.03E-04 1.19E-03
-1.71E-03 -1.70E-03 -1.25E-05 -4.25E-04
Day 30 -9.84E-04 -8.30E-04 4.11E-04 1.02E-03
-2.01E-03 -2.19E-03 5.60E-05 -1.01E-03
Day 36 -1.11E-03 -2.67E-03 3.29E-04 1.02E-03 -3.08E-03 -2.17E-03 -4.94E-04 -1.03E-03
Table 2

Fig. 1. Plan view showing the locations of instruments and instrumented pile group at the site
Figure 1

Fig. 2. Interpreted subsurface soil profile at site
Figure 2

Fig. 3. Plan and elevation views of instrumented pile group with respect to the slope excavation
Figure 3

Fig. 4. Layout of instruments attached to reinforcement cages of the bored piles
Figure 4

Stage Day Key Event Construction Sequence
1 Day 0 Soil slip occurred
2 Days 1-7 Soil movement due to excavation of slope, sheet pile installed
3 Days 8-14
Localized excavation to expose installed pile heads
4 Days 15-18
Further excavation to 5.0m depth
5 Days 19-21
Further excavation to 5.5m depth & temporary struts installed
6 Days 22-29
Further excavation to 6.0m depth
7 Days 30-62
Casting of pile caps & further works
8 Day 63 Backfilling works
Fig. 5. Timeline of excavation works
Figure 5

Fig. 6. Slope failure that unexpectedly occurred next to the instrumented pile group (Day 0)
Failed slope
Instrumented pile group
Figure 6

Fig. 7. Measured (a) rear pile deflection and (b) lateral soil movement profiles over the excavation period
Figure 7

Fig. 8. Measured lateral pile deflection and soil movements at various depths over the excavation period
Figure 8

Fig. 9. Computed profiles of effective moment of inertia, Ie along the instrumented rear pile over the excavation
Figure 9
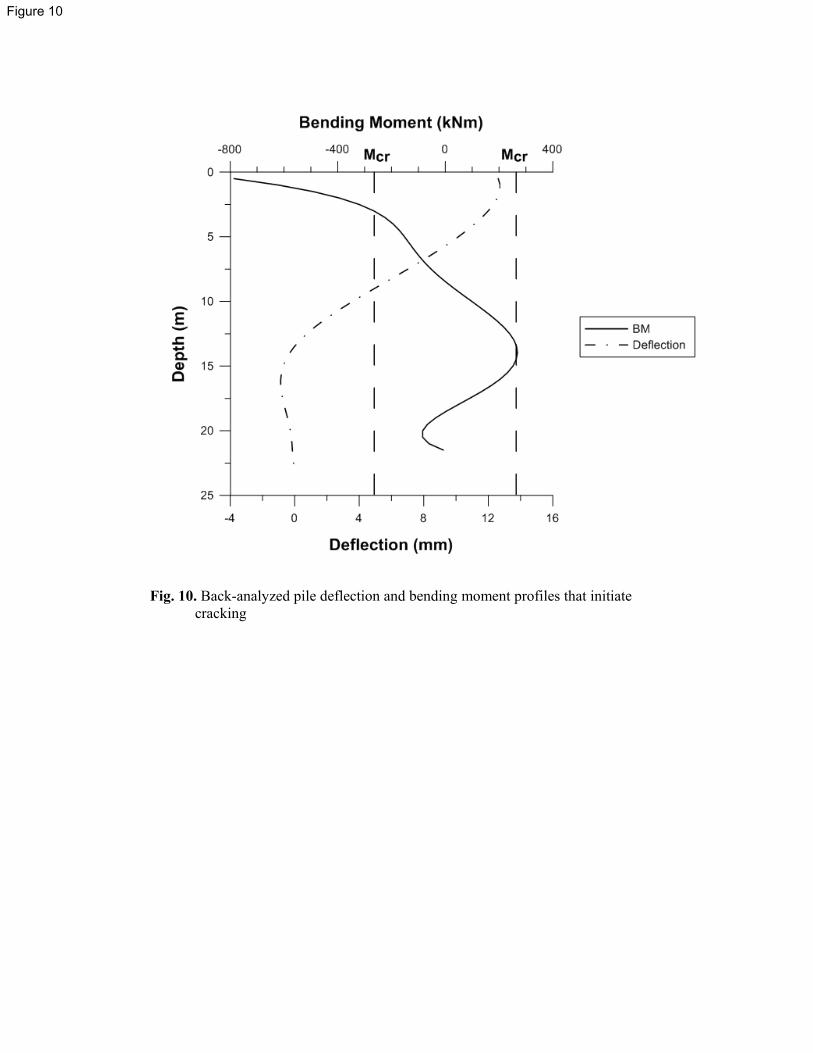
Fig. 10. Back-analyzed pile deflection and bending moment profiles that initiate cracking
Figure 10

Fig. 11. Interpreted bi-linear moment-deflection curve
Figure 11

Fig. 12. (a) Possible development of different crack intensities on the instrumented pile and (b) an idealized cracked pile used for back-analysis
(a) (b)Irregularly cracked pile represented by various Ie values
Uniformly cracked pile represented by a single equivalent Ie (equiv) value
Depth (m)
0
5
10
15
20
25
Ie Ie (equiv)
Zone 2: Segment of pile is cracking
Zone 3: Segment of pile is fully cracked
Zone 1: Segment of pile is mostly uncracked
30
Figure 12

Fig. 13. Selected measured and predicted pile bending moment and deflection profiles based on computed average Ie(equiv) before and on Day 14
Day14
30
25
20
15
10
5
0
30
25
20
15
10
5
0
30
25
20
15
10
5
0
Bending Moment (kNm)
30
25
20
15
10
5
0
Deflection (mm)
Bending Moment (kNm)
Measured - Rear pilePredicted - Rear pilePredicted - Front pile
Predicted
Measured - SG Front pile
Measured - SG Rear pile
Measured - Inclinometer Rear pile
Day 1
Day 9
Day -1 (1 day before first soil slip)
Rear pile
Front pile
Figure 13

Fig. 14. Selected measured and predicted pile bending moment and deflection profiles based on Icr after Day 15
Day 30
Day 16
Day 18
Day 23
Day 36
30
25
20
15
10
5
0
Dep
th (m
)
30
25
20
15
10
5
0
Dep
th (m
)
30
25
20
15
10
5
0
Dep
th (m
)
30
25
20
15
10
5
0
Dep
th (m
)
-200
0
-150
0
-100
0
-500 0
500
1000
1500
Bending Moment (kNm)
30
25
20
15
10
5
0
Dep
th (m
)
-50 0 50 100
150
200
250
Deflection (mm)
-200
0
-150
0
-100
0
-500 0
500
1000
1500
Bending Moment (kNm)
Measured - Rear pilePredicted - Rear pilePredicted - Front pile
Predicted
Measured - SG Front pile
Measured - SG Rear pile
Measured - Inclinometer Rear pile
Rear pile
Front pile
Figure 14

Fig. 15. Deterioration of pile moment of inertia after soil slip
Construction stage: 1 2 3 4 5 6 7
Excavation commences
Localized excavation to expose pile heads
Rate of reduction Ie/day is greater
Ig = 0.03221 m4
Icr = 0.00607 m4
Variation of Ie
Interpolated
Figure 15

List of Figures
Fig. 1. Plan view showing the locations of instruments and instrumented pile
group at the site
Fig. 2. Interpreted subsurface soil profile at site
Fig. 3. Plan and elevation views of instrumented pile group with respect to the slope
excavation
Fig. 4. Layout of instruments attached to reinforcement cages of the bored piles
Fig. 5. Timeline of excavation works
Fig. 6. Slope failure that unexpectedly occurred next to the instrumented pile group
(Day 0)
Fig. 7. Measured (a) rear pile deflection and (b) lateral soil movement profiles over the
excavation period
Fig. 8. Measured lateral pile deflection and soil movements at various depths over the
excavation period
Fig. 9. Computed profiles of effective moment of inertia, Ie along the instrumented rear pile
over the excavation period
Fig. 10. Back-analyzed pile deflection and bending moment profiles that initiate cracking
Fig. 11. Interpreted bi-linear moment-deflection curve
Fig. 12. (a) Possible development of different crack intensities on the instrumented pile and
(b) an idealized cracked pile used for back-analysis
Fig. 13. Selected measured and predicted pile bending moment and deflection profiles
based on computed average Ie(equiv) before and on Day 14
Fig. 14. Selected measured and predicted pile bending moment and deflection profiles
based on Icr after Day 15
Fig. 15. Deterioration of pile moment of inertia after soil slip
Figure Caption List

List of Tables
Table 1. Computed average equivalent effective moment of inertia, Ie(equiv) and
fully cracked moment of inertia, Icr
Table 2. Measured average strain gage readings used for bending moment interpretation