manual - cross-impact
TRANSCRIPT

ScenarioWizard 4.3
Constructing Consistent Scenarios Using Cross-Impact Balance Analysis
Manual
Wolfgang Weimer-Jehle
2018

ZIRIUS
Stuttgart Research Center for Interdisciplinary Risk and Innovation Studies
University of Stuttgart
Seidenstr. 36
70174 Stuttgart
Germany
www.zirius.eu
Contact:
Dr. Wolfgang Weimer-Jehle
Tel. ++49 (0)711 685-84301

ScenarioWizard 4.3 1
Contents
1 Preface ............................................................................................................................................ 6
2 Introduction to CIB ......................................................................................................................... 7
2.1 Purpose of the CIB method .................................................................................................... 7
2.2 The CIB approach ................................................................................................................... 8
2.3 The CIB algorithm ................................................................................................................... 8
2.3.1 Structure of a cross-impact matrix .................................................................................... 9
2.3.2 Recognizing the inconsistencies of a scenario ................................................................. 11
2.3.3 Consistent scenarios ........................................................................................................ 13
3 Installation .................................................................................................................................... 15
4 Getting started with ScenarioWizard ........................................................................................... 17
4.1 Overview .............................................................................................................................. 17
4.2 A simple analysis - step by step ........................................................................................... 18
5 Generating and handling a project file ......................................................................................... 23
5.1 Overview .............................................................................................................................. 23
5.2 Loading and storing a project file ........................................................................................ 23
5.3 Generating an analysis structure ......................................................................................... 24
5.4 Entering descriptor comments ............................................................................................ 26
5.5 Assigning colors to the descriptor variants .......................................................................... 27
5.6 Editing an analysis structure ................................................................................................ 28
5.7 Displaying and editing cross-impact data using the matrix editor ...................................... 30
5.8 Entering cross-impact comments in the matrix editor ........................................................ 33
5.9 Entering and editing cross-impact data using the section editor ..................................... 35
5.10 Standardization .................................................................................................................... 39
5.11 Factor multiplication ............................................................................................................ 39
5.12 Transpose ............................................................................................................................. 40
5.13 Generating a random matrix................................................................................................ 41
5.14 Exporting a cross-impact matrix .......................................................................................... 42
5.15 Importing a cross-impact matrix .......................................................................................... 43
5.16 Importing dzl and cim data .................................................................................................. 43
5.17 Workbooks ........................................................................................................................... 44
5.18 Displaying project information ............................................................................................ 46
6 Evaluating a cross-impact matrix .................................................................................................. 47
6.1 Calculating a system-grid ..................................................................................................... 47
6.2 Analysing the impact balances of a scenario ....................................................................... 49
6.3 Generating an automatic scenario report ........................................................................... 54
6.4 Computing consistent scenarios .......................................................................................... 58
6.5 Generating a scenario tableau ............................................................................................. 66
6.6 The Selection Manager ........................................................................................................ 68
6.7 Forcing descriptor variants .................................................................................................. 70
6.8 Ensemble evaluations .......................................................................................................... 72

ScenarioWizard 4.3 2
6.9 Ensemble mode and workbooks .......................................................................................... 77
6.10 Statistics ............................................................................................................................... 78
6.11 Pathway analysis .................................................................................................................. 80
6.12 Correlations .......................................................................................................................... 83
6.13 Influence profile ................................................................................................................... 86
7 Options ......................................................................................................................................... 89
7.1 Evaluation options ............................................................................................................... 89
7.2 Output options ..................................................................................................................... 94
7.3 Descriptor types ................................................................................................................... 98
7.4 System reset ....................................................................................................................... 101
7.5 Language selection ............................................................................................................. 102
8 The Presenter ............................................................................................................................. 103
8.1 Chapter "About"................................................................................................................. 104
8.2 Chapter "Descriptors" ........................................................................................................ 106
8.3 Chapter "Database" ........................................................................................................... 108
8.4 Chapter "Scenario Tableau" ............................................................................................... 111
8.5 Chapter "Inside the Scenarios" .......................................................................................... 112
8.6 Chapter "My Scenario" ...................................................................................................... 117
9 Limitations .................................................................................................................................. 118
10 Acknowledgements .................................................................................................................... 119
11 End User Licence Agreement (EULA) .......................................................................................... 120
12 Glossary ...................................................................................................................................... 122
Appendix .............................................................................................................................................. 128
Appendix 1: The scw file format ..................................................................................................... 129
Appendix 2: Formating csv import-files .......................................................................................... 133
Appendix 3: The heuristic used by the Selection Manager............................................................. 134

ScenarioWizard 4.3 3
List of figures
Fig. 2-1: A simple impact network ........................................................................................................... 9
Fig. 2-2: A cross-impact matrix .............................................................................................................. 10
Fig. 2-3: The impact balance of a scenario. ........................................................................................... 11
Fig. 2-4: The consistent scenarios of Fig. 2-2......................................................................................... 13
Fig. 2-5: The impact balance of scenario VI. .......................................................................................... 14
Fig. 4-1: The basic functions of ScenarioWizard can be found on the toolbar. .................................... 18
Fig. 4-2: The analysis structure of the „Somewhereland“ exercise displayed in the structure editor. 19
Fig. 4-3: The cim editor. ......................................................................................................................... 20
Fig. 4-4: The evaluation protocol displaying consistent scenarios. ....................................................... 21
Fig. 4-5: Extract of an automatic scenario report.................................................................................. 22
Fig. 5-1: Generating an analysis structure using the “Structure editor”. .............................................. 24
Fig. 5-2: The structure editor after the definition of the descriptors and variants. .............................. 25
Fig. 5-3: The comment window. In this example, a comment on the descriptor “A. Government” is
displayed. ...................................................................................................................................... 27
Fig. 5-4: A color-coded analysis structure. ............................................................................................ 28
Fig. 5-5: An empty matrix editor, ready for the input of cross-impact data. ........................................ 31
Fig. 5-6: The matrix editor filled with cross-impact data. ..................................................................... 32
Fig. 5-7: The comment window. In this example, a comment on the descriptor “A. Government” is
displayed. ...................................................................................................................................... 34
Fig. 5-8: The section editor displaying the judgement section “B. Foreign policy impacts on A.
Government”. ............................................................................................................................... 36
Fig. 5-9: The section editor with activated extension „Descriptor comments“. ................................... 37
Fig. 5-10: The section editor with activated extensions „Descriptor comments“ and “Navigator”. .... 38
Fig. 5-11: Entering a factor for cim factor multiplication. ..................................................................... 40
Fig. 5-12: A cross-impact matrix (left) and the transposed matrix (right). ........................................... 41
Fig. 5-13: A matrix generated by the “Export“ function. ...................................................................... 42
Fig. 5-14: A workbook sheet of an empty matrix to be used as a blank form. ..................................... 44
Fig. 5-15: A workbook sheet containing cross-impact data and text. ................................................... 45
Fig. 6-1: System-grid of „Somewhereland“. .......................................................................................... 48
Fig. 6-2: The form for calculating the impact balances of a scenario. .................................................. 49

ScenarioWizard 4.3 4
Fig. 6-3: Impact diagram of descriptor variant „E. Social value: meritocratic“ in scenario [ A2 B1 C3 D1
E1 F1 ]. .......................................................................................................................................... 51
Fig. 6-4: The window “Impact balances“ (Fig. 6-2) after the application of one succession step. ....... 52
Fig. 6-5: Html export of Fig. 6-4. ............................................................................................................ 53
Fig. 6-6: The section „Scenario overview“ of an automatic report. ...................................................... 55
Fig. 6-7: Comparing the supporting and the contradicting influences on a scenario element. ............ 56
Fig. 6-8: Continuation of Fig. 6-7: Proving the consistency of a scenario assumption by showing the
inferiority of all alternative assumptions. .................................................................................... 57
Fig. 6-9: The sections „Firmness of scenario assumptions“ and „Conclusions“ of an automatic scenario
report. ........................................................................................................................................... 58
Fig. 6-10: The evaluation protocol for the consistent scenario calculation. ......................................... 60
Fig. 6-11: Options for the calculation of variant frequencies. ............................................................... 61
Fig. 6-12: Text output of the variant frequencies in the evaluation protocol. ...................................... 62
Fig. 6-13: Bar chart of the unweighted variant frequencies. Short names of descriptors and variants
are used for labelling (see section 5.3). ........................................................................................ 62
Fig. 6-14: The option “F.differences” shows the changes of variant frequencies resulting from a
modification of the cross-impact matrix. ..................................................................................... 63
Fig. 6-15: Filtering the solution list. ...................................................................................................... 64
Fig. 6-16: Unsorted tableau of Somewhereland’s consistent scenarios. .............................................. 66
Fig. 6-17: Sorted tableau of Somewhereland’s consistent scenarios. .................................................. 67
Fig. 6-18: The Selection Manager window. ........................................................................................... 69
Fig. 6-19: Selection of Somewhereland scenarios resulting from selection mode "Select by scenario
distance" and "Minimum distance" = 3. ....................................................................................... 70
Fig. 6-20: The window for the selection of variants. ............................................................................. 71
Fig. 6-21: The file selection window for the compilation of an ensemble. ........................................... 72
Fig. 6-22: The ensemble condition query for the selection of consistent ensemble scenarios. ........... 74
Fig. 6-23: The evaluation protocol of the menu item Analyse - Ensemble Solutions. ........................... 75
Fig. 6-24: The intersection of the consistent scenarios of ensemble members (“consensus scenario”).
...................................................................................................................................................... 76
Fig. 6-25: Depiction of diverging expert opinions in an ensemble workbook. ...................................... 78
Fig. 6-26: The results of the Analyse – Statistics evaluation. ................................................................ 80
Fig. 6-27: Pathway analysis in the matrix editor. .................................................................................. 81
Fig. 6-28: Impact echoes of the descriptor variant D2. ......................................................................... 83
Fig. 6-29: Correlation coefficients of the “Somewhereland” scenarios. ............................................... 84

ScenarioWizard 4.3 5
Fig. 6-30: Correlation profile of the descriptor variant „E3 Riots“. ....................................................... 85
Fig. 6-31: Influence profiles of the „Somewhereland“ descriptor variants........................................... 87
Fig. 6-32: Bar chart of the influence profile of descriptor variant „C1 - Shrinking economy“. ............. 87
Fig. 7-1: The window “Evaluation options“. .......................................................................................... 89
Fig. 7-2: The window “Output options“. ............................................................................................... 94
Fig. 7-3: Displaying a cross-impact matrix using the format option „Sign“. .......................................... 97
Fig. 7-4: The impact balance window in case of the cross-impact format „Sign“. ................................ 98
Fig. 7-5: The options window „Descriptor type”. .................................................................................. 99
Fig. 8-1: After starting the Presenter window. .................................................................................... 103
Fig. 8-2: Presenter chapter "About": Plain text project describtion. .................................................. 105
Fig. 8-3: Presenter chapter "About": Html-formatted project description. ........................................ 106
Fig. 8-4: The Presenter window after starting the chapter "Descriptors". ......................................... 107
Fig. 8-5: Presenter chapter "Descriptors": Expanded descriptor box. ................................................ 107
Fig. 8-6: Presenter chapter "Descriptors": Variant list and comment window. .................................. 108
Fig. 8-7: Presenter chapter "Database": Connectivity chart. .............................................................. 109
Fig. 8-8: Presenter chapter "Database": Displaying a descriptor essay. ............................................. 110
Fig. 8-9: Presenter chapter "Database": Displaying cross-impact data............................................... 110
Fig. 8-10: Presenter chapter "Scenario tableau": Depiction of a scenario set. ................................... 111
Fig. 8-11: Presenter chapter "Inside the scenarios": Selecting a scenario. ......................................... 112
Fig. 8-12: Presenter chapter "Inside the scenarios": Depiction of the scenario "Society in crisis"..... 113
Fig. 8-13: Presenter chapter "Inside the Scenarios": Activated consistency check. ........................... 114
Fig. 8-14: Presenter chapter "Inside the Scenarios": Impact diagram explaining consistency
assessments. ............................................................................................................................... 115
Fig. 8-15: Presenter chapter "Inside the Scenarios": Displaying explanatory text about impact
relations. ..................................................................................................................................... 116

ScenarioWizard 4.3 6
1 Preface
The ScenarioWizard is designed for applying cross-impact balance analysis (CIB), a method of qualita-
tive system and scenario analysis. CIB facilitates the construction of qualitative scenarios based on
“qualitative impact networks”, i.e. based on qualitative knowledge concerning the mutual impact
relations of a system’s principal elements. Qualitative impact networks are used as a concept of sys-
tem description in many disciplines, for instance in economics, energy policy analysis, technology
foresight, innovation research, social sciences, management sciences and health care analysis. CIB
offers an approach to analyse qualitative impact networks and to understand their behaviour.
CIB and ScenarioWizard were first developed from 2001 to 2003 at the Center for Technology As-
sessment and developed further from 2004 to 2011 at ZIRN, the Interdisciplinary Research Unit on
Risk Governance and Sustainable Technology Development. In 2012, when ZIRN was integrated in
ZIRIUS, the newly founded Research Center for Risk and Innovation Studies of the University of Stutt-
gart, the curatorship of the CIB method was transferred to this organization. Since 2001 the method
and the software have been used, tested, and improved in many projects.
This manual only describes the technical aspects of using ScenarioWizard. It does not aim to explain
the methodological basis of CIB, give details on the different methods of evaluation, or the theoreti-
cal background to this form of analysis. A short introduction to the basic concepts of CIB is offered in
chapter 2, however. The CIB homepage www.cross-impact.de provides further information, refer-
ences and materials.
The structure of this manual is as follows: chapter 2 contains a short introduction to the CIB method.
Far from being exhaustive it gives a rough idea of the goals, the approach and the possible products
of a CIB analysis. Yet the installation of the software is straightforward and uses standard Windows
install procedures, it is shortly described in chapter 3. Chapter 4 takes you through a simple CIB
analysis procedure creating scenarios of the societal future of the fictitious country “Somewhere-
land”. After having worked through this chapter you will be able to map the analysis steps described
in chapter 2 onto the corresponding ScenarioWizard functions.
After this overview, the subsequent chapters describe the functions of the software in greater detail.
Chapter 5 shows how to build up a project file (containing descriptors, descriptor variants, descriptor
definitions, the cross-impact matrix and comments on the cross-impacts), and how to modify and
store it. Chapter 6 deals with ScenarioWizard’s evaluation procedures designed to support the con-
struction and the understanding of scenarios, i.e. plausible and internally consistent combinations of
descriptor variants. Chapter 7 shows how the user can customize the interface and the evaluation
procedures of the software to meet his/her needs. Chapter 8 explains the Presenter mode which is a
new feature in the software version 4.2. The Presenter provides several functions supporting the
presentation and discussion of data and results of your CIB analysis. Chapter 9 describes the techni-
cal limitations of the data structures which can be processed by ScenarioWizard. The topic of chapter
10 is both pleasure and obligation. It acknowledges the support of the many scholars, colleagues and
friends who contributed in various ways to the development of CIB and the ScenarioWizard. Chapter
11 informs about the license regulations and the liability disclaimer regulating your use of the soft-
ware. Finally, chapter 12 contains a glossary which might be a helpful guide through the jungle of
technical terms which, unfortuantely, also pervades this manual.

ScenarioWizard 4.3 7
2 Introduction to CIB
This chapter offers a short introduction to the basic concepts of CIB. Readers experienced with CIB
may prefer to skip this chapter. The method was published 2006 in the journal Technological Fore-
casting and Social Change1. A bibliography of the meanwhile extensive body of publications about
the method and its applications can be found at the CIB homepage (see www.cross-
impact.de/english/CIB_e_Pub.htm).
2.1 Purpose of the CIB method
The cross-impact balance analysis (CIB) is a method for analysing impact networks. The method uses
qualitative insights into the relations between the factors of an impact network in order to construct
consistent images of the network behaviour. The CIB method is based on
a discipline independent, qualitatively oriented concept of analysis which promotes the ap-
plication of the method in interdisciplinary problems;
an expert discourse approach which allows to collect, organize and to judge broad (as well as
dissenting) expert knowledge to complex, multidisciplinary topics in a structured way;
a proven algorithm for the evaluation of the collected information and for conducting a
qualitative system analysis.
ZIRIUS supports the application of the CIB method by scientists, companies or administrations
through advice, cooperation, and various materials. Visit CIB’s method homepage for more informa-
tion.
A typical application field of CIB is scenario analysis. The construction of scenarios frequently requires
the examination of developments in many different fields (e.g. economic, political, social or techno-
logical developments). Within different fields well established ideas about the possible developments
often exist (e.g. in the form of a favourable, middle and unfavourable forecast variant). However, the
development of holistic scenarios requires to identify which combinations of these variants are pro-
moted by the net of their interrelations. This systemic synthesis of isolated information to an overall
picture in the context of a scenario analysis can be carried out with the help of CIB.
CIB is a special form of cross-impact analysis. Several variants of cross-impact analysis have been
used for the analysis of multidisciplinary systems for more than 40 years. They provide a number of
structured processes for deducting plausible future developments in form of rough scenarios and are
based on expert judgements about systemic interactions. Cross-impact methods are mostly used for
analytical tasks which do not allow the use of theory-based computational models due to their disci-
plinary heterogeneity and the relevance of "soft" system knowledge, but on the other hand are too
1 Weimer-Jehle W. (2006): Cross-Impact Balances: A System-Theoretical Approach to Cross-Impact Analysis.
Technological Forecasting and Social Change, 73:4, 334-361

ScenarioWizard 4.3 8
complex for a purely argumentative systems analysis. CIB is a modern form of cross-impact analysis.
It is characterized by an easy-to-understand procedure, transparency, and high flexibility in applica-
tion and evaluation.
2.2 The CIB approach
The CIB method is a proven cross-impact method which aims for a qualitative systems analysis of
multidisciplinary topics (e.g. scenario construction). CIB consists of a thoroughly tested combination
of expert discourse and analysis algorithm. The basic structure of a CIB analysis contains the follow-
ing steps:
i. An expert panel is assembled which covers the full spectrum of knowledge that is necessary to understand all relevant topics. The panel should also reflect expert dissent if relevant.
ii. The expert panel prepares a list of the most important system factors ("descriptors") and compiles all available information on the expected future evolution of the descriptors. A list of possible disturbing influences which may deflect the evolution is also prepared.
iii. The expert panel discusses the interdependencies between the descriptors in one or (usually) more workshops. The experts pass "cross-impact judgements" on interdependencies using a qualitative judgement scale (e.g. "strongly promoting influence" or "weakly restricting influ-ence"). The set of all judgements defines an impact network.
iv. The consistent configurations of the impact network ("consistent scenarios") are calculated by the CIB algorithm. They reflect the systemic balance of influences of the network including all indirect effects and provide a set of plausible future system states.
v. The expert panel discusses the results of the evaluation and prepares recommendations for the user of the analysis.
More information on the CIB approach offers Guideline No. 1, which is available at the CIB homepage
www.cross-impact.de.
2.3 The CIB algorithm
The aim of the CIB analysis is the construction of internally consistent assumption bundles in the
context of scenario analysis. To this aim plausible configurations of the impact factor network con-
sisting of mutually supporting assumptions must be identified.
CIB uses a pair-interaction system approach. Starting point is the identification of a set of factors
("descriptors") which characterize the system in a sufficient way for the purpose of a qualitative sys-
ScenarioWizard 4.3 9
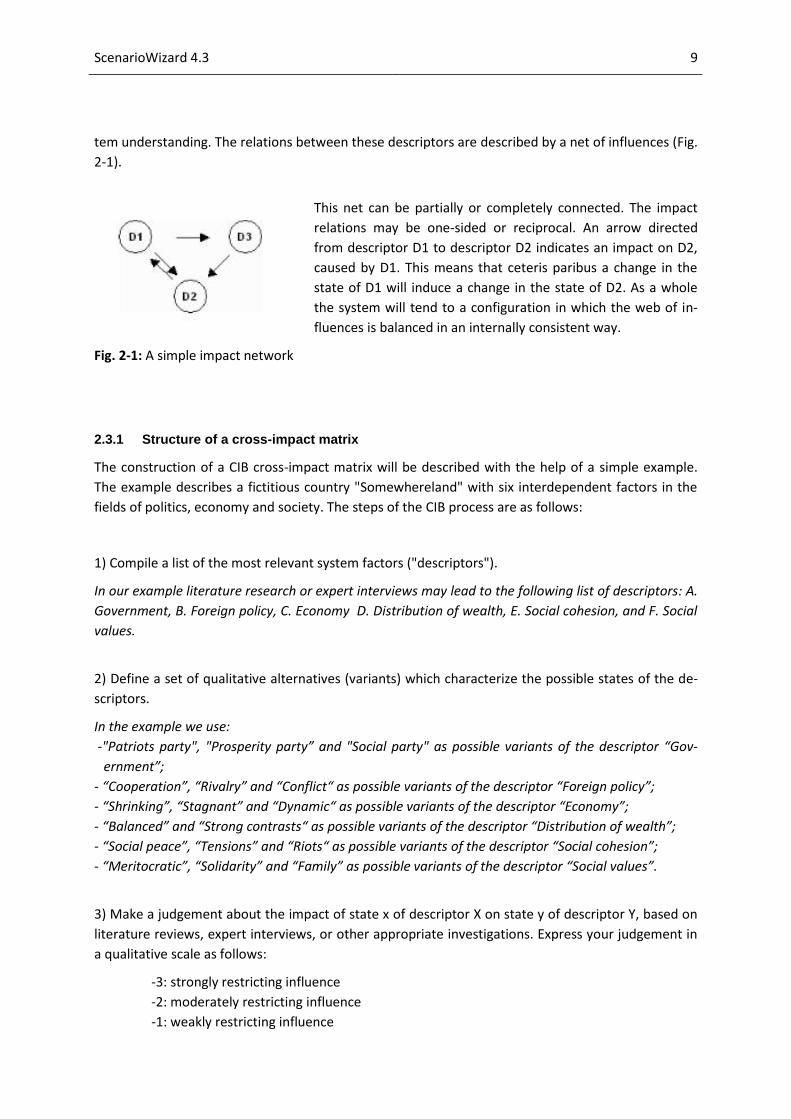
tem understanding. The relations between these descriptors are described by a net of influences (Fig.
2-1).
This net can be partially or completely connected. The impact
relations may be one-sided or reciprocal. An arrow directed
from descriptor D1 to descriptor D2 indicates an impact on D2,
caused by D1. This means that ceteris paribus a change in the
state of D1 will induce a change in the state of D2. As a whole
the system will tend to a configuration in which the web of in-
fluences is balanced in an internally consistent way.
Fig. 2-1: A simple impact network
2.3.1 Structure of a cross-impact matrix
The construction of a CIB cross-impact matrix will be described with the help of a simple example.
The example describes a fictitious country "Somewhereland" with six interdependent factors in the
fields of politics, economy and society. The steps of the CIB process are as follows:
1) Compile a list of the most relevant system factors ("descriptors").
In our example literature research or expert interviews may lead to the following list of descriptors: A.
Government, B. Foreign policy, C. Economy D. Distribution of wealth, E. Social cohesion, and F. Social
values.
2) Define a set of qualitative alternatives (variants) which characterize the possible states of the de-
scriptors.
In the example we use:
-"Patriots party", "Prosperity party” and "Social party" as possible variants of the descriptor “Gov-
ernment”;
- “Cooperation”, “Rivalry” and “Conflict“ as possible variants of the descriptor “Foreign policy”;
- “Shrinking”, “Stagnant” and “Dynamic“ as possible variants of the descriptor “Economy”;
- “Balanced” and “Strong contrasts“ as possible variants of the descriptor “Distribution of wealth”;
- “Social peace”, “Tensions” and “Riots“ as possible variants of the descriptor “Social cohesion”;
- “Meritocratic”, “Solidarity” and “Family” as possible variants of the descriptor “Social values”.
3) Make a judgement about the impact of state x of descriptor X on state y of descriptor Y, based on
literature reviews, expert interviews, or other appropriate investigations. Express your judgement in
a qualitative scale as follows:
-3: strongly restricting influence
-2: moderately restricting influence
-1: weakly restricting influence
ScenarioWizard 4.3 10
Cross-Impact Matrix
"Somewhereland"
A1 "
Patr
iots
pa
rty"
A2 "
Pro
sp
erity
part
y"
A3 "
Socia
l p
art
y"
B1 C
oo
pe
ratio
n
B2 R
iva
lry
B3 C
on
flic
t
C1 S
hrin
kin
g
C2 S
tagnant
C3 D
ynam
ic
D1 B
ala
nce
d
D2 S
tro
ng
co
ntr
asts
E1 S
ocia
l p
ea
ce
E2 T
en
sio
ns
E3 R
iots
F1 M
erito
cra
tic
F2 S
olid
arity
F3 F
am
ilyA. Government:
A1 "Patriots party" -2 1 1 0 0 0 0 0 -2 1 1 0 0 0
A2 "Prosperity party" 2 1 -3 -2 -1 3 -2 2 0 0 0 2 -1 -1
A3 "Social party" 0 0 0 0 2 -2 3 -3 2 -1 -1 -2 2 0
B. Foreign policy:
B1 Cooperation 0 0 0 -2 1 1 0 0 0 0 0 0 0 0
B2 Rivalry 0 0 0 0 1 -1 0 0 1 0 -1 0 0 0
B3 Conflict 3 -1 -2 3 0 -3 0 0 3 -1 -2 -2 1 1
C. Economy:
C1 Shrinking 2 1 -3 0 0 0 -2 2 -3 1 2 0 0 0
C2 Stagnant -1 2 -1 0 0 0 0 0 0 0 0 0 0 0
C3 Dynamic 0 0 0 0 0 0 -2 2 3 -1 -2 0 0 0
D. Distribution of Wealth:
D1 Balanced 0 0 0 0 0 0 0 0 0 3 -1 -2 -2 1 1
D2 Strong contrasts 0 -3 3 0 0 0 0 0 0 -3 1 2 2 -1 -1
E. Social cohesion:
E1 Social peace 0 0 0 0 0 0 -2 -1 3 0 0 2 -1 -1
E2 Tensions 0 0 0 -1 0 1 1 1 -2 0 0 -1 0 1
E3 Riots 2 -1 -1 -3 1 2 3 0 -3 0 0 -2 -1 3
F. Social values:
F1 Meritocratic 0 3 -3 0 0 0 -3 0 3 -3 3 -2 1 1
F2 Solidarity 1 -2 1 0 0 0 -1 2 -1 2 -2 2 -1 -1
F3 Family 0 0 0 0 0 0 -1 2 -1 1 -1 2 -1 -1
F.SoVA.Gov B.FoP C.Eco D.W E.SCo
CEB: A judgement section A judgement group CE3F3: A judgement cell
0: no influence
+1: weakly promoting influence
+2: moderately promoting influence
+3: strongly promoting influence.
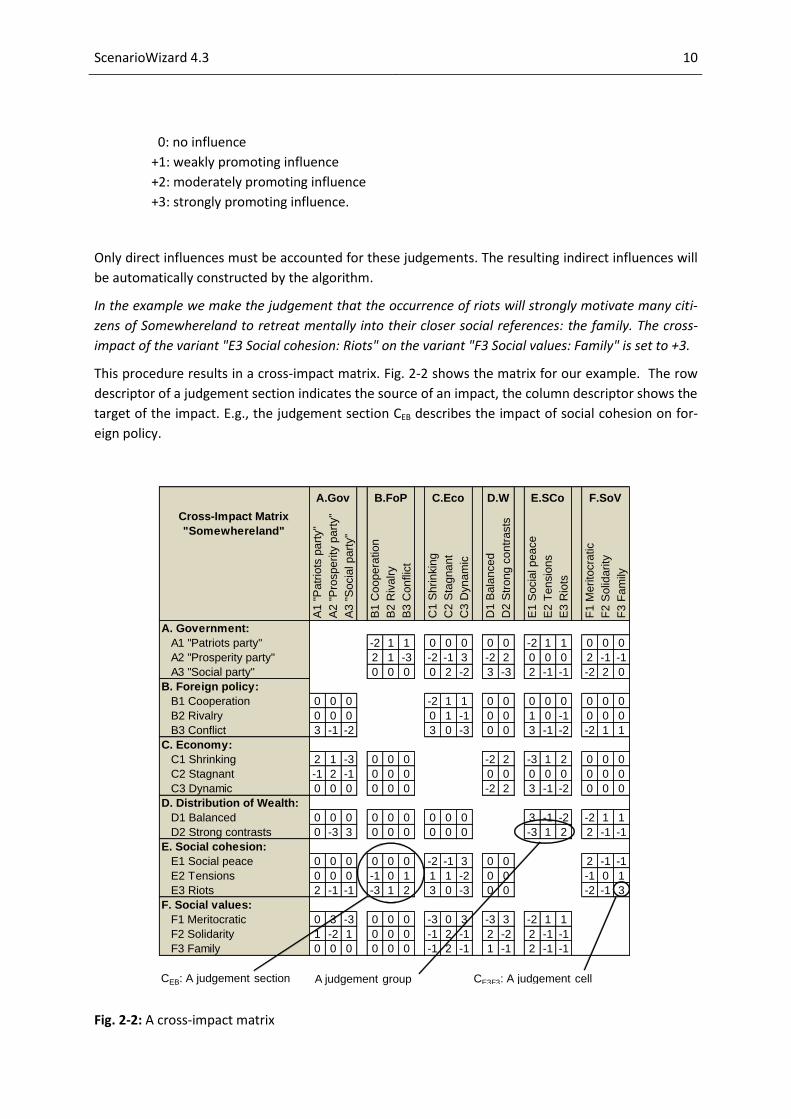
Only direct influences must be accounted for these judgements. The resulting indirect influences will
be automatically constructed by the algorithm.
In the example we make the judgement that the occurrence of riots will strongly motivate many citi-
zens of Somewhereland to retreat mentally into their closer social references: the family. The cross-
impact of the variant "E3 Social cohesion: Riots" on the variant "F3 Social values: Family" is set to +3.
This procedure results in a cross-impact matrix. Fig. 2-2 shows the matrix for our example. The row
descriptor of a judgement section indicates the source of an impact, the column descriptor shows the
target of the impact. E.g., the judgement section CEB describes the impact of social cohesion on for-
eign policy.
Fig. 2-2: A cross-impact matrix
ScenarioWizard 4.3 11
Cross-Impact Matrix
"Somewhereland"
A1 "
Pa
trio
ts p
art
y"
A2 "
Pro
sp
erity
pa
rty"
A3 "
So
cia
l p
art
y"
B1 C
oopera
tion
B2 R
ivalry
B3 C
onflic
t
C1
Sh
rin
kin
g
C2
Sta
gn
an
t
C3
Dyn
am
ic
D1
Ba
lance
d
D2
Str
ong
co
ntr
asts
E1 S
ocia
l peace
E2 T
ensio
ns
E3 R
iots
F1
Me
rito
cra
tic
F2
So
lida
rity
F3
Fa
mily
A. Government:
A1 "Patriots party" -2 1 1 0 0 0 0 0 -2 1 1 0 0 0
A2 "Prosperity party" 2 1 -3 -2 -1 3 -2 2 0 0 0 2 -1 -1
A3 "Social party" 0 0 0 0 2 -2 3 -3 2 -1 -1 -2 2 0
B. Foreign policy:
B1 Cooperation 0 0 0 -2 1 1 0 0 0 0 0 0 0 0
B2 Rivalry 0 0 0 0 1 -1 0 0 1 0 -1 0 0 0
B3 Conflict 3 -1 -2 3 0 -3 0 0 3 -1 -2 -2 1 1
C. Economy:
C1 Shrinking 2 1 -3 0 0 0 -2 2 -3 1 2 0 0 0
C2 Stagnant -1 2 -1 0 0 0 0 0 0 0 0 0 0 0
C3 Dynamic 0 0 0 0 0 0 -2 2 3 -1 -2 0 0 0
D. Distribution of wealth:
D1 Balanced 0 0 0 0 0 0 0 0 0 3 -1 -2 -2 1 1
D2 Strong contrasts 0 -3 3 0 0 0 0 0 0 -3 1 2 2 -1 -1
E. Social cohesion:
E1 Social peace 0 0 0 0 0 0 -2 -1 3 0 0 2 -1 -1
E2 Tensions 0 0 0 -1 0 1 1 1 -2 0 0 -1 0 1
E3 Riots 2 -1 -1 -3 1 2 3 0 -3 0 0 -2 -1 3
F. Social values:
F1 Meritocratic 0 3 -3 0 0 0 -3 0 3 -3 3 -2 1 1
F2 Solidarity 1 -2 1 0 0 0 -1 2 -1 2 -2 2 -1 -1
F3 Family 0 0 0 0 0 0 -1 2 -1 1 -1 2 -1 -1
Scenario assumptions:
Balances 0 3 -3 2 1 -3 -9 -1 10 -7 7 4 -1 -3 2 -1 -1
Maximum:
F.SoVA.Gov B.FoP C.Eco D.W E.SCo
The impact score of a variant The impact balance of a descriptor
Exercise: The cross-impact judgements in Fig. 2-2 are to be taken as an example. They express a pos-
sible view on the issue of societal development, but your opinion on some relationships might be
different for a real country. Prepare your own matrix which expresses your personal judgements.
2.3.2 Recognizing the inconsistencies of a scenario
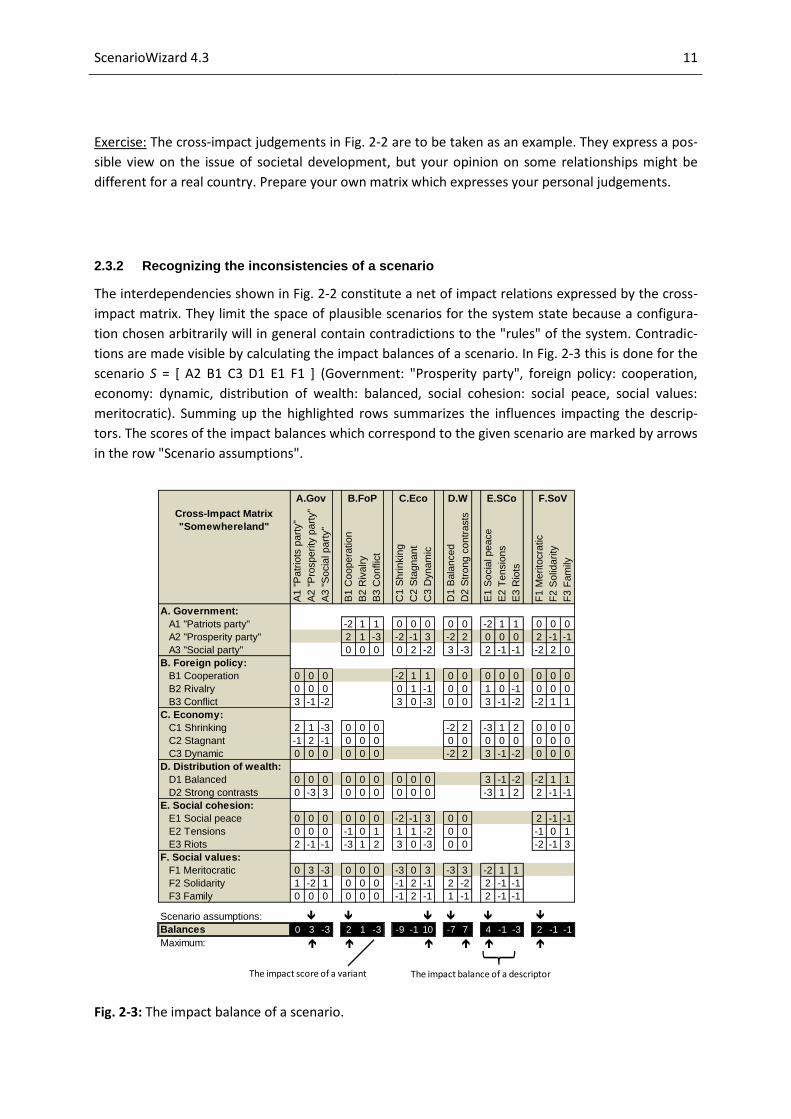
The interdependencies shown in Fig. 2-2 constitute a net of impact relations expressed by the cross-
impact matrix. They limit the space of plausible scenarios for the system state because a configura-
tion chosen arbitrarily will in general contain contradictions to the "rules" of the system. Contradic-
tions are made visible by calculating the impact balances of a scenario. In Fig. 2-3 this is done for the
scenario S = [ A2 B1 C3 D1 E1 F1 ] (Government: "Prosperity party", foreign policy: cooperation,
economy: dynamic, distribution of wealth: balanced, social cohesion: social peace, social values:
meritocratic). Summing up the highlighted rows summarizes the influences impacting the descrip-
tors. The scores of the impact balances which correspond to the given scenario are marked by arrows
in the row "Scenario assumptions".
Fig. 2-3: The impact balance of a scenario.

ScenarioWizard 4.3 12
In five cases (descriptors A, B, C, E, F), the arrows indicate the maximum score of the descriptor im-
pact balance (cf. arrows in the row "Maximum"). Consider descriptor E (social cohesion) as an exam-
ple. The impact balance of “E. Social cohesion” is [+4,-1,-3], and the impact score of “social peace”
(the descriptor variant which is assumed in scenario S) is +4. There is no higher impact score within
the impact balance of this descriptor, and therefore the assumption “Social cohesion: social peace” is
rated consistent. The reason behind this technical rating is that the scenario includes two assump-
tions strongly working in favour of social peace: the dynamic economic growth and the balanced
distribution of wealth. These impacts as a whole have considerable more weight than the scenario’s
single argument against social peace (social values: meritocratic). A comparable dominance of pro-
arguments can be found in none of the other possible variants of the descriptor “Social cohesion”.
The assumptions of the scenario are not working out for every descriptor, however. In one descriptor
balance (“D: Distribution of wealth”) the arrow does not point to the maximum impact score and this
indicates an inconsistency in the scenario. Scenario S assumes the variant “balanced” for this descrip-
tor, but this assumption is supported by none of the other scenario assumptions. The typical policies
of Somewhereland’s “Prosperity party”, the dynamic economic growth and the meritocratic social
values point towards the opposite assumption of strong contrasts in the distribution of wealth (cf.
the cross-impact table). This means that the assumption “balanced” does not comply with the pros
and cons associated with the descriptor “Distribution of wealth”.
Descriptor D violates the "rules" coded in the cross-impact matrix. To avoid such violations, the
states of the descriptors must show a well-balanced configuration that reflects the dual role of each
descriptor as both impact source and impact target. The internal consistency of a scenario requires
that every variant is chosen in such a way as to ensure that no other variant of the same descriptor is
stronger preferred by the combined influences of the other descriptors. In CIB this is denoted as the
principle of consistency. In Fig. 2-3 this principle is violated and the shown scenario is inconsistent.
It should be mentioned that the switching of the inconsistent descriptor "Distribution of wealth"
doesn’t automatically result in a consistent scenario. The variant of the descriptors then would corre-
spond to the influences having an impact on them. But new inconsistencies would arise in other
places, caused by the changes in the descriptor D. Impact nets are complex systems and usually they
are not easy to understand. CIB analysis, although a qualitative method, mirrors this fact.
Exercise: Try to guess a “Somewhereland” scenario without inconsistency before you read the next
section.

ScenarioWizard 4.3 13
Scenario-g. III
"Cosy society"
Scenario-g. IV
"Protectionism"
Scenario-g. VI
"Society in crisis"
Ia Ib IIa IIb Va Vb Vc
B. Foreign policy:
-B1 Cooperation
C. Economy:
-C1 Shrinking
D. Distribution of wealth:
-D2 Strong contrasts
E. Social cohesion:
-E3 Riots
-F1 Meritocratic -F2 Solidarity -F3 Family
E. Social cohesion: E. Social cohesion:
-E2 Tensions -E1 Social peace
F. Social values: F. Social values: F. Social values:
-C3 Dynamic -C2 Stagnant
D. Distribution of wealth: D. Distribution of wealth:
-D2 Strong contrasts -D1 Balanced
-B2 Rivalry -B1 Cooperation -B2 Rivalry -B3 Conflict
C. Economy: C. Economy:
-A2 "Prosperity party" -A3 "Social party" -A1 "Patriots party"
B. Foreign policy: B. Foreign policy: B. Foreign policy: B. Foreign policy:
Scenario-group I
"Prosperity in a divided society"
Scenario-group II
"Stop exploitation!"
Scenario-group V
"We against the others"
A. Government: A. Government: A. Government:
2.3.3 Consistent scenarios
In our example (six interacting descriptors) 3*3*3*2*3*3 = 486 possible configurations exist. Check-
ing all configurations in the way shown in Fig. 2-3 reveals that only ten configurations are free of
internal inconsistencies. The ten consistent scenarios are grouped into six scenario families (scenario
groups) and a title is assigned to each group interpreting and summarizing the scene in each case:
Fig. 2-4: The consistent scenarios of Fig. 2-2.
The consistency of the single scenario in scenario-group VI “Society in crisis” is demonstrated in Fig.
2-5. All arrows of the row "Scenario" mark the states of maximum impact score in the respective
impact balance. They coincide with the arrows in the row "Maximum". The state of each descriptor
reflects the sum of all influences which are caused by the other descriptors. In the case of contradic-
tory influences the stronger influences are decisive.
Large cross-impact matrices include too many possible configurations to be checked by hand. Even in
the case of our example with 486 configurations this would be a laborious task. A systematic explora-
tion of the configuration space and the identification of the complete set of consistent scenarios
requires the help of the ScenarioWizard. Nonetheless it is possible and instructive to test the validity
of the resulting scenarios or the inconsistency of a rejected scenario manually. The possibility to test
the computer evaluations in an easy and understandable way can considerably enhance the credibil-
ity of the analysis results in the eyes of the involved persons and the users of the analysis.
It should be stressed that the application of CIB is not restricted to the issue of societal develop-
ments, which is used here only as an example. Typical descriptors in applied projects concern policy
decisions, business strategies, environmental, social or technological changes and others.

ScenarioWizard 4.3 14
Cross-Impact Matrix
"Somewhereland"
A1 "
Patr
iots
part
y"
A2 "
Pro
sperity
part
y"
A3 "
Socia
l part
y"
B1 C
oopera
tion
B2 R
ivalry
B3 C
onflic
t
C1 S
hrinkin
g
C2 S
tagnant
C3 D
ynam
ic
D1 B
ala
nced
D2 S
trong c
ontr
asts
E1 S
ocia
l peace
E2 T
ensio
ns
E3 R
iots
F1 M
erito
cra
tic
F2 S
olid
arity
F3 F
am
ily
A. Government:
A1 "Patriots party" -2 1 1 0 0 0 0 0 -2 1 1 0 0 0
A2 "Prosperity party" 2 1 -3 -2 -1 3 -2 2 0 0 0 2 -1 -1
A3 "Social party" 0 0 0 0 2 -2 3 -3 2 -1 -1 -2 2 0
B. Foreign policy:
B1 Cooperation 0 0 0 -2 1 1 0 0 0 0 0 0 0 0
B2 Rivalry 0 0 0 0 1 -1 0 0 1 0 -1 0 0 0
B3 Conflict 3 -1 -2 3 0 -3 0 0 3 -1 -2 -2 1 1
C. Economy:
C1 Shrinking 2 1 -3 0 0 0 -2 2 -3 1 2 0 0 0
C2 Stagnant -1 2 -1 0 0 0 0 0 0 0 0 0 0 0
C3 Dynamic 0 0 0 0 0 0 -2 2 3 -1 -2 0 0 0
D. Distribution of wealth:
D1 Balanced 0 0 0 0 0 0 0 0 0 3 -1 -2 -2 1 1
D2 Strong contrasts 0 -3 3 0 0 0 0 0 0 -3 1 2 2 -1 -1
E. Social cohesion:
E1 Social peace 0 0 0 0 0 0 -2 -1 3 0 0 2 -1 -1
E2 Tensions 0 0 0 -1 0 1 1 1 -2 0 0 -1 0 1
E3 Riots 2 -1 -1 -3 1 2 3 0 -3 0 0 -2 -1 3
F. Social values:
F1 Meritocratic 0 3 -3 0 0 0 -3 0 3 -3 3 -2 1 1
F2 Solidarity 1 -2 1 0 0 0 -1 2 -1 2 -2 2 -1 -1
F3 Family 0 0 0 0 0 0 -1 2 -1 1 -1 2 -1 -1
Scenario assumptions:
Balances 7 -4 -3 -5 2 3 5 2 -7 -1 1 -3 1 2 -2 -1 3
Maximum:
F.SoVA.Gov B.FoP C.Eco D.W E.SCo
A detailed description of the method and additional information offers Guideline No. 1, which is
available at the CIB homepage.
Fig. 2-5: The impact balance of scenario VI.

ScenarioWizard 4.3 15
3 Installation
System requirements
The ScenarioWizard requires the following system features:
A PC with MS Windows XP, Vista or Windows 7;
MS .NET Framework 2.0 or higher. Because many applications require MS .NET Frame-
work this software probably is already installed on your computer. If not, you can
download MS .NET Framework free of charge at:
http://www.microsoft.com/downloads/search.aspx?displaylang=de
At least 10 MB free space on your hard disk;
Screen resolution of 1024 x 768 or more is recommended;
A mouse or another pointer device is recommended;
The CPU speed required depends on the size of the cross-impact matrices to be evalu-
ated. CPU speed of 1 GHz or more is recommended.
The main memory size required depends on the size of the matrix under consideration.
Maximum use of the data arrays enabled in ScenarioWizard (cf. chapter 9) requires a main
memory of approx. 650 MB. Typical project sizes use up 7-10 MB of main memory.
ScenarioWizard 4.3 16
Installation and start
Before you install the software, read the End User License Agreement
(EULA) in chapter 11!
1. If you have installed the basic version of the software (ScenarioWizardBasic) or older ver-
sions of the full version on your computer, please de-install it before proceeding.
2. Start the program ScenarioWizard4.msi using the Windows function “Start-Run“ or Win-
dows program “File Explore“.
3. Follow the instructions of the installation program. Having completed the installation pro-
cedure, start ScenarioWizard using the Windows function “Start-Run” or the Windows
program “File explore“ or the icon on the desktop.

ScenarioWizard 4.3 17
4 Getting started with ScenarioWizard
4.1 Overview
A qualitative system analysis using ScenarioWizard is conducted by sampling qualitative judgements
about the mutual influences (the “cross-impacts”) of the principal elements of a system, and by con-
structing plausible and consistent qualitative scenarios concerning the system’s behaviour. The typi-
cal structure of a cross-impact analysis using ScenarioWizard is as follows:
Generate a list of descriptors (relevant system elements) and their variants (possible states
or developments): the “analysis structure”.
Enter the cross-impact data into this structure. The analysis structure and the cross-impact
data together form the cross-impact matrix (“cim”).
Evaluate the cross-impact matrix by computing its solution set (consistent scenarios, weights,
...).
If appropriate for the aims of the analysis, carry out additional evaluations (frequency statis-
tics, influence analysis, transient analysis).
Store data and results.
The following chapters describe how to perform the various stages of the process. All necessary func-
tions can be accessed via the menu items and the buttons found in the different ScenarioWizard
windows. The basic functions are also available using the buttons of the toolbar (Fig. 4-1). All func-
tions may only be accessed if the necessary preparatory steps have been done. Otherwise the menu
items appear grey and their toolbar buttons are disabled. For instance clicking the button “Find con-
sistent scenarios“ on the toolbar is only effective if an analysis structure has been generated or
loaded, and if cross-impact data have been provided.
A help function is also available. It may be accessed via the menu item Info – Help or the F1 key.

ScenarioWizard 4.3 18
Fig. 4-1: The basic functions of ScenarioWizard can be found on the toolbar.
4.2 A simple analysis - step by step
This chapter describes a simple analysis in order to show the principles and the typical way of work-
ing with ScenarioWizard. The analysis deals with the calculation of the consistent scenarios of
„Somewhereland“, the example used in chapter 2.
Step 1: The analysis structure
The first step of the analysis requires the definition of the descriptors and their variants (the „analysis
structure“). Chapters 5.3 and 5.7 describe how to build up a new analysis structure using Sce-
narioWizard and how to fill the analysis structure with cross-impact data. This is not necessary in this
exercise as a ready-to-use project file named „Somewhereland_en.scw“ was included in Sce-
narioWizard‘s installation package. The project file can be loaded using the menu item File -
Load...project file or the button in the toolbar.
After loading the analysis structure it can be displayed using the menu item Edit - Analysis structure
or the button in the toolbar (Fig. 4-2). First an inquiry is shown to confirm if the cross-impact

ScenarioWizard 4.3 19
matrix (cim) shall be co-edited, because a modification of the analysis structure can request an ap-
propriate restructuring of the cross-impact data. Click on the button „Yes“.
Fig. 4-2: The analysis structure of the „Somewhereland“ exercise displayed in the structure editor.
In several program windows ScenarioWizard uses abbreviations of the names of the descriptors and
variants. So, the preparation of an analysis structure in the structure editor includes also the defini-
tion of short names of the descriptors and variants. However, this step can be skipped in our exercise
too, because all necessary abbreviations are already included in the loaded project file. To display the
abbreviations press the button „Short“. The same button (now inscribed „Long“) can be used to
switch back to the long names.
The structure editor can also be used to modify the analysis structure (cf. section 5.6). This is not
needed now because the loaded project file fully represents the exercise “Somewhereland”. The
structure editor can be closed now. Use the button “Close” to this end.
Step 2: Cross-impact data
The next step in the analysis procedure is to enter the „cross-impact data“. They represent the mu-
tual influences between the descriptors. This can be done using the „cim editor“. The menu item Edit
- Cross-impact matrix or the button in the toolbar opens the cim editor (Fig. 4-3). Again, it

ScenarioWizard 4.3 20
is not necessary to enter the data manually because the data of the exercise „Somewhereland“ are
provided by the loaded project file.
Fig. 4-3: The cim editor.
Descriptors and their alternative variants are printed in long names in the left column of the matrix.
In the head row they are printed in short names (cf. step 1). The cim editor can be used to enter or to
modify cross-impact data. In our exercise, the loaded matrix matches perfectly with Fig. 2-2 and we
can close the cim editor by pressing the button “Accept”.

ScenarioWizard 4.3 21
Step 3: Calculation of the consistent scenarios
Now all necessary data are provided and the evaluation of the cross-impact matrix can begin. The
calculation of the consistent scenarios following the method described in chapter 2 is started by the
menu item Analyse - Consistent scenarios or the button in the toolbar. The results of the
calculation (the “solutions of the matrix”) are displayed in the protocol shown in Fig. 4-4.
Fig. 4-4: The evaluation protocol displaying consistent scenarios.
The protocol shows the scenario IIa and IIb of the scenario tableau in Fig. 2-4. The other scenarios
can be displayed using the scroll bar.
Step 4: Analysing the consistent scenarios
The button “Rp” generates a report on a selected scenario discussing the logical coherence of the
scenario and the reasons behind the choice of the elements of the scenario. Enter “1” in the input

ScenarioWizard 4.3 22
field between the buttons “Tableau” and “IB” and press “Rp” to generate a report on the first sce-
nario of the evaluation protocol (scenario no. 1). An extract of the report is shown in Fig. 4-5.
Fig. 4-5: Extract of an automatic scenario report.
Close the protocol by pressing the close button top right of the window. The calculation of the con-
sistent scenarios is the core function of the CIB method. Further analysis procedures are described in
chapter 6.
The demonstration of the basic analysis of the exercise „Somewhereland“ is finished now. Close Sce-
narioWizard by the menu item File - Exit or the close button top right of the program’s main window.
The following chapters provide detailed information on the several functions of the software.

ScenarioWizard 4.3 23
5 Generating and handling a project file
Since program version 4 all input data necessary for conducting a CIB analysis are integrated and
stored in a single project file (in earlier versions of the software the analysis structure and the cross-
impact data were stored in different files). The project files bear the extension .scw. The following
sections describe the generation, handling and use of project data and project files by ScenarioWiz-
ard.
5.1 Overview
ScenarioWizard project files contain the following data (some of them obligatory, some of them op-
tional for conducting an analysis):
1. Name of the project (obligatory).
2. Names and abbreviations of the descriptors and their alternative variants (obligatory).
3. Colour codes of the descriptor-variants visualizing e.g. their normative desirability (optional).
4. Cross-impact data characterizing the influences between the descriptors (obligatory).
5. Explanatory text (“comments”) for the descriptors and cross-impact data (optional).
Section 5.2 shows how an existing project file can be loaded and saved. Sections 5.3 - 5.8 deal with
the process of building up a new project by defining an analysis structure (descriptors and their vari-
ants) and defining the cross-impact data. The remaining sections of chapter 5 describe additional
functions, e.g. the import and export functions of ScenarioWizard.
5.2 Loading and storing a project file
The first step of a cross-impact analysis using ScenarioWizard is either to load an existing project file
or to generate a new analysis structure. An existing project file (scw file) is loaded using the menu
item File - Load...project file. Upon starting ScenarioWizard, this is the only item available in the File-
menu, because all other items require the presence of a analysis structure.
Having clicked on File - Load...project file, a file selection window is shown. The window can also be
opened by the button on the toolbar. The loading of a new project file overwrites any
previously loaded or generated structure or cross-impact data. If there is unsaved structure data or
cross-impact data in the workspace a warning will appear before starting the loading procedure.

ScenarioWizard 4.3 24
Once a new project file has been loaded, it can be used for modification and evaluation of the in-
cluded data.
The menu item File - Save ... project file or the button in the toolbar stores the current state of
the project data. The name and the location of the project file can be chosen via a file selection win-
dow. Existing files with the same name will be overwritten.
5.3 Generating an analysis structure
The first step of a cross-impact analysis using ScenarioWizard is either to load an existing project file
or to generate a new analysis structure. In case of a new project, the analysis structure must be gen-
erated. Use the menu item Edit - Analysis structure to generate a new analysis structure. This menu
item opens the “structure editor” shown in Fig. 5-1.
In order to avoid unclear data states, the menu bar remains inaccessible while the structure editor is
open. The toolbar is also deactivated.
The newly opened sheet is prepared to accept the names of the first and the second descriptor (light
grey cells below the label “Descriptors”) and the names of their first states (white cells in the second
column of the sheet). Enter the names.
Fig. 5-1: Generating an analysis structure using the “Structure editor”.

ScenarioWizard 4.3 25
If needed, click a variant name and then the “Insert” button in order to expand a row and to gener-
ate a new cell for a further variant name of the same descriptor. Click the cell below the last descrip-
tor name and then the "Insert" button in order to expand the descriptor column and to generate an
new cell for the name of the next descriptor. Repeat these steps until all descriptors and variants are
specified. The column’s width will automatically adjust to the longest name in use inside a column.
Note: Descriptors with only one variant are permitted (but descriptors without variants are not per-
mitted). Once the analysis structure is completed the window looks as shown in Fig. 5-2.
Fig. 5-2: The structure editor after the definition of the descriptors and variants.
In addition to the names of the descriptors and variants (“long names”), abbreviations (“short
names”) must also be defined. They are used in several program windows, e.g. as labels of the cross-
impact matrix columns. The short names should be as short as possible to achieve compact represen-
tations, but they should also be as meaningful as possible to keep representations intelligible. Click
the "Short" button. The sheet with empty cells for all defined descriptors and variants is ready for the
entry of the short names. Click the same button (now named "Long") in order to change back to the
long names.
The long names and short names of the descriptors and variants must not contain commas or double
quotation marks.

ScenarioWizard 4.3 26
A double click on any point of the structure editor outside of the cell array generates a default set of
descriptor and variant names for all empty cells. Descriptors are named as A-Z, their variants as A1,
A2, ... B1, B2, ... and so on. This function is available only for max. 26 descriptors.
Having entered all short names and long names the generation of the analysis structure is complete.
The structure editor is closed with the “Accept” button. Now save the generated analysis structure.
This is done using the menu item File-Save ... Project file (this menu item becomes available after
closing the structure editor) or the respective button on the toolbar. The saved file can be
loaded again in a later session.
5.4 Entering descriptor comments
The definitions of the descriptors and their variants can be entered into “comment windows”. This is
useful for documentation and as a base for judging the interdependences. The comment window of a
descriptor is opened by clicking on the descriptor’s name (or on any of its variants) in the structure
editor using the right mouse button. A small text window appears in which the comment can be en-
tered or a existing comment can be modified (Fig. 5-3). The title of the comment window refers to
the short name of the descriptor. After finishing the comment, the comment window can be closed
by its close button. Double quotation marks (") are not permitted in comments and are automatically
converted into single quotation marks once the comment window is closed.
A click on the title row of the table (containing the denominations “Descriptors: Variant[1] Vari-
ant[2], ...) opens the comment window for general project information (e.g. project name, purpose
of the analysis, project team, project publications ...).
Comments are optional and don’t influence the scenario calculations. Yet they are used for the
automatic scenario report, if available (cf. section 6.3).
All comments are integrated into the project file database and they will be stored and loaded when
the project file is stored or loaded.
The menu item Edit - Show comments produces a compilation of all comments of the project (de-
scriptor comments and cross-impact comments, cf. section 5.8 and 5.9). The compilation can be
transferred into a word processor by copy-and-paste or it can be printed by the print button of the
“Show comments” window. Descriptors or judgement sections without comment are skipped in the
compilation. The menu item Edit - Show comments is only available if at least one comment exists.
The comments of a project can be erased using the menu item File - Reset ... Clear comments. The analysis structure and the cross-impact data of the project stay unchanged by this command.

ScenarioWizard 4.3 27
Fig. 5-3: The comment window. In this example, a comment on the descriptor “A. Government” is
displayed.
5.5 Assigning colors to the descriptor variants
The color selection button “Color” can be used to assign colors to the descriptor variants, e.g. to ex-
press their normative desirability by traffic light colors. The color coding is optional and has no influ-
ence on the scenario calculations. However, the color coding is used in the scenario tableau (cf. sec-
tion 6.5).
To assign a color to a descriptor variant select a color by pressing the color selection button and
choosing a color. Double click on a descriptor variant assigns the selected color to this variant. Fig.
5-4 shows a color-coded analysis structure.

ScenarioWizard 4.3 28
Fig. 5-4: A color-coded analysis structure.
5.6 Editing an analysis structure
The structure editor can also be used to edit an existing analysis structure. To do this select the menu
item Edit - Analysis structure.
If any cross-impact data are present at that time, the program will ask whether the cross-impact ma-
trix (cim) should be co-edited (synchronized). The reason for this question is that a modification of
the descriptor state list may have consequences for the cross-impact data structure. If the cim is co-
edited, the deletion of a descriptor in the structure editor will automatically cause the deletion of the
respective rows and columns in the cim. If the user changes the sequence of the descriptors or vari-
ants, co-editing means that the respective rearrangements will also be carried out in the cim, so that
the correlations between names and data remain unchanged.
If the user rejects co-editing, the present cross-impact data are deleted by the program thereby pre-
vent a meaningless combination of structure and data. In this case, a descriptor-variants-list without
connected cross-impact data will be edited by the structure editor.
Deleting descriptors or variants
To delete a descriptor, click the descriptor name in the descriptor list and click the “Delete” button.
Following confirmation, the descriptor and its variants will be erased. If a cross-impact matrix is co-
edited, the cross-impact data of this descriptor are also deleted. The following descriptors move up-
wards, in order to preserve a connected list.

ScenarioWizard 4.3 29
To delete a variant, click on the variant name. After clicking on the “Delete“ button and following
confirmation, the deletion will be carried out. If a cross-impact matrix is co-edited, the cross-impact
data of this state are also deleted. After deletion, the following states of the list will move leftwards.
It isn't possible to delete a variant which is the only variant of a descriptor. Furthermore, it isn't pos-
sible to shorten a descriptor list below a minimum number of two descriptors.
Moving descriptors or variants
The sequence of the descriptors (or variants) can be changed by the arrow buttons of the structure
editor. Click the descriptor or the variant to be moved. Each click on an arrow button moves the de-
scriptor (or variant) one place upwards or downwards (to the left or to the right). If a cross-impact
matrix is co-edited, the cross-impact data of the descriptor (or variant) will be moved simultaneously.
Changing names
Click the long name or the short name of the descriptor or the variant in question. Edit the name or
enter a new name as desired. The long names and short names of the descriptors and variants may
not contain any comma.
Adding new descriptors or variants
A new state cell in a descriptor's row will emerge if an existing variant of the same descriptor was
clicked and the "Insert" button is pressed after that. A new descriptor row will emerge if the cell be-
low the name of the last descriptor was clicked and the "Insert" button is pressed after that. If a cim
is co-edited, appropriate rows and columns will be automatically inserted also in the cim and filled
with zeros. The new descriptor (or variant) can afterwards be moved to its designated place in the list
using the arrow buttons. The adding of a new descriptor (or variant) is not possible if the number of
descriptors (or variants) would exceed the maximum number (199 descriptors, 9 variants for each
descriptor).
After pressing the button “Accept“, the program enters the data of the structure editor into the
workspace of ScenarioWizard, and closes the window. The edited analysis structure should then be
saved by saving the project file. Chapter 7.3 provides some hints for the use of the structure editor if
the descriptor type option is selected.

ScenarioWizard 4.3 30
5.7 Displaying and editing cross-impact data using the matrix editor
The cross-impact matrix (cim) contains the cross-impact data base of the project. It represents the
interdependence of the descriptors in a qualitative manner. The menu items for loading and editing a
cim are not available until an analysis structure has been defined (cf. chapters 5.2 and 5.3). Sce-
narioWizard offers two ways to enter and edit cross-impact data:
The matrix editor displays a table representing the entire cross-impact matrix at once. Data
can be entered or modified at any position of the matrix.
The section editor displays only a single judgement section for data editing at once. This can
be helpful to concentrate on the specific descriptor relationship under work.
All necessary steps can be done by both editor types. Basically it is a matter of taste which editor is
preferred by the user. This section describes the use of the matrix editor. The section editor is de-
scribed in section 5.9.
Choose the menu item Edit - CI-Matrix or press the button on the toolbar in order to dis-
play a cross-impact matrix using the matrix editor. If no cross-impact data have been loaded before,
an empty cross-impact matrix is displayed for the current analysis structure (Fig. 5-5).
While the matrix editor is open, all menu items are disabled (except for the menu item Info) to avoid
the storage or evaluation of unconfirmed data. The toolbar is also deactivated.
Descriptors and states appear with their long names in the first column of the matrix. In the first row
they are printed with their short names in order to save space, and to keep the size of the table
small. State names are tabulated in the first column.
The blue cell top left of the matrix contains the name of the project file. In case of a new project
which was not yet stored the cell is empty.
Enter cross-impact data by clicking on a cell and pressing the "+" ("-") button at the bottom of the
matrix editor. Each click on the "+" ("-") button increases (or decreases) the cross-impact entry of the
selected cell by one unit. The data can be entered also by the keyboard.

ScenarioWizard 4.3 31
Fig. 5-5: An empty matrix editor, ready for the input of cross-impact data.
Cross-impact values are usually interpreted in CIB as shown in Tab. 5-1. The states in the rows are
sources of influence, and the column states are the targets of influence. If necessary, higher values
than those quoted in Tab. 5-1 can be used in order to express very strong influences. Only direct in-
fluences are coded in the cross-impact matrix. The resulting indirect effects are automatically con-
structed by the CIB method.
A matrix editor with cross-impact entries is shown in Fig. 5-6. The diagonal judgement sections re-
main empty in the case of regular cross-impact matrices (for extended cross-impact matrices see
chapter 7.1).
The user can change the font used to print the names of descriptors and states in the matrix editor
(see chapter 7.2). A small font helps display large matrices without scrolling. A large font is useful for
projector presentations.

ScenarioWizard 4.3 32
Tab. 5-1: The interpretation of cross-impact judgements. Consider the direct influence of state x on
state y.
+3: strongly promoting influence
+2: promoting influence
+1: weakly promoting influence
0: no influence
-1: weakly restricting influence
-2: restricting influence
-3: strongly restricting influence
Fig. 5-6: The matrix editor filled with cross-impact data.

ScenarioWizard 4.3 33
Printing
Use the “Print“ button to request a printer selection window and a print-out of the cross-impact ma-
trix. For a satisfactory print-out, the printer needs to support the scalable “Arial“ font.
The printing of large matrices requires that the printer is able to print very small fonts. Selecting the
landscape orientation in the printer selection menu helps to print out larger matrices. Depending on
the abilities of the printer the printout of a large matrix may also fail. Selecting a pdf printer in the
printer setup, converting the matrix in a pdf-file and printing the pdf-file may yield a better result in
this case.
Accepting a cross-impact matrix
After pressing the button “Accept“, the program enters the data of the matrix editor into the work-
space of ScenarioWizard, and closes the window. Closing the form by clicking on the matrix editor
close button (upper right corner of the window) closes the window without updating ScenarioWizard
workspace. All changes made in the matrix editor are lost.
After closing the matrix editor by pressing the button "Accept", the data of the matrix editor are
available in the program's workspace and will be used by all evaluation procedures during the cur-
rent session. However, the data aren't stored permanently. If you want to use the data in a later
session you must store them using the menu item File - Save...project file or the button in
the toolbar before you finish the session and close ScenarioWizard.
The first opening of an empty cim displays the matrix editor with highlighted cells, but without zeros
(this gives the user the opportunity to create and print easily a blank cim form and fill it out by hand).
In order to display the window of an empty cim including zeros, close the matrix editor by pressing
the “Accept” button and open the matrix editor again. Now all relevant fields will be filled with zeros.
Chapter 7.3 provides some hints for the use of the matrix editor if the descriptor type option is se-
lected.
5.8 Entering cross-impact comments in the matrix editor
To explain the definition of the descriptors and the ideas behind the cross-impact judgements the
user can enter text into “comment windows”. This is useful for the documentation of the reasoning
on which the analysis is based and makes it easier to discuss the analysis results with the target
group of the analysis.
The comment window of a descriptor is opened by clicking on the descriptor’s name (or on any of its
variants) in the left column using the right mouse button. A small text window appears in which the
comment can be entered or a existing comment can be modified. The title of the text window refers
to the short name of the descriptor. After finishing the comment, the text window can be closed by

ScenarioWizard 4.3 34
its close button. Double quotation marks (") are not permitted in comments and are automatically
converted into single quotation marks once the comment window is closed.
To enter a comment on the impact of descriptor x on descriptor y click on any cell of the respective
judgement section using the right mouse button.
A click on the blue cell top left of the matrix (containing the name of the project file) opens the
comment window for general project information (e.g. project name, purpose of the analysis, project
team, project publications ...).
Fig. 5-7: The comment window. In this example, a comment on the descriptor “A. Government” is
displayed.
Comments are optional and don’t influence the scenario calculations. Yet they are used for the
automatic scenario report, if available (cf. section 6.3).
All comments are integrated into the project file database and they will be stored and loaded when
the project file is stored or loaded.

ScenarioWizard 4.3 35
The menu item Edit - Show comments produces a compilation of all comments of the project. The
compilation can be transferred into a word processor by copy-and-paste or it can be printed by the
print button of the window. Descriptors or judgement sections without comment are skipped in the
compilation. The menu item Edit - Show comments is only available if at least one comment exists.
The comments of a project can be erased by the menu item File - Reset ... Clear comments. The
analysis structure and the cross-impact data of the project stay unchanged by this command.
5.9 Entering and editing cross-impact data using the section editor
Cross-impact data can be entered and edited step-by-step using the „section editor”. This editor only
displays a single judgement section representing the impact of one descriptor onto another descrip-
tor without displaying the entire matrix. The advantage of this editor type is that restricting the dis-
play to a single section helps to concentrate on the specific descriptor relationship under work.
The section editor is activated by the menu item Edit - Cross-impact section or by the button in
the toolbar. The editor can be opened only if an analysis structure have been generated or loaded
before (cf. sections 5.2 - 5.3). While the section editor is open, all menu items are disabled to avoid
the storage or evaluation of unconfirmed data (except for the menu item Info). The toolbar is also
deactivated. Fig. 5-8 shows the section editor for the judgement section “B. Foreign policy impacts on
A. Government”.
The row descriptor (impact source) and the column descriptor (impact target) of the judgement sec-
tion can be selected from the combo boxes “Select row” and “Select column”. The selection can be
changed also by the arrow buttons below the combo boxes. It is also possible to click on the selection
field of a combo box and to scroll through the descriptors by turning the mouse wheel.
The selected descriptors (brown background) and their variants (grey background) are shown below
the combo boxes. The cross-impact data can be edited by clicking on a cell and entering a new value
using the keyboard or the plus/minus buttons. Changes are stored in the ScenarioWizard workspace
once a new judgement section is selected or the section editor is closed.
The width of the name labels adapt to the length of the names. If necessary the width of the editor
window is increased. Very long names may be displayed incompletely, however. In this case, the
complete name of a descriptor or a variant can be depicted by clicking on the name label using the
left mouse button. While the mouse button is pressed down the name label will be expanded in or-
der to show the complete name. Once the mouse button is released the name label shrinks to its
normal size.

ScenarioWizard 4.3 36
Fig. 5-8: The section editor displaying the judgement section “B. Foreign policy impacts on A. Gov-
ernment”.
When a diagonal judgement section is selected by the user, the section is printed in grey and no data
entry is accepted. Diagonal judgement sections are accessible for entry only if the option “Diagonal
elements” (cf. chapter 7.1) is activated.
Statements explaining the ideas behind the judgements can be entered into the text window “Expla-
nations” at the bottom of the sections editor. The explanations are stored into the ScenarioWizard
workspace once a new judgement section is selected by the user or the section editor is closed.
Extension “Descriptor comments”
Thinking about cross-impacts and delivering judgements needs a proper awareness of the definitions
of the involved descriptors. This is the reason why users are encouraged to formulate their defini-
tions of the descriptors and store them in “descriptor comments” when building the analysis struc-
ture (cf. chapter 5.4).
The descriptor comments can be displayed by pressing the extension button “>” at the right side of
the sector editor window Fig. 5-8. When pressed the editor window is expanded to the right side and
text windows for the row descriptor (upper part) and the column descriptor of the selected judge-
ment section (lower part) is shown (Fig. 5-9). The descriptor comment windows are read-only win-

ScenarioWizard 4.3 37
dows. Rather use the structure editor (chapter 5.4) or the matrix editor (chapter 5.8) to edit the de-
scriptor comments.
Fig. 5-9: The section editor with activated extension „Descriptor comments“.
While the extension “Descriptor comments” is open, the respective extension button on the right
side of the window is labelled as “<” and can be used to fold in the extension.
Extension “Navigator”
The button “<” on the left side of the section editor unfolds an extension containing control elements
for navigating through the matrix and selecting a section (Fig. 5-10).
The navigation graphic represents the cross-impact matrix as a field of colored cells. Each cell stands
for a judgement section. Black cells are assigned to diagonal sections which are inaccessible for regu-
lar cross-impact matrices. White cells represent empty sections without cross-impact data and with-
out any explanations. Light blue cells stand for judgement sections containing data or text and dark
blue cells show that the corresponding judgement section contain both data and text. The red cell
marks the currently edited judgement section.

ScenarioWizard 4.3 38
Fig. 5-10: The section editor with activated extensions „Descriptor comments“ and “Navigator”.
The array buttons beneath the navigation graphic move the focus of the section editor across the
matrix. Their function is identical with the function of the array buttons in the main sector of the
section editor. The section can be selected also by clicking on the respective cell of the navigation
graphic.
Beneath the arrow buttons the shares of judgement sections with/without data and text are printed.
This information can be used to observe the work status when building up a cross-impact matrix. To
this end it is useful to enter at least a blank or, e.g., the notation “n.a.” into the “Explanation” text
box even if all cross-impacts of a judgement section were assessed to be zero. In this case the share
of the white cells in the navigation graphic indicates the quota of undealt judgement sections in the
matrix.
While the extension “Navigator” is open, the respective extension button on the left side of the win-
dow is labelled as “>” and can be used to fold in the extension.

ScenarioWizard 4.3 39
5.10 Standardization
Standardization means that the sum of each judgement group (one line within a judgement section)
should be zero. Standardization is not necessitated by the mathematics of CIB, but it enhances the
comprehensibility of the data and the results. Users are free to decide if they wish to apply stan-
dardization or not. If standardization shall be applied ScenarioWizard provides two tools to support
the application of the standardization rule:
Check standardization
The menu item Edit - Standardization ... Check standardization instructs the program to check the
standardization of all judgement groups. In this procedure, the program checks the data and high-
lights all judgement groups found with invalid standardization. If the matrix contains only correctly
standardized groups, no cells are highlighted.
Execute standardization
The menu item Edit - Standardization ... Execute standardization enables a standardization of the
currently loaded cross-impact matrix to be performed. ScenarioWizard first of all checks whether a
standardization is necessary. If this is the case, and a security query is confirmed, the whole matrix is
multiplied by a suitable integer number. Afterwards, the mean value of each judgement group will be
subtracted within this group. These calculations obey the invariance laws of CIB. They therefore re-
sult in a standardization without changing the set of consistent scenarios and their weights.
The menu item Edit – Standardization is only available if an analysis structure and a cross-impact
matrix have already been defined.
5.11 Factor multiplication
The menu item Edit - Factor Multiplication multiplies the entire cross-impact matrix by a uniform
factor. The factor can be a positive or negative number. The factor can also be a non-integer number
(decimal separation character: point). In this case, the calculated cross-impact values are rounded to
integer numbers and the standardization of a matrix may be cancelled. Fig. 5-11 shows the query for
the multiplication factor.
Because of the invariance laws of CIB, the multiplication of a cross-impact matrix with a positive inte-
ger number does not affect the solution of the matrix. Factor multiplication by a non-integer number
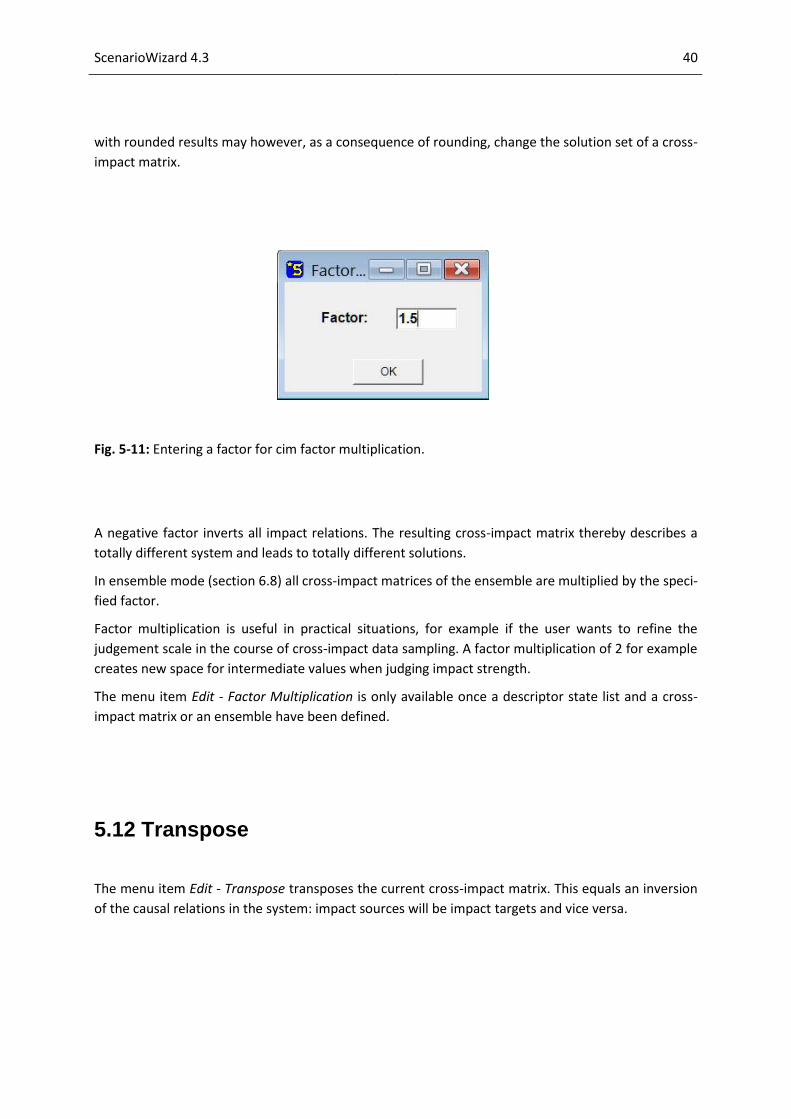
ScenarioWizard 4.3 40
with rounded results may however, as a consequence of rounding, change the solution set of a cross-
impact matrix.
Fig. 5-11: Entering a factor for cim factor multiplication.
A negative factor inverts all impact relations. The resulting cross-impact matrix thereby describes a
totally different system and leads to totally different solutions.
In ensemble mode (section 6.8) all cross-impact matrices of the ensemble are multiplied by the speci-
fied factor.
Factor multiplication is useful in practical situations, for example if the user wants to refine the
judgement scale in the course of cross-impact data sampling. A factor multiplication of 2 for example
creates new space for intermediate values when judging impact strength.
The menu item Edit - Factor Multiplication is only available once a descriptor state list and a cross-
impact matrix or an ensemble have been defined.
5.12 Transpose
The menu item Edit - Transpose transposes the current cross-impact matrix. This equals an inversion
of the causal relations in the system: impact sources will be impact targets and vice versa.
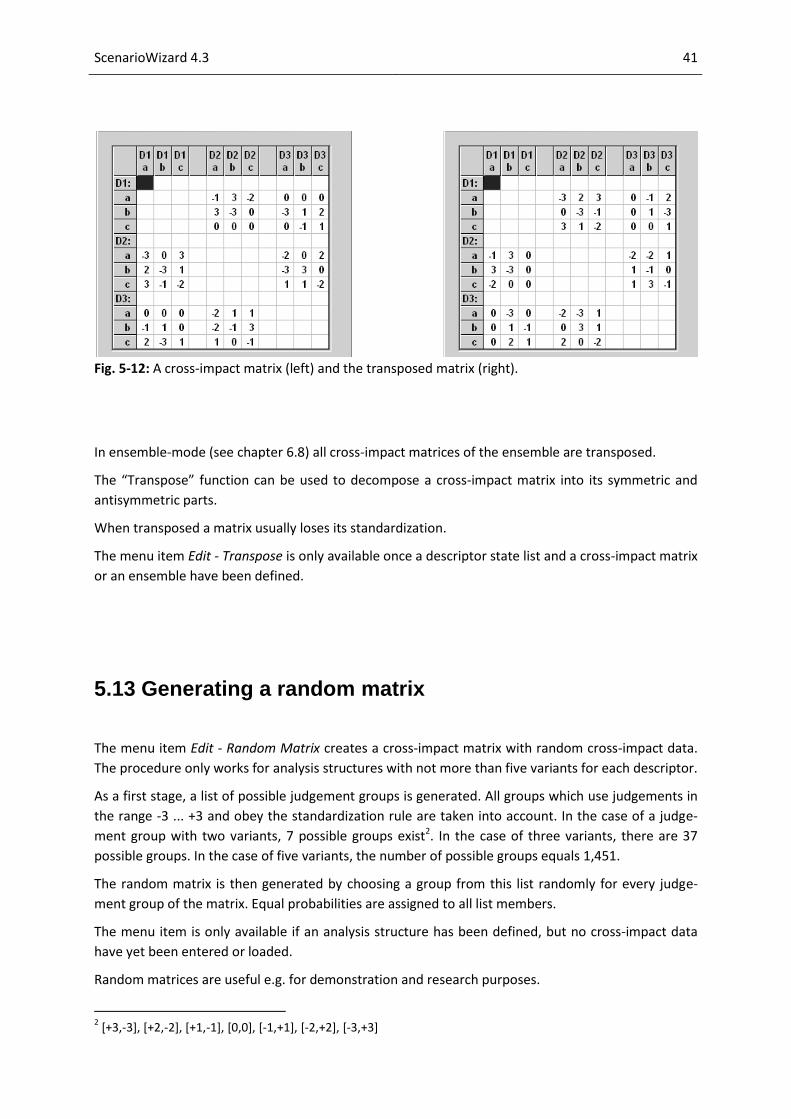
ScenarioWizard 4.3 41
Fig. 5-12: A cross-impact matrix (left) and the transposed matrix (right).
In ensemble-mode (see chapter 6.8) all cross-impact matrices of the ensemble are transposed.
The “Transpose” function can be used to decompose a cross-impact matrix into its symmetric and
antisymmetric parts.
When transposed a matrix usually loses its standardization.
The menu item Edit - Transpose is only available once a descriptor state list and a cross-impact matrix
or an ensemble have been defined.
5.13 Generating a random matrix
The menu item Edit - Random Matrix creates a cross-impact matrix with random cross-impact data.
The procedure only works for analysis structures with not more than five variants for each descriptor.
As a first stage, a list of possible judgement groups is generated. All groups which use judgements in
the range -3 ... +3 and obey the standardization rule are taken into account. In the case of a judge-
ment group with two variants, 7 possible groups exist2. In the case of three variants, there are 37
possible groups. In the case of five variants, the number of possible groups equals 1,451.
The random matrix is then generated by choosing a group from this list randomly for every judge-
ment group of the matrix. Equal probabilities are assigned to all list members.
The menu item is only available if an analysis structure has been defined, but no cross-impact data
have yet been entered or loaded.
Random matrices are useful e.g. for demonstration and research purposes.
2 [+3,-3], [+2,-2], [+1,-1], [0,0], [-1,+1], [-2,+2], [-3,+3]

ScenarioWizard 4.3 42
5.14 Exporting a cross-impact matrix
The menu item File - Save ... export exports the current cross-impact matrix into a html file. In this
file, the matrix is represented in a formatted fashion, ready to be used for documentations or print-
outs. Since many programs offer an import function for html files, the “Export“ item enables the user
to pass a matrix into a word processor, spreadsheet or presentation software. In the case of “MS
Office“, it is advisable to import the html file first into “Excel“ and to copy the imported table into
“Word” or “Powerpoint”. The indirect import via “Excel” leads to a prettier result. E.g. the matrix Fig.
5-6 is converted by the export function as shown in Fig. 5-13.
The menu item File - Save … export is not available until a descriptor state list has been defined. Fur-
thermore, “Export” is not available while ScenarioWizard is in the ensemble-mode (cf. chapter 6.8).
Fig. 5-13: A matrix generated by the “Export“ function.

ScenarioWizard 4.3 43
5.15 Importing a cross-impact matrix
The menu item File - Load ... import imports a csv-formated cross-impact matrix. The menu item is
only available once a descriptor state list (dsl) has been loaded (cf. chapter 5.2). The import function
reads the cross-impact data of the csv file whereas the names of the descriptors and states of the
current dsl remain unchanged. If there are unsaved cim data in ScenarioWizard’s workspace a warn-
ing will appear before starting the import procedure.
To be ready for import a csv file must show a specific structure. The requested structure corresponds
to the usual structure of a cross-impact matrix (cf. Fig. 5-13) and is shown in Appendix 3. However, it
is not necessary for the user to deal with these conditions. Exporting a cross-impact matrix using
ScenarioWizard’s export function (cf. chapter 5.14), loading the exported file into MS Excel or an-
other suitable spreadsheet application, editing the cross-impact data using the spreadsheet applica-
tion, and saving the spreadsheet as a csv-file (separator: semicolon) generates automatically a valid
csv-file suitable for import.
This procedure proves useful for expert surveys if persons without access to ScenarioWizard are
asked to contribute to a CIB analysis by giving their cross-impact judgements. Exporting a cross-
impact matrix containing only the analysis structure without cim data and loading the exported file
into a spreadsheet provides a suitable blank form which can be distributed to the experts. Saving the
completed spreadsheets as csv-files and importing the csv-files into ScenarioWizard avoids the ef-
forts and possible errors of a manual data entry.
A valid import requests:
the number of the descriptors and states of the current dvl-data in ScenarioWizard’s work-
space must match the number of the descriptors and states of the imported csv-file;
the long- and short-names of the descriptors and their states stored in the csv-file must fol-
low ScenarioWizard’s conventions. I.e. the names must not contain commas (,) nor double
quotation marks (").
Otherwise the import may terminate with an error message or it may result in corrupted cross-
impact data.
Once the csv-file was generated take care to close the speadsheet application before you start Sce-
narioWizard‘s import function. Otherwise the csv-file might be linked to the spreadsheet application
and access to the csv-file is denied. In this case ScenarioWizard produces an error message and ter-
minates the import procedure.
5.16 Importing dzl and cim data
Since version 4 ScenarioWizard uses integrated project files (file name extension .scw, cf. section
5.1). Earlier program versions have used separate files for storing the analysis structure (.dzl files)

ScenarioWizard 4.3 44
and for storing the cross-impact data (.cim files). In order to preserve the usability of older data
stocks ScenarioWizard4 offers an import function for dzl- and cim-files. To import dzl- and cim-files
use the menu item File - Import ... descriptor-variant-list and the menu item File - Import ... cross-
impact matrix. As in older ScenarioWizard versions the dzl file has to be imported before the cim file
is loaded.
After that the imported data can be processed as usual. They can be displayed, modified, evaluated
and stored in scw files. Storing data using the former dzl and cim data formats is not supported.
5.17 Workbooks
"Workbooks" generated by ScenarioWizard are html-documents showing the cross-impact matrix
divided into its judgment sections. They comprise a compilation of "sheets", each of them displaying
one single judgment section in the style of the "Section Editor" (cf. chapter 5.9).
Workbooks can be generated for empty cross-impact matrices (i.e. after generating or loading the
analysis structure but without entering cross-impact data into the matrix). This type of workbook is
intended, for instance, to be used as blank forms in expert interviews (Fig. 5-14).
Fig. 5-14: A workbook sheet of an empty matrix to be used as a blank form.

ScenarioWizard 4.3 45
Workbooks can be generated also for completed matrices. This workbook type is used for supporting
the review and discussion of the cross-impact judgments documented in the completed matrix (Fig.
5-15). Zero judgments cells are left empty for the sake of greater clarity.
Fig. 5-15: A workbook sheet containing cross-impact data and text.
There are two variants of workbooks available: in workbooks sorted by cols each workbook chapter
represents one column of the cross-impact matrix, e.g. all impact on a descriptor. Within the chapter
each judgment section of the column starting from above is shown in its own workbook sheet.
In workbooks sorted by rows the opposite is true: each workbook chapter represents one row of the
cross-impact matrix, e.g. all impacts exerted by a descriptor. Within the chapter each judgment sec-
tion of the row is shown in a separate sheet (starting from the left side).
Using a workbook sorted by cols means to study a descriptor focusing its role as an impact target. On
the other hand, using a workbook sorted by rows has the purpose to study a descriptor in its role of
an impact source.
Fig. 5-14 and Fig. 5-15 are extracted from a workbook sorted by cols. "Section 1-2" is the second
sheet of the first chapter. The first chapter deals with all impacts exerted on the descriptor "A. Gov-
ernment". The second sheet of chapter one shows the impact of descriptor "B. Foreign policy" on "A.
Government".

ScenarioWizard 4.3 46
Workbooks are generated using the menu item Books - Workbooks sorted by cols or Books - Work-
books sorted by rows. These menu items are available only after an analysis structure was generated
(chapter 5.3) or a project file was loaded (chapter 5.2). Generating the workbook of a large matrix
can take several minutes because the workbook might contain several hundred or thousand pages.
Once the generation of the workbook is completed an input form is shown requesting the file name
and storage location.
Workbooks are generated in html format because this format offers a broad variety of possible uses.
The workbooks can be displayed directly by a browser but also printed into a pdf file using the print
function of the browser. The workbook contains line breaks between the sheets. The line breaks are
inactive when the workbook is displayed by a browser but become active once the workbook is con-
verted into a pdf file.
Workbooks have the following structure:
Table of contents. The items of the table of contents are linked and the respective chapters
and sheets can be jumped at by mouse click.
Chapter 0: This chapter contains the descriptor essays (if available).
Chapter 1 ... Chapter D (number of descriptors). Each chapter is structured as follows:
o The first page of the chapter shows a list of all impact sources (resp. impact targets)
dealt with in the chapter. All impacts to which any data is assigned are marked by
"X".
o One page ("sheet") for each impact showing the respective judgment section.
A special type of workbook is generated when the function "workbook" is used in the ScenarioWizard
ensemble mode. This case is described in chapter 6.9.
5.18 Displaying project information
The menu item Info - Project information provides some basic information about the current project.
The following data are listed:
Name of the project file (if defined).
The project description (if specified, cf. section 5.8).
The number of descriptors.
The total number of all descriptor variants.
A statistics on the number of variants per descriptor.
Number of configurations (number of ways to combine the descriptor variants).
Number of judgement sections and the share of empty sections.
Number of judgement cells and their judgement statistics.
List of primary or secondary autonomous descriptors (if any, cf. section 12).
List of primary or secondary passive descriptors (if any, cf. section 12).
This menu item is available only after loading of building up a project.

ScenarioWizard 4.3 47
6 Evaluating a cross-impact matrix
Having specified the descriptor state list and the cross-impact data, the evaluation of the thus de-
fined qualitative system model may begin. The evaluation aims at determining the credible combina-
tions of qualitative descriptor-states, so that these “scenarios” are compatible with the insights ex-
pressed by the cross-impact data.
The evaluation procedures of the Solve menu item are only available if a descriptor state list and a
cross-impact matrix have already been defined.
6.1 Calculating a system-grid
A system-grid is a simple tool for assessing the role of the descriptors in the analysed system. The
descriptor assessment is a widely used preparation step for the actual scenario construction process.
The general procedure to prepare a system-grid is to calculate the sum of all impacts exerted by a
descriptor (“active sum”) and to calculate the sum of all impacts exerted onto a descriptor (“passive
sum”)3.
CIB offers a straightforward approach to this type of analysis. As a measure of the impact of descrip-
tor A on descriptor B, the average of all absolute values within the respective judgement section4 is
defined. The active sum of a descriptor is then calculated by summing up all impact measures within
the descriptor’s row. Correspondingly, the passive sum of a descriptor is calculated by summing up
all impact measures within the descriptor’s column. Plotting all descriptors in a diagram, the passive
sum serving as x-coordinate and the active sum serving as the y-coordinate yields the “system grid”.
ScenarioWizard’s menu item Analyse - System-Grid generates a system-grid of the current project.
The analysis is available as soon as cross-impact data were defined by loading a project file or enter-
ing cross-impact data into the cim-editor. The system-grid of the exercise “Somewhereland” is shown
in Fig. 6-1.
3 Cf. Gausemeier J., Fink A., Schlacke O.: Scenario management - an approach to develop future potentials.
Technological Forecasting and Social Change, 59, 111-130, 1998.
4 For a definition of a judgement section see the glossary in chapter 12.

ScenarioWizard 4.3 48
Fig. 6-1: System-grid of „Somewhereland“.
All descriptors are plotted in the diagram using their short names. Descriptors at the top left of the
diagram (none in this example) are interpreted as descriptors able to control a system in an effective
way. Descriptors at the bottom right of the system-grid (none in this example) can be understood as
dependent descriptors following the guiding of the other descriptors without too much influence on
the events in the system. Descriptors settling the top right domain in the diagram are descriptors
exerting strong influence on the system and, at the same time, sensing strong influence. This type of
descriptors is usually connected with the potential emergence of complex system behaviour.
However, the system-grid, being based only on an analysis of direct impacts, is a rather simple as-
sessment method. The results should be interpreted as helpful, but provisional conclusions. A deeper
understanding of the descriptor’s role in the system, reflecting the direct influences as well as the
indirect influences and also the context sensibility of impact effects, should include a scenario-based
analysis.

ScenarioWizard 4.3 49
6.2 Analysing the impact balances of a scenario
The heart of the CIB method is the assessment of the internal consistency of a scenario by calculating
its impact balances (cf. section 2.3.2). They are derived by inserting the scenario assumptions into
the cross-impact matrix thus showing if one or more scenario assumptions are at odds with the other
parts of the scenario or, otherwise, if there are no contradictions between the scenario assumptions
and the scenario can be assessed to be internal consistent.
The calculation of the impact balances can be done calling the menu item Analyse - Impact balance
or pressing the button in the toolbar. The impact balance form is available only after a pro-
ject is loaded or built up using the structure editor and the cim editor (cf. sections 5.3 and 5.7).
Fig. 6-2: The form for calculating the impact balances of a scenario.
The form displays the structure of the cim. In the row “Selection” at the top the user can select the
variants for each descriptor, thus defining the scenario under investigation. The selected variant is
marked by “x”. When the form is opened, the first variant of each descriptor is selected as a default
setting. In Fig. 6-2 the scenario

ScenarioWizard 4.3 50
z = [ A2 B1 C3 D1 E1 F1 ], i.e.:
Government: "Prosperity party", foreign policy: cooperation, economy: dynamic, distri-
bution of wealth: balanced, social cohesion: social peace, social values: meritocratic
known from the CIB introduction in chapter 2.3.2 is selected. In the matrix all rows representing the
selected descriptor variants are highlighted. The sum of all highlighted rows yields the impact bal-
ances of the scenario. It is displayed in the row “Balance” (third row). After each change of the selec-
tion, the highlighting of rows and the impact balances are updated. If a descriptor is “forced” (cf.
section 6.7) its impact balance is not displayed because the impact balance of a forced descriptor is
meaningless.
CIB rates an impact balance to be consistent if the impact sum of the selected variant is not sur-
passed by the impact sum of another variant of the same descriptor (cf. section 2.3.2). Inconsistent
impact balances are printed on red background in the row “Balance”. In Fig. 6-2 this is the case for
descriptor “D. Distribution of wealth”.
The form “Impact balance” can be used to identify in an easy way which parts of a scenario contrib-
ute to the consistency (or inconsistency) of a scenario assumption. Fig. 6-2 reveals that the scenario
assumption “Distribution of wealth: balanced” is assessed to be inconsistent because three other
scenario assumptions contradict this statement (i.e. they contribute to the negative impact sum of
the assumption D1): the economy oriented policy of the government, the dynamic economy and the
meritocratic social values.
In order to avoid unclear data states, the menu bar remains inaccessible while the impact balance
form is open. The toolbar is also deactivated.
The impact balance form offers several services to support the tracking of the internal connections of
a scenario. These services are described in the following.
Impact diagrams
Selecting a descriptor’s impact balance (row “Balance” of Fig. 6.2) by mouse click and then clicking
with the right mouse button calls a diagram displaying all impacts on the selected variant of the re-
spective descriptor. Fig. 6-3 shows the impact diagram of descriptor variant „E. Social value: meri-
tocratic“ in scenario [ A2 B1 C3 D1 E1 F1 ]. The diagram depicts the promoting impacts (green) and
the hindering impacts (red) on a certain scenario assumption (yellow) under the conditions of the
scenario selected in the impact balance form.

ScenarioWizard 4.3 51
Fig. 6-3: Impact diagram of descriptor variant „E. Social value: meritocratic“ in scenario [ A2 B1 C3 D1
E1 F1 ].
Impact diagrams can be drawn up to a maximum number of ten active impacts. A black-and-white
printout of the diagram can be generated in the window’s context menu (click with the right mouse
button on the window to call its context menu). Furthermore, the diagram can be stored into a html-
file using the button "Save".
Succession
Scenario succession is a CIB procedure to find a consistent scenario. The succession starts with an
initial scenario, computes the impact balances by summing up the cross-impacts of all rows of the
scenario, and switches all descriptor states to the states of maximum impact score within every de-
scriptor impact balance. This procedure is repeated until it yields a consistent scenario (or a cycle,
i.e. a repetitive series of scenarios). Once a consistent scenario is found it does not change under the
application of further iteration steps.
Choose an initial scenario by clicking on the appropriate descriptor variants in the row “Selection”
before starting the scenario succession (when the window is opened, the first variant of each de-
scriptor is selected as a default setting). The rows of the selected variants are highlighted in the ma-
trix. Every change to the selection also updates the highlighting of the rows and the impact balances
in the row “Balance”.
Click the “Succession“ button to switch all descriptor states to the states of maximum impact score
within a descriptor’s impact balance, in accordance with the CIB scenario succession rules56. Row and
impact balance highlighting is also updated. The result is shown in
Fig. 6-4 (see below for the “Succession protocol”). The window is now ready for the next step.
5 In case of a tie, the first value of maximum score is selected.
6 Other succession rules can be chosen in the option window Options - Evaluation options (section 7.1).

ScenarioWizard 4.3 52
Fig. 6-4: The window “Impact balances“ (Fig. 6-2) after the application of one succession step.
The succession procedure is iterated by clicking the “Succession“ button repeatedly. This leads to one
of two possible results: i) After a few steps, there are no more changes to the scenario. A consistent
scenario has been found. ii) After a few steps, the sequence of scenarios begins to repeat itself. A
scenario cycle has been found.
If the matrix possesses only one solution (one consistent scenario or one cycle), every succession will
lead to this solution after a sufficient number of steps, no matter which initial scenario was chosen. If
the matrix possesses more than one solution, the choice of the initial scenario dictates which solu-
tion will emerge from the succession. The probability that an initial scenario chosen arbitrarily will
lead to a specific solution can be calculated by dividing the attractor weight of the solution (cf. sec-
tion 7.1) by the sum of the attractor weights of all solutions.

ScenarioWizard 4.3 53
Protocol
The button “Protocol“ opens a listing of the succession. The scenarios of the succession are printed in
lines using the coded format (cf. section 7.2 for an explanation of the “coded“ scenario representa-
tion). The protocol will be reset once the “Impact balance“-window is reopened or if a new initial
scenario is selected by clicking a descriptor variant in the “Selection“ row.
Report
The button “Report” generates a scenario report on the current scenario as set in the row “Select”.
The “Report” function is described in detail in section 6.3.
Export
The button Export prints the current cross-impact matrix, the selected states and its impact balances
into a html-file. The data shown in Fig. 6-4 will be stored as shown in Fig. 6-5.
Fig. 6-5: Html export of Fig. 6-4.

ScenarioWizard 4.3 54
The arrows above the balances refer to the selected descriptor variants.
This type of depiction is useful for the analysis of the sources of consistency or inconsistency of a
descriptor, and useful for improving the understanding of the internal logic of a consistent scenario
or the shortcomings of an inconsistent scenario.
Just as exported cross-impact matrices (see chapter 5.14), exported impact balance data can be im-
ported not only by html-browsers, but also by various standard application programs, e.g. by MS
Excel.
Hide inactive rows
Activating the checkbox “Hide inactive rows” compresses the form “impact balances” by cutting out
all inactive rows (i.e. the rows of variants not selected in the row “Selection”). In the compressed
format it is easier to understand the calculated impact balances because they simply result from
summing up the depicted rows.
Deactivating the checkbox restores the normal state of the form, showing active as well as inactive
rows.
6.3 Generating an automatic scenario report
The button “Report” in the impact balance window (cf. section 6.2) and the button “Rp” in the
evaluation protocol “Consistent scenarios” (cf. section 6.4) start the automatic generation of a sce-
nario report. The report discusses the plausibility of the scenario assumptions and compiles the pros
and the cons for each assumption. If available, the descriptor and cross-impact comments (cf. section
5.8) will be integrated in the report to back the argumentation. The report shows the following struc-
ture:
Project information
If available the general project information (cf. section 5.8) opens the report. If no general project
information was entered into the comment database, this section is skipped.
Scenario topic
In this section lists the comments defining the descriptors provided that comments are available for
at least one descriptor. Otherwise, the section is skipped.
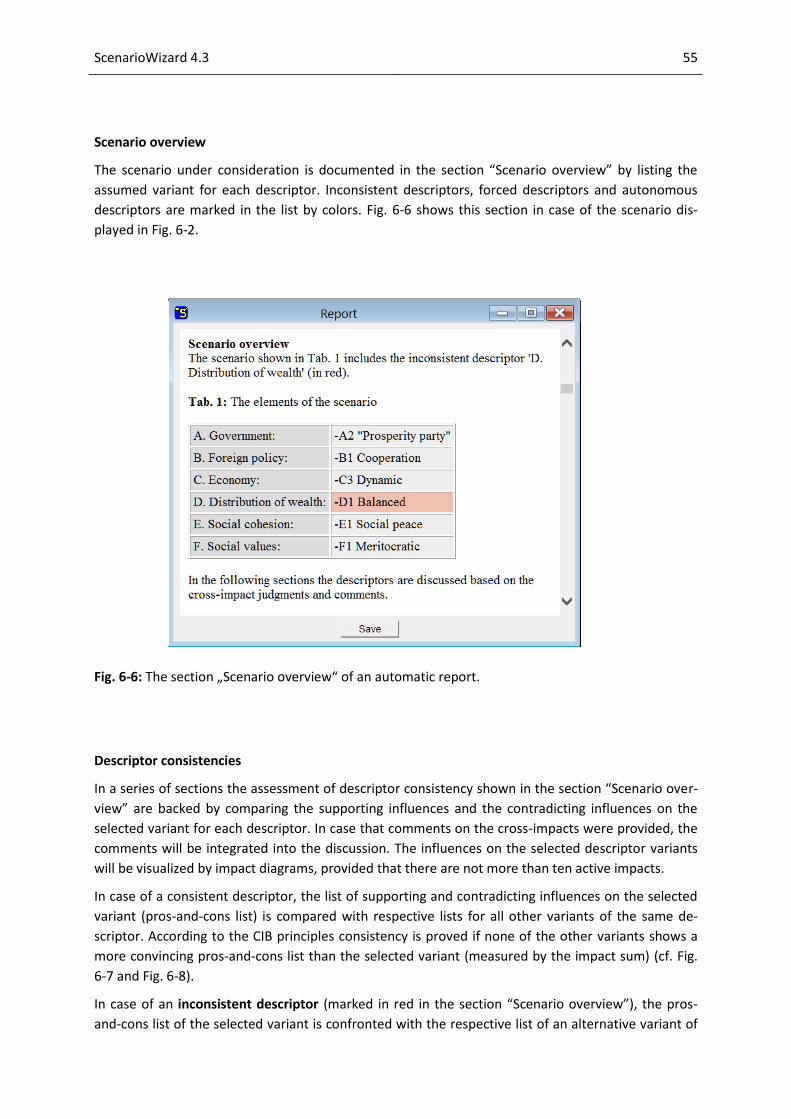
ScenarioWizard 4.3 55
Scenario overview
The scenario under consideration is documented in the section “Scenario overview” by listing the
assumed variant for each descriptor. Inconsistent descriptors, forced descriptors and autonomous
descriptors are marked in the list by colors. Fig. 6-6 shows this section in case of the scenario dis-
played in Fig. 6-2.
Fig. 6-6: The section „Scenario overview“ of an automatic report.
Descriptor consistencies
In a series of sections the assessment of descriptor consistency shown in the section “Scenario over-
view” are backed by comparing the supporting influences and the contradicting influences on the
selected variant for each descriptor. In case that comments on the cross-impacts were provided, the
comments will be integrated into the discussion. The influences on the selected descriptor variants
will be visualized by impact diagrams, provided that there are not more than ten active impacts.
In case of a consistent descriptor, the list of supporting and contradicting influences on the selected
variant (pros-and-cons list) is compared with respective lists for all other variants of the same de-
scriptor. According to the CIB principles consistency is proved if none of the other variants shows a
more convincing pros-and-cons list than the selected variant (measured by the impact sum) (cf. Fig.
6-7 and Fig. 6-8).
In case of an inconsistent descriptor (marked in red in the section “Scenario overview”), the pros-
and-cons list of the selected variant is confronted with the respective list of an alternative variant of

ScenarioWizard 4.3 56
the same descriptor showing a better balance of pros and cons, thus disproving the consistency of
the scenario assumption for the respective descriptor.
Forced descriptors and descriptors which are not object to any impact (“autonomous descriptors”)
are skipped in this section because the question of consistency is meaningless in these cases.
Fig. 6-7: Comparing the supporting and the contradicting influences on a scenario element.
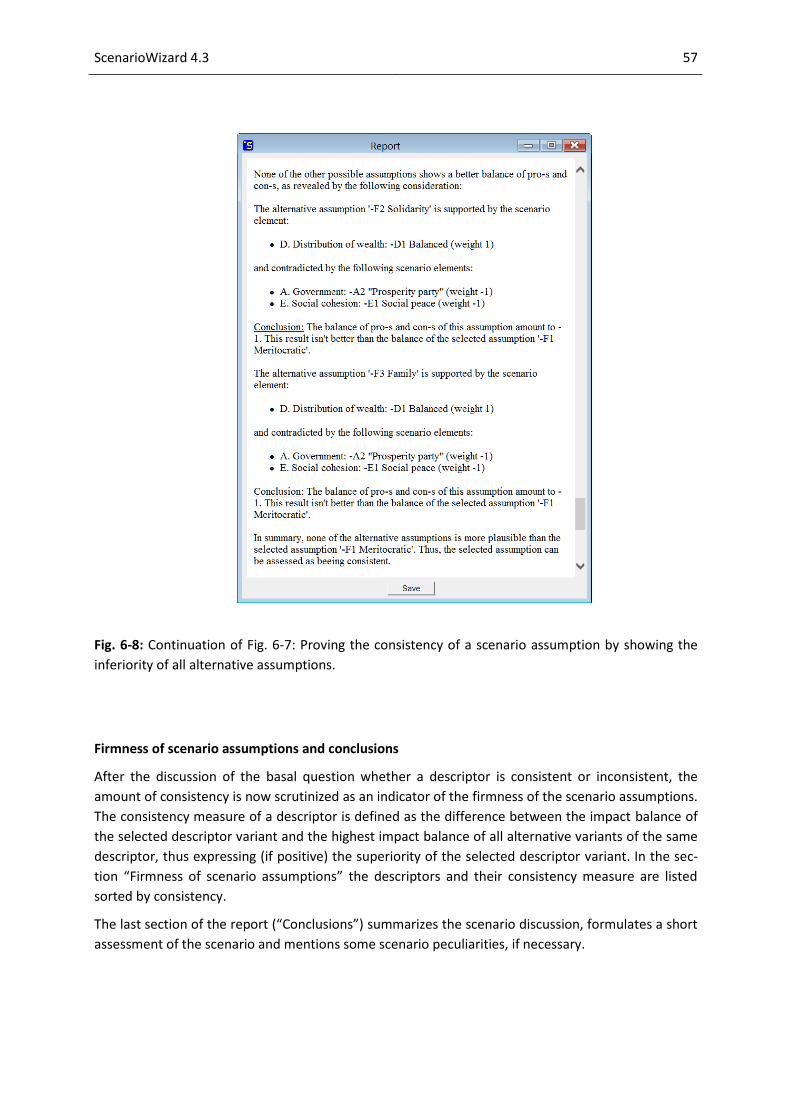
ScenarioWizard 4.3 57
Fig. 6-8: Continuation of Fig. 6-7: Proving the consistency of a scenario assumption by showing the
inferiority of all alternative assumptions.
Firmness of scenario assumptions and conclusions
After the discussion of the basal question whether a descriptor is consistent or inconsistent, the
amount of consistency is now scrutinized as an indicator of the firmness of the scenario assumptions.
The consistency measure of a descriptor is defined as the difference between the impact balance of
the selected descriptor variant and the highest impact balance of all alternative variants of the same
descriptor, thus expressing (if positive) the superiority of the selected descriptor variant. In the sec-
tion “Firmness of scenario assumptions” the descriptors and their consistency measure are listed
sorted by consistency.
The last section of the report (“Conclusions”) summarizes the scenario discussion, formulates a short
assessment of the scenario and mentions some scenario peculiarities, if necessary.

ScenarioWizard 4.3 58
Fig. 6-9: The sections „Firmness of scenario assumptions“ and „Conclusions“ of an automatic sce-
nario report.
6.4 Computing consistent scenarios
The computation of the consistent scenarios is the basic evaluation in CIB analysis. Each consistent
scenario is a bundle of mutually supporting assumptions. Consistent scenarios are calculated using
the menu item Analyse - Consistent Scenarios or the button on the toolbar.
A progress bar displays the course of the calculation. The evaluation of small cross-impact matrices
(e.g. with 10 descriptors) is carried out within a few seconds. The computation of large matrices (e.g.

ScenarioWizard 4.3 59
with 20 descriptors) can take several minutes to hours, depending on the performance of the com-
puter.
Once the calculation is completed an evaluation protocol appears. It displays all computed consistent
scenarios. Fig. 6-10 shows the evaluation protocol of the example Fig. 5-6.
The first line of the evaluation protocol displays the name of the evaluated matrix and the used con-
sistency mode (“Strong consistency“ is the default setting. Other consistency modes are described in
section 7.1). In case of the option „Volume weights“ or “Attractor weights” (cf. section 7.1, default:
deactivated) a line indicating the weight type follows. In case of the option “Attractor weight” the
succession mode is also printed (default setting: “Global succession”, cf. section 7.1).
Now follows a print-out of the consistent scenarios. In this case ten consistent scenarios exist. Each
scenario report starts with a header (in case of the default output option. For other output options
cf. section 7.2). It contains the current number, the weight7 (only in case of activated weight calcula-
tion, default: deactivated), the consistency value, and the total impact score (the sum of the impact
scores of all selected states of a scenario) of the scenario. In case of the option "Max. inconsistency“
and a maximum-inconsistency value >0 (cf. chapter 7.1) the header is completed by the number of
inconsistent descriptors. Then the descriptor variants that together form the suggested combination
are listed.
The text box of the evaluation protocol can be scrolled. Use the mouse to mark sections or all of the
protocol text. This can be copied into a word processor using the CTRL-C and CTRL-V key combina-
tions.
7 In case of the option „Volume weights“, weight number can be non-integer. The evaluation protocol shows
rounded weight numbers then.
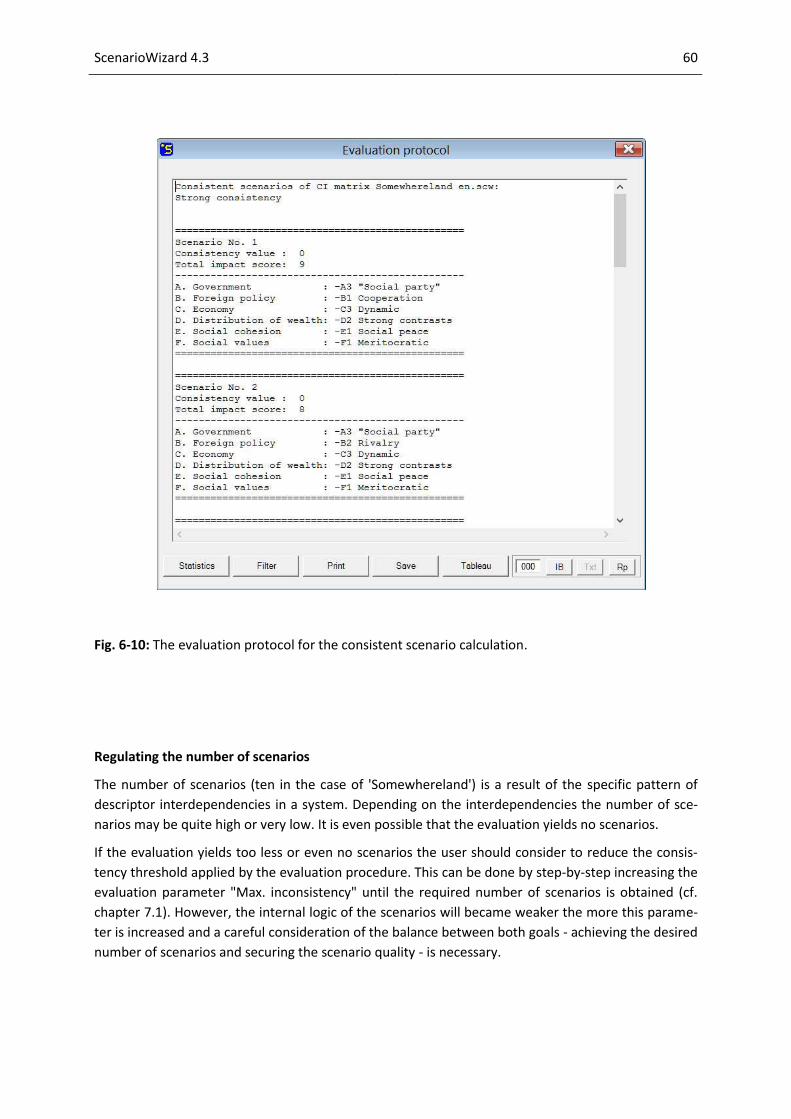
ScenarioWizard 4.3 60
Fig. 6-10: The evaluation protocol for the consistent scenario calculation.
Regulating the number of scenarios
The number of scenarios (ten in the case of 'Somewhereland') is a result of the specific pattern of
descriptor interdependencies in a system. Depending on the interdependencies the number of sce-
narios may be quite high or very low. It is even possible that the evaluation yields no scenarios.
If the evaluation yields too less or even no scenarios the user should consider to reduce the consis-
tency threshold applied by the evaluation procedure. This can be done by step-by-step increasing the
evaluation parameter "Max. inconsistency" until the required number of scenarios is obtained (cf.
chapter 7.1). However, the internal logic of the scenarios will became weaker the more this parame-
ter is increased and a careful consideration of the balance between both goals - achieving the desired
number of scenarios and securing the scenario quality - is necessary.

ScenarioWizard 4.3 61
The evaluation protocol window contains the following buttons:
Statistics
The interpretation of solution sets with many consistent scenarios can be aided by the calculation of
descriptor variant frequencies in the scenario list. The “Statistics” button is used for this purpose. It
opens the window shown in Fig. 6-11.
Fig. 6-11: Options for the calculation of variant frequencies.
Use this window to specify whether in calculating descriptor variant frequencies the consistent sce-
narios are to be weighted using their weight (available only if the weight calculation option is se-
lected) or counted with equal weights.
The option “Frequencies” leads to the direct calculation of frequencies.
The option “F.differences“ (Frequency differences) requires that a calculation with the option “Fre-
quencies” has already been performed. The option “F.differences” then calculates the differences
between the actual frequencies and the frequencies of the previous calculation. This option is useful,
e.g. to gain a clear picture of the effects of changes to the cross-impact data.
The “Text“/“Chart“ option controls they way the results are depicted. Text: the calculated frequen-
cies are attached at the end of the evaluation protocol as a table (Fig. 6-12). Chart: results are pre-
sented in a bar chart (Fig. 6-13).
The options window must be closed with the button “OK“ in order to store the selected options and
to start frequency calculations. According to the selection of options the results will either be printed
in the evaluation protocol or displayed in a newly opened graphics window. The evaluation protocol
reappears once the graphics window has been closed by clicking the “Close” button (top right corner
of the window).
It is also possible to use the “Statistics“ button repeatedly (e.g. to obtain an initial text output of the
frequencies as part of the protocol, and to create a subsequent graphical view of the frequency
data).

ScenarioWizard 4.3 62
Fig. 6-12: Text output of the variant frequencies in the evaluation protocol.
Fig. 6-13: Bar chart of the unweighted variant frequencies. Short names of descriptors and variants
are used for labelling (see section 5.3).

ScenarioWizard 4.3 63
The option “F.differences“ (Frequency differences) requires that a calculation with the option “Fre-
quencies” has already been performed. The option “F.differences” then calculates the differences
between the actual state frequencies and the frequencies of the previous calculation. This option is
useful, e.g. to gain a clear picture of the effects of changes to the cross-impact data. As an example
we investigate the role of social values in “Somewhereland”. First calculate the frequencies by using
the option “Frequencies” in Fig. 6-11 (choose options: Unweighted/Text). Next, open the cim window
(cf. section 5.7) and erase all impacts in the rows belonging to descriptor “F. Social values”. This cor-
responds to the hypothesis that social values have no impact on the development of “Somewhere-
land”. Then re-calculate the consistent scenarios and variant frequencies, but now using the option
“F.differences” (choose option: Unweighted/Graphics).
As a consequence of this hypothesis, Fig. 6-14 shows which descriptor variants appear more fre-
quently (or rarely) when compared with the baseline calculations.
Fig. 6-14: The option “F.differences” shows the changes of variant frequencies resulting from a modi-
fication of the cross-impact matrix.
Filter
Click on the “Filter” button to apply a filter to the list of solutions in the evaluation protocol. Only
solutions containing certain descriptor variants will be displayed. The filter conditions can be speci-
fied in a filter form which will show up after the "Filter" button was pressed (Fig. 6-15).

ScenarioWizard 4.3 64
Fig. 6-15: Filtering the solution list.
The filter shown in Fig. 6-15 specifies that scenarios are displayed only if they include both "A. Gov-
ernment: A1 Patriots party" and "C. Economy: C1 Shrinking". A filter condition can be specified for
each descriptor. It is also possible to select more than one variant for a descriptor. In this case, all
scenarios showing one of the selected variants are accepted ("or" condition).
Clicking a variant already selected will undo the selection of this variant. The solution list is updated
after each click on the filter form.
All functions of the evaluation protocol (Statistics, Print, Save, Tableau) can be applied to the filtered
solution list as long as the filter form is active. Closing the filter form will cancel all filter conditions
and the original solution list will be displayed.
Click on the “Print“ button to open a printer selection window and to send the displayed evaluation
protocol to the selected printer. For a satisfactory print-out the printer must support the font “Cou-
rier 11pt”.
Saving
Click on the “Save“ button to open a file selection window for saving the list of consistent scenarios.
The suffix of the file name is .sl. A saved sl file can be reloaded later using the menu item File - Load -
Solution Set.

ScenarioWizard 4.3 65
A sl file stores the consistent scenarios in coded syntax. The sl file of the cross-impact matrix shown
in Fig. 5-6 contains four scenarios and has the following structure:
$ ScenarioWizard 2.0
Solution set
10
" 3 1 3 2 1 1",0,0,0,9
" 3 2 3 2 1 1",0,0,0,8
" 2 1 3 2 2 1",0,0,0,17
" 2 2 3 2 2 1",0,0,0,15
" 3 1 2 1 1 2",0,0,0,18
" 1 2 2 1 1 2",0,0,0,9
" 3 2 2 1 1 2",0,0,0,19
" 1 3 2 1 1 2",0,0,0,14
" 1 3 2 1 1 3",0,0,0,12
" 1 3 1 2 3 3",0,1,0,21
The ScenarioWizard signature is followed by a line that characterizes the file as an slm file. There
then follows the number of stored scenarios. After an empty line, one line is added for each scenario.
Each scenario is encoded by a string with the state numbers of the descriptors. The line ends with the
combinatorial weight of the scenario.
ScenarioWizard uses an extended slm data structure since the program version 3.2. Slm-files created
by older program versions can't be loaded any longer. If necessary old slm-files should be re-
generated by a recent program version.
IB / Txt / Rp
The buttons "IB" (impact balances)", "Txt" (text) and “Rp” (report) support a closer look at a scenario.
Select a scenario of special interest and enter its number in the textbox to the left of the "IB" button.
Click the button "IB" to open the impact balance window (cf. chapter 6.2). The form will be set ac-
cording to the selected scenario and display the scenario's impact balances.
Click the button "Txt" to open a window showing the full text representation of the selected sce-
nario. This function is helpful when the output options "Code" or "Short name" are used because
these options generate only a reduced representation of the scenarios (cf. chapter 7.2). The button
"Txt" is disabled if the output option "Long text" is activated.
The button “Rp” generates an automatic scenario report on the selected scenario. This function is
described in detail in section 6.3.
The buttons "IB", "Txt" and “Rp” don't work if a number smaller than 1 or bigger than the number of
scenarios was entered in the textbox.

ScenarioWizard 4.3 66
If the number of combinations of a matrix (the product of the number of states of all descriptors)
exceeds 9,22 1018 then an evaluation “consistent scenarios” using the evaluation option “complete”
(see section 7.1) isn’t possible. In this case, a warning is displayed and the evaluation is terminated.
Use the evaluation option “Monte-Carlo” to solve matrices with a higher number of combinations.
6.5 Generating a scenario tableau
The button “Tableau” of the evaluation protocol generates a table showing the consistent scenarios
in the columns and their respective descriptor variants in the rows. To emphasize the similarities
between the scenarios, neighbouring cells with concurrent variants are merged. If colors were as-
signed to the descriptor variants while building up the analysis structure in the structure editor (cf.
section 5.5), the colors are used also in the scenario tableau. The ten consistent scenarios of “Some-
whereland” and the color coding shown in Fig. 5-4 yield the tableau Fig. 6-16.
Fig. 6-16: Unsorted tableau of Somewhereland’s consistent scenarios.

ScenarioWizard 4.3 67
Sorting
Full benefit of the tableau function is gained only if the scenarios are sorted in a way that exhibits
“scenario families” by grouping similar scenarios. The scenarios can be moved in the tableau in order
to align them in a meaningful way. Select the number of the scenario to be moved in the combo box
“Move scenario no.” and press the right/left-arrow buttons.
The button “Sort” offers an alternative to the manual sorting of the scenarios. “Sort” executes an
automatic sorting using a heuristic which strives for merging as much cells as possible. However, the
automatic sorting acts purely formal and is not able to include aspects of content. It is advisable to
complete the sorting by manual action.
Fig. 6-17 shows an example of a sorted tableau. This tableau was also used in Fig. 2-4 of the CIB in-
troduction in chapter 2.
Fig. 6-17: Sorted tableau of Somewhereland’s consistent scenarios.
The combo box “Move descriptor” and the up/down arrow buttons can be used to change the sort-
ing of the descriptors. E.g. placing influential descriptors on the top of the tableau and passive de-
scriptors on the bottom can depict the cause-effect structure of the scenarios and enhance the logi-
cal readability of the tableau. According to Fig. 6-1, the descriptor “F. Social values” is possibly a can-
didate to be moved to the upper part of the tableau.
ScenarioWizard 4.3 68
Another approach to sort descriptors is to group covariant descriptors in order to emphasize “syn-
drome behaviour” in the system. In the tableau of “Somewhereland” this is not necessary because
the only covariant descriptors (descriptors “C. Economy” and “D. Distribution of wealth”) are already
neighbouring descriptors.
The application of the up/down arrow buttons changes the sorting of descriptors only in the scenario
tableau window. The analysis structure defined by the structure editor (cf. section 5.3) remains un-
changed.
Scenario titles
The form "Tableau" can be used to assign titles to the scenarios. Select the scenario to be titled in the
combo box "Move descriptor" and press the "T" button. An input box will be displayed at the top of
the tableau form. Enter the scenario title and press the "OK" button on the right side of the input
box. A new title row at the top of the scenario tableau emerges, showing the newly defined scenario
title. The same function can also be used to edit an existing scenario title.
Neighbouring scenarios with identical variants are merged. This can be used to define scenario
groups in the tableau.
When the "Tableau" form is closed, ScenarioWizard registers all scenario titles in the evaluation pro-
tocol. In protocols using the output format "Code" (cf. chapter 7.2) the titles are displayed at the end
of each line. In protocols using the output formats "Short name" or "Long name" the titles are shown
in the header of each scenario section. The titles will be stored when the solution list is saved using
the button "Save" of the evaluation protocol. They are available again after reloading a solution list
(chapter 6.4, paragraph "Saving").
The scenario tableau is build up as a html table. This offers the opportunity to format the scenario
titles by including html-tags in the title text. For instance, <br> will generate a line break in the title
and text enclosed by <b> .... </b> will be printed in bold letters.
Printing and storing the tableau
The tableau can be stored in html format by pressing the "Save" button. A black-and-white printout
of the tableau can be generated via the window’s context menu (click with the right mouse button
on the tableau to open its context menu).
6.6 The Selection Manager
The numbers of consistent scenarios resulting from a CIB analysis vary; some matrices yield only a
few or even no perfect consistent scenario. Other matrices produce more solutions than required for
the purpose of the analysis. In the latter case a scenario selection has to take place. This can be done
manually. However, a useful alternative in case of high scenario numbers is a selection (or pre-

ScenarioWizard 4.3 69
selection) by formal procedures. ScenarioWizard provides a simple selection heuristic based on the
principle of scenario diversity. Details about the heuristic can be found in Appendix 3.
The Selection Manager can be activated by the menu item Options - Selection Manager. The menu
item is available only while the evaluation protocol is open after calculating consistent scenarios or
loading a solution set.
Fig. 6-18: The Selection Manager window.
After starting the Selection Manager window the option "Selection manager deactivated" is prese-
lected. The Selection Manager is not active and the evaluation protocol displays the unmodified sce-
nario list. For starting a selection the user can chose between two modes of selection:
1) Enter a number n into the text box "Minimum distance" and click on the option "Select by scenario
distance". Then a group of scenarios are displayed, each of them differing at least in n descriptors
from each other scenario of the group. The higher the "Minimum distance" parameter is chosen, the
less scenarios will be able to satisfy the selection condition.
2) Enter a number into the text box "Number of scenarios" and click on the option "Select by number
of scenarios". The requested number of scenarios are displayed in the evaluation protocol. The more
scenarios are requested, the lower will be the differences between some scenarios in the selection.
All selection procedures are reversible, i.e. the selection modes and conditions can be changed in any
manner causing an expansion or contraction of the selection list. Change the entry in the text box
and press the ENTER key for applying a change of the selection condition.
Fig. 6-19 shows the selection of Somewhereland scenarios resulting from selection mode "Select by
scenario distance" and "Minimum distance 3", i.e. each scenario in the selection list has a minimum
distance of 3 from each other scenario in the list. Choosing the selection mode "Select by number of
scenarios" and entering "5" into the text box "Number of scenarios" would result in the same selec-
tion list.

ScenarioWizard 4.3 70
Fig. 6-19: Selection of Somewhereland scenarios resulting from selection mode "Select by scenario
distance" and "Minimum distance" = 3.
Hints
As long as the Selection Manager window is active the function "Calculate consistent scenarios" is
disabled. The respective menu item and shortcut is activated again once the Selection Manager win-
dow is closed.
The Selection Manager is not available when ScenarioWizard is in ensemble mode (section 6.8) or if
the evaluation option "Calculate cycles" is activated (section 7.1).
The Selection Manager can be used in combination with the "Filter" function of the evaluation proto-
col (see section 6.4). In this case filtering has priority, i.e. the original scenario list will be filtered first
according to the filter conditions specified in the filter form, and the result of the filtering will be
object of the selection procedure following the directives of the Selection Manager window.
6.7 Forcing descriptor variants
The menu item Edit - Force variant enables the user to select one variant out of the list of variants for
one or more descriptors. In the course of all subsequent evaluation procedures, the selected variants
will be forced, i.e. an additional impact will be assumed which stabilizes the forced variants. Forced
variants will be strictly maintained therefore, no matter which impacts may be exerted on this de-
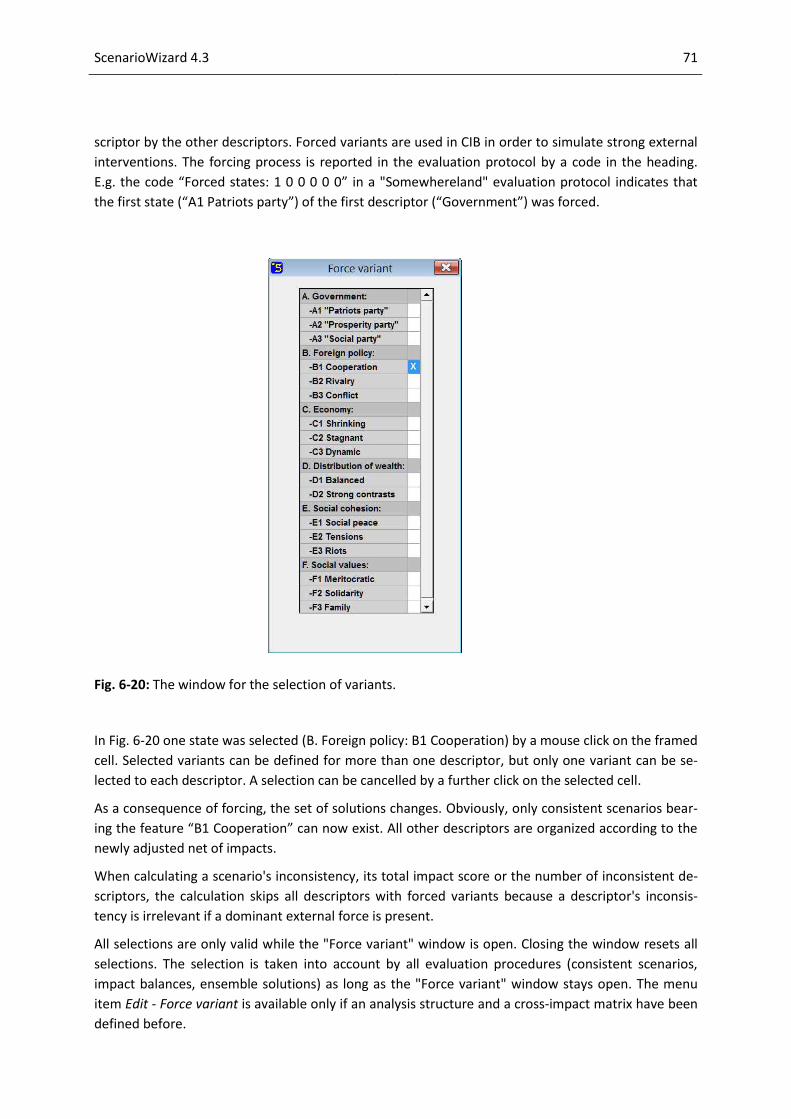
ScenarioWizard 4.3 71
scriptor by the other descriptors. Forced variants are used in CIB in order to simulate strong external
interventions. The forcing process is reported in the evaluation protocol by a code in the heading.
E.g. the code “Forced states: 1 0 0 0 0 0” in a "Somewhereland" evaluation protocol indicates that
the first state (“A1 Patriots party”) of the first descriptor (“Government”) was forced.
Fig. 6-20: The window for the selection of variants.
In Fig. 6-20 one state was selected (B. Foreign policy: B1 Cooperation) by a mouse click on the framed
cell. Selected variants can be defined for more than one descriptor, but only one variant can be se-
lected to each descriptor. A selection can be cancelled by a further click on the selected cell.
As a consequence of forcing, the set of solutions changes. Obviously, only consistent scenarios bear-
ing the feature “B1 Cooperation” can now exist. All other descriptors are organized according to the
newly adjusted net of impacts.
When calculating a scenario's inconsistency, its total impact score or the number of inconsistent de-
scriptors, the calculation skips all descriptors with forced variants because a descriptor's inconsis-
tency is irrelevant if a dominant external force is present.
All selections are only valid while the "Force variant" window is open. Closing the window resets all
selections. The selection is taken into account by all evaluation procedures (consistent scenarios,
impact balances, ensemble solutions) as long as the "Force variant" window stays open. The menu
item Edit - Force variant is available only if an analysis structure and a cross-impact matrix have been
defined before.
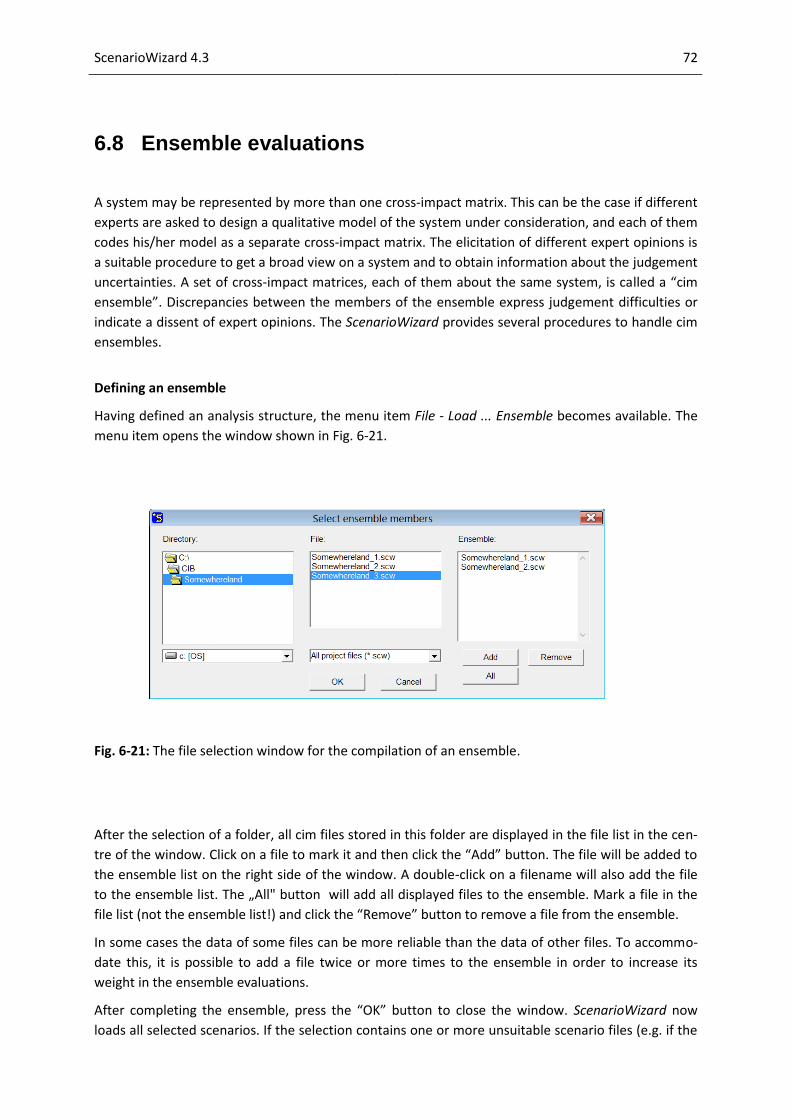
ScenarioWizard 4.3 72
6.8 Ensemble evaluations
A system may be represented by more than one cross-impact matrix. This can be the case if different
experts are asked to design a qualitative model of the system under consideration, and each of them
codes his/her model as a separate cross-impact matrix. The elicitation of different expert opinions is
a suitable procedure to get a broad view on a system and to obtain information about the judgement
uncertainties. A set of cross-impact matrices, each of them about the same system, is called a “cim
ensemble”. Discrepancies between the members of the ensemble express judgement difficulties or
indicate a dissent of expert opinions. The ScenarioWizard provides several procedures to handle cim
ensembles.
Defining an ensemble
Having defined an analysis structure, the menu item File - Load ... Ensemble becomes available. The
menu item opens the window shown in Fig. 6-21.
Fig. 6-21: The file selection window for the compilation of an ensemble.
After the selection of a folder, all cim files stored in this folder are displayed in the file list in the cen-
tre of the window. Click on a file to mark it and then click the “Add” button. The file will be added to
the ensemble list on the right side of the window. A double-click on a filename will also add the file
to the ensemble list. The „All" button will add all displayed files to the ensemble. Mark a file in the
file list (not the ensemble list!) and click the “Remove” button to remove a file from the ensemble.
In some cases the data of some files can be more reliable than the data of other files. To accommo-
date this, it is possible to add a file twice or more times to the ensemble in order to increase its
weight in the ensemble evaluations.
After completing the ensemble, press the “OK” button to close the window. ScenarioWizard now
loads all selected scenarios. If the selection contains one or more unsuitable scenario files (e.g. if the

ScenarioWizard 4.3 73
number of descriptors or variants does not match) the loading procedure will be terminated and an
error message will be displayed. The file selection window must be re-opened and the file selection
repeated.
Comment text of the selected files will not be imported into the ensemble.
Once the loading procedure has been successfully completed ScenarioWizard changes its internal
operation mode to “ensemble mode”. In this mode several menu items that are irrelevant to ensem-
ble evaluations are disabled. On the other hand, several ensemble specific menu items are now en-
abled.
If the “Select Ensemble Members“ window is closed using the “Cancel” button, no ensemble will be
defined. The system will revert to normal operation mode. Any previously defined ensemble will also
be cancelled. On the other hand, previously loaded project files are not cancelled and can be re-
accessed as required.
Ensemble sum
The menu item Edit - Ensemble sum calculates the sum of the cross-impacts of all ensemble members
for each cell. After that, the operation mode of the program reverts to normal mode. The user can
display and edit the calculated matrix of sum values and the usual evaluation procedures can be exe-
cuted.
Because of the invariance laws of CIB, a matrix of sum values possesses exactly the same solutions as
the corresponding matrix of mean values (which may contain non-integer values). The use of the
matrix of sum values makes it possible to construct mean value scenarios and to avoid non-integer
cross-impact values.
If necessary, the mean value matrix can be calculated by the menu item Edit - Factor Multiplication
by multiplying the sum values by the factor 1/n (cf. section 5.11, n is the number of ensemble mem-
bers). But the derived values are rounded numbers, and the matrix may lead to somewhat different
solutions than the sum value matrix.
The menu item Edit - Ensemble sum is available only if an ensemble has already been defined using
the menu item File - Load ... Ensemble.
Ensemble dissent
The menu Edit - Ensemble dissent provides two evaluations in order to depict the differences be-
tween the members of an ensemble:
The evaluation Standard deviation calculates the standard deviation of the cross-impacts of all en-
semble members for each cell. The standard deviations will be rounded and they will be collected in
a new matrix. The program then terminates the ensemble mode and reverts to normal mode. The
dissent data can now be displayed, saved, and printed like an ordinary cross-impact matrix. By so
doing it is easy to see in which sections of the matrix the greatest disagreements occur8.
8 Because of the rounding of the dissent data, only the rough structure of the dissent data is visible. Multiplica-
tion of all ensemble matrices by factor 10 (cf. section 5.11) before applying the menu item Edit - Ensemble-Dissent will help to indicate finer details of the dissent data structure.

ScenarioWizard 4.3 74
The evaluation Sign deviation checks for each cell if the sign of the cross-impact judgements differs
between the members of the ensemble. This would be a hint towards a fundamental dissent. The
result of the evaluation indicates for each cell how many members propose a sign different from that
chosen by the majority. For instance, if 3 members choose a positive value, 2 members choose a
negative value and one member judges the cross-impact to be zero, the evaluation will report the
value 2 for this cell.
Although the dissent data are collected in a cross-impact matrix form, they are not cross-impact data.
It makes no sense to execute evaluation procedures with these data or to apply other procedures
reserved for cross-impact matrices. Some menu items are therefore disabled after the calculation of
ensemble dissent. Once dissent analysis has been completed and the dissent data stored (if neces-
sary), a system reset can be executed to revert to the normal mode (menu item File - Reset ... Sce-
narioWizard, cf. section 7.4).
The menu Edit - Ensemble dissent is available only if an ensemble has already been defined using the
menu item File - Load ... Ensemble.
Ensemble scenarios
Being in the ensemble mode, the menu item Analyse - Consistent Scenarios or the button
on the toolbar starts an evaluation of the consistent scenarios of the ensemble members. First a
query appears (Fig. 6-22). The query is concerned with the conditions governing the selection of con-
sistent ensemble scenarios.
Fig. 6-22: The ensemble condition query for the selection of consistent ensemble scenarios.
In the following evaluation, the complete scenario space is investigated. A scenario is selected as a
solution only if it is a consistent scenario for at least the number of members specified in query Fig.
6-22. Suppose an ensemble has 3 members. If 3 was entered in Fig. 6-22 a scenario will only be se-
lected if it is a consistent scenario for each ensemble member. On the other hand, if 1 was the entry
in Fig. 6-22, the evaluation will report every consistent scenario of every ensemble member. Click the
“Start” button to begin the evaluation. An example of this evaluation is shown in Fig. 6-23.

ScenarioWizard 4.3 75
The protocol heading records the members of the ensemble, the ensemble condition for the evalua-
tion, and the consistency mode setting (cf. section 7.1). Beneath are printed all selected scenarios in
coded format. The choice of the output option discussed in section 7.2 does not affect this protocol.
The list provides the following information:
- The current number of the scenario.
- The scenario in coded format (cf. section 7.2 for the interpretation of the code).
- The “consistent members” (at the end of the line): the ensemble members for which the
scenario is consistent. The number of consistent members is at least as high as the ensem-
ble condition specified in Fig. 6-22.
Fig. 6-23: The evaluation protocol of the menu item Analyse - Ensemble Solutions.
- The member number of the “critical member”: The critical member is the one among the
consistent members, for whom the scenario has the greatest inconsistency. If more than
one consistent member share the highest inconsistency, the consistent member with the
lowest member number will be indicated. The critical member information is only relevant
if non-zero inconsistencies are permitted (cf. section 7.1).

ScenarioWizard 4.3 76
- The maximum inconsistency of the scenario within all “consistent members”. The maxi-
mum inconsistency is no higher than the inconsistency threshold that was specified in the
“Evaluation options” window (cf. section 7.1).
- The “weight” of the scenario. This ensemble weight should not be confused with the vol-
ume weight or the attractor weight (cf. section 7.1). In the frame of ensemble analysis, the
weight of a solution is defined as the number of consistent members. The weight of an en-
semble solution is not smaller than the ensemble condition specified in Fig. 6-22.
Increasing the ensemble condition will restrict the set of solution scenarios more and more to “con-
sensus scenarios”. In the given example of three ensemble members, an ensemble condition of 3 will
result in one consensus scenario (Fig. 6-24). Of course it can occur that there is no general-assent
scenario. It is then only possible to search for maximum weight (maximum number of consistent
members) scenarios.
As with ordinary evaluation protocols, ensemble evaluation protocols can be printed, solution lists
can be saved, and descriptor variant frequencies can be computed. Note that weighted calculations
of variant frequencies will use the ensemble weights, not volume or attractor weights. Ensemble
weights will also be used for saving solution lists (sl files, cf. section 6.4).
Fig. 6-24: The intersection of the consistent scenarios of ensemble members (“consensus scenario”).

ScenarioWizard 4.3 77
Save scenario list
The solutions of the ensemble evaluation can be stored in a sl file pressing the “Save” key in Fig. 6-23
and reloaded in a further session by the menu item File - Load … Solution set. The file contains the
following data:
- the numbering of each scenario
- the scenario (coded format, cf. section 7.2)
- the "ensemble weight" of the scenario (number of ensemble members allowing this sce-
nario)
- the worst (highest) inconsistency value of the scenario within all ensemble members allowing
this scenario (0 if the option "Max. inconsistency“ and a maximum-inconsistency value >0
were not applied, cf. section 7.1)
- two meaningless zeros.
If the number of combinations of a matrix (the product of the number of states of all descriptors)
exceeds 9,22 1018 then an ensemble evaluation using the evaluation option “complete” (see section
7.1) isn’t possible. In this case, a warning is displayed and the evaluation is terminated. Use the
evaluation option “Monte-Carlo” to solve matrices with a higher number of combinations.
6.9 Ensemble mode and workbooks
The menu function Books - Workbooks ... generates html-documents showing the cross-impact
judgment sections and their textual explanations in an organized way in order to ease expert enquir-
ies and discussions about the cross-impact judgments, as described in chapter 5.17. When called
while the Ensemble Mode of ScenarioWizard is active the 'workbook'-function generates a special
type of workbook. The purpose of 'ensemble workbooks' is to depict differences between expert
opinions and judgment dissent in a clear way. For this purpose all judgments sections of an ensemble
concerning a certain impact relation are printed in columns on one page in order to ease the compar-
ison between the judgments and explanations stored in different matrices. A simple example com-
prising three ensemble members and featuring three different expert opinions about the influence of
"Government" on "Economy" in Somewhereland is shown in Fig. 6-25. However, also ensembles
comprising two members or more than three members can be documented in ensemble workbooks.

ScenarioWizard 4.3 78
Fig. 6-25: Depiction of diverging expert opinions in an ensemble workbook.
The ensemble workbook will list all judgment sections containing cross-impact data or text for at
least one ensemble member. Judgment sections without data or text for any ensemble member will
be skipped. The file names of the ensemble members are used for the column titles (Expert 1, Expert
2, Expert 3 in Fig. 6-25). Just like ordinary workbooks (cf. chapter 5.17) ensemble workbooks can be
generated in two formats: sorted by cols or sorted by rows (use menu items Books - Workbook sort-
ed by cols and Books - Workbook sorted by rows).
6.10 Statistics
The menu item Analyse - Statistics provides three evaluations. ScenarioWizard explores the space of
all possible scenarios, checks the consistency of each scenario, and computes the statistics of their
inconsistencies, the statistics of the total impact score and the bias statistics of the cross-impact
data. The results are displayed in a window shown in Fig. 6-26.

ScenarioWizard 4.3 79
Inconsistency statistics
How often every inconsistency value appears is indicated as well as how many scenarios show an
inconsistency higher or lower than this value. The sum of these three numbers is equal in every line
and indicates the number of possible scenarios9.
If the evaluation option “max. inconsistency” was chosen (cf. section 7.1) the inconsistency statistics
are useful when selecting the inconsistency limit parameter.
Total impact score statistics
The display of the total impact score statistics is similar to the inconsistency statistics. How often
every total impact score value appears is indicated, as is how many scenarios show a total impact
score higher or lower than this value. Again, the sum of these three numbers is equal in every line
and indicates the number of possible scenarios.
The total impact score statistics support the interpretation of the total impact score data of the con-
sistent scenarios (cf. section 6.4).
Bias statistics
A descriptor is biased if the maximum impact score of a randomly chosen scenario is assigned more
frequently to some descriptor variants than to others. This is a consequence of the choice of the
cross-impact judgements in the descriptor column in question, not a result of the systemic interplay
with the other descriptors. In extreme cases an unfavourable choice of judgements may completely
disable a descriptor variant (“forbidden variant”), no matter how the cross-impact in the other de-
scriptor columns are chosen.
The bias statistics indicate how often a descriptor variant reaches the maximum impact score when
all possible scenarios are applied to the descriptor. Moderate bias is nearly inevitable and tolerable.
Strong bias and forbidden variants should motivate to reconsider the respective descriptor judge-
ments.
The row sums of the bias statistics may exceed 100 % because different variants of a descriptor may
share the same maximum impact score for some scenarios.
9 In case of „Monte-Carlo“ evaluation (cf. chapter 7.1): number of runs.

ScenarioWizard 4.3 80
Fig. 6-26: The results of the Analyse – Statistics evaluation.
If the number of combinations of a matrix (the product of the number of variants of all descriptors)
exceeds 9,22 1018 then the evaluation “statistics” using the evaluation option “complete” (see sec-
tion 7.1) isn’t possible. In this case, a warning is displayed and the evaluation is terminated. Use the
evaluation option “Monte-Carlo” to estimate the statistics of matrices with a higher number of com-
binations.
The menu item Analyse - Statistics is available only if an analysis structure and a cross-impact matrix
have already been defined or a project file has been loaded.
6.11 Pathway analysis
The function "Pathway analysis" identifies and displays first-order indirect impact pathways between
two descriptors. A first-order indirect impact pathway establishes an influence from descriptor A to B
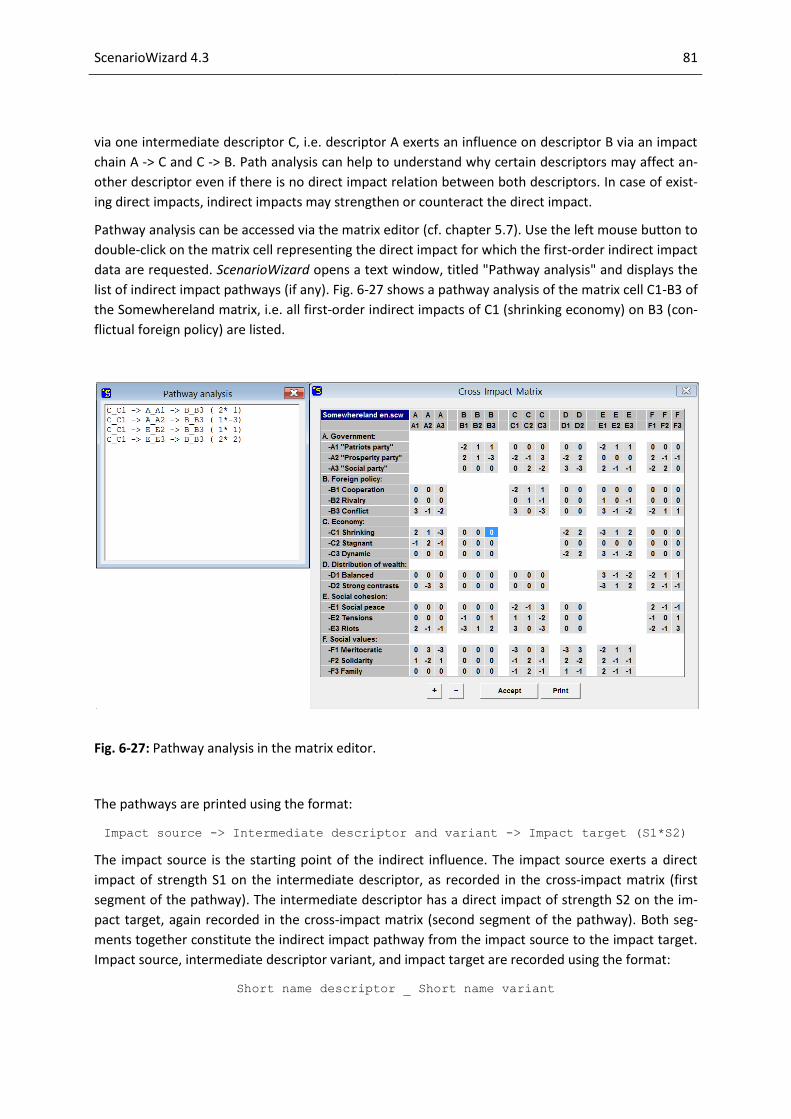
ScenarioWizard 4.3 81
via one intermediate descriptor C, i.e. descriptor A exerts an influence on descriptor B via an impact
chain A -> C and C -> B. Path analysis can help to understand why certain descriptors may affect an-
other descriptor even if there is no direct impact relation between both descriptors. In case of exist-
ing direct impacts, indirect impacts may strengthen or counteract the direct impact.
Pathway analysis can be accessed via the matrix editor (cf. chapter 5.7). Use the left mouse button to
double-click on the matrix cell representing the direct impact for which the first-order indirect impact
data are requested. ScenarioWizard opens a text window, titled "Pathway analysis" and displays the
list of indirect impact pathways (if any). Fig. 6-27 shows a pathway analysis of the matrix cell C1-B3 of
the Somewhereland matrix, i.e. all first-order indirect impacts of C1 (shrinking economy) on B3 (con-
flictual foreign policy) are listed.
Fig. 6-27: Pathway analysis in the matrix editor.
The pathways are printed using the format:
Impact source -> Intermediate descriptor and variant -> Impact target (S1*S2)
The impact source is the starting point of the indirect influence. The impact source exerts a direct
impact of strength S1 on the intermediate descriptor, as recorded in the cross-impact matrix (first
segment of the pathway). The intermediate descriptor has a direct impact of strength S2 on the im-
pact target, again recorded in the cross-impact matrix (second segment of the pathway). Both seg-
ments together constitute the indirect impact pathway from the impact source to the impact target.
Impact source, intermediate descriptor variant, and impact target are recorded using the format:
Short name descriptor _ Short name variant

ScenarioWizard 4.3 82
In the example the pathway analysis yields four indirect pathways running from C1 to B3. Two of
them make their way via descriptor A (Government), two of them are running via E (Social cohesion).
For instance, the first row of the list in the "Path analysis" window expresses that a shrinking econ-
omy (C1) may indirectly stimulate foreign conflicts (B3) by promoting the chances of a government
with pronounced patriotic habitus, what in turn may easily lead to more foreign-policy conflicts.
Generally spoken, indirect pathways consisting of two pathway segments of equal signs of the impact
strength (+/+ or -/-) tend to establish a supportive indirect influence while pathways consisting of
two segments with divergent signs (+/- or -/+) imply a repressive indirect influence.
Pathway analysis is not restricted to descriptor pairs without direct impact relations. It can be applied
also to matrix cells carrying a direct impact. In this case, the indirect influences superimpose the di-
rect impact.
In principle, direct influences are very common in cross-impact matrices. Nevertheless, they do not
automatically come into effect in every scenario. Other descriptors may intervene on the intermedi-
ate descriptor and force it into a different direction, thus interrupting the impact pathway. There-
fore, indirect influences are potential impacts and it depends on the overall scenario configuration
whether they can unfold their power. Second or higher-order indirect pathways with two or more
intermediate descriptors are under even higher risks to lose their power by successful interventions
on the intermediate descriptors issued by other descriptors. On this account the pathway analysis in
ScenarioWizard is restricted to first-order pathways - they have the best chances to unfold and to
actually shape the system behaviour.
The CIB evaluation "consistent scenarios" automatically takes into account all indirect influences of
first or higher order. Thus the purpose of the pathway analysis function is rather to foster a better
understanding of the evaluation results.
Echoes
Left-button double click on a diagonal cell of a diagonal judgement section leads to a special type of
pathway analysis. Though those cells are not emphasized in the matrix editor in case of regular ma-
trices they nevertheless can be selected and respond by providing a pathway analysis (Fig. 6-28).
In this special case the "impact echoes" of a descriptor variant are calculated. They describe the im-
pact pathways leading from the selected descriptor variant to another descriptors variant and from
there directly back to the origin. Echoes reveal whether a descriptor variant is able to stabilize itself
by activating supportive developments in other descriptors or by suppressing counteracting devel-
opments (reciprocal promotion and suppression). Or they show whether a descriptor variant has an
inclination of self-destabilization by promoting counteracting developments or suppressing suppor-
tive developments in other descriptors. Impact echoes in CIB are the equivalent of feed-back loops in
cybernetics.

ScenarioWizard 4.3 83
Fig. 6-28: Impact echoes of the descriptor variant D2.
The example of an echo analysis shown in Fig. 6-28 reveals that D2 (strong contrasts in wealth distri-
bution) receives an overall supportive echo from descriptor F (social values) because the echoes of all
variants of F carry a +/+ or -/- signature. This means that strong wealth contrasts foster those social
values with are supportive vice versa (meritocratic values) and counteract social values which would
challenge unequal wealth distribution (solidarity and family values). From descriptor A (government)
D2 receives only an echo in scenarios showing A2 or A3 ("Prosperity party" of "Social party") - and in
those cases the echo is destabilizing (+/- or -/+ signature): with respect to elections, strong wealth
contrasts promote a challenger ("Social party") and hamper a supporter ("Prosperity party").
6.12 Correlations
The menu item Analyse - Correlations calculates the correlation coefficients of the descriptor variants
with respect to the current scenario set. The item is available once a set of consistent scenarios was
calculated by the evaluation “Consistent scenarios” (cf. section 6.4) and the evaluation protocol dis-
playing the scenarios is still open. The calculated correlation coefficients are expressed in rounded
percentage values and printed in a matrix form. The correlation coefficients of the “Somewhereland”
scenarios (Fig. 6-17) are shown in Fig. 6-29.

ScenarioWizard 4.3 84
Fig. 6-29: Correlation coefficients of the “Somewhereland” scenarios.
The correlation table indicates that “F. Social values: meritocratic” and “D. Distribution of wealth:
balanced” rarely occur jointly in a scenario (correlation coefficient -81%). On the other hand, “E3
Riots” and “C1 Shrinking economy” occur either together or not at all (correlation coefficient +100%).
Since correlation coefficients characterize the relation of a pair of descriptor variants in both direc-
tions, the correlation table is a symmetric matrix. The correlation table can be printed by the button
“Print”.
A bar chart of the array of correlation coefficients of a descriptor variant (“correlation profile”) is
generated by clicking on the descriptor variant in the first column using the right mouse button. The
correlation profile makes it easy to see which descriptor variants are closely connected.

ScenarioWizard 4.3 85
Fig. 6-30: Correlation profile of the descriptor variant „E3 Riots“.
The menu item Analyse - Correlations is not available if the option “Descriptor types” is activated (cf.
section 7.3). The correlation coefficients are calculated using Pearson’s Phi-coefficient formula10.
Depending on the setting of the option “Calculate weights” (cf. section 7.1) weights are used (or not
used) for this calculation (default setting: unweighted).
In case that a descriptor variant doesn`t occur in any scenario, the calculation of correlation coeffi-
cients is not meaningful. The respective row and column of the correlation table is filled by zeros,
then.
Correlation coefficients are significant rather in cases of medium and large scenario sets. Correlation
coefficients of small scenario sets containing only few scenarios may lead to artificial results.
10
Everitt B.S. (2002) The Cambridge Dictionary of Statistics, CUP. ISBN 0-521-81099-X

ScenarioWizard 4.3 86
6.13 Influence profile
This evaluation (menu item Analyse - Influence profile) is an auxiliary analysis procedure within CIB
analysis11. It investigates the influence of an intervention on the descriptor variant frequency of a
scenario set. E.g. the influence profile of the descriptor variant “C1 Shrinking economy” is calculated
as follows:
1. First, the frequencies of all descriptor variants are calculated as shown in Fig. 6-13 6.4.
2. Second, the descriptor variant “C1 Shrinking economy” is forced as described in section 6.7.
3. Third, the descriptor variant frequencies are recalculated under the influence of the forcing.
4. Forth, the differences between the recalculated and the basic frequencies are calculated and
stored as the “influence profile” of descriptor variant C1.
The influence profile is interpreted as the effect of a strong external intervention in favour of a cer-
tain descriptor variant. In the example, the intervention might be an international economic crisis
which causes a shrinking economy in Somewhereland no matter what developments take place in
Somewhereland in other fields.
The steps described above are performed automatically. Successively each descriptor is supposed to
be the target of an intervention and the respective influence profile is calculated and stored. The
influence profiles of all descriptor variants are compiled then in a matrix form as shown in Fig. 6-31.
The frequency changes are printed as rounded percentage values. The number “60” in the row “C1”
and the column “A1” indicates that the frequency of the descriptor variant A1 (Government: ‘Patriots
party’) increases by 60 % as the effect of the intervention “C1” (frequency of “A1” is 40% in the basic
run and 100% in case of the intervention “C1”).
The table of influence profiles can be printed by the button “Print”. A bar chart of a influence profile
is generated by clicking on the descriptor variant in the first column using the right mouse button
(Fig. 6-32).
Clicking on a descriptor variant in the top row of the table using the right mouse button generates an
inverse influence profile. This depiction displays all numbers of the respective column and indicates
which interventions would be able to produce a promoting or a hindering effect on a certain descrip-
tor variant.
Depending on the setting of the option “Calculate weights” (cf. section 7.1) weights are used (or not
used) for this calculation (default setting: unweighted). The influence profiles should be interpreted
only in a qualitative meaning. Similar as the “Correlations” (section 6.12), the results of this evalua-
tion are less significant for scenario sets with only few scenarios.
The menu item Analyse - Influence profile is available only if an analysis structure and a cross-impact
matrix have already been defined or a project file has been loaded.
11
See paragraph “Interpreting influence profiles“ at the end of the chapter.

ScenarioWizard 4.3 87
Fig. 6-31: Influence profiles of the „Somewhereland“ descriptor variants.
Fig. 6-32: Bar chart of the influence profile of descriptor variant „C1 - Shrinking economy“.

ScenarioWizard 4.3 88
Interpreting influence profiles
In general, data about the frequency of variants should not be misunderstood as probability data.
Rather they express the diversity of possibilities to construct consistent scenarios including a certain
variant. In the context of influence profiles this means that a high value A→B within a profile doesn’t
indicate the increase of the probability of the variant B as a future event if an intervention in favour
of A is imposed. Instead, a high value should be read as a hint that an intervention on A would in-
crease the diversity of possible futures sharing the variant B as a common feature.
It is recommended, therefore, to interpret influence profile data in a qualitative way. The profile data
should not be used as a result in itself. Peculiar values in the profile should be read as an encourage-
ment to investigate the scenario lists with and without the respective intervention and to strive for a
topical understanding of the differences and the effects of the intervention. In CIB analysis, a method
of qualitative systems analysis, quantitative evaluations like the influence profile evaluation can only
have the status of an auxiliary analysis, giving valuable hints about promising topics to investigate
and guiding the further analysis, yet without having the claim to be a result in itself.
Similar to the case of correlation coefficients, influence profiles are significant rather in cases of me-
dium and large scenario sets. Evaluations based on scenario sets containing only few scenarios may
lead to artificial results.

ScenarioWizard 4.3 89
7 Options
Several options for the execution of CIB evaluations and for the display of data are available. Appro-
priate settings can be specified using the menu item Options. In previous chapters only default set-
tings were used.
7.1 Evaluation options
The menu item Options - Evaluation Options or the button on the toolbar opens the op-
tions window shown in Fig. 7-1.
Fig. 7-1: The window “Evaluation options“.
Consistency
The option “Consistency” determines the consistency mode which controls the consistency assess-
ment of the scenarios over the course of the evaluation procedure.
- “Strong consistency” (default setting): A scenario is judged to be consistent only if every
state owns the maximum impact score of the descriptor impact balance. According to
this, in the CIB succession procedure a state will be adjusted if it does not possess the
maximum impact score of the descriptor impact balance.

ScenarioWizard 4.3 90
- “Weak consistency“: A scenario is judged to be consistent, if every state owns a positive
or zero impact score. According to this, in the CIB succession procedure, a state will be
adjusted if it possesses a negative impact score. Weak consistency only makes sense in
the case of standardized cross-impact matrices. This option results in a larger, less strin-
gently selected scenario set.
- “Max. inconsistency“: A scenario is judged to be consistent if no state has a larger gap be-
tween its impact score and the maximum impact score than the specified value permits.
According to this, a variant will be adjusted in the CIB succession procedure if the gap be-
tween its impact score and the maximum impact score exceeds the specified value. This
option is intended for analyzing the influence of data uncertainties. If zero is assigned to
the maximum inconsistency, this option yields the same results as the option “Strong
consistency“. The specified value for maximum inconsistency will only enter into the cal-
culation if the option button “Max. inconsistency“ is selected. If the option "Max. incon-
sistency" and a maximum inconsistency value >0 are chosen the scenario information
provided by the evaluation protocol "Consistent scenarios" includes the number of incon-
sistent descriptors.
Diagonal elements
The checkbox “Diagonal elements” controls whether diagonal judgment sections of the cross-impact
matrix are permitted (extended cross-impact matrix) or not (regular cross-impact matrix). The exclu-
sion of diagonal judgement sections is the default setting. While loading a new project file, Sce-
narioWizard will check whether the data contain non-zero diagonal elements, and the program will
set this option according to the data. If the user changes this option while cross-impact data are pre-
sent in the workspace, the diagonal judgement sections will be cleared and filled with zeros respec-
tively.
Calculate weights
The option group „Calculate weights” controls if scenario weights are calculated by the evaluation
“Consistent scenarios” (cf. section 6.4) and which type of weight is calculated.
– Default setting is “None”. No weights are calculated and no weights are reported in the
evaluation protocol. On the other hand, this setting allows the maximum computation speed.
– The option “Volume weights” activates the calculation of weights during the evaluation of
consistent scenarios. The volume weight of a consistent scenario indicates the share of the
total configuration space which is represented best by this scenario in terms of scenario simi-
larity. The calculation of volume weights takes the following course: i) the weight 1 is as-
signed to all possible configurations (all possible combinations of descriptor variants). ii) each
configuration passes on its weight to the most similar consistent scenario. If two or more
consistent scenarios are equal similar to the configuration, the weight to be passed is divided
up in equal parts. Similarity is measured by the number of matching descriptors. The option
“Volume weight” requires two evaluation runs (indicated by two runs of the progress bar).
The first run calculates the set of consistent scenarios. The second run calculates the volume

ScenarioWizard 4.3 91
weights. Dependent on the number of scenarios, the second run may require considerably
less or considerably more calculation time than the first run.
– The option “Attractor weight” also activates the calculation of scenario weights. In this case,
the weight of a consistent scenario indicates the probability that a randomly chosen initial
scenario will be transformed into this scenario by the CIB succession procedure. The results
depend on the choice of the succession type by the option group “Succession” (see below).
If the option "Volume weights" or the option “Attractor weights” is activated the resulting scenario
weights are printed into the protocol of the evaluation "Consistent scenarios" together with the
other scenario key figures. Some evaluations uses weight information if available, e.g. the calculation
of descriptor variant frequencies (using option “weighted frequencies”, section 6.4), the calculation
of correlations (section 6.12) or the calculation of influence profiles (section 6.13).
Excursus: Why scenario weights?
Scenario weights should not be confused with scenario probabilities. Scenario weighting is a tool to
protect statistical calculations (e.g. the calculation of descriptor variant frequencies) against statisti-
cal distortion. Statistical distortion can occur if some members of a scenario set describe clearly dis-
tinct types of system behaviour while other scenarios of the same set represent simply some highly
related variants of the same one scenario pattern. Consider for example the scenario set of six de-
scriptors, each owning three variants:
S1 = [ a1 b3 c2 d1 e3 f2 ]
S2 = [ a2 b2 c1 d3 e1 f3 ]
S3 = [ a2 b2 c1 d3 e1 f1 ]
S1 is quite different to S2 and S3, while S2 and S3 are very similar and differ only by one descriptor (f).
In a formal sense, the scenario set consists of three scenarios, and the frequency of, e.g., a2 is 66,7 %
in this set. Arguing from a more content-oriented point of view, things are different because the sce-
nario set shows in fact only two genuine scenario types (one of them can occur in two slightly differ-
ent ways). Thinking in scenario types, the correct answer for the frequency of a2 is 50 %.
Weighted statistical calculations are better suited to address such considerations than unweighted
calculations. In the example shown above, the volume weights of scenario S1 is 309 and both the
scenario weights of S2 and S3 are 210. So the weighted frequency of a2 is 57,6% which reflects the
character of S2 and S3 as variants of a single scenario type better than the unweighted result, though
the formal aspect is not completely omitted.
Solver
The option “Solver“ controls the selection of the method which ScenarioWizard uses for finding the
solutions of a cross-impact matrix (the consistent scenarios and cyclic attractors).

ScenarioWizard 4.3 92
- “Complete“ (defaut setting): A complete exploration of all possible scenarios will be per-
formed. All solutions of a matrix will be reliably determined (within the limitations de-
scribed in section 9). For large matrices, this method may cause a long computation time,
however. For very large matrices, the computation time of a complete exploration even
may be unacceptable.
- The option “Monte Carlo“ can be used for an approximate evaluation of large matrices. In
this case there will be no complete exploration of all possible scenarios. Instead of this, a
number of randomly chosen scenarios will be used as a starting point for constructing a
solution by the succession method. All solutions found by this procedure will be reported
in the evaluation protocol and the occurrence frequency will be interpreted as the weight
of a solution. The number of random scenarios can be set by the user in the textbox of
this option.
The option “Monte Carlo“ offers an approximate evaluation of very large matrices. However, only
the main solutions (i.e. solutions with high combinatorial weight) will be identified in a reliable way.
Solutions with low weight may be missed. The higher the number of random runs (default setting:
10.000), the more probable solutions with low weight will be found.
If the option “Monte Carlo“ is selected, the evaluations “Consistent scenarios“ and the evaluations
“Ensemble evaluation“ and “Statistics“ described in section 6 will be executed using this method. As
aforementioned the output variable “weight“ of the evaluations “Consistent scenarios“ and “Statis-
tics“ indicates no longer the volume weight or the attractor weight. It indicates the frequency of the
solutions, in which they occur in all random runs.
A repetition of the Monte Carlo evaluation will usually not lead exactly to the same solution set and
solution weights: Weights may differ and solutions with low weight may be found only in some runs.
This is a consequence of the random nature of the method. Weight scattering will decrease if the
number of runs is increased.
Although the Monte Carlo evaluation is an approximation method, all consistent scenarios and cyclic
attractors found by this method are exact solutions with regard to their structure. The approximate
nature of the method concerns exclusively the calculation of the weights and the fact that the solu-
tion set may be incomplete.
If the option “Monte Carlo“ is selected, a hint is printed in the head of the evaluation protocol and
the number of random runs is indicated.
If the number of runs was chosen smaller than 1 in the options textbox then this parameter is set to
1 by the program. An entry with more than 9 digits will be ignored by the program. Don’t use periods
or other non-numeric characters for the entry of this textbox.
The entry of the “Monte Carlo“ option textbox doesn’t affect any evaluation if the option “Monte
Carlo“ is not selected.
The option “Calculate cycles” controls if the evaluation “Consistent scenarios” (cf. section 6.4) will
check also for cyclic solutions of the cross-impact matrix (default setting: deactivated). In case of a
cyclic solution the succession procedure repeats a certain series of scenarios (the cycle). Cyclic solu-

ScenarioWizard 4.3 93
tion should be interpreted with care; depending on the nature of the descriptors they are not in
every case meaningful. However, for some systems they correctly indicate a tendency towards vacil-
lation.
If the option “Calculate cycles” is activated, the evaluation protocol “Consistent scenarios” reports
not only the scenario solutions, but also the identified cyclic solutions. The header of each solution
shows the list number of the solution, its attractor weight and the period of the cycle (number of
involved scenarios: 1 for consistent scenarios, >1 for cycles).
Succession
The option “Succession” determines the rules which control the succession algorithm of the matrix
evaluation procedures. One of the following rules can be chosen:
- “Global” (default setting): In each succession step, adjust all inconsistent descriptors to the state
of highest impact score. This rule should be used as a generic rule if none of the following alter-
natives apply.
- “Local”: Adjust only the descriptor(s) with the highest inconsistency and change it to the state of
the highest impact score. This rule expresses the idea that the reaction of the system elements is
accelerated by high system forces and that the system element sensing the greatest forces reacts
first.
- “Incremental”: Adjust all inconsistent descriptors towards the state of highest impact score, but
only by jumping to a neighbour state. This rule is appropriate if abrupt state transitions are not
plausible in the system under consideration. It should be used only if all descriptors of the matrix
are ordinal descriptors.
- “Adiabatic”: Adjust only the first inconsistent descriptor to the state of highest impact score. This
rule is suitable if the descriptor reaction times feature distinct time scales, and the descriptors
are sorted according to time scale, starting with the fastest descriptor.
All rules are valid CIB succession modes. I.e. they all yield the same set of consistent scenarios when
a matrix is evaluated by them. However, they produce different succession pathways (transients) and
therefore they may result in different attractor weights and in different shapes of the cyclic attrac-
tors.
The chosen succession rule affects all evaluations which are launched in the windows Analyse - Con-
sistent scenarios (section 6.4) and Analyse - Impact balances (section 6.2). On the other hand, the
setting of the evaluation option “Consistency” is properly taken into account for all of the offered
succession rules.

ScenarioWizard 4.3 94
7.2 Output options
The menu item Options - Output Options (or the button on the toolbar) opens the window
shown in Fig. 7-2.
Fig. 7-2: The window “Output options“.
Output format
The option “Output format” controls the format of the consistent scenario print-outs belonging to
the evaluation protocols.
- “Code“: The consistent scenarios are printed in the form of a code rather than a text. For
instance, the code “2 1 3 2“ of a scenario with four descriptors expresses that the first
descriptor takes state no. 2, the second descriptor state no. 1, the third descriptor state
no. 3, and the fourth descriptor state no. 2. The coded format helps list a large number of
consistent scenarios in a clear and compact way. On the other hand, reading this format
takes some practice. All scenario data (code, weight, consistency value, total impact score
and - in case of the option "Max. inconsistency" - the number of inconsistent descriptors)
are printed in a line.
- “Code and header" uses the coded form, too. In addition, at the top of the list of scenar-
ios a header is printed. The header indicates the columns of the scenario list by the first
character of the descriptor's name. This should improve the comprehensibility of the
coded scenario list, provided that the names of the descriptors were chosen in a suitable
way (e.g. starting with A, B, C, ...).

ScenarioWizard 4.3 95
- “Short name“: Each scenario is printed as a list of its descriptors and their selected states.
The descriptors are printed with long names, and the states are printed with short
names.
- “Long name“ (default setting): Each scenario is printed as a list of its descriptors and their
selected states. Both descriptors and states are printed with long names. This option
yields the largest output text. On the other hand, the output text is easy to understand
without explanations. This option is therefore particularly appropriate for presentations
and workshops.
Cyclic attractors are printed with the descriptors (long name) and the sequence of states (short
names) for one cycle period if either “Short name” or “Long name” was selected. If the option
“Code” is chosen, the scenarios of a cycle are printed in rows, using the code described above.
The output format of ensemble evaluation protocols (cf. section 6.8) is not affected by the option
“Output format”. The ensemble evaluation protocol always appears in coded format.
Activate the checkbox “File” to print the protocol of the evaluation “Consistent scenarios” into a file.
The file's name and location will be enquired once an evaluation is started. The protocol will not be
displayed on the screen in this case.
Sorting of scenarios
The option “Sorting of consistent scenarios” controls the sorting of the evaluation output list Analyse
- Consistent scenarios.
- “None“ (default setting): Scenarios are printed in unsorted form. In this case, the se-
quence of scenarios listed reflects the sequence in which ScenarioWizard’s computation
algorithm identifies the solutions.
- “Code“: Scenarios are sorted in ascending numerical order according to their codes (the
codes are read as numbers with n digits; n is the number of descriptors).
- “Weight“ (available only if the option "Calculate weights" is selected, cf. section 7.1):
Scenarios are sorted in descending numerical order according to their combinatorial
weights.
- “Consistency”: Scenarios are sorted in descending numerical order according to their
consistency values.
- “Incon. descriptors”: Scenarios are sorted in ascending numerical order according to the
scenario’s number of inconsistent descriptors. This sorting is only meaningful if the
evaluation option “Max. inconsistency” and a maximum inconsistency >0 was chosen (cf.
chapter 7.1). Otherwise, the number of inconsistent descriptors would be zero for each
listed scenario.
- “Total impact score”: Scenarios are sorted in descending numerical order according to
their total impact score.
The output of the ensemble evaluations is always printed unsorted. The same is true if the option
“Calculate cycles” (section 7.1) is activated.

ScenarioWizard 4.3 96
Live change of output options
The window “Output options” can be opened while the evaluation protocol is still open. Settings can
be changed and the content of the evaluation protocol is accordingly updated once the “Output op-
tion” window is closed by the button “OK”. In this way a new choice of output formatting can be
applied without possibly time-consuming recalculations.
Display font
The user can change the font used to print the names of descriptors and states in the program win-
dows. The font is also used for the print-out of all evaluation protocols on the screen. The combo box
“Display font” controls this font. 9 pt is the default font setting. A small font helps display large ma-
trices without scrolling. A big font is useful for projector presentations.
Hiding empty descriptor columns
Cross-impact matrices may contain descriptors free of influence ("autonomous descriptors"). This
sort of descriptor has non-zero cross-impacts in its descriptor row, whereas there are only zero en-
tries in its descriptor column. If the option "Hide empty descriptor columns" is activated the window
"Edit cross-impact matrix" will display the matrix without the columns of the independent descrip-
tors, sparing the space otherwise occupied by columns containing no information. The rows of the
independent descriptors are displayed, however. The "Print"-button of the window "Edit cross-
impact matrix" produces the corresponding print-outs without the columns of the independent de-
scriptors. The option "Hide empty descriptor columns" is effective also if the option "Descriptor
types" is used (cf. chapter 7.3). Matrices without independent descriptors are displayed as usual.
Activating the option "Hide empty descriptor columns" will cause no effect in this case.
Hide empty sections
In most cases not all descriptors of a matrix exert influences onto all other descriptors. Some judge-
ment sections of a matrix are completely filled with zeros instead. In the interest of greater clarity,
the option "Hide empty sections" can be used to suppress the empty sections. The option is effective
in the CIM editor (the suppressed sections stay editable, however, and are highlighted in order to
indicate this), in the CIM print function, in the impact-balance-window and in all html-export func-
tions.
Cross-impact format
As default setting, ScenarioWizard uses integer numbers to depict cross-impact judgements (usually
within a scale of -3...+3). Occasionally experts feel uncomfortable to express their qualitative influ-
ence judgements in numbers. To avoid mental obstacles when interviewing experts and eliciting their
judgements, the format option “Sign” can be chosen in this case. Under this option, cross-impacts
are depict in a format free of numbers, using only “+” and “-“ symbols.
The cross-impact matrix of the exercise “Somewhereland” (Fig. 5-6) looks like shown in Fig. 7-3 then.
The sign of each impact (promoting or hindering) is represented by (+) or (-), the strength is classified

ScenarioWizard 4.3 97
by assigning more than one (max. three) signs to a cell. Promoting impacts are printed in green, hin-
dering impacts in red. Zeros (no impact) are omitted. Data can be assigned into the cells simply by
entering + or - signs using the keyboard or by marking the cell by mouse click and using the +/- but-
tons of the cim editor.
The judgement scale is strictly restricted to the range [--- ... +++] (corresponding to -3 ... +3) in this
case. The cim editor will refuse to accept inputs outside this range. If a project file containing judge-
ments outside this rage is loaded, the cross-impact format option will be automatically changed to
“Numbers”.
The print function of the cim editor answers to the format option and prints a matrix corresponding
to the depiction in the editor.
Fig. 7-3: Displaying a cross-impact matrix using the format option „Sign“.
The chosen cross-impact format is also used in the window “Impact balances” (Fig. 7-4). To empha-
size the qualitative aspect of the analysis, also the impact balances are not shown as numbers. Only
the fundamental information is expressed: The symbol [+] in an impact balance indicates that the
respective impact sum is the highest one within the impact balance, qualifying the respective de-
scriptor variant for the criterion of strong consistency (cf. section 7.1). The symbol [0] stands for an
impact sum smaller than the maximum but nevertheless positive so that its descriptor variant fulfils

ScenarioWizard 4.3 98
the criterion of weak consistency. A descriptor variant characterized by [-] in the balance row has a
negative impact sum and fulfils none of both consistency types.
Storing the impact balance window using the button “Export” creates a html-table, using the chosen
format option.
The format option “Sign” is exclusively a display option. It doesn’t affect any calculation, neither the
evaluation “Consistent scenarios” nor the operations of the window “Impact balance”.
Fig. 7-4: The impact balance window in case of the cross-impact format „Sign“.
7.3 Descriptor types
For some analytic problems the impacts between the descriptors differ in their strength and orienta-
tion, while they all share a common internal structure of their judgement sections. In this case it is
possible to characterize the impact by a single number instead of a submatrix. This considerably re-

ScenarioWizard 4.3 99
duces the amount of necessary data and simplifies the processes of data procurement and data qual-
ity management.
The window Options - Descriptor type offers some useful descriptor types (Fig. 7-5). If a descriptor
type is chosen, the ScenarioWizard will use a predefined impact pattern for all calculations and a
compact representation of the matrix is used when the cross-impact matrix is edited or printed.
Fig. 7-5: The options window „Descriptor type”.
The options of this window are as follows:
- The option “Multi variant“ is the default option. It represents the general case of CIB analysis
without predefined impact patterns. It offers a free choice of the number of descriptor vari-
ants and the internal structure of each interrelationship.
- The option “Event“ uses a descriptor type with two variants representing a passive (“0”) and
an active state (“1”) of the descriptor. Only the active state is assumed to cause impacts on
other descriptors. E.g. the judgement “impact strength of descriptor A on descriptor B is +2“
will be identified with the impact pattern
B 0 1
A 0 0 0
1 -2 +2
in this option.
- The option „Polar-2“ also uses descriptors with two variants. However, it is assumed that the
variants express an opposite and cause opposite impacts (e.g. “rising“/“falling“ or
“good“/“bad“). In this case the judgement “impact strength of descriptor A on descriptor B is
+1“ will be identified with the impact pattern
-

ScenarioWizard 4.3 100
B - +
A - +1 -1
+ -1 +1
- The option „Polar-3“ is similar to option „Polar-2“. However, it is assumed that an additional,
neutral variant exists. As a neutral variant, it causes no impacts. The judgement “impact
strength of descriptor A on descriptor B is -3“ is expressed by the impact pattern
B - 0 +
A - -3 0 +3
0 0 0 0
+ +3 0 -3
The procedure for the use of types is differently, depending on whether a new project shall be built
up by using descriptor types or whether an existing project shall be transformed to descriptor types.
Building up a new project using descriptor types
Step 1: Restart the ScenarioWizard and select a descriptor type in the window Options - Descriptor
type.
Step 2: Open the structure editor (cf. section 5.3) and enter the descriptors of the project. The struc-
ture editor operates in a different way if one of the options “Event”, “Polar-2”, or “Polar-3” is se-
lected. The state column of the editor form is invisible because only the descriptor list and the de-
scriptor names must be entered. The variants and their names (“0”/”+1”, “-1”/”+1”, or “-
1”/”0”/”+1”) are automatically assigned to each newly defined descriptor according to the chosen
descriptor type.
Step 3: Enter the cross-impact date using the cim editor (see section 5.7). The use of an impact pat-
tern makes it possible to portray an impact relation by a single number and to represent a cross-
impact matrix in a compact way without displaying the descriptor variants. If the options “Event”,
“Polar-2”, or “Polar-3” are chosen the cim editor uses the compact representation of the matrix. The
printout of a matrix also will be done in the compact format. Once the cim editor is closed, the full
cross-matrix is automatically generated in the program’s workspace.
Step 4: Save the project data as usual and proceed to the evaluation of the project.
The usage of descriptor types doesn’t affect the evaluation procedures and the display of their re-
sults. In these respects, there is no difference to the default option “Multi variant”.
Transforming an existing project to descriptor types
Existing projects can be transformed to descriptor types if its structure is compatible with at least
one of the descriptor types. I.e. either all descriptors have two variants or all descriptors have three
variants.
ScenarioWizard 4.3 101
Step 1: Load the project file of the project to be transformed (cf. section 5.2).
Step 2: Select the requested descriptor type in the window Options - Descriptor type. Options incom-
patible with the analysis structure are automatically disabled. E.g. the option „Polar-3“ is disabled if
the analysis structure contains a descriptor with more than three variants, or with less than three
variants. The option “Multi variant” (i.e. no use of descriptor types) is available in every case. Once
the option window is closed by clicking the button “OK” and a warning message is conformed, the
old variant names of the analysis structure are replaced by the predefined names of the selected
descriptor type. The existing cross-impact data are overwritten by the selected descriptor type pat-
tern, calibrating the pattern with the original cross-impact value in the bottom right cell of each
judgement section (cell “1/1” or “+/+”).
Step 3: Edit cross-impact data using the cim editor (cf. section 5.7) if necessary.
Step 4: Save the project file as usual and proceed to the evaluation of the project.
The usage of descriptor types doesn’t affect the evaluation procedures and the display of their re-
sults.
7.4 System reset
The menu item File - Reset offers three functions to clear ScenarioWizard’s workspace either in parts
or completely.
Clear comments
The menu item File - Reset - Clear comments deletes all comments on the project, on the descriptors
and on the cross-impacts from the workspace. All data saved in project files keep unchanged, how-
ever. Only the workspace of the current ScenarioWizard session is affected. If any comments were
modified since the last storing operation, a warning will appear before starting the clearing proce-
dure.
Clear cross-impact data
Selecting the menu item File - Reset - Clear cross-impact data removes the content of the cross-
impact matrix from the workspace. The analysis structure (descriptors and their variants) and also all
comments stay unchanged.

ScenarioWizard 4.3 102
Reset ScenarioWizard
The menu item File - Reset - Reset ScenarioWizard resets the program to its initial state after starting.
All project data in the workspace (analysis structure, cross-impact data, comments, evaluation re-
sults) are removed and all settings are changed back to their default values.
Each type of data reset is confined to ScenarioWizard’s workspace, however. All data already saved
in project files keep unchanged. If any project data were modified since the last storing operation, a
warning will appear before starting the clearing procedure.
7.5 Language selection
ScenarioWizard supports three language versions: English, German and Spanish. If you start Scenario-
Wizard for the first time a window will ask you to select the language of the program. Your choice
will be stored and the selected language will be used in all further sessions until you make another
choice.
Use the menu item Options - Language to change the initial language setting. The welcome window
will then open in the seleceted language, and all labels, text outputs, messages, and the help function
will appear in the seleceted language (exception: the Spanish language version uses the English help
text. A Spanish version of the help function is not available). Open windows will not be affected, but
their language will change if closed and reopened.
The last valid language will be stored when ScenarioWizard is closed, and it will be used again for the
next program session.
The language selection within ScenarioWizard does not affect the names stored in the project files.
An analysis structure written in English will stay unchanged, even if the program language mode is
changed to German (and vice versa). The specification of descriptor names and variant names and
the formulation of the comments (including the choice of language used) is left up to the user.
ScenarioWizard controls not the language of several Windows dialogs (Load file, Save file, Printer
setup). The language mode of these dialogs is determined by the language version of the installed
Windows operation system.

ScenarioWizard 4.3 103
8 The Presenter
The menu item Presenter starts ScenarioWizard's "Presenter Mode". The purpose of this mode is to
present data and evaluation results of a CIB analysis to an auditorium in a pre-structured way. How-
ever, some functions of the Presenter Mode can be useful also for own reflections about the analysis
and its results.
After starting the Presenter, the window Fig. 8-1 is shown. Initially, the presenter window is started
in full-screen mode in order to maximize the space available for the presentation. The window can be
scaled independently from the size of ScenarioWizard's main program window. Some content may
be hidden, then.
Fig. 8-1: After starting the Presenter window.
The command bar on the left side of the window contains a column of buttons for starting six "chap-
ters". The chapters are aligned following a standard course of a CIB presentation. Nonetheless, the
presentation chapters can be started in arbitrary sequence.
The Presenter Mode is available only if a project file was loaded or build up before. As long as the
project matrix was not evaluated and no scenarios are available in an activated evaluation protocol
the presenter chapters "Scenario tableau" and "Inside the scenarios" are deactivated. Both presenter

ScenarioWizard 4.3 104
chapters are available only after calculating scenarios using the menu item Consistent scenarios (cf.
chapter 6.4) or loading a scenario list using the menu item File - Load solution set (cf. chapter 6.4,
paragraph "Saving").
Both chapters are deactivated also in case of solution sets consisting of more than 50 scenarios be-
cause it appears unmanageable to discuss larger scenarios sets during a presentation. For large sce-
nario sets it is advisable to prepare a selection of scenarios in advance and to store the selection in a
separate solution set (sl-file) which is used during the presentation.
All Presenter functions were deliberately programmed in a way that avoids any control actions be-
sides simple mouse clicks. The intention is to ease the usage of the Presenter on touch-screen com-
puters.
The presenter chapters are described step-by step in the following paragraphs. Since the Presenter
Mode is intended basically for presentation purposes, all display elements used in the Presenter are
locked for input.
8.1 Chapter "About"
The purpose of the Presenter's opening chapter "About" is to offer basic information about the pro-
ject to the auditorium. After pressing the button "About" the program description text (as entered in
the structure editor - chapter 5.4 - or in the matrix editor - chapter 5.8) is displayed. Information
about the topic, goal of the analysis, working steps of the project, contributors etc. might be included
in this text. In the simplest case the program description consists of plain unformatted text as shown
in Fig. 8-2.
The font size of the text can be changed using the output option "Display font" (chapter 7.2).

ScenarioWizard 4.3 105
Fig. 8-2: Presenter chapter "About": Plain text project describtion.
A more appealing layout of the project description can be achieved by using html-formatted text.
Project description text starting with the tag <html> and ending with the tag </html> will be dis-
played using an internal browser and all usual html tags can be applied for formatting the project
description text. If the computer is connected to the internet links can be used also. An example of a
html-formatted "About" chapter is shown in Fig. 8-3.
If no project description text was defined the button "About" is deactivated and displayed in dark
grey.

ScenarioWizard 4.3 106
Fig. 8-3: Presenter chapter "About": Html-formatted project description.
8.2 Chapter "Descriptors"
This Presenter chapter deals with the descriptors of the scenario analysis and the alternative futures
(variants) assigned to the descriptors. After pressing the button "Descriptors" the list of descriptors is
displayed (Fig. 8-4). Again, the font size of the text can be changed using the output option "Display
font" (chapter 7.2).
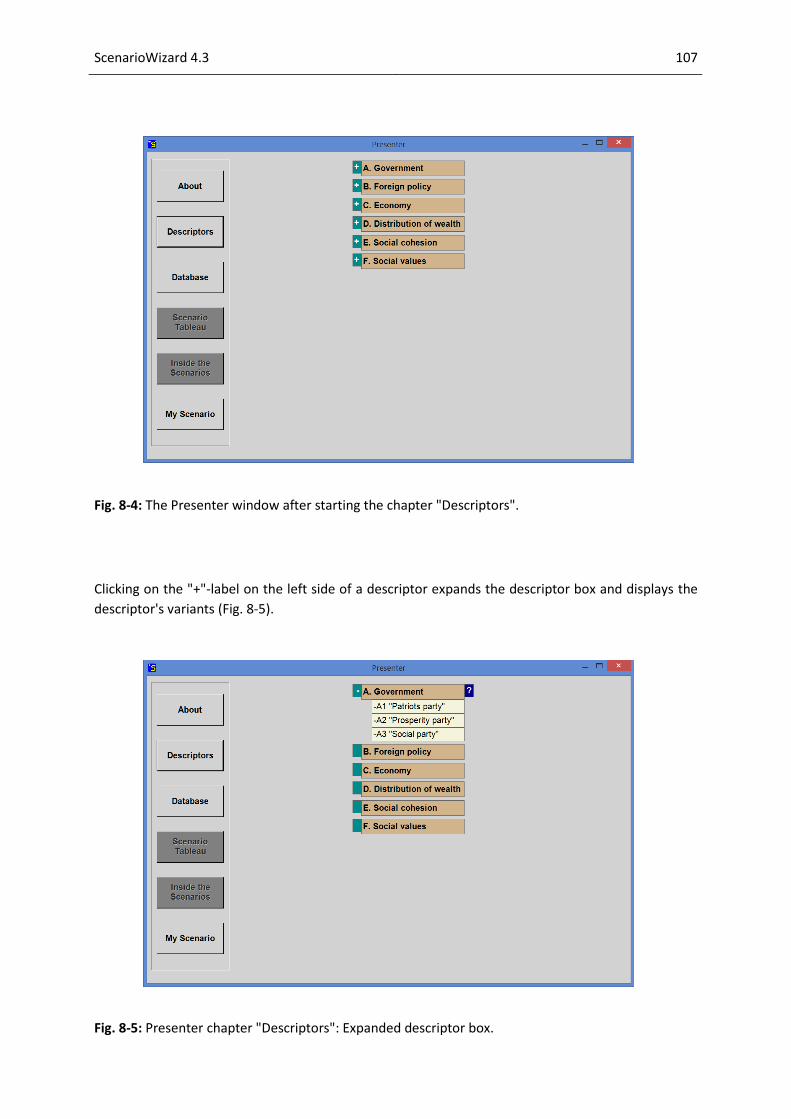
ScenarioWizard 4.3 107
Fig. 8-4: The Presenter window after starting the chapter "Descriptors".
Clicking on the "+"-label on the left side of a descriptor expands the descriptor box and displays the
descriptor's variants (Fig. 8-5).
Fig. 8-5: Presenter chapter "Descriptors": Expanded descriptor box.

ScenarioWizard 4.3 108
Clicking again on the same label (now marked by "-") will fold in the list of variants. As long as the list
of variants is displayed for a descriptor, the expansion labels of all other descriptors are deactivated.
Whilst a descriptor box is expanded as shown in Fig. 8-5 the blue "?"-label on the right side of the
descriptor box can be used for displaying the respective descriptor comment (cf. chapter 5.4 and
chapter 5.8). This is shown in Fig. 8-6. Clicking again on the same label (now marked by "X") will close
the text window.
Fig. 8-6: Presenter chapter "Descriptors": Variant list and comment window.
8.3 Chapter "Database"
The purpose of the Presenter chapter "Database" is to display the database of the analysis, i.e. the
cross-impact data and their textual explanations. After starting the chapter the Presenter displays a
diagram showing for which impact relations the database contains information. The color of a node
indicates if the database provides cross-impact data, or text, or both types of information about this
node (connectivity chart).
Again, the font size of the text can be changed using the output option "Display font" (chapter 7.2).

ScenarioWizard 4.3 109
Fig. 8-7: Presenter chapter "Database": Connectivity chart.
Long descriptor names will be truncated, if necessary, in order to ensure sufficient space for the con-
nectivity chart. When preparing a presentation about a CIB analysis with very long descriptor names
it is advisable to build a presentation version of the project file and to use appropriate abbreviations
of the descriptor names in the presentation version.
The connectivity chart serves as an access point leading to further database content. Clicking on a
descriptor name opens a text box showing the respective descriptor explanation text (Fig. 8-8).
Clicking on a node of the connectivity chart produces the cross-impact data of the respective impact
relation and the associated explanations (if available), as shown in Fig. 8-912. The text window can be
scrolled for complete access to a long explanation text. The selected node is marked by yellow color.
Large matrices and the choice of a high font size can result in a connectivity chart too extended to be
displayed as a whole on the Presenter window. The Presenter will automatically reduce the font size
in those cases.
12
After a fresh start of the "Database" chapter, it can be necessary to click twice to activate a node.

ScenarioWizard 4.3 110
Fig. 8-8: Presenter chapter "Database": Displaying a descriptor essay.
Fig. 8-9: Presenter chapter "Database": Displaying cross-impact data.

ScenarioWizard 4.3 111
8.4 Chapter "Scenario Tableau"
The Presenter chapter "Scenario Tableau" aims at displaying all scenarios in an integrated way. The
chapter is available only after scenarios were calculated using the menu item Consistent scenarios (cf.
chapter 6.4) or loaded using the menu item File - Load solution set (cf. chapter 6.4, paragraph "Sav-
ing"). Otherwise the button "Scenario Tableau" is depicted in dark grey and deactivated.
After pressing the button "Scenario Tableau" all current scenarios are shown in a representation
equivalent to the representation described in chapter 6.5. Different to the scenario tableau function
presented in chapter 6.5, the user cannot edit or modify the tableau during a Presenter session.
The font size used in the tableau can be changed using the output option "Display font" (chapter 7.2).
Fig. 8-10: Presenter chapter "Scenario tableau": Depiction of a scenario set.

ScenarioWizard 4.3 112
8.5 Chapter "Inside the Scenarios"
This chapter is also available only after scenarios were calculated using the menu item Consistent
scenarios (cf. chapter 6.4) or loaded using the menu item File - Load solution set (cf. chapter 6.4, par-
agraph "Saving"). Otherwise the button "Inside the Scenarios" is depicted in dark grey and deactivat-
ed. The purpose of the chapter is to take a closer look at a single scenario and unveil its internal logic
structure.
Selecting a scenario to be scrutinized
Pressing the button "Inside the Scenarios" produces an array of buttons, one for each scenario listed
in the evaluation protocol. The buttons are labeled with the scenario number (assigned in the evalua-
tion protocol) or, if available, the scenario title (cf. chapter 6.5, paragraph "Scenario titles"). Using
the scenario titles of the Somewhereland exercise shown in Fig. 2-4, the Presenter displays the
screen shown in Fig. 8-11.
Fig. 8-11: Presenter chapter "Inside the scenarios": Selecting a scenario.
In case of subsequent scenarios with identical title the Presenter attaches an identification suffix (a),
(b), ... to the scenario title. The use of identical titles for a group of scenarios makes sense in order to
express their similarity and their affiliation to a scenario family.

ScenarioWizard 4.3 113
Mapping the scenario
Pressing one of the scenario buttons draws the respective scenario using an array of descriptor boxes
showing the descriptor name in the upper part and the allocated future variant in the lower part (Fig.
8-12).
Fig. 8-12: Presenter chapter "Inside the scenarios": Depiction of the scenario "Society in crisis".
Checking the scenario consistency
A consistency check of the scenario can be activated by clicking on the dark green button at the bot-
tom of the window. The lower part of each consistent descriptor will be depicted in light green color.
In case of an inconsistent descriptor the lower part of the respective descriptor box is colored in red.
Not surprisingly, the consistency check of the scenario "Society in crisis" shown in Fig. 8-12 leads to
green marks for all descriptors. Finally, this scenario is the result of the evaluation "Consistent sce-
narios", and the result of the consistency check is simply a confirmation of the validity of the evalua-
tion. The actual purpose of the consistency check is to study the effect of scenario modifications on
the descriptor's consistency. This can be demonstrated by changing the assumed variant for a de-
scriptor by clicking on the variant. The Presenter changes the variant to the next item of the de-
scriptor's list of variants and updates all consistency assessments (in case the last variant was active
before clicking, Presenter jumps back to the first item of the variant list). For instance, clicking on the
box "B3. Conflict" (lower part of descriptor box "B. Foreign policy") produces Fig. 8-13.

ScenarioWizard 4.3 114
Fig. 8-13: Presenter chapter "Inside the Scenarios": Activated consistency check.
The assigned future variant of descriptor "B. Foreign policy" changed from "B3. Conflict" to "B1. Co-
operation". The consistency check immediately identifies that the descriptor "B. Foreign policy" itself
and, moreover, the descriptor "C. Economy" becomes inconsistent as a result of this change.
After activating the consistency check the button "Activate consistency check" is renamed to "Deac-
tivate consistency check". Pressing the button again will deactivate the function and restore the orig-
inal caption of the button.
Saving a modified scenario
In the course of a presentation discussions may lead to the desire to modify a scenario and to store
the modified scenario. The dark green button "Transfer" at the bottom of the window offers the op-
portunity to copy the modified scenario to the evaluation protocol and to supplement the protocol's
scenario list. So far, the modified scenario is stored only until the evaluation protocol is closed, how-
ever. For permanent storage of the modified scenario the expanded scenario list should be stored
using the "Save" button of the evaluation protocol before closing the protocol window.
The Presenter assigns the titles "MyScenario 1", "MyScenario 2", ... to the supplemented scenarios.
The user can change the scenario titles using the "Tableau" function of the evaluation protocol (cf.
chapter 6.5).
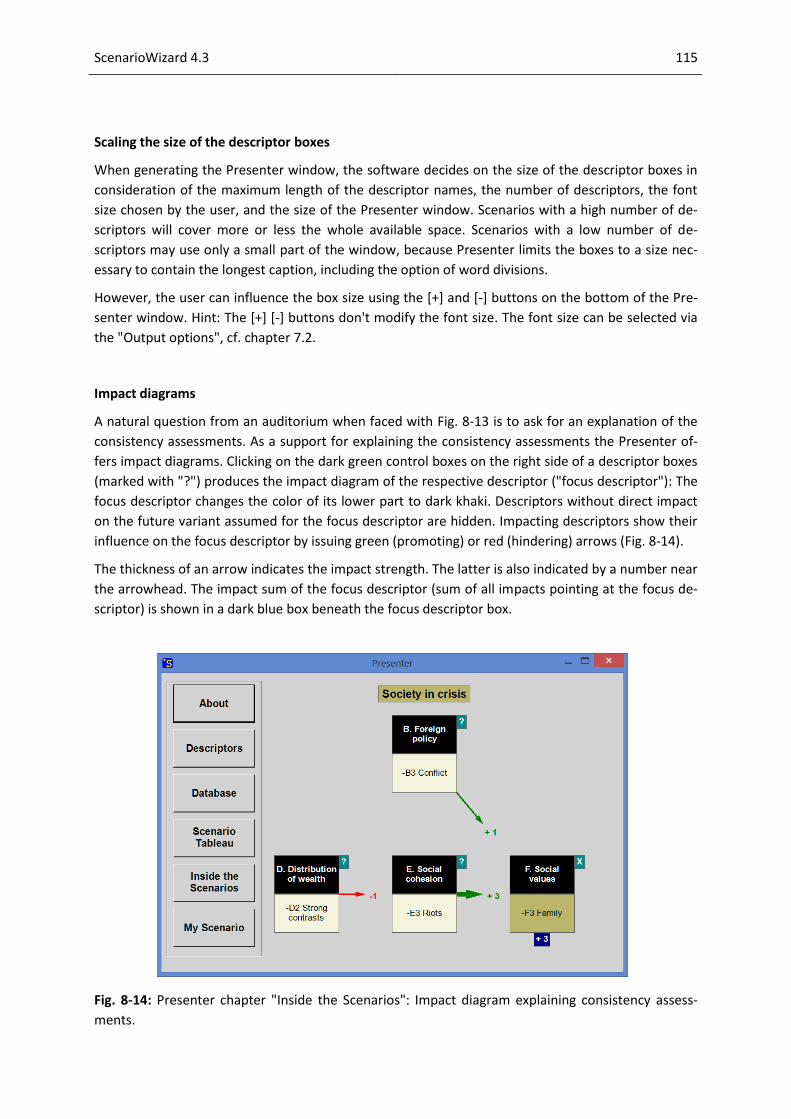
ScenarioWizard 4.3 115
Scaling the size of the descriptor boxes
When generating the Presenter window, the software decides on the size of the descriptor boxes in
consideration of the maximum length of the descriptor names, the number of descriptors, the font
size chosen by the user, and the size of the Presenter window. Scenarios with a high number of de-
scriptors will cover more or less the whole available space. Scenarios with a low number of de-
scriptors may use only a small part of the window, because Presenter limits the boxes to a size nec-
essary to contain the longest caption, including the option of word divisions.
However, the user can influence the box size using the [+] and [-] buttons on the bottom of the Pre-
senter window. Hint: The [+] [-] buttons don't modify the font size. The font size can be selected via
the "Output options", cf. chapter 7.2.
Impact diagrams
A natural question from an auditorium when faced with Fig. 8-13 is to ask for an explanation of the
consistency assessments. As a support for explaining the consistency assessments the Presenter of-
fers impact diagrams. Clicking on the dark green control boxes on the right side of a descriptor boxes
(marked with "?") produces the impact diagram of the respective descriptor ("focus descriptor"): The
focus descriptor changes the color of its lower part to dark khaki. Descriptors without direct impact
on the future variant assumed for the focus descriptor are hidden. Impacting descriptors show their
influence on the focus descriptor by issuing green (promoting) or red (hindering) arrows (Fig. 8-14).
The thickness of an arrow indicates the impact strength. The latter is also indicated by a number near
the arrowhead. The impact sum of the focus descriptor (sum of all impacts pointing at the focus de-
scriptor) is shown in a dark blue box beneath the focus descriptor box.
Fig. 8-14: Presenter chapter "Inside the Scenarios": Impact diagram explaining consistency assess-
ments.

ScenarioWizard 4.3 116
The effect of changing the focus descriptor's future variant can be demonstrated by clicking on the
lower part of the focus descriptor box. The next item of the focus descriptor's variant list is selected
and the impact diagram is updated. Consistency means that a change of variant will never improve
the impact sum of the focus descriptor13. In case of inconsistent descriptors, there will be at least one
variant which achieves a higher impact sum and, therefore, would have been a more appropriate
choice of the focus descriptor's assumed future.
For a deeper understanding of the impact relations depicted by the impact diagram the impact
comments can be retrieved, if available. This can be done by clicking on the green control boxes
marked by "?" and located on the right side of the box of each impacting descriptor. In Fig. 8-14 this
is shown for the descriptor "E. Social cohesion".
Fig. 8-15: Presenter chapter "Inside the Scenarios": Displaying explanatory text about impact rela-
tions.
The text box can be resized or moved by "click and drag" using the mouse. It can be closed by clicking
on the red closing button on the upper right side of the text box. Clicking on the control button of the
focus descriptor (marked by "X") will close the impact diagram and Presenter returns to the general
scenario map shown in Fig. 8-12 and Fig. 8-13.
13
In case of perfect consistent scenarios. If limited inconsistency is permitted (cf. evaluation options, chapter 7.1), a change of variants may lead to an improvement of the impact sum up to the permitted maximum incon-sistency.

ScenarioWizard 4.3 117
8.6 Chapter "My Scenario"
The purpose of the Presenter chapter "My Scenario" is to design a scenario following the ideas of the
auditorium.
The functions of the chapter are an exact copy of the functions of the Presenter chapter "Inside the
Scenarios" (chapter 8.5). Different to "Inside the Scenarios" this chapter starts with a neutral basic
state of the scenario: each descriptor is set to the first item of its variant list. Now the user can select
the desired variant for each descriptor by clicking on the lower part of each descriptor box. After
pressing the button "Activate consistency check" all inconsistencies of the chosen scenario are
marked by red color. A click on the control box "?" of a inconsistent descriptor makes the reasons
behind the inconsistency visible by displaying the impact diagram of the descriptor.
Once the auditorium is satisfied with the scenario it can be transferred to the evaluation protocol by
pressing the button "Transfer" regardless of its consistency status (if the evaluation protocol is not
active it will be automatically opened once the "Transfer" button is used). For permanent storage of
the scenario the content of the evaluation protocol should be stored using the "Save" button of the
evaluation protocol before closing the protocol window.
The Presenter chapter "My Scenario" is particularly suitable to demonstrate the difficulties of a un-
systematic scenario construction. Especially in case of large matrices it is impressive to observe how
fixing the inconsistency of one descriptor can generate new inconsistencies for other descriptors.
ScenarioWizard 4.3 118
9 Limitations
The limitations for the size of ScenarioWizard 4.3 data structures are as follows:
Not more than 199 descriptors;
Not more than 9 variants for each descriptor;
Not more than 99 ensemble members;
The number of combinations (the product of the numbers of variants of all descriptors) must
not exceed ca. 9,22 1018 in case of the evaluation option “Complete” (cf. section 7.1). This
limit was strongly increased compared to earlier versions of the software. It is not longer of
practical relevance because computation time restrictions impose tighter limits to the size of
the matrix. Use the evaluation option “Monte Carlo“ to solve very large matrices.
Not more than 9.999 solutions will be displayed in the course of an evaluation. If more solu-
tions exist, a message will be printed in the evaluation protocol;
In the course of the evaluations “Consistent scenarios” including weight calculation (cf. sec-
tion 7.1) or activated option “Calculate cycles”, solutions will be found by the evaluation pro-
cedure if the length of their transient plus the cycle period does not exceed 100 iteration
steps. A transgression of this limit is indicated by “cycles” of period 99 in the evaluation pro-
tocol. In this case, the list of solutions may be incomplete and the weights are not valid. In
practice such cases are extremely rare. Typical values for the length of attractor periods and
transients are about 10 or less. In case of an evaluation “Consistent scenarios” without
weight calculation (default setting) there is no such limitation. All solutions will be identified
by the search algorithm also in the (rare) case of excessive transient length.
The Presenter mode is limited to import max. 50 scenarios from the evaluation protocol. The
total number of scenarios in the Presenter mode, including all "MyScenarios" generated dur-
ing a presentation, is limited to max. 100 scenarios.
The limit values are by far sufficient to carry out a cross-impact analysis of typical size. In the case of
large descriptor and state numbers, the computation time is more likely to put a limit on the size of
the matrix.
A matrix of typical size (i.e. 12-15 descriptors, each owning 2-3 variants) requires a computation time
of a few seconds or less. Large matrices may require a computation time of several hours or even
more. A clue about the order of magnitude of the computation time gives the number of combina-
tions of a matrix (the product of the number of variants of all descriptors). Matrices up to approx.
10.000.000 combinations typically require a few seconds computation time. Matrices with some
100.000.000 combinations typically cause a computation time of a few minutes. The evaluation of a
matrix with a ten-digits number of combinations may require several hours. These numbers depend
on hardware characteristics. They are valid only as a rough approximation and in case of deactivated
weight calculation. Computations including weight calculation take considerable more time.
In cases of unacceptable computation times, the use of the “Monte Carlo” evaluation option should
be considered (cf. section 7.1).

ScenarioWizard 4.3 119
10 Acknowledgements
The author wishes to thank Dr. Diethard Schade for his guidance and support during the first devel-
opmental phase of CIB and Professor Ortwin Renn for his generous offer to continue developing the
method at his institute. Special thanks go to Prof. Georg Förster, Dr. Ulrich Fahl, Dr. Astrid Aretz, Dr.
Gerhard Fuchs, Dr. Vanessa Schweizer, Sandra Wassermann, Dr. Stefan Vögele, Christian Léon, Jür-
gen Deuschle, Hannah Kosow, Dr. Till Jenssen, Ullrich Lorenz, Sigrid Prehofer, Dr. Wolfgang Hauser,
Ricarda Scheele, Dr. Thomas Pregger, Dr. Tobias Naegler, Dr. Witold-Roger Poganietz, Jens Buchgeis-
ter, Andreas Rieder, and Arash Shojachaikar for fruitful discussions, project cooperation, valuable
suggestions for the improvement of the software and supporting the dissemination of the method.
Lucy James, Sophia Alcantara, Saâd Tabet-Aoul and Nina Fischer assisted in the preparation of the
English and Spanish versions of the program. CIB projects were funded by the Center for Technology
Assessment of Baden-Württemberg, the German Federal Ministry of Economics, the Ministry for
Science and Art of Baden-Württemberg, the Volkswagen Foundation, the German Federal Ministry of
Education and Research, the German Federal Environment Agency, Deutsche Forschungsgemein-
schaft (DFG), and the Helmholtz Association.

ScenarioWizard 4.3 120
11 End User Licence Agreement (EULA)
Herein "AUTHOR" shall refer to the copyright owner stated below, "PRODUCT" shall refer to the software ScenarioWizard, developed and provided by the AUTHOR, "SERVICES" shall refer to services developed and provided by the AUTHOR in order to support the users of the PRODUCT, "USER" shall refer to you, the user (either as an individual, single entity or group). This End User Licence Agreement (EULA) is an agreement between you, the USER and the mentioned AUTHOR. By using the mentioned AUTHOR's PRODUCT, SERVICES and all other documents associated with and/or accompanying such, you agree to have read, fully understood and agree to be bound by, the terms set out below. I. PRODUCT All PRODUCT and accompanying materials provided by the AUTHOR, are provided "as is", without warranty. By using the PRODUCT, you agree not to hold the AUTHOR liable for any damages that may occur. II. SERVICES All SERVICES and accompanying materials provided by the AUTHOR, are provided "as is", without warranty. By using the SERVICES, you agree not to hold the AUTHOR liable for any damages that may occur. Further you agree that SERVICES may be discontinued at any time, without prior notification. III. LICENCE Under the terms of this agreement, a non-exclusive [FREEWARE] licence is granted to the USER on the understanding the AUTHOR retains ALL rights to SERVICES, PRODUCT, written materials and other such supplies. Under this agreement, you are free to download and/or use the SERVICES and PRODUCT provided by the AUTHOR for both personal, scientific and commercial use, but are NOT permitted to attempt to modify, de-compile, merge, sell, lease or otherwise misuse said AUTHOR's PRODUCT and/or SER-VICES, including but not limited to, all graphics, documents and other such files. IV. DISTRIBUTION Under the terms of this agreement, the AUTHOR grants you a non-exclusive licence to re-distribute the PRODUCT provided by said AUTHOR, on the understanding no attempt is made to sell or other-wise personally or financially gain from the distribution of the PRODUCT. All files provided MUST remain unchanged and in full, including, but not limited to: EULA, DISTRIBUTION, Help, PRODUCT and all other such files. V. DISTRIBUTION RESTRICTIONS Whilst the AUTHOR grants you permission to distribute said AUTHOR's PRODUCTS, the following restrictions apply in all cases where the PRODUCT and/or SERVICE has been developed and/or [is] provided by said AUTHOR. You may not list the AUTHOR's PRODUCT and SERVICES on website's that charge for access to list-ings, downloadable files or other such material. You may not list or distribute said AUTHOR's PRODUCT and SERVICES via cd-rom or other such media, except where charges are for postage only.

ScenarioWizard 4.3 121
You may not "bundle" said AUTHOR's PRODUCT and SERVICES with ANY product and/or service that has not been developed and/or is provided by said AUTHOR without written permission of the AU-THOR. If including said AUTHOR's PRODUCT and SERVICES on media such as CD-ROM, DVD, floppy disc, the AUTHOR must be informed prior to your doing so. Additionally, said AUTHOR reserves the right to be sent a copy of such media without charge, monetary or otherwise. VI. EULA MODIFICATIONS The aforementioned AUTHOR reserves the right to modify this EULA at any time, without notice. Should such a modification take place, the USER is expected to read and agree to such modifications within 7 days. Failure to agree to such modifications shall require said USER cease using said AU-THOR's PRODUCT and/or SERVICES. VII. EULA TERMINATION Said AUTHOR reserves the right to terminate this agreement at any time, in whole or part without notice or prior warning. Should such a termination take place, the USER shall be granted a non-exclusive gratis licence to carry on using said AUTHOR's PRODUCT with the same restrictions above, but with the understanding, no SERVICES shall be provided for said PRODUCT. Copyright: Dr. Wolfgang Weimer-Jehle c/o ZIRIUS Stuttgart Research Center for Interdisciplinary Risk and Innovation Studies University of Stuttgart Seidenstr. 36 70174 Stuttgart Germany Phone: ++49 (0)711 6858-4301 [email protected] www.zirius.eu www.cross-impact.de

ScenarioWizard 4.3 122
12 Glossary
Analysis structure The set of descriptors and their alternative variants. The set of descriptors and variants is called „analysis structure“ be-cause they define the reach and the limits of a CIB analysis in a fundamental manner.
Attractor weights Attractor weight (combinatorial weight) is a number to char-acterize scenarios. The attractor weight indicates how often a scenario is found by scenario succession if all possible de-scriptor variant combinations are used as a start scenario of the scenario succession (cf. glossary entry “Succession”).
This means that the ratio of a scenario’s attractor weight and the total number of possible descriptor variant combinations indicates the probability of finding this scenario by applying succession on a random start scenario.
Autonomous descriptors (Primary) autonomous descriptors are not object to any im-pacts within a cross-impact matrix. I.e. the column of an autonomous descriptor is completely filled with zeros.
Secondary autonomous descriptors are influenced only by primary autonomous descriptors.
Bias A descriptor is biased if the maximum impact score of a ran-
domly chosen scenario is assigned more frequently to some
descriptor variants than to others.
CIB Cross-impact balance analysis. Cf. section 2.
CIM Cross-impact matrix.
Coded representation of a scenario An example of a coded scenario representation is: “2 1 3 2“.
The code indicates that the scenario consists of four descrip-
tors. The first descriptor takes variant no. 2, the second de-
scriptor takes variant no. 1, the third descriptor takes variant
no. 3, and the fourth descriptor takes variant no. 2.
Descriptor A system element, that is needed to describe the state or the
development of a system or the influences that determine
the systems behavior.

ScenarioWizard 4.3 123
DVL Descriptor-variant-list (analysis structure).
Echo (Impact-) Echoes are a special type of indirect impact path-
ways leading from an impact source to an intermediate de-
scriptor and directly back to the impact source. I.e. if descrip-
tor variant A1 impacts descriptor variant B3, and B3 in turn
affects A1, then A1 receives an "impact echo" from B3. If the
impact strengths of both parts of this impact pathway show
the same sign, the echo stabilizes the impact source A1, oth-
erwise it unfolds a destabilizing effect. Echoes can be identi-
fied using the pathway analysis function of the ScenarioWiz-
ard (see section 6.11).
Ensemble A system may be represented by more than one cross-
impact matrix. This can be the case if different experts are
asked to design a qualitative model of the system under con-
sideration, and each of them code his/her model as a sepa-
rate cross-impact matrix. The elicitation of different expert
opinions is a suitable procedure to get a broad view on a
system and to get information about the uncertainties of
judgments. A set of cross-impact matrices, each of them
concerns the same system, is called a “cim ensemble”. Dis-
crepancies between the members of the ensemble express
judgment difficulties or indicate a dissent of expert opinions.
The ScenarioWizard provides several procedures to handle
cim ensembles.
Ensemble mode and normal mode There are two operation modes of the ScenarioWizard. In
the normal mode, only menu items intended to process sin-
gle cross-impact matrices, are enabled. In the ensemble
mode, only menu items intended to process a set of cross-
impact matrices (the ensemble), are enabled. The Scenario-
Wizard automatically switches between both operation
modes.
Ensemble weight Ensemble weights are calculated in the course of an ensem-
ble scenario evaluation (cf. section 6.8). In this evaluation,
scenarios are calculated for a set of several cross-impact
matrices (ensemble members), sharing a common analysis
structure, yet differing in their cross-impact data. The en-
semble weight of a scenario indicates how many ensemble
members include this scenario in their solution list, i.e. how
many ensemble members accept this scenario as a con-
ScenarioWizard 4.3 124
sistent scenario.
Impact echo See "Echo".
Impact score
The impact score represents a scenario’s aggregated impact
on a certain descriptor variant. The impact score is calculated
by highlighting the rows of all descriptor variants in the
cross-impact matrix selected by the scenario and adding all
highlighted impacts within a variant’s column. The impact
scores of all variants of a descriptor set up the descriptor’s
impact balance.
Inconsistency of a descriptor The inconsistency value of a descriptor is equal to the gap
between the impact score of the selected variant of the de-
scriptor and the maximum impact score of the descriptors
impact balance.
Inconsistency of a scenario Maximum descriptor inconsistency of the scenario. The sce-
nario-inconsistency is a local measure of the plausibility of
the scenario (cf. “Total impact score”).
Judgement group One row of a judgement section.
Judgement section A data block (submatrix) of the cross-impact matrix. It de-
scribes the impact of a descriptor on another descriptor.
Monte-Carlo Method A method to conduct an approximate evaluation of large
matrices. In this case there will be no complete exploration
of all possible scenarios. Instead of this, a number of ran-
domly chosen scenarios will be used as a starting point for
constructing a consistent scenario by the succession method.
However, only the main solutions (i.e. consistent scenarios
with high combinatorial weight) will be identified in a reliable
way. Consistent scenarios with low weight may be missed.
News value The "News value" of a scenario X with respect to a scenario
group G is defined as the minimum of all distances between
X and the scenarios of G (distance between two scenarios is
defined to be the amount of descriptors showing different
variants for the two scenarios). I.e. the news value of a sce-
nario with respect to a scenario group is the scenario's dis-
tance to its closest relative among the group's scenarios. This
means, a scenarios achieves a high news value if it resembles

ScenarioWizard 4.3 125
none of the group's scenarios. On the other hand, a scenario
which is very similar to one or more of the group's scenarios
is assessed to have a low news value.
Passive descriptor (Primary) passive descriptors don’t exert any influence on
other descriptors. The row of a (primary) passive descriptor
is completely filled with zeros, therefore.
Secondary passive descriptors exert influences only on pri-
mary passive descriptors.
Pathway analysis Descriptors in CIB are usually connected (also) by indirect
pathways. I.e. descriptor A may influence descriptor B even
in those cases when there is no (direct) cross-impact from A
to B because A impacts descriptor C, and C impacts B.
Pathway analysis is a tool for identifying indirect pathways
between a given pair of descriptors, by this promoting a bet-
ter understanding of the internal logic structure of consistent
scenarios. ScenarioWizard provides a function for identifying
first-order indirect pathways (pathways running from impact
source to impact target via one intermediate descriptor, see
section 6.11).
A special type of impact pathways are "Echoes" (see above).
SL Solution list (list of consistent scenarios).
Standardization A judgement group of a cross-impact matrix is standardized,
if its cross-impacts sum to zero. The standardization is not
demanded by the mathematics of CIB, but it supports the
comprehensibility of the data. This convention expresses
that promoting influences towards one state restricts respec-
tive opposites.
States Former name of the possible variants of descriptor behaviour
(cf. glossary entry “Variant”).
Succession A CIB procedure to find the solutions of a cross-impact ma-
trix (consistent scenario or scenario cycle) using an iteration
procedure. The succession starts with an initial scenario,
computes the impact balances by summing up the cross-
impacts of all rows of the scenario, and switches all descrip-
tor variants to the variants of maximum impact score within

ScenarioWizard 4.3 126
every descriptor impact balance (“Global succession mode”).
This procedure is repeated until it yields a consistent sce-
nario (or a scenario cycle).
When calculating attractor weights (cf. glossary entry “At-
tractor weights and section 7.1) ScenarioWizard executes a
scenario succession for every possible initial scenario. The
succession is repeated until a result is found (consistent sce-
nario or scenario cycle), and the result of every succession is
counted and indicated in the evaluation protocol. Depending
on the size of the cross-impact matrix, a matrix evaluation
requires several thousand or several million succession steps.
ScenarioWizard provides four alternative succession modes
(“Global”, “Local”, “Incremental”, “Adiabadic”). The modes
are described in section 7.1.
Total impact score Sum of the impact scores of all selected variants of a sce-
nario. The total impact score is a global measure of the plau-
sibility of a scenario (cf. "Inconsistency").
Variants (descriptor variants) The range of possible system behaviour is characterized in
CIB by assigning a set of “variants” to each descriptor. E.g. in
the exercise „Somewhereland“ the descriptor „Social cohe-
sion“ contains the three variants „Social peace”, “Tensions”
and “Riots”.
In former versions of ScenarioWizard the descriptor variants
were named “states”. The more neutral name “variant” is
preferred in ScenarioWizard4 because descriptors can be
used not only to describe stationary system states (“Ten-
sions”) but also temporal developments (e.g. “Increasing
tensions”).
Volume weights The “Volume weight” of a scenario indicates the share of the
configuration space (possible combinations of descriptor
variants) which is related to this scenario closer than to any
other scenario of the solution list. The closeness of relation is
measured by the number of matching descriptor variants.
The volume weights are calculated during the evaluation
“Consistent scenarios” if the option “Calculate weights - Vol-
ume weights” is activated in the evaluation options window
(cf. section 7.1).
Scenarios with high volume weight are frequently scenarios
with a characteristic scenario theme, distinct from all other

ScenarioWizard 4.3 127
scenarios. Scenarios with low volume weight are closely re-
lated to other scenarios and can be interpreted as variants of
a scenario theme which they share with one or more other
scenarios (cf. section 7.1).
Weights ScenarioWizard uses three types of weights to characterize
scenarios:
Attractor weights
Volume weights
Ensemble weights
Each type of weight correspondents to a specific interpreta-
tion. Cf. respective glossary entries.

ScenarioWizard 4.3 128
Appendix

ScenarioWizard 4.3 129
Appendix 1: The scw file format
ScenarioWizard project files (scw-files) are text files. As an alternative to editing the project data
using the analysis editor or the cim editor they can be edited using a text editor. In such instances
ScenarioWizard syntax rules governing scw files have to be observed exactly. Scw files consist of five
data sections:
Section I: general information (File signature and project name)
Section II: analysis structure (long names and short names of descriptors and variants)
Section III: Color codes of descriptor variants
Section IV: Cross-impact data
Section V: Comments on descriptors and cross-impacts
The initial section consists of two rows:
$ ScenarioWizard 4.0
Somewhereland.scw
The first line serves as a signature. It enables the program to recognize a ScenarioWizard4 project
file. If ScenarioWizard cannot read this signature, the loading procedure is aborted. The second line
stores the project name and is usually identical to the file name.
Now follows the long names and the short names of the descriptors and their variants (data section
II). The data of the exercise “Somewhereland”:
Long names Short names
Descriptors: Variants: Descriptors: Variants:
A. Government
A1 "Patriots party"
A2 "Prosperity party"
A3 "Social party"
A. A1 A2 A3
B. Foreign policy
B1 Cooperation
B2 Rivalry
B3 Conflict
B. B1 B2 B3
C. Economy C1 Shrinking
C2 Stagnant
C3 Dynamic
C. C1 C2 C3
D. Distribution of wealth
D1 Balanced
D2 Strong contrasts
D. D1 D2
E. Social cohesion E1 Social peace
E2 Tensions
E3 Riots
E. E1 E2 E3
F. Social values F1 Meritocratic
F2 Solidarity
F3 Family
F. F1 F2 F3

ScenarioWizard 4.3 130
are stored as follows:
&A. Government
-A1 "Patriots party"
-A2 "Prosperity party"
-A3 "Social party"
&B. Foreign policy
-B1 Cooperation
-B2 Rivalry
-B3 Conflict
&C. Economy
-C1 Shrinking
-C2 Stagnant
-C3 Dynamic
&D. Distribution of wealth
-D1 Balanced
-D2 Strong contrasts
&E. Social cohesion
-E1 Social peace
-E2 Tensions
-E3 Riots
&F. Social values
-F1 Meritocratic
-F2 Solidarity
-F3 Family
#
&A
A1
A2
A3
&B
B1
B2
B3
&C
C1
C2
C3
&D
D1
D2
&E
E1
E2
E3
&F
F1
F2
F3
#
#
First, a paragraph with the long names follows. The character “&“ is put at the beginning of each
descriptor name. The following lines up to the next descriptor name contain the variant names with

ScenarioWizard 4.3 131
an empty character and hyphen at the beginning of each line. The section ends with the character
“#“.
The next paragraph contains the short names using the same pattern. But the lines with the variant
names begin only with an empty character and not a hyphen, as was the case for the long names.
The paragraph ends with two successive lines with the character “#”. This is also the end of the data
section II.
The subsequent data section contains the color code data. The colors are stored using hexadecimal RGB code. The list starts with the color codes of the first descriptor’s variants, then the second de-scriptor’s variants, and so on. Again, the section ends with two successive lines with the character “#”.
C4BD97
C4BD97
C4BD97
D7E4BD
FFFFAF
FFAAAA
FFAAAA
FFFFAF
D7E4BD
D7E4BD
FFAAAA
D7E4BD
FFFFAF
FFAAAA
C4BD97
C4BD97
C4BD97
#
#
These color codes correspond to the colors shown in Fig. 5-4. The “Somewhereland” project file in-
cluded in the installation package is not color-coded, however. All color data in section III show the
value “FFFFFF” (white).
Now follows section IV storing the cross-impact data. The structure of the section is displayed in the following table. Every line contains the data of one row. For regular cross-impact matrices, the di-agonal sectors are filled with zeros. All data are separated by commas. The section ends with one line with the character “#”.

ScenarioWizard 4.3 132
0 , 0 , 0 ,-2 , 1 , 1 , 0 , 0 , 0 , 0 , 0 ,-2 , 1 , 1 , 0 , 0 , 0
0 , 0 , 0 , 2 , 1 ,-3 ,-2 ,-1 , 3 ,-2 , 2 , 0 , 0 , 0 , 2 ,-1 ,-1
0 , 0 , 0 , 0 , 0 , 0 , 0 , 2 ,-2 , 3 ,-3 , 2 ,-1 ,-1 ,-2 , 2 , 0
0 , 0 , 0 , 0 , 0 , 0 ,-2 , 1 , 1 , 0 , 0 , 0 , 0 , 0 , 0 , 0 , 0
0 , 0 , 0 , 0 , 0 , 0 , 0 , 1 ,-1 , 0 , 0 , 1 , 0 ,-1 , 0 , 0 , 0
3 ,-1 ,-2 , 0 , 0 , 0 , 3 , 0 ,-3 , 0 , 0 , 3 ,-1 ,-2 ,-2 , 1 , 1
2 , 1 ,-3 , 0 , 0 , 0 , 0 , 0 , 0 ,-2 , 2 ,-3 , 1 , 2 , 0 , 0 , 0
-1 , 2 ,-1 , 0 , 0 , 0 , 0 , 0 , 0 , 0 , 0 , 0 , 0 , 0 , 0 , 0 , 0
0 , 0 , 0 , 0 , 0 , 0 , 0 , 0 , 0 ,-2 , 2 , 3 ,-1 ,-2 , 0 , 0 , 0
0 , 0 , 0 , 0 , 0 , 0 , 0 , 0 , 0 , 0 , 0 , 3 ,-1 ,-2 ,-2 , 1 , 1
0 ,-3 , 3 , 0 , 0 , 0 , 0 , 0 , 0 , 0 , 0 ,-3 , 1 , 2 , 2 ,-1 ,-1
0 , 0 , 0 , 0 , 0 , 0 ,-2 ,-1 , 3 , 0 , 0 , 0 , 0 , 0 , 2 ,-1 ,-1
0 , 0 , 0 ,-1 , 0 , 1 , 1 , 1 ,-2 , 0 , 0 , 0 , 0 , 0 ,-1 , 0 , 1
2 ,-1 ,-1 ,-3 , 1 , 2 , 3 , 0 ,-3 , 0 , 0 , 0 , 0 , 0 ,-2 ,-1 , 3
0 , 3 ,-3 , 0 , 0 , 0 ,-3 , 0 , 3 ,-3 , 3 ,-2 , 1 , 1 , 0 , 0 , 0
1 ,-2 , 1 , 0 , 0 , 0 ,-1 , 2 ,-1 , 2 ,-2 , 2 ,-1 ,-1 , 0 , 0 , 0
0 , 0 , 0 , 0 , 0 , 0 ,-1 , 2 ,-1 , 1 ,-1 , 2 ,-1 ,-1 , 0 , 0 , 0
#
The last data section contains the comments. First the general project description is displayed under
the title “# 0-0”. Then the descriptor comments follow, each under the title “# Short name of descrip-
tor”. The comments are printed in quotation marks. If a descriptor was not commented, the corre-
sponding paragraph is reduced to “”
# 0-0
"’Somewhereland’ is a CIB training exercise analysing the political and social de-
velopment of a fictitious country."
# A
"In Somewhereland, a democratic country, three parties struggle for power: the
'Patriots party', the 'Prosperity party' and the 'Social party'. The parties' names
indicate their general political priority, though all parties pursue on a limited
scale also the other political issues."
# B
… After the descriptor comments the comments on the cross-impacts follow. The cross-impact com-ments are organized in rows. E.g. the first comment in this paragraph describes the impact of the first descriptor on itself. Next comes the impact of the first descriptor on the second descriptor, and so on. The diagonal judgement sections are included also in case of regular cross-impact matrices where no diagonal impacts are assumed. They consist of an empty string (“”) in this case. Each paragraph describing a judgement section is initiated by a line
# Short name of the impact source -> Short name of the impact target
The section and the scw file end with two successive lines with the character “#”.
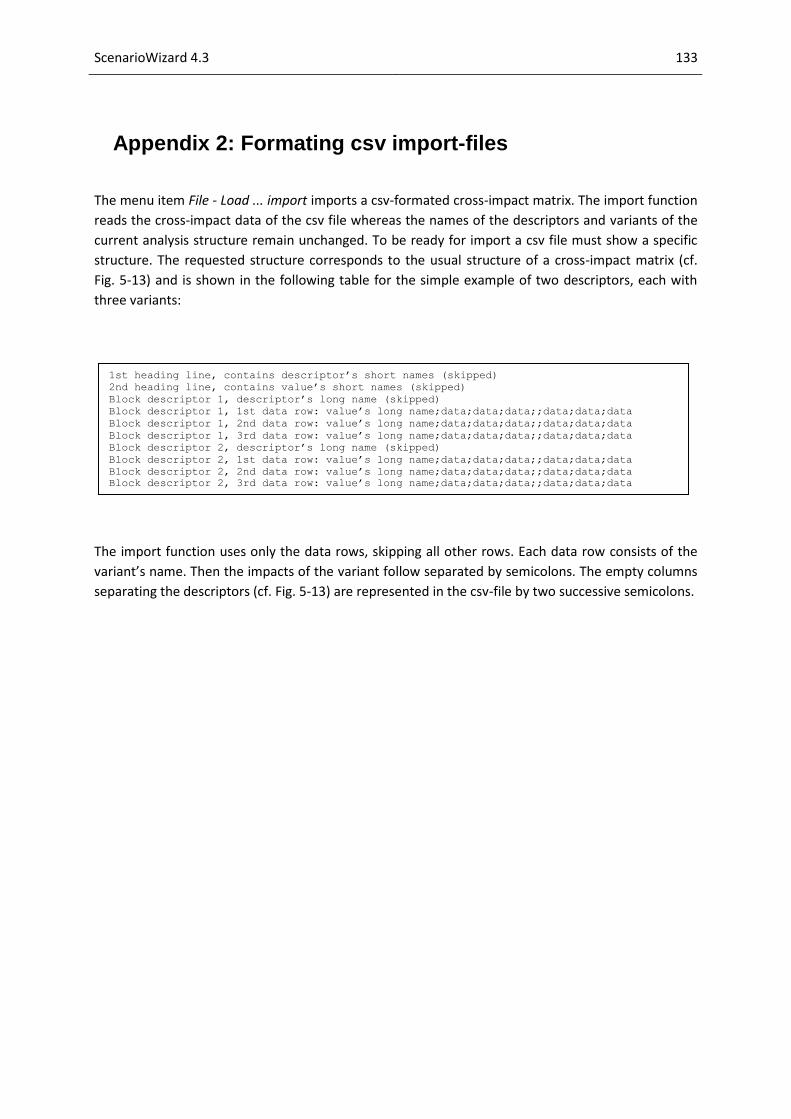
ScenarioWizard 4.3 133
Appendix 2: Formating csv import-files
The menu item File - Load ... import imports a csv-formated cross-impact matrix. The import function
reads the cross-impact data of the csv file whereas the names of the descriptors and variants of the
current analysis structure remain unchanged. To be ready for import a csv file must show a specific
structure. The requested structure corresponds to the usual structure of a cross-impact matrix (cf.
Fig. 5-13) and is shown in the following table for the simple example of two descriptors, each with
three variants:
The import function uses only the data rows, skipping all other rows. Each data row consists of the
variant’s name. Then the impacts of the variant follow separated by semicolons. The empty columns
separating the descriptors (cf. Fig. 5-13) are represented in the csv-file by two successive semicolons.
1st heading line, contains descriptor’s short names (skipped)
2nd heading line, contains value’s short names (skipped)
Block descriptor 1, descriptor’s long name (skipped)
Block descriptor 1, 1st data row: value’s long name;data;data;data;;data;data;data
Block descriptor 1, 2nd data row: value’s long name;data;data;data;;data;data;data
Block descriptor 1, 3rd data row: value’s long name;data;data;data;;data;data;data
Block descriptor 2, descriptor’s long name (skipped)
Block descriptor 2, 1st data row: value’s long name;data;data;data;;data;data;data
Block descriptor 2, 2nd data row: value’s long name;data;data;data;;data;data;data
Block descriptor 2, 3rd data row: value’s long name;data;data;data;;data;data;data
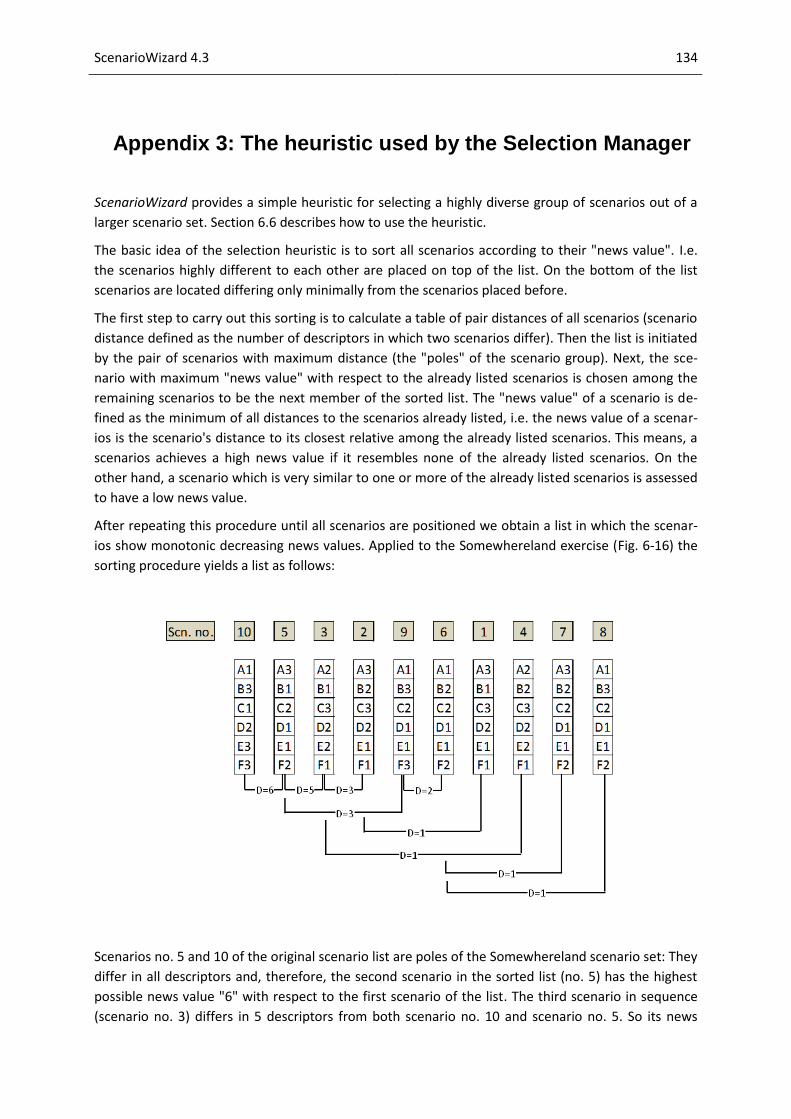
ScenarioWizard 4.3 134
Appendix 3: The heuristic used by the Selection Manager
ScenarioWizard provides a simple heuristic for selecting a highly diverse group of scenarios out of a
larger scenario set. Section 6.6 describes how to use the heuristic.
The basic idea of the selection heuristic is to sort all scenarios according to their "news value". I.e.
the scenarios highly different to each other are placed on top of the list. On the bottom of the list
scenarios are located differing only minimally from the scenarios placed before.
The first step to carry out this sorting is to calculate a table of pair distances of all scenarios (scenario
distance defined as the number of descriptors in which two scenarios differ). Then the list is initiated
by the pair of scenarios with maximum distance (the "poles" of the scenario group). Next, the sce-
nario with maximum "news value" with respect to the already listed scenarios is chosen among the
remaining scenarios to be the next member of the sorted list. The "news value" of a scenario is de-
fined as the minimum of all distances to the scenarios already listed, i.e. the news value of a scenar-
ios is the scenario's distance to its closest relative among the already listed scenarios. This means, a
scenarios achieves a high news value if it resembles none of the already listed scenarios. On the
other hand, a scenario which is very similar to one or more of the already listed scenarios is assessed
to have a low news value.
After repeating this procedure until all scenarios are positioned we obtain a list in which the scenar-
ios show monotonic decreasing news values. Applied to the Somewhereland exercise (Fig. 6-16) the
sorting procedure yields a list as follows:
Scenarios no. 5 and 10 of the original scenario list are poles of the Somewhereland scenario set: They
differ in all descriptors and, therefore, the second scenario in the sorted list (no. 5) has the highest
possible news value "6" with respect to the first scenario of the list. The third scenario in sequence
(scenario no. 3) differs in 5 descriptors from both scenario no. 10 and scenario no. 5. So its news

ScenarioWizard 4.3 135
value with respect to the scenarios no. 5 and 10 is "5" and because no other scenario performs bet-
ter scenario no. 3 is the next member of the sorted list. Starting from scenario no. 1 (7th position of
the list) all further scenarios have only the lowest possible news value "1", i.e. among the scenarios
on their left side there is at least one very similar scenario differing only in one descriptor. E.g. sce-
nario no. 1 (7th position) is very similar to scenario no. 2 (4th position) or scenario no. 4 (8th position) is
very similar to scenario no. 3 (3rd position).
Hints
The "news value" sorting concept can imply ambiguous results if two or more scenarios in
the solution list share the same news value (as in the Somewhereland exercise). The heuristic
then prefers scenarios with high consistency/low inconsistency (provided that inconsisten-
cies are admitted, cf. section 7.1). In case of equal consistency and same news value, scenar-
ios with low list numbers of the original scenario list are preferred.
A comprehensive discussion of scenario selection procedures can be found in the research
literature:
- Carlsen H., Eriksson E.A., Dreborg K.H., Johansson B., Bodin Ö. (2016): Systematic exploration of sce-
nario spaces. Foresight 18, 59-75
- Carlsen H., Lempert R., Wikman-Svahn P., Schweizer V. (2016): Choosing small sets of policy-relevant
scenarios by combining vulnerability and diversity approaches. Environmental Modelling & Software
84, 155-164
- Tietje O. (2005): Identification of a small reliable and efficient set of consistent scenarios. European
Journal of Operational Research 162, 418–432
The heuristic used in the current version of the ScenarioWizard software draws from con-
cepts described in these publications.