manoview clt ug - medtronic · manoview clt 1 user guide chapter 1 introduction welcome to manoview...
TRANSCRIPT

ManoViewTM CLT
Analysis Software
Version 3.0
User Guide
DOC-2615-03May 2016

COPYRIGHT & TRADEMARKS
© 2001-2016 Given Imaging Ltd. All rights reserved. Medtronic, Medtronic logo and Further, Together are trademarks of Medtronic. ™* Third party brands are trademarks of their respective owners. All other brands are trademarks of a Medtronic company.
Given Imaging15 Hampshire Street, Mansfield, MA 02048 [email protected]
Medtronic B.V.Earl Bakkenstraat 10,6422 PJ Heerlen, The Netherlands
Rx Only

ManoView CLT i User Guide
Table of Contents
Chapter 1: Introduction............................................................ 1
Welcome to ManoView ...................................................................................... 1
Product Intent...................................................................................................... 1
Audience ................................................................................................ 1
Indications for Use ................................................................................. 1
Contraindications of Use ........................................................................ 2
Intended Use .......................................................................................... 2
Warnings and Cautions .......................................................................... 2
Chapter 2: Menu Options and Controls ................................. 3
File Menu............................................................................................................ 3
Study Manager .................................................................................................... 4
Advanced Options (Filtered Searches) .................................................. 6
View Menu ......................................................................................................... 6
Setup Menu ......................................................................................................... 7
Report and Analysis Screen ................................................................... 7
Saving and Loading User Preferences ................................................... 9
Tools Menu ......................................................................................................... 9
Smart Mouse ........................................................................................ 10
Save Selected Data ............................................................................... 11
Chapter 3: Analysis Screen................................................... 12
Main Display..................................................................................................... 12
Analysis Screen Controls.................................................................................. 13
Pressure Profile ................................................................................................. 14
Data Display Panel............................................................................................ 15
Chapter 4: Frame Editing and Navigation............................ 16
Guidelines for Using Measurement Frames ..................................................... 16
Inserting, Removing, and Editing Frames ........................................................ 17

ManoView CLT ii User Guide
Inserting and Removing a Frame ......................................................... 17
On/Off Frame ....................................................................................... 17
Moving and Resizing a Frame ............................................................. 18
Navigation Bar and Time Controls ................................................................... 18
The Guide Wizard............................................................................................. 19
Chapter 5: Analysis Workflow............................................... 20
General Workflow Guidelines .......................................................................... 20
Specific Workflows .......................................................................................... 21
Anorectal Manometry .......................................................................... 21
Esophageal Manometry ........................................................................ 23
Sphincter of Oddi Manometry ............................................................. 24
Antroduodenal Manometry .................................................................. 26
Colonic Manometry ............................................................................. 26
Chapter 6: Report Screen...................................................... 27
Report Screen and Controls .............................................................................. 27
Report Screen Organization ................................................................. 27
Customized Drop-down Lists .............................................................. 28
Create Report ....................................................................................... 29
Normal Values .................................................................................................. 30
Chapter 7: Analytical Parameter Notes ................................ 31
Anorectal Manometry ....................................................................................... 31
General Notes ....................................................................................... 31
Analysis Parameter Description ........................................................... 32
Algorithms ........................................................................................... 33
Contraction Identification ........................................................... 33
Relaxation Identification ............................................................ 33
Esophageal Manometry .................................................................................... 34
General Notes ....................................................................................... 34
Analysis Parameter Description ........................................................... 34
Antroduodenal and Colonic Manometry .......................................................... 36
Sphincter of Oddi Manometry ......................................................................... 36
Chapter 8: HIS (Hospital Information System) .................... 37

ManoView CLT 1 User Guide
Chapter 1
Introduction
Welcome to ManoView
The ManoViewTM CLT analysis program is a graphical tool for analyzing the conventional
line trace pressure studies acquired through ManoScan® acquisition software. ManoScan
software is part of the ManoScan system, which includes catheters and devices for
performing manometry measurement.
This user guide describes ManoView CLT Analysis Program and its use.
Product Intent
AudienceThis user guide is intended for the trained medical personnel using ManoView CLT. All
users should have basic familiarity with Microsoft Windows.
Indications for UseThe ManoScan system provides mapping of pressures and, optionally, impedance within
organs of the human gastrointestinal tract. These include the pharynx, upper esophageal
sphincter (UES), esophagus, lower esophageal sphincter (LES), stomach, sphincter of
Oddi, small bowel, colon, duodenum, and anorectal organs. It is used in a medical clinical
setting to acquire pressures and then store the corresponding data for visualization and
analysis. The real-time data as well as the analysis information can be viewed by
medically-trained personnel for diagnostic and analytic purposes. The ManoScan HRM
modules provide high-resolution and/or 3D (three dimensional) display of the pressure
and impedance data. The ManoScan CLT module provides conventional line trace
mapping of the pressure data and can be used as a stand-alone system or as a module of the
ManoScan High-Resolution manometry system.

ManoView CLT 2 User Guide
Contraindications of UseThe use of the ManoScan system for pharyngeal/esophageal motility study and proximal
gut (gastric/duodenal) manometry is contraindicated for the following:
• patients with an inability to tolerate nasal intubation.
• patients with significant bleeding disorders for whom nasal intubation is
contraindicated.
• patients with a known esophageal obstruction preventing passage of the instrument.
The use of the ManoScan system for anorectal manometry is contraindicated for patients
with known anal stricture/obstruction preventing insertion of the instrument.
Intended Use The ManoView CLT software program is a component of the ManoScan system. It is a
tool for analyzing the pressure and video data acquired during ManoScan procedures.
ManoView CLT allows medical personnel to analyze quantitative results and reference
images, and to generate reports.
ManoView CLT supports analysis of manometry studies that use conventional air-charged,
water-perfused, or solid-state catheters. It supports the following manometry procedures:
esophageal, anorectal, Sphincter of Oddi, antroduodenal, and colonic.
Warnings and CautionsManoView CLT is a component of the ManoScan system and is intended to be used by
trained medical personnel only. ManoView CLT assists in the diagnostic process by
providing visualization and quantitative estimates of physiological parameters, but clinical
conclusions should not be made without proper medical training in the applicable fields.

ManoView CLT 3 User Guide
Chapter 2
Menu Options and Controls
When you start ManoView, the Analysis screen appears. It contains these four main menu
selections at the top-left of the screen:
• File: file handling
• View: viewing data table
• Setup: analysis setup
• Tools: analysis tools
Each menu is listed below with its options and their functionality.
File Menu
The File menu supports file opening and saving in various formats.
Option Function
Open Opens the Study Manager from which a study or analysis file can be opened. See Study Manager on page 4.
Save Analysis Saves the current state of the analysis including original pressure, current parameter values, and report information (when applicable). A new analysis file is created as result of this operation.
Save w/o Pat. Info Saves the study without the patient name.
Create Report Opens the Report screen to generate a report.
Save Data Log Saves logged data in text format (selected via the Log Data control above the Current display field near the bottom of the screen). The log file includes all entries from each time Log Data was selected since the last log was saved or ManoView was started.
Exit Closes ManoView after prompting to save or delete unsaved files.

ManoView CLT 4 User Guide
Study Manager
Studies are created and saved in ManoScan (the data acquisition application) and reviewed
in ManoView.
The Study Manager is the most efficient way to browse all existing studies. The Study
Manager scans the Study Repository folder (where the studies are saved, as defined in
Setup > Folder > Study Repository) and displays a table of available studies. The scan is
performed every time the Study Manager is opened, so that the table is current. If a file
stored in a different location is browsed (Open File button), the corresponding folder is
also scanned and all of its studies are added to the Study Manager table; however, such
folders are not scanned regularly.
To open the Study Manager, select File > Open. The controls on the Study Manager screen
are:
Note
While a study can be reviewed in ManoScan (through the Study
Manager), it cannot be modified. This protects the authenticity of the
original data saved during acquisition.
Option Function
Browse Opens the Open File screen to select a file not located in the Study Repository. Once opened, all files at the location are also added to Study Manager table.
Advanced Displays additional controls for searching and filtering studies in the list. Also allows customization of Study Manager fields (see Advanced Options (Filtered Searches) on page 6).
Delete Deletes a study file from Study Manager table. The file is not deleted from the PC.
Refresh Refreshes the Study Manager to remove studies from the table that are no longer available in their original locations.
Open Opens the selected study.
Cancel Closes the Study Manager.

ManoView CLT 5 User Guide
Figure 1. Study Manager main screen

ManoView CLT 6 User Guide
Advanced Options (Filtered Searches)You may specify criteria for up to three fields to filter the Study Manager table. This lets
you see only the files appropriate to your search. For example, specifying Gender:
Female as the filter displays only studies with female patients.
Figure 2. Filtered list
View Menu
The View Menu provides access to the Report screen and the All Data Table.
Option Function
All Data Table Opens the All Data Table screen.
Video Window Displays recorded video input during study. Requires the corresponding video file (.mvd) to be found.
ManoView CLT 7 User Guide
Setup Menu
The Setup menu allows you to customize ManoView’s analysis preferences and settings to
be used during analysis and reports.
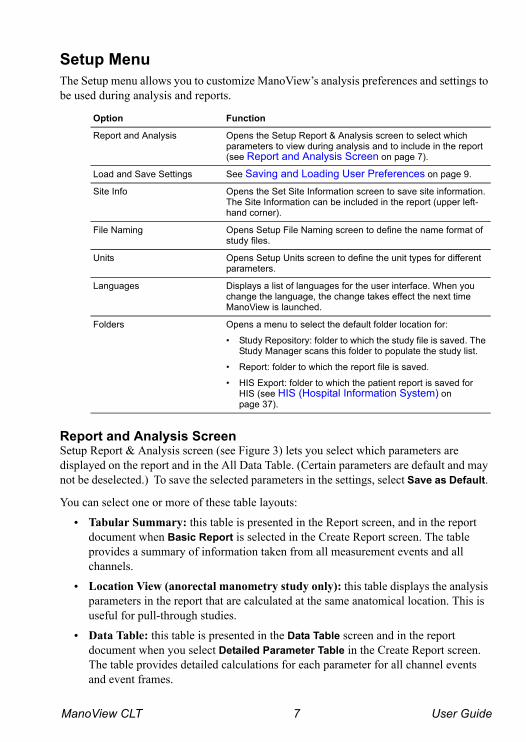
Report and Analysis ScreenSetup Report & Analysis screen (see Figure 3) lets you select which parameters are
displayed on the report and in the All Data Table. (Certain parameters are default and may
not be deselected.) To save the selected parameters in the settings, select Save as Default.
You can select one or more of these table layouts:
• Tabular Summary: this table is presented in the Report screen, and in the report
document when Basic Report is selected in the Create Report screen. The table
provides a summary of information taken from all measurement events and all
channels.
• Location View (anorectal manometry study only): this table displays the analysis
parameters in the report that are calculated at the same anatomical location. This is
useful for pull-through studies.
• Data Table: this table is presented in the Data Table screen and in the report
document when you select Detailed Parameter Table in the Create Report screen.
The table provides detailed calculations for each parameter for all channel events
and event frames.
Option Function
Report and Analysis Opens the Setup Report & Analysis screen to select which parameters to view during analysis and to include in the report (see Report and Analysis Screen on page 7).
Load and Save Settings See Saving and Loading User Preferences on page 9.
Site Info Opens the Set Site Information screen to save site information. The Site Information can be included in the report (upper left-hand corner).
File Naming Opens Setup File Naming screen to define the name format of study files.
Units Opens Setup Units screen to define the unit types for different parameters.
Languages Displays a list of languages for the user interface. When you change the language, the change takes effect the next time ManoView is launched.
Folders Opens a menu to select the default folder location for:
• Study Repository: folder to which the study file is saved. The Study Manager scans this folder to populate the study list.
• Report: folder to which the report file is saved.
• HIS Export: folder to which the patient report is saved for HIS (see HIS (Hospital Information System) on page 37).

ManoView CLT 8 User Guide
Depending on the selection in the Setup Report & Analysis screen, a parameter is shown
in one of the above tables.
Figure 3. Setup Table screen

ManoView CLT 9 User Guide
Saving and Loading User PreferencesYou can save the settings of the current display. These settings can later be reset.
ManoView always displays the data in the current configuration.
To change default setting or to create a custom configuration (for example, settings
appropriate for pharyngeal research):
1. Set the value of each of the controls in ManoView as desired (for example, set the
values of main display pressure range).
2. Select Setup > Save Settings.
3. Select a group of settings (for example, Main and Profile Display Options or Main
and Profile Display Range). You can select any combination of these.
4. Enter a name for the configuration and click Save.
To reload the settings, click Load Settings. ManoView immediately applies the settings
and displays the main display accordingly. If the current configuration is saved as default,
(Default.cft), ManoView starts in this state the next time it is launched. This allows you to
customize the start-up viewing configuration and have other viewing configurations for
specific needs.
Tools Menu
The Tools menu provides access to ManoView CLT’s analytical tools and allows
configuration of on-screen guidelines and markers.
Option Function
Clear Analysis Clears all analysis performed for the analysis file. This includes setting of position of anatomical landmark and analysis controls.
Smart Mouse Opens the Smart Mouse submenu with diagnostic tools available using the cursor (see Smart Mouse on page 10).
Display Mode Options Allows one or more of these display options to be selected:
• Show Catheter in Profile
• Show Measurement Frames On/Off: enables On and Off button left of navigation bar
• Show Peak and Valleys
Save Selected Data Allows saving of the pressure data visible on the main display. The data can be saved as a text file (.txt) or as ManoScan study format (.tls) (see Save Selected Data on page 11).
Insert Frame Inserts a specified measurement frame at that location of the time bar.
Remove Frame Removes any measurement event at that location of the time bar.

ManoView CLT 10 User Guide
Smart MouseThe Smart Mouse tool provides analytical information by left-clicking the mouse. The
analytical data is redisplayed next to the cursor. The parameters are calculated within the
Region of Interest (ROI) defined by Begin Point (BP) and End Point (EP). Turn on the
Smart Mouse by clicking Smart Mouse button on the top panel.
When the Smart Mouse is activated, it supports "drag on line trace" actions. Click-and-
drag across any two points on same channel or different channel to draw the ROI for
which the analysis information is provided. If the two points are on different channels,
only the difference information is calculated and displayed (see Figure 4).
You can draw multiple SmartMouse regions on the screen by pinning existing regions of
interest by clicking the pin icon that appears when the cursor is on the top right corner of
the ROI or holding the Ctrl key down while drawing the ROI (click-and-drag).
Figure 4. ROI in trace mode
Goto Provides options to go to:
• previous frame (Tab)
• next frame (Shift + Tab)
• previous screen (Left)
• next screen (Right)
Option Function

ManoView CLT 11 User Guide
Smart Mouse options are:
Save Selected DataA selected portion may be saved for subsequent review or to be imported into other
applications, such as Microsoft Excel or Matlab. Select the time duration for the desired
data by zooming into the data on the main display. You may then select Tools > Save
Selected and select a data file format:
• Text file: The range of data is saved as a tab-delimited text table where the rows are
the data records for each sample time. The first column contains the sample times,
and the subsequent columns contain the pressure values (mmHg) for each sensor in
the range selected from distal to proximal. The files are saved with a .txt extension.
• Patient examination file: The saved data can be reviewed in ManoView CLT
software. The files are saved with a .tls extension.
Group Parameter Explanation
Difference Info Distance
Velocity
Data Difference
Distance between EP and BP
Distance / duration
Data value difference between EP and BP
Min/Mean/Max Duration
Max
Mean
Min
Time difference between EP and BP
Maximum data value in ROI
Mean data value in ROI
Minimum data value in ROI
Amplitude/Basal Amplitude
Basal
Average of difference of local maxima (peaks) and local minima (valleys) in ROI
Average of local minima (valleys) in ROI
Frequency Frequency Number of local maxima per minute in ROI

ManoView CLT 12 User Guide
Chapter 3
Analysis Screen
The Analysis screen provides several ways to access setup options and tools. Functions
are accessible through the menu system or on-screen control buttons; the more commonly-
used functions can be accessed either way.
Main Display
The main display shows pressure as a colored trace (up to 16 horizontal traces, depending
on the number of sensors in the catheter).
Figure 5. Analysis screen: main display
The vertical space for each trace is adjusted automatically to accommodate all displayed
traces. Each trace has a legend/control area at the left showing the current trace value (at
that location of the time bar), trace position, and the maximum/minimum scale selected for

ManoView CLT 13 User Guide
the trace. To adjust the minimum and full-scale pressure ranges, click in the legend/control
area.
Analysis Screen Controls
The Analysis screen provides these control buttons:
Figure 6. Range screen
Control Button Function
Open Opens the Study Manager.
Capture Takes a picture (screen capture) of the current main display. This picture can be printed or saved in the report.
Report Activates the ManoView CLT Report screen (see Report Screen and Controls on page 27).
Data Table Opens the All Data Table screen showing detailed study data.
Play Scrolls the data horizontally.
SM (Smart Mouse) Toggles Smart Mouse functionality on and off.
On / Off Shows or hides the event frame on the main display for the purpose of analysis. A frame toggled Off is not removed from the study, but it is not analyzed, so that it does not affect report parameters. To delete frames permanently, select Tools > Remove Frame. The On / Off control is available only when enabled from Tools > Display Mode Options.
Video Opens a window that displays recorded video input during the study. This control button is available only for files with video data.
Range Provides the ability to adjust the range and baseline values for the individual traces or all traces. To open, click the channel control at the left in Line Trace mode. If the All Channels checkbox is selected, all traces are adjusted simultaneously. This control is also used to set the range for the Pressure Profile (see Figure 6).

ManoView CLT 14 User Guide
Pressure Profile
The Pressure Profile Display (right pane) displays the spatial distribution of pressure
relative to the time bar. It also includes the spatial markers used in localizing anatomical
landmarks. Figure 7 displays examples of graphical variations of the configurations that
may be displayed using the Anatomy controls for an anorectal study.
Figure 7. Pressure profile panel
The Pressure Profile contains these control buttons:
Control Button Function
Position Reference Toggles the position shown on the display from one reference to another. The references available for each modality are:
• Esophageal: From Nares, From LES, Sensor Channel
• Antroduodenal: From Nares, Sensor Channel
• Anorectal: From Orifice, Sensor Channel
Range Provides a slider control for setting the pressure limits when the display is in Line Trace mode.
Anatomy Toggles the Anatomy view on and off.
Line trace pressure display with anorectal anatomy
Line trace pressure display without anatomy

ManoView CLT 15 User Guide
Data Display Panel
The Data Panel displays the data for the current activities on screen, including:
• the time, position, and pressure of the channels displayed in the main display, at that
location of the time bar.
• the current measurement data if a measurement frame is open, or the Smart Mouse
data if the Smart Mouse is in use.
To save the data from this panel, click the Log Data button. The saved data log includes an
entry for each time the log data was selected since the last time the log file was saved or
ManoView opened.
Figure 8. Analysis window, Data Panel
To show or hide the data panels, click the Hide Data button in the upper right of this area.

ManoView CLT 16 User Guide
Chapter 4
Frame Editing and Navigation
Using the Frame Editing tools, you can move the boundaries of measurement frames, add
new frames, or delete existing frames.
Guidelines for Using Measurement Frames
Measurement frames identify areas in the data record. These are usually special areas
needed to calculate diagnostic parameters. Some types of measurement frames can be
inserted in ManoScan during acquisition and then retrieved in ManoView when the study
file is reviewed. There are also event frames that mark when a specific event occurred
during the study. These event frames can be inserted in ManoView CLT:
Modality Available Analysis Frames Frame Insertion in ManoScan
Frame Insertion in ManoView
Esophageal • LES ID
• LES Relaxation
• Swallow
• UES Resting
• UES Relaxation
yes
yes
yes
yes
yes
yes
yes
yes
yes
yes
Anorectal • Rectal Baseline
• Resting Pressure
• Squeeze
• Balloon Fill
• Push
yes
yes
yes
yes
yes
yes
yes
yes
yes
yes
Sphincter of Oddi • Duodenal Baseline
• CBD Analysis
• PD Analysis
yes
no
no
yes
yes
yes
Antroduodenal • Phase III
• Fed Response
no
no
yes
yes
ManoView CLT 17 User Guide
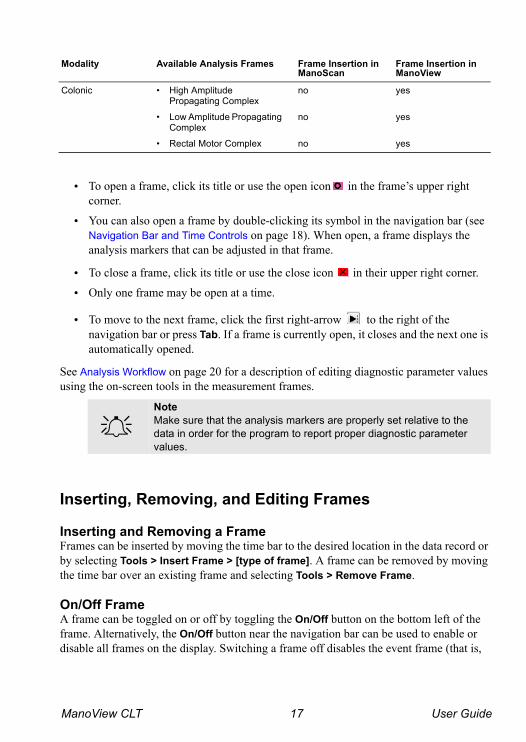
• To open a frame, click its title or use the open icon in the frame’s upper right
corner.
• You can also open a frame by double-clicking its symbol in the navigation bar (see
Navigation Bar and Time Controls on page 18). When open, a frame displays the
analysis markers that can be adjusted in that frame.
• To close a frame, click its title or use the close icon in their upper right corner.
• Only one frame may be open at a time.
• To move to the next frame, click the first right-arrow to the right of the
navigation bar or press Tab. If a frame is currently open, it closes and the next one is
automatically opened.
See Analysis Workflow on page 20 for a description of editing diagnostic parameter values
using the on-screen tools in the measurement frames.
Inserting, Removing, and Editing Frames
Inserting and Removing a FrameFrames can be inserted by moving the time bar to the desired location in the data record or
by selecting Tools > Insert Frame > [type of frame]. A frame can be removed by moving
the time bar over an existing frame and selecting Tools > Remove Frame.
On/Off FrameA frame can be toggled on or off by toggling the On/Off button on the bottom left of the
frame. Alternatively, the On/Off button near the navigation bar can be used to enable or
disable all frames on the display. Switching a frame off disables the event frame (that is,
Colonic • High Amplitude Propagating Complex
• Low Amplitude Propagating Complex
• Rectal Motor Complex
no
no
no
yes
yes
yes
Note
Make sure that the analysis markers are properly set relative to the
data in order for the program to report proper diagnostic parameter
values.
Modality Available Analysis Frames Frame Insertion in ManoScan
Frame Insertion in ManoView

ManoView CLT 18 User Guide
excludes it from all analysis calculations). This can be used as alternative to Tools >
Remove Frame feature, which removes the frame permanently.
Moving and Resizing a FrameThe right and left sides of a measurement frame can be moved by left-clicking and
dragging the measurement to the desired location. This allows resizing or moving frames.
Resizing an event frame repositions the analysis markers within that frame to the
appropriate new positions auto-calculated by the software, even if the positions of the
analysis markers within the frame are already modified and set by the user.
Navigation Bar and Time Controls
The navigation bar lets you quickly move anywhere within the data record. As shown in
Figure 9, the navigation bar includes a slider that shows the width of the current main
display and its location in the record. Color-coded rectangular areas (frame symbols) show
the location of measurement frames. A dot marker in the center of each rectangle is red if
that frame has not been opened, yellow if it is currently open, and green if it has been
opened and closed. Use the arrow controls to navigate backward and forward through the
frames. You can also navigate by clicking (moves center of slider to click point) and
double-clicking (opens associated measurement frame). Use the time control to adjust the
width (duration) of data currently displayed.
Figure 9. Navigation Bar
Note
This feature is only available when enabled from Tools > Display
Mode Options > Show Measurement Frames On/Off.
time control
zoom in/out
go to the beginning
go to end
frame on/off previous frame
slider status or dot marker
next frame
ManoView CLT 19 User Guide
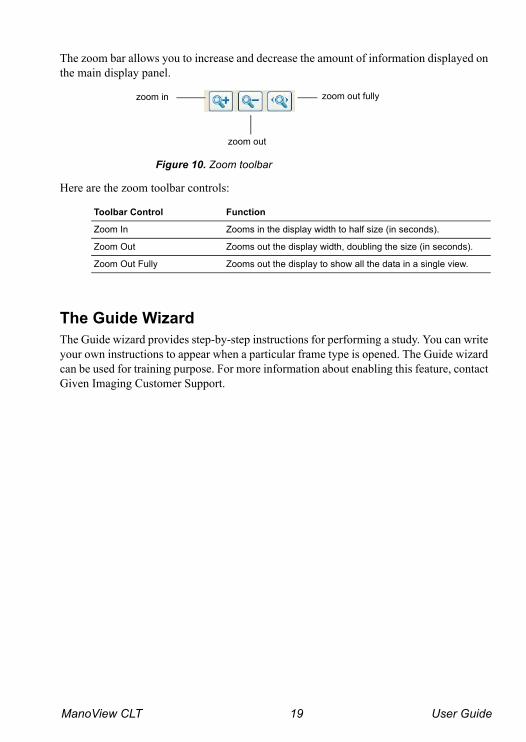
The zoom bar allows you to increase and decrease the amount of information displayed on
the main display panel.
Figure 10. Zoom toolbar
Here are the zoom toolbar controls:
The Guide Wizard
The Guide wizard provides step-by-step instructions for performing a study. You can write
your own instructions to appear when a particular frame type is opened. The Guide wizard
can be used for training purpose. For more information about enabling this feature, contact
Given Imaging Customer Support.
Toolbar Control Function
Zoom In Zooms in the display width to half size (in seconds).
Zoom Out Zooms out the display width, doubling the size (in seconds).
Zoom Out Fully Zooms out the display to show all the data in a single view.
zoom in
zoom out
zoom out fully

ManoView CLT 20 User Guide
Chapter 5
Analysis Workflow
General Workflow Guidelines
These are the steps for analyzing a study. This workflow is similar for all types of studies.
1. Navigate through each measurement frame of the study, starting from the beginning
of the study. Use the Tab key or the navigation bar to navigate between frames.
Insert, remove, or adjust frames as desired (see Frame Editing and Navigation on
page 16).
2. Open the first measurement frame for analysis by clicking open icon in the top
right of the frame. If applicable, adjust the position of anatomical landmarks from
the profile panel.
3. Add or remove analysis channels to be used for calculation. Use the plus and minus
controls associated with each event frame (see Figure 11).
4. Adjust the analysis controls associated with the frame. When a frame is opened,
software auto-sets the analysis controls within the frame. However, you must review
the controls and adjust them if needed. These controls affect the calculation of report
analysis parameters.
5. Repeat the steps 2 to 4 for each measurement frame. When all measurement frames
are analyzed, click the Report button to generate a report.
Figure 11. Adding and removing channels

ManoView CLT 21 User Guide
Specific Workflows
This section discusses specific analysis workflow details related to each type of study. For
a description of analysis parameters and their calculations, see Analytical Parameter Notes
on page 31.
Anorectal Manometry
1. Navigate through each measurement frame. Insert, remove, or adjust frames as
desired.
2. Open a Rectal Baseline frame. If needed, adjust the rectal pressure value for each
channel by moving the triangle control up and down.
Figure 12. Rectal Baseline frame
The rectal pressure value derived from a Rectal Baseline frame is used to calculate
certain parameters (such as Resting Pressure - Rectal Reference), which depend on
rectal pressure value.
3. Open the first Resting Pressure frame.
a. If applicable, set the positions of Proximal, Distal sphincter boundary, and/or
Peak pressure marker in the profile panel. For instance, if pressure traces
indicate that Channel 1 is at proximal sphincter location, move the Prox marker
in the profile panel and place it at Channel 1.
b. If needed, adjust the resting pressure value for each channel by moving the
triangle analysis control up and down.
c. Use the plus and minus controls to include or exclude channels for resting
pressure analysis.
d. Repeat the above steps for other Resting Pressure frames when they appear in
the study.
4. Repeat the above steps for Squeeze event frames as well. There are many analysis
controls applicable to Squeeze (see Figure 13). If a contraction is not identified in a
move to adjust rectal pressure value

ManoView CLT 22 User Guide
channel, the channel is excluded for analysis and no analysis control is shown. Use
the plus and minus controls to include or exclude channels for analysis.
Figure 13. Squeeze Frame values
5. Repeat the above steps for Balloon Fill event frames. The values indicated by
analysis controls are shown here:
Figure 14. Balloon Fill event frame
6. Repeat the above steps for Push event frames.
7. Once all event frames have been analyzed, proceed to report generation.
resting pressure
duration
mean
max
duration
resting pressure
residual

ManoView CLT 23 User Guide
Esophageal Manometry
1. Navigate through each measurement frame. Insert, remove, or adjust frames as
desired.
2. An LES ID frame was inserted (as per the Guide's instruction) after each catheter
pull in ManoScan software as the catheter transversed from gastric region to the
esophagus. Thus, these frames carry the information be used to position the Gastric
pressure baseline, to position the LES and PIP anatomical landmarks, and to
calculate the LES resting pressure.
Open the LES ID frames one by one, and follow these steps in parallel:
a. Adjust the position of LLB, HPZ, PIP, and LUB markers by moving anatomical
markers in the profile panel (see Figure 15). For example, if pressure traces
indicate that Channel 4 is at LUB, move the corresponding marker in the profile
panel and place it at Channel 4.
Figure 15. Adjust markers
b. Adjust the value of minimum pressure (Channelmin) for each gastric channel by
moving the triangle control up and down. The Channelmin value does not
directly impact any calculation. Rather, minimum of Channelmin from all
frames is taken as Gastric Baseline pressure (shown as the red dashed line in
Figure 16), which in turn is used to calculate LES parameters (see Analysis
Parameter Description on page 32 for detail).
Figure 16. Adjust minimum pressure
c. LES Resting pressure is calculated at the HPZ location. If needed, adjust the
analysis controls displayed to alter the resting pressure value.
Note
The software auto-positions the LES Upper Border (LUB), LES Lower
Border (LLB), and High pressure zone (HPZ) markers by auto-
detection algorithms.
LUB
LLB
minimum pressure control
Gastric Baseline for study

ManoView CLT 24 User Guide
3. LES Relaxation frame: if the Extended Guide feature was used in ManoScan
software, LES relaxation frames may be available in the study. If needed, adjust the
position of LES anatomical landmark in the profile panel. The software calculates
the LES relaxation pressure at the channel placed at HPZ.
4. Swallow frame analysis:
a. Open the analysis frame. The LES anatomical position set in LES ID frames are
inherited in these frames, assuming the catheter was not moved. If needed,
adjust the position of the anatomical markers in the profile panel to indicate the
updated sphincter position.
b. The channel located at HPZ is used for LES relaxation analysis.
c. The channels located above LUB are used for Esophageal wave propagation
analysis. Analysis controls can be modified to alter the wave characteristics (for
example, peristaltic or failed) as well as calculate wave propagation parameters.
5. UES Resting and Relaxation frame analysis: Open the frames one by one, and
position the UES marker to indicate where the UES resting and relaxation analysis is
to be performed. If needed, adjust values by moving analysis controls.
6. Once all event frames have been analyzed, proceed to report generation.
Sphincter of Oddi Manometry
1. Zoom the main display to the desired magnification. Use the left and right arrow
keys to navigate through the whole study. Adjust the Duodenal baseline frame or
insert CBD or PD event frames (depending on whether the Sphincter of Oddi
measurement was taken while pulling the catheter through common bile duct or
pancreatic duct).
2. Open the Duodenal baseline frame for analysis. If needed, adjust the duodenal
pressure value for each channel by moving the triangle control up and down. The
pressure value derived from the Duodenal baseline frame is used to calculate the
Basal Sphincter of Oddi pressure parameter, which is reported with respect to
duodenal pressure (see Figure 17).
Note
The LES relaxation analysis parameters are also calculated in Swallow
frames. The combined LES relaxation values from the two frame types
are presented in the Report Summary table.
Note
For a CBD or PD frame, the Duodenal baseline frame located before
the CBD/PD frame defines duodenal pressure to be used for
calculation.

ManoView CLT 25 User Guide
Figure 17. Duodenal baseline frame
3. Open the CBD or PD frame. The 40 mmHg region above the Duodenal baseline
(derived from latest baseline frame) is shaded for visual purposes (see Figure 18).
Figure 18. CBD analysis frame
4. Open the frames one by one for analysis. If needed, adjust the analysis controls to
change value for analysis parameters. Use the plus and minus controls to include
and exclude channels for analysis.
5. Once all event frames have been analyzed, proceed to report generation.
Duodenal baseline
40 mmHg zone from Duodenal baseline derived from previous baseline frame

ManoView CLT 26 User Guide
Antroduodenal Manometry
1. Zoom the main display to desired magnification. Use the left and right arrow keys to
navigate through the whole study. Insert the event frames Phase III MMC or Fed
Response while navigating.
2. Open the first Phase III MMC frame:
a. If applicable, set the position of Pylorus sphincter and/or Jejunum pointer in the
profile panel. For instance, if pressure traces indicate that Channel 3 is at
Pylorus, move the corresponding marker in the profile panel and place it at
Channel 3. Corresponding annotation is placed in the event frame that indicates
that marker position has been set. These locations define which channel is in
which part of the anatomy. The summary output in the report uses this
information to report parameter calculated for the Antrum and Duodenal
regions separately.
b. If needed, adjust the analysis controls to change value for wave amplitude and
duration parameters.
c. Use the plus and minus controls to include and exclude channels for analysis.
3. Repeat the above steps for all event frames. Once all event frames have been
analyzed, proceed to report generation.
Colonic Manometry
1. Zoom the main display to the desired magnification. Use the left and right arrow
keys to navigate through the study. Insert the event frames HAPC, LAPC, or RMC
while navigating.
2. Open the frames one by one for analysis. If needed, adjust the analysis controls to
change the value for wave amplitude and duration parameters. Use the plus and
minus controls to include or exclude channels for analysis.
3. Once all event frames have been analyzed, proceed to report generation.

ManoView CLT 27 User Guide
Chapter 6
Report Screen
The ManoView CLT Analysis Report screen lets you customize and generate reports. You
can control which categories of information are included. Convenient drop-down lists let
you save and re-insert commonly used textual information and ICD codes. The particular
analysis parameters that are available in the report screen may be custom-specified with
the Setup Report & Analysis feature (see Setup Menu on page 7). After you review and
complete the on-screen report screen, ManoView generates a report document that can be
printed or saved in a separate file. The report data becomes part of the analysis file (.tla)
and is stored when the analysis file is saved.
Report Screen and Controls
Report Screen OrganizationThe Report screen consists of six information areas. Each may be included or excluded
from the report. Figure 19 identifies the areas in the Report screen.
• Site Info: provides site or medical facility information. This information is carried
over from the acquisition study file (saved from ManoScan) or may be specified in
the ManoScan CLT software from the Setup menu.
• Exam Info: provides patient, examination, and physician information. This
information comes from the study file (created in the ManoScan acquisition
software); the information may be edited here if needed.
• Analysis Tables: provides analysis parameters depending on the type of manometry
procedures being conducted.
• Procedure Description, Indications, Interpretations, Impressions: allows input
of the indicated information or a selection from a previously saved drop-down list.
• Signatory Physician: allows input of name, title, and affiliation of the signing
physician or a selection from a previously saved drop-down list.

ManoView CLT 28 User Guide
Figure 19. Report Screen organization
Customized Drop-down ListsThe Report screen provides customizable drop-down lists to eliminate the need for re-
typing commonly used information. These lists are available in the Procedure
Description, Indications, Interpretations, Impressions, and Signatory Physician tabs.
Adding, accessing, and removing data is similar for each list. Below is an example of a
Procedure Description window with the drop-down list.
Figure 20. Procedure Description drop-down list
• Adding To Drop-down List: to create a Procedure Description, enter the desired
name (for example, Small Bowel Manometry) in the List Name field. Then type the
description in the Text Field and select Save.
Note
Selecting Save causes all text in the Text field to be saved under the
current list name.
exam information
site information
study data
procedure description
scroll bar

ManoView CLT 29 User Guide
• Using An Existing Drop-down list: to use a previously saved description, select it
from the drop-down list and select Add from list. This adds the corresponding
information to the end of any text already in the Text field. If an additional selection
is made from the list, it is added at the current insertion point (where text would be
added if typed).
• Removing Drop-down List Elements: to delete a saved description, select it from
the list and select Delete.
• ICD Codes: ICD codes can be added or removed in the same way as described
above. To add a code, type in the code and descriptive title (for example, ICD:
564.02 [Constipation, outlet dysfunction]). This is the title that will appear on the
report in the corresponding text field. No other text should exist in the text field at
this time. Type the desired title to be listed by this code (for example, Constipation)
in the List Name field for the ICD code and select Save. To delete an ICD code,
select it from the list and select Delete.
Create ReportAfter entering the appropriate information in the report, select Create to generate the
report document. This activates the screen shown in Figure 21. Select the information to
be included in the report document. The Basic Report is the information selected in the
previous Report screen. The Detailed Parameter Table is the list of parameters derived
from every event frame (for example, Swallow). You can adjust the parameters included in
the report with the Setup Report & Analysis feature (see Setup Menu on page 7).
You can select plot images to be included in the report. These plot images contain both the
measurement frames and the screenshots taken using the Capture function of the main
display.

ManoView CLT 30 User Guide
Figure 21. Create Report
You can select the layout of the report (for example, 1 Column or 2 Column) from the list.
You can also select how the report is generated (for example, as a Word .docx file or a
PDF .pdf file).
Select OK to generate the report. Once generated, you can print the report or save it in any
common document format.
Normal Values
You may specify your own normal values to be used for the analysis parameters. Different
normal values may be specified based on probe type and gender. The normal values are
displayed in the Report Form screen and the printed report document. For more
information about normal values, and assistance in implementing them, contact Given
Imaging Customer Support.

ManoView CLT 31 User Guide
Chapter 7
Analytical Parameter Notes
Anorectal Manometry
General NotesRectal Baseline pressure: the minimum pressure within a Rectal Baseline frame for a
channel is calculated as the Rectal Baseline pressure for the channel. If multiple Rectal
Baseline frames are present, the minimum is used as a channel’s Rectal Baseline pressure
for the whole study.
Frame Resting Pressure: the Frame Resting Pressure for a channel is the 5-second
average before the beginning of the frame. The pressure increase for Squeeze and Push
frames are calculated with respect to Frame Resting Pressure (and not with respect to
resting pressure calculated from the Resting frame).
Note
The actual rectal pressure during Squeeze and Push maneuvers may
be significantly different from the pressure measured in the Rectal
Baseline frame. Therefore, use judgment if using the analysis
parameters for Squeeze or Push frames that are calculated based on
Rectal Baseline pressure (see Analysis Parameter Description on
page 32).

ManoView CLT 32 User Guide
Analysis Parameter Description
Parameter Name Description
Anatomy Location
Length HPZ (cm) Distance between proximal and distal boundaries of anal sphincter
Verge to Center (cm) Distance from distal sphincter boundary to Peak pressure location
Resting
Resting Pressure (atmosph. Ref.)
Mean pressure within the Resting frame
Resting Pressure (baseline Ref.)
Resting Pressure (atmosph. Ref. – Rectal Baseline pressure)
Squeeze
Pressure Amplitude (atmosph. Ref.)
Maximum Pressure within the contraction duration
Pressure Amplitude (baseline Ref.)
Pressure Amplitude (atmosph. Ref. – Rectal Baseline pressure)
Pressure Increase (mmHg)
Pressure Amplitude (atmosph. Ref. – Frame Resting Pressure)
Contraction Power (mmHg)
Mean Pressure within the contraction duration
Contraction Duration (sec)
Duration of contraction calculated using the Contraction Identification Algorithm described in Algorithms on page 33
Push
Pressure Amplitude (Atmosph. Ref.)
Maximum Pressure within the contraction duration
Pressure Amplitude (Baseline Ref.)
Pressure Amplitude (atmosph. Ref. – Rectal Baseline pressure)
Pressure Increase (mmHg)
Pressure Amplitude (atmosph. Ref. – Frame Resting Pressure)
Contraction Power (mmHg)
Mean Pressure within the contraction duration
Contraction Duration (sec)
Duration of contraction calculated using Contraction Identification Algorithm described in Algorithms on page 33
Balloon Fill
Sensation (cc) The value of last balloon volume annotation entered by user before first sensation, first urge, or first discomfort annotation, respectivelyUrge (cc)
Discomfort (cc)
RAIR Presence Presence or absence of rectoanal inhibitory reflex as manually indicated by user for the RAIR flag
Reported in summary results as Present if it is present in any of the Balloon Fill frames

ManoView CLT 33 User Guide
Algorithms
Contraction IdentificationContraction within Squeeze and Push frames is identified as follows:
1. When the pressure value with respect to Frame Resting Pressure exceeds the
threshold, it marks the start of a possible contraction.
2. When the pressure value with respect to Frame Resting Pressure falls below the
threshold, it marks the end of the possible contraction.
3. If the maximum pressure increase value (within this possible contraction period)
exceeds the minimum increase threshold, and the time between the start and end of
the possible contraction exceeds the minimum duration threshold, it is identified as a
contraction.
4. If multiple contractions are found, the one with the maximum time duration is saved
as contraction.
Relaxation IdentificationRAIR Relaxation within Balloon Fill frame is identified as follows
1. When the pressure value falls below the threshold, it marks the start of a possible
relaxation.
2. When the pressure value falls above the threshold or the end of the analysis marker
is met, it marks the end of the possible relaxation.
3. If the minimum pressure value (within this possible relaxation period) is lower than
the minimum decrease threshold, and the time between the start and end of the
possible relaxation exceeds the minimum duration threshold, it is identified as a
relaxation.
Percent Relaxation (1 - (Residual Pressure / Frame Resting Pressure)) * 100
Resting Pressure (mmHg)
See Resting Pressure, above
Residual Pressure (mmHg)
Minimum pressure within the Relaxation duration
Relaxation Duration (sec)
Duration of relaxation calculated using Relaxation Identification Algorithm described in Algorithms on page 33
Balloon Volume (cc) Taken from the Balloon Volume annotation previous to the frame
Parameter Name Description

ManoView CLT 34 User Guide
Esophageal Manometry
General NotesGastric baseline pressure: if Channelmin represents the minimum pressure for a channel
within an LES ID frame, the Gastric baseline at a channel is calculated as the minimum of
Channelmin calculated from all LES ID frames. Thus, no matter how many LES ID frames
there are in the study, there is only one Gastric baseline pressure associated with each
channel.
The Gastric baseline is displayed in software as a dashed red line running through the LES
ID frames. The Gastric baseline value impacts the LES resting and relaxation calculations
in LES ID, LES relaxation, and Swallow analysis frames.
Analysis Parameter Description
Parameter Name Description
Anatomy Location
LES Lower Border LLB Marker location calculated from LES ID frame
LES Upper Border LUB Marker location calculated from LES ID frame
LES Total Length = LES Lower Border – LES Upper Border
Abdominal Length = LES Lower Border – PIP location (if negative, then zero)
Hernia Sac Length = PIP location – LES Lower Border (if negative, then zero)
UES Mid-point Location UES Marker location calculated from UES Resting and UES Relaxation frame
Esophageal Location = LES Upper Border – UES marker location
LES ID Frame
LES Resting Pressure (Respiratory Mean)
Mean for the channel within the frame, expressed with regards to Gastric baseline pressure
LES Resting Pressure - End Expiratory
Mean of local minima (valleys) for the channel within the frame, expressed with regards to Gastric baseline pressure
LES Relaxation Frame
LES Resting Pressure 5 sec mean taken at the LES channel before the beginning of the frame, expressed with regards to Gastric baseline pressure
LES Residual Pressure Minimum pressure taken at LES channel, expressed with regards to Gastric baseline pressure
LES Percent Relaxation (1 – (Residual Pressure / Resting Pressure)) * 100

ManoView CLT 35 User Guide
Parameter Name Description
Swallow Frame
Swallow Classification If Contraction identified in all channels:
• If Vel < 0.5: Failed (where Vel = positive value of peristaltic velocity between first and last esophageal channel)
• If Vel > 20: Simultaneous
• If Vel < 0: Retrograde
• Otherwise:
• Amplitude in at least one channel < 20 mmHg: Hypotensive
• Amplitude in at least one channel > 180 mmHg: Hypertensive
• Otherwise: Normal
If Contractions missing in at least 1 channel between proximal and distal, then Ineffective Esophageal Motility (IEM)
LES Resting Pressure
See description for LES Relaxation Frame, above.LES Residual Pressure
LES Percent Relaxation
Wave Amplitude Peak pressure for the channel – esophageal baseline pressure, where esophageal baseline pressure for the channel is calculated as 5 sec mean before the beginning of the frame
Wave Duration Duration of wave propagation
Onset Velocity Velocity calculated using time of onset of peristaltic wave on two neighboring channels
Time Propagation Time taken for wave to move from one channel to the next
UES Resting Analysis
UES Resting Pressure Mean pressure within the frame
UES Relaxation Analysis
UES Resting Pressure 5 sec mean taken at the UES channel before the beginning of the frame
UES Residual Pressure Minimum pressure taken at UES channel
UES Percentage Relaxation
(1 – (Residual Pressure / Resting Pressure)) * 100
ManoView CLT 36 User Guide
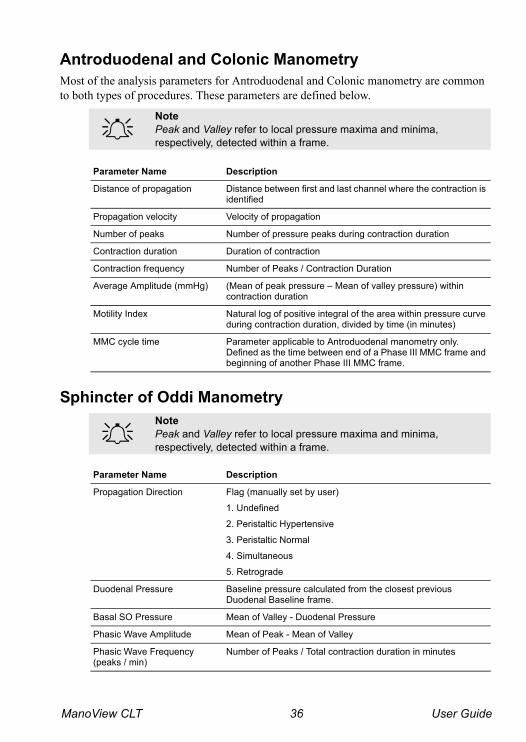
Antroduodenal and Colonic Manometry
Most of the analysis parameters for Antroduodenal and Colonic manometry are common
to both types of procedures. These parameters are defined below.
Sphincter of Oddi Manometry
Note
Peak and Valley refer to local pressure maxima and minima,
respectively, detected within a frame.
Parameter Name Description
Distance of propagation Distance between first and last channel where the contraction is identified
Propagation velocity Velocity of propagation
Number of peaks Number of pressure peaks during contraction duration
Contraction duration Duration of contraction
Contraction frequency Number of Peaks / Contraction Duration
Average Amplitude (mmHg) (Mean of peak pressure – Mean of valley pressure) within contraction duration
Motility Index Natural log of positive integral of the area within pressure curve during contraction duration, divided by time (in minutes)
MMC cycle time Parameter applicable to Antroduodenal manometry only. Defined as the time between end of a Phase III MMC frame and beginning of another Phase III MMC frame.
Note
Peak and Valley refer to local pressure maxima and minima,
respectively, detected within a frame.
Parameter Name Description
Propagation Direction Flag (manually set by user)
1. Undefined
2. Peristaltic Hypertensive
3. Peristaltic Normal
4. Simultaneous
5. Retrograde
Duodenal Pressure Baseline pressure calculated from the closest previous Duodenal Baseline frame.
Basal SO Pressure Mean of Valley - Duodenal Pressure
Phasic Wave Amplitude Mean of Peak - Mean of Valley
Phasic Wave Frequency (peaks / min)
Number of Peaks / Total contraction duration in minutes

ManoView CLT 37 User Guide
Chapter 8
HIS (Hospital Information
System)
This information is intended to be used by the IT professional responsible for maintaining
the HIS. ManoScan supports interfacing with an HIS. This allows the import of patient
information into ManoScan and the export of the study report from ManoView.
Figure 22. Data workflow between the ManoScan system and the HIS
ManoScan software accepts the patient information from an import file (.imp). ManoScan
looks in the folder specified in Folders > HIS Import every time it starts, and adds the
patients scheduled for procedure to the Patient Manager (accessible from the Patient
Information screen). Patient information is exported by ManoView to the HIS as an export
file (.exp), and the study report is exported as a PDF file (.pdf).
HIS
ManoScan
software
ManoView
software
patient information via .imp (import) file
ManoScan file (data + patient info)
patient info via .exp (export) file and .pdf (report) file

ManoView CLT 38 User Guide
Here is the file structure for both the import and export file:
<study>
<patient>
<dob>1954-11-23</dob> //yyyy-mm-dd
<name>
<first>Ralph</first>
<last>Jefferson</last>
<middle>H</middle>
</name>
<gender>1</gender> //1 = Male, 0 = female
<height>1701</height> //in mm
<id>C98349A2</id>
<weight>70306</weight> // in gms
</patient>
<procedure>
<indications>Swallowing Problems</indications>
<procedure>Esophageal Manometry</procedure>
</procedure>
</study>