mannino et al gca 1999.pdf
TRANSCRIPT

PII S0016-7037(99)00128-3
Lipid composition in particulate and dissolved organic matter in the Delaware Estuary:Sources and diagenetic patterns
ANTONIO MANNINO and H. RODGER HARVEY*Chesapeake Biological Laboratory, University of Maryland Center for Environmental Science, P.O. Box 38, Solomons, MD 20688, USA
(Received May3, 1998;accepted in revised form March16, 1999)
Abstract—Dissolved organic matter (DOM) was isolated from surface waters of Delaware Bay along atransect from freshwater to the coastal ocean and fractionated by tangential flow ultrafiltration into high (1–30kDa; HDOM) and very high (30 kDa–0.2mm; VHDOM) nominal molecular mass fractions. Carbon content,stable carbon isotopes, and lipid composition were measured for each DOM fraction, and particles collectedin parallel. Lipids, excluding hydrocarbons, comprised up to 0.33% of HDOM organic carbon, 1.6% ofVHDOM carbon, and 10% of POC, the majority of which were fatty acids. Although lipids comprised a smallfraction of HDOM, fatty acids and sterols provided valuable information on the origins of DOM. Molecularcomposition of particulate and dissolved lipids and bulk stable carbon isotopes demonstrated differences inorganic sources along the estuarine gradient with distinct terrestrial signals in the river and turbid middleestuary and an algal signal in the lower estuary and coastal ocean. Both particulate organic matter andVHDOM samples were enriched in lipids on a carbon basis compared to the HDOM fraction, which suggeststhat the HDOM fraction was less labile than particulate organic matter or VHDOM. Selective degradation oflabile lipids by the microbial community can account for the depletions of unsaturated fatty acids, sterols, andphytol within HDOM relative to particles.Copyright © 1999 Elsevier Science Ltd
1. INTRODUCTION
Estuaries occupy a unique position between land and ocean formaterial exchange and biogeochemical processing of organicmatter. Defining the sources and composition of dissolved(DOM) and particulate organic matter (POM) within estuariesis essential to understanding the carbon cycle, and in particularthe importance of terrestrial or estuarine derived carbon assources of energy and nutrients to coastal systems. The originof organic matter in estuaries is complex, and sources include:(1) in situ primary production, (2) terrestrial material trans-ported by river and groundwater flow, land runoff, and atmo-spheric deposition, (3) anthropogenic sources—such as waste-water treatment plants, industrial plants, etc., and (4) materialfrom the coastal ocean transported via tidal exchange.
Terrestrial sources comprise portions of organic carbon inrivers (e.g., Hedges et al., 1994; Jaffe et al., 1995), in conti-nental shelf and slope sediments (e.g., Hedges and Parker,1976; Westerhausen et al., 1993), and even in pelagic waters(e.g., Meyers–Schulte and Hedges, 1986; Moran et al., 1991;Bianchi et al., 1997; Opsahl and Benner, 1997), demonstratingthat some fraction of these materials that enters the estuary istransported to the marine system. Because of elevated nutrientinputs, estuaries are highly productive environments with pri-mary production generating substantial levels of in situ POMand DOM. These multiple sources and their exchange arelinked, yet the examination of POM-DOM dynamics andsources of DOM within estuaries is limited. Much of theprevious estuarine work on DOM has dealt with stable carbonisotopes (Peterson et al., 1994; Guo and Santschi, 1997), car-bohydrate composition (Hedges et al., 1994; Sigleo, 1996), and
amino acid composition (e.g., Hedges et al., 1994; Coffin,1989), which provide limited information in regard to specificsources.
Lipids have been used extensively as biomarkers for terrig-enous and planktonic POM in various aquatic and sedimentaryenvironments (e.g., Wakeham and Beier, 1991; Meyers andIshiwatari, 1993). Individual lipid compounds can be used asmolecular tracers to track terrestrial and planktonic POM andDOM through the estuary and continental shelf (e.g., Volkman,1986; Prahl and Pinto, 1987; Harvey, 1994; Jaffe et al., 1995).For example, polyunsaturated fatty acids are commonly attrib-uted to plankton (e.g., Canuel and Martens, 1996; Colombo etal., 1996), branched C15 and C17 fatty acids to bacteria(Kaneda, 1991), specific sterols to dinoflagellates (Boon et al.,1979), 16:0 n-alcohol to wax esters of zooplankton (Harvey etal., 1987; Sargent and Falk-Petersen, 1988), and long-chain(C24 to C32) saturated fatty acids, n-alkanes, and alcohols toterrestrial plants (see Meyers, 1997 for review). Thus far, thestudies that examined the composition of dissolved lipids fo-cused on the total dissolved pool with varied delineation of thedissolved particulate size cutoff (e.g., Kattner et al., 1983;Berdie et al., 1995; Jaffe et al., 1995). Appropriate delineationof size between particles and dissolved materials is critical forexclusion of microbial communities from the dissolved pool.
The goal of this study is to characterize the lipid compositionof high-molecular-mass DOM and POM along the salinitygradient of the Delaware Estuary and to ascertain their potentialsources. The Delaware system is ideal in this regard becausethe Delaware River is the principal source of freshwater. Algalblooms are located primarily in the lower bay region and areisolated from the turbidity zone because of light limitationsimposed by the high particle load in the upper bay region(Harding et al., 1986; Pennock and Sharp, 1986). Samplingalong the salinity gradient thus provides a means of distinguish-
* Author to whom correspondence should be addressed ([email protected]).
Pergamon
Geochimica et Cosmochimica Acta, Vol. 63, No. 15, pp. 2219–2235, 1999Copyright © 1999 Elsevier Science LtdPrinted in the USA. All rights reserved
0016-7037/99 $20.001 .00
2219
ing how river flow, turbidity, and primary production influencethe lipid composition of DOM and POM fractions.
2. STUDY SITE AND SAMPLE COLLECTION
The Delaware estuary is a highly urbanized system extend-ing 215 km from the bay mouth to Trenton, NJ, the upstreamlimit of tidal influence. Most of the freshwater entering theestuary originates from the Delaware River (;60%) andSchuylkill River (;15%) with other individual sources con-tributing ,1% to the total input (Wong and Munchow, 1993).Tidal resuspension of bottom sediments and flocculation formsa narrow turbidity maximum at;100 km upstream from thebay mouth (Biggs et al., 1983). The estuary is generally wellmixed by tidal flow except during high river flow in springwhen a classic two-layer circulation forms (Sharp et al., 1986).At the seaward end of the estuary, Atlantic Ocean water entersthe estuary from the center of the bay mouth, and the estuarineplumes exit along the New Jersey shore and the Delaware coast(Wong and Munchow, 1993). Samples were collected at sevenstations between June 6 and 9, 1996 along the salinity gradientof the Delaware Estuary corresponding to riverine, the turbiditymaximum and downstream, chlorophylla maximum anddownstream, and two stations within the estuarine plume on theinner continental shelf (Fig. 1).
3. EXPERIMENTAL
3.1. Filtration and Bulk Measurements
Large volume water samples (44–104 l) were collected with aperistaltic pump at 1 m depth and filtered sequentially through Gelmancartridge filters of 3-mm and 0.2-mm pore size. Prior to sample collec-tion, the filtration apparatus was rinsed with a minimum of 10 l ofsample water. DOM filtrates were separated into three nominal sizefractions: 30 kDa–0.2mm very high-molecular-mass (VHDOM), 1–30kDa HDOM, and,1 kDa low-molecular-mass DOM (LDOM) bysequential filtration using an Amicon DC-10L tangential flow ultrafil-tration unit with the S10Y30 and S10N1 filters following the methodsof Benner (1991). Because of the high particle load at the turbiditymaximum (92 mg/L), a 13-L sample was collected and only the.1-kDa fraction retained. After initial fractionation, each of the high-molecular-mass fractions were desalted by using the Amicon unit,Amicon, Inc., New Bedford, MA, with 6–9 L of low organic deionizedwater (,22 mM dissolved organic carbon [DOC]; Milli-Q water fil-tered through Nanopure Easy-Pure unit, Nanopure, Dubuque, IA).Ultrafiltration cartridges were cleaned with 0.1 N NaOH (S10Y30cartridge) or 1% Na3PO4 (S10N1 cartridge) and rinsed three times with5–7 l of low organic deionized water after each concentration-diafil-tration procedure per manufacturer specifications. Concentration fac-tors (initial volume/concentrate volume) ranged from 83 to 194 forVHDOM and 46 to 64 forHDOM (concentration factor5 15 for theturbidity maximum). Samples for DOC analysis were collected from the,0.2-mm filtrate (TDOC) and each DOM size fraction and analyzed intriplicate (SD# 5%) by high temperature combustion by using a Shi-madzu TOC 5000, Shimadzu Scientific Instruments, Inc., Columbia, MD,(Benner and Strom, 1993). Remaining sample retentates were storedfrozen and concentrated further by rotary evaporation and subsequentlylyophilized to dry powders. LDOM-C was analyzed for mass balancepurposes, and no further characterization was made on the LDOMfraction.
Additional whole water was filtered through pre-combusted (4–6 hat 450°C) GF/F size filters by vacuum filtration to collect particles forcomparison with dissolved fractions. Organic carbon and total nitrogencontent were measured by using an Exeter Analytical CHN analyzer forPOM samples and for lyophilized DOM. Stable carbon isotopes werequantified on POM and DOM fractions as CO2 on a Micromass Optimainstrument, Micromass Instruments, Manchester, UK, interfaced with a
Carlo Erba elemental analyzer, CE Instruments, Milan, Italy, (Fry et al.,1992; Macko et al., 1997). Precision of the method is typically60.1%. Inthe laboratory, samples commonly are measured against a tank of carbondioxide that has been calibrated against NBS 22 that is referenced to thePeedee Belemnite standard. Total suspended particles were collected induplicate on preweighed 0.4-mm polycarbonate filters by vacuum filtrationand quantified gravimetrically after drying at 50°C to constant weight.
Plasticware and glassware were washed in Alconox and RBS-35detergents followed by acid wash (15% HCl) and thorough rinsing withNanopure water. Glassware also was combusted at 450°C for 4–6 h.All glassware and Teflon-lined caps used in lipid analyses were rinsedwith organic solvents prior to use.
3.2. Lipid Extraction and Analysis
Lipids from the HDOM and VHDOM subsamples were extracted bysonication (30 min) in a mixture of dichloromethane:methanol (1:1)followed by overnight extraction at 4°C similar to that previouslydescribed (Harvey et al., 1987). Extraction was repeated twice, and thesolvents combined. Bound lipids that might remain associated with theinsoluble high-molecular-mass material after initial solvent extractionwere isolated by re-extraction of the residue after alkaline hydrolysis.Internal standards for polar and neutral fractions (nonadecanoic acidand 5a-cholestane) were added to lipid extracts and residues. Remain-ing solvent was dried under gentle stream of N2, and 1 mL of deionizedwater and 3 mL KOH/methanol (0.25 N KOH final concentration) wereadded to all samples (nonsolvent extractable residues were sonicatedfor 15 min). Samples were flushed with N2, capped, and placed in aheating block at 70°C for 30 min. After cooling, deionized water wasadded, and neutral lipids were partitioned into hexane:diethyl ether(9:1) three times. The neutral lipid extract was dried under N2 andderivatized to the respective trimethylsilyl ethers with 30mL of bis(tri-methylsilyl)trifluoroacetamide with 25% pyridine at 50°C. Polar lipidscontaining fatty acids were partitioned similarly following acidificationto pH 2, dried under N2, and subsequently converted to their methylesters by using BF3 in methanol. Procedural blanks were processedsimultaneously with samples. Small amounts of contaminants found inthe procedural blanks (e.g., 16:0 and 18:0 fatty acids and normalalkanes, respectively) were subtracted from the respective samples.Results presented here include combined totals for solvent extractableand bound lipids released during alkaline hydrolysis.
Particulate lipids were extracted from filters with 15 mL of dichlo-romethane:methanol three times and processed similarly to DOM frac-tions except internal standards were added with initial solvent. Boundlipids were not examined separately.
Neutral and polar lipids were quantified by capillary gas chromatog-raphy (DB-5MS, 30-m column, 0.32-mm internal diameter, 0.25-mmfilm thickness) with flame ionization detection and hydrogen as carriergas and temperature ramp of 10°C/minfrom 50°C to 120°C and4°C/min thereafter to 300°C. Structural identification was made utiliz-ing gas chromatography-mass spectrometry (GC-MS; HP-5890-II GCcoupled to a HP-5970B or HP-5989A) operating at 70 eV with massrange acquisition of 50–600 a.m.u. using a 25 m column (DB-5MS)with 0.2-mm internal diameter and helium as the carrier gas and thetemperature program described previously. Identifications of selectcompounds were confirmed by GC-MS using positive chemical ion-ization with CH4 (1.7 torr) as the ionizing gas (HP-5890-II GC coupledto a 5989A MS). Double bond positions of monounsaturated fatty acidswere determined by GC-MS analysis of dimethyl disulfide adductsfollowing the protocol described by Nichols et al. (1986).
4. RESULTS
4.1. Distributions of POC, DOC, andd13C
Minerals comprised a significant portion of total suspendedparticles in the upper and middle regions of the estuary butdeclined in the lower estuary and coastal ocean (Table 1).Ratios of POC to total suspended particles indicate that parti-cles in the upper river contain 11% organic carbon by weight,4% at both turbid sites, 23% at the chlorophyll maximum, and43–48% in the lower estuary and coastal ocean sites (Table 1).
2220 A. Mannino and H. R. Harvey

Maximal POC and total DOC (TDOC;,0.2 mM DOC) wereobserved within the turbid middle estuary, 318mM POC at theturbidity max, and 330mM TDOC downstream of the turbiditymax (Table 1). POC and TDOC concentrations were relativelyhigh (.200 mM DOC) in the lower estuary (,60 km), wheresubstantial algal biomass was present and were lowest at thecoastal ocean stations.
The LDOM fraction comprised the bulk of TDOC at all sitesexcept at the turbidity max (Table 1; Fig. 2). Lower amounts of
HDOM-C were present in the coastal ocean than in the lowersalinity region of the estuary, ranging from 25% of TDOC atcoastal ocean (station 7) to 41% and 61% at the riverine andturbidity max sites, respectively. Amon and Benner (1996)have shown a similar decline in high-molecular-mass DOCfrom rivers to the ocean. This trend did not hold for VHDOM,which showed lowest concentrations downstream of the turbid-ity max in the middle estuary. Summation of the three DOCsize fractions accounted for 85–110% of TDOC (Table 1),
Fig. 1. Station locations along the Delaware Estuary, USA. Inset map shows the location of the Delaware Estuary inrelation to the eastern coast of USA.
2221Lipid composition in Delaware Estuary organic matter

which is comparable to previous studies’ results using similarinstrumentation and procedures (81–128% TDOC; Guo andSantschi, 1996; Benner et al., 1997).
Thed13C of POM and high-molecular-mass DOM followedsimilar patterns along the estuary. Heavierd13C values wereobserved for all fractions at the chlorophyll maximum, down-stream of the chlorophyll maximum, and at coastal ocean
station 7 (Fig. 3). The highestd13C values were found in POMdownstream of the chlorophyll maximum (218.9‰) and mostnegative at the riverine station (226.8‰). The VHDOM frac-tion contained the heaviestd13C values, ranging from223.2‰at station 6 to219.6‰ downstream of the chlorophyll maxi-mum. The variation ind13C along the estuary was smallest forthe HDOM fraction (ranged from225.5‰ at the turbidity max
Table 1. Station locations and physical parameters and chemical characteristics for DOC and POC collected through the Delaware Estuary.
StationSite
descriptorDistance
(km)Salinity(psu)
TSP(mg/L)
POC(mM)
POC/TSP(mg C/mg
dry wt)Chl a(mg/L)
TDOC(mM)
,1 kDa(% TDOC)
1–30 kDa(% TDOC)
.30 kDa(% TDOC)
SUM(% TDOC)
1 Riverine 197.1 0.10 10.7 95.8 0.108 4.1 218 51.3 41.1 2.1 94.52 Turbidity max 100.2 0.66 92.0 318 0.042 10.8 218 37.3 61.4a 98.73 Turbid 66.4 9.36 42.3 147 0.042 9.7 330 79.3 29.6 0.6 109.54 Chl a max 45 13.41 8.5 162 0.229 21.6 224 78.8 29.0 1.1 108.95 High Chl a 28.4 22.67 4.3 152 0.428 21.0 205 54.5 29.3 1.7 85.46 Coastal ocean 216.3 29.42 1.5 53.4 0.427 1.7 136 74.2 31.2 0.9 106.37 Coastal ocean 251.5 29.48 1.4 54.4 0.475 2.1 170 70.6 25.2 1.9 97.7
Station numbers are illustrated in Fig. 1. Distance upstream from bay mouth; TSP; total suspended particles; POC; particulate organic carbon; Chla; chlorophylla (Kirchman, unpublished data); TDOC, total dissolved organic carbon (,0.2mm); SUM-sums of %, TDOC for three DOM fractions.
a .1-kDa fraction only, turbidity precluded particle filtration of large volume of water required for isolation of.30 kDa fraction.
Fig. 2. Molecular mass distributions of DOC throughout the Delaware Estuary. Turbidity Max5 turbidity maximum,Chlorophyll Max5 chlorophyll a maximum, LDOM5 ,1 kDa, HDOM5 1–30 kDa, VHDOM5 30 kDa-0.2mm, * .1kDa fraction.
2222 A. Mannino and H. R. Harvey

to 222.2‰ at station 7). The greatest enrichment in the13Cisotope occurred between station 3 (downstream of the turbid-ity max) and the chlorophyll maximum for POM and VHDOMwith a shift in d13C of 13.8‰ and12.9‰, respectively. Forthe HDOM fraction, the most pronounced enrichment occurredbetween coastal ocean stations 6 and 7,12.7‰. The greatestdepletion of d13C was found in all three fractions betweenstation 5 (downstream of the chlorophyll maximum) andcoastal ocean station 6,25.6‰ in POM,23.6‰ in VHDOM,and22.2‰ in HDOM.
4.2. Fatty Acids
Distributions of individual fatty acids from both dissolvedhigh-molecular-mass fractions are summarized in Table 2.Based on organic carbon, the.30 kDa fraction containedhigher yields of dissolved fatty acids ranging from 2.99mgfatty acid/mg OC in the lower estuary (station 5) to 12.6mg/mgOC in the coastal ocean (station 6). For HDOM, fatty acidyields were highest at the chlorophyll maximum (station 4; 2.72mg/mg OC) and lowest downstream of the chlorophyll maxi-mum (station 5; 0.64mg/mg OC) as observed in VHDOM.
At all sites saturated fatty acids comprised the bulk ofdissolved fatty acids, particularly the C14, C16, and C18. Othersaturated fatty acids were detected, but few monounsaturatedand polyunsaturated fatty acids (PUFA) were observed. The
16:0 and 18:0 were the dominant acids throughout the estuary,comprising 59% to 90% of total fatty acids. The 16:0 acid aloneaccounted for 39–55% of total fatty acids in VHDOM through-out the estuary. The contributions of 18:0 in both DOM frac-tions were similar except at station 3, where it comprised 62%of total fatty acids in HDOM but only 29% in VHDOM. Thecontribution of 14:0 was greatest at the chlorophyll maximumfor both DOM fractions. Branched (iso and anteiso) C15 andC17 fatty acids, attributed to bacteria (Kaneda, 1991), rangedfrom below detection in the coastal ocean (station 6) to 9% oftotal HDOM fatty acids downstream of the chlorophyll maxi-mum. Branched bacterial acids in VHDOM comprised up to10% of total fatty acids in the upper river (station 1) but werebelow detection level downstream of the chlorophyll maximum(station 5).
Monounsaturated acids were a small component of fattyacids in both DOM fractions, ranging from below detectionlevels to a maximum of 14.6% of HDOM fatty acids down-stream of the chlorophyll maximum (station 5). Polyunsatu-rated acids were only seen in DOM at the chlorophyll maxi-mum or downstream (Table 2).
Particles contained higher yields and a greater diversity offatty acids, especially monounsaturated and polyunsaturatedacids, than the high-molecular-mass DOM fractions (Table 3).Particulate fatty acid yields were much higher in the lower
Fig. 3. Stable carbon isotope distributions of POM and high-molecular-mass DOM in the Delaware Estuary.
2223Lipid composition in Delaware Estuary organic matter
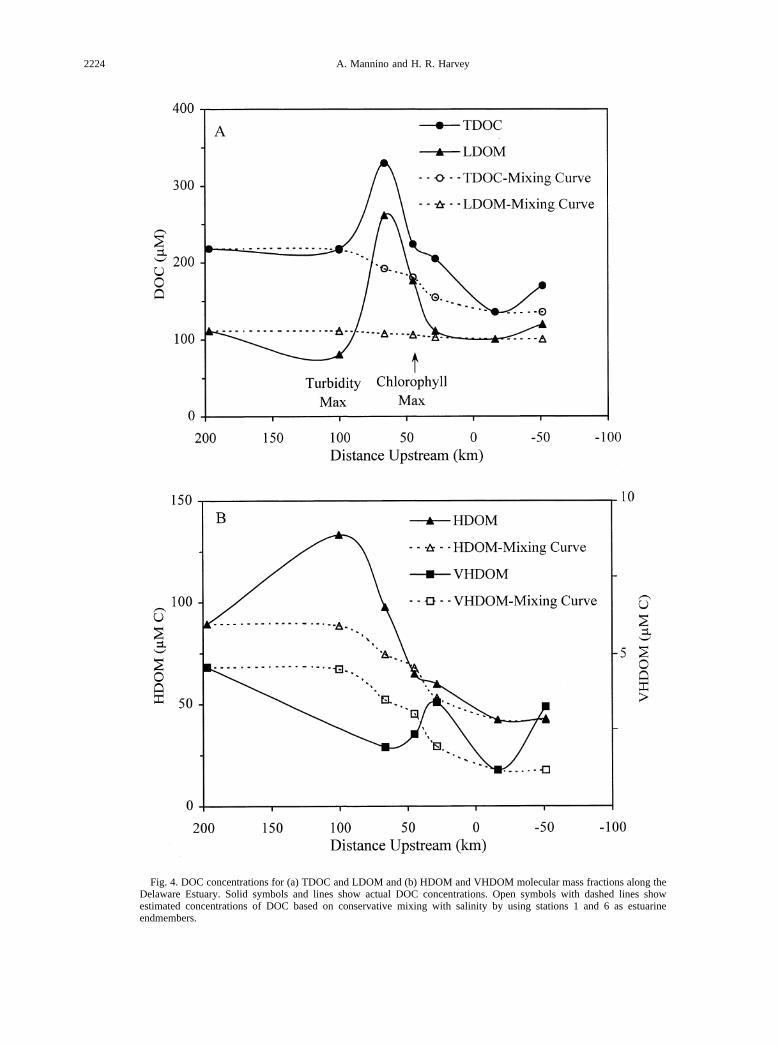
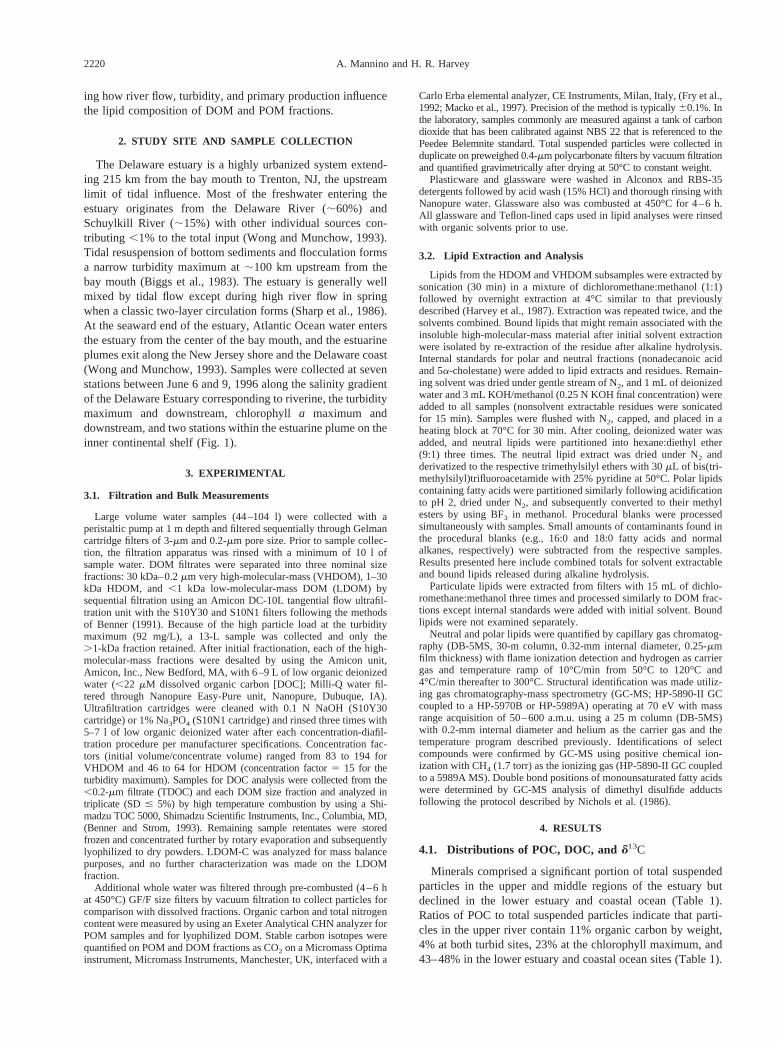
Fig. 4. DOC concentrations for (a) TDOC and LDOM and (b) HDOM and VHDOM molecular mass fractions along theDelaware Estuary. Solid symbols and lines show actual DOC concentrations. Open symbols with dashed lines showestimated concentrations of DOC based on conservative mixing with salinity by using stations 1 and 6 as estuarineendmembers.
2224 A. Mannino and H. R. Harvey

estuary and the coastal ocean (59 to 137mg/mg OC) than in theupper and mid-bay regions (12.5 to 30mg/mg OC). The dis-tribution of fatty acids were limited downstream of the turbiditymax (station 3) with three fatty acids (14:0, 16:0, and 18:0)comprising 82% of total fatty acids. The 16:0 was the dominantfatty acid in particles (25.4% to 52.1%) with the exception ofstation 5 where 16:1D9 comprised 32.6% of total fatty acids.The contribution of the saturated C18 to total fatty acids wasmuch lower in POM than in any DOM fraction, accounting for2% to 15% in POM and a minimum of 26% in DOM. Whennormalized to carbon, however, the yields of the 18:0 acid inPOM were comparable to those found in VHDOM and wereslightly higher than in HDOM. Long-chain fatty acids (24:0and 26:0) ranged from 1.1% to 0.1% of particulate fatty acidsat the turbidity max and at the coastal ocean (station 7).
Monounsaturated fatty acids ranged from 4.6% to 39.4% ofparticulate fatty acids downstream of the turbidity max anddownstream of the chlorophyll maximum. Monounsaturatedacids also peaked downstream of the chlorophyll maximum forboth DOM fractions. The 16:1D9 was the dominant monoun-saturate throughout the estuary, except downstream of theturbidity max where 20:1 comprised 4% of particulate fattyacids. In contrast, 18:1D9 was typically the dominant monoun-saturate for HDOM and VHDOM. PUFAs comprised 1.1% ofparticulate fatty acids downstream of the turbidity max and upto 25.1% at coastal ocean station 6. Higher proportions of C16
PUFAs were found at the turbidity max and chlorophyll max-imum, whereas C18 PUFAs dominated at the remaining sta-tions.
4.3. Neutral Lipids
Four groups of neutral lipids (n-alcohols, methyl esters,sterols, and hydrocarbons) were quantified in dissolved frac-tions and POM. Low amounts of sterols were observed inDOM, typically ,0.1 mg/mg OC in HDOM and somewhathigher in VHDOM (0.15–1.3mg/mg OC; Table 4). Eithercholesterol (cholest-5-en-3b-ol) or cholesta-5,22-dien-3b-ol(C27D
5,22) was the dominant sterol in HDOM, except at theturbidity maximum where additional sterols contributed to thetotal. VHDOM samples contained several sterols that originatefrom algae, zooplankton, and higher plants. The observed shiftsin sterol distributions also indicate shifts in algal species com-position, particularly from the lower estuary to the coastalocean site where the presence of 4a,23,24-trimethylcholest-22-en-3b-ol (dinosterol), a biomarker of dinoflagellates (Boon etal., 1979), was observed.
In contrast to the low concentrations in dissolved fractions,sterols comprised a significant portion of particulate neutrallipids, ranging from 0.14mg/mg OC in the upper river to 3.2mg/mg OC at the coastal ocean (Table 6). Cholesta-5,24-dien-3b-ol (C27D
5,24) comprised a significant percentage of totalsterols in the lower estuary (up to 36% at the chlorophyllmaximum) and coastal ocean sites, yet was absent from dis-solved fractions. As observed for dissolved lipids, shifts inparticulate sterol distributions indicate shifts in algal speciescomposition. For example, 24-methylcholesta-5,22-dien-3b-ol(C28D
5,22) was not detected at the chlorophyll maximum or atstation 5 but comprised 12% of total sterols at both coastal
Table 2. High-molecular-mass dissolved fatty acid distributions along the Delaware Estuary.
Fatty acid(% of total)
1a
H2H
3H
4H
5H
6H
7H
1VH
3VH
4VH
5VH
6VH
7VH
12:0 2.5 — — 2.0 — — — 1.8 2.0 1.3 — — —14:0br — — — — — — — 0.8 — — — — —14:0 9.2 2.0 — 10.2 — — — 8.6 6.4 9.9 3.3 9.6 7.115:14 — — — — — — — 0.4 3.0 — — — —15:0i 3.1 — — 2.3 — — — 5.0 — — — — —15:0a — — — 3.6 — — — 3.6 1.5 2.1 — 2.5 2.715:0 — — — — — — — 1.7 — — — — —16:3 — — — — 4.0 — — — — — — — —16:1D9 — — — — 6.0 — — — — — — — —16:0i — — — — — — — 1.6 — — — — —16:0a — — — — 13.2 9.9 13.8 0.9 1.1 4.1 — 1.7 —16:0 51.8 31.2 24.8 48.9 19.4 60.1 23.3 40.7 54.5 49.5 39.4 53.4 42.917:0i — — — — — — — 0.8 — — — — —17:0a 0.9 2.7 3.8 0.9 8.8 — 6.9 1.1 2.5 1.2 — 1.5 —17.0 — — — 2.3 — — — 1.6 — 2.7 — — —18:4 — — 5.0 2.0 — — — — — — 6.8 — —18:1D9 — 3.2 4.0 — 8.7 — 6.2 — — — 5.5 — 2.818:0 31.5 46.6 62.5 27.1 40.0 30.0 41.5 26.0 28.9 29.2 45.0 30.1 44.520:1 — — — — — — — 1.0 — — — — —20:0 0.1 — — 0.9 — — — 1.4 — — — 1.2 —22:0 0.9 14.4 — — — — 8.4 1.6 — — — — —24:0 — — — — — — — 1.7 — — — — —Saturated 100 96.8 91.0 98.0 81.4 100 93.8 98.7 97.0 100 87.7 100 97.2Monounsaturated — 3.2 4.0 — 14.6 — 6.2 1.4 3.0 — 5.5 — 2.8PUFA — — 5.0 2.0 4.0 — — — — — 6.8 — —Total mg/mg OC 0.72 0.77 1.80 2.72 0.64 0.71 0.83 3.33 7.71 7.40 2.99 12.6 3.39DOC mg C/l 1.07 1.60 1.17 0.78 0.72 0.51 0.51 0.055 0.023 0.028 0.041 0.014 0.039
H, 1–30 kDa; VH, 30 kDa–0.2mm; -, below detection limits; 12:0, carbon: no. double bonds;D, no. double-bond position from carboxyl terminus;br, branched; i, iso; a, anteiso; PUFA, polyunsaturated fatty acid; DOC, dissolved organic carbon.
a Station numbers in this now.
2225Lipid composition in Delaware Estuary organic matter

ocean sites. Cholesterol was a major sterol in POM at theriverine site (71.5%) and at the turbid stations (31–34%) butdeclined to 9.5–16.8% in the lower estuary and coastal oceansites. C27D
5,22, a dominant sterol in DOM fractions, was aminor sterol in POM.
Elevated methyl ester yields were common in HDOM with amaximum of 1.63mg/mg OC at the chlorophyll maximum(Table 4). In contrast, n-alcohols and sterols were typicallymore abundant in VHDOM (Table 4). Methyl esters werelimited to a few compounds in the dissolved fractions, with nosingle compound dominating through the estuary or in eithersize class. The absence of the nonadecanoic acid methyl ester(esterification product of the internal standard) in neutral frac-tions of blanks and samples verified that no conversion of freeacids to methyl esters occurred during sample processing. n-Alcohols ranged from 0.16mg/mg OC at station 3 to 2.2mg/mg
OC at station 6 in HDOM and 0.4–13.5mg/mg OC in VHDOMat the riverine site and in the chlorophyll maximum, respectively.
In POM, concentrations of n-alcohols ranged from belowdetection level to 1.7mg/mg OC downstream of the turbiditymax and coastal ocean station 6, respectively (Table 5). Asobserved for neutral lipids in dissolved material, no singlen-alcohol dominated throughout the estuarine gradient. Themethyl ester concentration in POM was highest at the chloro-phyll maximum, 1.7mg/mg OC, and lowest at the turbiditymax, 0.13mg/mg OC. Phytol, originating from the side chain ofchlorophyll a and c, and its hydrogenation product dihydro-phytol were observed in POM but not in either DOM fraction.Phytol and dihydrophytol followed similar distributions alongthe salinity gradient with maxima at the chlorophyll maximum(9.9mg/mg OC and 0.22mg/mg OC, respectively) and minima atthe riverine site and downstream of the turbidity max (Table 5).
Table 3. Free and esterified fatty acids present in particles along the Delaware Estuary.
Fatty acid(% of total)
Stations
1 2 3 4 5 6 7
12:0 0.2 0.4 0.3 0.2 0.1 tr 0.213:0 — 0.2 — — 0.1 — 0.113:0 0.2 0.7 — — 0.1 — 0.114.:0 br 0.5 1.2 1.1 0.6 0.7 tr 0.514:0 7.7 12.6 20.3 23.9 16.0 9.5 18.015:1D4 1.1 0.4 — 0.4 0.6 0.4 0.315:0i 3.4 2.8 2.4 1.3 1.4 0.9 1.215:0a 1.8 2.6 1.8 0.8 0.8 0.6 0.815:0 1.4 1.8 2.2 1.4 1.1 0.8 1.016:4 — — — 2.0 0.9 0.4 0.216:3 0.7 2.3 — 1.5 1.5 0.4 0.216:2 0.8 1.9 — 1.1 — — —16:1D9 7.9 10.7 — 9.6 32.6 17.1 16.816:1D11 1.0 1.0 — 0.2 0.6 0.9 1.016:0i 0.4 0.8 0.6 — — 0.3 0.316:0a 1.4 2.9 — 2.5 0.7 — —16:0 33.5 32.6 52.1 33.5 25.4 26.6 34.817:0i 0.7 0.5 0.7 0.2 0.2 0.2 0.317:0a 0.6 0.7 0.4 0.2 0.1 0.2 0.217:0 coel 0.7 1.0 0.3 0.2 coel 0.318:4 0.8 0.7 — 1.1 1.1 3.9 2.318:3 0.4 0.2 — 0.7 0.4 1.4 0.718:2 2.0 0.9 1.1 0.9 1.1 3.4 3.218:1D9 4.8 2.8 0.4 1.6 2.9 8.2 7.718:1D11 3.1 2.3 0.3 0.9 2.8 3.8 2.418:0 15.4 9.8 9.5 2.4 2.0 4.2 2.820 PUFA 0.7 0.4 — 0.2 0.2 0.4 0.220:5 1.9 2.4 — 2.2 3.2 5.5 1.720:4 — 0.2 — 0.2 0.3 0.5 0.220:1 3.7 0.8 4.0 5.1 — — 0.320:1 0.7 — — 0.2 — 0.5 —20:0 0.7 0.2 1.0 0.5 0.3 0.3 0.122 PUFA — 0.6 — — 0.2 0.4 0.122:6 — 0.4 — 1.0 1.3 8.0 1.822 PUFA — — — 0.5 0.1 0.7 0.222:1 1.8 — — — — — 0.122:0 tr 0.7 coel 2.0 0.5 coel 0.124:0 0.5 0.7 0.8 0.6 0.6 0.4 0.126:0 0.2 0.4 0.2 0.1 0.1 — trSaturated 68.6 72.0 94.3 70.5 50.2 44.2 60.6Monounsaturated 24.1 18.0 4.6 18.1 39.4 30.8 28.7PUFA 7.4 10.0 1.1 11.4 10.4 25.1 10.8Total mg/mg OC 30.0 12.5 17.0 59.1 72.9 97.2 137.4POC mg/C/L 1.15 3.82 1.77 1.95 1.82 0.64 0.65
Coel, coelution of peaks; tr, trace amount.
2226 A. Mannino and H. R. Harvey

Tab
le4.
Neu
tral
lipid
spr
esen
tin
diss
olve
dfr
actio
nsal
ong
the
Del
awar
eE
stua
ry.
Neu
tral
lipid
s(%
ofgr
oup
tota
l)1a H
2 H3 H
4 H5 H
6 H7 H
1 VH
3 VH
4 VH
5 VH
6 VH
7 VH
Alc
ohol
12:2
——
——
12.2
—10
.0—
——
13.4
——
12:0
tr3.
8tr
—10
.313
.825
.7—
1.3
9.0
23.8
10.3
6.4
13:0
—5.
2—
—72
.2—
40.1
—tr
3.5
11.9
3.9
9.0
14:0
—34
.128
.29.
6—
5.1
24.2
10.9
10.1
9.9
9.6
6.8
2.4
15:0
——
—9.
05.
36.
2—
—1.
71.
67.
3—
8.6
16:0
14.1
—71
.868
.3—
25.7
——
14.5
10.9
29.1
2.1
19.7
17:0
——
——
——
——
1.0
3.1
——
27.4
18:1
——
——
——
——
——
—3.
5—
18:0
85.9
——
13.1
—49
.2—
89.1
69.4
62.1
5.0
73.5
26.6
20:1
—56
.9—
——
——
——
——
——
20:0
——
——
——
——
2.0
——
——
Tot
alal
coho
l(mg/
mg
OC
)0.
221.
040.
160.
210.
622.
180.
530.
406.
8913
.50
1.37
7.02
1.29
Met
hyle
ster
14:0
—10
0—
—10
0—
97.5
——
——
——
16:0
——
12.9
33.1
——
2.5
——
—10
0—
52.0
18:4
——
——
——
——
—10
0—
—48
.018
:0—
—87
.166
.9—
——
——
——
——
Tot
alM
E(m
g/m
gO
C)
—0.
260.
701.
631.
01—
0.86
——
0.15
0.28
—0.
26S
tero
l24
-Nor
-cho
lest
a-5,
22-d
ien-
3b-o
l—
13.7
——
——
——
——
13.6
—8.
55b
-Cho
lest
an-3b
-ol
——
——
——
—10
.518
.53.
1—
——
Cho
lest
a-5,
22-d
ien-
3b-o
l8.
212
.6—
—89
.6—
91.1
4.6
—29
.418
.0—
51.8
Cho
lest
-5-e
n-3b-o
l91
.828
.262
.510
0—
100
—26
.835
.818
.416
.957
.83.
85a
-Cho
lest
an-3b
-ol
——
——
——
—4.
8—
——
7.6
—24
-Met
hylc
hole
sta-
5,22
-die
n-3b-o
l—
7.6
37.5
—10
.4—
—8.
110
.616
.38.
016
.013
.024
-Met
hylc
hole
sta-
5,24
(28)
-die
n-3
b-o
l—
8.2
——
——
8.9
15.4
21.9
18.3
20.0
—9.
524
-Met
hylc
hole
st-5
-en-
3b-o
l—
5.6
——
——
—4.
9—
——
4.4
—24
-Eth
ylch
oles
ta-5
,22-
dien
-3b-o
l—
8.2
——
——
—8.
7—
2.9
4.4
—1.
424
-Eth
ylch
oles
t-5-
en-3b
-ol
—16
.1—
——
——
16.3
13.2
6.0
14.2
8.4
4.4
24-E
thyl
chol
esta
-5,2
4(28
)-di
en-3b-o
l—
——
——
——
——
5.6
4.9
5.8
4.9
4a,2
3,24
-Trim
ethy
lcho
lest
-22-
en-3b-o
l—
——
——
——
——
——
—2.
8T
otal
Ste
rol(m
g/m
gO
C)
0.08
0.03
0.00
40.
010.
020.
010.
021.
270.
150.
550.
410.
230.
51T
otal
n-A
lkan
es(mg/
mg
OC
)0.
57.
27.
19.
67.
77.
510
.80.
720
.421
.14.
025
.21.
8T
otal
UC
MH
ydro
carb
ons
(mg/
mg
OC
)0.
583
.320
.736
.218
826
.617
00.
729
.337
.715
.740
.713
.3
ME
,m
ethy
lest
er;
UC
M,
unre
solv
edco
mpl
exm
ixtu
re.
aS
tatio
nnu
mbe
rsin
this
row
.
2227Lipid composition in Delaware Estuary organic matter
Hydrocarbons, primarily as an unresolved complex mixture(UCM), accounted for the largest portion of dissolved neutrallipids in HDOM, ranging from 0.49mg/mg OC at the riverinesite (series of n-alkanes) to 188mg/mg OC downstream of thechlorophyll maximum (UCM; Table 4). n-Alkanes comprisedfrom ,5% to 100% of total hydrocarbons in dissolved frac-tions. Concentrations of UCM hydrocarbons were similar be-tween HDOM and VHDOM at stations 1, 3, and 4 but variedgreatly at all other stations. The hydrocarbons appear to beprimarily of anthropogenic origin as indicated by the odd toeven C22-C30 n-alkane ratio of;0.98. The UCM for dissolvedfractions occurred within the C17 to C29 n-alkane regions of thegas chromatograms. Contrary to that observed for most dis-
solved lipid fractions, hydrocarbons in POM samples werecomprised of a simple series of n-alkanes (Table 5).
5. DISCUSSION
5.1. Distributions of Lipids and Diagenetic Patterns
Although lipids comprised a small portion of DOM, thecomposition of dissolved lipids has the potential to provideinformation on source and diagenetic processing. Yields ofnonhydrocarbon lipids were much higher in particles than ineither HDOM fraction. Fatty acid yields were 10- to 30-foldgreater in POM than VHDOM and up to 15-fold greater inVHDOM than HDOM (Fig. 5). Both DOM fractions were
Table 5. Distribution of neutral lipids on particles in the Delaware Estuary.
Neutral lipids (% of group total) 1a 2 3 4 5 6 7
Alcohol14:0 — 13.5 — 16.6 8.0 3.7 —15:0 — — — — 11.4 4.4 —16:0 — 56.3 — — 43.3 70.7 74.817:0 — — — — — tr —18:1 100 — — 37.9 — — —18:0 — 33.5 — 32.5 13.6 19.0 25.220:1 — — — 13.0 23.6 2.2 —Total alcohol (mg/mg OC) 0.17 0.15 — 0.17 0.21 1.70 0.28
Methyl ester14:0 — — — — 1.4 tr —16:1 — — — — 12.1 6.4 11.916:0 — — 1.6 — 5.6 16.6 16.518:0 30.5 — 47.3 — 3.4 10.2 4.818:4 69.5 100 51.1 100 74.8 66.8 60.8Phytanic acid ME — — — — 2.7 — 6.0Total ME (mg/mg OC) 0.27 0.13 0.32 1.73 1.28 0.56 0.50
Sterol24-Nor-cholesta-5,22-dien-3b-ol — 2.8 8.6 5.5 5.7 14.8 14.65b-Cholestan-3b-ol 10.9 2.2 — — — — —Cholesta-5,22-dien-3b-ol 17.5 11.3 11.8 9.2 4.7 7.8 6.3Cholest-5-en-3b-ol 71.5 34.4 31.2 11.2 12.0 16.8 9.55a-Cholestan-3b-ol — 4.0 — — 0.8 — —Cholesta-5,24-dien-3b-ol — 3.9 — 35.7 30.6 14.6 16.924-Methylcholesta-5,22-dien-3b-ol — 6.2 6.5 — — 11.9 12.224-Methylcholesta-5,24(28)-dien-3b-ol — 13.0 17.7 27.0 23.4 12.0 14.924-Methylcholest-5-en-3b-ol — 7.3 24.2 6.7 — — —24-Ethylcholesta-5,22-dien-3b-ol — 4.5 — — 2.1 1.8 —24-Ethylcholest-5-en-3b-ol — 10.5 — — 7.9 5.1 9.024-Ethylcholesta-5,24(28)-dien-3b-ol — — — 4.7 10.6 14.4 14.04a,23,24-Trimethylcholest-22-en-3b-ol — — — — 2.1 1.0 2.6Total Sterol (mg/mg OC) 0.14 1.09 0.19 2.90 2.73 3.20 2.59Phytol (mg/mg OC) 0.02 2.21 0.15 9.93 6.02 2.76 0.70Dihydrophytol (mg/mg OC) — 0.03 — 0.22 0.13 0.06 0.06
n-Alkane17 — — — — 5.7 — —18 41.6 41.3 — — 8.9 — —23 — 37.0 51.5 — 14.3 20.8 —24 7.3 — 26.4 — — 15.0 —25 51.1 — 32.1 — 0.3 53.2 —26 — 21.7 — — 7.7 — —27 — — — — 5.2 11.0 —28 — — — — 6.6 — —29 — — — — 32.1 — —30 — — — — 6.9 — —31 — — — — 7.2 — —32 — — — — 5.2 — —Total hydrocarbons (mg/mg OC) 0.26 0.09 0.05 — 0.35 0.17 —
Abbreviations: see previous tables.a Station numbers in this row.
2228 A. Mannino and H. R. Harvey

dominated by saturated fatty acids, primarily 16:0 and 18:0,with few monounsaturated acids and PUFAs detected (Table2). Other researchers have examined the total dissolved lipidpool, defined by various sized filters from,0.5 mm to ,1.2mm (GF/C), and subsequent liquid:liquid extraction of lipidsinto an organic solvent phase (e.g., Kattner et al., 1983; Berdie
et al., 1995; Jaffe et al., 1995; Thoumelin et al., 1997) orextraction onto an hydrophobic resin (Gomez–Belinchon et al.,1988). Total dissolved fatty acid concentrations from a numberof aquatic environments were comparable to the fatty acidconcentrations we found in VHDOM and HDOM. As weobserved in the Delaware, a predominance of C16 and C18 fatty
Fig. 5. Distribution of major fatty acid classes in particulate and high-molecular-mass dissolved fractions in the DelawareEstuary. Bacterial fatty acids include: branched and normal C15 and C17 saturated acids and 15:1D4. TB max5 turbiditymaximum.
2229Lipid composition in Delaware Estuary organic matter
acid homologs in total dissolved lipids is often seen (Berdie etal., 1995; Jaffe et al., 1995). Previous work also has observedmainly saturated fatty acids in the dissolved pool (Gomez–Belinchon et al., 1988; Berdie et al., 1995). Yet Thoumelin etal. (1997) observed a greater proportion and diversity of un-saturated acids in the Seine Estuary. Jaffe et al. (1995) reporteda higher ratio of unsaturated to saturated fatty acids in totaldissolved fatty acids than in POM of the Orinoco River basin.In addition to variability among aquatic systems, differences inparticle-dissolved filtration procedures could substantially in-fluence lipid composition because much of the microbial com-munity resides within the 0.2–1.2mm size range.
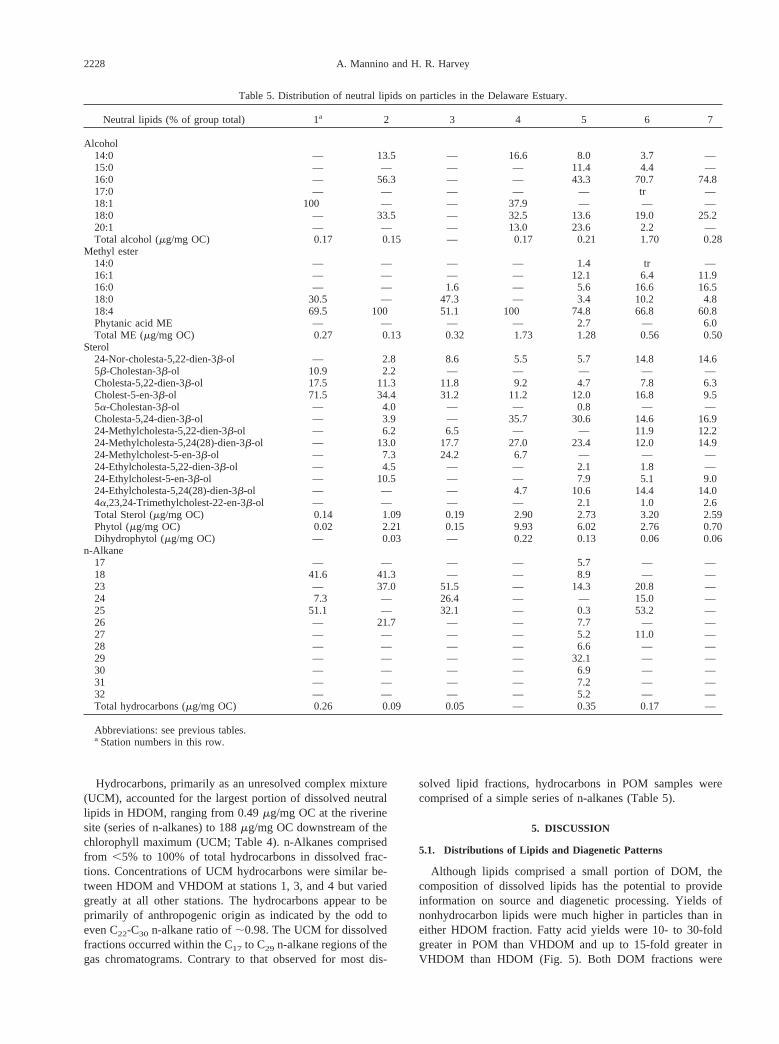
The divergence of fatty acid composition and concentrationbetween POM and DOM fractions mirror diagenetic patternsobserved in particles. Studies have shown preferential utiliza-tion of PUFAs and monounsaturated acids compared to theirsaturated counterparts, and total fatty acids are degraded morerapidly than total lipids in POM (Sun and Wakeham, 1994;Harvey and Macko, 1997). Source and composition appear tobe important factors in degradation of fatty acids. Disparities infatty acid concentrations, yields, and composition between par-ticles and high-molecular-mass DOM fractions indicated thatmicrobial utilization of fatty acids, particularly unsaturatedacids, was preferred over sterols, alcohols, and methyl esters.
As observed for fatty acids, POM contained much higherconcentrations of neutral lipids than either DOM fraction, ex-cluding hydrocarbons (Fig. 6). On a carbon basis, however,POM and VHDOM contained similar amounts of neutral lipids,although differences in lipid class composition were evident(Fig. 6). The compositional differences observed among neutrallipids may be a consequence of differing lability. Lipid struc-tures most susceptible to degradation, i.e., phytol and sterolswere removed rapidly from the dissolved pool. Harvey andMacko (1997) observed faster turnover times for phytol, ste-rols, and fatty acids from decaying diatoms than other lipids orPOC. The lability of particulate phytol, sterols, and fatty acidscould explain the relative depletion of these compounds inhigh-molecular-mass DOM. Normal alcohols and methyl estersappear less labile and, hence, selectively retained in the DOMfractions.
As with other lipid components, particles contained higherconcentrations of sterols than either DOM fraction. The simi-larity in sterol concentration between VHDOM and HDOMfractions and a 10-fold higher yield in VHDOM sterols indi-cated that VHDOM was significantly enriched in sterols com-pared to the HDOM fraction (Fig. 7). The similarity in isotopiccomposition and sterol distributions between POM andVHDOM along with higher lipid yields for VHDOM thanHDOM suggested that VHDOM was more labile than HDOM.
5.2. DOC Dynamics Along the Salinity Gradient
By using salinity as a conservative marker, mixing curveswere generated with the riverine and coastal ocean site (station6) as end-members to examine where potential sources andsinks of DOM occurred along the estuarine gradient (Fig. 4).Conservative mixing of TDOC with salinity was not observed(Fig. 4) in contrast to previous studies of the Delaware Estuary(Fox, 1983; Sharp et al., 1984). Mixing curves showed sourcesof TDOC downstream of the turbidity max (station 3) primarily
through the LDOM fraction that coincided with a decline inPOC and HDOM-C between the turbidity max and station 3.Desorption of organic matter from particles and from 1–30 kDacolloids may have contributed to the observed increases inLDOM-C. The precipitous decline in TDOC and LDOM-Cbetween station 3 and the lower estuary may be attributed inpart to dilution by estuarine mixing but also suggests theimportance of physical processes such as flocculation (Sholko-vitz, 1976; Fox, 1983) or sorption to particles.
The distributions of DOC among the molecular mass frac-tions suggested that aggregation of low-molecular-mass mate-rials may have led to the HDOM-C maximum at the turbiditymax. Alternatively, adsorption of LDOM to particles and re-lease of HDOM from resuspended sediments also could explainthe observed results. At the turbidity max, the presence ofphytol, algal sterols, and fatty acids in POM and algal sterols inthe .1-kDa DOM indicate relatively fresh organic matter atthis site, originating from an upstream source or possibly up-stream transport of algal material from the lower estuary. Tidalflow could transport recently deposited algal material from thelower estuary and subsequently resuspend it in surface watersat the turbidity max. Other potential origins for the elevatedHDOM-C include adsorption of LDOM to 1- to 30-kDa min-erals and organics, discharge from the Schuylkill River, andvarious point and nonpoint urban sources. However, the mag-nitude of the increase in HDOM-C (44mM C) between theriverine site and the turbidity max and the subsequent decline(36 mM C) at station 3 point to sorption or aggregation aspotential mechanisms leading to the elevated HDOM-C con-centration. Regardless of the specific mechanism(s), physico-chemical processes are clearly important factors that influencethe molecular mass distribution of DOC within turbid regions.
Phytoplankton production was an important source of DOMto the lower estuary and coastal ocean, as indicated by thechange ind13C between the upper and lower estuary forHDOM and VHDOM (Fig. 3). Phytoplankton release;12% oftotal primary production as dissolved organics (Baines andPace, 1991), yet the apparent release of DOM by phytoplanktonwas not evident from the HDOM-C concentrations at the chlo-rophyll max or downstream (Fig. 4). Uptake of HDOM bybacteria may have attenuated the HDOM-C concentration inthe lower estuary because bacterial production is typically highin the lower estuary of Delaware Bay (Hoch and Kirchman,1993). Nevertheless, algal-derived sources of VHDOM areclearly evident ind13C values (219.8‰ to219.6‰) and theelevated concentrations of VHDOM-C in the lower estuary(Figs. 3 and 4). In addition, the strong similarity in stablecarbon isotope distributions between POM and VHDOM in thelower region of the Delaware Estuary, where algal biomass wassubstantial, provides support for the removal of high-molecu-lar-mass dissolved material from the upper and turbid regionsof the estuary during transport.
5.3. Dissolved and Particulated13C and LipidComposition as Indicators of Source
The d13C of POM and DOM fractions generally increasedfrom the riverine station to the lower Delaware estuary ap-proaching similar values to bulkd13C-DOC (Peterson et al.,1994) and.1 kDa d13C-DOC (Guo and Santschi, 1997;231
2230 A. Mannino and H. R. Harvey

to 223‰) measured in other estuarine systems. Peterson et al.(1994) found bulkd13C-DOC predominantly of phytoplanktonorigin (222 to224‰) within the high salinity region and DOCof terrestrial origin with lowd13C (225 to 229‰) near thefreshwater regions of several temperate estuaries. Cifuentes etal. (1988) observed a similar pattern ind13C for POM duringspring in the Delaware Estuary, which they attributed to ter-restrial inputs in the upper and turbid middle estuary and
primary production in the lower estuary, primarily from thediatom Skeletonema costatum. They also noted lighterd13CPOM values near the bay mouth, which they attributed tohigher algal growth rates, changes in dissolved inorganic car-bon source for phytoplankton (uptake of bicarbonate), or a shiftin phytoplankton species composition.
The saturated C24 and C26 fatty acids, generally ascribed tohigher plants, comprised higher fractions of POM fatty acids in
Fig. 6. Major neutral lipid classes in particulate and high-molecular-mass dissolved fractions along the DelawareEstuary.
2231Lipid composition in Delaware Estuary organic matter

the upper and middle regions of the estuary, suggesting aterrestrial origin for these fatty acids. In DOM, 24:0 wasdetected only in VHDOM at the riverine station. Sterols orig-inating from higher plants and/or algae were present throughoutthe estuarine gradient in POM but occurred primarily at theriverine site in VHDOM and at the turbidity max in HDOM
(Table 4; Fig. 7). This distribution suggests principally a ter-restrial origin for the dissolved sterols. The absence of higherplant sterols in POM at the riverine site indicates low levels ofterrestrial input or rapid dissolution of this material. Although24-ethylcholest-5-en-3b-ol and 24-methylcholest-5-en-3b-olare commonly ascribed to higher plants, algae also synthesize
Fig. 7. Source classification of sterols in particulate and high-molecular-mass dissolved fractions through the DelawareEstuary. Higher plant and/or algae: 24-methylcholest-5-en-3b-ol, 24-ethylcholesta-5,22-dien-3b-ol and 24-ethylcholest-5-en-3b-ol; algae: 24-nor-cholesta-5,22-dien-3b-ol, cholesta-5,24-dien-3b-ol, 24-methylcholesta-5,22-dien-3b-ol, 24-meth-ylcholesta-5,24(28)-dien-3b-ol, 24-ethylcholesta-5,24(28)-dien-3b-ol and 4a,23,24-trimethylcholest-22-en-3b-ol; zoo-plankton/algae: 24-cholesta-5,22-dien-3b-ol, cholest-5-en-3b-ol (cholesterol) and 5a-cholestan-3b-ol; sewage: 5b-cholestan-3b-ol.
2232 A. Mannino and H. R. Harvey

these sterols (e.g.,S. costatumand chlorophytes synthesizeboth sterols), which could explain their presence in the lowerestuary and coastal ocean (Volkman, 1986). The majority ofsterols observed in the turbidity max HDOM sample (.1 kDa)may be associated with material.30 kDa given the similarityof sterol distributions and yields with the VHDOM fraction atother sites. Stable carbon isotopes also indicate terrestriallyderived materials within POM (226.8‰ and226.2‰) andHDOM (224.7‰ and225.5‰) at the riverine site and turbid-ity max with perhaps a mixed signal for VHDOM at theriverine site (223‰).
The fatty acid composition of particles between the chloro-phyll maximum and the coastal ocean sites also resembledalgal-derived material; noteworthy was the presence of poly-unsaturated fatty acids (Table 3). Substantially higher yields inparticulate fatty acids were observed for C18 PUFAs and mono-unsaturated acids, especially 18:4, 18:2, and 18:1D9, at thecoastal ocean stations, whereas at the chlorophyll maximumand downstream C16 PUFAs were found in higher proportions(Table 3). Prymnesiophytes, chlorophytes, and cryptomonadscontain higher concentrations of C18 PUFAs than C16 PUFAswith the opposite distribution occurring in diatoms (Volkman etal., 1989). Fewer diatoms and higher relative abundances offlagellated organisms observed by epifluorescence microscopyat the coastal ocean sites supported the shift seen in fatty acids.
Algal sterols were especially abundant in POM at stationswith high phytol concentrations including the turbidity max(Fig. 7). As with fatty acids, differences in sterol compositionbetween the lower estuary and coastal ocean (Tables 4 and 5)may be attributed to shifts in algal species. Microscopic exam-ination indicated that diatoms were most prevalent at the chlo-rophyll maximum and at the site immediately downstream.Lower proportions of 24-methylcholesta-5,24(28)-dien-3b-ol(found primarily in diatoms, certain Prasinophytes, anddinoflagellates; Volkman, 1986) were found at the coastalocean sites than in the lower estuary for both POM andVHDOM. In addition, cholesta-5,24-dien-3b-ol (found in S.costatumand dominant in other diatoms,Rhizosoleniagenus;Barrett et al., 1995), which comprised 35.6% and 30.6% ofPOM sterols at the chlorophyll maximum and downstream ofthe chlorophyll maximum, respectively, contributed only14.6% and 16.9% at stations 6 and 7, respectively. 24-Meth-ylcholesta-5,22-dien-3b-ol, a major sterol in Cryptomonads butnot in diatoms (Barrett et al., 1995), was not detected in thelower estuary in particles but comprised 12% of particulatesterols at both coastal ocean sites. Dinosterol, a biomarkerspecific to dinoflagellates, was detected in POM and VHDOMat station 7 and only in POM downstream of the chlorophyllmaximum and at station 6. Unlike dinosterol, sterol specificityis lacking for other algal taxa and variability in sterol compo-sition within similar taxa is common (Volkman, 1986).
The distributions of neutral lipids would indicate a plank-tonic origin for n-alcohols and methyl esters. Although rare inalgae, n-alcohols as wax esters comprise a substantial fractionof lipids in some zooplankton, especially copepods (Sargentand Henderson, 1986; Parrish, 1988; Sargent and Falk-Pe-tersen, 1988). The high proportion of the 16:0 alcohol in POMdownstream of the chlorophyll maximum and at the coastalocean stations (43%, 71%, and 75% of total alcohols, respec-tively) and in HDOM downstream of the turbidity max and at
the chlorophyll maximum (72% and 68%, respectively) wouldsuggest a zooplankton origin (Harvey et al., 1987; Sargent andFalk–Petersen, 1988). In copepods isolated from the POMfraction at station 7, the normal chain 16:0 alcohol comprised65.8% of total alcohols with 14:0 and 18:0 n-alcohols contrib-uting the remaining 12.7% and 13.5%, respectively.
The observance of methyl esters in the dissolved fraction isuncommon and may originate from bacterial or autocatalyticmethylation of fatty acids present within macromolecules. Thehigh concentrations of the polyunsaturated 18:4 methyl ester inparticles from the lower estuary suggest algal synthesis. Be-cause fatty acid degradation proceeds primarily through decar-boxylation (Sun et al., 1997), methyl esters may be moreresistant to bacterial degradation and accumulate in the dis-solved fractions. Kennicutt and Jeffrey (1981) found methyl,ethyl, and propyl esters in total dissolved lipid extracts withmethyl esters dominated by 16:0 and 17:0. They proposed anorigin of methyl esters from the mineralization of humics. Theresults presented here are inconclusive in attributing a sourcefor dissolved and particulate methyl esters.
5.4. Anthropogenic Dissolved Lipids
Coprostanol (5b-cholestan-3b-ol), an indicator of sewageinput, was found in POM and VHDOM at the riverine site andseveral sites downstream of the Trenton, NJ and Philadelphia,PA municipalities. Sewage treatment plants along the DelawareEstuary, particularly in the Philadelphia metropolitan area, areknown for releasing high levels of phosphate and ammonium(Sharp, 1995) and apparently coprostanol as well. The obser-vation of hydrocarbons was not unexpected because the Dela-ware Bay is the second largest oil refinery region in the UnitedStates, and Philadelphia is one of the largest ports in the world(Albert, 1988). The pattern of UCM hydrocarbons suggest thatfuel oil originating from commercial shipping, oil refineryactivity, and other industrial operations are the likely sources ofthese hydrocarbons to Delaware Bay DOM. The absence of anUCM within particles and the high yields of UCM hydrocar-bons in HDOM and VHDOM, however, is a conundrum. Pre-vious observations have shown higher concentrations of UCMhydrocarbons or n-alkanes in the particulate phase compared tototal DOM or high-molecular-mass DOM (Gomez–Belinchonet al., 1988; Yunker et al., 1991; Jaffe et al., 1995). Yet ourresults show preferential sorption or aggregation within thehigh-molecular-mass dissolved pool. Boehm and Quinn (1973)determined that removal of DOM from seawater substantiallydecreased the solubility of n-alkanes and isoprenoid hydrocar-bons. They suggested that micelles formed by humics mediatedthe incorporation of hydrocarbons to DOM. Higher than ex-pected concentrations of dissolved hydrocarbons based on oc-tanol-water partition coefficients were attributed to aggregationof hydrocarbons through intermolecular associations (McAu-liffe, 1969; Coates et al., 1985).
5.5. Geochemical Role of Dissolved Lipids
In addition to the utility of dissolved lipids as tracers ofsource and indicators of diagenesis, dissolved lipids may en-hance the preservation of other DOM. Nagata and Kirchman(1992) have shown that heterotrophic flagellates grazing on
2233Lipid composition in Delaware Estuary organic matter

bacteria release lipid-rich macromolecular DOM. They hypoth-esized that this lipid-rich DOM is composed of undigestedbacterial membrane components that form liposome structures.Recent evidence has shown that encapsulation of protein withinliposomes or adsorbed to liposomes reduced the degradationrate of the protein versus unassociated dissolved protein (Na-gata et al., 1998; Borch and Kirchman, 1999). One recent studythat used ultrafiltration observed that phospholipids were animportant component of the 10-kDa to 0.45-mm DOM lipidfraction (Liu et al., 1998). Phospholipids and glycolipids,which comprised most of the dissolved fatty acids in theDelaware Estuary, are the main constituents of cell membranesand may form liposome structures. Cell membrane fragmentsor liposomes could act as nucleating agents for hydrophobicorganics and result in the aggregation of other lipid componentssuch as the UCM hydrocarbons observed in the DelawareEstuary. Because a lipid membrane structure would pose agreater challenge for bacterial degradation than free fatty acids,a greater potential for preservation of lipids and associatedorganics exists.
6. CONCLUSIONS
Lipids, excluding hydrocarbons, comprised up to 0.33% ofHDOM organic carbon, 1.6% of VHDOM carbon, and 10% ofPOC. Although lipids comprised a small fraction of HDOM,the amounts observed were significant. In general, both DOMfractions contained lower concentrations of lipids than POM,especially, phytol, and fatty acids, with much lower contribu-tions of unsaturated fatty acids relative to saturated acids thanobserved for POM. Similard13C and sterol composition andhigher yields of fatty acids and neutral lipids within POM andVHDOM may indicate a more active exchange between thesetwo pools than with the HDOM fraction. Lipid composition anddistributions suggest that selective degradation of particulatelipids determines the composition of dissolved high-molecular-mass lipids. Differential lability of individual lipids promotesselective release of particulate lipids to the HDOM pool withsubsequent selective utilization within the DOM pool.
Changes in distributions of dissolved lipids provided valu-able information on the origins of DOM in the DelawareEstuary. Terrestrially derived lipids were found in HDOM,VHDOM, and POM at the riverine site, at the turbidity max,and downstream of the turbidity max. Unambiguous biomarkersignals were observed in the lower estuary and coastal oceanfor algal- (phytol, sterols, and fatty acids) and zooplankton(alcohols and sterols)-derived lipids in all three size fractions.Molecular composition of particulate and dissolved lipids andbulk stable carbon isotopes demonstrated differences in organicsources along the estuarine gradient with distinct terrestrialsignals in the river and turbid middle estuary and an algal signalin the lower estuary and coastal ocean.
Acknowledgments—We thank D. L. Kirchman for the invitation toparticipate in work on the Delaware Estuary and chlorophylla data,S. A. Macko for carbon and stable carbon isotope measurements, R.Benner for advice on ultrafiltration, and the captain and crew of the R/VCape Henlopen. Constructive comments by Fred Prahl and two anon-ymous reviewers substantially improved the final manuscript.
This work was supported by NSF (OCE-9617892) and the Donors ofthe Petroleum Research Fund of the American Chemical Society.
Contribution No. 3159, University of Maryland Center for Environ-mental Science.
REFERENCES
Albert R. C. (1988) The historical context of water quality managementfor the Delaware Estuary.Estuaries11, 99–107.
Amon R. M. W. and Benner R. (1996) Bacterial utilization of differentsize classes of dissolved organic matter.Limnol. Oceanogr.41,41–51.
Baines S. B. and Pace M. L. (1991) The production of dissolvedorganic matter by phytoplankton and its importance to bacteria:Patterns across marine and freshwater systems.Limnol. Oceanogr.36, 1078–1090.
Barrett S. M., Volkman J. K., Dunstan G. A., and LeRoi J. (1995)Sterols of 14 species of marine diatoms (Bacillariophyta).J. Phyco-logia 31, 360–369.
Benner R. (1991) Ultra-filtration for the concentration of bacteria,viruses, and dissolved organic matter. InMarine particles: Analysisand Characterization(eds. D. C. Hurd and D. W. Spencer), pp.181–185. American Geophysical Union.
Benner R. and Strom M. (1993) A critical evaluation of the analyticalblank associated with DOC measurements by high-temperature cat-alytic oxidation.Mar. Chem.41, 153–160.
Benner R., Biddanda B., Black B., and McCarthy M. (1997) Abun-dance, size distribution, and stable carbon and nitrogen isotopiccompositions of marine organic matter isolated by tangential-flowultrafiltration.Mar. Chem.57, 243–263.
Berdie L., Grimalt J. O., and Gjessing E. T. (1995) Combined fattyacids and amino acids in the dissolved1 colloidal and particulatefractions of the waters from a dystrophic lake.Org. Geochem.23,343–353.
Bianchi T. S., Lambert C. D., Santschi P. H., and Guo L. (1997)Sources and transport of land-derived particulate and dissolved or-ganic matter in the Gulf of Mexico (Texas shelf/slope): The use oflignin-phenols and loliolides as biomarkers.Org. Geochem.27,65–78.
Biggs R. B., Sharp J. H., Church T. M., and Tramontano J. M. (1983)Optical properties, suspended sediments, and chemistry associatedwith the turbidity maxima of the Delaware Estuary.Can. J. Fish.Aquat. Sci.40, 172–179.
Boehm P. D. and Quinn J. G. (1973) Solubilization of hydrocarbons bythe dissolved organic matter in sea water.Geochim. Cosmochim.Acta 37, 2459–2477.
Boon J. J., Rijpstra W. I., De Lange F., De Leeuw J. W., Yoshioka M.,and Shimizu Y. (1979) Black Sea sterol-a molecular fossil fordinoflagellate blooms.Nature (Lond)277,125–127.
Borch N. H. and Kirchman D. L. (1999) Protection of protein frombacterial degradation by sub-micron particles.Aquat. MicrobialEcol. 16, 265–272.
Canuel E. A. and Martens C. S. (1996) Reactivity of recently depositedorganic matter: Degradation -of lipid compounds near the sediment-water interface.Geochim. Cosmochim. Acta 60, 1793–1806.
Cifuentes L. A, Sharp J. H., and Fogel M. L. (1988) Stable carbon andnitrogen isotope biogeochemistry in the Delaware Estuary.Limnol.Oceanogr.33, 1102–1115.
Coates M., Connell D. W., and Barron D. M. (1985) Aqueous solubilityand octan-1-ol water partition coefficients of aliphatic hydrocarbons.Environ. Sci. Technol.19, 628–632.
Coffin R. B. (1989) Bacterial uptake of dissolved free and combinedamino acids in estuarine waters.Limnol. Oceanogr.34, 531–542.
Colombo J. C., Silverberg N., and Gearing J. N. (1996) Lipid biogeo-chemistry in the Laurentian Trough-II. Changes in composition offatty acids and aliphatic hydrocarbons during early diagenesis.Org.Geochem.25, 211–225.
Fox L. E. (1983) The removal of dissolved humic acid during estuarinemixing. Estuarine Coastal Shelf Sci.16, 431–440.
Fry B., Brand W., Mersch F. J., Tholke K., and Garritt R. (1992)Automated analysis system for coupledd13C and d15N measure-ments.Anal. Chem.64, 288–291.
Gomez–Belinchon J. I., Llop R., Grimalt J. O., and Albaiges J. (1988)The decoupling of hydrocarbons and fatty acids in the dissolved and
2234 A. Mannino and H. R. Harvey

particulate water phases of a deltaic environment.Mar. Chem.25,325–348.
Guo L. and Santschi P. H. (1996) A critical evaluation of the cross-flowultrafiltration technique for sampling colloidal organic carbon inseawater.Mar. Chem.55, 113–127.
Guo L. and Santschi P. H. (1997) Isotopic and elemental characteriza-tion of colloidal organic matter from the Chesapeake Bay andGalveston Bay.Mar. Chem.59, 1–15.
Harding L. W. Jr., Meeson B. W., and Fisher T. R. (1986) Phytoplank-ton production in two east coast estuaries: photosynthesis-light func-tions and patterns of carbon assimilation in Chesapeake and Dela-ware Bays.Estuarine Coastal Shelf Sci.23, 773–806.
Harvey H. R. (1994) Fatty acids and sterols as source markers oforganic matter in sediments of the North Carolina continental slope.Deep Sea Res. II41, 783–796.
Harvey H. R. and Macko S. A. (1997) Kinetics of phytoplankton decayduring simulated sedimentation: changes in lipids under oxic andanoxic conditions.Org. Geochem.27, 129–140.
Harvey H. R., Eglinton G., O’Hara S. C., and Corner E. D. S. (1987)Biotransformation and assimilation of dietary lipids by Calanusfeeding on a dinoflagellate.Geochim. Cosmochim. Acta51, 3031–3040.
Hedges J. I. and Parker P. L. (1976) Land-derived organic matter insurface sediments from the Gulf of Mexico.Geochim. Cosmochim.Acta 40, 1019–1029.
Hedges J. I., Cowie G. L., Richey J. E., and Quay P. (1994) Origins andprocessing of organic matter in the Amazon River as indicated bycarbohydrates and amino acids.Limnol. Oceanogr.39, 743–761.
Hoch M. P. and Kirchman D. L. (1993) Seasonal and inter-annualvariability in bacterial production and biomass in a temperate estu-ary. Mar. Ecol. Prog. Ser.98, 283–295.
Jaffe R., Wolff G. A., Cabrera A. C., and Chitty H. C. (1995) Thebiogeochemistry of lipids in rivers of the Orinoco Basin.Geochim.Cosmochim. Acta59, 4507–4522.
Kaneda T. (1991) Iso- and anteiso-fatty acids in bacteria: biosynthesis,function, and taxonomic significance.Microbiol. Rev.55, 288–302.
Kattner G., Gercken G., and Hammer K. D. (1983) Development oflipids during a spring plankton bloom in the northern North Sea II.Dissolved lipids and fatty acids.Mar. Chem.14, 163–173.
Kennicutt M. C. and Jeffrey L. M. (1981) Chemical and GC-MScharacterization of marine dissolved lipids.Mar. Chem.10, 367–387.
Liu Q., Parrish C. C., and Helleur R. (1998) Lipid class and carbohy-drate concentrations in marine colloids.Mar. Chem.60, 177–188.
Macko S. A., Uhle M. E., Engel M. H., and Andrusevich V. (1997)Stable nitrogen isotope analysis of amino acid enantiomers by gaschromatography/combustion/isotope ratio mass spectrometry.Anal.Chem.69, 926–929.
McAuliffe C. (1969) Solubility in water of normal C9 and C10 alkanehydrocarbons.Science163,478–479.
Meyers P. A. (1997) Organic geochemical proxies of paleoceano-graphic, paleolimnologic, and paleoclimatic processes.Org. Geo-chem.27, 213–250.
Meyers P. A. and Ishiwatari R. (1993) Lacustrine organic geochemis-try: an overview of indicators of organic matter sources and diagen-esis in lake sediments.Org. Geochem.20, 867–900.
Meyers–Schulte K. J. and Hedges J. I. (1986) Molecular evidence fora terrestrial component of organic matter dissolved in ocean water.Nature (Lond)321,61–63.
Moran M. A., Pomeroy L. R., Sheppard E. S., Atkinson L. P., andHodson R. E. (1991) Distribution of terrestrially derived dissolvedorganic matter on the southeastern U.S. continental shelf.Limnol.Oceanogr.36, 1134–1149.
Nagata T. and Kirchman D. L. (1992) Release of macromolecularorganic complexes by heterotrophic marine flagellates.Mar. Ecol.Prog. Ser.83, 233–240.
Nagata T., Fukuda R., Koike I., Kogure K., and Kirchman D. L. (1998)Degradation by bacteria of membrane and soluble protein in seawa-ter. Aquat. Microb. Ecol.14, 29–37.
Nichols P. D., Guckert J. B., and White D. C. (1986) Determination ofmonounsaturated fatty acid double-bond position and geometry for
microbial monocultures and complex consortia by capillary GC-MSof their dimethyl disuphide adducts.J. Microbiol. Methods5, 49–55.
Opsahl S. and Benner R. (1997) Distribution and cycling of terrigenousdissolved organic matter in the ocean.Nature (Lond)386,480–482.
Parrish C. C. (1988) Dissolved and particulate marine lipid classes: Areview.Mar. Chem23, 17–40.
Pennock J. R. and Sharp J. H. (1986) Phytoplankton production in theDelaware Estuary: Temporal and spatial variability.Mar. Ecol.Prog. Ser.34, 143–155.
Peterson B., Fry B., Hullar M., Saupe S., and Wright R. (1994) Thedistribution and stable carbon isotopic composition of dissolvedorganic carbon in estuaries.Estuaries17, 111–121.
Prahl F. G. and Pinto L.A. (1987) A geochemical study of long-chainn-aldehydes in Washington coastal sediments.Geochim. Cosmo-chim. Acta51, 1573–1582.
Sargent J. R. and Falk–Petersen S. (1988) The lipid biochemistry ofcalanoid copepods.Hydrobiologia,167/168,101–114.
Sargent J. R. and Henderson R. J. (1986) Lipids. InThe BiologicalChemistry of Marine Copepods(eds. E. D. S. Corner and S. C. M.O’Hara), Chap. 2, pp. 59–110. Oxford.
Sharp J. H. (1995) What not to do about nutrients in the DelawareEstuary. InChanges in fluxes in estuaries(eds. K. R. Dyer and R. J.Orth), pp. 423–428. Olsen and Olsen.
Sharp J. H., Pennock J. R., Church T. M., Tramontano J. M., andCifuentes L. A. (1984) The estuarine interaction of nutrients, organ-ics and metals: A case study in the Delaware Estuary. InThe Estuaryas a Filter (ed. V. S. Kennedy), pp. 241–258. Academic Press.
Sharp J. H., Cifuentes L. A., Coffin R. B., Pennock J. R., and Wong K.(1986) The influence of river variability on the circulation, chemis-try, and microbiology of the Delaware Estuary.Estuaries9, 261–269.
Sholkovitz E. R. (1976) Flocculation of dissolved organic and inor-ganic matter during the mixing of river water and seawater.Geochim. Cosmoschim. Acta40, 831–845.
Sigleo A. C. (1996) Biochemical components in suspended particlesand colloids: Carbohydrates in the Potomac and Patuxent Estuaries.Org. Geochem.24, 83–93.
Strom S. L., Benner R., Ziegler S., and Dagg M. J. (1997) Planktonicgrazers are a potentially important source of marine dissolved or-ganic carbon.Limnol. Oceanogr.42, 1364–1374.
Sun M. and Wakeham S. G. (1994) Molecular evidence for degradationand preservation of organic matter in the anoxic Black Sea Basin.Geochim. Cosmoschim. Acta58, 3395–3406.
Sun M., Wakeham S. G., and Lee C. (1997) Rates and mechanisms offatty acid degradation in oxic and anoxic coastal marine sediments ofLong Island Sound, New York, USA.Geochim. Cosmoschim. Acta61, 341–355.
Thoumelin G., Bodineau L., and Wartel M. (1997) Origin and transportof organic matter across the Seine estuary: Fatty acid and sterolvariations.Mar. Chem.58, 59–71.
Volkman J. K. (1986) A review of sterol markers for marine andterrigenous organic matter.Org. Geochem9, 83–99.
Volkman J. K., Jeffrey S. W., Nichols P. D., Rogers G. I., and GarlandC. D. (1989) Fatty acid and lipid composition of 10 species ofmicroalgae used in mariculture.J. Exp. Mar. Biol. Ecol.128,219–240.
Wakeham S. G. and Beier J. A. (1991) Fatty acid and sterol biomarkersas indicators of particulate matter source and alteration processes inthe Black Sea.Deep-Sea Res.38, S943–S968.
Westerhausen L., Poynter J., Eglinton G., Erlenkeuser H., and Sarn-thein M. (1993) Marine and terrigenous origin of organic matter inmodern sediments of the equatorial East Atlantic: Thed13C andmolecular record.Deep Sea Res.40, 1087–1121.
Wong K. and Munchow A. (1993) Buoyancy forced interaction be-tween estuary and inner shelf: Observation.Continental Shelf Res.15, 59–88.
Yunker M B., Cretney W. J., Fowler B. R., Macdonald R. W.,McLaughlin F.A., and Whitehouse B. G. (1991) On the distributionof dissolved hydrocarbons in natural waters.Org. Geochem.17,301–307.
2235Lipid composition in Delaware Estuary organic matter