managing waiting lines chapter - 13. 13-2 learning objectives describe how queues form. apply...
Post on 20-Dec-2015
216 views
TRANSCRIPT

Managing Waiting Lineschapter - 13
Managing Waiting Lineschapter - 13

13-2
Learning ObjectivesLearning ObjectivesDescribe how queues form.Apply Maister's two “laws of service.”Discuss the psychology of waiting.Describe the essential features of a queuing system.Explain the equivalence of Poisson arrival rates and
exponential time between arrivals.

Queuing SystemsQueuing Systems
A queue is a line of waiting customers who require service from one or more servers.
The queue need not be a physical line of individuals in front of a server, example, being placed on hold by telephone operator.
Servers typically are considered to be individual stations where customers receive service.
In any service system, a queue forms whenever current demand exceeds the existing capacity to serve. Such a situation is bound to occur in any system for which arrivals occur at varying times and service times also vary.
13-3

Different kinds of queuing systemsDifferent kinds of queuing systems
Servers need not be limited to serving one customer at a time. Example, transportation system such as buses, airplanes, and elevators are bulk services.
The consumer need not always travel to the service facility; the server actually may come to the consumer, example, police protection, ambulance service.
The service may consist of stages of queues in a series or of a more complex network of queues. Example, Disneyland, where queues are staged in sequence.
13-4

13-5
Waiting RealitiesWaiting Realities
Inevitability of Waiting: Waiting results from variations in arrival rates and service rates
Economics of Waiting: High utilization purchased at the price of customer waiting. Example, doctor’s clinic.

The Psychology of WaitingThe Psychology of Waiting
Maister’s two laws of service First law deals with the customer’s expectation versus
perceptions. If customer’s receive better service than he or she expects, then the customer departs a happy, satisfied person. He/she will then tell his friends the positive experience; but he/she will also share the bad experience and hurt the service.
Second law states that it is hard to play ‘catch-up-ball’. The first impressions formed during wit time may impact perceptions for rest of the service. Therefore, customer wait time should be managed well.
13-6
The Old Empty FeelingThe Old Empty Feeling
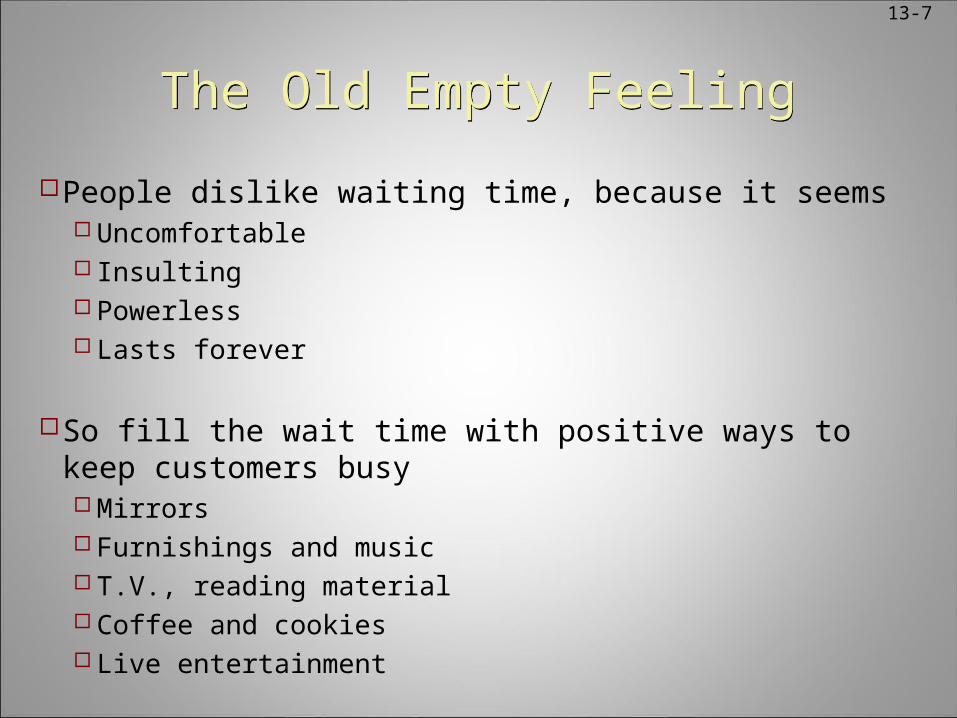
People dislike waiting time, because it seems Uncomfortable Insulting Powerless Lasts forever
So fill the wait time with positive ways to keep customers busy Mirrors Furnishings and music T.V., reading material Coffee and cookies Live entertainment
13-7

A Foot in the DoorA Foot in the Door
Convey to the customer that the service has begun, because they can tolerate the wait much longer than if service has not even started, example,
Handing them menus while they are waiting in the line
Asking them to fill in their medical history
13-8
The Light at the End of the TunnelThe Light at the End of the Tunnel
Anxiety of waiting in a line with unknown wait time is not good. Therefore, telling the customer how long the wait time will be allows the customer to decide whether to wait or not.
If the customer has to wait then a simple explanation and apology for the delay will go a long way in establishing goodwill.
13-9

Excuse me, but I was nextExcuse me, but I was next
FCFS should be the primary rule used for service.
Use ticketing system to determine the priority instead of physical line. The number being served can be displayed so that customer will know how long the wait time will be.
It will also allow customers to wander around and may do some impulse buying.
Such a system will also work well if there are multiple servers
13-10

The Economics of WaitingThe Economics of Waiting Internal customer when kept waiting in line for service or
product – means unproductivity and lost wages.
External customer when kept waiting may mean lost sales
Strategy to avoid lost sale
Conceal the queue from arriving customers, ex., in a hotel divert the customers to the bar so that people cannot be seen as waiting
Disney charges customers outside the park where customers cannot see the lines. Inside, they design the lines in such a way that you cannot see many customers waiting before you.
Design the service to involve the customers to participate in service delivery during wait, ex, filling medical history
Use wait time to educate customers about your new product and services
13-11

13-12
Essential Features of Queuing SystemsEssential Features of Queuing Systems
DepartureQueue
discipline
Arrival process
Queueconfiguration
Serviceprocess
Renege
Balk
Callingpopulation
No futureneed for service

Calling populationCalling population
Calling population is the arrival or input to the system
It may not be homogenous; it may consist of several subpopulations.
Example, arrivals at an outpatient clinic can be divided into walk-in patients, patients with appointments, and emergency patients
Each class of patients has different needs from the service provider and also their waiting expectations are different
13-13

continuedcontinued
In some queuing systems, the source of calls may be limited to a finite number of people.
Example, demands on an office copier by a staff of 3 secretaries
Here, the probability of future arrivals depends on the number of persons who are in the system seeking service. Example, the probability of a future arrival becomes zero once the 3rd secretary joins the copier queue.
13-14

Arrival CharacteristicsArrival Characteristics
Size of the populationPattern of arrivals in the queuing systemBehavior of the arrivals
13-15

Size of populationSize of population
Unless the population is quite small, an assumption of independent arrivals or infinite population usually suffices.
When the number of customers or arrivals on hand at any given moment is just a small portion of potential arrivals, the calling population is considered unlimited.
Most queuing models assume such an infinite calling population.
13-16

Arrival ProcessArrival ProcessThe rate at which the customers arrive is determined by the
arrival process.
Pattern of arrival can be deterministic or random. Typically, we assume random arrival process.
Data are collected by recording the actual times of arrivals, which are then used to calculate inter-arrival times.
Studies show that the distribution of inter-arrival times will be an exponential distribution (see figure 13.3). It has a high frequency at the origin and the long tail that tapers off to the right.
The mean and the standard deviation of exponential distribution are theoretically equal)
13-17

continuedcontinued
The exponential distribution has a continuous probability density function of the form
f(t) = λe-λt t ≥ 0
λ = average arrival rate within a given interval of time (e.g. minutes, hours, days). On average how many arrive within a specified time period.
t = time between arrivals
μ = 1/λ (mean time between arrivals)
e = base of natural logarithms (2.718)
13-18

continuedcontinued
F(t) = 1 – e-λt
Cumulative distribution function, which tells us the probability that the time between arrivals will be time period t or less.
What is the probability that a patient will show up in the next 5 minutes; given that the mean time between arrivals is 2.4 minutes.
μ = 2.4 , therefore , λ = 1/2.4 = 0.4167 arrivals per minute
t = 5
F(5) = 1 – e-0.4167(5)
= 1 – 0.124
= 0.876 = 87.6%
13-19
Poisson DistributionPoisson Distribution
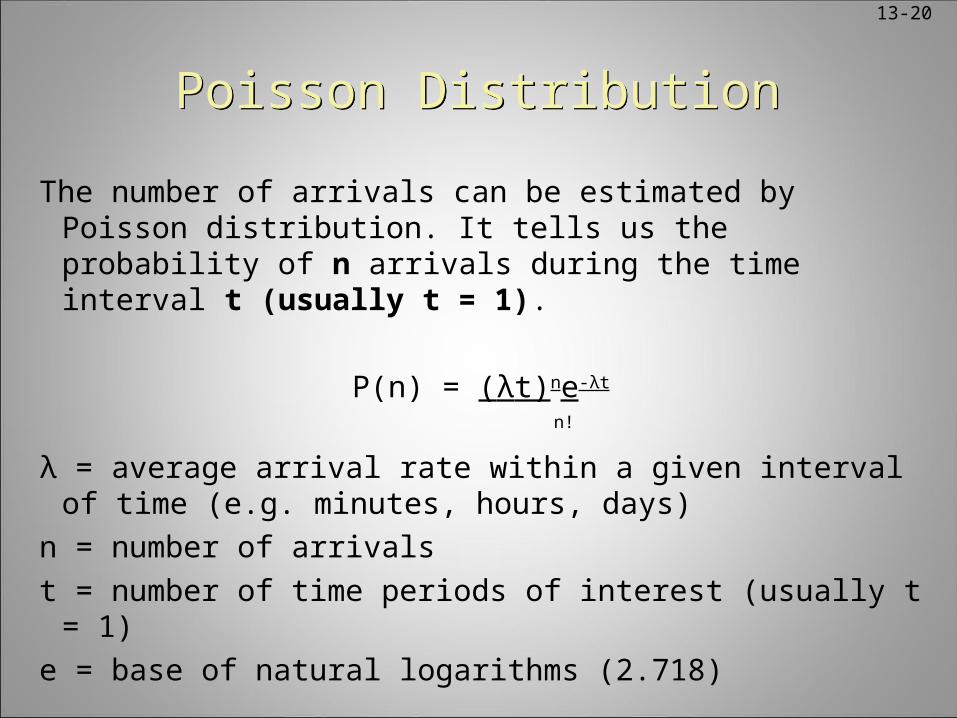
The number of arrivals can be estimated by Poisson distribution. It tells us the probability of n arrivals during the time interval t (usually t = 1).
P(n) = (λt)ne-λt
n!
λ = average arrival rate within a given interval of time (e.g. minutes, hours, days)
n = number of arrivals
t = number of time periods of interest (usually t = 1)
e = base of natural logarithms (2.718)
13-20

continuedcontinued
What is the probability that 2 patients will show up in the next 1 hour; given that the mean time between arrivals is 2.4 minutes.
μ = 2.4 , therefore , λ = 1/2.4 = 0.4167 arrivals per minute
Arrivals in 1 hour, λt = 0.4167 x 60 minutes = 25 arrivals per hr
P(2) = (25)2 e-25 = 625 x (2.7183)-25
2! 2 x 1
Probability that no patient will arrive during 1 hour interval
P(0) = (25)0 e-25 = (2.7183)-25
0!
13-21
13-22
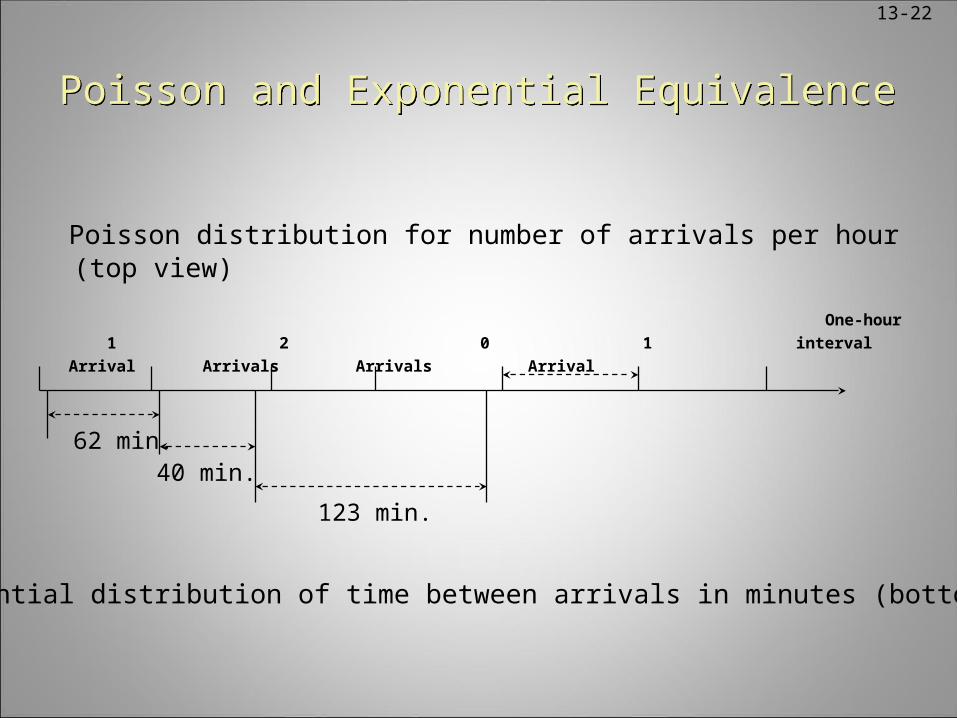
Poisson and Exponential EquivalencePoisson and Exponential Equivalence
Poisson distribution for number of arrivals per hour (top view)
One-hour
1 2 0 1 interval
Arrival Arrivals Arrivals Arrival
62 min.40 min.
123 min.
Exponential distribution of time between arrivals in minutes (bottom view)

Behavior of the arrivalsBehavior of the arrivalsMost queuing models assume that an arriving customer is a
patient customer, they will wait in the Queue until they are served; and they do not switch between lines.
The demand rate during the unit of time should be stationary with respect to time, i.e lambda is a constant; otherwise, the underlying fluctuations in demand rate as a function of time will not be accounted for. This dynamic feature of demand is illustrated in fig. 13.5 for hours in a day; fig. 13.6 for days of a week; and fig. 13.7 for months of the year.
Variation in demand intensity directly affects the requirements for service capacity. When possible, service capacity is adjusted to match changes in demand, perhaps by varying the staffing levels.
13-23

13-24
Temporal Variation in Arrival RatesTemporal Variation in Arrival Rates
0
0.5
1
1.5
2
2.5
3
3.5
1 3 5 7 9 11 13 15 17 19 21 23
Hour of day
Avera
ge ca
lls pe
r hou
r
60708090
100
110120130140
1 2 3 4 5
Day of week
Perc
enta
ge o
f ave
rage
dail
y ph
ysici
an vi
sits

Queue configurationQueue configuration
Queue configuration refers to the number of queues, their locations, their space requirements, and their effects on customer behavior.
Balking refers to customers who arrive but refuse to join the waiting line because it is too long to suit their needs or interests.
Reneging customers are those who enter the queue but then become impatient and leave without completing their transaction.
Jockeying is the line switching activity; when the customer finds another line moving faster than his/her and they switch.
13-25

continuedcontinued
A queue can be limited or unlimited. A queue is limited when it cannot by law or by physical restrictions increase to an infinite length ( example, space in a bank may limit the queue to 10 customers)
Rules that maybe used to serve the arriving customers; typically we use the FCFS
Number of service channels or number of servers, that is single versus multiple
Number of phases or number of service stops that must be made, single versus multiple
13-26
13-27
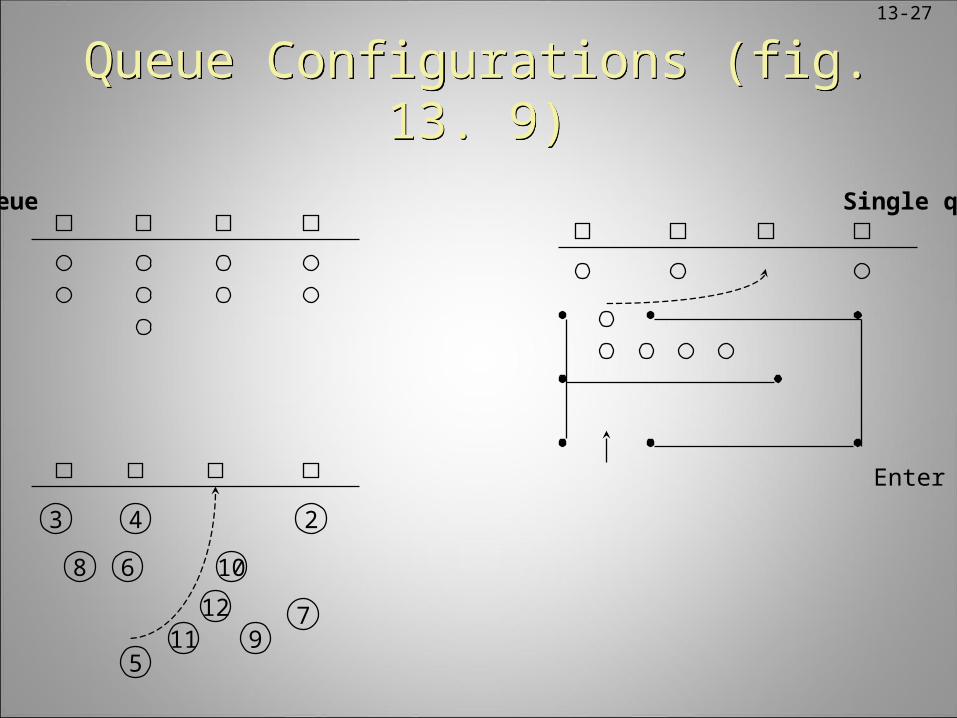
Queue Configurations (fig. 13. 9)Queue Configurations (fig. 13. 9)
Multiple Queue Single queue
Take a Number Enter
3 4
8
2
6 10
1211
5
79

continuedcontinued
Multiple queue alternative (fig. 13.9a)
The arriving customer must decide which queue to join. Of course they can switch
Service provided can be differentiated to attend to different needs; ex. Fast lane for shorter orders
Division of labor is possible, allowing different servers to do different things
Customers have a choice to select the server they prefer
Balking behavior is deterred because lines look smaller than if there was only one line
13-28

continuedcontinued
Single queue (figure 13.9b)
The first person in the line moves to the available service counter
Reneging becomes difficult because customer finds hard to leave the line once more customers gather behind
The arrangement ensures fairness, that is, FCFS rule is applied
There is a single line; thus no anxiety is associated with waiting to see if another line is moving faster
Privacy is enhanced because the transaction is conducted with no one standing immediately behind the person being served
This arrangement is more efficient in terms of reducing the average time that customers spend waiting in line
13-29

continuedcontinued
Variation of single queue system (figure 13.9c)
Arriving customer takes a number to indicate his or her place in the line
There is no need for a formal line; customers can wander around but remain alert to hear their number being called or risk missing their turn for service
Virtual queue
On phone, when it is hard to determine how long is the wait time; but now, they can calculate the average wait time per customer and then the order in which you call they can inform you of the wait time.
13-30

13-31
Queue DisciplineQueue Discipline
Queue
discipline
Static(FCFS rule)
Dynamic
selectionbased on status
of queue
Selection basedon individual
customerattributes
Number of customers
waitingRound robin Priority Preemptive
Processing timeof customers
(SPT rule)

Queue DisciplineQueue Discipline It is the policy established by management to select the next
customer from the queue for service.
Most popular is the FCFS rule; which is static because no information other than position in line is used to identify the next customer for service. So the customers are served in the order they arrive.
Dynamic queue disciplines are based on some attributes of the customer or status of the waiting line. For example, shortest processing time rule will change the order of service of the customer to minimize the average time the customer spends in the system. There are number of other similar rules used to change the dynamic ordering of customers.
13-32

continuedcontinued
In medical setting, they use the procedure known as triage, which gives priority to those who would benefit most from immediate treatment.
Preemptive – here the service currently in process for a person is interrupted to serve a newly arrived customer with higher service urgency; example, what we see in medical facilities
Priority – when the importance of customer decides the order of their service; example, an important customer may not stand in a line but be served personally by the manger.
13-33

continuedcontinued
Number of customers waiting – as a policy measure the organization may open more check out counters once they see more than a certain number of customers in a line. They may also start taking orders from customers in line
Round robin – is used by time shared computer systems, where a customer is given partial service, and then the server moves on to the next waiting customer. Thus customers alternate between waiting and being served.
The queue discipline can have an important effect on the likelihood that a waiting customer will renege – because the rule used to serve will impact the wait time for a customer.
13-34

Service ProcessService Process
The distribution of service times, arrangement of servers, management policies, and server behavior all contribute to service performance.
Service time can be a constant, such as the time to wash a car through an automated car wash.
Typically, the service time is not a constant, example, serving at a fast food window, collecting toll at a bridge – here the service time frequently is exponential distribution.
The distribution of service times is a reflection of the variation in customer needs and server performances.
13-35

Service facility arrangementService facility arrangement
Parallel servers – provides flexibility in meeting variation in demand for service. Management can vary the service capacity by opening and closing service lines to meet changes in demand.
Cross training is important for parallel service
Behavior of service providers is important for success. Under pressure, if provider speeds up, then some customers may interpret as bad quality.
13-36

13-37
Service Facility Arrangements (table 13.1)
Service Facility Arrangements (table 13.1)
Service facility Server arrangement
Parking lot Self-serve
Cafeteria Servers in series
Toll booths Servers in parallel
Supermarket Self-serve, first stage; parallel servers, second stage
Hospital Many service centers in parallel and series, not all used by each patient

13-38
Arrival Process (fig. 13.8)Arrival Process (fig. 13.8)
Static Dynamic
AppointmentsPriceAccept/Reject BalkingReneging
Randomarrivals withconstant rate
Random arrivalrate varying
with time
Facility-controlled
Customer-exercised
control
Arrival process

13-39
Approaches to Controlling Customer WaitingApproaches to Controlling Customer Waiting
Animate: Disneyland distractions, elevator mirror, recorded music
Discriminate: Avis frequent renter treatment (out of sight)
Automate: Use computer scripts to address 75% of questions
Obfuscate: Disneyland staged waits (e.g. House of Horrors)

13-40
The Art of Service Recovery“To err is human; to recover, divine”The Art of Service Recovery“To err is human; to recover, divine”
Measure Cost of Lost Customer
Listen Carefully
Anticipate Need for Recovery
Act Fast
Train Employees
Empower the Frontline
Inform Customers of Improvement

13-41
Topics for DiscussionTopics for Discussion
Suggest some strategies for controlling variability in service times.
Suggest diversions that could make waiting less painful.Select a bad and good waiting experience, and contrast the
situations with respect to the aesthetics of the surroundings, diversions, people waiting, and attitude of servers.
Suggest ways that management can influence the arrival times of customers.
What are the benefits of a fast-food employee taking your order while waiting in line?

13-42
Interactive ExerciseInteractive Exercise
The class breaks into small groups with at least one international student in each group, if possible. Based on overseas travel, each group reports on observations of waiting behavior from a cultural perspective.