managing the risk of cascading failure - irgc
TRANSCRIPT

IRGC - Public Sector Governance of Emerging Risks - Infrastructure Case - November 2012
Richard G. Little
1
Managing the Risk of Aging Infrastructure
Richard G. Little, Senior Fellow,
The Price School of Public Policy, University of Southern California,
Los Angeles, CA 90089 [email protected].
November 2012
This paper was prepared for the International Risk Governance Council (IRGC),
as part of project work on Public Sector Governance of Emerging Risks, and revised following the IRGC
workshop held in September 2012.
Contents
Executive Summary .................................................................................................................... 2
Background ................................................................................................................................ 3
Introduction ............................................................................................................................... 4
Aging Infrastructure and Risk ..................................................................................................... 6
Contributing Factors to Risk Emergence ................................................................................. 13
New Orleans - The “trap” of path dependence ................................................................... 13
Fukushima Daichi – A Failure to Regulate Effectively Leads to Disaster ............................. 20
The August 2003 Northeast Power Outage – A Conflict of Priorities .................................. 23
A Way Forward ........................................................................................................................ 30
References ............................................................................................................................... 35

IRGC - Public Sector Governance of Emerging Risks - Infrastructure Case - November 2012
Richard G. Little
2
Executive Summary
Background
In addition to a degradation of expected service levels, failures of aging infrastructures also pose the
risk of secondary, cascading effects which can have impacts far beyond a simple loss of service. This
paper attempts to demonstrate, through a review of three notable 21st century infrastructure
failures; i.e., the 2003 electrical blackout in the NE United States, the 2005 levee failures in New
Orleans, and the 2011 Fukushima Daiichi nuclear power plant damage following the Tohoku
earthquake and tsunami, that cascading infrastructures failures typically have common roots. These
roots are not generally technological in nature and absent significant changes in organizational and
regulatory mindsets, are not readily amenable to improved engineering or other technical
safeguards. The primary factor contributing to the emergence of this risk is the prevalence of
perverse incentives that typically place long-term and somewhat ethereal goals such as safety at a
comparative disadvantage to shorter term economic or social objectives. These perverse incentives
arise for a number of reasons including asymmetry of timescales, social dynamics, and conflicts
among values and the perception of a threat.
1. Identifying the Risk
The phenomenon of cascading failure is not new but its identification as a distinct class of events is
relatively recent and grows out of the study of complex systems and chaos theory. Charles Perrow
was among the first in the social sciences to ascribe causes beyond simple “human error” to events
with outsized and far reaching consequences. Technological disasters always generate a political
demand for answers as to “what went wrong?” and the near-instantaneous delivery of information
in the age of social media has made knowledge of these events ubiquitous and denial impossible. In
all three of the cases discussed in this paper, although the consequences of failure should have been
readily apparent, the risk that failure could occur was overlooked or ignored. When confronted by a
potentially hazardous situation for which resources to correct it were not available, the institutional
response in all three cases was that preparation was adequate and a hazard did not exist.
2. Managing the Risk
In all three cases, the risk was only officially identified after the fact. Despite independent warnings
about the safety of the New Orleans levees, the vulnerability of Fukushima Daiichi to tsunami, and
the need to manage reactive power carefully during periods of high demand, all three
infrastructures were allowed to run to failure before serious corrective action was take. Typically,
following a major failure, an independent investigative panel is convened that delivers a credible
report on the causes of the event and proposes a range of solutions to prevent the problem from
reoccurring in the future. However, failures continue to occur, and if not a copy of the previous
event, they are sufficiently similar to suggest that the underlying issues have not been addressed.
This approach is not wholly satisfactory because it focuses on failure as an isolated event rather than
a systemic problem. As a result, specific “fixes” essentially are bolted on to systems with underlying
flaws that remain largely uncorrected.

IRGC - Public Sector Governance of Emerging Risks - Infrastructure Case - November 2012
Richard G. Little
3
There are many reasons for this but a major element appears to be the assumption that “well
designed” systems are inherently safe and causes for failure must, therefore, lie outside the system
itself. In a management climate that rewards efficiency and speed of operation, there is little
incentive to adopt approaches that may take longer and cost more to achieve a measure of safely
that is difficult to measure and hence hard to achieve. We usually know whether a system has failed
or not. We rarely know how close and how frequently it approaches a failure point. As a result,
organizations and the bodies that regulate them tend to assume a level of safety that may or may
not exist. When failure does not occur, these assumptions are reinforced with the result that safety
margins are often reduced on no other basis than the system has not failed. The incentive of
measurable financial benefits from reduced safety precautions (inspections, testing, maintenance,
etc.) against an unmeasurable (or at least unmeasured) level of safety usually drives decision-
making. When this behavior becomes ingrained in organizational culture it is very difficult to
implement alternative courses of action.
3. Lessons Learned
The major lesson that should be taken from this effort is that complex infrastructure systems are not
inherently safe, no matter how well designed. The reason for this is that the systems are designed
first and foremost to produce a service, be it electric power or flood defense, not to safe on their
own account. These three events are far from unique and the recurrence of the same institutional
and human factors as underlying root causes suggests that a new paradigm for addressing the risks
of high-consequence infrastructure failures is called for. Rather than seeking an optimal design
solution based on an expected maximum probable demand or hazard event, a more effective way of
addressing these risks may be to assume that a failed condition is actually the stable configuration of
the system. If high entropy governs system behavior, then continuous inputs of financial and
intellectual capital would be required (and expected) to keep the system in an unstable, lower
entropy and “safe” condition. By recasting the problem as one of achieving safety rather than
preventing failure, such investments take on a wholly different meaning and can no longer be
viewed as optional. Without on-going analysis, assessment, planning, testing, maintenance, and
repair, the system will revert to its most stable configuration, i.e., failure.
This story is not all bleak. Institutional behavior in some nations is progressive on this issue and
these are discussed at the end of this paper. More must be done however, to develop and
incentivize organizational culture that values and rewards actions to reduce the risk of infrastructure
failure and its accompanying cascading effects.
Background
Whenever a major piece of infrastructure fails, usually with loss of life and high economic costs, the
question is always raised whether excessive age and poor condition were to blame. The age and
condition of the physical artifacts certainly played a role in recent spectacular infrastructure failures
in the U.S. such as the New Orleans levees in 2005, the I-35 highway bridge collapse in Minneapolis
in 2007, and the San Bruno, California natural gas pipeline explosion in 2010. Not surprisingly, in the
aftermath of such incidents, calls for increased expenditures to “restore the infrastructure” are
heard from the media, public interest groups, and some politicians. However, is it really as simple as
IRGC - Public Sector Governance of Emerging Risks - Infrastructure Case - November 2012
Richard G. Little
4
that? Even if it is indeed true that increased safety and reduced economic loss is a function of the
condition of the infrastructure, is condition directly related to age, and if so, how can we materially
reduce the rate and severity of failure through increased investment, namely, how much is enough
without being too much? These and similar questions have occupied the attention of the
infrastructure asset management community for many years and a definitive solution remains
elusive. However, even in the absence of precise algorithms, there is much that can be done to
reduce the risk of catastrophic infrastructure failure and the human and economic toll it exacts on
society.
Introduction
Civil infrastructure systems are complex networks that are absolutely necessary for the function of
modern society. The ability to move goods, people, energy, and information quickly, safely, and
reliably underpins economic activity at all levels and contributes to the overall quality of life and
well-being. Consequently, governments, businesses, and the public at-large all have a stake in
ensuring that the flow of services provided by infrastructure continues unimpeded in the face of a
broad range of potential threats.
Earthquakes, extreme winds, floods, snow and ice, volcanic activity, landslides, tsunamis, wildfires,
terrorism, and sabotage are active hazards that can damage infrastructure systems and interrupt the
services they deliver. However, aging materials, inadequate maintenance, and excessively prolonged
service lives are passive threats that are more insidious but can be equally disruptive. Additionally,
when systems have been weakened by excessive age or inadequate maintenance, they become
more vulnerable to otherwise survivable events. This paper specifically addresses the risks
associated with aging infrastructure systems, speculates on why they have become so ubiquitous in
both the developing and developed world, discusses examples of where and how these risks have
been addressed proactively, and presents suggestions for more universal guidance for addressing
the risks of aging infrastructure systems.
The Nature of Infrastructure Failure
Infrastructure failures can range from the merely annoying (a brief power outage that requires
resetting digital clocks) to the decidedly catastrophic (the partial core meltdowns and release of
radioactive materials at Fukushima Daiichi). Fortunately, most infrastructure failures are clustered at
the lower end of the consequence scale but notable exceptions do occur. For example, almost all of
the destruction and death that occurred in New Orleans following Hurricane Katrina in 2005 was
caused by the failure of old and poorly maintained levees, not directly by the hurricane itself.
In addition to direct damage caused by extreme natural events such as earthquakes, and malevolent
acts such as sabotage and terrorism, ensuring the reliable delivery of service is further complicated
by the interdependent nature of these systems. For example, infrastructure systems all depend on
electricity to some degree. The reliable delivery of electric power is dependent on a variety of other
systems ranging from railroads for coal deliveries, to cellular and digital communications for system
control, to the public transit that workers take to the generating plant. A failure in any of these
subordinate systems can cause disruptions in the electrical system that can spill over to affect the
IRGC - Public Sector Governance of Emerging Risks - Infrastructure Case - November 2012
Richard G. Little
5
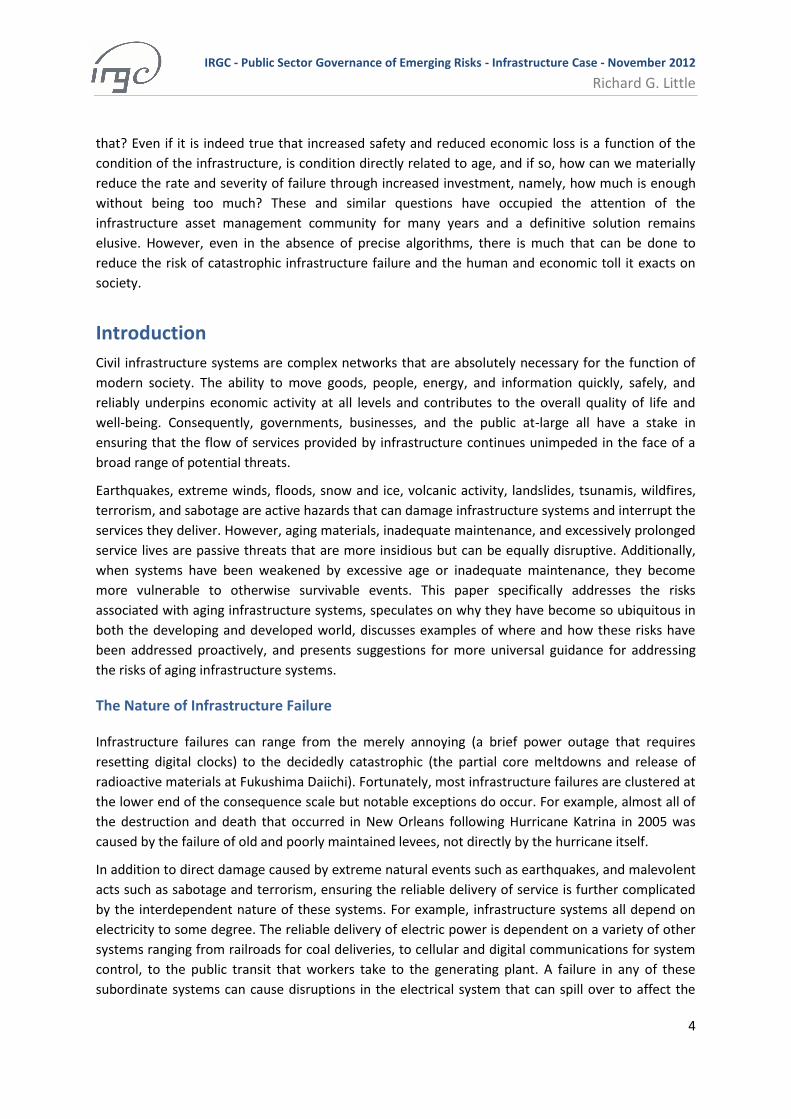
others. Because of this, infrastructure interdependency has become a potential cause of failure in
and of itself similar to the “systemic risk1” exhibited by the financial system during the Great
Depression and the financial crisis of 2007-2009. In both of these financial examples, individual
failures, each manageable on their own, combined with unanticipated and devastating effect to
cause the entire system to collapse. Figure 1 illustrates the complexity of interdependent
relationships that can exist between various infrastructure systems and illustrates how failure in any
one system can affect many others. All of these effects are magnified when the systems themselves
have been weakened by excessive age and inadequate maintenance: “Infrastructure age often acts
together with other factors such as design, maintenance, and operation in increasing the
vulnerability of infrastructure to these threats.2”
Figure 1. The Interdependent Nature of Infrastructure Systems3
1 Systemic risks are characterized by an external triggering event (natural or man-made) that leads to a
cascade of undesirable outcomes. 2 U.S. Department of Homeland Security, 2010.
3 Rinaldi, Peerenboom, and Kelly, 2001.

IRGC - Public Sector Governance of Emerging Risks - Infrastructure Case - November 2012
Richard G. Little
6
Aging Infrastructure and Risk
Risk is a useful analytical concept that gives meaning to those uncertainties of life that pose a danger
to people or what we value4. Risk is often expressed as a combination of the likelihood of an
adverse event, the vulnerability of people, places, and things to that event, and the consequences
should that event occur, i.e., the probability of an adverse event (threat and vulnerability)
multiplied by the consequences of that event, or R = P x C. For example, if we consider the case of
rising sea level, the risk is greater to people living in coastal areas than to those at higher elevations
because of their increased vulnerability to lowland flooding and storm surge and the greater
consequences (to them) if flooding occurs. One of the inherent shortcomings of this simplified,
expected value-type approach to risk is that the structure of the model can produce apparently
similar but grossly misleading determinations of risk for vastly different classes of events. For
example, from an arithmetic standpoint, a catastrophic event with extremely low probability can be
interpreted to have a similar level of “risk” as a relatively frequent event with far lower
consequences.
A more formalized process of risk assessment and risk management can help to illuminate
and deal with these uncertainties at least from the standpoint of understanding the value of
potential mitigating actions. Risk assessment has classically been defined by three questions5:
1. What can go wrong?
2. What is the likelihood that it could go wrong?
3. What are the consequences of failure?
What can go wrong?
As has been discussed previously, infrastructure failures can range from the merely annoying to the
decidedly catastrophic. Events such as power outages of short duration or limited extent, leaks in
distribution water mains, and roadway potholes cluster at one end of the failure spectrum while
bridge collapses, natural gas pipeline explosions, and dam and levee failures occupy the other.
Obviously, there are an essentially unlimited number of infrastructure failure events that can occur
between these two extremes. The risk of aging infrastructure is further complicated by the potential
for systemic, cascading failures resulting from the interconnections and interdependencies between
individual systems. The unpredictability of such cascading failure chains makes it extremely difficult
to state with specificity what, exactly, can go wrong.
How likely is it to occur?
In an ideal world, we would be able to work from empirical data and develop probability distribution
functions for various types of infrastructure failures. The data sets certainly exist to plot histograms
that display the numbers of different types of failures against various independent variables (e.g.,
age, materials, environmental conditions, degree of maintenance, etc.) and are used to develop
deterioration models of the physical systems (electric grid, pipeline networks, roadway pavements).
Although certainly an aid to understanding the physical behavior of these systems and under what
conditions failure is more (or less) likely to occur, they still have far to go in predicting with
4 NRC, 1996.
5 Kaplan and Garrick, 1981.

IRGC - Public Sector Governance of Emerging Risks - Infrastructure Case - November 2012
Richard G. Little
7
confidence the actual probability of failure. Unlike light bulbs or electric motors, infrastructure
systems do not follow straightforward models where the mean time to failure can be determined
and the corresponding probability of failure calculated with a reasonable degree of accuracy.
What are the consequences of failure?
As noted previously, the consequences of infrastructure failure can range from minimal to profound
and will vary widely depending on specific circumstances. A simple water main break can result in
street closures that cause a few minutes’ delay in someone’s daily commute. Although there are
costs associated with such unplanned outages, economies generally absorb them with little effect.
However, a similar water main break could lead to the formation of a sinkhole that caused gas mains
to rupture and set fire to adjacent structures. If the water leak was severe, it could impede fire
suppression activities and result in economic losses and possible human casualties that far exceeded
expectations for a leaking water main. In a similar vein, although the failure of the levees in New
Orleans following Hurricane Katrina in 2005 resulted in over 1,000 deaths and billions of dollars in
damage, the consequences of failure of agricultural levees are relatively trivial by comparison. This is
critical to a full understanding of the “risk” of infrastructure failure because it underscores the point
that the “consequences” component of risk is extremely case specific which will strongly influence
the setting of priorities for risk reduction and the overall resources allocated to risk management.
In addition to the direct consequences of failure, i.e., loss of the asset, collateral physical damage,
human injuries and death, there are secondary economic and social impacts that also arise. Reduced
productivity due to congestion and delay caused by inadequate capacity or unreliable supply is often
cited as a barrier to advancement in the developing world. However, this can be increasingly
expected in the developed world as well if additional capacity and reliability is not provided through
expanded and upgraded facilities or more efficient management of existing capacity. Although
difficult to quantify, infrastructure failures can also lead to social unrest and political change.
California Governor Gray Davis lost a recall election in 2003 partially as a result of poorly
implemented electric deregulation which led to both a spike in consumer prices and rolling
blackouts throughout the state. In the wake of the events at Fukushima Daiichi in 2011, the political
situation in Japan remains unclear despite tentative steps to restart some of the nation’s reactors.
Finally, Italian dictator Benito Mussolini successfully consolidated his power by claiming to “have
made the trains run on time.” Although largely a myth, this example underscores the perceptual
significance that infrastructure reliability can have in the political realm.
As it is an underlying premise of this paper that infrastructure age has the potential to increase the
likelihood of failure and consequently, the risk of such failure, it will be instructive to spend a few
moments considering the validity of that assumption. In and of itself, the age of infrastructure does
not appear to be the primary driver in determining the risk of infrastructure failure—it is neither
necessary nor sufficient for failure to occur. For example, the United States experienced three
significant bridge collapses in the 1980s; the I-95 - Mianus River Bridge in Connecticut, the I-87 -
Schoharie Creek Bridge in New York, and the US 51 - Hatchie River Bridge in Tennessee. Two of the
bridges had been in place for less than 30 years and the Hatchie River Bridge was 54 years old. By
contrast, the Brooklyn Bridge (1883), George Washington Bridge (1931), and Golden Gate Bridge
(1937) are still in service today. What does appear to be the more significant risk factor (certainly in
the cases of the three collapsed U.S. bridges) is the lack of adequate and timely maintenance and

IRGC - Public Sector Governance of Emerging Risks - Infrastructure Case - November 2012
Richard G. Little
8
repair6. This is a key point that can lead to an improved understanding of infrastructure risk and
better informed ex ante policies, guidelines, and regulations to reduce that risk.
The Role of Asset Management in Risk Reduction
Infrastructure asset management has the objective of providing the best possible service to the
users within the constraints of available resources7. Although seemingly clear on its face, achieving
this objective has proved difficult in practice. Because “the best possible service to users” means
different things to different stakeholder groups, the effectiveness of funds spent on infrastructure
maintenance and repair (M&R) cannot be readily measured. As a result, the search for an “optimal”
M&R investment strategy remains something of a Holy Grail to the infrastructure asset management
community and rightly so. Each year, the equivalent of tens of billions of dollars are spent globally
on M&R activities in an effort to maintain satisfactory performance levels for these systems. Public
agencies and private corporations alike grapple with the question of how much should they spend to
maintain their infrastructure assets while at the same time, wonder if they are spending too much
against the possibility of a serious breakdown or loss of service capacity. The desire is, of course, to
avoid spending more than necessary while at the same time, avoiding excessive frugality that could
bring on calamitous outcomes, (e.g., major reconstruction, lengthy road or bridge closures,
catastrophic failure, etc.). This dilemma is illustrated conceptually in Figure 3 where it can be seen
that the optimal M&R strategy will position the vertical line in the decision table so that the risk of
both Type I errors (not doing maintenance when it’s needed) and Type II errors (doing excessive
maintenance) is minimized within the risk tolerance of the decision-makers. Although operating
agencies typically focus on preventing physical failure, M&R strategies should also be targeted at
reducing the broader, and far more threatening, systemic risks of cascading failure. Unpredictable
cascading failures resulting from infrastructure interdependencies pose significant risks both to
government budgets and often the stability of the government itself.
Figure 3. Varying Strategies for Investment in Maintenance and Repair8
Figure 4 shows how the life of an infrastructure asset can be prolonged through timely and
6 NTSB, 1984, 1988, 1990
7 Ben-Akiva, Humplick, Madanat, and Ramaswamy, 1993
8 Little, 2008

IRGC - Public Sector Governance of Emerging Risks - Infrastructure Case - November 2012
Richard G. Little
9
4B1B 2B 3B
ProbableC
4C1C 2C 3C
ImprobableD
4D1D 2D 3D
Consequence
Likelihoo
d
Not serious4
Catastrophic1
Very serious2
Serious3
CertainA
4A1A 2A 3A
Highly probableB
4B1B 2B 3B
ProbableC
4C1C 2C 3C
ImprobableD
4D1D 2D 3D
Consequence
Likelihoo
d
These risks are usually acceptable as part ofa comprehensive risk management strategy.
Risk Level Action Indicated
1A,1B,1C,2A,2B.3A
1D,2C,2D,3B,3C
3D,4A,4B,4C,4D
These are unacceptable risks.Action must be taken to eliminate
or reduce them.These may be unacceptable risks.
These risks may be acceptable as part of acomprehensive risk management strategy.
These risks are usually acceptable as part ofa comprehensive risk management strategy.
Risk Level Action Indicated
4B1B 2B 3B
ProbableC
4C1C 2C 3C
ImprobableD
4D1D 2D 3D
Consequence
Likelihoo
d
Not serious4
Catastrophic1
Very serious2
Serious3
CertainA
4A1A 2A 3A
Highly probableB
4B1B 2B 3B
ProbableC
4C1C 2C 3C
ImprobableD
4D1D 2D 3D
Consequence
Likelihoo
d
4B1B 2B 3B
ProbableC
4C1C 2C 3C
ImprobableD
4D1D 2D 3D
Consequence
Likelihoo
d
Not serious4
Catastrophic1
Very serious2
Serious3
CertainA
4A1A 2A 3A
Highly probableB
4B1B 2B 3B
ProbableC
4C1C 2C 3C
ImprobableD
4D1D 2D 3D
Consequence
Likelihoo
d
These risks are usually acceptable as part ofa comprehensive risk management strategy.
Risk Level Action Indicated
1A,1B,1C,2A,2B.3A
1D,2C,2D,3B,3C
3D,4A,4B,4C,4D
These are unacceptable risks.Action must be taken to eliminate
or reduce them.These may be unacceptable risks.
These risks may be acceptable as part of acomprehensive risk management strategy.
These risks are usually acceptable as part ofa comprehensive risk management strategy.
Risk Level Action Indicated
These risks are usually acceptable as part ofa comprehensive risk management strategy.
Risk Level Action Indicated
1A,1B,1C,2A,2B.3A
1D,2C,2D,3B,3C
3D,4A,4B,4C,4D
These are unacceptable risks.Action must be taken to eliminate
or reduce them.These may be unacceptable risks.
These risks may be acceptable as part of acomprehensive risk management strategy.
These risks are usually acceptable as part ofa comprehensive risk management strategy.
Risk Level Action Indicated
appropriate maintenance and a value for that life extension calculated based on replacement cost.
Conversely, a consequence of inadequate maintenance is the loss of value resulting from the
decreased service life.
Figure 4. The Role of Maintenance and Repair in Extending the Service Life of Infrastructure9
The Risk Management Process
Fortunately, risk can be managed, and, under the appropriate conditions, managed quite effectively.
Figure 5 is a simple decision tool that identifies possible actions based on the likelihood and
consequences of various events. It provides a relatively quick and straightforward method for
identifying where action must be taken to reduce unacceptable risks and where there are more
options for addressing risk. The following section discusses the risk management process.
Figure 5. A Decision Aid for Risk Management
9 NRC, 1993.

IRGC - Public Sector Governance of Emerging Risks - Infrastructure Case - November 2012
Richard G. Little
10
Risk management is the process by which the results of risk assessment are integrated with
other information—such as political, social, economic, and engineering considerations—to arrive at
decisions about the need and methods for risk reduction. Risk management seeks answers to a
second set of questions10:
4. What can be done and what options are available?
5. What are the associated trade-offs in terms of all costs, benefits, and risks?
6. What are the impacts of current management decisions on future options?
It is the answers to these three questions in the context of governance and decision-making that will
attempt to provide some insight into what can be done to reduce the risks from aging and poorly
maintained infrastructure. The empirical evidence certainly suggests that the risk of devastating
systemic failures must be placed on governmental agendas; market forces alone will not be
sufficient to drive individual system operators to take action of their own accord. How governments
respond to this risk will vary, but at the very least actions should include the development of
comprehensive and robust policies that will guide investment management decisions based on
system vulnerability (including age) and aimed at reducing the risk of cascading systemic failures.
Regulation, because of its inflexibility, should be used sparingly but remain an option particularly
when serious injury and loss of life is a potential consequence of failure.
What can be done and what options are available?
Because risk is a product of probability and consequence, risk reduction strategies should focus on
options for reducing one or both of these components. Options for managing the risk of
infrastructure failure can be grouped into five general categories. We can
1. Reduce the consequences of failure through locational decisions. Given the nature of
infrastructure, it must often be located near the people or activities it serves. However,
certain types of facilities can be isolated from human activity through regulatory
requirements for set-backs and buffer zones. In the case of the San Bruno natural gas
pipeline explosion in California in 2010, the close proximity of the pipeline to a
residential area was a contributing cause to eight deaths and the destruction of 38
homes. The estimated cost of this accident to shareholders of Pacific Gas and Electric
(the owner of the pipeline) is between $1.2 billion and $1.3 billion11.
2. Reduce the likelihood of failure by taking countermeasures. The traditional approach for
dealing with leaks and blowouts in water distribution systems is a proactive program of
water main replacement. Using risk assessment principles can help to refine this process
by identifying high-risk mains (i.e., those with a high probability or high consequence of
failure or both). However, repairing mains as they fail may be an economically rational, if
politically unacceptable, approach to the problem as well. Between these two poles lie
other options such as improved response to main breaks to minimize the consequences
and reliance on commercial or self-insurance to cover the cost of damage. Different
strategies have different cost and benefit profiles and are also influenced by the
10
Haimes, 1991. 11
Electric Utility Week, 2012

IRGC - Public Sector Governance of Emerging Risks - Infrastructure Case - November 2012
Richard G. Little
11
organization’s risk tolerance. One consequence of adopting a strategy with a high
tolerance for risk is to defer the inevitable cost of system renewal well into the future.
The accumulated costs of this backlog could seriously hamper the future financial
viability of the system and this is a situation that now confronts many older water
systems that routinely deferred main replacement programs in an effort to reduce costs
to keep rates at acceptable levels. This is illustrated in the table below.
Two Risk-based Options for Asset Management
Less Aggressive Strategy More Aggressive Strategy
Replace pipe when the cost of repair (including all consequential costs) exceeds replacement on an annualized basis. The decision point will be highly dependent on what is included in “consequential costs” and this approach could result in large expenditure at some point in the future as large quantities of pipe reach the end of their useful life and start to fail in a short period of time. This has the potential of having significant societal impacts and associated political implications due to system disruption (Type I Error).
Replace all cast iron pipe (CIP) evenly distributed over its “expected” life prioritized on failure rates and consequential costs (e.g., replace all pipe over a 100-year cycle). This should avoid sudden large expenditures and minimize the annual failure rates but may result in replacing pipe that has many years of useful life remaining (Type II Error). This should minimize societal impacts. While few U.S. utilities are taking this approach, the City of Kobe Japan had replaced nearly all of their CIP with ductile iron pipe (DIP) prior to the 1995 Kobe earthquake for non-earthquake reasons. In general, the Japanese have a more aggressive view of pipe replacement.
3. Spread the risk by choosing multiple redundant locations for certain activities. This has
the effect of both reducing the likelihood that the entire system will fail from a common
cause and will also limit the extent of the effects of a failure.
4. Transfer the risk by buying insurance. The relevance of this option will depend on the
willingness and ability of the commercial insurance industry to underwrite the risk of
infrastructure failure at rates that system owners and operators are able and willing to
pay. Pacific Gas and Electric expects to recover $600 million of the cost of the San Bruno
pipeline explosion through insurance12.
5. Retain the risk. In light of the preceding points, system owners and governments may
have no choice but to accept a portion of the consequences of infrastructure failure.
Catastrophe bonds13, either private (insurance industry) or sovereign (local, state,
federal) may be an option to supplement traditional insurance.
12
ibid. 13
Anderson and Suess, 2006.

IRGC - Public Sector Governance of Emerging Risks - Infrastructure Case - November 2012
Richard G. Little
12
What are the associated trade-offs in terms of all costs, benefits, and risks?
Evaluating alternative risk management strategies from an economic benefit/cost standpoint is
relatively straightforward. The cost (C) of a risk management strategy should be less than the value
of the expected benefits, or
where
p = probability of loss w/o strategy
p* = probability of loss with strategy (p* < p)
L = loss reduction from risk management strategy
r = annual discount rate
T = time horizon for evaluation
This analytical procedure makes no effort to distinguish between who bears the costs and
who reaps the benefits which can lead to the suboptimal allocation of resources. For example,
although all taxpayers underwrite a portion of the national government’s share of the costs to
reduce risk, the benefits generally accrue locally. Although such benefits are often touted as serving
national economic or social goals, they are usually targeted to reach a far narrower audience and as
a result, may not be the best use of limited funds. The equity of such redistributional efforts need to
be considered in decisions to proactively reduce risk. At the same time, trade-offs between
economic costs and benefits and their social and environmental counterparts are inherently
subjective processes that must be defined and evaluated carefully with the input of multiple
stakeholder groups.
What are the impacts of current management decisions on future options?
Regardless of which options (including doing nothing) are selected to address the risk of
infrastructure failure today, they will have implications for the future. Funds expended for
infrastructure renewal to reduce the risk of failure will not be available for other current priorities
(the opportunity cost burden). Funds spent today to reduce the cost to future generations also must
overcome the effects on discounting over time. Depending on the discount rate chosen, the present
economic value of future benefits decreases rapidly with time and it quite rational (if not necessarily
moral) to assign little or no “value” to the future. This dilemma is particularly acute in the climate
change debate where some would have the present make enormous investments, in terms of both
direct capital outlays and lost opportunity cost, for the benefit of unknown future generations where
the benefits count for little in terms of net present economic value. Arguably, a similar
incompatibility of timescales is a fundamental driver in what is seen as widespread disinvestment in
infrastructure.

IRGC - Public Sector Governance of Emerging Risks - Infrastructure Case - November 2012
Richard G. Little
13
Contributing Factors to Risk Emergence
The International Risk Governance Council (IRGC) has identified twelve contributing factors that
provide “fertile ground” for the emergence of risks and either allow new risks to emerge or amplify
their effects in their early stages14. These contributing factors are shown in Figure 6 and serve to
underscore the reality that much of what is typically assumed to be the origin of technological risks
such as aging infrastructure, is not, in fact, technical. As will be demonstrated in several examples,
some of the major infrastructure failures that have occurred in the recent past have their origins
more in failures of institutions and governance than in engineering, construction, and maintenance.
Factor #1 Scientific unknowns
Factor #2 Loss of safety margins
Factor #3 Positive feedback
Factor #4 Varying susceptibilities to risk
Factor #5 Conflicts about interests, values, and science
Factor #6 Social dynamics
Factor #7 Technological advances
Factor #8 Temporal complications
Factor #9 Communication
Factor #10 Information asymmetries
Factor #11 Perverse incentives
Factor #12 Malicious motives and acts
Figure 6. Twelve Contributing Factors to Risk Emergence
New Orleans - The “trap” of path dependence15
A recent U.S. example will demonstrate how a chain of decisions over time can create a path
dependence that is difficult, if not impossible, to deviate from. From its founding, New Orleans was
subject to Mississippi River flooding and periodic hurricanes and storm surge. Since most of the city
lies just a few feet above sea level, flooding also routinely occurs during the intense spring and
summer rainfalls. As a result, for many years development was confined to the higher areas near the
Mississippi River levees. However, in the latter part of the nineteenth century, development began
to expand into the swampy areas closer to Lake Pontchartrain, necessitating construction of
additional levees and a drainage system for the city’s lower-lying areas. Further development of this
land occurred after World War I and again following World War II, when the Lakeview, City Park,
Fillmore, Gentilly, and Pontchartrain Park areas behind the lakefront emerged as desirable
residential communities16.
14
IRGC, 2010. 15
This summary is largely drawn from “Building Walls Against Bad Infrastructure Policy in New Orleans” by Peter Gordon and Richard Little, January 2009, The Mercatus Center, George Mason University, Fairfax, VA. 16
Rogers, 2006.

IRGC - Public Sector Governance of Emerging Risks - Infrastructure Case - November 2012
Richard G. Little
14
Recognizing the drainage problems facing a city with so much land lying near or below sea level, the
Louisiana legislature established the New Orleans Sewerage and Water Board (S&WB) in 1899 to
construct and operate water, sewerage, and drainage works to be funded by a voter-approved
property tax. The S&WB merged with the existing Drainage Commission in 1903 and began building
drainage canals and pumping stations throughout the city. Not surprisingly, this set off a building
boom that not only rapidly increased land values but also exacerbated the drainage problem by
dramatically increasing the amount of impervious surface from roads and roofs. Today the S&WB is
responsible for draining 95.3 square miles of New Orleans and neighboring Jefferson Parish.
The Louisiana legislature similarly established the Orleans Levee District in 1890. The District is
responsible “for the operation and maintenance of levees, embankments, seawalls, jetties,
breakwaters, water basins, and other hurricane and flood-protection improvements surrounding the
City of New Orleans, including the southern shores of Lake Pontchartrain and along the Mississippi
River.” At the federal level, the U.S. Army Corps of Engineers (USACE) became heavily involved with
the city’s drainage canals in 1955 following Congressional studies that later led to the authorization
of the Lake Pontchartrain and Vicinity Hurricane Protection Project (LP&VHPP) in 1965. The USACE
was charged with designing and building improved levees, the Orleans and Jefferson Parish Levee
Districts with levee maintenance, and the S&WB with operation and maintenance of the pumping
stations. To protect the city from a Lake Pontchartrain storm surge, the USACE initially prepared
designs for floodgates on the drainage canals near where they entered the lake. However, a judicial
ruling in 1977 precluded this option on environmental grounds, which led the USACE to abandon
flood gates and begin planning to raise the height of the levees. Raising the levees by adding soil to
the embankments was not feasible in many locations because residential development had
encroached on the landside of many levees, effectively preventing any lateral expansion. As a result,
the USACE opted to build a series of floodwalls on top of the existing levees. The LP&VHPP, which
Congress authorized following Hurricane Betsy in 1965, was still not complete when Hurricane
Katrina struck in 2005.
Nature tested the effectiveness of this flood protection “work in progress” on August 29, 2005,
when a storm surge in Lake Pontchartrain, driven by Hurricane Katrina, entered the city’s drainage
canals and caused water levels to rise to more than seven feet above Mean Gulf Level (MGL), a
height never before reached. Multiple levee and floodwall failures as a result of overtopping and
poor design, construction, and maintenance allowed water from Lake Pontchartrain and Lake
Borgne to enter the city and cause widespread flooding. When floodwaters inundated the electrical
generators for the S&WB drainage pumps, New Orleans lost the ability to counter the flood waters,
which continued to rise until water levels equalized several days later.
Contributing Factors
Assessing the New Orleans disaster by means of the IRGC Contributing Factors to Risk Emergence
will facilitate its understanding as well as provide a means of comparing it to other events discussed
subsequently in this paper.
Factor #1: Scientific Unknowns
The science of flood defense is certainly straightforward even if its application is not. Hydrology
generates a demand function that must be countered with structural, soils, and hydraulic

IRGC - Public Sector Governance of Emerging Risks - Infrastructure Case - November 2012
Richard G. Little
15
engineering; all technologies that have been well defined for many years. Katrina was not an
unusually powerful hurricane and certainly within the design parameters of the New Orleans levees
even if the levees themselves were not constructed accordingly. Given the failure sequence of the
levees, the subsequent flooding and its impacts were certainly predictable.
Factor #2: Loss of Safety Margins
The levees were designed based on an incorrect elevation datum and were poorly constructed and
inadequately maintained. All of these factors reduced normal and routine safety margins.
Factor #3: Positive Feedback
Once the levees breached and New Orleans flooded, a chain of events was set in motion that caused
the situation to deteriorate rapidly. Electricity, communications, and transportation failed which
made coordination and response difficult. Public safety organizations suffered from personnel
absences and the loss of the Emergency Operations Center (EOC) to floodwaters which further
complicated any response. All of these direct impacts were compounded by an almost total lack of
preparedness for what was a predictable initiating event.
Factor 4: Varying susceptibilities to risk
Most of those directly impacted by the flooding in New Orleans were poor or working class people
who occupied homes that were built on reclaimed land allegedly “protected” by the levees. Had
these people not been enticed onto less costly land on the assumption that the levees would keep
them safe, both the human and economic scale of the disaster would have been much less.
Factor #5: Conflicts about interests, values, and science
For the most part, there was relatively little conflict concerning the levees. Although most of those
in authority knew or should have known that the levees possessed serious weaknesses, there was
little effort to publicize and correct them. Funding to do so was not available and not likely to be
made available. Those who did question the safety of the levees were met with assurances that
proved to be empty.
Factor #6: Social dynamics
The socio-economic profile of New Orleans had been trending downward for several decades prior
to Katrina. As a result, more people without effective means to protect themselves and their homes
and property and to evacuate quickly were concentrated in the areas of highest impact. This
contributed greatly to the loss of life.
Factor #7: Technological advances
Had objective, ex ante assessments been made of the safety of the levees and the risk of
concentrating so many vulnerable people in areas that would be inundated, the scope and scale of
the disaster quite likely would have been greatly reduced. Failure to develop these assessments and
take action based on them was a major contributing factor to the disaster.
Factor #8: Temporal complications
The institutional, financial, and technical conditions leading up to the levee failures took decades to
coalesce and ripen into the “failure waiting to happen” that unfolded over a matter of hours. The

IRGC - Public Sector Governance of Emerging Risks - Infrastructure Case - November 2012
Richard G. Little
16
complacency that builds up when infrastructures do not fail, despite profound neglect, is a
significant factor in the scale of the consequences when they do.
Factor #9: Communication
Katrina made landfall well before the storm surge in Lake Pontchartrain caused the first levee
breach. The storm’s high winds and rain caused widespread electrical and communication outages
which made coordination and cooperation difficult in the immediate aftermath of the failures and
greatly affected rescue and recovery operations. People trapped in flooded homes were reduced to
waving bed sheets at passing helicopters or waiting for volunteers to float by in small boats.
Factor #10: Information asymmetries
Communication failures contributed greatly to information asymmetries before, during, and after
the levees failed. The New Orleans EOC flooded early in the event and was not accessible to public
safety personnel. The Mayor, who had authority to order the City evacuated, received conflicting
reports on the location and extent of flooding, and those on the scene were unable to transmit
timely information due to the communication failures. This situation persisted for several days.
Factor #11: Perverse incentives
There is always conflict between spending to avoid an adverse outcome or on something that
produces a more immediate and observable benefit. This is actually at the heart of the issue of
mitigating the risk of infrastructure failure; monies spent to address failures that never occur often
are considered wasted by the public and policy-makers alike. This makes it politically difficult to “do
the right thing” and much easier to do the opposite.
Factor #12: Malicious motives or acts
Despite the claims of some conspiracy theorists, there is no evidence that the levees were allowed
to fail in order to facilitate the depopulation of New Orleans of poor and minority voters.
Decisions that encouraged the growth of New Orleans and then required the building of flood works
to enable that growth effectively precluded other management approaches to the flood risk. Once
the size of the population and the value of the constructed environment achieved certain
thresholds, there was little to do but to keep investing in large protective flood works that in turn,
encouraged still more people to locate in harm’s way. However, these large investments were
actually counter-productive and magnified the scale of the ultimate disaster when the infrastructure
failed.
At this point, New Orleans and the United States are faced with another set of decisions that will
affect the city and its residents far into the future—to continue with the failed policies of the past or
to seek a more harmonious and equitable balance with the forces of nature, the desires of man, and
basic economics. Hurricane Katrina demonstrated what can happen when the risk management
process is manipulated to produce a comforting but inaccurate depiction of likely events. How might
have events been different if a widely-disseminated flood risk assessment for New Orleans had read:
In the event of a stronger than usual but not uncommon intensity hurricane, it is
highly likely that the levees will be breached or otherwise fail in a number of
IRGC - Public Sector Governance of Emerging Risks - Infrastructure Case - November 2012
Richard G. Little
17
locations with the result that hundreds to thousands of mostly poor people will
perish and damage in the billions of dollars will accrue.
Actions taken to develop and implement comprehensive hazard mitigation strategies for
infrastructure must be based on a balanced assessment of all risks confronting the systems and the
possible consequences of their failure, either singly or in combination with other, interconnected
systems. These strategies must be informed by the best available information and carried out by
people knowledgeable about the systems, their possible failure modes, the implications of
concurrent system failures, and possible interventions that would allow systems to degrade
gracefully and avoid catastrophic, multi-system failure.
Framing and Implementing Effective Solutions
In many ways, physical infrastructure is much like a living thing which goes through a process of
creation, growth, maturation, decline, and death. Unlike natural systems, though, physical systems
cannot sustain themselves; they must be renewed from without in the form of maintenance, repair,
renewal, and replacement on a more or less continuous basis. These sustaining actions require us to
invest capital, materials, labor, and other resources. Depriving a physical system of funding for
maintenance and repair, for example, will have a similar effect to depriving a living organism of food
or water—it will decline and ultimately, die.
Despite our obvious dependence on infrastructure and the services it provides, we are sceptical of
calls for increased investment to maintain existing systems and build new ones to replace the old.
We balk at providing additional funding to agencies charged with maintaining infrastructure and
don’t seem to find it illogical to argue against paying for infrastructure while still demanding its
services. Unfortunately, the warning signs of infrastructure in distress are subtle and mapping
infrastructure condition to its performance is by no means a straightforward exercise. Figure 7 is a
conceptual model that arguably depicts the qualitative relationship between condition and
performance for many infrastructure systems and components and illustrates how temporal
considerations (risk factor #8) can foster the emergence of risk. When physical condition is very
good, performance will be high; conversely, when the condition of infrastructure is very bad,
performance will suffer. However, there is a considerable range over which condition deteriorates
without noticeably affecting performance and this is where temporal considerations come into play.
The model suggests that M&R investments made during the mid-life of infrastructure will not
noticeably improve performance and could even prove counter-productive by leading decision-
makers to believe that investment in routine inspection, maintenance, and repair is an unnecessary
expense that can be deferred without penalty. Unfortunately, this difference in time scales fosters a
“tipping point” environment for failure. Although the time to failure for infrastructure may be quite
long, once failure begins, it proceeds rapidly and irreversibly. In other words, once the levee breaks
or the bridge is falling, it is too late to consider repairs.

IRGC - Public Sector Governance of Emerging Risks - Infrastructure Case - November 2012
Richard G. Little
18
Figure 7. Infrastructure Condition Affects Its Performance Mostly at the Extremes
This is not new information. Those forced to operate systems on shoestring budgets have known for
decades just how vulnerable infrastructure is to chronic disinvestment. The U.S. National Academies
and others have published numerous reports calling for more enlightened investment policies for
infrastructure, a truly national asset. In 2002, John Marburger, science advisor to President George
W. Bush, warned the U.S. Congress about the interdependencies among infrastructure and their
potential for exactly the sort of cascading failure that occurred in New Orleans in 200517.
The previous discussion tacitly assumed that the probabilities and consequences of adverse events
are produced by physical and natural processes that can be objectively quantified by risk
assessment. Paul Slovic, a noted expert on risk perception, points out that much social science
analysis rejects this notion, arguing instead that human beings have invented the concept of risk to
help them understand and cope with the dangers and uncertainties of life. Although these dangers
are real, he maintains that there is no such thing as “real risk” or “objective risk.” From his
perspective, the theoretical models used by risk analysts to quantify risk are just as subjective and
assumption-laden and dependent on individual judgment as the implicit value judgments reached by
lay persons. As a result, he sees risk definition as an exercise in power wherein whoever controls the
definition of risk controls the risk management solution18. Thus, before a “risk” can rise to actionable
status, it must be recognized as a threat and this is shaped as much by perception as by objective
risk assessments. Figure 8 displays a ranking by laypeople of various hazards based on the level of
dread it inspires and the degree to which the hazard is understood. Hazards in the upper right hand
quadrant constitute the greatest perceived risks and are those for which the public generally
demand regulatory action or other government controls (e.g., nuclear power and nuclear weapons).
Figure 8 also provides useful clues as to why the public may not see aging infrastructure as a
17
Marburger, 2002. 18
Slovic, P. 2003. Slovic, P and E. U. Weber. 2002.

IRGC - Public Sector Governance of Emerging Risks - Infrastructure Case - November 2012
Richard G. Little
19
significant risk (bridges are found in the lower left hand quadrant) and why they do not demand
actions to address it; particularly in light of the fact that they rightly perceive that, as taxpayers and
consumers, they probably will bear most of the cost.
Figure 8. The Perceptions of Lay People Regarding Various Risks19
There are exceptions, of course. Catastrophic failure frequently creates a favorable climate for M&R
investment. Figure 9 illustrates how awareness levels rise sharply following a dramatic event, and it
was during one such “teachable moment” that the U.S. Highway Bridge Replacement and
Rehabilitation Program (HBRRP) came into existence. Made dramatically aware of bridge safety
following a number of bridge collapses in the 1970’s and 1980’s that were traced to faulty inspection
programs and underinvestment in M&R (NTSB, 1984; 1988; 1990), the U.S. Congress demanded that
the nation’s bridges be made safe and appropriated the funds to do so. Although such reactionary
programs are usually effective in forcing resources onto an issue, they are rarely the most cost-
effective way of achieving their intended results. The subjective nature of risk perception and the
political press for immediate action can lead to questionable decision-making. For example,
following the events at Fukushima Daiichi, the German government made a decision to discontinue
the use of nuclear power nationally despite the fact that the Japanese reactors performed
reasonably well in the face of a massive earthquake and were overwhelmed only by a tsunami of
unanticipated magnitude. Germany is not subject to significant earthquake or tsunami risk, and the
discontinuance of nuclear power will complicate the country’s attainment of long-established goals
for the reduction of greenhouse gas emissions thus underscoring the difficultly of driving public
policy decisions based purely on technical evidence. It is noteworthy that Japan, directly affected,
shut down its nuclear generating capacity for safety inspections in the immediate aftermath of the
Fukushima disaster but has made the decision to restart some reactors.
19
Slovic, 1987

IRGC - Public Sector Governance of Emerging Risks - Infrastructure Case - November 2012
Richard G. Little
20
time
Aw
are
ness L
evel
Level of Sustained Interest
The “Teachable Moment”
time
Aw
are
ness L
evel
Level of Sustained Interest
The “Teachable Moment”
Figure 9. “Teachable Moments” Following a Noteworthy Event Can Drive Political Action
Organizational Aspects of Failures in Large Technical Systems
Although improvements to technology and a better understanding of system interdependencies are
necessary to ensure the reliable provision of infrastructure services, organizations and their internal
cultures play a key role in the provision of these services. The following discussion presents the case
that human capital and institutional resilience (the socio-technological interface) are as important to
the performance of the overall system as the physical assets and must be incorporated into effective
risk reduction strategies20.
Fukushima Daichi – A Failure to Regulate Effectively Leads to Disaster21
On March 11, 2011, a magnitude 9.0 earthquake occurred 80 km off the east coast of Japan and
generated a tsunami that killed tens of thousands of people and devastated coastal communities.
The Fukushima Daiichi nuclear power station, consisting of six reactors owned and operated by
Tokyo Electric Power Company (TEPCO), was effectively destroyed by the tsunami that was
estimated to have reached a height of 14 meters at the plant site. Although the reactors shut down
as designed when triggered by the earthquake, the plant’s seawater cooling pumps were damaged
by the tsunami and its emergency electrical generators flooded. As a result, Fukushima Daiichi was
20
Little, 2004. 21
This summary is based in large part on “Fukushima in review: A complex disaster, a disastrous response” by Yoichi Funabashi and Kay Kitazawa, 2012, Bulletin of the Atomic Scientists, 68(2) 9–21; “Why Fukushima Was Preventable” by James M. Acton and Mark Hibbs, March, 2012, The Carnegie Endowment for International Peace, Washington, DC: and “The Official Report of the Fukushima Nuclear Accident Independent Investigation Commission,” 2012, The National Diet of Japan.

IRGC - Public Sector Governance of Emerging Risks - Infrastructure Case - November 2012
Richard G. Little
21
left without the means to cool the shutdown reactors and spent nuclear fuel stored on-site. The
resulting explosions and fires released high levels of radioactive contamination into the air, ocean,
and on land.
Early assessments of the causes of the Fukushima Daiichi disaster point to multiple contributing
factors that if addressed proactively could have prevented (or at least significantly reduced) much of
the environmental and physical damage, and resultant economic losses, that occurred. First and
foremost, the earthquake was possibly the strongest ever recorded in Japan and certainly larger
than the design-basis earthquake for Fukushima Daiichi. Although TEPCO initially claimed that direct
earthquake damage to the plant was negligible, the report of the Fukushima Nuclear Accident
Independent Investigation Commission questions that assessment. The larger than anticipated
earthquake generated a tsunami for which the plant was not at all prepared despite warning signals
that seaside nuclear stations could be particularly vulnerable to tsunami and storm surge, TEPCO’s
own studies, as well as data from the historical record that indicated that very large tsunamis have
been far from rare along the Japanese coast. Fukushima Daiichi’s design-basis tsunami was 3.1
meters; a 2002 study led to a revised design-basis tsunami of 5.7 meters but no structural
modifications were ever implemented to address the difference. On March 11, 2011 the seawater
cooling pumps were located 4.0 meters above sea level and the diesel generators 10 meters above
sea level. Figure 10 illustrates where these facilities emergency were located in relation to sea level.
Contributing Factors
In light of both the severity and complexity of the Fukushima Daiichi disaster, it will be instructive to
review it through the lens of the IRGC’s “Contributing Factors to the Emergence of Risk.”
Factor #1: Scientific Unknowns
It has become apparent after the fact that the historical record of earthquakes and tsunamis in and
around Japan should have dictated much larger design-basis events for these hazards. Neither was
an event so large that it could have legitimately been classified as “unanticipated.” Similarly, none of
the technical problems at the plant that arose in the aftermath of the tsunami should have been
unexpected given the predictable scenario that played out.

IRGC - Public Sector Governance of Emerging Risks - Infrastructure Case - November 2012
Richard G. Little
22
Figure 10. Schematic Layout of Fukushima Daiichi Reactor22
Factor #2: Loss of Safety Margins
The design-basis tsunami was inadequate to address the actual risk so there actually was no safety
margin for tsunami protection. When a larger (although still inadequate) design-basis event was
calculated in 2002, modifications were not undertaken to address it. Both the seawater cooling
pumps and the emergency diesel generators were placed at too low an elevation to survive even a
much smaller event.
Factor #3: Positive Feedback
The damage to the seawater cooling pumps and emergency electrical power both contributed to the
“loss of coolant” accident which led to the partial core meltdown(s) and overheating of spent fuel
and resultant fires and explosions. These cascading failures were the immediate cause of the release
of radiation to the atmosphere and the resultant radioactive environment greatly complicated
emergency response and regaining control of the situation.
Factor 4: Varying susceptibilities to risk
Many people in the local communities derived their livelihoods from farming, aquaculture, and
fishing. These occupations were particularly impacted by the release of radioactivity to the
environment and it is doubtful that there will be any recovery within the lifetimes of those directly
affected.
Factor #5: Conflicts about interests, values, and science
As a nation without significant energy resources, Japan has long embraced nuclear power. However,
because of the terrible legacy of Hiroshima and Nagasaki, there arose what Funabashi and Kitazawa
have termed the “myth of absolute safety” concerning the nuclear industry. They contend that the
need to foster this myth has precluded meaningful discussion of the risks of nuclear energy with the
public and a reluctance to implement safety and emergency preparedness measures that are routine
in other nations with nuclear power plants.
Factor #6: Social dynamics
The nature of Japanese society and its reluctance to question authority has probably enabled the
industry both to perpetuate the myth of absolute safety and stifle public scrutiny and discussion of
safety and risk. Kiyoshi Kurokawa, chairman of the Independent Investigation Commission, said the
crisis was “Made in Japan” resulting from the “ingrained conventions of Japanese culture.”
Factor #7: Technological advances
This factor appears to have been operating in reverse in the case of Fukushima Daiichi. Despite
increasing awareness of emergent risks such as the vulnerability of nuclear power plants to tsunami
and storm surge, indicated structural improvements and designed changes were not pursued. Both
Acton and Hibbs and Funabashi and Kitazawa also cite examples where the overly close relationship
22
Source: James M. Acton and Mark Hibbs, Why Fukushima Was Preventable (Washington, D.C.: Carnegie Endowment for International Peace, 2012, 9. Reprinted with permission.
IRGC - Public Sector Governance of Emerging Risks - Infrastructure Case - November 2012
Richard G. Little
23
between the industry and government regulators led to regulatory capture23 and the failure to
implement international or even Japanese best practices other than for seismic design at Fukushima
Daiichi.
Factor #8: Temporal complications
Fortunately, major tsunamis are rare events but this appeared to work to the detriment of the
design of Fukushima Daiichi. The historical record, which contains evidence of several very large
tsunamis, was either not researched sufficiently or the findings ignored. Without personal
knowledge of such events among designers, reviewers, and regulators, their significance can easily
be overlooked. Additionally, the difficulty in contextualizing one thousand year or ten thousand year
design events within the span of human lifetimes and political terms in office further exacerbates
this problem.
Factor #9: Communication
For reasons previously mentioned, there was little open and frank discussion in Japan of the risks of
nuclear power, ways to mitigate the risks, or emergency preparedness among the civilian
population. Such discussion is incompatible with the myth of absolute safety.
Factor #10: Information asymmetries
Such asymmetries always exist in the regulation of complex technologies and it normally requires
aggressive stakeholder involvement to force full disclosure into the public domain. As previously
noted, both Japanese social mores and an industry fixation on the myth of absolute safety conspired
against such information sharing or citizen demand for it.
Factor #11: Perverse incentives
The tight-knit Japanese nuclear community appears to owe its first loyalty to itself and the overly
close relationship between the regulators and regulated has led to regulatory capture. As a result,
non-seismic design issues were overlooked or ignored, and emergency preparedness and safety
exercises were restricted in scope if planned at all. Contrary to international best practice, such
exercises were not required by regulators.
Factor #12: Malicious motives or acts
This factor does not appear to have played any role in the Fukushima Daiichi disaster. Although
many human and institutional failures have been noted, there is no evidence that anyone acted
deliberately to make the situation worse.
The August 2003 Northeast Power Outage – A Conflict of Priorities
The North American electricity infrastructure represents more than $1 trillion (U.S.) in asset value,
more than 200,000 miles—or 320,000 kilometers (km) of transmission lines operating at 230,000
volts and greater, 950,000 megawatts of generating capability, and nearly 3,500 utility organizations
serving well over 100 million customers and 283 million people. Providing reliable electricity is an
enormously complex technical challenge, even on the most routine of days. It involves real-time
23
Regulatory capture occurs when a regulatory agency, created to act in the public interest, instead advances the commercial or special interests that dominate the industry or sector it is charged with regulating.

IRGC - Public Sector Governance of Emerging Risks - Infrastructure Case - November 2012
Richard G. Little
24
assessment, control and coordination of electricity production at thousands of generators, moving
electricity across an interconnected network of transmission lines, and ultimately delivering the
electricity to millions of customers by means of a distribution network. On August 14, 2003 much of
the northeastern United States and neighboring parts of Canada suffered a massive cascading failure
in the electric grid. The blackout began within the First Energy system in Ohio and rapidly spread in
all directions as sections of the grid shut down to isolate the damage. The outage affected an area
with an estimated 50 million people and 61,800 megawatts (MW) of electric load in the states of
Ohio, Michigan, Pennsylvania, New York, Vermont, Massachusetts, Connecticut, New Jersey and the
Canadian province of Ontario. The blackout began a few minutes after 4:00 pm Eastern Daylight
Time (16:00 EDT), and power was not restored for 4 days in some parts of the United States. Parts of
Ontario suffered rolling blackouts for more than a week before full power was restored. There were
widespread failures in interdependent infrastructures (transportation, communications, water and
sewer) and ultimately tens of millions of lives were disrupted. Estimates of total costs in the United
States range between $4 billion and $10 billion (U.S. dollars). In Canada, gross domestic product was
down 0.7% in August, there was a net loss of 18.9 million work hours, and manufacturing shipments
in Ontario were down $2.3 billion (Canadian dollars)24.
Contributing Factors
As with the New Orleans levees and Fukushima Daiichi, the IRGC “Contributing Factors” for
emerging risk should help to shine some light on what occurred on August 14, 2003.
Factor #1: Scientific Unknowns
Although the U.S. electrical grid is very large and extremely complex, it operates according to rather
basic physical principles. A lack of understanding of these basic principles by FirstEnergy personnel
was not a major contributing cause of the blackout. The system was operating in a reliable state less
than one hour before the blackout began thus strongly suggesting that the system was not subject
to unknown electrical conditions prior to the event. However, what flows through the Task Force
report is a continuing theme that FirstEnergy lacked a comprehensive understanding of its system
and how the system would perform under conditions of extreme stress. FirstEnergy operators were
not trained to recognize and respond to distress signals and hence failed to take appropriate action
to contain the blackout within its operating area.
Factor #2: Loss of Safety Margins
FirstEnergy made many errors in planning, management, and operations that were not detected
through independent reviews and remained uncorrected. These errors and omissions seriously
compromised normal and routine safety margins.
Factor #3: Positive Feedback
Because FirstEnergy personnel did not fully understand the state of the system or its operating
characteristics, they did not take appropriate action to return the system to a safe operating
24 “Final Report on the August 14, 2003 Blackout in the United States and Canada: Causes and Recommendations,” April 2004, U.S.-Canada Power System Outage Task Force.

IRGC - Public Sector Governance of Emerging Risks - Infrastructure Case - November 2012
Richard G. Little
25
condition following initial destabilizing events or subsequently to isolate the blackout within Ohio.
This lack of feedback control allowed the event to cascade into the massive blackout that occurred.
Factor 4: Varying susceptibilities to risk
The Cleveland-Akron area was highly vulnerable to voltage instability problems on August 14th.
According to the Task Force report, “FirstEnergy was operating that system on the very edge of
NERC operational reliability standards, and that it could have been compromised by a number of
potentially disruptive scenarios that were foreseeable by thorough planning and operations
studies.”
Factor #5: Conflicts about interests, values, and science
To some degree, the blackout appears to have grown out of conflicts between FirstEnergy business
concerns (a corporate priority) and the reliability of the grid (a priority of others). In the words of
the Task Force, “...deficiencies in corporate policies, lack of adherence to industry policies, and
inadequate management of reactive power and voltage caused the blackout, rather than the lack of
reactive power.” This was essentially a dilemma of the commons. FirstEnergy corporate policy and
practice placed the immediate concerns of the company above the well-being of the larger user
community which resulted in the collapse of both FirstEnergy’s system and the larger, extended grid.
Factor #6: Social dynamics
Following large-scale deregulation, the U.S. electric power industry was transformed from vertically
integrated companies that performed generation, transmission, and distribution functions under
unified management, to a multiplicity of companies that provided these services separately although
often at a much larger scale. This aggregated combination of power companies (e.g., FirstEnergy),
utilities (e.g., Ohio Edison), reliability coordinators (MISO), policy bodies (NERC), and state and
federal regulators have differing missions and goals which are not congruent. As a result, there is no
over-arching policy guidance or system control to manage the grid in a fully coordinated and
comprehensive manner.
Factor #7: Technological advances
The advent of the Independent Power Producer (IPP), while not a technological advance, is a change
that has greatly complicated the monitoring, management, and operation of the grid. The Task force
noted that FirstEnergy did not have operational monitoring equipment adequate to provide a means
for its operators to evaluate the effects of the loss of significant transmission or generation facilities
and to take appropriate action in a timely manner.
Factor #8: Temporal complications
Electrical energy moves through the grid at essentially the speed of light and unlike fluids flowing in
pipes, cannot be readily controlled by valves and other diverters. As such, operational decision-
making must occur in real-time in a very fast-moving system leaving little time to deal with
unexpected problems.
IRGC - Public Sector Governance of Emerging Risks - Infrastructure Case - November 2012
Richard G. Little
26
Factor #9: Communication
The deteriorating state of FirstEnergy’s system was not communicated to neighboring systems. Had
more real-time information been available, action could have been taken that would have limited
the scale and duration of the blackout.
Factor #10: Information asymmetries
Because so many players were involved, from individual utilities, power corps such as FirstEnergy,
and reliability and regulatory bodies, no one had a complete picture of the system and how events
were unfolding. This precluded timely and effective coordination of actions that could have limited
the impacts of the blackout.
Factor #11: Perverse incentives
Load-shedding of its own customers by FirstEnergy would have contained the blackout within Ohio.
However, potential legal and financial liability regarding customers taken off line raises conflicts with
actions necessary to maintain system reliability.
Factor #12: Malicious motives or acts
This factor does not appear to have played any role in the April 14, 2003 blackout. Although many
human and institutional failures were noted in the Task Force report, there is no evidence that
anyone acted deliberately to cause or to make the situation worse.
Prior to the blackout, the vulnerability of the grid to cascading type failures was well documented25.
The summary report of the group that studied the outage expressed no surprise in its overall
findings
Although the causes discussed below produced the failures and events of August 14,
they did not leap into being that day. Instead, as the following chapters explain,
they reflect long-standing institutional failures and weaknesses that need to be
understood and corrected in order to maintain reliability26.
Regarding the cause of the initiating failure in Ohio, the Task Force continued this line of reasoning
...deficiencies in corporate policies, lack of adherence to industry policies, and
inadequate management of reactive power and voltage caused the blackout, rather
than the lack of reactive power.
To a large degree the blackout appears to have been the result of corporate polices that rightly or
wrongly placed immediate operational and business concerns of FirstEnergy above the security of
the national grid. The company never considered voluntarily cutting off power to its customers to
ease congestion on the power lines and questioned why it should have interrupted service to its own
customers to stabilize the system27. At the same time, such actions were not required by regulation.
25
Amin, 2003. 26
U.S.-Canada Power System Outage Task Force, op.cit. 27
Behr, 2003

IRGC - Public Sector Governance of Emerging Risks - Infrastructure Case - November 2012
Richard G. Little
27
Institutional Resilience in Socio-Technological Systems
The World Trade Center attacks of September 11, 2001 provide some interesting lessons for a more
comprehensive understanding of the failure and recovery of interdependent infrastructures. Studies
of the performance of infrastructure in the vicinity of the World Trade Center in the days and weeks
following the attacks28,29 underscore the notion that resilience or the ability to recover quickly is a
critical feature of survivable systems. Resilience is often provided by means of robustness which
increases failure-resistance through design and/or construction techniques or redundancy that
provides duplicative capacity for service delivery. This work demonstrated that these characteristics
are just as critical for institutions as for the physical systems themselves.
New York City was able to recover relatively quickly (compared to how other cities might have fared)
after the September 11th terrorist attacks not only because of the inherent redundancy of its
physical infrastructures (which is considerable) but because of its institutional resilience as well30.
New York City was fortunate that many of the basic infrastructure networks in the financial district
were redundant in many places. These redundancies developed because the systems were old and
had been added to considerably over the years (with little removed) and that excess capacity was
often installed because of its low marginal cost. Even though these were not conscious
organizational decisions, from a practical standpoint they achieved the same affect and are an
empirical reference point for the value of redundancy in critical systems. Many of the service
providers involved in New York’s recovery (e.g., Consolidated Edison, Verizon, AT&T, MTA)
possessed considerable capacity in people considered international experts in their fields; state-of-
the-art equipment and configuration management; as well as other physical and institutional
resources necessary to effect recovery. Another important factor in New York’s resilient response
was the dense social networks that existed both within and across individual utilities. Familiarity and
friendships forged over many decades were the links in conveying intimate knowledge of the
systems between retirees (some living in distant parts of the country) and those still employed that
was critical in quickly re-establishing the physical links. Across utility networks, earlier planning for
Y2K had broadened social networks as personnel from many of the systems had attended the same
planning meetings and event simulations so that there was a greater degree of personal familiarity
that might have otherwise been expected. Again, this was more a serendipitous than a planned
outcome of Y2K preparedness training. This is not to imply that these service providers are
unconcerned with efficiency and cost but it is not apparent that leaner, less robust systems with less
of a focus on core mission and values as service providers would have performed as well. The
evidence suggests that had these organizations been driven solely by a neoliberal, market-driven,
“lean and mean” philosophy, it is quite possible that recovery would have been hampered and
delayed considerable.
28
Wallace, et al, 2003. 29
Zimmerman, 2003. 30
O’Rourke, Lembo, and Nozick, 2003.

IRGC - Public Sector Governance of Emerging Risks - Infrastructure Case - November 2012
Richard G. Little
28
Normal Accidents and High Reliability Organizations
Perrow31 was among the first researchers to discard the traditional approach to failure analysis that
focused on the technical cause of an accident or event and the underlying human error that gave it
life. The technical and human elements of such large systems are inseparable and sufficiently
complex to allow unexpected interactions of failures to occur and so tightly coupled to result in a
cascade of increasing magnitude. Perrow ascribes many of the causes of normal accidents to
organizational issues such as the nature of the power hierarchy and the culture of the organization
itself.
Scott Sagan, in an analysis of U.S. nuclear weapons safety during the cold war, emphasized the
importance that organizational culture plays in the management of high risk technologies. High
reliability theory (HRT) holds that the culture of some organizations allows them to carry out
hazardous operations with a far lower failure rate than would otherwise be expected (e.g., aircraft
carrier flight operations, the nuclear power industry, and air traffic control)32, 33. What is most
striking about those organizations that perform surprisingly well in complex, high risk environments
is an unrelenting focus on core values and an organizational culture that nurtures and supports
them. By minimizing institutional conflicts, high reliability organizations (HRO’s) are able to strike a
balance that minimizes serious technical failures while at the same time maintains reliable
operations at acceptable levels. These organizations are by no means perfect and the HRO model is
not applicable to all organizations, all of the time34. However, most of the infrastructure failures
described in this paper can traced to a large degree to organizational cultures that placed other
objectives above the core values (i.e., safety or reliability) of the organization and which failed to
comprehend fully the potential consequences of these actions. There is certainly nothing inherently
wrong with operating infrastructure systems as efficiently as possible or in converting formerly
public or publicly-regulated service providers to profit-driven enterprise. However, when the pursuit
of efficiency or profit becomes the motivating value of an organization whose prime responsibility
should be safety or reliability, the results are likely to be unacceptable on both counts. Trade-offs
between competing objectives are an organizational reality. However, these trade-offs and their
consequences must be both transparent and understood. Otherwise, devastating but predictable
failures (i.e., Perrow’s normal accidents) will continue to occur within our vital infrastructure
systems and the incident board convened in the aftermath will likely come to the conclusion that
failure was preventable.
Improving Understanding and Learning from Failure
Although past failures can be fertile ground for learning, care needs to be taken to avoid what
Taleb35 has termed the “narrative fallacy.” That is, the need for people to create a story that weaves
elements of otherwise incomprehensible events into something that can be readily understood.
Unfortunately, such stories usually bear little resemblance to reality and create little opportunity for
31
Perrow, 1999a 32
La Porte and Consolini, 1991. 33
Weick and Sutcliffe, 2001. 34
ibid. 35
Taleb, 2007.

IRGC - Public Sector Governance of Emerging Risks - Infrastructure Case - November 2012
Richard G. Little
29
learning. Lessons learned programs (or other forms of adaptive learning for understanding the
causes, modes, and likelihood of interdependency failures in infrastructure systems) need to be
designed to identify the influence of all contributing factors, not merely the obvious or easy ones.
The 2005 failure of the levee system that protected New Orleans from flooding provides a good case
in point that was borne out by the earlier delineation of contributing factors. Figure 11 depicts the
sequence of events that led up to the multiple infrastructure failures that brought civil life in New
Orleans to a halt. Based on the findings of several post-event reports36, the failure of the levees and
the resultant flooding was predictable given the nature of Hurricane Katrina. However, the event
chain in Figure 11 indicates how the narrative fallacy could direct the focus to the levee breach or
the hurricane which were just precipitating events leading up to the flooding. What it fails to capture
is the root cause, the complex series of socio-technical interactions that are embedded in the
technical and institutional arrangements that contributed directly to the failure, i.e., incorrect design
basis, lack of funding, and poor maintenance.
Figure 11. The event chain leading up to the collapse of New Orleans during Hurricane Katrina.
This strongly mirrors the IRGC contributing factors analysis where, #5: Conflicts about interests,
values and science, #6: Social dynamics, and #11: Perverse incentives appear to be the most
explanatory. Replicating the Stage 1 box of Figure 11 for the 2003 power blackout in the
northeastern U.S. and the 2011 Fukushima Daiichi power plant disaster, the results would be much
the same. The root cause of both these disasters was also at the socio-technical interface; a lethal
mix of willful ignorance, institutional inadequacy, and regulatory failure which allowed the risk to
emerge and grow unchecked until triggered by an initiating event; i.e., Hurricane Katrina, higher
than normal electric power demand when the local grid was in an unstable state, and the Tohoku
earthquake and tsunami. These three events are far from unique and the recurrence of the same
institutional and human factors as underlying root causes suggests that a new paradigm for
addressing the risks of high-consequence infrastructure failures is called for. Rather than seeking an
optimal design solution based on an expected maximum probable event, a more effective way of
addressing these risks may be to assume that a failed condition is actually the stable configuration of
the system. If high entropy governs system behavior, then continuous inputs of financial and
intellectual capital would be required (and expected) to keep the system in an unstable, lower
entropy and “safe” condition. By recasting the problem as one of achieving safety rather than
preventing failure, such investments take on a wholly different meaning and can no longer be
36
ILIT, 2006; IPET, 2007.

IRGC - Public Sector Governance of Emerging Risks - Infrastructure Case - November 2012
Richard G. Little
30
viewed as optional. Without on-going analysis, assessment, planning, testing, maintenance, and
repair, the system will revert to its most stable configuration, i.e., failure.
In the aftermath of Hurricane Katrina, there was much public demand to “get the engineering right”
as though that was the only problem. Although the connection between poor design, construction,
and maintenance and the breach and collapse of the levees is valid, it really misses the point.
Instead of asking ‘‘How can we design levees so that they will not collapse or breach if subjected to a
storm of Katrina’s intensity?’’ perhaps the more appropriate question is ‘‘How can we protect the
people of New Orleans from floods in the future at reasonable cost?’’ The answer to the second
question lies at least as much with institutions, governance, and finance as with structural design
and levee maintenance. Perhaps the real question is not ‘‘What are the best technologies to hold
back floodwaters?’’ but rather, ‘‘How can we reduce exposure, damage, and casualties in the event
of future hurricanes?’’— a fundamentally different question.
These causes were abundantly apparent in the forty years leading up to the flooding of New Orleans
during Hurricane Katrina. (Actually, the roots of this disaster are much older, predating the Civil
War37). Even a cursory analysis of the timeline in Figure 11 shows a project destined to fail at some
point. Beginning with the Congressional authorization of the Lake Pontchartrain and Vicinity
Hurricane Protection Plan (LPVHPP) in 1965, Federal appropriations were never sufficient to
complete the project in a timely manner. As a result, construction lagged behind schedule causing
further cost escalation and funding shortfalls. Local cost-sharing was slow to materialize and even in-
kind contributions for maintenance were not made. In addition, encroachment by local property
owners made remedial work identified by the U.S. Army Corps of Engineers (USACE) difficult or
impossible to undertake. Despite these obvious omissions and shortfalls, everyone involved, from
the U.S. Congress to the individual homeowner, pretended that that a fail-safe flood protection
system was in place. Although certainly not unique, reliance on such “fantasy plans”38 had
particularly devastating consequences in New Orleans and, to a large degree, in Ohio in 2003 and
Fukushima in 2011 as well.
A Way Forward
It is obvious from the preceding discussion that just knowing what to do about the risk of aging
infrastructure is not enough. There must also be a political will to act and institutional frameworks
and organizational capacity to develop and implement appropriate policies, i.e., “How to do it.”
Some countries and agencies have institutionalized risk management processes while many others
have not. This section of the paper will examine successful programs for common threads and
suggest how proactive practices to reduce the risk of aging infrastructure could be more broadly
implemented.
After reviewing the plans and programs of several infrastructure agencies and government bureaus,
it is apparent that to be effective, risk management must be integral to the corporate culture. In
other words, if risk reduction is an overarching enterprise goal, it will be a much more
straightforward process to incorporate risk management into daily work routines. For example, both
37
Barry, 1997. 38
Clarke, 1999.

IRGC - Public Sector Governance of Emerging Risks - Infrastructure Case - November 2012
Richard G. Little
31
Transport Scotland and the New Zealand Transport Agency have developed highly rated
transportation asset management plans. Transport Scotland notes that
Risk is relevant to all parts of our business and as such it is important that a consistent and joined up approach is used across all Transport Scotland Directorates39.
Figure 11: Significant Congressional, Judicial, and USACE Decisions Related to the LP & VHVHPP40
while the New Zealand Transport Agency similarly states
Risk management is a fundamental facet of the NZTA’s operation, as it is for all
companies. Risks occur at strategic, portfolio, project and operational levels, and
each requires a different management tactic41.
It should be noted that both nations have recognized ISO 31000, the international standard for risk
management which states that
39
Transport Scotland, 2007. 40
Woolley, D. and L. Shabman, 2008. 41
NZ Transport Agency, 2011.

IRGC - Public Sector Governance of Emerging Risks - Infrastructure Case - November 2012
Richard G. Little
32
...organizations should have a framework that integrates the process for managing
risk into the organization's overall governance, strategy and planning, management,
reporting processes, policies, values and culture.
Governments at several levels in Australia have also been singled out as being proactive in
the area of risk management. The Government of South Australia has made its chief executives
accountable to a State Minister for the implementation of risk management standards and practices
and the Lower Murray River urban water authority has incorporated the identification,
consideration, and management of risks is built into decision-making processes. Following a decision
by the Australian High Court that held road authorities to a “duty of care” to road users to maintain
roadways to reduce foreseeable risks, these authorities are looking to robust asset management
plans as a defense against liability claims. It would appear that participation in the ISO 31000
process has played an important role in helping to institutionalize Enterprise Risk Management
(ERM) so that risk reduction has become a core, rather than an ancillary, activity. It is interesting to
note that guidance for asset management promulgated by the U.S. Federal Highway Administration,
the agency that oversees the largest highway network in the world, mentions neither ISO 31000 nor
risk management more generally.
Another interesting example of proactive risk management for infrastructure may be found in the
work of the Dutch Sustainable Coastal Development Committee42. Possibly because flooding in the
Netherlands is viewed as an existential threat, plans for dealing with the risks of climate change and
sea level rise take a broad and long range view. Rather than just focusing on engineered protective
works, the Delta Committee recommends an approach that seeks to restore the natural estuary and
tidal regimes while still protecting against flooding. In this way, they address the risk of aging dikes
and levees by providing alternatives to traditional flood protection works—not all flood protection
solutions need to be structural43.
Changing the status quo is rarely quick and seldom easy. Fifty years after the health risks of smoking
were well-documented, people continue to engage in this risky behavior. By comparison, with few
notable exceptions such as New Orleans in 2005, past infrastructure failures have not caused great
bodily harm or loss of life. For example, although certainly spectacular, the San Bruno pipeline
explosion resulted in only seven deaths; 13 people died in the collapse of the I-35 bridge in
Minneapolis, and there were no reported deaths resulting from the epidemic of water main
blowouts in Los Angeles in 2009. At the same time, the amount of money necessary to address the
problem is large, very large. The American Society of Civil Engineers estimates a rolling five-year
need in the U.S. in excess of $2 trillion or about $1300 annually on a per capita basis. This compares
to per capita expenditures of about $3400, $3000, and $2900 for health care, education, and
defense, respectively. In a resource-constrained world, it will be difficult to muster the political will
to generate the funding required.
All of these programs share some common elements. First among them is a recognition by governing
bodies of a problem of national significance that needs to be addressed. Whether an existential
matter as with flooding in the Netherlands or a lesser “duty of care” for managing transport risks in
42
Delta Committee, 2008. 43
Kabat, et al, 2009.

IRGC - Public Sector Governance of Emerging Risks - Infrastructure Case - November 2012
Richard G. Little
33
Australia, such recognition is crucial to moving forward. Second is the perceived level of “buy-in”
among stakeholder groups. It is not completely clear why this exists in the countries reviewed but a
belief that a governmental body is well equipped to manage these risks does appear to play a
significant role. In the Netherlands, government has managed the flood risk in an acceptable manner
for almost 60 years since the floods of 1953 and people generally believe that government will
continue to be up to the task. In Australia, a nation of huge geography but sparse and widely
dispersed population, people have learned to accept a certain level of personal risk and address it on
a shared basis with their neighbors. Although government is generally trusted, there is a realization
that it may not always be available to respond directly so reducing risk ex ante through guidelines
and planning is an appropriate role. Similar conditions of social cohesion would appear to be in play
in both New Zealand and Scotland which may relate to all being part of the British Commonwealth.
On the other hand, the United States and its relative lack of awareness of risk and unwillingness to
address it at a national level may be a result of both geography and governance. The U.S. is very
large with one of the most ethnically diverse populations in the world. It is very difficult to identify
risks that affect all parts of the nation on a similar basis and the diversity that is a great strength of
the U.S. on many fronts also conspires against effective collective action. Governance in the U.S. is
based on a federal, not a national, system. Policy and decision-making is mostly relegated to the 50
states which have widely differing risks, priorities, and the means to address them. Much of the
responsibility for actually funding infrastructure improvements is further delegated to local
governments. Perhaps under such conditions, it is more surprising that any progress is made in the
U.S. despite its wealth.
However, we can begin to draw up a list of actions that could form the basis for “how to” create an
environment conducive to better asset management and overall risk reduction.
Make risk management an enterprise goal for governments and infrastructure agencies.
The adoption of foundational documents such as ISO 31000 would provide a basis for
sustained action.
Adopt and promulgate infrastructure risk reduction as core values through all levels of
the responsible organization. The Dupont Corporation has for years held safety on an
equal footing as profitability and no one is exempt. Cultures can change.
Develop broad stakeholder support for risk acceptance and collective action through
meetings and dialogue at all governmental levels. The benefits of risk management
activities must be understood if they are to be supported by the public.
Hold management accountable for organizational risk performance; good performance
should be rewarded and poor performance corrected.
Develop the necessary funding sources and financing strategies for asset management
and risk reduction. Water boards in the Netherlands fund flood defense mostly with
locally generated taxes and fees. Local solutions are possible.
Continue to expand our understanding of how infrastructure age and condition affects
its performance and risk of failure. Technological advances offer many opportunities to
improve asset management and reduce risk.

IRGC - Public Sector Governance of Emerging Risks - Infrastructure Case - November 2012
Richard G. Little
34
There should be no expectation for a universal solution to this problem. What is possible in a small
country like the Netherlands that faces a well-recognized threat from the sea is quite different from
what can occur in the much larger and broadly diverse United States. A strong government in
Singapore can compel national actions unthinkable in the UK. However, despite the challenges of
addressing a global issue at the local level, there are many lessons to be learned from what we know
of good risk management practices and the successes of the sort described above.

IRGC - Public Sector Governance of Emerging Risks - Infrastructure Case - November 2012
Richard G. Little
35
References
Amin, M. 2003. “North America’s Electricity Infrastructure: Are we ready for more perfect storms?”
IEEE Security and Privacy Magazine, pp. 19-25, September/October.
Anderson, M. and O. Suess. 2006. “The allure of catastrophe bonds.” International Herald Tribune.
July 13, 2006.
Barry, J. M. 1997. Rising Tide: The Great Mississippi Flood of 1927 and How It Changed America. New
York. Touchstone.
Behr, P. “Probers Say Blackout in August Was Avoidable,” Washington Post, p. A1, November 20,
2003.
Ben-Akiva, M., F. Humplick, S. Madanat, and R. Ramaswamy. 1993. “Infrastructure Management
Under Uncertainty: Latent Performance Approach”, Journal of Transportation Engineering, 119
(1): 43-58.
Clarke, L. 1999 Mission Improbable: Using Fantasy Documents to Tame Disaster. Chicago, Il.,
University of Chicago Press.
Delta Committee. 2008. Electric Utility Week. 2012. “San Bruno pipeline explosion to cost PG&E shareholders up to $1.3
billion, CEO says.” February 20, 2012. Gordon, P. and R.G. Little. 2009. “Rethinking Flood Protection: Options and Opportunities for New
Orleans.” Public Works Management & Policy, 14(1):37-54.
Haimes, Y. Y. 1991 "Total Risk Management," Risk Analysis, 11(2):169–171.
ILIT (Independent Levee Investigation Team) 2006. Investigation of the Performance of the New
Orleans Flood Protection Systems in Hurricane Katrina on August 29, 2005. Available on-line:
http://www.ce.berkeley.edu/~new_orleans/ [May 7, 2008]
IPET (Interagency Performance Evaluation Task Force). 2007. Performance Evaluation of the New
Orleans and Southeast Louisiana Hurricane Protection System. March 26, 2007. Available on-
line: https://ipet.wes.army.mil/ [May 2, 2008].
Kabat, P., L. O. Fresco, M. J. F. Stive, C. P. Veerman, J. S. L. J. van Alphen, B. W. A. H. Parmet, W.
Hazeleger and C. A. Katsman. 2009. “Dutch coasts in transition,” Nature Geoscience, 2:450-452.
Kaplan, S. and B. J. Garrick, 1981. "On the Quantitative Assessment of Risk," Risk Analysis 1(1):11–27.
La Porte, T.R. and P. Consolini. 1991. “Working in Practice But Not in Theory: Theoretical Challenges
of High Reliability Organizations,” Journal of Public Administration Research and Theory, pp. 19-
47, Winter.
Little, R.G. 2004. “A Socio-Technical Systems Approach To Understanding And Enhancing The
Reliability Of Interdependent Infrastructure Systems,” International Journal of Emergency
Management. 2(1–2):98-110.
Little, R.G. 2008. “A Clinical Approach to Infrastructure Asset Management?” in INFRASTRUCTURE
REPORTING AND ASSET MANAGEMENT: BEST PRACTICES AND OPPORTUNITIES. A. Amekudzi
and S. McNeil, eds. Reston, Va. The American Society of Civil Engineers.
NRC (National Research Council). 1996. Understanding Risk: Informing Decisions in a Democratic
Society. Washington, D.C.: National Academy Press.
NRC. (1993). The Fourth Dimension in Building: Strategies for Avoiding Obsolescence. Washington,
D.C.: National Academy Press.

IRGC - Public Sector Governance of Emerging Risks - Infrastructure Case - November 2012
Richard G. Little
36
NTSB (National Transportation Safety Board). 1984. Collapse of a Suspended Span of Route 95
Highway Bridge over the Mianus River, Greenwich, Connecticut, (HAR-84/03), National
Transportation Safety Board, Washington, D.C.
NTSB. 1988. Collapse of New York Thruway (I-90) Bridge, Schoharie Creek, near Amsterdam, New
York, (HAR-88/02) National Transportation Safety Board, Washington, D.C.
NTSB. 1990. Collapse of the Northbound U.S. Route 51 Bridge Spans over the Hatchie River near
Covington, Tennessee, (HAR-90/01), National Transportation Safety Board, Washington, D.C.
NZ Transport Agency. 2011. State Highway Asset Management Plan 2012–15.
O’Rourke, T.D., A.J. Lembo, and L.K. Nozick. 2003. “Lessons Learned from the World Trade Center
Disaster About Critical Utility Systems,” in Impacts of and Human Response to the September 11,
2001 Disasters: What Research Tells Us, M. F. Myers, Ed. Natural Hazards Research and
Applications Information Center, University of Colorado, Boulder, CO., pp. 269-290, 2003.
Perrow, C. 1999. Normal Accidents: Living with High-Risk Technologies. Princeton, N.J.: Princeton
University Press.
Perrow, C. 1994. “The Limits of Safety: The Enhancement of a Theory of Accidents,” Journal of
Contingencies and Crisis Management, pp. 212-220.
Rinaldi, S.M. J.P. Peerenboom, and T.K. Kelly. 2001. “Identifying, Understanding, and Analyzing
Critical Infrastructure Interdependencies,” IEEE Control Systems Magazine, pp. 11-25, December.
Sagan, S. D. 1999. The Limits of Safety, Princeton University Press, Princeton, N.J., 1999.
Slovic, P. 2003. “Going Beyond the Red Book: The Sociopolitics of Risk.” Human and Ecological Risk
Assessment, 9: 1–10, 2003
Slovic, P. 1987. “Perception of risk.” Science, 236, 280-285.
Slovic, P and E. U. Weber. 2002. “Perception of Risk Posed by Extreme Events” presented at Risk
Management Strategies in an Uncertain World, Palisades, New York, April 12-13, 2002.
Taleb, N.N. 2007. The Black Swan: The Impact of the Highly Improbable. New York, NY: Random
House, Inc.
Transport Scotland, 2007. ROAD ASSET MANAGEMENT PLAN for SCOTTISH TRUNK ROADS: APRIL
2007 – MARCH 2009.
U.S.-Canada Power System Outage Task Force. 2004. August 14th Blackout: Causes and
Recommendations.
U.S. Department of Homeland Security. 2010. Aging Infrastructure: Issues, Research, and
Technology. BIPS 01 / December 2010.
Wallace, W. A. D. M. Mendonca, E. E. Lee, J. E. Mitchell, and J. H. Chow. 2003. “Managing
Disruptions to Critical Interdependent Infrastructures in the Context of the 2001 World Trade
Center Attack,” in Impacts of and Human Response to the September 11, 2001 Disasters: What
Research Tells Us, M. F. Myers, Ed. Natural Hazards Research and Applications Information
Center, University of Colorado, Boulder, CO., pp. 165-198.
Weick, K.E. and K.M. Sutcliffe. 2001. Managing the Unexpected: Assuring High Performance in an
Age of Complexity, San Francisco, Ca., John Wiley and Sons.
Woolley, D. and L. Shabman., 2008. Decision-Making Chronology for the Lake Pontchartrain &
Vicinity Hurricane Protection Project. Final Report for the Headquarters, U.S. Army Corps of
Engineers; Submitted to the Institute for Water Resources of the U.S. Army Corps of Engineers,
March 2008.

IRGC - Public Sector Governance of Emerging Risks - Infrastructure Case - November 2012
Richard G. Little
37
Zimmerman, R. 2003. “Public Infrastructure Service Flexibility for Response and Recovery in the
Attacks at the World Trade Center, September 11, 2001,” in Impacts of and Human Response to
the September 11, 2001 Disasters: What Research Tells Us, M. F. Myers, Ed. Natural Hazards
Research and Applications Information Center, University of Colorado, Boulder, CO., pp. 241-
268.