managing financial resources to deliver better public ... · published in february 2008, the...
TRANSCRIPT
Managing financial resources to deliver better public servicesSurvey results

The National Audit Office scrutinises public spending on behalf of Parliament. The Comptroller and Auditor General, Tim Burr, is an Officer of the House of Commons. He is the head of the National Audit Office, which employs some 850 staff. He, and the National Audit Office, are totally independent of Government. He certifies the accounts of all Government departments and a wide range of other public sector bodies; and he has statutory authority to report to Parliament on the economy, efficiency and effectiveness with which departments and other bodies have used their resources. Our work saves the taxpayer millions of pounds every year. At least £8 for every £1 spent running the Office.
For further information about the National Audit Office please contact:
National Audit Office Press Office 157-197 Buckingham Palace Road Victoria London SW1W 9SP
Tel: 020 7798 7400
Email: [email protected]
© National Audit Office 2008

Section One Use of better information to manage resources 4
Section Two Planning 10
Section Three Board level oversight of departmental resources 16
Section Four Matching expenditure more closely to 36 service needs
Section Five The role, leadership, skills and capacity of the 42 finance function
Contents

Published in February 2008, the National Audit Office report, Managing financial resources to deliver better public services, examined central government departments’ financial resource management capability and performance.
The report drew on a detailed survey of 37 central government departments. As the study progressed it became apparent that there was an appetite in departments for the information collected in the survey to be put to maximum use. To meet this demand, this volume contains the aggregated results for each question in the survey. It has two main purposes:
l to provide additional detail to the information contained within the main report, which will be useful to anyone with an interest in the management of public finances; and
l to be used by departments to compare their own financial resource management capability and performance with that of their peers.
Introduction
The survey questionnaire contained 49 questions, brigaded into five sections:
1. Use of better information to manage resources.
2. Planning.
3. Board level oversight of departmental resources.
4. Matching expenditure more closely to service needs.
5. The role, leadership, skills and capacity of the finance function.
The majority of questions asked respondents to choose the most appropriate response from a range of options. Some questions, however, invited a free text response, for which results were analysed before being grouped by common themes.
The questionnaire was developed in consultation with HM Treasury and CIPFA, and through piloting it with three government departments.
The final questionnaire was completed by 37 government departments, representing more than 99 per cent of government resource and capital expenditure.
In order to provide assurance as to the reasonableness of each return, the respective National Audit Office Financial Audit Directors reviewed a sample of departments’ returns and agreed changes with departments in the small number of cases where this was appropriate.
The questionnaire

Assets Recovery Agency
Cabinet Office
Charity Commission
Crown Prosecution Service
Departments for Communities and Local Government
Department for Culture, Media and Sport
Department for Environment, Food and Rural Affairs
Department for Constitutional Affairs
Department for Education and Skills
Department for International Development
Department for Transport
Department for Work and Pensions
Department of Health
Department for Trade and Industry
Export Credits Guarantees Department
Food Standards Agency
Foreign and Commonwealth Office
Forestry Commission
Government Actuary’s Department
HM Treasury
HM Revenue and Customs
Home Office
Ministry of Defence
National Savings and Investments
Northern Ireland Office
Office of Fair Trading
Office of National Statistics
Office of Rail Regulation
Office of Gas and Electricity Markets
Office for Standards in Education, Children’s Services and Skills
Postal Services Commission
Revenue and Customs Prosecutions Office
Serious Fraud Office
The National Archives
Treasury Solicitor’s Department
UK Trade & Investment
Water Services Regulation Authority
Departments surveyed
4
SECTION ONE
Use of better information to manage resources
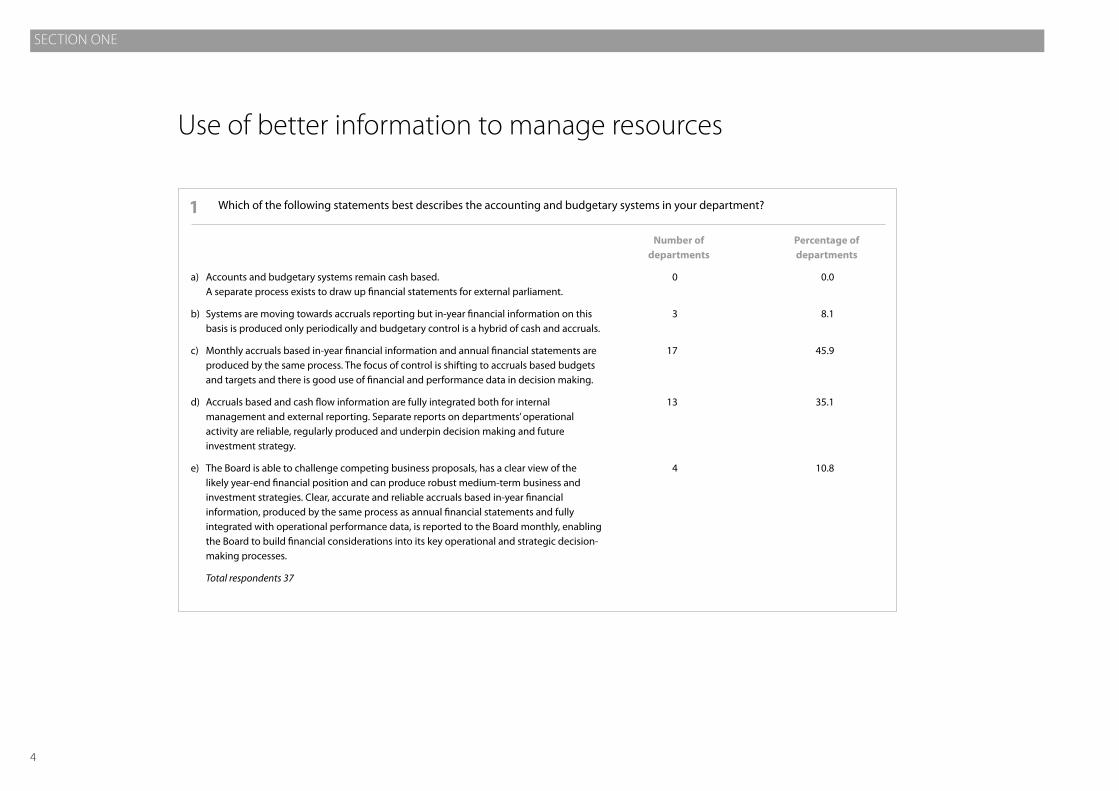
a) Accounts and budgetary systems remain cash based. A separate process exists to draw up financial statements for external parliament.
b) Systems are moving towards accruals reporting but in-year financial information on this basis is produced only periodically and budgetary control is a hybrid of cash and accruals.
c) Monthly accruals based in-year financial information and annual financial statements are produced by the same process. The focus of control is shifting to accruals based budgets and targets and there is good use of financial and performance data in decision making.
d) Accruals based and cash flow information are fully integrated both for internal management and external reporting. Separate reports on departments’ operational activity are reliable, regularly produced and underpin decision making and future investment strategy.
e) The Board is able to challenge competing business proposals, has a clear view of the likely year-end financial position and can produce robust medium-term business and investment strategies. Clear, accurate and reliable accruals based in-year financial information, produced by the same process as annual financial statements and fully integrated with operational performance data, is reported to the Board monthly, enabling the Board to build financial considerations into its key operational and strategic decision-making processes.
Total respondents 37
1 Which of the following statements best describes the accounting and budgetary systems in your department?
Number of departments
0
3
17
13
4
Percentage of departments
0.0
8.1
45.9
35.1
10.8

5
Section one USE OF BETTER INFORMATION TO MANAGE RESOURCES
Option
a) There is little uniformity in the financial and operational performance reporting of the core Department, its agencies and NDPBs. The Department is therefore unable to report uniform information to the Board.
b) The Department is able to report uniform financial and operational performance information for the core Department and some of its agencies and NDPBs.
c) The nature of some agencies’ and NDPBs’ business means that its operational and financial reporting differs from those of the Department. However, these bodies report financial and operational performance to the Department in a manner that enables the Department to collate a uniform report of performance of the core Department, its agencies and NDPBs for the Board.
d) The Department ensures that ALL agencies and NDPBs use compatible systems and processes, which enables the Department to report uniform, accurate, timely and reliable financial and operational performance information to the Board on behalf of the core Department, its agencies and NDPBs.
e) Not applicable: the Department has no associated agencies or NDPBs.
f ) Other
Total respondents 35
2 Which of the following statements best describes the extent to which your department has effective oversight of the activities of the core department, its agencies, NDPBs and other arms-length bodies?
Number of departments
0
21
9
5
19
0
Percentage of departments
0.0
5.7
25.7
14.3
54.3
0.0
1. Includes one response that was originally entered as ‘other’. Upon review, the study team judged this response to match option b.

Section one USE OF BETTER INFORMATION TO MANAGE RESOURCES
�
Systems/data quality/improved reporting
Financial skills and awareness by non-finance staff (managers/budget-holders)
Accountability for finance management to budget-holders/senior managers
Link between resource usage and performance
Simplification and alignment of budgeting and reporting process
Improved planning
More of a finance management culture/profile of Finance team
Decentralised financial skills – financial staff sitting in spending areas
Qualified Finance Director on Board
Better-skilled permanent finance staff
Recruitment and training of finance professionals
Better fixed asset valuation
Better incentivised staff
Total responses2 104
3 In order of importance, what three factors would most improve resource management in your department?
Number of responses
31
20
12
9
8
7
6
3
2
2
2
1
1
Percentage of responses
29.8
19.2
11.5
8.7
7.7
6.7
5.8
2.9
1.9
1.9
1.9
1.0
1.0
Systems/data quality/improved reportingFinancial skills and awareness by non-financial staff (managers/budget-holdersAccountability for finance management to budget-holders/senior managers
Link between resource usage and performanceSimplification and alignment of budgeting and reporting process
Improved planningMore of a finance management culture/profile of Finance TeamDecentralised financial skills − financial staff sitting in spending areas
Recruitment and training of finance professionals
Qualified Finance Director on BoardBetter-skilled permanent finance staff
Better incentivised staff Better fixed asset valuation
0% 10% 20% 30%
2. Departments had the opportunity to provide three factors which would improve resource management. The total number of factors given by departments was 104. 35 of the 37 departments in our survey provided at least one response.

7
Section one USE OF BETTER INFORMATION TO MANAGE RESOURCES
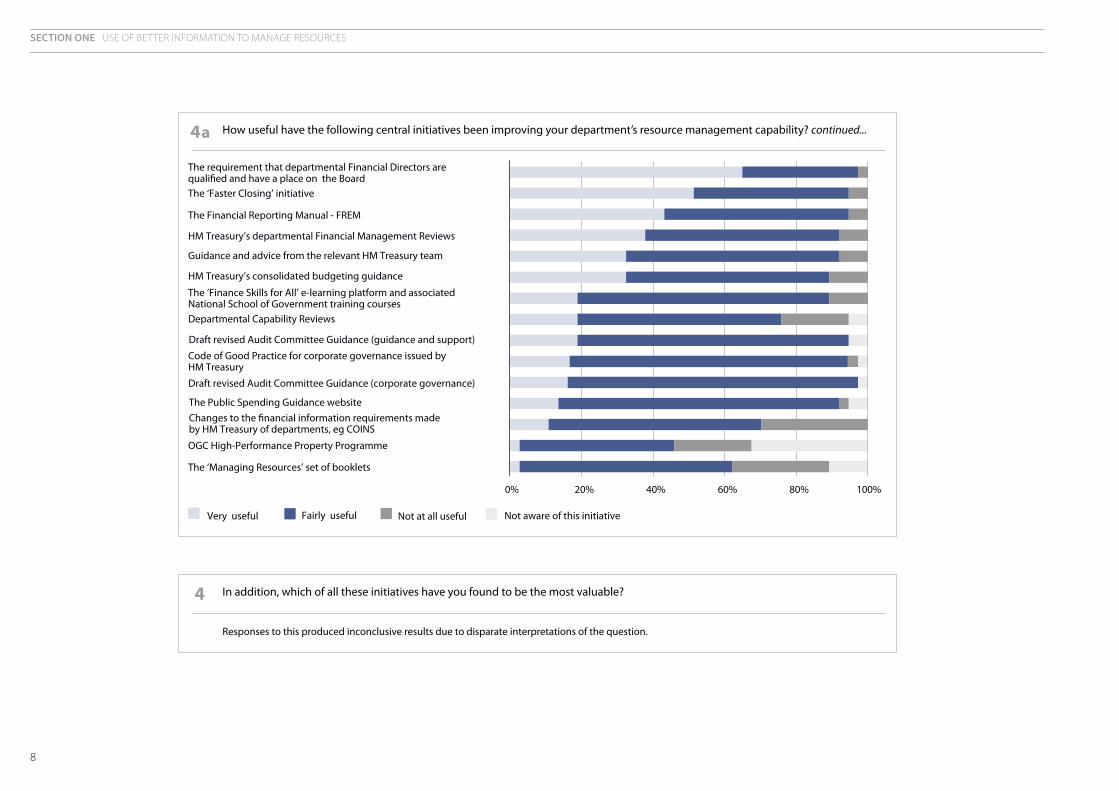
The requirement that departmental Financial Directors are qualified and have a place on the Board
The ‘Faster Closing’ Initiative
The Financial Reporting Manual – FREM
HM Treasury’s departmental Financial Management Reviews
Guidance and advice from the relevant HM Treasury team
HM Treasury’s consolidated budgeting guidance
The ‘Finance Skills for All’ e-learning platform and associated National School of Government training courses
Departmental Capability Reviews
Draft revised Audit Committee Guidance (guidance and support)
Code of Good Practice for corporate governance issued by HM Treasury
Draft revised Audit Committee Guidance (corporate governance)
The Public Spending Guidance website
Changes to the financial information requirements made by HM Treasury of departments e.g. COINS
OGC High-Performance Property Programme
The ‘Managing Resources’ set of booklets
4a How useful have the following central initiatives been in improving your department’s resource management capability?
Total respondents
37
37
37
37
37
37
37
37
37
36
37
37
37
37
37
Percentage of departments
0.0
0.0
0.0
0.0
0.0
0.0
0.0
5.4
5.4
2.8
2.7
5.4
0.0
32.4
10.8
Numberof departments
0
0
0
0
0
0
0
2
2
1
1
2
0
12
4
Percentage of departments
2.7
5.4
5.4
8.1
8.1
10.8
10.8
18.9
0.0
2.8
0.0
2.7
29.7
21.6
27.0
Number of departments
1
2
2
3
3
4
4
7
0
1
0
1
11
8
10
Percentage of departments
32.4
43.2
51.4
54.1
59.5
56.8
70.3
56.8
75.7
77.8
81.1
78.4
59.5
43.2
59.5
Number of departments
12
16
19
20
22
21
26
21
28
28
30
29
22
16
22
Percentage of departments
64.9
51.4
43.2
37.8
32.4
32.4
18.9
18.9
18.9
16.7
16.2
13.5
10.8
2.7
2.7
Number of departments
24
19
16
14
12
12
7
7
7
6
6
5
4
1
1
Very useful Fairly useful Not at all useful Not aware of this initiative
Section one USE OF BETTER INFORMATION TO MANAGE RESOURCES
8
0% 20% 40% 60% 80% 100%
OGC High-Performance Property Programme
The ‘Managing Resources’ set of booklets
Changes to the �nancial information requirements madeby HM Treasury of departments, eg COINS
The Public Spending Guidance website
Draft revised Audit Committee Guidance (corporate governance)
Code of Good Practice for corporate governance issued by HM Treasury
The ‘Finance Skills for All’ e-learning platform and associated National School of Government training coursesDepartmental Capability Reviews
Draft revised Audit Committee Guidance (guidance and support)
Guidance and advice from the relevant HM Treasury team
HM Treasury’s consolidated budgeting guidance
HM Treasury’s departmental Financial Management Reviews
The Financial Reporting Manual - FREM
The ‘Faster Closing’ initiative
The requirement that departmental Financial Directors are quali�ed and have a place on the Board
Very useful Fairly useful Not at all useful Not aware of this initiative
4a How useful have the following central initiatives been improving your department’s resource management capability? continued...
4 In addition, which of all these initiatives have you found to be the most valuable?
Responses to this produced inconclusive results due to disparate interpretations of the question.
9
Section one USE OF BETTER INFORMATION TO MANAGE RESOURCES
5b Where you have stated that significant extra support is needed, please explain your response
The survey produced an insufficient number of responses to form a meaningful analysis for this question.
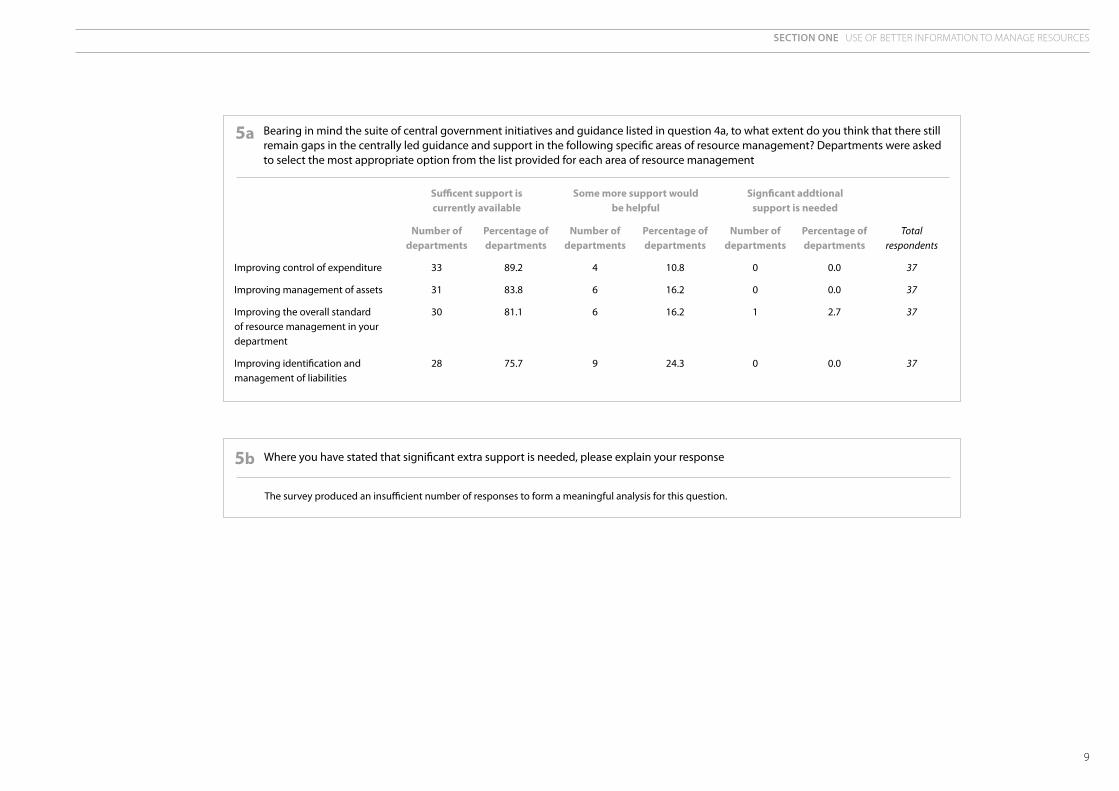
5a Bearing in mind the suite of central government initiatives and guidance listed in question 4a, to what extent do you think that there still remain gaps in the centrally led guidance and support in the following specific areas of resource management? Departments were asked to select the most appropriate option from the list provided for each area of resource management
Improving control of expenditure
Improving management of assets
Improving the overall standard of resource management in your department
Improving identification and management of liabilities
Percentage of departments
0.0
0.0
2.7
0.0
Number of departments
0
0
1
0
Percentage of departments
10.8
16.2
16.2
24.3
Number of departments
4
6
6
9
Percentage of departments
89.2
83.8
81.1
75.7
Number of departments
33
31
30
28
Sufficent support is currently available
Some more support would be helpful
Signficant addtional support is needed
Total respondents
37
37
37
37

10
SECTION TWO
Number of Percentage of departments departments
Yes 33 89.2
No 4 10.8
Total respondents 37
6a Does the Department have a detailed Business Plan covering future years which details priorities and forecasts expected operational and financial performance?
7a
Tangible Assets
Intangible Assets
Investments
Stocks
Debtors
Cash and Bank
Creditors
Provisions
Reserves
Total respondents
36
34
32
33
34
34
34
35
35
Percentage of departments
36.1
88.2
75.0
84.8
29.4
35.3
8.8
37.1
54.3
Number of departments
13
30
24
28
10
12
3
13
19
Percentage of departments
8.3
5.9
6.3
9.1
44.1
50.0
47.1
28.6
22.9
Number of departments
3
2
2
3
15
17
16
10
8
Percentage of departments
55.6
5.9
18.8
6.1
26.5
14.7
44.1
34.3
22.9
Number of departments
20
2
6
2
9
5
15
12
8
Highly material Medium level of marteriality Low materiality
In order to assess the areas of the Department’s balance sheet that are of particular significance, departments were asked to judge the level of materiality of balance sheet of each balance sheet component
Number Number of Percentage of of years departments departments
1 12 37.5
2 0 0.0
3 12 37.5
4 3 9.4
5 5 15.6
Total respondents 32
6b If the answer to 6 (a) is yes, how many years does the current plan cover?
Planning
11
Section two PLANNING
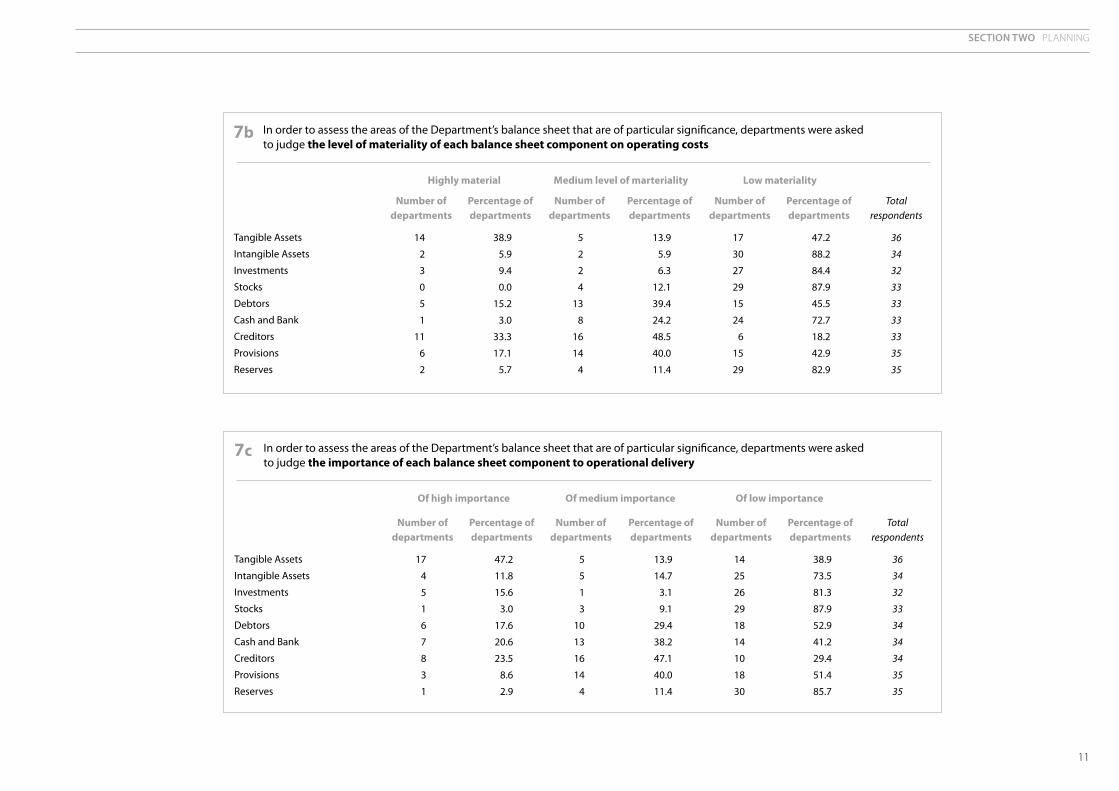
7b In order to assess the areas of the Department’s balance sheet that are of particular significance, departments were asked to judge the level of materiality of each balance sheet component on operating costs
Tangible Assets
Intangible Assets
Investments
Stocks
Debtors
Cash and Bank
Creditors
Provisions
Reserves
Total respondents
36
34
32
33
33
33
33
35
35
Percentage of departments
47.2
88.2
84.4
87.9
45.5
72.7
18.2
42.9
82.9
Number of departments
17
30
27
29
15
24
6
15
29
Percentage of departments
13.9
5.9
6.3
12.1
39.4
24.2
48.5
40.0
11.4
Number of departments
5
2
2
4
13
8
16
14
4
Percentage of departments
38.9
5.9
9.4
0.0
15.2
3.0
33.3
17.1
5.7
Number of departments
14
2
3
0
5
1
11
6
2
Highly material Medium level of marteriality Low materiality
7c In order to assess the areas of the Department’s balance sheet that are of particular significance, departments were asked to judge the importance of each balance sheet component to operational delivery
Tangible Assets
Intangible Assets
Investments
Stocks
Debtors
Cash and Bank
Creditors
Provisions
Reserves
Total respondents
36
34
32
33
34
34
34
35
35
Percentage of departments
38.9
73.5
81.3
87.9
52.9
41.2
29.4
51.4
85.7
Number of departments
14
25
26
29
18
14
10
18
30
Percentage of departments
13.9
14.7
3.1
9.1
29.4
38.2
47.1
40.0
11.4
Number of departments
5
5
1
3
10
13
16
14
4
Percentage of departments
47.2
11.8
15.6
3.0
17.6
20.6
23.5
8.6
2.9
Number of departments
17
4
5
1
6
7
8
3
1
Of high importance Of medium importance Of low importance

12
Section two PLANNING
Tangible Assets
Intangible Assets
Investments
Stocks
Debtors
Cash and Bank
Creditors
Provisions
Reserves
Total respondents
35
34
32
33
34
34
34
35
35
Percentage of departments
74.3
85.3
93.8
87.9
67.6
73.5
58.8
77.1
88.6
Number of departments
26
29
30
29
23
25
20
27
31
Percentage of departments
17.1
14.7
6.3
9.1
20.6
23.5
32.4
20.0
5.7
Number of departments
6
5
2
3
7
8
11
7
2
Percentage of departments
8.6
0.0
0.0
3.0
11.8
2.9
8.8
2.9
5.7
Number of departments
3
0
0
1
4
1
3
1
2
7d In order to assess the areas of the Department’s balance sheet that are of particular significance, departments were asked to judge the extent to which there have been problems in the past related to each balance sheet component
Significant history of problems Occasional problems No history of significant problems
Tangible Assets
Intangible Assets
Investments
Stocks
Debtors
Cash and Bank
Creditors
Provisions
Reserves
Total respondents
36
34
32
33
34
34
34
35
35
Percentage of departments
72.2
94.1
75.0
93.9
73.5
91.2
82.4
71.4
94.3
Number of departments
26
32
24
31
25
31
28
25
33
Percentage of departments
8.3
2.9
12.5
3.0
14.7
8.8
11.8
20.0
5.7
Number of departments
3
1
4
1
5
3
4
7
2
Percentage of departments
19.4
2.9
12.5
3.0
11.8
0.0
5.9
8.6
0.0
Number of departments
7
1
4
1
4
0
2
3
0
7e In order to assess the areas of the Department’s balance sheet that are of particular significance, departments were asked to judge the level of political sensitivity related to each balance sheet component
High degree of political salience
Medium degree of political salience
Low degree of political salience

13
Section two PLANNING
7f In order to assess the areas of the Department’s balance sheet that are of particular significance, departments were asked to judge the need for specific expertise to manage each balance sheet component
Tangible Assets
Intangible Assets
Investments
Stocks
Debtors
Cash and Bank
Creditors
Provisions
Reserves
Total respondents
36
34
32
33
34
34
34
35
35
Percentage of departments
22.2
58.8
59.4
93.9
50.0
52.9
55.9
31.4
65.7
Number of departments
8
20
19
31
17
18
19
11
23
Percentage of departments
41.7
26.5
28.1
3.0
35.3
29.4
29.4
42.9
22.9
Number of departments
15
9
9
1
12
10
10
15
8
Percentage of departments
36.1
14.7
12.5
3.0
14.7
17.6
14.7
25.7
11.4
Number of departments
13
5
4
1
5
6
5
9
4
Significant need for specialist expertise
Some / occasional need for specialist expertise
Little need for specialist expertise
14
Section two PLANNING
Number of Percentage of departments departments
Yes 22 61.1
No 14 38.9
Total respondents 36
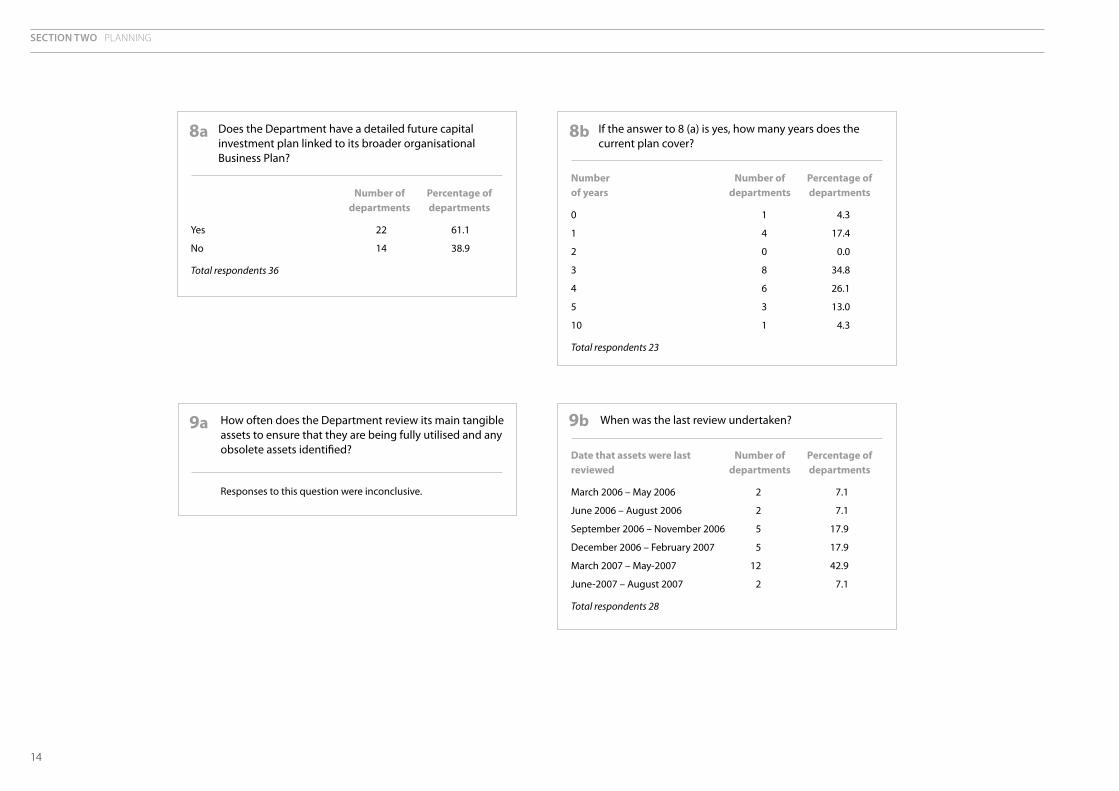
8a Does the Department have a detailed future capital investment plan linked to its broader organisational Business Plan?
Number Number of Percentage of of years departments departments
0 1 4.3
1 4 17.4
2 0 0.0
3 8 34.8
4 6 26.1
5 3 13.0
10 1 4.3
Total respondents 23
8b If the answer to 8 (a) is yes, how many years does the current plan cover?
Date that assets were last Number of Percentage of reviewed departments departments
March 2006 – May 2006 2 7.1
June 2006 – August 2006 2 7.1
September 2006 – November 2006 5 17.9
December 2006 – February 2007 5 17.9
March 2007 – May-2007 12 42.9
June-2007 – August 2007 2 7.1
Total respondents 28
9b When was the last review undertaken?9a How often does the Department review its main tangible assets to ensure that they are being fully utilised and any obsolete assets identified?
Responses to this question were inconclusive.

15
Section two PLANNING
Number of Percentage of departments departments
Weekly 0 0.0
Monthly 4 10.8
Quarterly 2 5.4
Annually 12 32.4
Rolling Programme 19 51.4
Never 0 0.0
Other 0 0.0
Total respondents 37
10 How often does the Department review the costs of providing its main services and programmes (for example to examine whether alternative ways of providing the service may be more efficient and effective)? Date that operational budget Number of Percentage of
for 2006-07 was approved departments departments
September 2004 – February 2005 1 3.3
March 2005 – August 2005 1 3.3
September 2005 – February 2006 11 36.7
March 2006 – August 2006 16 53.3
September 2006 – February 2007 0 0.9
March 2007 – August 2007 1 3.3
Total respondents 30
11 On what date did your department’s Board approve the allocation of operational budgets for 2006-07
1�
SECTION THREE
Board level oversight of departmental resources
There are regular problems with data quality in this area
Usually accurate but occasionally problems have arisen
Almost always accurate
Total respondents
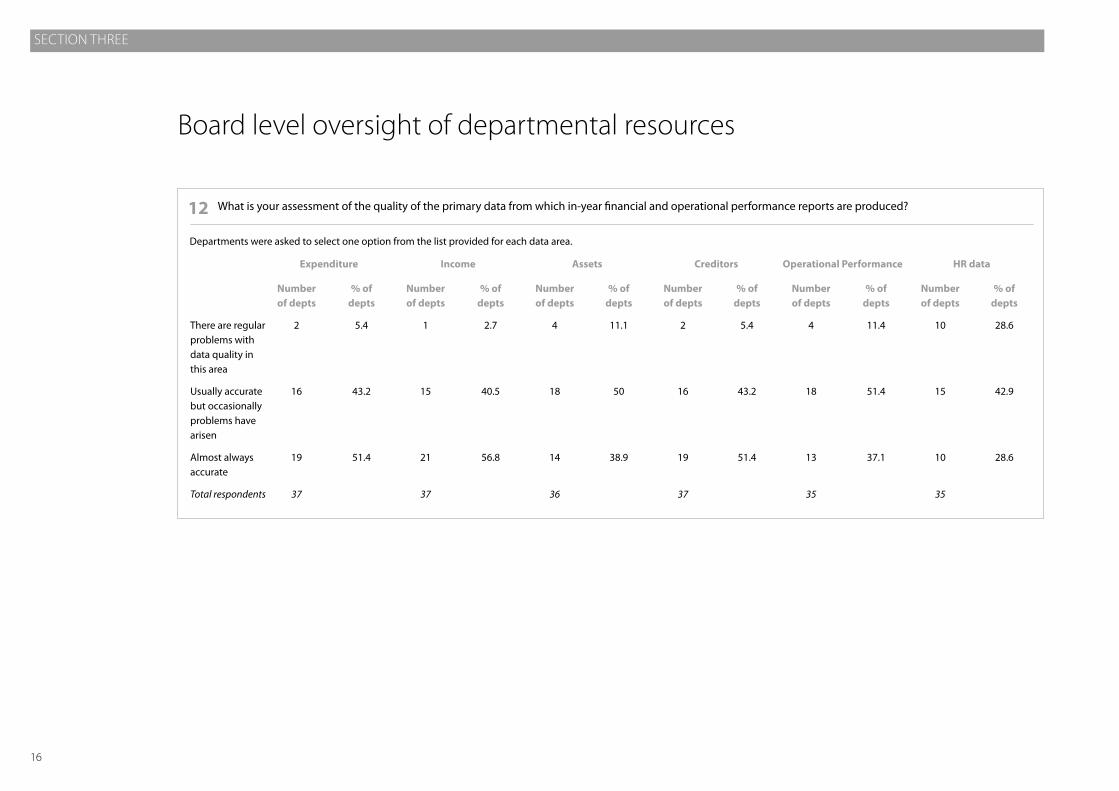
12 What is your assessment of the quality of the primary data from which in-year financial and operational performance reports are produced?
Number of depts
4
18
13
35
% of depts
5.4
43.2
51.4
Number of depts
2
16
19
37
% of depts
11.1
50
38.9
Number of depts
4
18
14
36
% of depts
2.7
40.5
56.8
Number of depts
1
15
21
37
% of depts
5.4
43.2
51.4
Number of depts
2
16
19
37
% of depts
28.6
42.9
28.6
Number of depts
10
15
10
35
% of depts
11.4
51.4
37.1
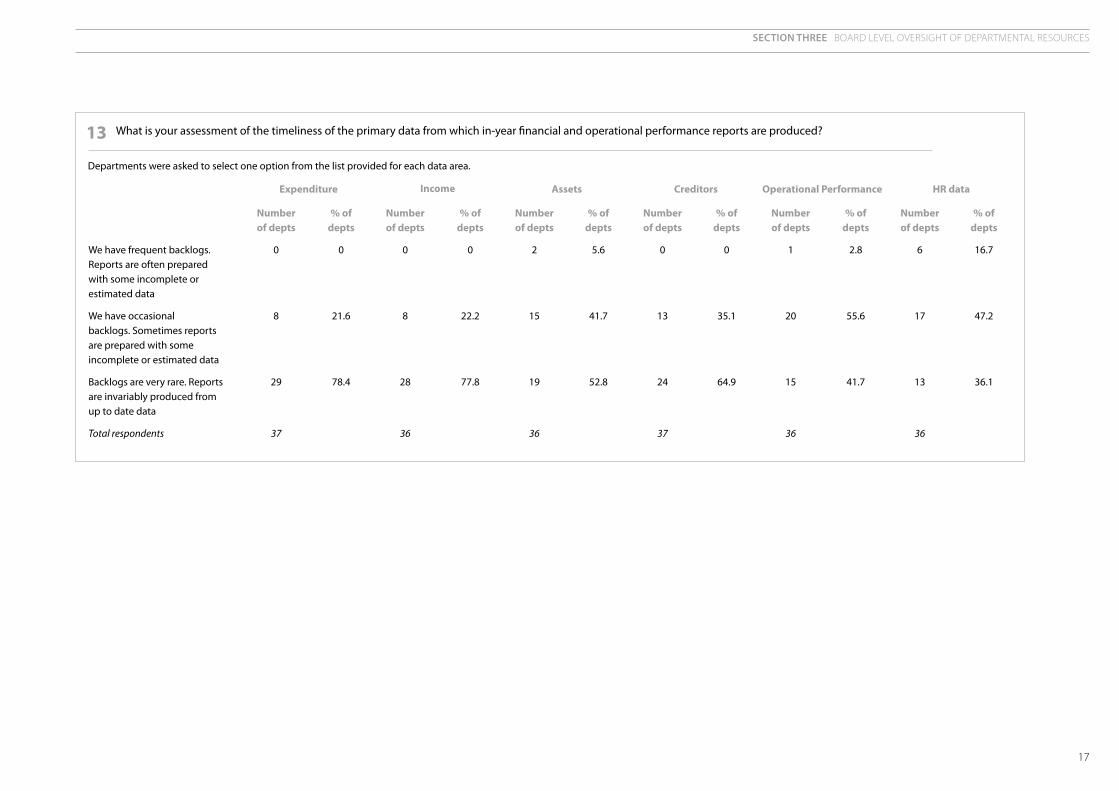
Departments were asked to select one option from the list provided for each data area.
Expenditure Income Assets Creditors Operational Performance HR data
17
Section three BOARD LEvEL OvERSIGHT OF DEPARTMENTAL RESOURCES
We have frequent backlogs. Reports are often prepared with some incomplete or estimated data
We have occasional backlogs. Sometimes reports are prepared with some incomplete or estimated data
Backlogs are very rare. Reports are invariably produced from up to date data
Total respondents
13 What is your assessment of the timeliness of the primary data from which in-year financial and operational performance reports are produced?
Number of depts
0
8
29
37
Number of depts
1
20
15
36
% of depts
0
35.1
64.9
Number of depts
0
13
24
37
% of depts
5.6
41.7
52.8
Number of depts
2
15
19
36
% of depts
0
22.2
77.8
Number of depts
0
8
28
36
% of depts
0
21.6
78.4
% of depts
16.7
47.2
36.1
Number of depts
6
17
13
36
% of depts
2.8
55.6
41.7
Departments were asked to select one option from the list provided for each data area.
Expenditure Income Assets Creditors Operational Performance HR data

Section three BOARD LEvEL OvERSIGHT OF DEPARTMENTAL RESOURCES
18
Number of Percentage of departments departments
Monthly 25 67.6
Every two months 3 8.1
Quarterly 9 24.3
Less frequently 0 24.3
Total respondents 37
14 How often is the financial position of the Department discussed as a discrete item at Board meetings?
Type of system Number of Percentage of departments departments
Cash-based 0 0.0
A mixture of cash and accruals 4 10.8
Accruals-based 33 89.2
Total respondents 37
15 The system used to produce in-year reports on financial performance is?
Number of Percentage of departments departments
Systems are fully integrated. 8 21.6 All reports are directly from primary data without manual intervention (for example the use of spreadsheets or stand-alone systems).
Systems are integrated in the 25 67.6 main. Most reports are automated but some still require some manual intervention.
There is a low level of 4 10.8 integration. A significant degree of manual intervention is needed to produce financial reports.
Total respondents 37
16 Which of the following statements best describes the degree of integration of systems used to produce in-year financial reports?
19
Section three BOARD LEvEL OvERSIGHT OF DEPARTMENTAL RESOURCES
No of days Number of Percentage of departments departments
0-5 1 2.8
6-10 13 36.1
11-15 10 27.8
16-20 8 22.2
21-25 0 0.0
26-30 3 8.3
31-35 0 0.0
36-40 0 0.0
41-45 1 2.8
46-50 0 0.0
Total respondents 36
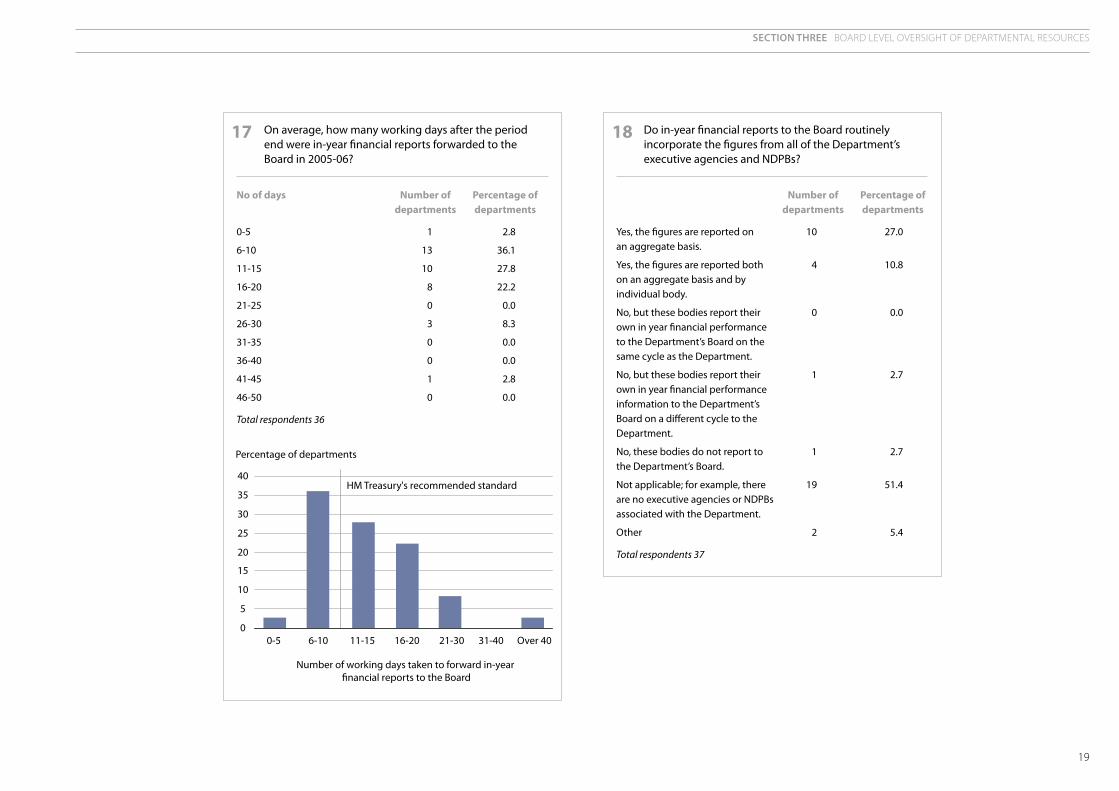
17 On average, how many working days after the period end were in-year financial reports forwarded to the Board in 2005-06?
0-5 6-10 11-15 16-20 21-30 31-40 Over 40
Percentage of departments
HM Treasury's recommended standard
0
5
10
15
20
25
30
35
40
Number of working days taken to forward in-year �nancial reports to the Board
Number of Percentage of departments departments
Yes, the figures are reported on 10 27.0 an aggregate basis.
Yes, the figures are reported both 4 10.8 on an aggregate basis and by individual body.
No, but these bodies report their 0 0.0 own in year financial performance to the Department’s Board on the same cycle as the Department.
No, but these bodies report their 1 2.7 own in year financial performance information to the Department’s Board on a different cycle to the Department.
No, these bodies do not report to 1 2.7 the Department’s Board.
Not applicable; for example, there 19 51.4 are no executive agencies or NDPBs associated with the Department.
Other 2 5.4
Total respondents 37
18 Do in-year financial reports to the Board routinely incorporate the figures from all of the Department’s executive agencies and NDPBs?

Section three BOARD LEvEL OvERSIGHT OF DEPARTMENTAL RESOURCES
20
Number of Percentage of departments departments
Separate reports for operational 21 56.8 and financial performance are produced for each Board meeting.
The Board receives a single report 13 35.1 covering both operational and financial performance for each meeting.
Integrated operational and financial 3 8.1 performance information at programme level is reported to the Board.
Total respondents 37
19 How is operational and financial performance reported to the Board?
Number of Percentage of responses responses
Reduced grant income/conflicting 17 15.7 priorities
Uncertainty over department 14 13.0 specific expenditure
Reduced commercial income 13 12.0
Uncertainty over general 13 12.0 expenditure
Control/use of money granted to 13 12.0 third parties/action of funding bodies
Possible overspend due to one-off/ 10 9.3 unexpected event
Incidents leading to financial 6 5.6 losses/litigation
Escalating pay costs/recruitment 5 4.6 difficulties
Planning difficulties and lack of 5 4.6 financial awareness of staff
Timing issues 4 3.7
Project overruns 3 2.8
Lack of Value for Money 2 1.9
Pressure from individual ministers 1 0.9
Changes in accounting treatments 1 0.9
Consistency and predictability 1 0.9 of budgeting process
Total responses3 108
20 What are the three top financial risks to your organisation (including any resulting from the activities of your executive agencies, NDPBs or other arms-length bodies)?
Departments were invited to give free text responses, which were later grouped by the study team.
3. 3� of the 37 departments in our survey gave at least one response. The total number of responses was 108.
Number of Percentage of departments departments
Yes 24 64.9
No 13 35.1
Total respondents 37
21 Does the Department have a financial risk register?

21
Section three BOARD LEvEL OvERSIGHT OF DEPARTMENTAL RESOURCES
22a How frequently are the following aspects of financial and operational performance reported to the Board in relation to the department only?
An analysis of expenditure by division or business unit
A summary of year-to-date expenditure against budget
A projected forecast of year-end expenditure against budget
Balance Sheet information
Achievement of key operational performance targets
Cash flow information
An analysis of expenditure by operational performance target or key outputs
A specific report on the key financial risks identified by the Department
Total respondents
36
36
36
36
35
35
36
36
Percentage of departments
8.3
5.6
25.0
36.1
5.7
34.3
25.0
25.0
Number of departments
3
2
9
13
2
12
9
9
Percentage of departments
0.0
0.0
33.3
25.0
2.9
17.1
0.0
11.1
Number of departments
0
0
12
9
1
6
0
4
Percentage of departments
13.9
30.6
11.1
11.1
45.7
20.0
16.7
33.3
Number of departments
5
11
4
4
16
7
6
12
Percentage of departments
77.8
63.9
30.6
27.8
45.7
28.6
58.3
30.6
Number of departments
28
23
11
10
16
10
21
11
Monthly Quarterly Annually Never

Section three BOARD LEvEL OvERSIGHT OF DEPARTMENTAL RESOURCES
22
22b How frequently are the following aspects of financial and operational performance reported to the Board at directorate or programme level?
An analysis of expenditure by division or business unit
A summary of year-to-date expenditure against budget
A projected forecast of year-end expenditure against budget
Balance Sheet information
Achievement of key operational performance targets
Cash flow information
An analysis of expenditure by operational performance target or key outputs
A specific report on the key financial risks identified by the Department
Total respondents
31
30
31
30
31
30
30
30
Percentage of departments
19.4
10.0
9.7
66.7
9.7
66.7
46.7
33.3
Number of departments
6
3
3
20
3
20
14
10
Percentage of departments
6.5
6.7
3.2
6.7
16.1
10.0
13.3
13.3
Number of departments
2
2
1
2
5
3
4
4
Percentage of departments
16.1
6.7
22.6
10.0
35.5
10.0
20.0
23.3
Number of departments
5
2
7
3
11
3
6
7
Percentage of departments
58.1
76.7
64.5
16.7
38.7
13.3
20.0
30.0
Number of departments
18
23
20
5
12
4
6
9
Monthly Quarterly Annually Never

23
Section three BOARD LEvEL OvERSIGHT OF DEPARTMENTAL RESOURCES
22c How frequently are the following aspects of financial and operational performance reported to the Board in a form which consolidates figures from the Department and its agencies and NDPBs?
An analysis of expenditure by division or business unit
A summary of year-to-date expenditure against budget
A projected forecast of year-end expenditure against budget
Balance Sheet information
Achievement of key operational performance targets
Cash flow information
An analysis of expenditure by operational performance target or key outputs
A specific report on the key financial risks identified by the Department
Total respondents
20
20
20
20
20
20
20
19
Percentage of departments
30.0
15.4
10.0
50.0
10.0
40.0
35.0
26.3
Number of departments
6
3
2
10
2
8
7
5
Percentage of departments
0.0
0.0
0.0
20.0
0.0
15.0
35.0
10.5
Number of departments
0
0
0
4
0
3
7
2
Percentage of departments
20.0
10.0
20.0
20.0
60.0
20.0
20.0
36.8
Number of departments
4
2
4
4
12
4
4
7
Percentage of departments
50.0
75.0
70.0
10.0
30.0
25.0
10.0
26.3
Number of departments
10
15
14
2
6
5
2
5
Monthly Quarterly Annually Never

Section three BOARD LEvEL OvERSIGHT OF DEPARTMENTAL RESOURCES
24
22d How frequently are the following aspects of financial and operational performance reported to the Board with figures from the Department, its agencies and its NDPBs shown separately?
An analysis of expenditure by division or business unit
A summary of year-to-date expenditure against budget
A projected forecast of year-end expenditure against budget
Balance Sheet information
Achievement of key operational performance targets
Cash flow information
An analysis of expenditure by operational performance target or key outputs
A specific report on the key financial risks identified by the Department
Total respondents
20
21
20
20
20
20
20
19
Percentage of departments
40.0
23.8
25.0
70.0
30.0
55.0
55.0
42.1
Number of departments
8
5
5
14
6
11
11
8
Percentage of departments
0.0
9.5
5.0
15.0
0.0
10.0
15.0
10.5
Number of departments
0
2
1
3
0
2
3
2
Percentage of departments
10.0
9.5
15.0
10.0
40.0
15.0
15.0
21.1
Number of departments
2
2
3
2
8
3
3
4
Percentage of departments
50.0
57.1
55.0
5.0
30.0
20.0
15.0
26.3
Number of departments
10
12
11
1
6
4
3
5
Monthly Quarterly Annually Never
23 Do you consider that your department has the necessary financial and operational performance information to adequately inform decisions to do the following?
Cease programmes
Identify fixed assets that should be disposed, replaced or renewed
Switch resources between programmes
Scale back programmes
Total respondents
36
37
36
36
Percentage of departments
13.9
10.8
8.3
8.3
Number of departments
5
4
3
3
Percentage of departments
86.1
89.2
91.7
91.7
Number of departments
31
33
33
33
Yes No

25
Section three BOARD LEvEL OvERSIGHT OF DEPARTMENTAL RESOURCES
Number of Percentage of departments departments
Yes 37 100.0
No 0 0.0
Total respondents 37
24a Were your draft year-end financial statements for 2005-06 forwarded to your Audit Committee for their consideration?
Date that draft statements Number of Percentage of forwarded to Audit Committee departments departments
April 2006 1 3.1
May 2006 3 9.4
June 2006 17 53.1
July 2006 6 18.8
August 2006 1 3.1
September 2006 2 6.3
October 2006 1 3.1
November 2006 1 3.1
Total respondents 32
24b If yes, on what date were they forwarded to your Audit Committee?
Number of Percentage of departments departments
Yes 20 54.1
No 17 45.9
Total respondents 37
25a Were your year-end financial statements for 2005-06 considered by the departmental Board prior to being approved by your Accounting Officer?
Date that statements were Number of Percentage of forwarded to the Board departments departments
May 2006 1 6.3
June 2006 9 56.3
July 2006 3 18.8
August 2006 1 6.3
September 2006 1 6.3
October 2006 1 6.3
Total respondents 16
25b If yes, on what date were they forwarded to the Board?

Section three BOARD LEvEL OvERSIGHT OF DEPARTMENTAL RESOURCES
2�
Date that statements were given final approval Number of Percentage of departments departments
May 2006 2 5.7
June 2006 7 20.0
July 2006 21 60.0
August 2006 0 0.0
September 2006 1 2.9
October 2006 2 5.7
November 2006 2 5.7
Total respondents 35
26 On what date were your financial accounts for 2005-06 given final approval by your Accounting Officer?
0
10
20
30
40
50
60
70
Apr-06 May-06 Jun-06 Jul-06 Aug-06 Sep-06 Oct-06 Nov-06
Date
Forwarded to Audit Committee Forwarded to Departmental Board Approved by AO
Percentage

27
Section three BOARD LEvEL OvERSIGHT OF DEPARTMENTAL RESOURCES
Barrier
Availability of external information
Availability of internal information (linked to systems control)
Audit and clearance timetable
Internal systems and procedures
Lack of staff numbers and experience
Changes to internal structure and procedures and external governmental changes
Resolving problems with the accounts
Culture and attitude
Writing, proofing and publishing final accounts
27 What are the main barriers to your department being able to finalise its year-end financial statements earlier?
Details
Including, but not limited to, delays in receiving invoices from suppliers, pension information, loans data, receipts and income information and staff bonus data.
Including, but not limited to, delays in receiving accounts information from Agencies, NDPBs and other reporting bodies such as overseas and geographic offices, as well as from the higher Department. This increases the time taken to consolidate accounts.
Including, but not limited to, time taken for contracted out audit and NAO audit. The time taken to supply information for audit, the fact that the majority of audit work is at year-end, delays to Audit Committee and Board meetings, sometimes lengthy testing and clearance of management commentary all lengthen the accounting timetable.
Where problems with processes and systems have been identified, work is in hand to resolve them. Problems include but are not limited to leaving the bulk of the work until year-end with many departments mentioning attempts to bring work forward to be completed earlier in the year, and problems with collating data with integrated systems management proposed.
High staff turnover in key posts and lowered staffing levels are stretching resources.
Including, but not limited to, extra testing of new software systems and senior management changes. Departments must adapt to the changes alongside completing the year-end accounts.
It was commented that this would be less of an issue were issues to be identified and dealt with throughout the year.
Attitudes may include a lack of desire to speed up the final accounting process with low priority given to decreasing turnaround and the production of the final accounts seen as a year-end add-on duty.
The practical timetable of producing the final accounts.
Departments were invited to give free text responses, which were later grouped according to recurring themes. The list below is a summary of the main themes in no particular order of significance.

Section three BOARD LEvEL OvERSIGHT OF DEPARTMENTAL RESOURCES
28
A full assessment of the financial implications of the proposals
An assessment of the financial and operational performance implications of the ‘do nothing’ option
Identification of the main financial and operational risks
A full assessment of the anticipated impact on operational performance
Alternative options detailing comparative data on expected costs and operational impact
Confirmation from the finance function that they have verified the financial assessment
Identification of the main factors driving costs, income and outputs, together with a quantification of the impact of different scenarios
An assessment of the likely social, economic and environmental impacts
MEAN
28 How often is the following information included in submissions to Ministers or Board members for policy proposals?
Number of depts
1
1
0
1
1
3
1
3
% of depts
5.4
5.6
0.0
5.6
8.3
8.3
16.7
21.6
8.9
Number of depts
2
2
0
2
3
3
6
8
% of depts
21.6
22.2
30.6
33.3
30.6
30.6
27.8
29.7
28.3
Number of depts
8
8
11
12
11
11
10
11
% of depts
29.7
50.0
47.2
36.1
33.3
36.1
36.1
24.3
36.6
Number of depts
11
18
17
13
12
13
13
9
% of depts
40.5
19.4
22.2
22.2
25.0
16.7
16.7
16.2
22.4
Number of depts
15
7
8
8
9
6
6
6
Total respondents
37
36
36
36
36
36
36
37
% of depts
2.7
2.8
0.0
2.8
2.8
8.3
2.8
8.1
3.8
Invariably Usually Sometimes Seldom Never

29
Section three BOARD LEvEL OvERSIGHT OF DEPARTMENTAL RESOURCES
28 How often is the following information included in submissions to Ministers or Board members for policy proposals? continued ...
Type of information
An assessment of the likely social, economic and environmental impacts
0 10 20 30 40 50 60 70 80 90 100
Percentage
Identi�cation of the main factors driving costs, income and outputs, together with a quanti�cation of the impact of di�erent scenarios
Con�rmation from the �nance function that they have veri�ed the �nancial assessment
Alternative options detailing comparative data on expected costs and operational impact
A full assessment of the anticipated impact on operational performance
Identi�cation of the main �nancial and operational risks
An assessment of the �nancial and operational performance implications of the ‘do nothing’ option
A full assessment of the �nancial implications of the proposals
Invariably Usually Sometimes Seldom Never

Section three BOARD LEvEL OvERSIGHT OF DEPARTMENTAL RESOURCES
30
Number of Percentage of departments departments
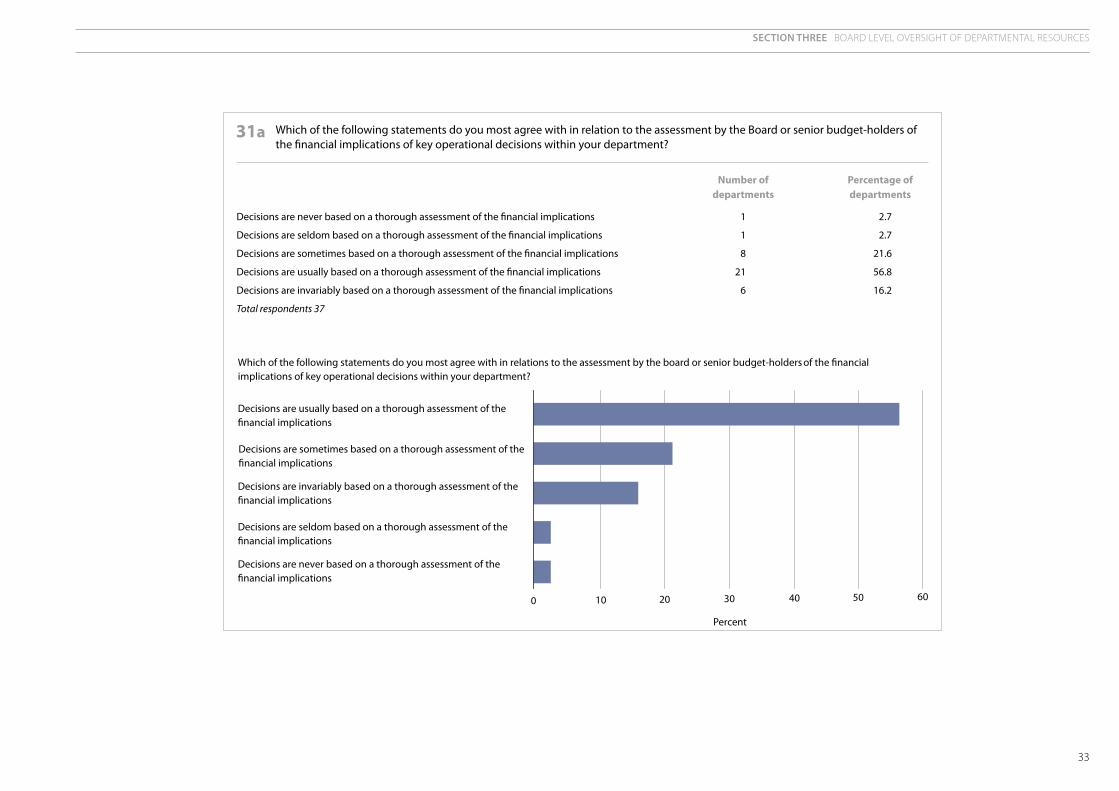
Decisions are never based on a thorough assessment of the financial implications 0 0.0
Decisions are seldom based on a thorough assessment of the financial implications 1 2.9
Decisions are sometimes based on a thorough assessment of the financial implications 10 28.6
Decisions are usually based on a thorough assessment of the financial implications 17 48.6
Decisions are invariably based on a thorough assessment of the financial implications 7 20.0
Total respondents 35
29 Which of the following statements do you most agree with in relation to the assessment by the Board or senior budget-holders of the financial implications of policy proposals within your department?
Which of the following statements do you most agree with in relation to the assessment by the budget or senior buget-holders of the financial implications of policy proposals within your department?
Decisions are usually based on a thorough assessment of the financial implications
Decisions are sometimes based on a thorough assessment of the financial implications
Decisions are invariably based on a thorough assessment of the financial implications
Decisions are seldom based on a thorough assessment of the financial implications
Decisions are never based on a thorough assessment of the financial implications
0 10 20 30 40 50 60
Percent

31
Section three BOARD LEvEL OvERSIGHT OF DEPARTMENTAL RESOURCES
Type of information
A full assessment of the financial implications of the proposals
A full assessment of the anticipated impact on operational performance
Confirmation from the finance function that they have verified the financial assessment
Identification of the main financial and operational risks
Alternative options detailing comparative data on expected costs and operational impact
An assessment of the financial and operational performance implications of the ‘do nothing’ option
An assessment of the likely social, economic and environmental impacts
Identification of the main factors driving costs, income and outputs, together with a quantification of the impact of different scenarios
30a How often is the following information included in submissions to Ministers or Board members for key operational decisions and investments?
Number of depts
1
1
2
1
1
1
3
1
% of depts
2.8
5.6
5.4
0.0
5.6
5.6
25.0
11.1
Number of depts
1
2
2
0
2
2
9
4
% of depts
11.1
16.7
13.5
22.2
27.8
22.2
25.0
30.6
Number of depts
4
6
5
8
10
8
9
11
% of depts
50.0
44.4
51.4
52.8
41.7
50.0
33.3
47.2
Number of depts
18
16
19
19
15
18
12
17
% of depts
33.3
30.6
24.3
22.2
22.2
19.4
8.3
8.3
Number of depts
12
11
9
8
8
7
3
3
Total respondents
36
36
37
36
36
36
36
36
% of depts
2.8
2.8
5.4
2.8
2.8
2.8
8.3
2.8
Key Operational Decisions Invariably Usually Sometimes Seldom Never

Section three BOARD LEvEL OvERSIGHT OF DEPARTMENTAL RESOURCES
32
Type of information
A full assessment of the financial implications of the proposals
Confirmation from the finance function that they have verified the financial assessment
Identification of the main financial and operational risks
An assessment of the financial and operational performance implications of the ‘do nothing’ option
A full assessment of the anticipated impact on operational performance
Alternative options detailing comparative data on expected costs and operational impact
Identification of the main factors driving costs, income and outputs, together with a quantification of the impact of different scenarios
An assessment of the likely social, economic and environmental impacts
30b How often is the following information included in submissions to Ministers or Board members for key operational decisions and investments?
Number of depts
1
2
0
1
1
1
1
3
% of depts
0.0
3.1
3.1
3.1
3.1
0.0
9.4
18.8
Number of depts
0
1
1
1
1
0
3
6
% of depts
3.1
3.1
12.5
6.3
6.3
15.6
18.8
34.4
Number of depts
1
1
4
2
2
5
6
11
% of depts
37.5
43.8
43.8
53.1
53.1
50.0
53.1
28.1
Number of depts
12
14
14
17
17
16
17
9
% of depts
56.3
43.8
40.6
34.4
34.4
31.3
15.6
9.4
Number of depts
18
14
13
11
11
10
5
3
Total respondents
32
32
32
32
32
32
32
32
% of depts
3.1
6.3
0.0
3.1
3.1
3.1
3.1
9.4
Investments Invariably Usually Sometimes Seldom Never
33
Section three BOARD LEvEL OvERSIGHT OF DEPARTMENTAL RESOURCES
Number of Percentage of departments departments
Decisions are never based on a thorough assessment of the financial implications 1 2.7
Decisions are seldom based on a thorough assessment of the financial implications 1 2.7
Decisions are sometimes based on a thorough assessment of the financial implications 8 21.6
Decisions are usually based on a thorough assessment of the financial implications 21 56.8
Decisions are invariably based on a thorough assessment of the financial implications 6 16.2
Total respondents 37
31a Which of the following statements do you most agree with in relation to the assessment by the Board or senior budget-holders of the financial implications of key operational decisions within your department?
Which of the following statements do you most agree with in relations to the assessment by the board or senior budget-holders of the financial implications of key operational decisions within your department?
Decisions are usually based on a thorough assessment of the financial implications
Decisions are sometimes based on a thorough assessment of the financial implications
Decisions are invariably based on a thorough assessment of the financial implications
Decisions are seldom based on a thorough assessment of the financial implications
Decisions are never based on a thorough assessment of the financial implications
0 10 20 30 40 50 60
Percent
Section three BOARD LEvEL OvERSIGHT OF DEPARTMENTAL RESOURCES
34
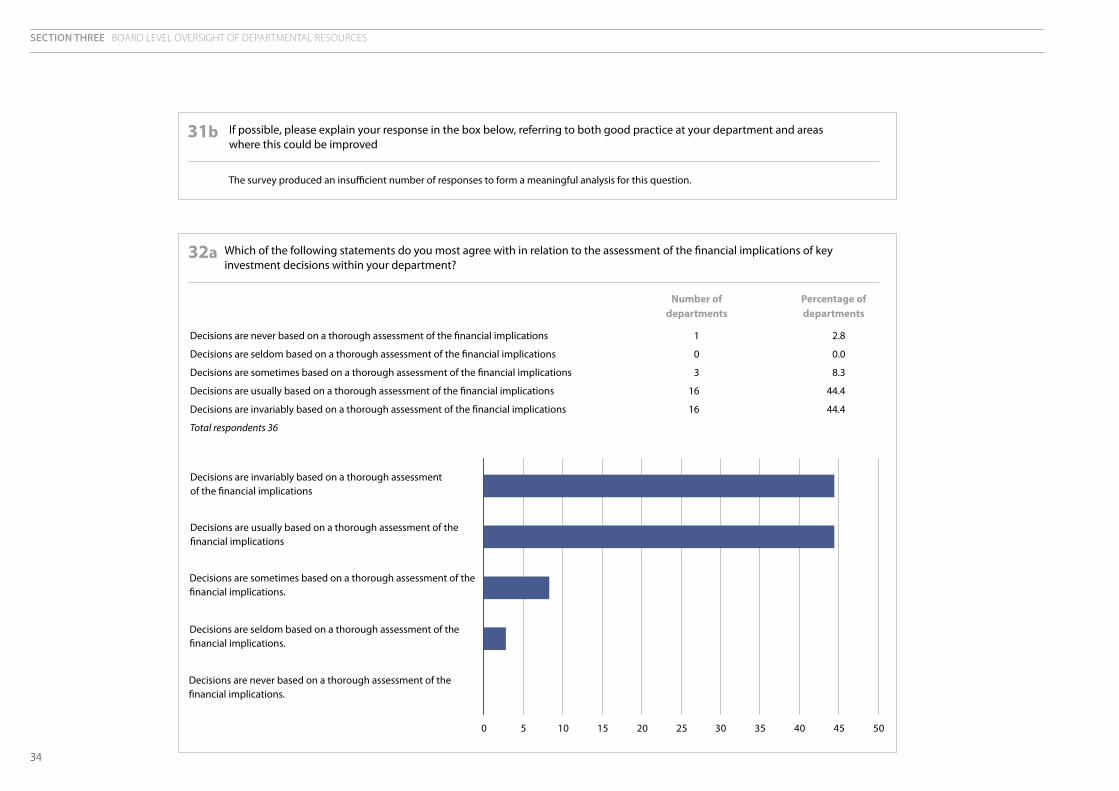
31b If possible, please explain your response in the box below, referring to both good practice at your department and areas where this could be improved
The survey produced an insufficient number of responses to form a meaningful analysis for this question.
32a Which of the following statements do you most agree with in relation to the assessment of the financial implications of key investment decisions within your department?
Decisions are invariably based on a thorough assessmentof the financial implications
Decisions are usually based on a thorough assessment of thefinancial implications
Decisions are sometimes based on a thorough assessment of thefinancial implications.
Decisions are seldom based on a thorough assessment of thefinancial implications.
Decisions are never based on a thorough assessment of thefinancial implications.
0 5 10 15 20 25 30 35 40 45 50
Number of Percentage of departments departments
Decisions are never based on a thorough assessment of the financial implications 1 2.8
Decisions are seldom based on a thorough assessment of the financial implications 0 0.0
Decisions are sometimes based on a thorough assessment of the financial implications 3 8.3
Decisions are usually based on a thorough assessment of the financial implications 16 44.4
Decisions are invariably based on a thorough assessment of the financial implications 16 44.4
Total respondents 36

35
Section three BOARD LEvEL OvERSIGHT OF DEPARTMENTAL RESOURCES
32b If possible, please explain your response in the box below, referring to both good practice at your department and areas where this could be improved
The survey produced an insufficient number of responses to form a meaningful analysis for this question
33 Please provide up to three examples of instances, when financial and operational performance information has been successfully used to inform major resource allocation decisions in-year (for example to switch resources between programmes or to scale back/cease a poorly performing or obsolete programme). Where possible, please briefly describe the impact of the decision on financial and operational performance
The survey produced an insufficient number of responses to form a meaningful analysis for this question

3�
SECTION FOUR
Matching expenditure more closely to service needs
34 In percentage terms, what proportion of your expenditure was spent in each quarter of each financial year since 2002-03?
The survey produced an insufficient number of responses to form a meaningful analysis for this question. The chart below is derived from an analysis of published data on Central Government Current Expenditure (CGCE) and Central Government Net Investment (CGNI).
Percentage of spending
CGCE – Quarter 1 CGCE – Quarter 2 CGCE – Quarter 3 CGCE – Quarter 4
CGNI – Quarter 1 CGNI – Quarter 2 CGNI – Quarter 3 CGNI – Quarter 4
Financial year
2002-03 2003-04 2004-05 2005-06 2006-07-10
0
10
20
30
40
50
37
Section four MATCHING EXPENDITURE MORE CLOSELY TO SERvICE NEEDS
35a In 2005-06, what was your department’s variance against final expenditure provision for DEL resource expenditure?
Percentage
0
10
20
30
40
50
60
70
80
0-5 6-10 11-25 26-50 51-100
Variance
Variance Number of Percentage of departments departments
0-5 25 67.6
6-10 6 16.2
11-25 1 2.7
26-50 2 5.4
51-100 3 8.1
Total respondents 37
35b What were the three main reasons for this variance?
Departments were invited to give free text responses, which were later grouped according to recurring themes.
Number of Percentage of responses responses
Expenditure different than expected 15 18.8 or savings made during the year
Timing differences 11 13.8
Expenditure area difficult to forecast 9 11.3
No overriding factor 9 11.3
Unused contingency 6 7.5
Change in accounting treatment 5 6.3
Income different than expected 5 6.3
Payroll costs lower than expected 5 6.3
Cushion provided against overspend 4 5.0
Underspend by funded body 4 5.0
Lower cost of capital than expected 2 2.5 due to fluctuation of value of estate
Planning problems 2 2.5
Non-aligned responsibilities 1 1.3
Level of HMT oversight 1 1.3
Poor financial awareness 1 1.3 of non-financial staff
Total responses4 80
4. Of the 37 departments given an opportunity to respond, 35 provided at least one response.
Section four MATCHING EXPENDITURE MORE CLOSELY TO SERvICE NEEDS
38
36 In the box below, please detail all DEL reserve claims made by the Department from 2002-2003 onwards, stating the main reason for the claims, their value and whether they were granted by HM Treasury
Responses to this question are department specific and so are not disclosed in this document.
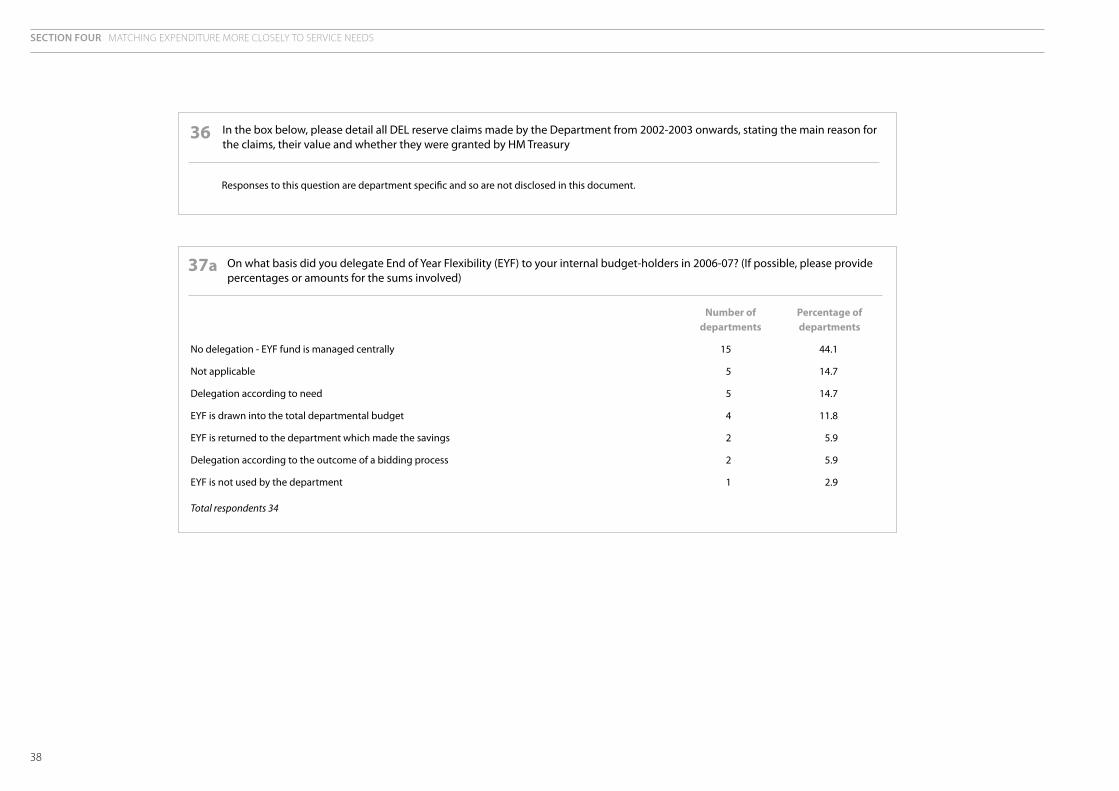
37a On what basis did you delegate End of Year Flexibility (EYF) to your internal budget-holders in 2006-07? (If possible, please provide percentages or amounts for the sums involved)
No delegation - EYF fund is managed centrally
Not applicable
Delegation according to need
EYF is drawn into the total departmental budget
EYF is returned to the department which made the savings
Delegation according to the outcome of a bidding process
EYF is not used by the department
Total respondents 34
Percentage of departments
44.1
14.7
14.7
11.8
5.9
5.9
2.9
Number of departments
15
5
5
4
2
2
1
39
Section four MATCHING EXPENDITURE MORE CLOSELY TO SERvICE NEEDS
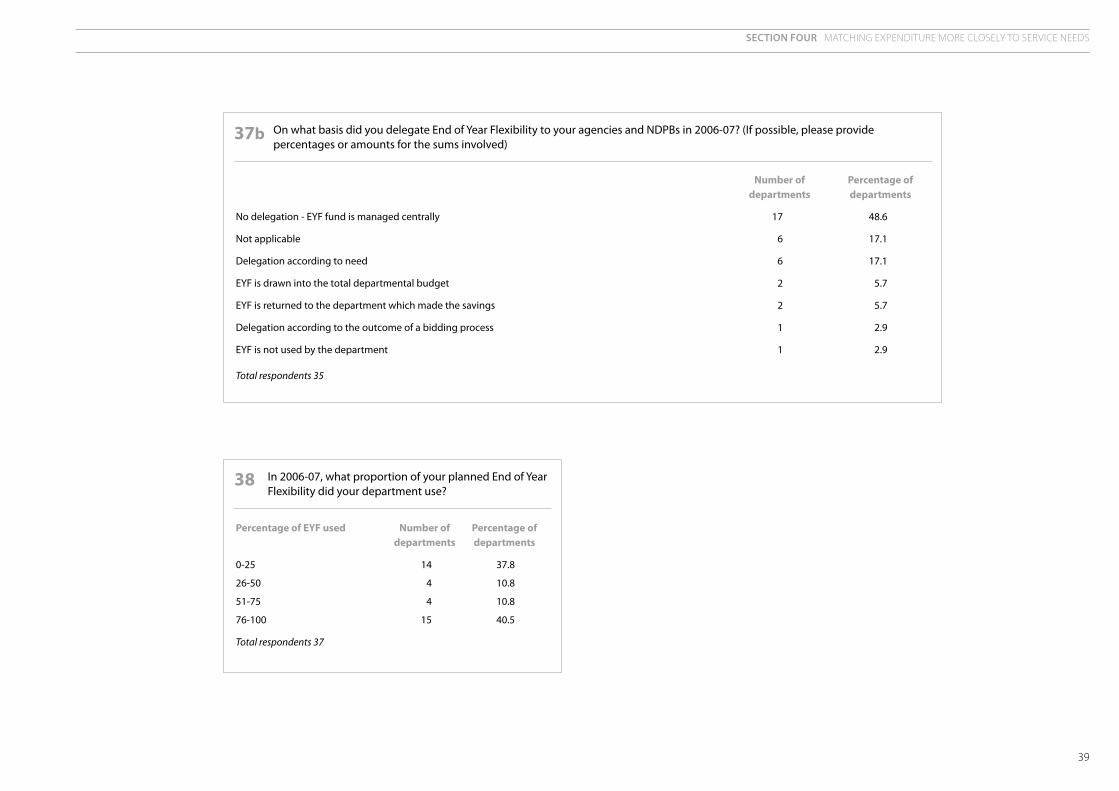
37b On what basis did you delegate End of Year Flexibility to your agencies and NDPBs in 2006-07? (If possible, please provide percentages or amounts for the sums involved)
No delegation - EYF fund is managed centrally
Not applicable
Delegation according to need
EYF is drawn into the total departmental budget
EYF is returned to the department which made the savings
Delegation according to the outcome of a bidding process
EYF is not used by the department
Total respondents 35
Percentage of departments
48.6
17.1
17.1
5.7
5.7
2.9
2.9
Number of departments
17
6
6
2
2
1
1
38 In 2006-07, what proportion of your planned End of Year Flexibility did your department use?
Percentage of EYF used Number of Percentage of departments departments
0-25 14 37.8
26-50 4 10.8
51-75 4 10.8
76-100 15 40.5
Total respondents 37
Section four MATCHING EXPENDITURE MORE CLOSELY TO SERvICE NEEDS
40
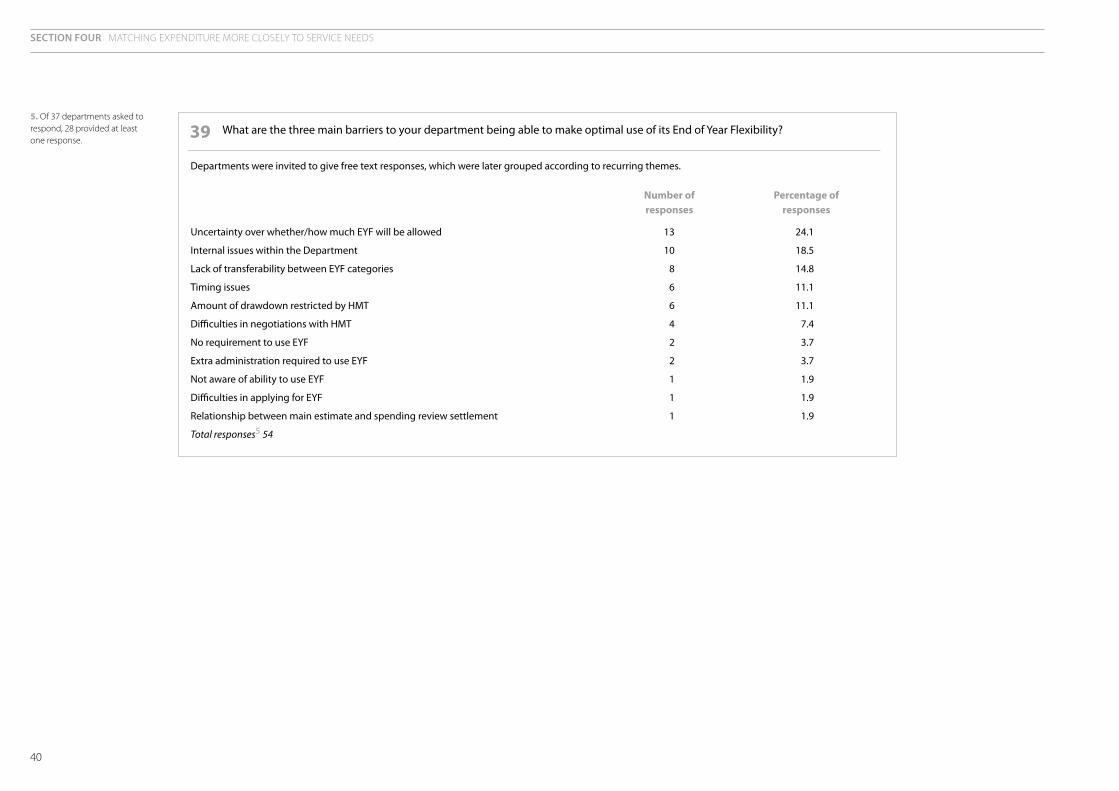
39 What are the three main barriers to your department being able to make optimal use of its End of Year Flexibility?
Departments were invited to give free text responses, which were later grouped according to recurring themes.
Number of Percentage of responses responses
Uncertainty over whether/how much EYF will be allowed 13 24.1
Internal issues within the Department 10 18.5
Lack of transferability between EYF categories 8 14.8
Timing issues 6 11.1
Amount of drawdown restricted by HMT 6 11.1
Difficulties in negotiations with HMT 4 7.4
No requirement to use EYF 2 3.7
Extra administration required to use EYF 2 3.7
Not aware of ability to use EYF 1 1.9
Difficulties in applying for EYF 1 1.9
Relationship between main estimate and spending review settlement 1 1.9
Total responses5 54
5. Of 37 departments asked to respond, 28 provided at least one response.

41
Section four MATCHING EXPENDITURE MORE CLOSELY TO SERvICE NEEDS
0 10 20 30
Internal issues within the Department
Lack of transferability between EYF categories
Timing issues
Amount of drawdown restricted by HM Treasury
Difficulties in negotiations with HM Treasury
No requirement to use EYF
Extra administration required to use EYF
Not aware of ability to use EYF
Difficulties in applying for EYF
Barrier
Percentage
Relationship between main estimate and spending review settlement
Uncertainty over whether/how much EYF will be allowed
39 What are the three main barriers to your department being able to make optimal use of its End of Year Flexibility? continued...
42
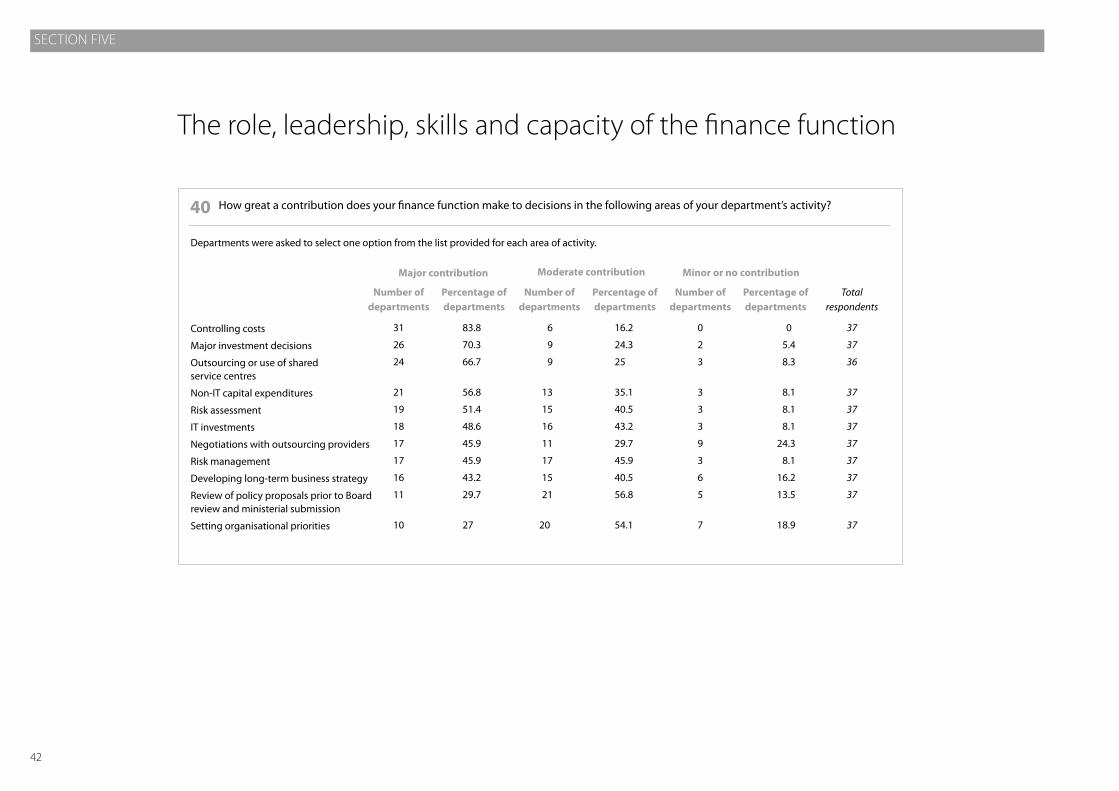
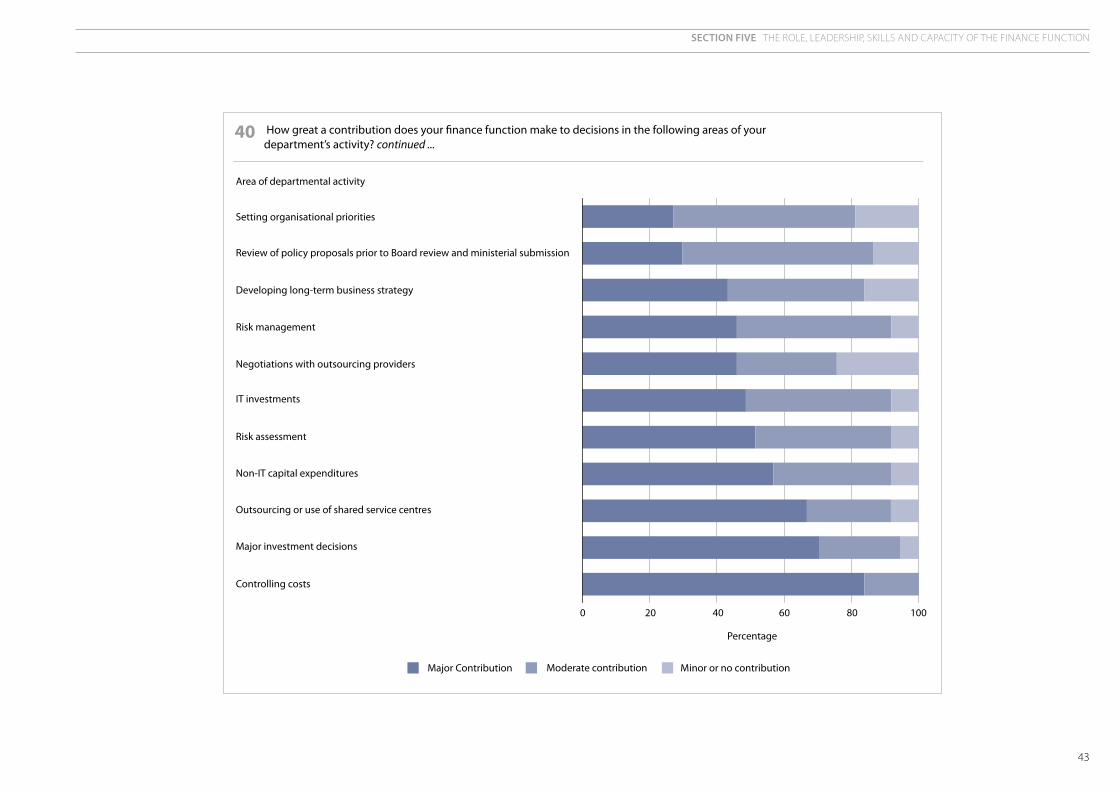
40 How great a contribution does your finance function make to decisions in the following areas of your department’s activity?
Controlling costs
Major investment decisions
Outsourcing or use of shared service centres
Non-IT capital expenditures
Risk assessment
IT investments
Negotiations with outsourcing providers
Risk management
Developing long-term business strategy
Review of policy proposals prior to Board review and ministerial submission
Setting organisational priorities
Total respondents
37
37
36
37
37
37
37
37
37
37
37
Percentage of departments
0
5.4
8.3
8.1
8.1
8.1
24.3
8.1
16.2
13.5
18.9
Number of departments
0
2
3
3
3
3
9
3
6
5
7
Percentage of departments
16.2
24.3
25
35.1
40.5
43.2
29.7
45.9
40.5
56.8
54.1
Number of departments
6
9
9
13
15
16
11
17
15
21
20
Percentage of departments
83.8
70.3
66.7
56.8
51.4
48.6
45.9
45.9
43.2
29.7
27
Number of departments
31
26
24
21
19
18
17
17
16
11
10
Major contribution Moderate contribution Minor or no contribution
Departments were asked to select one option from the list provided for each area of activity.
The role, leadership, skills and capacity of the finance function
SECTION FIvE
43
40 How great a contribution does your finance function make to decisions in the following areas of your department’s activity? continued ...
Setting organisational priorities
0 20 40 60 80 100
Percentage
Review of policy proposals prior to Board review and ministerial submission
Developing long-term business strategy
Risk management
IT investments
Risk assessment
Non-IT capital expenditures
Area of departmental activity
Major Contribution Moderate contribution Minor or no contribution
Outsourcing or use of shared service centres
Major investment decisions
Controlling costs
Negotiations with outsourcing providers
Section five THE ROLE, LEADERSHIP, SKILLS AND CAPACITY OF THE FINANCE FUNCTION
Section five THE ROLE, LEADERSHIP, SKILLS AND CAPACITY OF THE FINANCE FUNCTION
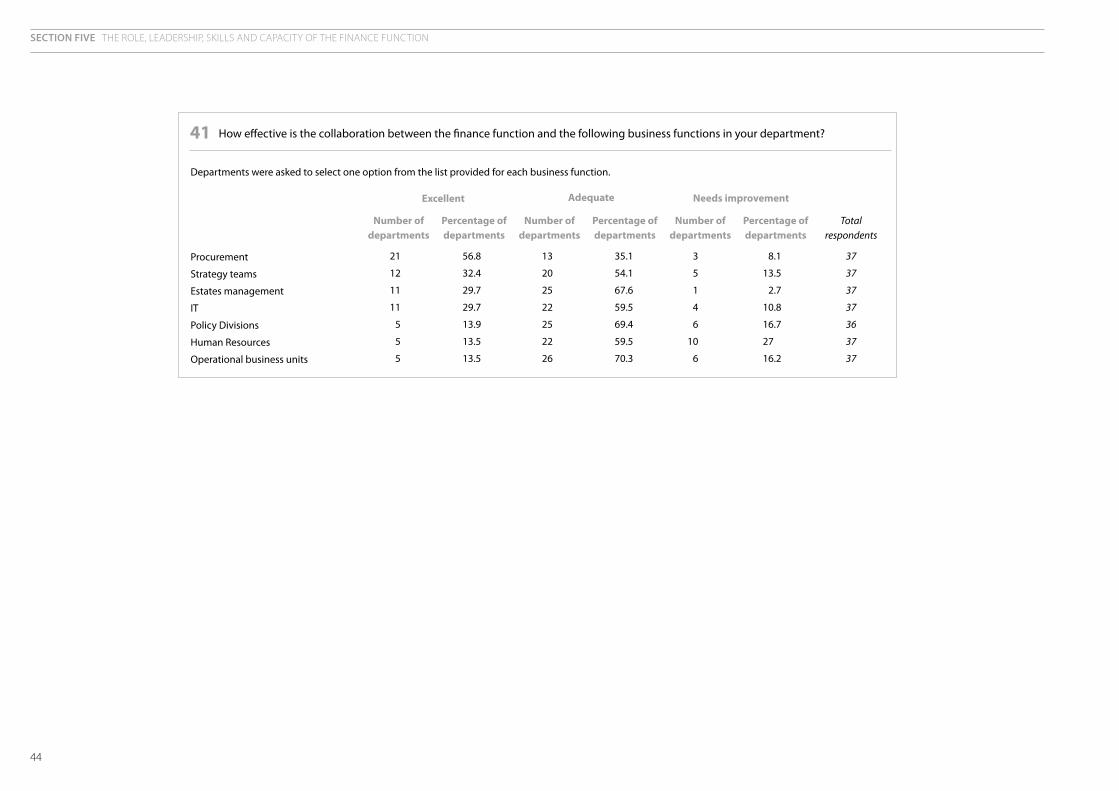
44
41 How effective is the collaboration between the finance function and the following business functions in your department?
Procurement
Strategy teams
Estates management
IT
Policy Divisions
Human Resources
Operational business units
Total respondents
37
37
37
37
36
37
37
Percentage of departments
8.1
13.5
2.7
10.8
16.7
27
16.2
Number of departments
3
5
1
4
6
10
6
Percentage of departments
35.1
54.1
67.6
59.5
69.4
59.5
70.3
Number of departments
13
20
25
22
25
22
26
Percentage of departments
56.8
32.4
29.7
29.7
13.9
13.5
13.5
Number of departments
21
12
11
11
5
5
5
Excellent Adequate Needs improvement
Departments were asked to select one option from the list provided for each business function.

45
Section five THE ROLE, LEADERSHIP, SKILLS AND CAPACITY OF THE FINANCE FUNCTION
41 How effective is the collaboration between the finance function and the following business functions in your department? continued ...
0 20 40 60 80 100
Procurement
Strategy teams
IT
Policy Divisions
Percentage
Operational business units
Human Resources
Estates management
Business function
Excellent Adequate Needs Improvement
Section five THE ROLE, LEADERSHIP, SKILLS AND CAPACITY OF THE FINANCE FUNCTION
4�
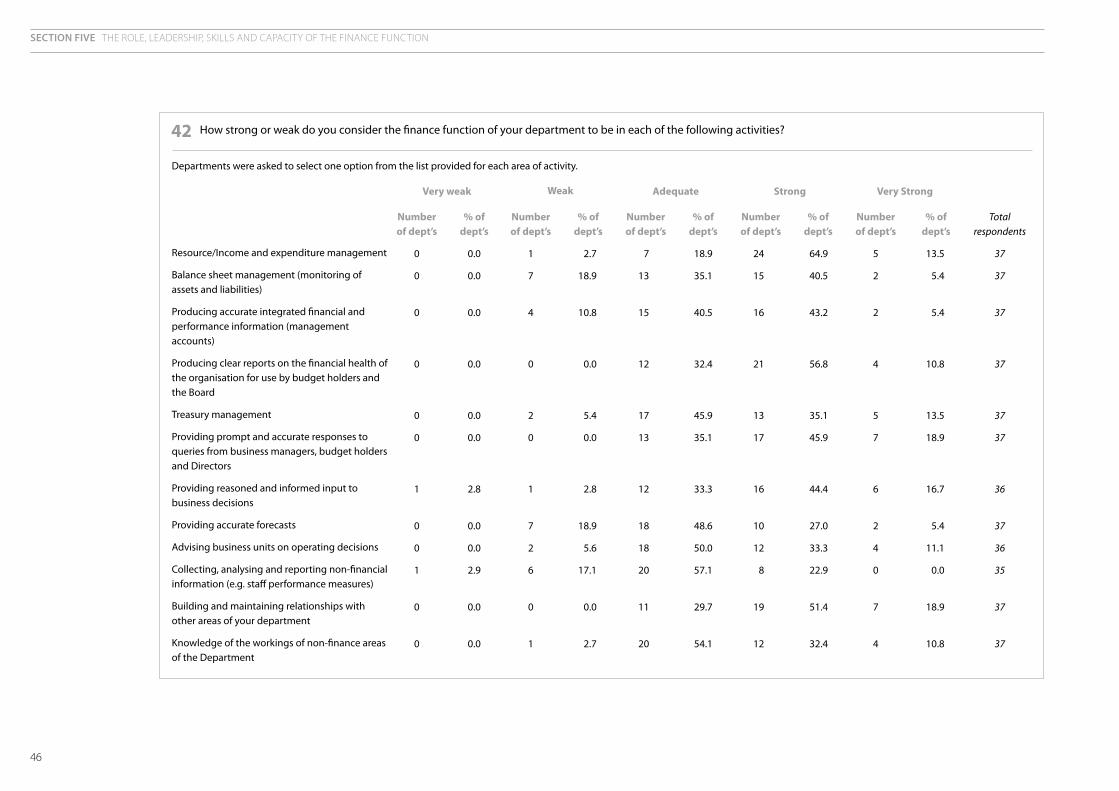
Resource/Income and expenditure management
Balance sheet management (monitoring of assets and liabilities)
Producing accurate integrated financial and performance information (management accounts)
Producing clear reports on the financial health of the organisation for use by budget holders and the Board
Treasury management
Providing prompt and accurate responses to queries from business managers, budget holders and Directors
Providing reasoned and informed input to business decisions
Providing accurate forecasts
Advising business units on operating decisions
Collecting, analysing and reporting non-financial information (e.g. staff performance measures)
Building and maintaining relationships with other areas of your department
Knowledge of the workings of non-finance areas of the Department
42 How strong or weak do you consider the finance function of your department to be in each of the following activities?
Number of dept’s
5
2
2
4
5
7
6
2
4
0
7
4
% of dept’s
64.9
40.5
43.2
56.8
35.1
45.9
44.4
27.0
33.3
22.9
51.4
32.4
Number of dept’s
24
15
16
21
13
17
16
10
12
8
19
12
% of dept’s
18.9
35.1
40.5
32.4
45.9
35.1
33.3
48.6
50.0
57.1
29.7
54.1
Number of dept’s
7
13
15
12
17
13
12
18
18
20
11
20
% of dept’s
2.7
18.9
10.8
0.0
5.4
0.0
2.8
18.9
5.6
17.1
0.0
2.7
Number of dept’s
1
7
4
0
2
0
1
7
2
6
0
1
% of dept’s
0.0
0.0
0.0
0.0
0.0
0.0
2.8
0.0
0.0
2.9
0.0
0.0
Number of dept’s
0
0
0
0
0
0
1
0
0
1
0
0
Total respondents
37
37
37
37
37
37
36
37
36
35
37
37
% of dept’s
13.5
5.4
5.4
10.8
13.5
18.9
16.7
5.4
11.1
0.0
18.9
10.8
Departments were asked to select one option from the list provided for each area of activity.
Very weak Weak Adequate Strong Very Strong

47
Section five THE ROLE, LEADERSHIP, SKILLS AND CAPACITY OF THE FINANCE FUNCTION
42 How strong or weak do you consider the finance function of your department to be in each of the following activities? continued ...
0 20 40 60 80 100
Knowledge of the workings of non-finance areas of the Department
Building and maintaining relationships with other areas of your department
Collecting, analysing and reporting non-financial information (e.g. staff performance measures)
Advising business units on operating decisions
Providing accurate forecasts
Providing reasoned and informed input to business decisions
Providing prompt and accurate responses to queries from business managers, budget holders and Directors
Treasury management
Producing clear reports on the financial health of the organisation for use by budget holders and the board
Producing accurate integrated financial and performance information (management accounts)
Balance sheet management (monitoring of assets and liabilities)
Resource/Income and expenditure management
Activity
Very weak Weak Adequate Strong Very Strong
Section five THE ROLE, LEADERSHIP, SKILLS AND CAPACITY OF THE FINANCE FUNCTION
48
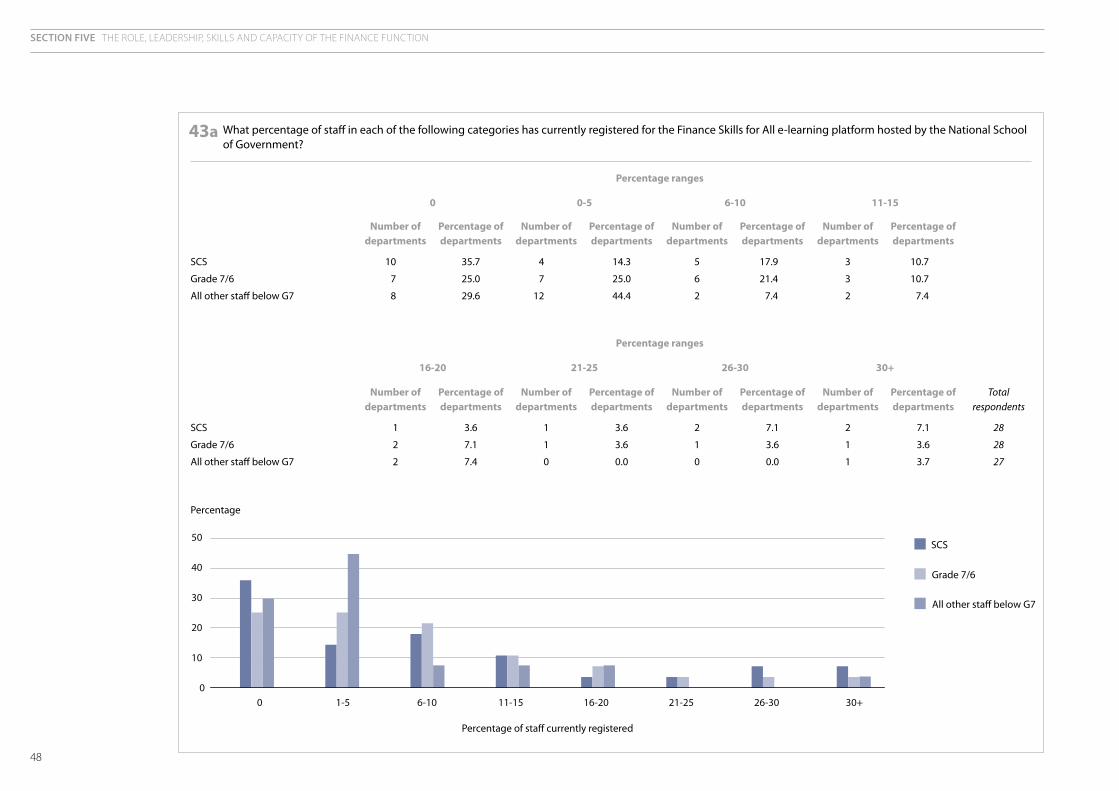
43a What percentage of staff in each of the following categories has currently registered for the Finance Skills for All e-learning platform hosted by the National School of Government?
SCS
Grade 7/6
All other staff below G7
Percentage of departments
10.7
10.7
7.4
Number of departments
3
3
2
Percentage of departments
17.9
21.4
7.4
Number of departments
5
6
2
Percentage of departments
14.3
25.0
44.4
Number of departments
4
7
12
Percentage of departments
35.7
25.0
29.6
Number of departments
10
7
8
0 0-5 6-10 11-15
Percentage ranges
SCS
Grade 7/6
All other staff below G7
Total respondents
28
28
27
Percentage of departments
7.1
3.6
3.7
Number of departments
2
1
1
Percentage of departments
7.1
3.6
0.0
Number of departments
2
1
0
Percentage of departments
3.6
3.6
0.0
Number of departments
1
1
0
Percentage of departments
3.6
7.1
7.4
Number of departments
1
2
2
16-20 21-25 26-30 30+
Percentage ranges
Percentage
Percentage of staff currently registered
SCS
Grade 7/6
All other staff below G7
0
10
20
30
40
50
0 1-5 6-10 11-15 16-20 21-25 26-30 30+

49
Section five THE ROLE, LEADERSHIP, SKILLS AND CAPACITY OF THE FINANCE FUNCTION
43b What percentage of your staff in each of the following categories has successfully completed the Finance Skills for All e-learning programme?
SCS
Grade 7/6
All other staff below G7
Percentage of departments
0.0
0.0
0.0
Number of departments
0
0
0
Percentage of departments
3.7
3.6
3.8
Number of departments
1
1
1
Percentage of departments
25.9
39.3
26.9
Number of departments
7
11
7
Percentage of departments
66.7
50.0
65.4
Number of departments
18
14
17
0 0-5 6-10 11-15
Percentage ranges
SCS
Grade 7/6
All other staff below G7
Total respondents
27
28
26
Percentage of departments
3.7
0.0
3.8
Number of departments
1
0
1
Percentage of departments
0.0
0.0
0.0
Number of departments
0
0
0
Percentage of departments
0.0
3.6
0.0
Number of departments
0
1
0
Percentage of departments
0.0
3.6
0.0
Number of departments
0
1
0
16-20 21-25 26-30 30+
Percentage ranges
0
10
20
30
40
50
60
70
0 1-5 6-10 11-15 16-20 21-25 26-30 30+
Percentage
Percentage of staff who have completed the course
SCS
Grade 7/6
All other staff below G7

Section five THE ROLE, LEADERSHIP, SKILLS AND CAPACITY OF THE FINANCE FUNCTION
50
44 For each of the following categories of staff, please describe the financial management training received by staff (aside from the ‘Finance Skills for All’ e-learning platform and associated National School of Government training provision) in your department and provide an estimate of the percentage of staff in this category that have received this training
a Training received by Board members.
b Training received by finance staff.
c Training received by non-finance staff
Responses to these questions are department specific and so are not disclosed in this document.
45 How many full meetings of the Department’s Audit Committee were held during the financial year ending 31 March 2007?
Number of Percentage of departments departments
2 1 2.7
3 8 21.6
4 18 48.6
5 9 24.3
6 1 2.7
Total respondents 37
46 Is the Department’s Audit Committee chaired independently?
Number of Percentage of departments departments
Yes 36 97.3
No 1 2.7
Total respondents 37
47 Does the chair or any member of the Department’s Audit Committee hold a qualification recognised by any of the six members of the Consultative Committee of Accountancy Bodies (CCAB)?
Number of Percentage of departments departments
Yes 31 91.2
No 3 8.8
Total respondents 34

51
Section five THE ROLE, LEADERSHIP, SKILLS AND CAPACITY OF THE FINANCE FUNCTION
48 Thinking of your answers to previous questions, please tick the THREE of the following you consider to be the most significant barriers to improving resource management in your department
Poor financial awareness amongst non-finance staff
A lack of incentives to encourage senior budget holders to increase the role of financial and resource management in the management of departmental programmes
Difficulties in finding, training and retaining suitably skilled and qualified finance staff
Inadequate performance management and management accounting information on which to base future resource allocation decisions
Business processes which have not been reviewed for some time, and which do not fit the current requirements of the organisation
IT systems from which you are unable to produce automated information on the financial performance of the Department
Other
Insufficient support from the Board for raising the profile of financial and resource management across the organisation
Accounting IT systems which are incompatible with one another
Total respondents
35
35
35
35
35
35
35
35
35
Percentage of departments
31.4
37.1
60
60
68.6
82.9
85.7
94.3
97.1
Number of departments
11
13
21
21
24
29
30
33
34
Percentage of departments
68.6
62.9
40
40
31.4
17.1
14.3
5.7
2.9
Number of departments
24
22
14
14
11
6
5
2
1
Yes No
Departments were asked to select three options from the list provided.
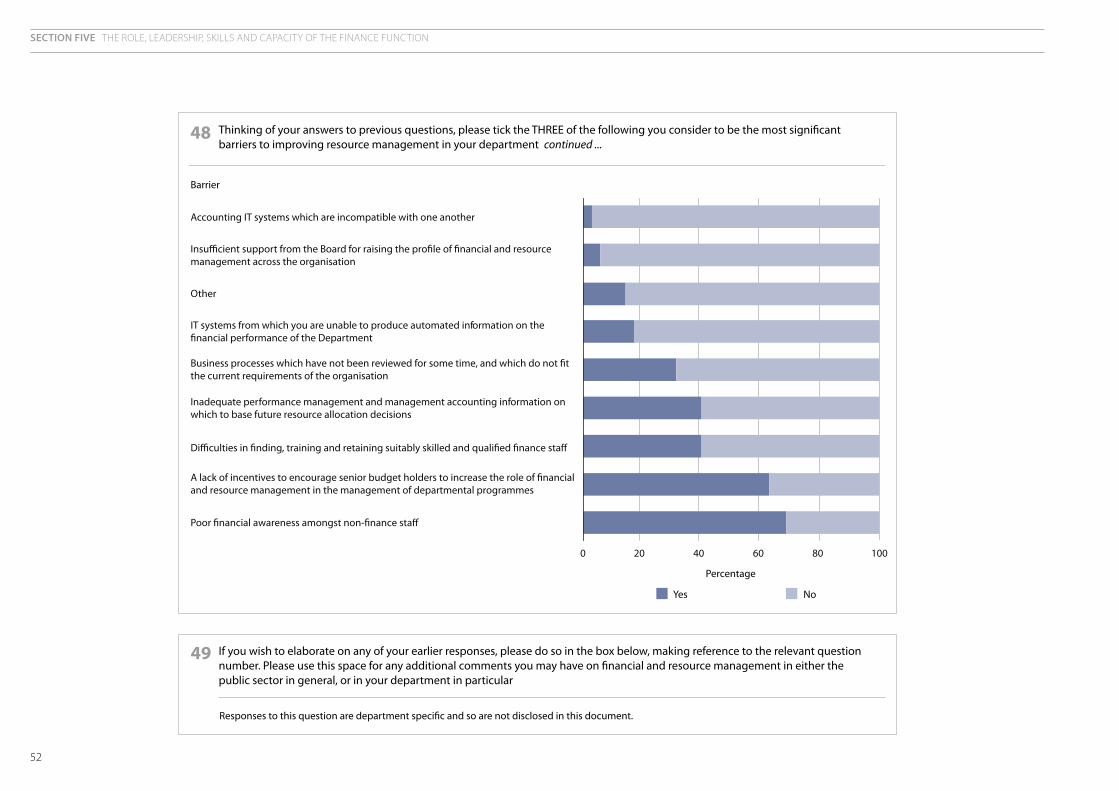
Section five THE ROLE, LEADERSHIP, SKILLS AND CAPACITY OF THE FINANCE FUNCTION
52
48 Thinking of your answers to previous questions, please tick the THREE of the following you consider to be the most significant barriers to improving resource management in your department continued ...
Barrier
Percentage
Yes No
0 20 40 60 80 100
Poor �nancial awareness amongst non-�nance sta�
Other
Accounting IT systems which are incompatible with one another
Insu�cient support from the Board for raising the pro�le of �nancial and resource management across the organisation
IT systems from which you are unable to produce automated information on the �nancial performance of the Department
Business processes which have not been reviewed for some time, and which do not �t the current requirements of the organisation
Inadequate performance management and management accounting information on which to base future resource allocation decisions
Di�culties in �nding, training and retaining suitably skilled and quali�ed �nance sta�
A lack of incentives to encourage senior budget holders to increase the role of �nancial and resource management in the management of departmental programmes
49 If you wish to elaborate on any of your earlier responses, please do so in the box below, making reference to the relevant question number. Please use this space for any additional comments you may have on financial and resource management in either the public sector in general, or in your department in particular
Responses to this question are department specific and so are not disclosed in this document.


Design & Production by NAO Marketing & Communications Team DP Ref: 8287RF | Printed by Dudfields