managing data for better rural wash
TRANSCRIPT

Tesfahun Molla
Project Officer, WASH
Ethiopia
Helvetas Swiss
Intercooperation
June 2018
Managing data for better Rural WASH

Presentation Outline
1. Description of the context
2. Key Issues
3. Stakeholders in WASH decision making
4. Decision making process
5. Challenges
6. Lessons Learnt

1. Description of the context
• Ethiopia’s water supply and sanitation coverage levels have significantly
improved in recent years from 19% and 4% in 1990 to 59% and 60%,
respectively, in 2017.
• However, there are still wide disparities and inequalities in progress and
coverage levels among the regions as well as between urban and rural
areas.
• Amhara National Regional State (ANRS) constitutes about 22.4% of the
total population of Ethiopia (82 million)
• Rural water supply and sanitation coverage in Amhara Region stood at
43.2% and 42.2%.
Location of The WASH intervention (Amhara Integrated WASH –
AIRWASH)
Country: Ethiopia
Regional State: Amhara
Zone: South Gondar
Districts: Dera, Fogera and Mecha
District Total Population
Dera 326,006
Fogera 321,922
Mecha 371,110

Geographical Location

Rationale for Intervention
Decision-making can only be as good as the underlying information.
A WASH Sector Assessment made by HSI in 2012/13 in Amhara
Region.
In response to the local government and community high demand for
WASH intervention in the HSI operational areas in the Amhara Region.
Criteria and data used to make decisions in selecting Districts
Estimated population without access to safe water supply and
basic sanitation
Incidence of water borne diseases
Visible on-going Woreda level initiatives in the WASH sector;
Potential to create synergies and complementarities among
WASH actors and other on-going HELVETAS projects in the
region.

Data from the assessment for intervention decision
S.No Woreda Number of
schemes/Functionality
Improved Hand Dug
Wells
Developed
Springs
Shallow Wells
Deep Well (mortised)
Spring sources
(Motorized Total
1 Dera
Functional 552 70 17 3 642
Non-Functional 138 10 2 150
Total 690 80 19 3 792
% Functional 80.0% 87.5% 89.5% 100.0% 81.1%
2 Fogera
Functional 448 9 6 0 463
Non-Functional 225 9 4 238
Total 673 18 10 0 701
% Functional 66.6% 50.0% 60.0% 0.0% 66.0%
3 Mecha
Functional 601 70 61 3 1 736
Non-Functional 12 4 4 0 0 20
Total 613 74 65 3 755
% Functional 98.0% 94.6% 93.8% 100.0% 97.5%

Socio-economic Conditions
Population dwelling or residing in the Districts is from
Amhara ethnicity
Language is Amharic
99% are Orthodox Christians and the rest 1% of the
populations are Muslims
88.5% of the Woreda Population lives on Agriculture,
1.7% on Trade and 9.8% on other businesses.
0.8 % civil servant.
Two Banks : Commercial Bank of Ethiopia and ACSI

Political aspect
Decentralization process in Ethiopia involves democratic
decentralization, ethnic based federalism and
administrative de-concentration to make service delivery
equitable, efficient and effective.
Regions now have full responsibility to plan and finance,
implement and monitor their own development
programmes.
Likewise, Woredas (districts) also prepare and manage
their own budget and development programmes.

Government Structure
Lowest Governmental Structure (Subdivided into Villages or Communities)
Water, Irrigation and Energy Office
Health Office
Water Department
Heal Department
(Does not involve in budgeting and planning for Woreda)
Regional Water, Irrigation and Energy Bureau
Regional Health Bureau
(Approve Budge and Plan for Districts)
Ministry of Water, Irrigation, and Energy
Ministry of Health
Federal Government
Regional Government and City Administrations
Zonal Structure
Woreda (District)
Kebele

Institutional
Regional Water Resources Bureaus are responsible for planning,
managing and coordination of rural water supply programmes for
medium and large scale Water Supply schemes (population of more
than 5000 people) and piped systems involving civil and
electromechanical works.
Woreda Water offices plan and manage their Woreda water supply
programs.
in Villages WASHCOs are responsible for operation and maintenance
of water and sanitation facilities.
Regional Water Resources, Irrigation and Energy Bureaus are linked to
the federal ministry and have coordination meetings.
However they actually have a stronger link and line of accountability to
the regional councils that approve their funding.
Institutional (Continued..)
These institutional coordination challenges emerge as an
important issue in the improvement of WaSH information
systems.
More recently, moves towards a coordinated sector wide
approach are beginning to gather speed.
Efforts are underway to promote government leadership of
sector development programs.
Donors are moving to further support government policy
goals and strategies, channeling resources through
government systems and harmonizing financial and
reporting systems and using national procedures and
system

2. Key Issues
Coordination and integration among stakeholders
in the WASH in data use for decision making.
Application of innovative approaches and
methodologies for the decision making process for
WASH investment and O&M.
Data flow from lower to upper government
bodies.

2. Stakeholders in WASH decision making process
Village Level
Villages are sub-categorized under the kebele administration (lowest administration
Unit)
Places where WASH infrastructures are built and sanitation and hygiene promotion
activities.
Data flow if directly to districts with the involvement of the following stakeholders.
Health Extension Workers
Development agents
WASHCOs
Kebele WASH Teams
Woreda Experts
NGO workers (project officers)
Artisans
Data types
Demography
Water resource availability
Environmental sanitation
Hygiene behavior
Gender issues
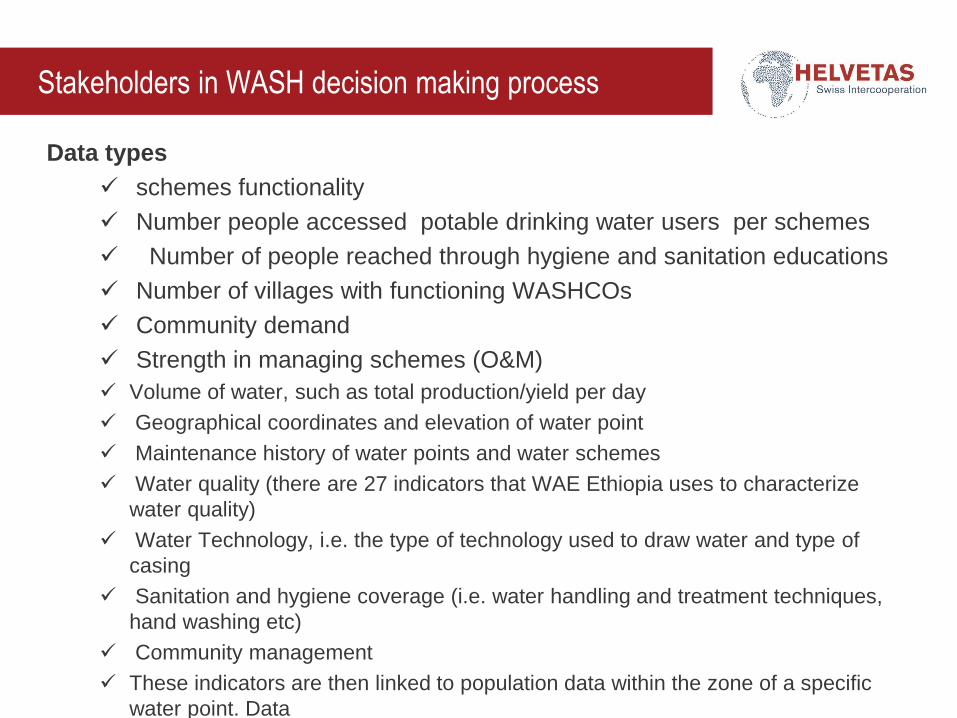
Stakeholders in WASH decision making process
Data types
schemes functionality
Number people accessed potable drinking water users per schemes
Number of people reached through hygiene and sanitation educations
Number of villages with functioning WASHCOs
Community demand
Strength in managing schemes (O&M)
Volume of water, such as total production/yield per day
Geographical coordinates and elevation of water point
Maintenance history of water points and water schemes
Water quality (there are 27 indicators that WAE Ethiopia uses to characterize
water quality)
Water Technology, i.e. the type of technology used to draw water and type of
casing
Sanitation and hygiene coverage (i.e. water handling and treatment techniques,
hand washing etc)
Community management
These indicators are then linked to population data within the zone of a specific
water point. Data

Stakeholders in WASH decision making process
Data used to make decisions on (by Districts ): for HDW,
SPD, SW, and non motorized schemes
Which villages should be included for next
implementation period
To decide to make new investment or rehabilitation
(based on non-functionality and coverage data) or
expansion.
To fill capacity gaps among WASH actors at village
level.
Usage of data for decision is geared towards
meeting district level targets
Calculate and disseminate Water Supply and
Sanitation coverage

Stakeholders in WASH decision making process
Tools for data collection at village level
surveys (usually conducted using electronic surveys
such as AKVO Flow, mWAter, ODK)
Baseline
WASH sector assessments (Helvetas Conducted in
2012/13)
Mid-term monitoring and evaluations.
Outcome monitoring (endline evaluations)
Meetings and Reports
Review meetings.
Annual, biannual and quarter reports.
Planning workshops

Stakeholders in WASH decision making process
District level
Districts are the key political and administrative units for a regional state.
Data gathered at this level directly flow to Regional Water Bureau to make decisions.
Stakeholders involving in gathering, processing and interpreting are:
Regional water bureau experts
Contracted consultants
Zonal experts
NGOs
Bilateral organizations
Data types
Water supply coverage (Urban and Rural)
People with access to safe water and improved sanitation
Functionality rate
Water resource potential (hydro geological data)
Infrastructure status (road, electric power, financial institutions)
Affordability to pay

Using Woreda Water Schemes Inventory
Rather than sending data straight up to zones and
regional level, there is a major need to develop capacities
and promote use of information that is now becoming
available through Woreda inventory surveys.
Better management and constant use of this information at
Woreda and kebele level could lead to improved action
plans and better local decision-making (e.g. on location of
new sources, prioritizing allocation of scarce resources for
maintenance etc).

Stakeholders in WASH decision making process
Data is used for the following decisions:
Allocate the regular and/or capital budget for WASH development
programs among districts
Support Donors, NGOs and bilateral organizations in selecting their
intervention Woredas.
Prioritize and decide on the importance of new investments and/or
rehabilitation or expansion.
To design strategies, set directions and appropriate techniques for
better implementation towards planned targets.

Other decision-Making data Users
Those invested with the responsibility and opportunity to improve
water, sanitation, and hygiene services in a community are the target
users of the decision-making support data.
This group includes
Staff of development agencies,
Rural development practitioners,
NGOs,
rural and peri-urban planners,
government agency staff,
engineers, and health professionals.
Water users associations
Private sector (Contractors, suppliers)
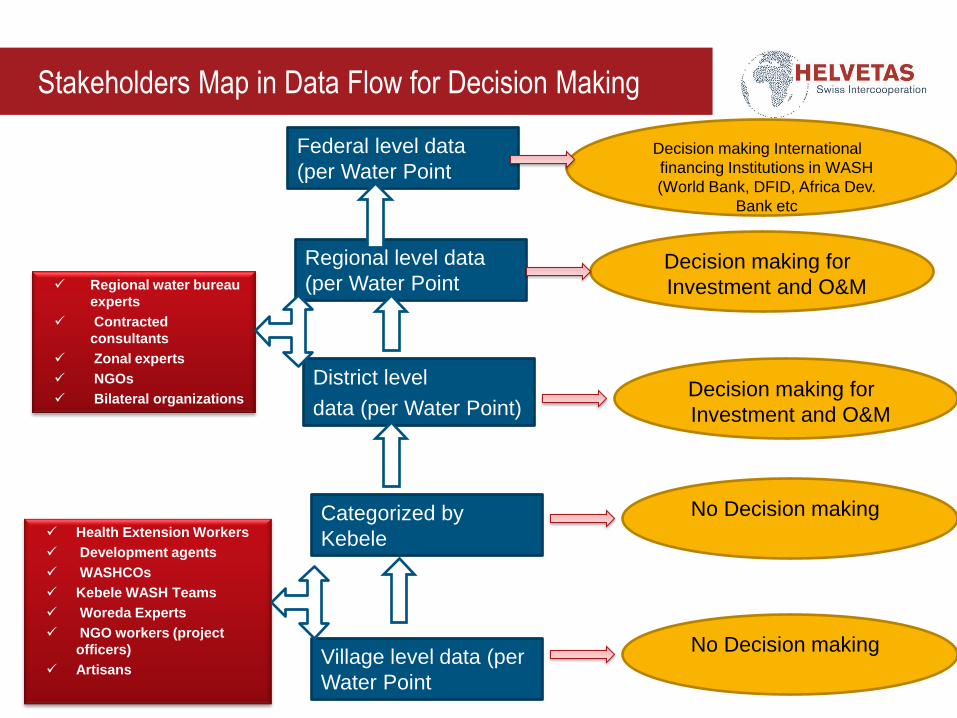
Stakeholders Map in Data Flow for Decision Making
Village level data (per
Water Point
Categorized by
Kebele
District level
data (per Water Point)
Regional level data
(per Water Point
Federal level data
(per Water Point
No Decision making
Decision making for
Investment and O&M
Decision making for
Investment and O&M
Decision making International
financing Institutions in WASH
(World Bank, DFID, Africa Dev.
Bank etc
Health Extension Workers
Development agents
WASHCOs
Kebele WASH Teams
Woreda Experts
NGO workers (project
officers)
Artisans
Regional water bureau
experts
Contracted
consultants
Zonal experts
NGOs
Bilateral organizations
No Decision making

Use of ICT and mobile phone applications for database and
monitoring
• Use of smart phone based application have contributed to
better monitoring, evaluation and learning in AIRWASH
project.
• Tasks conducted using these tools:
baseline survey (including O&M issues) in 2014 (project
start) using AKVO Flow survey tool
Mid-phase water quality survey: AKVO Flow
Biannual water quality surveys both at point of use and
household level: AKVO Flow
Endline evaluation : Akvo Flow
Dispensers for Safe Water (DSW): ODK survey tool for
overall piloting implementation of the program (DSW)

Benefits of using mobile data tools
• Better uniformity and less error in data quality.
• Less time and fair cost of data collection (no paper
questionnaires, logbooks or other hardware materials).
• By using a smartphones GPS, we were able to determine if
the intended respondent was actually taking the survey.
• Additional information is acquired: enumerators can gather
pictures, record respondent’s voice, or write notes/diaries all
on their Smartphone.
• WASH data was easy to access from the dashboard
whenever needed.
• Suitable for easy producing graphical and tabular reports
segregated by water scheme type, location, etc

5) Challenges
Lack of institutional data management structure instruments for
informed decision.
Inadequate attention from government partners for better data quality.
No updatable database system in implementing WASH projects.
(Inconsistency in database updating)
Limited capacity of the project staff in modern data management
techniques.
Poor use and integration of research outputs in program and policy
changes;

6) Lessons Learnt
Quality data is a significant factor in producing reliable planning documents
Continuous assessment and back-check is important to sustain better data
management
Capacity building at local level enhances the effectiveness of database
systems.
Data on coverage was to be based on yield, but information on yield is difficult
to gather.
The majority of the water schemes are hand dug wells and shallow wells. As
such, ‘regular measuring of yield is difficult, tedious and costly.’
Lack of standard WASH indicators and methods of measuring them makes it
difficult to share our data with other actors in the WASH sector.
Data collection and analysis requires a lot of financial and human resources
as well as technical skills.