managing ammonia in agriculture usda research efforts
TRANSCRIPT
Managing Ammonia in Managing Ammonia in AgricultureAgriculture
USDA Research EffortsUSDA Research Efforts

USDA ResearchUSDA Research
Emissions from Livestock ProductionEmissions from Livestock Production– BuildingsBuildings– Manure StorageManure Storage– Manure ApplicationManure Application
Emissions from Crop ProductionEmissions from Crop Production– Fertilizer ApplicationFertilizer Application– Crop release and uptakeCrop release and uptake

USDA Research PartnersUSDA Research Partners
Agricultural Research ServiceAgricultural Research Service
Cooperative States Research, Cooperative States Research, Education, and Extension ServiceEducation, and Extension Service
Land Grant UniversitiesLand Grant Universities
Research PartnersResearch Partners

Emissions from Livestock Emissions from Livestock Production SystemsProduction Systems

Complexities of Agricultural Complexities of Agricultural SystemsSystems
ShapeShape
SizeSize
Position on the landscapePosition on the landscape
Meteorological conditions Meteorological conditions surrounding the site (daily and surrounding the site (daily and seasonal)seasonal)
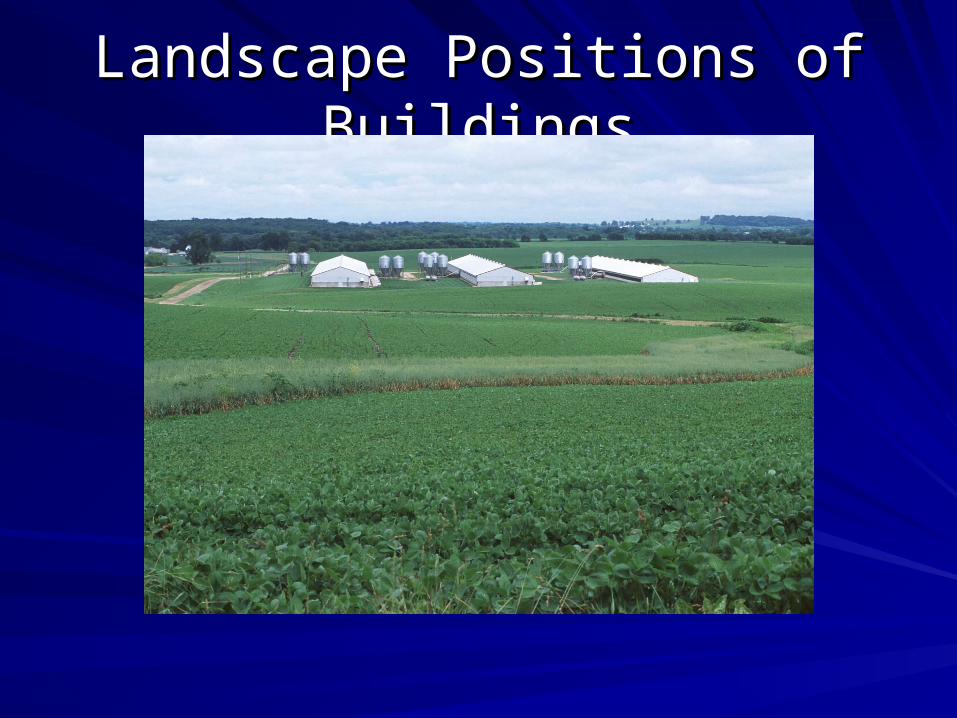
Landscape Positions of Landscape Positions of BuildingsBuildings
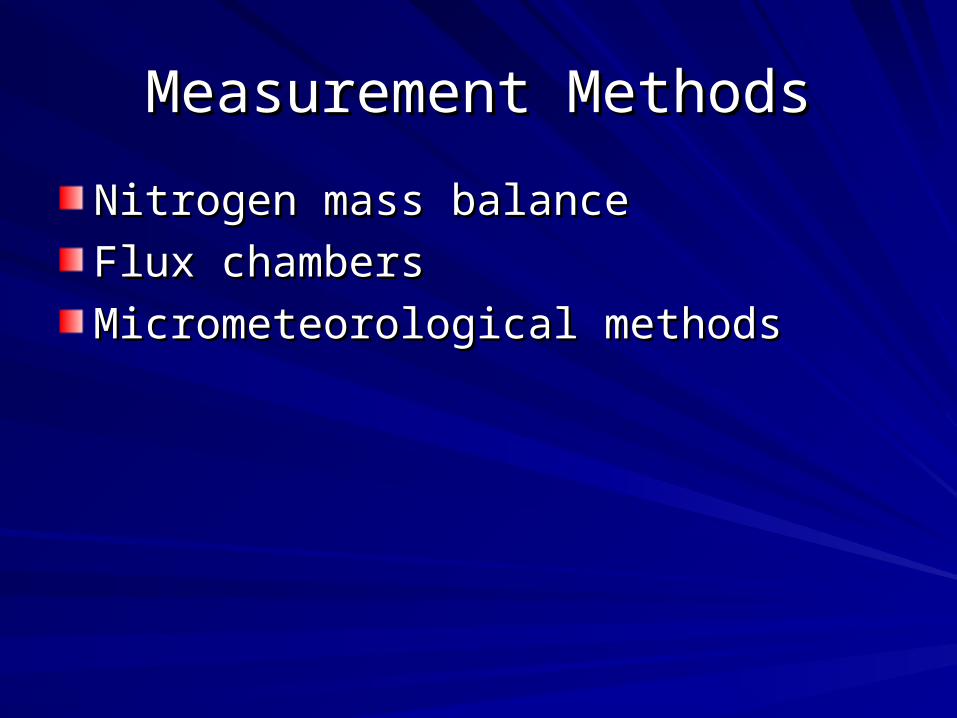
Measurement MethodsMeasurement Methods
Nitrogen mass balanceNitrogen mass balance
Flux chambersFlux chambers
Micrometeorological methodsMicrometeorological methods

Chemiluminescence Chemiluminescence Ammonia AnalyzerAmmonia Analyzer
Detects NHDetects NH33 down to 2 ppb down to 2 ppb
Cost - $17,000Cost - $17,000
Barn B1 NH3 Concentration (ppm)
0
5
10
15
20
74.8 75 75.2 75.4 75.6 75.8 76 76.2
J ulian Day
Loc 1
Loc 2
Loc 3
Loc 4
Loc 5
Loc 6

Open-Path FTIR Measurement System for Hog Waste Lagoon

Instrumentation Instrumentation ComparisonsComparisons
Joint project with USDA, EPA, and Joint project with USDA, EPA, and BattelleBattelle
Comparison of ammonia instruments Comparison of ammonia instruments around swine confinement and beef around swine confinement and beef feedlotfeedlot
Comparison of 8 different Comparison of 8 different instruments over a 2-month periodinstruments over a 2-month period
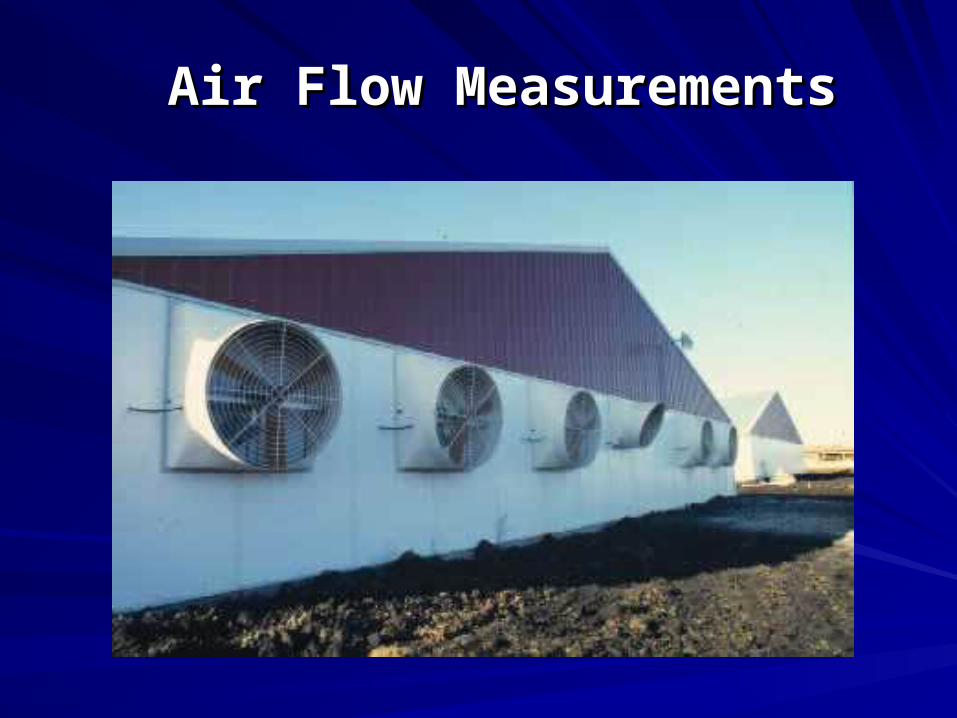
Air Flow MeasurementsAir Flow Measurements

Emission RatesEmission Rates
Need to define emission rates to Need to define emission rates to determine the loading rate from a determine the loading rate from a facilityfacility
Need to define emission rates in Need to define emission rates in order to evaluate the effectiveness of order to evaluate the effectiveness of treatment or management treatment or management techniquestechniques

Agricultural livestock emission factorsAgricultural livestock emission factorsaa
Composite emission factor (kg of % of composite emission factorCategory NH3/head-year)b Housing Storage Spreading Grazing
CattleCattle 22.922.9 2121 99 5151 1919
HogsHogs 9.219.21 3434 1414 5252 00
PoultryPoultry 0.1790.179 4040 00 6060 00
aaMcCubbin et al., 2002. Environ. Sci. Technol. 36:1141-1146.McCubbin et al., 2002. Environ. Sci. Technol. 36:1141-1146.
bbComposite emission factors are from Battye et al. (1994). Percentages attributed to each subcategory are based on breakdowns from Asman et al. (1992).

Variation in Emission RatesVariation in Emission Rates
AmmoniaAmmonia– 3.6-42 g/d-pig place (swine)3.6-42 g/d-pig place (swine)
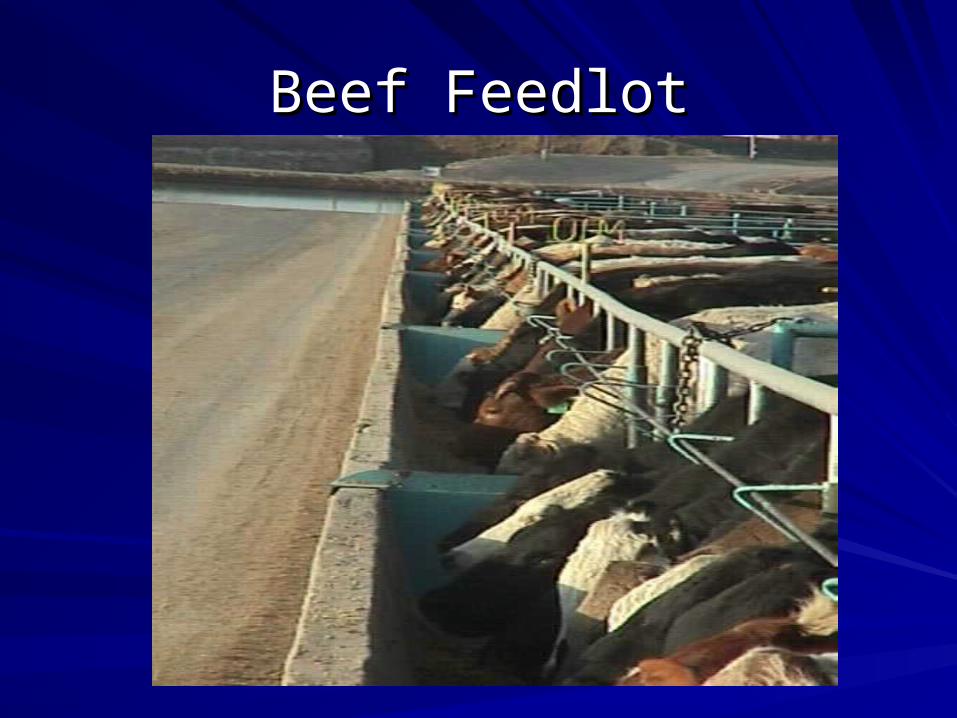
Beef FeedlotBeef Feedlot

OdorsNH3 Dust
N, C, H2O, pH
Decrease atmospheric losses Quantify losses Modify diets & management Effectively manage manure

Ammonia Emission FactorsAmmonia Emission Factors
AnimalAnimal EmissionEmission
Kg NHKg NH33 yr yr-1-1 an an-1-1
RangeRange
PigPig 4.94.9 2.3 – 7.62.3 – 7.6
< 54 kg (US)< 54 kg (US) 6.986.98 0 – 6.980 – 6.98
>54 kg (US) >54 kg (US) 6.986.98 6.98 - 116.98 - 11
PoultryPoultry 0.220.22 0.18 – 0.240.18 – 0.24
DairyDairy 21.021.0 18.8 – 23.518.8 – 23.5
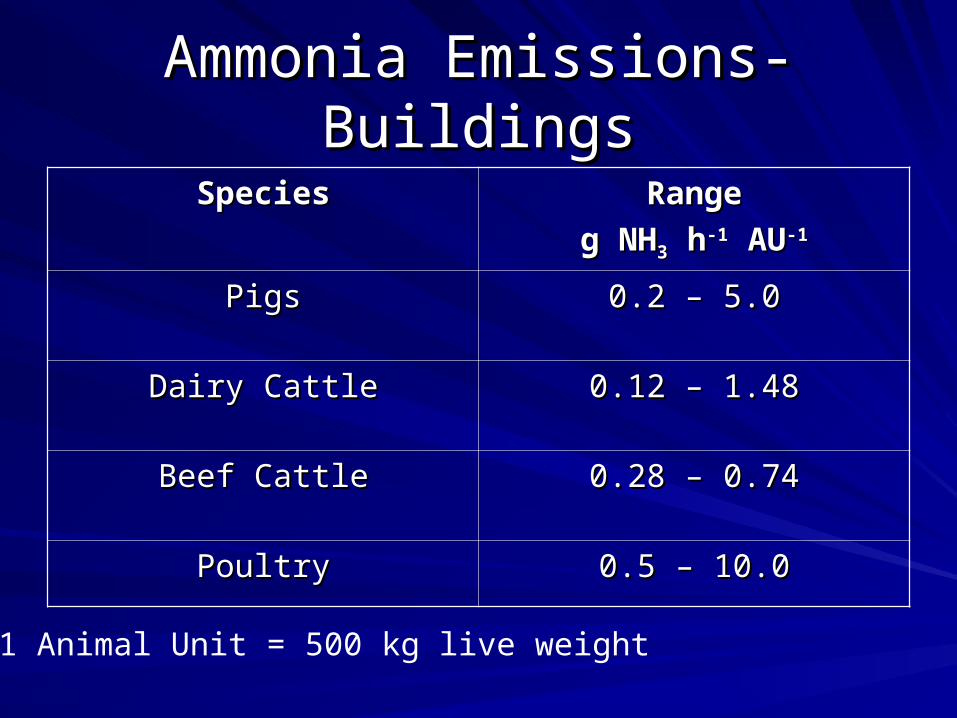
Ammonia Emissions-Ammonia Emissions-BuildingsBuildings
SpeciesSpecies RangeRange
g NHg NH33 h h-1-1 AU AU-1-1
PigsPigs 0.2 – 5.00.2 – 5.0
Dairy CattleDairy Cattle 0.12 – 1.480.12 – 1.48
Beef CattleBeef Cattle 0.28 – 0.740.28 – 0.74
PoultryPoultry 0.5 – 10.00.5 – 10.0
1 Animal Unit = 500 kg live weight
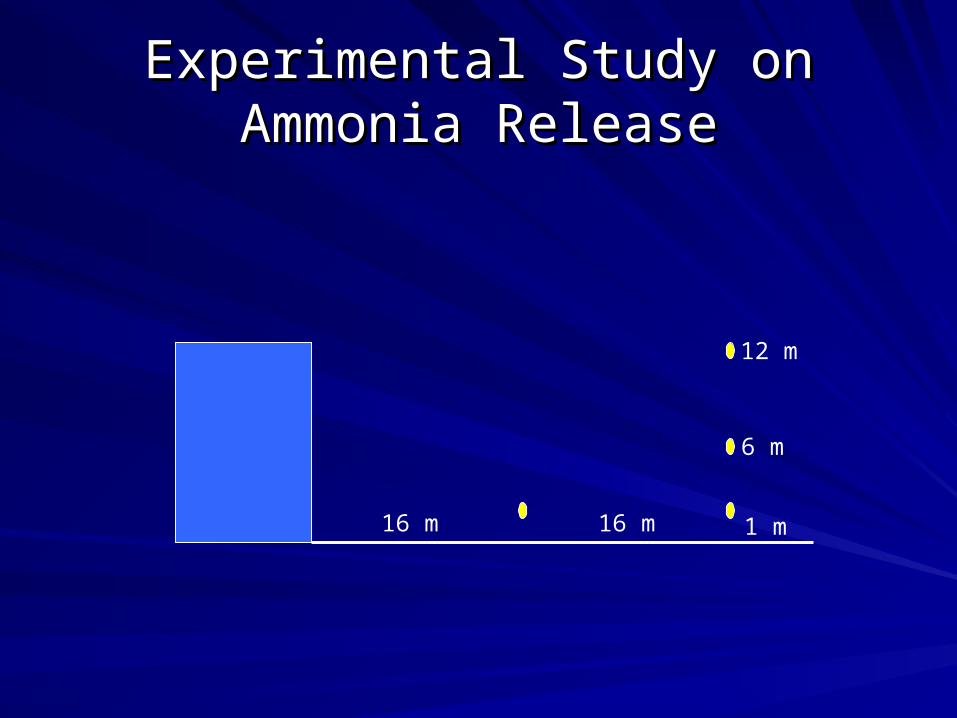
Experimental Study on Experimental Study on Ammonia ReleaseAmmonia Release
16 m 16 m 1 m
6 m
12 m

Ammonia Emissions Ammonia Emissions
DOY 155-160
Day of Year
155 156 157 158 159 160 161
Am
mon
ia C
once
ntra
tion
(ppb
)
0
200
400
600
800
1000
1200
14001 m at 16 m 1 m at 33 m 6 m at 33 m 12 m at 33 m

Ammonia EmissionsAmmonia Emissions
DOY 246-253
Day of Year
246 247 248 249 250 251 252 253
Am
mon
ia C
once
ntra
tion
(ppb
)
0
100
200
300
400
500
600
700
1 m at 16 m1 m at 33 m6 m at 33 m12 m at 33 m
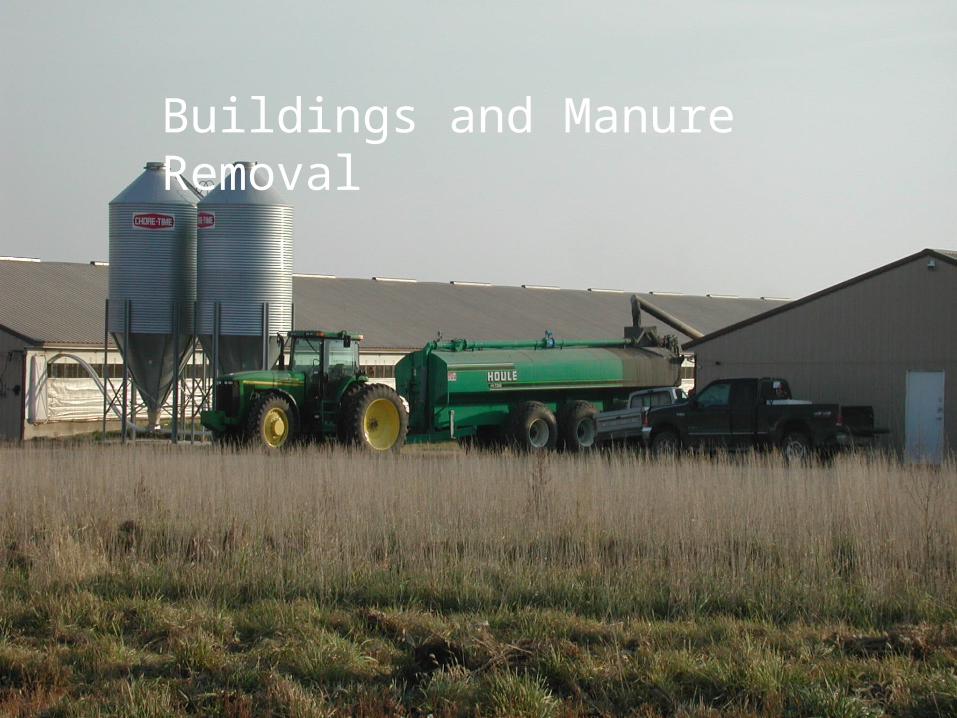
Buildings and Manure Removal
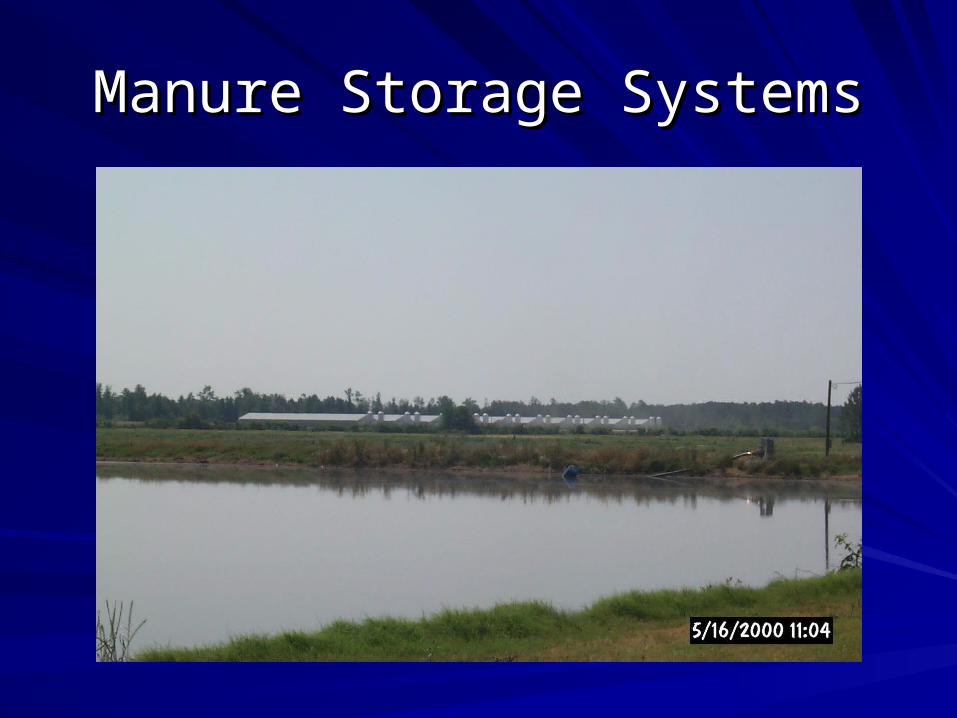
Manure Storage SystemsManure Storage Systems

Ammonia Emissions-StorageAmmonia Emissions-Storage
Manure Storage TypeManure Storage Type EmissionEmission
Kg NHKg NH33 ha ha-1-1 day day-1-1
LagoonsLagoons 0.25 - 1560.25 - 156
Storage TanksStorage Tanks 3 - 903 - 90
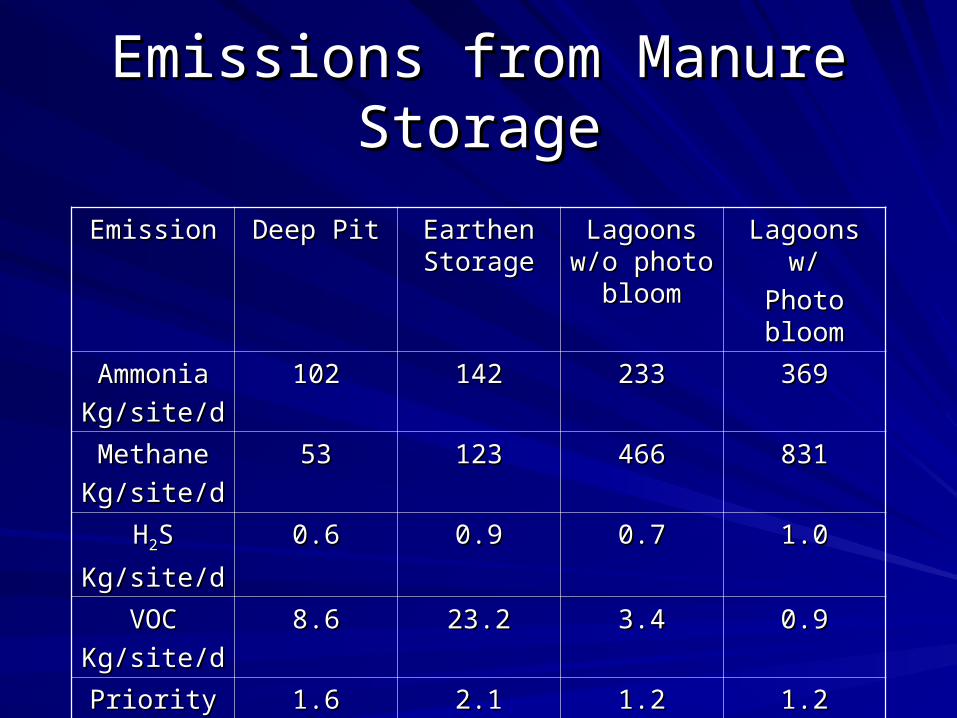
Emissions from Manure Emissions from Manure StorageStorage
EmissionEmission Deep PitDeep Pit Earthen Earthen StorageStorage
Lagoons Lagoons w/o photo w/o photo
bloombloom
Lagoons w/Lagoons w/
Photo Photo bloombloom
AmmoniaAmmonia
Kg/site/dKg/site/d
102102 142142 233233 369369
MethaneMethane
Kg/site/dKg/site/d
5353 123123 466466 831831
HH22SS
Kg/site/dKg/site/d
0.60.6 0.90.9 0.70.7 1.01.0
VOCVOC
Kg/site/dKg/site/d
8.68.6 23.223.2 3.43.4 0.90.9
Priority Priority pollutantpollutant
1.61.6 2.12.1 1.21.2 1.21.2

Emission Measurements during Manure
Application
Energy Exchanges
Ammonia sampler

Evaluation of Dispersion Evaluation of Dispersion Methods and ModelsMethods and Models


Atmospheric DispersionAtmospheric Dispersion

Factors Affecting Ammonia Factors Affecting Ammonia VolatilizationVolatilization
TAN concentrationTAN concentrationpHpHTemperatureTemperatureWindspeedWindspeedChemical activityChemical activityMicrobiological activityMicrobiological activityDiffusive and convective transportDiffusive and convective transportGas phase resistanceGas phase resistance

Ammonia Volatilization during Ammonia Volatilization during Crop SenescenceCrop Senescence
Corn Field in Central Iowa
Measurements throughout the season
Full energy balance and plant growth measurements

Ammonia Volatilization during Ammonia Volatilization during Crop GrowthCrop Growth
Corn Field in Central Iowa
Measurements throughout the season
Full energy balance and plant growth measurements
Coupled water, carbon dioxide, and ammonia measurements

Crop Emission and UptakeCrop Emission and Uptake
Research studies on ammonia Research studies on ammonia volatilization and uptake from corn volatilization and uptake from corn and wheat crops and wheat crops
Ammonia deposition onto crops and Ammonia deposition onto crops and rangeland in areas surrounding beef rangeland in areas surrounding beef feedlotsfeedlots
Research StudiesResearch Studies
Encompass a number of speciesEncompass a number of species– BeefBeef– DairyDairy– PoultryPoultry– SwineSwine
Encompass a range of production Encompass a range of production systems across a wide geographical systems across a wide geographical areaarea
Encompass complete growing seasonEncompass complete growing season

ChallengesChallenges
Quantify the emission rates through Quantify the emission rates through combined concentration and flux combined concentration and flux methodsmethods
Compare emission rates across a Compare emission rates across a range of facilities and agricultural range of facilities and agricultural practicespractices
Develop an understanding of why Develop an understanding of why and how the emission rates vary and how the emission rates vary within and among systemswithin and among systems
Addressing these Addressing these ChallengesChallenges
Requires good methods to measure Requires good methods to measure the concentration of ammonia in the the concentration of ammonia in the atmosphereatmosphere
Requires a good methodology to Requires a good methodology to estimate the total emission from a estimate the total emission from a facility that links flux through a given facility that links flux through a given area and concentrationarea and concentration

USDA ResearchUSDA Research
Multi-faceted to cover a range of Multi-faceted to cover a range of species and production systemsspecies and production systems
Directed toward quantifying the Directed toward quantifying the emission rates of ammoniaemission rates of ammonia
Focused on being able to evaluate Focused on being able to evaluate treatment technologies that reduce treatment technologies that reduce ammonia emissionammonia emission