management accounting principles and applications
TRANSCRIPT


Management Accounting
Coombs Prelims.qxd 3/18/2005 1:07 PM Page i

Coombs Prelims.qxd 3/18/2005 1:07 PM Page ii

Management Accounting
Principles and Applications
Hugh CoombsDavid HobbsEllis Jenkins
● ●
SAGE PublicationsLondon Thousand Oaks New Delhi
Coombs Prelims.qxd 3/18/2005 1:07 PM Page iii

© Hugh Coombs, David Hobbs, Ellis Jenkins, 2005
First published 2005
Apart from any fair dealing for the purposes of research or privatestudy, or criticism or review, as permitted under the Copyright,Designs and Patents Act, 1988, this publication may bereproduced, stored or transmitted in any form, or by any means,only with the prior permission in writing of the publishers, or inthe case of reprographic reproduction, in accordance with theterms of licences issued by the Copyright Licensing Agency.Enquiries concerning reproduction outside those terms should besent to the publishers.
SAGE Publications Ltd1 Oliver’s Yard55 City RoadLondon EC1Y 1SP
SAGE Publications Inc.2455 Teller RoadThousand Oaks, California 91320
SAGE Publications India Pvt LtdB-42, Panchsheel EnclavePost Box 4109New Delhi 110 017
Library of Congress Control Number: 2005901200
A catalogue record for this book is available from the British Library
ISBN 1-4129-0843-4ISBN 1-85396-383-6 (pbk)
Typeset by C&M Digitals (P) Ltd., Chennai, IndiaPrinted on paper from sustainable resourcesPrinted in Great Britain by Alden Press, Oxford
Coombs Prelims.qxd 3/18/2005 1:07 PM Page iv

CONTENTS
List of Illustrations viPreface xAcknowledgements xii
1 An Introduction to Management Accounting 1
2 Cost Analysis and Decision Making 21
3 Costing Products and Services 52
4 Management Accounting and the Planning Process – 1 84
5 Management Accounting and the Planning Process – 2 125
6 Management Accounting and the Control Process – 1 147
7 Management Accounting and the Control Process – 2 186
8 Operational Decision Making 219
9 Strategic Decision Making 260
10 Management Accountancy and Performance Management Systems 295
Bibliography and Recommended Further Reading 339Index 343
Coombs Prelims.qxd 3/18/2005 1:07 PM Page v

LIST OF ILLUSTRATIONS
Figures2.1 Total cost of sales analysis, manufacturing industry 242.2 Cost behaviour against output change 293.1 Absorption costing and ABC compared 623.2 Break-even chart 703.3 Contribution chart 714.1 The strategy and planning process 904.2 Buddy Ltd’s budgeting process 955.1 Graph of maintenance costs against direct machine hours 1285.2 Balanced scorecard (University of California – Business
and Administrative Services) 1356.1 Feedback control loop 1496.2 The information summarising process 1507.1 Possible avenues for exploring variances in more depth 1897.2 The multidimensional aspects of (materials)
variance analysis 1917.3 Variance investigation tree 1987.4 Probability tree for Exhibit 7.2 data 2007.5 Investigation of latest direct unit variance in Exhibit 7.3 2028.1 The break-even chart 2268.2 The contribution graph 2268.3 The profit-volume graph 2278.4 Graphical solution to contribution maximisation problem 2338.5 Graphical solution to cost minimisation problem 2379.1 The impact of changes in discount rate on NPV 267
Tables 1.1 Some areas of activity considered to be part of ‘management accounting’ 72.1 Example of a unit cost statement: comparative food costs for four
schools providing school meals, March–December 2004 31
Coombs Prelims.qxd 3/18/2005 1:07 PM Page vi

2.2 Workload analysis of meals per worker 322.3 Illustration of cost classification 382.4 Incremental analysis of proposed expansion 413.1 Examples of production and other overheads 533.2 Examples of overhead bases 543.3 Apportionment data 553.4 Budgeted overhead analysis for 2005 563.5 Budgeted annual activity 563.6 Overhead absorption rates 573.7 Direct costs and production times 573.8 The full cost of products A and B 573.9 Overhead absorption in January 583.10 Cost pools and cost drivers 633.11 Annual production overhead for Eiger ice axes 633.12 Cost driver breakdown 643.13 Activity-based cost per ice axe 653.14 Product costs 664.1 Some dictionary definitions of common business terms 854.2 Some attempts at defining some common terms used in
management accounting 884.3 Uses of budgets 914.4 Some questions to be asked when preparing a manufacturing firm’s
annual budget 924.5 Some possible complicating factors in real-life budgeting 1065.1 Total maintenance costs and direct machine hours for
the past 10 accounting periods 1285.2 Regression analysis calculations 1296.1 Expenditure control statement for a university department 1486.2 Comparison with a fixed budget 1536.3 Comparison with a flexible budget 1536.4 Flexible budgets at different levels of output (£) 1556.5 Calculating flexed budget variances 1556.6 Standard cost statement for one wheel build 1566.7 Standard times of output 1596.8 Standard times of activities 1596.9 Standard costs per unit and annual budget 1606.10 Actual output and costs for October 1606.11 Variances for October (£) 1616.12 Subvariances 1626.13 Reconciliation of standard and actual
costs of production 165
LIST OF ILLUSTRATIONS vii
Coombs Prelims.qxd 3/18/2005 1:07 PM Page vii

8.1 Budgeted cost for shrub growing 2228.2 Contribution per acre 2238.3 Maximum contribution and profit available 2238.4 Analysis of past performance 2288.5 Shadow prices – resources table 2358.6 Country Limited absorption budget statement 2398.7 Country Limited restated contribution budget statement 2398.8 Avoidable costs 2418.9 A conventional approach to identifying
revenues and costs 2428.10 Relevant costs and revenues 2428.11 Relevant cost of material, and explanations 2448.12 Calculation for Exhibit 8.8 2458.13 Desiderata table for make or buy appraisal 2469.1 Data for projects A, B and C 2629.2 Present value calculations for a discount rate of 10% 2649.3 Discount factors for one to five periods and discount rates up to 10% 2649.4 Project net present values 2659.5 Present value of annuity 2669.6 Cumulative NCFs for projects A, B and C (from Table 9.1) 2699.7 Discounted payback 2709.8 Sensitivity analysis 2759.9 Two-way analysis of net present value (£ millions) 2769.10 The pivot approach 2779A.1 Present value of future cash flows 2939A.2 Present value of annuities 29410.1 Issues to consider in performance measurement 29610.2 Some contingent factors for consideration 29710.3 Issues that may arise as an organisation becomes
increasingly decentralised 30010.4 Some possible transfer pricing bases and some
advantages/disadvantages 30110.5 Some of the parties interested in performance information 307
Case StudiesSHB 44Billy Griffiths 75Jim Davies 76
viii LIST OF ILLUSTRATIONS
Coombs Prelims.qxd 3/18/2005 1:07 PM Page viii

Budget preparation 114Tuba Accessories 142Budget preparation and variance analysis 172Dayview Ltd 211The Odd-Job Manufacturing Company 252Branchester United 282Social Services Agency 289Callas plc 324Fantasy Planet University 329Sioca PLC 331
Exhibits2.1 Cost classification 372.2 Fixed and variable costs 382.3 Incremental costs and revenue 404.1 Illustration of budgeting within a small manufacturing firm 937.1 Illustration of a more comprehensive analysis of materials variance 1907.2 Application of statistical techniques to the variance
investigation/correction decision 1997.3 The use of normal distribution theory in
variance investigations 2018.1 Contribution statement compared with a functional financial
reporting type approach 2218.2 The Hardy Out Door Company 2248.3 Break-even and related formulas 2318.4 Maximise contribution 2318.5 Cost minimisation 2368.6 Ceasing production 2388.7 Avoidable and unavoidable costs 2408.8 Reviewing a project 24510.1 Transfer pricing example 30310.2 Illustration of the use of financial performance measures 308
LIST OF ILLUSTRATIONS ix
Coombs Prelims.qxd 3/18/2005 1:07 PM Page ix

PREFACE
Management accounting may be seen as a practical tool aimed at solving the day-to-dayfinancial management problems facing decision makers in the private and publicsectors. We feel, however, that this is too narrow a view of the potential of the subject.Accordingly, we have gone beyond this view. In this book, while we have looked at thepractical techniques that can help managers and students solve management accountingproblems, we have tried to approach the subject in a way which ensures coverage of tech-nical financial topics in an accessible style while making appropriate reference toresearch. In addition, the book goes beyond techniques to recognise qualitative issues byattempting to identify analytical and critical issues of relevance to decision makers at alllevels in a variety of organisations in both the private and public sectors.
While chapters contain exhibits and examples, we have introduced case studies fromthe end of Chapter 2. These can be approached on many levels such that students from awide range of backgrounds and experience can benefit from working through them eitherin whole or in part. The case studies are intended to be underpinned by reference to theresearch literature to gain maximum benefit. We introduce some of this research literaturein the practical context of each chapter in order to encourage further reading. Readers canthus contextualise the issues which they are studying within the wider environment of theresearch literature and through the case studies before continuing their studies in moredepth. Indeed, the case studies are based on our own consultancy and research areas,although the names have been changed to protect the ‘guilty’.
The case studies in this book represent the development of teaching approaches at theUniversity of Glamorgan and are one of a number of innovative approaches used in thedelivery of accounting modules in the Business School at the University. They contributedto the HEFCW/QAA ‘excellent’ rating received by the accounting teaching team. Thecases have been well received by students and managers both locally and internationally(see Coombs et al., 2000) and are aimed at developing the ‘graduateness’ skills of criticaland analytical appraisal in decision-making situations. We are grateful to the Universityof Glamorgan and colleagues for the encouragement we have received to develop andexpand this approach.
In today’s competitive world, managers from whatever background need an under-standing of the tools of management accounting when making financial decisions, yet
Coombs Prelims.qxd 3/18/2005 1:07 PM Page x

they must also be aware of the qualitative issues affecting such decisions. Furthermore,they need to be aware of what is happening through research into their competitors. In thiscontext we believe managers and students will find this book of value.
Hugh CoombsDave HobbsEllis JenkinsMarch 2005
PREFACE xi
Coombs Prelims.qxd 3/18/2005 1:07 PM Page xi

ACKNOWLEDGEMENTS
We would wish to thank Shane Johnson for his advice on aspects of this book and theTeaching and Learning Office at the University of Glamorgan for their support of innov-ative teaching methods.
Coombs Prelims.qxd 3/18/2005 1:07 PM Page xii

Chapter 1AN INTRODUCTIONTO MANAGEMENT ACCOUNTING
By the time you have finished studying this chapter, you should be able to:• explain the meaning and nature of management accounting;• describe the scope and content of management accounting;• discuss the past and current issues affecting the evolution of management accounting;• list key factors that need to be considered when designing management accounting
systems.
The Nature and Role ofManagement Accounting
This chapter will introduce you to the world of management accounting by presenting anoverview of the areas of work in which management accountants operate. It will com-mence by explaining the nature and scope of management accounting. You will see thatmanagement accounting is an evolving subject and that its nature and scope have changedand expanded over time, and will continue to do so. As the world of accounting hasexpanded, so specialities have developed, and we shall see that management accountingis one such speciality, having its own distinctive features and accepted areas of operation.You will see that, in a number of ways, management accounting is quite different fromother forms of accounting.
The chapter will examine the historical beginnings and contexts of managementaccounting, and will consider the nature of the forces and circumstances that have shapedits development. Consideration will be given to the influences that continue to shapemanagement accounting’s current development and the likely future influences to whichmanagement accounting must respond in order to retain its relevance and effectiveness.In particular, we will consider some of the ‘softer’ factors that affect any area of
Key Learning Objectives
Coombs-01.qxd 3/18/2005 1:08 PM Page 1

management science, including that of management accounting, and will examine theconditions and system requirements necessary for the successful implementation andmaintenance of management accounting systems. We will see that, like many areas ofaccounting in the current organisational environment, management accounting is notnecessarily an exact, entirely reliable, science. Some of these issues will be introducedwithin this chapter and then developed in later chapters.
What is Management Accounting?What is management accounting? One might think that a book devoted to managementaccounting would have little difficulty in answering this question. Not necessarily!A logical start is to examine the words ‘management’ and ‘accounting’ individually.Unfortunately, neither of these words has a single, universally agreed meaning. Managementmight be seen to encompass the entire range of activities involved in running an organi-sation, not forgetting that organisations take many forms, including businesses of manytypes and not-for-profit organisations, within the private or public sectors. Accountingmay be seen to encompass any of the activities that attempt to gauge the performance ofan organisation, or to plan for an organisation’s future performance. Additionally it maybe seen to include the traditional ‘accounting’ roles of stewardship, control and audit. Thelayman might think of accounting as being concerned only with those financial measure-ments undertaken by those with the title ‘accountant’ and of management as being con-cerned only with those activities undertaken by those with the title ‘manager’. Neither isthe case in real life.
In competitive business environments, and within a public sector that is increasinglyfocused upon effectiveness, value for money and ‘best practice’, all organisational partici-pants take on a responsibility for both management and accounting. The actions of eachindividual within an organisation have, after all, ‘trickle-down’ effects on other parts of theorganisation and an ‘upward’ effect on the eventual results of the organisation as a whole.
So, then, what is management accounting? Well, in a nutshell, management accountingis accounting (i.e. producing useful information) for management (whoever those managershappen to be and whatever their job titles). In this sense, ‘accounting’ includes the produc-tion of all information useful in running the organisation. Hence, such information may be:
• financial or non-financial;• accurate, or broadly correct;• actual (certain) or estimated (uncertain);• based in the past or the future;• detailed, or in a highly aggregated form;• presented in any of a variety of spoken or written forms, such as numbers, tables, and
graphs;• related to profits/losses, costs/incomes, volumes, quality indicators, trends, etc.
2 MANAGEMENT ACCOUNTING
Coombs-01.qxd 3/18/2005 1:08 PM Page 2

Similarly, ‘management’ may include the activities of individuals in a number ofpositions, for example:
• senior managers;• mid-level managers;• lower-level managers;• executive directors with management responsibilities;• employees not usually considered to be ‘managers’, such as production line workers,
call-centre operatives, and salespeople.
Thus, in many senses, an average person might not consider many of the areas of activ-ity of management accounting to be accounting at all! Indeed, some writers have suggestedthat the term ‘management accountant’ should be replaced with a term such as ‘informa-tion manager’ in order to signify the wide scope of management accounting. Drucker(1994) has, for instance, suggested that the term ‘manufacturing economics’ might be abetter contemporary term than management accounting, within the manufacturing envi-ronment. Obviously, a different term would be required for the public sector aspects ofmanagement accounting. Interestingly, in recent years, management accounting organisa-tions such as the UK’s Chartered Institute of Management Accounting (CIMA) have takena more wide-ranging view of the scope of management accounting and have tended to takea more broad ‘management consultancy’ view of the work of their members. Perusal of arecent issue of CIMA’s monthly journal Financial Managemet will confirm this trend. It isinteresting, too, to note the recent change of name of this journal from the former Manage-ment Accounting. This name change and the changing emphasis of CIMA have not, how-ever, met with the universal approval of its members, some of whom take a narrower viewof what management accounting should encompass.
A selection of definitions of management accounting, from a range of books on the sub-ject, illustrates the variety of definitions possible. Garrison and Noreen (2000: 4) state thatmanagerial accounting (essentially a US term for management accounting – but see Proctor’sviews below) is ‘concerned with providing information to managers – that is, people insidean organisation who direct and control its operations’. They continue that it ‘provides theessential data with which organizations are actually run’ and (2000: 34) that it is ‘concernedwith providing information to managers for use in planning and controlling operations andin decision making’. Note, here, the distinction made by Garrison and Noreen between plan-ning, control and decision making. It is our view that planning, control and decision-makingactivities are inextricably interlinked. Planning, for example, can be seen as decision makingfor the future, and control can be seen to be ensuring that the decisions of the past are carriedout (as well as ensuring that such decisions are still appropriate).
Proctor (2002: xvii) offers the following explanations of management and managerialaccounting, making a distinction between the two terms:
Management accounting is orientated towards the future. It is primarily concerned with theprovision of information to managers to help them plan, evaluate and control activities. It is
INTRODUCTION 3
Coombs-01.qxd 3/18/2005 1:08 PM Page 3

essentially a service function; a means to an end rather than an end in itself. Managerialaccounting also fits this description but the use of the word ‘managerial’ emphasises the servicerole. This may seem obvious but, for much of the twentieth century, management accounting wasused mainly to serve the needs of financial accounting, rather than to assist managers in theirtasks. … Managerial accounting is about improving the future performance of organisations.
Proctor emphasises that management accounting is not an end in itself. In essence, theslogan ‘If it’s not useful, it’s not information’ applies.
Wilson and Wai (1993: 15), writing about managerial accounting, offer the followingobservations:
Managerial accounting encompasses techniques and processes that are intended to providefinancial and non-financial information to people within an organization to make better deci-sions and thereby achieve organizational control and enhance organizational effectiveness.
It is this last definition that we consider to be the most representative. Note that Wilsonand Wai’s definition is broad in scope, reflecting management (managerial) accounting’sbroad base, and that the definition incorporates aspects of many areas of study, all inter-related with management accounting:
• both financial and non-financial information – requiring management accountantsto be more than just characterless ‘bean-counters’. Additionally, managementaccountants deal in information, not just data, and thus must have the requisite skillsto produce useful, meaningful, relevant information. Management accountants must‘add value’ to data, processing it into useful information.
• the provision of information to people – requiring management accountants to have‘people skills’ and be able to communicate effectively.
• organisational control and effectiveness – requiring management accountants tohave the ability to see the implications of their advice for the whole organisation andto understand how the various parts of the organisation are interrelated (i.e. the‘soft’ (people) parts as well as the ‘hard’ parts).
Management Accounting andFinancial Accounting
As seen above, management accounting has a rather broad potential coverage as comparedwith financial accounting, the latter possibly being a more generally understood term.Financial accounting is defined by the Oxford Dictionary of Accounting (Hussey, 1999) as:
The branch of accounting concerned with classifying, measuring, and recording the transactionsof a business. [It is] primarily concerned with providing a true and fair view of the activities ofa business to parties external to it. … Financial accounting can be separated into a number ofspecific activities, such as conducting audits, taxation, book-keeping and insolvency …
4 MANAGEMENT ACCOUNTING
Coombs-01.qxd 3/18/2005 1:08 PM Page 4

Thus, financial accounting can be considered to have a more narrow and specific/precisecoverage than management accounting. However, the following points are worth noting:
• Although financial accounting is often considered to be a more ‘exact science’ thanmanagement accounting, this may not be the case, as can be seen from the recentspate of reported accounting scandals around the world. Both forms of account-ing make extensive use of estimation and both may be subject to the application of‘creative accounting’. Consider, for instance, the current debate on the valuation anddisclosure of organisations’ pensions liabilities. The actuarial evaluations of suchliabilities may justifiably take many approaches and may arrive at vastly differentvalues for the same organisation.
• Financial accounting is no longer the relatively straightforward affair that it oncewas. The increasing complexity and sheer volume of financial accounting standards,designed to cope with the increasing complexity of the business world and, forinstance, the explosion in financial instruments, have helped to expand the worldof financial accounting. Additionally, attempts to harmonise the various systems ofaccounting standards across the world (e.g. the implementation of InternationalFinancial Reporting Standards by all EU listed companies’ group accounts by 2005),increasing public interest in corporate governance and the increasing focus onmaking the public sector more accountable have all contributed to the accountant’sworkload. This ensures that financial accounting is a ‘cutting edge’ subject that canbe fascinating (well, to some people, at least!). The international standard dealingwith financial instruments, IAS39, is an excellent indicator of the complexity thatmay be inherent in a single accounting issue, and the arguments it has caused showthat there is rarely a universal acceptance of any single accounting approach.
• Both management accounting and financial accounting can maintain their currencyonly by evolving to keep pace with changes in the organisational environment. Bothtypes of accounting, therefore, are very much ‘living’ subjects.
• The boundaries of financial accounting have become more blurred as financialaccountants have increasingly moved into the (more lucrative) areas of taxationadvice, financial consultancy etc., raising public concerns, in recent years, aboutaccountants’ conflicts of interest.
• Both management accounting and financial accounting can only be truly useful bypresenting information to the right people at the right time and in ways that aremeaningful, transparent and cost-effective. There can therefore be no room in themodern organisation for information and for information-gathering methodologiesthat have outlived their purpose.
The History and Context ofManagement Accounting
So, where did management accounting come from? Who invented it? Why was it devel-oped, and by what types of person? As with most forms of historical study, a number of
INTRODUCTION 5
Coombs-01.qxd 3/18/2005 1:08 PM Page 5

partly conflicting ‘stories’ or paradigms exist, each claiming to give authoritative responsesto such questions. Such ‘stories’ may concentrate, according to the slant adopted by theirauthors, on the commercial, organisational, cultural, sociological, political or ideologicalaspects of management accounting’s history. The past few decades have seen an explosionin the amount and variety of research undertaken into management accounting’s history,practices and trends. While some of this research might be criticised for being repetitive,unnecessary, too specialised and/or impractical, this research base at least provides awealth of ideas to increase our understanding of the possible forces that shape managementaccounting. An understanding of these forces is useful in considering individual scenarioswithin which management accounting is applied and in analysing the likely or observed out-comes of such applications. In this book we will provide information to encourage furtherbackground reading, along with summaries of some influential and ground-breaking papers.Obviously, there is a limited amount of time available to you for such background reading,but it is often only by going back to the original papers that you can fully appreciate theworth of such contributions to the literature. Some of these papers can be surprisingly read-able; others may be less so! A number of specialised texts on such papers, covering a widevariety of management accounting related subjects, have been produced in recent years,two examples being Ashton et al. (1995) and Emmanuel et al. (1995).
Excellent analyses of the history and context of management accounting, taking a vari-ety of perspectives, have been provided by writers such as Loft (1995), Roslender (1995)and Johnson and Kaplan (1987). Some aspects of these and similar papers will be expandedupon in later chapters, although summaries of some issues are provided in the sectionsbelow.
Within such papers you will see that management accounting’s past, present and futuredevelopment as a profession may be dependent upon a wide range of factors. Writers ofsuch papers may focus upon such questions as the following:
• In what ways was management accounting created and developed as a response tochanges in the industrial/business/organisational environments?
• Does management accounting merely follow and react to changes in business (andother) environments, or does it take a more active role in shaping changes in thoseenvironments? To put is another way, is management accounting passive (reactive)or active (proactive)?
• To what extent do the observed changes in management accounting practice andresearch fit in with other schools of thought in areas such as sociology and philosophy?
• What is the significance for management accounting of areas of study such as ethicsand power relationships?
• To what extent are changes in management accounting shaped by political andideological processes?
Such questions are addressed by different writers in a variety of ways. Loft gives anoverview of a number of different ‘schools of thought’ on management accounting’shistory. Roslender looks at the context of management accounting within a framework ofcritical theory, relating it to a number of recognised social models. Johnson and Kaplan
6 MANAGEMENT ACCOUNTING
Coombs-01.qxd 3/18/2005 1:08 PM Page 6

give their own analysis of management accounting’s history and apply this to their theoryof why management accounting lost some of its relevance during the later years of thetwentieth century. Merchant (1998) and Robson and Cooper (1989) respectively give theirobservations on the relationships between management accounting and theories/modelsof ethics and power/control.
The Scope of Management AccountingAs explained earlier, there is no single definition of what management accounting is, orof the areas of work that it includes. Additionally, as management accounting continuesto evolve, some areas of its coverage may become obsolete and be discarded, and somenew and initially unfamiliar areas may gradually become accepted as mainstream man-agement accounting activities. Table 1.1 summarises some of the areas considered to bepart of ‘management accounting’, based upon a study of contemporary managementaccounting textbooks. One word of warning: just because a topic is contained within atextbook, it is not necessarily part of current management accounting practice. Reasonsfor such a mismatch include the fact that textbooks may not be able to keep pace withchanges in practice (this is not just a management accounting problem) and that textbooksmay contain some ‘ideal approaches’ which have not yet been put into practice, or whichare unlikely to ever be actioned. Some of the terms within Table 1.1 may be unfamiliar toyou. Don’t worry: these will be explained in later chapters. Table 1.1 concentrates onrelatively ‘high level’ activities. Bear in mind that ‘calculating the profitability of prod-ucts, services and operations’, for example, will involve a range of ‘lower level’ activitiesincluding allocating costs to products, setting inter-divisional transfer prices, and so on.
INTRODUCTION 7
Budgeting, planning and forecasting
Calculating the profitability of products, services and operations
Measuring organisational, divisional and departmental performance
Comparing results and performance within and between organisations
Assisting in the process of increasing effectiveness and efficiency
Assessing the performance of past and future capital investments
Advising on decisions about product mix, markets to be served and selling prices
Advising on decisions on whether to outsource products, components, activities and services
Advising on decisions involving the investment of scarce funds between a range of possible alternatives
Assisting in the making of a wide range of strategic decisions
Table 1.1 Some areas of activity considered to be part of ‘managementaccounting’
Coombs-01.qxd 3/18/2005 1:08 PM Page 7

Similarly, ‘assisting in the process of increasing effectiveness and efficiency’ may includea range of specialised techniques such as activity-based cost management and theory ofconstraints.
If you browse through other texts on management accounting you will find that theauthors have different ideas about what should be included within ‘management account-ing’. One specific area for which differences of opinion are found is that of financialmanagement or managerial finance. Traditionally, within the syllabuses of professionalaccountancy examinations, and also within universities’ accounting syllabuses, bound-aries have been drawn between ‘management accounting’ and ‘financial management’.This is often done as a pragmatic solution to the problems of achieving manageably-sizedsyllabuses for use within modularised courses. Like the boundary between financialaccounting and management accounting, the boundary between management accountingand financial management is also rather blurred. Similarly, the scope or coverage of‘financial management’ is not always well defined. Texts on financial management tendto have certain areas of coverage in common, such as financial theories concerning thepricing of financial instruments, the calculation of the cost of capital and the implicationsof gearing, dividends, the effects of risk, treasury management, and so on. The area ofcapital investment appraisal, that is, the appraisal of the implications of proposed invest-ments for the value of the organisation (via the application of discounted cash-flow tech-niques), is usually covered by financial management texts but is also covered by manytexts on management accounting. One possible reason for this dual coverage is thatcapital investment appraisal deals with investment decisions that have a strategicallyimportant effect upon the organisation. Thus, when the strategic aspects of managementaccounting are considered, such investment decisions are part of the work of managementaccountants. Similarly, when the strategic financing decisions related to such investmentsare made, these decisions form part of financial management. What is obvious, then, isthat such strategic decisions cannot be made in a one-dimensional way. Their impact issuch that all aspects must be considered and all interested parties (financial managers,management accountants, financial accountants, etc.) have a part to play.
For completeness, capital investment appraisal techniques will be incorporated withinthis text, as an understanding of these techniques and the ability to apply them compe-tently is essential to management accountants, as is the ability to work and communicateeffectively with financial managers, financial accountants and other managers. The impor-tance of the various professional disciplines working together in order to reach decisionsthat have considered a broad range of issues (i.e. a holistic approach) is a theme thatcontinues throughout this text.
Users of Management Accounting InformationWho uses management accounting information? As explained above, anyone who needsinformation to manage the organisation. Think about the people involved in managing theactivities of a typical company. The following are some examples:
8 MANAGEMENT ACCOUNTING
Coombs-01.qxd 3/18/2005 1:08 PM Page 8

• A sales manager would require information about sales trends, profitability, stocklevels, stock turnover rates, salespeople’s performance (measured in a variety of ways),customer ‘hit rates’, sales volumes and values by customer, area, sector, productline, etc.
• A production manager would require information about production rates, produc-tion efficiencies, machine capacity usage, productive employee performance, qualitymeasures and trends, stock levels, throughput rates, wastage rates, etc.
• A human resources manager would require information about absenteeism rates,lateness, sickness levels and trends, staff turnover rates, recruitment costs and theeffectiveness of the recruitment process, training rates and success rates, compara-tive salary and wage levels etc.
• An office manager, in addition to the types of information relevant to the humanresources manager, would require information about matters such as the perfor-mance of the particular office, however measured, the extent to which service levelagreements with other offices had been met, the overall effectiveness of theprocesses carried out by the office, budgets for the office and the extent to whichthese are being met, the cost implications of future services to be provided by theoffice, comparisons between the costs of services provided by the office and thoseof potential external providers, etc.
• A procurement manager would require information about stock and procurementorder levels, the effectiveness and costs of procurement processes, the cost implica-tions of alternative procurement approaches, the comparative costs of alternativesuppliers, procurement channels etc.
• A director or other high-level manager would require information on all of theabove matters but, of course, at a more aggregated, summarised level. The high-level manager needs to be able to ‘see the wood for the trees’ and hence her/hisinformation requirements will have a more strategic bias. Additionally, this type ofmanager would be more interested in the wider, longer-term and political aspects ofthe organisation’s business and thus the appropriate information requirements maybe broader in scope, less accurate, and more frequently exhibit a non-financial bias.
Of course, information along the same general lines will also be required by managerswithin a public sector organisation, or a not-for-profit organisation. The following areexamples, within public sector organisations:
• A housing department manager will require information about occupation rates,tenant turnover rates, the capital costs of housing programmes, the comparative costimplications of different approaches to the provision of social housing, etc., as wellas the types of information identified earlier relating to staff performance, budgetperformance, and service level agreements.
• A hospital manager will require information (depending upon her/his specific role)about such matters as bed occupation, waiting list trends, surgical success rates, costeffectiveness of surgical procedures, comparative costs of alternative suppliers,budgetary matters, etc.
INTRODUCTION 9
Coombs-01.qxd 3/18/2005 1:08 PM Page 9

Additionally, information of many types will be required, or at least be of interest, toemployees of the organisation, whether or not they are considered to be ‘managers’ in theformal sense. The following are examples of such uses of management information byemployees:
• Efficiency of the employee’s department, production line, division, etc., as com-pared to that of others – particularly if the employee’s monetary or other rewards aredependent upon performance.
• Comparative wage levels – particularly if wage negotiations are impending.• The profitability and general performance of the organisation, as compared with
that of competitors – particularly when job security is being considered.• The employee’s own performance, however measured, as compared with that of other
employees – particularly when the employee is considering applying for promotion.
One further issue to note is that what constitutes ‘management accounting information’will depend upon the uses to which such information is being put and upon the ‘level’ beingconsidered. Within the public sector, for example, information that a lower-level clericalofficer may consider to be ‘management accounting information’ may be considered by ahigh-level manager to be excessively detailed data. Similarly, the data that the high-leveldepartmental manager thinks of as management accounting information would not be con-sidered as such by a national or supranational organisation working at a sectoral, countryor economic zone level. For organisations such as the International Monetary Fund, theOrganisation for Economic Co-operation and Development (OECD) and the EuropeanUnion, the ‘detail’ may consist of the total results for entire countries or states.
Issues Affecting the Evolution and Designof Management Accounting Systems
There are many versions of the ‘truth’ about the roots and evolution of managementaccounting. Some authors describe the evolution of management accounting in terms ofthe ways in which it can be seen to have followed, or in some cases acted as a catalyst for,changes in the ways in which organisations operate. Others describe changes in manage-ment accounting as functions of societal and other factors that have simultaneouslycaused changes in organisational behaviour. Some (a minority of) authors see manage-ment accounting as a symptom of perceived ills in society – as a tool of the operation ofsubversive forces.
An excellent account of the history of management accounting is given by Loft (1995).Loft describes a number of ‘schools of thought’ on the history of management accounting:
• the traditional, or neo-classical revision school;• the relevance lost school;
10 MANAGEMENT ACCOUNTING
Coombs-01.qxd 3/18/2005 1:08 PM Page 10

• the labour process school;• the radical school
A summary of Loft’s account is given in the recommended further reading section atthe end of this chapter. In basic terms, Loft’s ‘schools’ have the following features:
• The ‘traditional’ school sees management accounting’s roots in the late nineteenthcentury, whereby systematic costing methods evolved as a response to the problemscaused by the Great Depression (1873–96). Many of the ‘best methods’ of manage-ment accounting are considered to have been developed during the early twentiethcentury as ‘tools’ of the manufacturer. The ‘neo-classical revision’ school argues thatthe birth of management accounting, as a way of profit maximisation and competi-tive defence, was as early as the late 1700s.
• The ‘relevance lost’ school (so called after Johnson and Kaplan’s text) sees manage-ment accounting as having been a key factor in co-ordinating firms’ activities overlarge geographical areas. Here, management accounting is seen as a necessary devicethat enabled the capitalism of the late nineteenth century and the rapid expansion andglobalisation of companies during the twentieth century. Management accounting isseen having been a useful ally to scientific management approaches. However, the‘relevance lost’ school argues that most of management accounting’s main advanceshad been made by the early twentieth century and that it has failed since to respondto or anticipate changes in business/organisational environments, thereby losingmuch of its relevance during the later twentieth century.
• The ‘labour process’ school sees management accounting as one significant aspectof changes in the ways in which labour and processes of managing labour have beencontrolled, leading to a progressive alienation of the workforce. Significantly, thisschool sees management accounting and accountants as instruments applied byexploiters of labour – as means of reducing the power of the labour force – therebyallowing domination and ‘empire-building’ by the owners of capital.
• The ‘radical’ school has similarities with the views of the ‘labour process’ schooland further sees the use of management accounting by organisations as part of theprocess of creating the ‘governable person’. Here, management accounting, with itstraditional focus on financial measurements and systematic surveillance of theworkforce (with associated rewards and penalties), is likened to the systems ofdiscipline and surveillance used in other institutions.
You may consider some of these views to be a little ‘over the top’. Some of them mayseem to have the essence of ‘conspiracy theories’ about them – only time will tell whetherthese or new alternative ‘stories’ are most accurate. Some things are clear from the aboveviews. Management accounting either acts passively or as an active force for change.Where management accounting is an active force for change, this force may have beenapplied consciously or accidentally. There are, therefore, a number of implications formanagement accounting as a profession:
INTRODUCTION 11
Coombs-01.qxd 3/18/2005 1:08 PM Page 11

• If management accounting has acted predominantly in a passive way, there may bepotential for management accountants to take more responsibility for creating ben-eficial change, rather than ‘parasitically’ responding to the efforts of others.
• If management accounting has acted predominantly in an active but accidental(unconscious) way, then it may have been causing unnoticed but adverse conse-quences for society. Maybe management accounting should face up to its responsi-bility to identify and consider the consequences of its actions.
• If management accounting has acted in a consciously active way and has been thecause of the adverse effects identified by, for example, the ‘labour process’ school,then maybe management accounting should act in a more responsible fashion andconsider its ethics.
Whichever way we look at it, management accounting seems to have an importantrole to play within organisations and, as a profession, it should not operate in avacuum, oblivious to the many potential offshoot effects it may cause. Among themany possible dimensions with which management accounting may interact are thedimensions of ethical behaviour, corporate governance, empowerment, agency theory,contingency theory, and so on. Additionally, the management accounting press hasseen the appearance and disappearance of many ‘new ideas’ and ‘cunning plans’ overthe years. Many of these ideas have turned out to be either impractical, lacking in sub-stance or simply carefully repackaged old ideas. We will revisit some of these mattersin later chapters.
The Time Dimension ofManagement Accounting
The Time Focus of Management Accounting
As you may already realise, the focus of financial accounting is the past. Conversely,management accounting’s focus is in the future. Practically all of the areas of activity con-sidered to be part of ‘management accounting’, as identified above, are focused upon thefuture. Budgeting, planning and forecasting, calculating the profitability of products, advis-ing on short-term decisions and on longer-term major investment decisions all involvelooking ahead in time. Admittedly, measuring performance and calculating product costsfor previous periods involve looking backward in time, but such activities are carriedout for one purpose only: to improve performance in future periods. The advice providedby management accountants can have value only if it is focused upon the future. Whowould, for instance, employ a management consultant merely to pick holes in past per-formance? The whole point is to ‘add value’ by avoiding similar mistakes in the future, tolearn from past experiences and to benefit from the insight of those who have ‘been therebefore’.
12 MANAGEMENT ACCOUNTING
Coombs-01.qxd 3/18/2005 1:08 PM Page 12

The Time Periods (periodicity) of Management Accounting Information
Financial accounting has, as we have seen, a retrospective focus. Additionally, because ofits nature and the demands placed upon it, it tends to be reported upon at regular inter-vals. For the purposes of publicly available financial reports, financial accounting infor-mation is produced at least annually or, in the case of listed public companies, on abiannual or quarterly basis.
Management accounting information may be produced regularly, for instance on amonthly or weekly basis, or on a more irregular, ad hoc basis, according to demand, pur-pose, circumstances and priority. Whereas many companies, particularly the more size-able ones, organise a system of regular, standardised reporting, focusing upon suchmatters as performance, cost control, and marketing success, these matters are among themore backward-looking aspects of management accounting. The more strategic, moreimportant aspects such as deciding upon the items in which to invest, which markets toenter/leave, which products to sell and which processes to adjust tend to be carried outless regularly. Such future-focused management accounting information is producedeither according to immediate needs (reaction) or according to a predetermined strategyaimed at optimising organisational performance (proaction).
The Timeliness (‘time value’) of Management Accounting Information
Whichever type of management accounting information is being produced, it is only ofvalue if it is produced within a given period of time. Regularly produced, routine, past-focused information needs to be available within a relatively short period of time after theperiod under review, in order to be of value in making adjustments to actions in the follow-ing period. Similarly, forward-looking, strategically focused management accountinginformation needs to be produced quickly in order to take advantage of the opportunitiesthat might exist, and before competitors gain the advantage.
There are, however, relationships between the timeliness of management accountinginformation and other factors such as its accuracy, reliability, comprehensibility and rele-vance, and the cost of producing it.
The Role, Power and Responsibilitiesof the Management Accountant
As described in the preceding section, management accounting, and management accoun-tants, may be in a position to have a significant influence upon the actions and strategiesof organisations. With this potential influence comes the burden of ensuring that man-agement accounting information is generated and communicated in a responsible fashion.Consider some examples of the outcomes of decisions made upon the basis of faulty orunreliable management accounting information:
INTRODUCTION 13
Coombs-01.qxd 3/18/2005 1:08 PM Page 13

• Employees may be labelled as inefficient, lazy or unsuitable and, as a result, may besubject to financial penalties or the loss of their livelihoods.
• A branch, division or department of an organisation may be labelled as ineffective oruncompetitive, resulting in the demotivation of its workforce and possibly its closure.
• Scarce financial resources may be diverted into investment projects that are unfea-sible, or suboptimal, leading to adverse effects on organisational results.
• A company might decide to alter the mix of products that it produces, or to alter thegeographical focus of its marketing, leading to a disastrous downturn in profitabilityand share price.
• A local health authority may decide to alter the range of procedures that its hospi-tals provide, or to close a local hospital, on false grounds, to the detriment of localhealth provision.
• A government department may decide to close down a service department and touse external, private sector contractors to provide the service, possibly leading to apoorer, less reliable service and escalating future costs.
• An incomplete analysis may lead to a company’s outsourcing of components orservices, only to find that quality and delivery suffer, with consequent effects oncompetitiveness, and depressing effects on the local economy and employment.
The management accountant’s role is thus a responsible one which can have direct effectson people both within and outside of the organisation. As we saw earlier, the managementaccountant, as the provider of performance-monitoring information, acts as an importantand influential link in the chain between management and employees, and between share-holders and management. The relationship between those in a position of ‘power’ (the prin-cipals) and those being managed or employed (the agents) is known as the principal–agentrelationship, and the corresponding body of theory is known as principal–agent theory oragency theory. We will examine such theory in more detail later. It is, however, worth not-ing here that the management accountant is responsible for ensuring two things in respectof the principal–agent relationship:
• that any information produced to monitor the performance of the agent is as reliableand accurate as possible;
• that any system designed to enable such monitoring is unbiased, either in favour ofthe principal or the agent.
This is not easy to achieve. The management accountant is meant to be a professional,acting in an impartial fashion. At the same time, however, she/he is an employee of theprincipal and may feel pressure to act in favour of the principal, to the detriment of theagent. Such pressure may be applied in many ways, including the ‘carrot’ of enhancedremuneration for being a ‘company player’. Of course, being in a position to control thedestiny of others can bestow a measure of power on the management accountant, and thispower must also be handled responsibly and ethically.
Later we will look in more depth at some writers’ thoughts on the role of ethics, ethicalcodes and empowerment/disempowerment in the work of management accountants. This
14 MANAGEMENT ACCOUNTING
Coombs-01.qxd 3/18/2005 1:08 PM Page 14

is an important area of study, as mishandling such matters can lead to the distrust ofmanagement accountants and the devaluation of their inputs.
Information Requirements forManagement Accounting: Practicalities,Costs and Organisational Implications
An excellent coverage of the information requirements of organisations, for the purposesof planning and control, is given in the first few chapters of Emmanuel et al. (1995).Emmanuel et al. indicate a number of important considerations of information for plan-ning and control. The following checklist below is based on Emmanuel et al. and isintended to act as an overview of some of the issues that should be considered whenencountering any management accounting planning/control system:
• Accounting information is affected by the modern business environment. Such envi-ronments are characterised by their complexity, uncertainty and turbulence, andtherefore management accounting systems must be designed to be able to cope withsuch environmental conditions.
• Accounting information systems must take account of the nature of control infor-mation appropriate to the particular organisation, the methods used for data andinformation transmission, and the culture and shared values existing within theorganisation.
• Information for control may be formal or informal; quantifiable or unquantifiable;routine or ad hoc. The system must be designed to be able to produce appropriatecontrol information at appropriate times.
• Accounting information systems serve as a means of control; an integrative mecha-nism and/or a measure of performance and viability. These multiple uses may conflictand lead to behavioural problems.
• Control is the process by which a system adapts to its environment and may havetwo major themes; one as a means to achieving the end of domination, and the otheras a form of regulation (regulation of others or self-regulation).
• To achieve self-regulation, clear objectives are required – an internal means ofachieving these objectives by measurable outputs and a predictive model of output.Any effective management control system must possess each of these. Self-regulatingsystems are sometimes called cybernetic systems.
• Control involves consideration of both operational and strategic issues and goes‘hand in hand’ with planning.
• Feedback is important. There are two important terms; (i) negative feedback is wherecontrol action is taken to reduce deviations from the plan; and (ii) feed-forward isthe comparison of expected outputs (predictions) with future activities, and controlactivities implemented. Planning is a form of feed-forward control.
INTRODUCTION 15
Coombs-01.qxd 3/18/2005 1:08 PM Page 15

• Decisions take two forms: programmed, where the situation is understood enoughto make reliable predictions and unprogrammed, where no formal mechanism forprediction exists. It can be argued that a flaw of many management accountingmodels is that they assume programmed situations where many actual managementcontrol situations are unprogrammed in nature.
• Objectives: Emmanuel et al. suggest that ‘individuals have objectives – collectivitiesdo not’. One of the practical problems of designing, implementing and maintainingmanagement control systems is that reconciling individual objectives and (assumed)group objectives may be problematic. Agreement on objectives is necessary forgroups to hold together
• Some main aspects for comparison of performance, that is, performance measurement,are: current period vs. previous periods; comparisons with similar organisations; actualvs. estimates (either ex ante or ex post estimates); actual performance vs. benchmarksor necessary performance required measured against specified objectives; and so on.
• There is no ‘best way’ to manage an organisation, including its management controlsystems. Everything is contingent upon a range of factors such as the environment(its predictability; competition; product diversity; hostility and so on); organisa-tional structure (its size, interdependencies, level of decentralisation, resource avail-ability); and technology (nature of processes, degree of routine, clarity of causalrelationships). Thus improving control systems is a continuing and iterative processrequiring an enquiring mind, flexibility and an openness to change.
• Managers are limited in their capabilities in many ways. They have, for example,limited powers of understanding, a limited capability to deal with a lot of data atonce and limited rationality. So, rather than undertake a full and logical appraisal ofdecisions (which is impossible in the practical situation) managers may jump at thefirst acceptable solution.
• Management control may take place at a number of levels:
(i) strategic planning – information should be tailor-made, external andpredictive;
(ii) management control – information should be integrated, mainly internal andmore historical;
(iii) task/operational control – information should be tailor-made, internal andreal-time.
Emmanuel et al. conclude that the ideal conditions for effective control systems are:
• a stable operating environment;• a clear-cut organisational hierarchy;• clear definitions of controllability;• little interdependence between parts of the organisation.
Of course, in today’s large, complex multinational organisations operating within anextremely competitive global marketplace, conditions are less than ideal to make life easyfor the management accountant!
16 MANAGEMENT ACCOUNTING
Coombs-01.qxd 3/18/2005 1:08 PM Page 16

ConclusionsThis chapter has shown that management accounting:
• is essentially the production of information for managers at all levels;• is designed to increase organisational effectiveness;• is forward-looking and relies upon estimation;• has evolved and continues to evolve as organisations and society progress.
It has also argued that management accounting information:
• must be relevant to be useful and so must take account of organisational andbehavioural settings;
• may have undesirable effects if used without careful consideration
SummaryThis chapter has provided an introduction to the nature, scope and difficulties of man-agement accounting. We have seen that management accounting is forward-looking innature and is involved in assessing the implications of managerial and strategic decisions,both those decisions made in the past and those being considered at present. Essentially,we see management accounting as being interested in producing useful information toenhance organisational effectiveness.
The role of management accounting, and the definition of its scope, continues toevolve. We have seen that management accounting information is essential to most organ-isational players. We have also seen, however, that some management accountants mustconsider the effects of the information that they produce, as such information may haveundesirable effects. Management accounting has an important role to play in all types oforganisation, but what type of information is most useful depends upon a wide range of(contingent) factors. Finally, we note that management accounting may play a passive,reactive role or an active one. The latter approach carries with it a degree of responsibil-ity for the organisational and possibly societal impacts it may have.
Recommended Further Reading Loft, A. (1995) ‘The history of management accounting’,in D. Ashton, T. Hopper and R. Scapens (eds), Issues in ManagementAccounting (2nd edition). Hemel Hempstead: Prentice Hall.Loft gives an overview of the history of management accounting, looking at the various(often conflicting) historical perspectives. Such analyses can be useful in learning fromthe past when negotiating current and future management accounting problems. Shepoints to some of the problems of any historical analysis:
INTRODUCTION 17
Coombs-01.qxd 3/18/2005 1:08 PM Page 17

• the possible atypicality of early examples;• a lack of clear evidence of how accounting records were used, and to what extent.
Loft identifies four ‘schools of thought’in the history of management accounting:
Traditional School and the Neo-classical Revision Loft explains how, as a result of the Great Depression of the late nineteenth century, therewas a crucial need to calculate and be aware of product costs as competition increased.This led, she notes, to the emergence of systematic allocations, apportionment and cost/financial integration (she refers to Factory Accounts, by Garke and Fells (1887), in thisrespect). She further explains how following the nineteenth century there was a develop-ment of ideas regarding allocation to products, accounting for waste and scrap, and howstandard costing methods emerged in the 1920s. Within the ‘traditional’ school, she explainsthat costing is seen as a manufacturer’s tool that developed in line with manufacturingmethods.
‘Neo-classical revision’ was, Loft observes, a similar view to that of the traditionalschool except it argues that costing was a management tool as early as the late eighteenthcentury and that costing methods were used to maximise profits and defend against com-petition. Loft mentions the work of Fleischman, Parker and Tyson as being representativeof the views of the neo-classical revisionists.
In both traditional and neo-classical views, management accounting is seen as taking avery passive and reactive role.
‘Relevance lost’ schoolLoft refers to Johnson and Kaplan (1991), who say that in 1962 Alfred Chandler drewattention to the importance of management accounting in the development of giant USfirms. Management accounting is seen to have been a key factor in co-ordinating suchfirms’ wide activity ranges over large geographical areas. Johnson and Kaplan argue that:
• it was the rise of the factory that led to a move away from market-exchange struc-tures (lots of small traders/manufacturers letting the market dictate prices).
• management accounting/costing was a necessary tool of the new industrial capital-ism of the late nineteenth century, developing to ‘evaluate a company’s internalprocesses’ via measuring efficiency in mainly singler activity firms.
• management accounting’s development facilitated the growth of enterprises – i.e. itwas proactive rather than passive; a catalyst to change rather than an effect of it.
• as scientific management (Taylorism) developed, management accounting movedfrom simple records of cost (historic) into budgeting and monitoring, and financialaccountants found that it was useful for simple-evaluation of stocks.
• following the turn of the twentieth century, as firms became larger and more decen-tralised, further management accounting measures (e.g. return on investment (ROI))
18 MANAGEMENT ACCOUNTING
Coombs-01.qxd 3/18/2005 1:08 PM Page 18

led to an increase in management accounting’s role, in order to optimise the useof capital.
• most ‘modern’ management accounting practices had been developed by 1925 andmanagers have since tended to rely mainly on numbers. Therefore, managementaccounting’s information content has lost its strategic (and sometimes most of its)relevance.
Loft points out that, although management accounting may have been slow to react tochange, it was ‘catching up’ and that the preferred process was one of evolution ratherthan revolution – i.e. a series of gradual well-considered changes rather than ‘fire-fighting’reactions. Although some of management accounting’s key techniques and approacheswere admittedly quite well established (i.e. old), this did not necessarily lessen their rel-evance (after all, some of the basic principles of mathematics and language, for example,have very historic origins, but they still apply today).
Labour Process ApproachLoft refers to the work of Hopper and Armstrong (1991) who:
• see management accounting’s development as being one (significant) aspect ofoverall changes in the way in which the labour process has been controlled as cap-italists have progressively alienated the process of production from the worker.
• explain the success of early factories (partly) by the way in which managementaccounting was used to intensify the exploitation of labour.
• interpret management accounting’s focus in the early twentieth century as one ofreducing the power of the labour force, rather than of increasing productive efficiency
• explain that, in order to homogenise labour via de-skilling, companies increasedthe percentage of unskilled labour used by reorganising the productive process.Management accounting developed rapidly in order to aid this process.
• see budgeting and the use of ROI as having been developed to increase control overmanagerial labour and hence, again, management accounting is interpreted as a toolused in this process of exploitation.
All of the above may explain the dominance, in the twentieth century, of accountants assenior executives in most US and UK organisations – i.e. accountants as a dominatingforce; engineers and the like as dominated managerial labour).
RadicalismLoft explains how the writing of Foucault, Derrida and others (none of whom wrotedirectly about accounting) may be used to help in the interpretation of managementaccounting’s history. Foucault (1977) wrote about the growth of disciplinary institutions(prisons, armies, schools, hospitals, factories) in the nineteenth and twentieth centuries,wherein individuals were arranged so that they could be watched, and discipline/punish-ment administered, via surveillance and record keeping.
INTRODUCTION 19
Coombs-01.qxd 3/18/2005 1:08 PM Page 19

Management accounting can thus be seen as one of these techniques of surveillanceand record keeping. Such a process will lead to the prioritisation of financial factors aboveall others, and hence to the expansion of management accounting.
Loft points to the effects of the UK government’s taking control of many factoriesduring the world wars of the twentieth century. This led to the dominance of cost-pluspricing and a much-increased emphasis of historical costing. Therefore cost accountingexpanded, as did the cost accountant’s importance.
Management accounting is thus seen as part of the process of creating the ‘governableperson’.
Questions1. Examine the extent to which the role and nature of management accountants might
differ within the public and private sectors. 2. Critically analyse the possible effects of e-commerce on the role of the manage-
ment accountant.3. Traditionally, management accounting, financial management and financial
accounting have been treated as largely separate disciplines. Discuss the extent towhich such a categorisation is still valid and comment upon the implications fortoday’s management accounting profession.
4. ‘Management accountants exist to ensure that the changing information needs ofmanagers are met.’‘Management accountants are in the fortunate position of being the brokers andguardians of information. They may use this information to increase their ownpower and status.’‘Management accountants have a duty to serve all stakeholders of their organisationand a responsibility to ensure the reliability of the information which they process.’To what extent are these statements contradictory or complementary?
5. Analyse the potential effects of recent developments in the business or publicsector environments on the relevance of management accounting systems.
6. Analyse the extent to which the management accounting information system of aservice-based organisation of your choice would be likely to differ from that of amanufacturing company.
20 MANAGEMENT ACCOUNTING
Coombs-01.qxd 3/18/2005 1:08 PM Page 20

Chapter 2COST ANALYSIS ANDDECISION MAKING
By the time you have finished studying this chapter, you should be able to:• describe how costs may be classified in both subjective and objective ways;• define and identify direct and indirect costs and categorise them into their subdivi-
sions of labour, materials and overheads;• explain how costs behave at various levels of activity;• classify costs for control and decision-making purposes.
IntroductionIn Chapter 1 we explained the meaning and nature of management accounting, describedthe scope and content of the discipline, discussed past and current issues in managementaccounting and, finally, outlined the factors which are important when designing man-agement accounting systems. In this chapter we begin to develop the fundamentals ofcost accounting which underpin these concepts and issues. This chapter is therefore aimedat ensuring that you have a fundamental grasp of the basics as this is the bedrock uponwhich an ability to develop the interpretation skills of the management accountant isfounded. In essence, these skills are based on the ability to understand the basis on whichfinancial information is compiled and provided in a business environment. This applieswhether the business operates in the private sector or is regarded as providing publicsector services. The chapter thus contains a number of basic definitions in addition tofostering the development of analytical and critical skills.
The chapter develops what has been described as ‘basic knowing’ (Coombs et al.,2000), in that basic concepts have to be understood before moving on to develop moreadvanced skills of interpretation. Hence, this explains their introduction at this stage ofthe text. We also introduce these concepts in a variety of organisations to show thatmanagement accounting is relevant not only to what is traditionally seen as its home in
Key Learning Objectives
Coombs-02.qxd 3/18/2005 1:08 PM Page 21

manufacturing industry but also to a wide range of other sectors of the economy, includingthe public sector. This move away from manufacturing industry has been highlightedby the changing nature of western economies with their reduced emphasis on heavyindustry, the growth in the service sector and the almost infinite demand for public sectorservices despite finite resources.
Cost Management Essentials – The BasicProcess and Requirements
The basic requirement in the management of the business process is for the provision ofinformation for decision-making purposes. The nature of these decisions depends on thetask in hand. Information has to be tailored to the needs and abilities of managers makingdecisions, but its foundation in a management accounting context is based on the attribu-tion of costs to cost objectives. A cost objective is a purpose or activity for which a dis-tinctly identifiable measurement of cost is desired in order that a decision can be made.In essence, the purpose is to attract the attention of managers so that they can then moveinto problem-solving mode. It will be noted that this emphasises the importance of infor-mation being in a format that is relevant to the decision required and the level of managersmaking the decision. It also implies that information, in addition to being relevant, has tobe meaningful, accurate, timely and in a format suitable for use by the decision maker.This is inevitably a challenge for any accounting system or, indeed, management accoun-tant designing the accounting information system to provide what is required by decisionmakers.
Fundamental in this process is the definition of the cost unit, the unit of product orservice that an organisation produces. As Upchurch (1998: 35) points out, this ‘must bean accurate reflection of the nature of the output to which costs are attributed’, otherwise,if it is wrongly defined, then there is every chance that cost attribution will be incorrect.
It is conventional in management accounting texts to assume that all businesses aim tomaximise profits as per the traditional view expressed in the neo-classical economicsmodel. This is rather a simplistic assumption of the real world and is further discussed inChapter 10, where agency and other theories are raised. It is presented here, however,since profit under this definition is seen as the sole function of business and is presentedin many management accounting texts as somehow being self-explanatory without anyattempt being made to discuss the problems of measuring ‘profit’.
There are numerous definitions of what ‘profit’ is, as profit can be measured, for exam-ple, from an accountant’s, an economist’s and a taxation authority’s perspective. Underthese various definitions we can have a wide range of potential profit figures even inrelatively straightforward companies.
Simplified definitions are as follows:
• Accounting profit is an improvement in the financial position through the excess ofaccounting revenue over accounting cost over a defined accounting period.
22 MANAGEMENT ACCOUNTING
Coombs-02.qxd 3/18/2005 1:08 PM Page 22

• In micro-economics economists consider the opportunity cost of capital provided byentrepreneurs (also termed ‘normal profits’) as a cost of production. In macro-economics the term ‘profit’ excludes interest on borrowed capital but not the returnon the capital provided by the owners (Baring Asset Management, 1997: 217).
• Taxable profits depend on the rules set by the tax body. In the United Kingdomdepreciation is normally disallowable (excluding certain intangible assets andfinance leases) in computing taxable profits, being replaced by a system of capitalallowances.
In the accounting context the use of various legally acceptable financial accountingtechniques in stock valuation, assessing the provision for bad and doubtful debts, thetreatment of an item as capital expenditure as opposed to revenue expenditure, the depre-ciation rates judged appropriate and applied to plant and machinery, the definition ofmateriality of an item and so on will have a significant impact on the financial resultsshown. Large-scale publicly quoted companies have been known to use these techniquesto smooth profit figures (with or without the knowledge and agreement of their auditors)to manage stock market expectations, their share price and their dividend distributionpolicy.
As has just been indicated, a wide range of ‘profits’ are possible, yet profit is used asan essential measurement basis to assess the performance of a business by a wide rangeof commentators both internal and external to any business organisation. By using it assuch a measure we are attempting to show whether it has been worth an enterprise under-taking any activity in the period of operation being measured (year, six months, week orwhatever). This concept of performance measurement and the difficulties associated withmeasuring profit also applies to future projections of profitability and should be borne inmind when the reader comes to budgeting in subsequent chapters. It can thus be arguedthat the term ‘profit’ should carry a health warning for readers and any analyst on thefigures produced.
‘Profit’ therefore depends on how the managers of the business define (whetheractively, or passively through ignorance of accounting techniques) the profits that theywish to achieve. This will have obvious implications for the management accountingreporting system and the actions taken as a result of information produced. It may well bethere is a surplus of financial benefits over financial costs in an accounting period. Thiswould, however, be specific to the company as it defines the term ‘surplus’ since itexpresses the financial performance the company is attempting to measure through thetargets set by management. Readers should also remember that we are not talking aboutcash flows but about the benefits earned and costs expended in a period arising from theproductive activity of the business during that period. These costs in measuring profit thusinclude non-cash flows such as depreciation.
In ‘not for profit’ organisations, as is self-evident, the organisation exists to achievesome benefit other than profit. Thus, we have charities which exist to further the causeof the specific charitable functions for which they were established and organisationssuch as the NHS and local government providing a national health service and local
COST ANALYSIS AND DECISION MAKING 23
Coombs-02.qxd 3/18/2005 1:08 PM Page 23

services such as education and leisure. In the case of a charity, its objective will be tomaximise its revenue over its costs to maximise the achievement of its charitable func-tions. Thus its management accounting system will be established and run to report onhow well the organisation is doing in achieving this objective. In the case of the NHS,the more economically, efficiently and effectively it use its resources, the greater thepotential impact on satisfying patient needs. Where it provides services to the privatehealth sector it will need to know the cost of those services so that it can makedecisions on how it recovers those costs and at what price. Local government willhave services for which it charges and may even aim to make profits (such as leisurecentres), but many local government services will be provided below cost. The finan-cial objective of local government (as with the NHS) therefore is to manage all itsservices on the general principles of economy, efficiency and effectiveness to reduce thecalls on both local and national taxpayers who fund the majority of local governmentexpenditure.
To turn to cost analysis, all expenditure can be divided into the groups correspondingto the activities of the concern under consideration. If we consider a manufacturing envi-ronment, the activities of the enterprise can be divided into expenditure on manufactur-ing, administration expenses, selling expenses and distribution expenses. For the serviceindustry, expenditure on manufacturing can be substituted with expenditure on servicedelivered.
The total expenditure of a manufacturing business can be subdivided as shown inFigure 2.1. Ultimately the total cost of sales can be compared with the total income forthe period resulting in a profit or loss for that period, as discussed above. A similar analy-sis could be performed for a service industry but excluding, of course, the manufacturingelements.
Direct labour, direct materials and direct expenses comprise prime cost and, togetherwith production overheads, comprise total production costs. In more detail:
24 MANAGEMENT ACCOUNTING
Direct materialsDirect labourDirect expenses (if appropriate)Overheads
ProductionProduction overheads cost
Total costDepartmental of salesGeneralServices
Administration expensesSelling and distribution expenses
123
123
Figure 2.1 Total cost of sales analysis, manufacturing industry
Coombs-02.qxd 3/18/2005 1:08 PM Page 24

• Direct materials comprises all material purchased for a particular job, materialacquired and later issued from stores, components purchased or produced materialpassing from one process to another, and primary packaging materials. Items suchas import duties, transport costs are also part of direct materials costs. A de minimusrule will also apply to items of minimal cost – meaning that there are items belowwhich it is not worth the time, cost or effort of charging what could be regarded asthe direct expenditure of manufacturing a product directly to that product. Thesecosts will be treated as indirect expenditure (overheads). An example of direct mate-rials where the product is a car would be the metal used to make the body shell. Inessence, direct materials can be clearly observed in the product manufactured.
• Direct labour is the labour expended in making the product. Wages paid to skilled andunskilled workers for work rendered can be charged directly to products, hence theterm direct labour. Other similar terms include process labour, productive labour andoperating labour. In our car example the direct labour element would be the personwho assembled the vehicle. Where the product is a service such as a taught class in auniversity, the direct labour is the lecturer standing in front of the class. Wages of fore-men, storespersons and internal transport drivers would be regarded as indirect as theycannot be traced directly to a particular job. In the university case indirect costs wouldbe the academic registry as it does not have direct teaching contact with students.
• Direct expenses are those costs other than direct materials or direct labour that areincurred in the production of a product. An example would include the hire of spe-cial tools to manufacture a particular product or deliver a specific service in theservice sector.
You will have noticed that all the above costs are described as direct. All other costs areindirect – that is, overheads. While there are elements of subjectivity in the classificationof direct costs, technical expertise exercised through subjective judgements plays a majorpart in dealing with overheads, particularly in any allocation to products. It should also bepointed out that employees working in a marketing department, for example, are a directcost of the marketing function. In terms of the production department, however, such indi-viduals are an overhead as they do not produce the company’s product. We can furtherclassify overheads as follows:
• Production overheads This category of cost covers all indirect expenditure incurred,from the receipt of the order to the dispatch of the completed goods. Other termswhich describe such expenditure include ‘factory overhead’ and ‘works overhead’.Examples are: rents, rates and insurance, excluding those that can be apportioned tothe general administrative office, selling departments or warehousing and distribu-tion areas; indirect labour, such as supervision costs, salary of the works manager,storespersons, gauging and testing, idle time of operatives, works security; con-sumable stores and all types of indirect material, including such items as oil andgreases; depreciation of factory plant, vehicles and buildings; sundry expenses, forexample, performance rights licences for factory music.
COST ANALYSIS AND DECISION MAKING 25
Coombs-02.qxd 3/18/2005 1:08 PM Page 25

• Administration overheads comprise all costs and expenses incurred in the direction,control and day-to-day administration of the organisation. Examples include officelighting and heating, accountants’ salaries, credit management, and directors’ salaries.
• Selling and distribution overheads comprise the costs of selling and distributinggoods to the customer or client. They therefore include the payment of salaries andcommissions to sales staff, training costs, preparation of tenders, rent of salesoffices, costs of transportation, packaging, despatching and so on. Selling and dis-tribution costs can be analysed by function (e.g. warehousing or advertising) or bylocation (e.g. by sales territory).
The distinction between direct and indirect costs is directly related to the cost objec-tive. If the cost objective is the establishment of the costs of selling and marketing thenthe salaries of salesmen and cost of promotion will be regarded as a direct cost. The costscannot, however, be traced directly to products and are thus indirect for product valuationpurposes. It should also be remembered that, for example, in a public sector organisationthe cost of an accountant working in the central finance department will be a direct costof that department. It is, however, an indirect cost of say, the education department whichuses the individual to provide financial advice on the education service.
Cost ClassificationCosts can basically be divided into costs for stock valuation, costs for control and costs fordecision making. Stock valuation is closely linked with profit measurement and the match-ing concept familiar to students of financial accounting and is covered in Chapter 3.Unexpired costs are those costs that are expected to make a contribution to profit in somefuture accounting period and are carried forward as assets on the balance sheet. They willbecome an expense in some later period. Any cost consumed during a period and thus seenas having no future earnings potential is charged to revenue in the current period and is thustreated as an expired cost. In a manufacturing environment all manufacturing costs areregarded as product costs and non-manufacturing costs are treated as period costs.
Allocating costs for control is concerned with responsibility accounting. Product costsin themselves are inadequate to perform this function as a product may go throughseveral manufacturing processes. In this case it is likely that these processes would bemanaged by several different people. Responsibility accounting is based on the principleof recognising an individual’s area of responsibility and holding that individual account-able for his/her performance for costs (and revenues as appropriate) incurred where theyare under that individual’s control.
Responsibility centres are divided into three types:
• cost centres where managers are held responsible for expenses under their control;• profit centres where managers are held responsible for both sales revenue and expenses;• investment centres where managers are normally held responsible not only for sales
revenue and expenses but also for capital investment decisions.
26 MANAGEMENT ACCOUNTING
Coombs-02.qxd 3/18/2005 1:08 PM Page 26

In the previous paragraph it was stated that managers should be only held accountable foritems within their control. While ultimately all costs are controllable by someone withinan organisation, clearly the costs which are controllable at the highest level of managementdiffer from those controllable lower down the organisation. This has significant implica-tions for accountants in terms of the design of performance reports.
As a general rule, the lower down within an organisation that a manager operates themore detailed is the performance report, although again it should only contain informa-tion on costs controllable by that manager otherwise negative behavioural implicationscan arise (Argyris, 1953). It also leads on to the concept of exception reporting, so thatmanagement can concentrate on those items which are important and controllable bythem in a given situation.
A controllable cost can be defined as a cost over which a manager has the ability toinfluence behaviour. If the manager has no ability to control or influence a cost it is clearlyuncontrollable at that manager’s level – it is beyond the manager’s span of control. As anillustration, a production manager may be able to control the usage of material but con-tracts for that material are let through a central purchasing department which negotiatesprice. In any budget variance for materials the usage variance of the material is controllableby the production manager, but any price variance is the responsibility of the purchasingarm of the organisation. Responsibility has thus been identified with the power to control.
While cost accounting is concerned with cost collation and the calculation of productcosts for profit measurement, management accounting is concerned with the proactive gen-eration of financial and non-financial information for decision making. In the public sector,costing information (to simplify) is concerned with creating budgets for agreed policygoals and monitoring those budgets. Costing information is accumulated via the account-ing system of an organisation. Management accounting information is accumulated bothwithin and outside the standard cost-gathering system with the objective of helping managersevaluate alternative courses of action to reach a decision. By its very nature, managementaccounting information is non-standard and decision-specific. The more complex the deci-sion, the more complex the probable information set although managers need to be awareof the danger of being overwhelmed by the volume of data (Simon, 1953).
This leads into the discussion of various costs classifications for decision making:
• cost behaviour by volume of activity;• sunk costs;• relevant and non-relevant costs;• avoidable and unavoidable costs;• opportunity costs;• marginal or incremental costs.
Cost Behaviour by Volume of Activity
Costs can vary by the level of activity, and this has important implications for decision mak-ing. A manager therefore has to be aware of how costs will behave in a specific situation.Typically managers might ask:
COST ANALYSIS AND DECISION MAKING 27
Coombs-02.qxd 3/18/2005 1:08 PM Page 27

• What will happen to material costs if output rises?• What sales level of units do we need to sell to cover our costs and at what
price?• If we expand production, what will happen to labour costs?• How do energy costs behave at various levels of production?
These questions raise issues about how accountants estimate costs and revenues for a varietyof activity levels and how they present that information to managers.
The traditional terms used in this respect are fixed costs, variable costs, semi-variable costs and stepped or semi-fixed costs. Figure 2.2 illustrates these how these categories ofcosts behave in relation to output changes.
• Fixed costs remain constant over a wide range of activity levels for a specific periodof time. Examples of fixed costs include depreciation of buildings, rent and rates,and management salaries.
• Variable costs are assumed to vary in the short term directly in proportion to output.These costs are thus assumed to be linear and can thus be represented by a straightline. Examples of variable costs include fuel for motor vehicles (directly variablewith mileage covered), sales commissions (directly variable with product sold),piecework labour costs (directly variable with produced units) and direct materialcosts (directly variable with product manufactured).
• Semi-variable costs can be illustrated by activities such as photocopier rental. Undersuch agreements there may be a fixed rental change followed by charge per copymade. The rental is thus fixed but total cost will depend on the addition of the vari-able element. A similar cost pattern exists for any utility bill which has a standingcharge element.
• Stepped or semi-fixed costs remain constant within a band of activity. Here we findthat over a band of productive activity there is no change, but if production levelsfall or rise we may need to either lay off or employ extra labour thus progressing tothe next step up or down.
It will be noted from Figure 2.2 that it is assumed that all costs exhibit straight-linebehaviour. In the economist’s model the economist assumes that the average unit costdeclines on the basis, for example, that a firm obtains discounts for bulk buying of mate-rial and can also benefit from the division of labour as it expands. These are regarded aseconomies of scale. At the other extreme, as the firm becomes too large it suffers diseco-nomies of scale. These factors inevitable lead to a different cost function for the econo-mist from that of the accountant. The key factor to remember, however, is that theaccountant is interested in representing costs over the range of output that a firm reason-ably expects to correspond to the reality of its operating environment. This is the conceptof relevant range and also broadly represents the output levels over which the firm hasgained experience of operating and for which cost data are available from the business’saccounting records.
28 MANAGEMENT ACCOUNTING
Coombs-02.qxd 3/18/2005 1:08 PM Page 28

Sunk Costs
These are costs which are the result of previous decisions of the enterprise and which willbe unaffected by any future decision as they have already been incurred. An example isexpenditure on materials that were bought in anticipation of a contract which never cameto fruition. The materials are still in store and the decision to buy cannot be undone.
COST ANALYSIS AND DECISION MAKING 29
Fixed cost
cost
Variable cost
cost
Stepped fixed cost Semi-fixed cost
Output Output
Output Output
cost
Unit Fixed cost
Output
cost
cost
Figure 2.2 Cost behaviour against output change
Coombs-02.qxd 3/18/2005 1:08 PM Page 29

Relevant and Non-Relevant Costs and Revenues
In making decisions managers, in whatever enterprise they work, are primarily concernedwith those costs and revenues which will be changed by their decisions. They are notinterested in costs and revenues which will be unchanged by their decisions. In the shortterm not all costs and revenues are relevant for decision making. Costs which will be unal-tered in the short term are fixed costs and include such items as rents and rates. Whenconsidering a decision on transporting goods the road tax and insurance already paid ona vehicle are fixed. Consequently, the only costs that will be altered by a decision to trans-port goods by road by the company’s own vehicles will be any variable costs that the firmwill incur (e.g. extra fuel costs, and possible bonuses paid to drivers).
Avoidable and Unavoidable Costs
These are effectively an alternative perspective on relevant and non-relevant costs.Avoidable costs are those costs that have to be incurred if a particular course of action istaken. Unavoidable costs cannot be saved.
Opportunity Costs
These measure the cost of an opportunity forgone to pursue a particular course of action.By their nature, opportunity costs are not based on past payments but are an estimate ofthe costs of following or not following a particular course of action. The cost arisesbecause of the scarcity of resources and because there is competition for the use of theseresources.
Marginal or Incremental Costs
These are additional costs or revenues that arise as a result of following a particular courseof action. Incremental costs may include fixed costs depending on the nature of the deci-sion being taken. Suppose an estate agent is considering increasing the size of the officeaccommodation available to the business by renting premises next door. Rent, while afixed cost for the current premises, will increase on signing the contract for the new officeand thus constitute an incremental cost to the business.
Unit CostsUnit costs are widely used across all sectors of the economy to compare and control finan-cial performance. At its most basic a unit cost is simply the total cost of producing a numberof units divided by the number of units produced. If, for example, a restaurant produced
30 MANAGEMENT ACCOUNTING
Coombs-02.qxd 3/18/2005 1:08 PM Page 30

10,000 meals at a cost of £20,000 during an accounting period the unit cost of a mealwould be £2. If all meals had been sold for £4 we would have made £20,000 profit. If weare looking forward the £2 unit cost could be the benchmark against which to measure andcontrol future performance.
Table 2.1 is an example of a unit cost statement. The objective is the provision of schoolmeals, and we are interested in the cost per meal provided. The categorisation of costs intotheir individual elements such as pay, food and energy is the subjective element of thestatement. In such public sector examples the objective is defined as the service beingprovided (e.g. education), while the individual categories of expense represent the sub-jective elements as a decision has to be made on how to code items of expenditure. This
School A School B School C School D TOTAL
Unit Unit Unit Unit UnitCost cost Cost cost Cost cost Cost cost Cost cost
(£000) (p) (£000) (p) (£000) (p) (£000) (p) (£000) (p)
Food 16.00 35 31.50 40 27.50 45 10.00 28 85.00 38
Energy 3.60 8 4.10 5 2.00 3 3.00 9 12.7 6
Kitchen staff
Cooks 9.00 20 18.00 23 18.00 29 9.00 26 54.00 25
Asst. Cooks 12.00 27 6.00 8 12.00 20 12.00 35 42.00 19
Maids 13.50 30 13.50 17 13.50 22 13.50 39 54.00 24
Cleaners 3.00 7 7.00 9 6.00 10 5.00 14 21.00 10
Overheads 3.75 8 4.45 6 4.95 8 3.95 11 17.10 8
Supervisor 5.00 11 5.00 6 5.00 8 5.00 14 20.00 9
Capital charges
Depreciation 10.00 22 9.00 12 9.00 15 7.00 20 35.00 16
Interest 4.00 9 2.00 2 2.00 3 2.50 7 10.50 5
Admin charge 9.00 20 15.60 20 12.24 20 6.97 20 43.81 20
Total 88.85 197 116.15 148 112.19 183 77.92 223 395.11 180
Meals 45,000 78,000 61,200 34,850 219,050provided
No. of pupils 400 650 550 320 1920
COST ANALYSIS AND DECISION MAKING 31
Table 2.1 Example of a unit cost statement: comparative food costs for four schoolsproviding school meals, March–December 2004
Coombs-02.qxd 3/18/2005 1:08 PM Page 31

Staff Kitchen A Kitchen B Kitchen C Kitchen D
Cooks 45,000 44,000 30,600 34,850Asst. cooks 22,500 78,000 30,600 17,425Kitch. maids 15,000 26,000 20,400 11,617
example has been developed as many readers will be familiar with the provision of schoolmeals through personal experience (good or bad!) and it could obviously be extended toa restaurant or even a hotel with relatively minor changes. Indeed, in the school situationdepicted we could add in the income received from the sale of meals and work out theprofit or loss on the provision of school meals.
In Table 2.1 it is evident that the provision of meals in kitchen B is considerably moreefficient in cost terms than in A, C or D. Its cost per meal provided, 148p, is 75% of A,81% of C and 66% of D. No income per meal has been shown for each kitchen to sim-plify the example, but it could be common across all three kitchens, given the subject ofthe example. Examination of the individual cost components reveals that kitchen B’slower unit costs are the result of a variety of factors. Food costs are the highest of all fourkitchens but the unit costs for staff are the lowest. Managers would be interested in estab-lishing the reasons for these variations and in doing something about them. It might bepossible to direct any savings in the kitchens to the provision of further teaching support.
Food costs vary considerably. This might be caused by:
• overstocking, leading to waste;• overprovision of portions, indicating a lack of menu and portion control;• fraud and theft;• buying from local suppliers rather than cheaper contractors;• quality of food in the meals varying between the kitchens;• special dietary needs of certain pupils (e.g. diabetic meals).
Note that we have no answers, but managers are in a position to raise questions.Energy costs per meal vary between kitchens but judgementally are rather low when
compared to total cost. It may not be possible to influence these costs other than by rela-tively simple measures, such as encouraging staff to turn off lights and gas when thekitchens or equipment are not in use.
Further analysis of Table 2.1 reveals cooks are paid £9,000 per annum, assistant cooks£6,000 per annum and kitchen maids £4,500 per annum. This gives the ability to producea workload analysis, as set out in Table 2.2. The table does not tell us which kitchen is themost efficient, but it demonstrates considerable variation in workloads between staff andkitchens. This would require further study to see if the solution was to relocate staff ormake staff redundant. This might be achieved via work study analysis.
32 MANAGEMENT ACCOUNTING
Table 2.2 Workload analysis of meals per worker
Coombs-02.qxd 3/18/2005 1:08 PM Page 32

Cleaning costs vary per meal (although no mention has been made of floor area). Itmight be possible to contract out the cleaners if this has not already been done.
The original table/report can also be designed to highlight responsibilities. The upperpart of the table focuses on costs directly incurred in the preparation of meals and pre-sumably within the control of the cook. Kitchen staff are appointed by someone – thequestion is who? The employment of staff generates overheads on wages and salaries.These overheads (pension and national insurance) may be outside the direct control of thesupervisor if he/she did not appoint but will depend on the number of staff employed. Thesupervisor line itself will also be the responsibility of a higher-level manager who maybe the head teacher but is more likely to be based at a central office running the schoolmeals service for the organisation. It should be noted that the statement is a nine-monthanalysis, implying that this type of data is gathered regularly. It could be used to projectexpenditure forward to compare against projected costs and income to act as a budgetarycontrol statement. It is clearly meant to stimulate action or at least identify that action maybe required.
The administration charge represents a fixed charge and in the example is aimed at recov-ering in the cost of the meal a set contribution (20p) towards the administration costs of thescheme. It thus assumes a central administration function somewhere within the organisation.This cost can only be reduced by questioning the value for money provided by that function.
It should be noted that the emphasis in Table 2.1 is on unit costs; nothing is said aboutthe quality of meals. This is an emphasis on throughputs as opposed to outcomes. In com-piling any report on the provision of meals the views of users of the service should besought to present a more rounded picture when considering how well the provision ofmeals is going.
Unit cost statements broadly contribute to the management of an organisation in threemain ways. First, they serve as an indicator of efficiency relative to other similar functionsor providers within an organisation or between organisations. For the school mealsservice, they allow it to compare its cost with other internally generated data for any otherkitchens or possibly those of other school meals organisations if it is part of a trade asso-ciation. In the UK public sector, where data are readily available on comparative perfor-mance, the Audit Commission in England and Wales makes considerable use of unit costsfor this purpose, generating batteries of comparative statistics which it can use as a startingpoint for analysis.
Second, unit costs can be used as an indicator of efficiency over time as data builds upon performance. This allows us to measure and compare the outputs (and outcomes) of thesame function from year to year. This can show whether efficiency is increasing or decreas-ing over the period being measured. It also hopefully will enable us to judge if the out-comes (including qualitative factors) are also improving. Over time inflation will tend tocreate a problem as it increases the costs of providing a service. In order, therefore, to makecosts (and income) truly comparable, the effects of inflation will need to be considered andremoved from the calculation such that the ‘real’ picture may be understood. This is doneby using price index data which are specific to the cost element, such as pay awards forsalaries and wages and the utility cost index for such services as gas and electricity.
COST ANALYSIS AND DECISION MAKING 33
Coombs-02.qxd 3/18/2005 1:08 PM Page 33

Third, unit costs can be used to set unit cost standards against which actual performancecan be monitored. They thus allow managers to develop an understanding of cost behaviourand facilitate cost control.
Unit cost measures need to be used with considerable care. Some of their limitationsare outlined below:
• Rather than outcomes, they emphasise throughputs. • The quality of performance maybe be ignored in a simplistic analysis.• They may not recognise case mix differences (e.g. open plan offices as opposed to
traditional offices would distort any analysis).• Comparisons need to be made against best practice if efficiency gains are to be
maximised. • Overheads may be charged in different ways between comparators, thus distorting
any comparisons. • Alternative depreciation techniques may affect costs and thus comparisons.
There is a danger that throughputs can be taken as a proxy for outcomes. This assumes(dangerously) that there is a linear and direct relationship between throughputs and out-comes. It also implies the assumption that all outcomes can be proxied by the through-put indicator (e.g. the number of meals in Table 2.1), but this is simplistic and significantextra information is therefore required to inform management decisions.
Throughput provides no indicator concerning the quality of performance; as indicatedabove, the meals may be provided to different standards of quality in each of the fourkitchens, and this may explain all or part of the variations in, say, food costs. If differencesin standard are laid down by the school meals service, then such differences may beacceptable. If they are not, and differences in meal standards are observed, then actionneeds to be taken.
This could be related to the problem of case mix. If we now turn to another example, thecleaning of offices, one cannot usefully compare the costs of three offices where one is amodern office block but not open plan (A), one is modern and open plan (B) and the thirdis old-fashioned and cramped (C). No information is available on best practice, so even ifone office achieves greater efficiencies and cost reductions it may still be operating sub-optimally. Office C will require more time to clean and possibly a higher cleaning staffratio than either A or B. What the cost statement and attendant commentary should do formanagers is to reinforce the need to recognise qualitative factors in any cost analysis.
While overheads are discussed in a subsequent chapter, in the school meals example thecost of the supervisor is an overhead and his/her costs have been allocated equally to thekitchens. This distorts the cost of each kitchen as the allocation could have been done ona variety of other bases, for example, the number of staff supervised, the number of mealsprovided by each kitchen, or even floor area. While these bases for allocation have vary-ing technical merits, the total cost of the supervisor has to be borne by the business and itis only the subjective allocation of cost between the kitchens in this case that could changesince the total cost of the supervisor is fixed at £20,000. Similarly, if cooks, assistantcooks or kitchen maids were reallocated between the three kitchens there would be a
34 MANAGEMENT ACCOUNTING
Coombs-02.qxd 3/18/2005 1:08 PM Page 34

transfer of costs (including staff-related overheads) between kitchens. No savings wouldbe incurred unless some staff were made redundant and this could incur a one-off redun-dancy payment in the year of the redundancy. This could cause the budget to overspendin that year but in the longer term should lead to savings.
Capital costs in Table 2.1 represent depreciation (the wearing out of an asset) andinterest on the assets employed in the service. This concept of effectively an ‘asset rent’was recently introduced in the public sector. Here, to simplify, many government assetshad been acquired through paying cash and as such no cost appeared other than in the yearof account when the assets were acquired. In effect, they became regarded as ‘free’ goodsby managers. In this context public sector assets were revalued and then depreciated(where appropriate). In addition an interest charge was added to reflect the cost of capi-tal for assets employed in the public sector based on this current value. The combineddepreciation and interest charge then forms the asset rent which managers are required tocover in, for example, their pricing policies (for a fuller explanation of asset rents seeCoombs and Jenkins, 2002: 26–7). The interest charge of the asset rent effectively repre-sents the opportunity cost of tying up money in the school meals service. Asset rents arefixed costs to managers. In this example of the school meals service the greater the numberof meals served by each of the four kitchens the lower the unit fixed costs per meal.A similar logic applies to the supervisor, who also is assumed to be a fixed cost.
For a fuller explanation of unit costing in the public sector, see Coombs and Jenkins(2002).
Service CostingAs mentioned in the introduction to this chapter, the UK economy has seen a growth inthe service sector. In this ‘industry’ there is the same need to cost and price activities asin the manufacturing sector. The service sector can include elements of the public sectorand services provided within organisations to other parts of the same organisation at aninternal price, as with service level agreements (see the discussion of Coombs and Evansin the recommended further reading section at the end of this chapter, and Chapter 3). Thelatter might include the provision of IT services within a supermarket, or financial advicefrom the finance department of a government body. The provision of advice raises specialcharacteristics in that each piece of advice is unique unlike, for example, a manufacturedproduct which tends to be uniform. Advice may need to be provided instantly and oncegiven is intangible as it cannot be undone. Advice may expire virtually instantly or havea very limited ‘shelf’ life, unlike a product which may have a long production cycle –although with technological advancement and consumer changes in taste, product lifecycles tend to be shorter today.
In the case of a service industry, such as accounting or the provision of financialservices such as investment advice, it is not realistic to attempt to cost every job or indi-vidual piece of advice. In such cases it is normal to use a cost unit based on time – costper client hour. In this case, the more complex the case, the more time is likely to be
COST ANALYSIS AND DECISION MAKING 35
Coombs-02.qxd 3/18/2005 1:08 PM Page 35

spent with the client. In the public sector costs may be attributed to a number of differentcategories of work. In the NHS the cost per in-patient day may be calculated, while addi-tional information will be provided on the cost of different surgical procedures. Thesecosts are often related to quality measures such as patient waiting time for a specificoperation such as a hip replacement. In a university the cost per student will be availableand information will also be provided on the cost per subject studied. Quality data,for example, on retention rates or examination success will also be available. Inevitably,in both of these cases there may be an element of overlap between the cost data beingprovided, but the financial information is being provided for different purposes anddecisions.
ConclusionsThis chapter has:
• considered the issue of profit and problems of its definition;• developed an understanding of cost definitions and cost behaviour and shown that
it is essential that managers understand these concepts when making decisions;• shown that costs behave differently at various levels of activity, depending on
whether they are fixed or variable;• stated that all costs in the long run are variable;• demonstrated that cost allocation can be subjective and therefore there is no such
thing as a ‘true’ cost;• indicated that all costs are controllable at a certain level within an organisation, but
managers should only be allocated costs over which they have specific control underresponsibility accounting;
• shown that cost data say little about performance or the non-quantitative factors thatare increasingly vital in decision making.
SummaryThis chapter has set out the important definitions of cost and demonstrated how costsbehave in different circumstances. It has also stressed that an understanding of cost andcost behaviour is essential for managers if they are to make the right decisions. Importantin this is that management accounting information is presented in a format that is under-standable to the manager, relevant to the decision being taken, as accurate as is relevantto the decision and timely with respect to the decision horizon.
Cost classification was shown as a fundamental requirement of this process, with costsidentified with a cost objective. The cost objective is a separate measure for which themeasurement of costs is desirable. Classification into period and product costs was
36 MANAGEMENT ACCOUNTING
Coombs-02.qxd 3/18/2005 1:08 PM Page 36

outlined for stock valuation purposes. Costs for decision making were classified intovarious cost behaviour patterns and also whether they were regarded as sunk, marginal,incremental, opportunity or irrelevant costs. Finally, for cost control purposes costs wereidentified as controllable or not controllable and fixed or variable.
It has been stressed that cost alone tells the decision-maker little about the quality ofthe product or service. With unit costs it was shown that the provision of unit cost datacan be seen merely as a measure of the resources devoted to an activity but gives no infor-mation on the quality of such output, and is therefore in itself a measure solely concernedwith throughput.
COST ANALYSIS AND DECISION MAKING 37
EXHIBIT2.1
Cost Classification
David Green is the newly appointed management accountant for a small manufacturingcompany which until now has not been particularly efficient at cost control or classifying itscosts. The business is under severe financial pressure and as part of an efficiency drive isbeginning the process of improving cost classification as an initial stage of improving itsfinancial systems.
As part of his initial review of the business, David has identified the following costs:
• lubricant for machines;• holiday pay of machine operatives;• carriage on purchase of raw materials;• raw materials;• factory security guards;• wages of store keeper in raw materials store;• audit fees;• salaries of administrative staff;• rent of finished goods warehouse;• salaries of sales staff;• factory floor supervisors’ wages;• sales commissions;• licenses with performing rights society for music played in factory;• road fund licenses on delivery vehicles;• wages of forklift truck drivers in materials store;• fees to advertising agency;• direct marketing campaigns;• insurance of company’s premises;• protective clothing for machine operatives;• depreciation of factory plant and equipment;• interest on bank overdraft;• royalties payable on units of production;• trade discounts given to customers;• production operatives’ wages.
Coombs-02.qxd 3/18/2005 1:08 PM Page 37

Table 2.3 shows the subsequent classification for the costs identified. It should be rememberedthat this is based on David’s definitions. As such it is subjective, and there may be otherdefinitions that are equally sound. Whatever categorization is used, it should be technicallysound and produce information relevant to the decision-making needs of the company.
38 MANAGEMENT ACCOUNTING
Table 2.3 Illustration of cost classification
Direct labour Production operative
Direct materials Raw materialsCarriage on purchase of raw materials
Direct expenses Lubricant for machinesProtective clothingDepreciation of factory plant and equipmentRoyalties on units produced
Indirect production overheads Wages of storekeeperPerforming rights licencesHoliday pay of machine operativesForklift drivers’ wagesFactory insuranceSecurity guardsSupervisors’ wagesRent of finished goods warehouse
Selling and distribution costs Advertising feesTrade discountsDirect marketing campaignsRoad fund licencesSalesperson salariesSalesperson commissions
Admin. costs Audit feesAdmin. staff salaries
Finance costs Interest on bank overdraft
Fixed and Variable Costs
Compass Limited is a small building company that tenders for work on a regular basis. Oneelement contained within its tenders is for the provision of transport to carry building materialsand labour to construction sites. Compass owns one lorry and bases this cost in its tenders on theestimated cost per mile of operating the lorry before adding in the cost of the driver. These calcula-tions are done prior to the start of Compass’s financial year. This coincides with the calendar year.
EXHIBIT2.2
Coombs-02.qxd 3/18/2005 1:08 PM Page 38

£Cost of capital consumption 4,000Vehicle licence 400Insurance 500Maintenance 1,750Annual fixed cost 6,650Unit fixed cost per mile (£6,650/25,000 miles) £0.266
For the purpose of this exhibit we are required to calculate the cost per vehicle mile for thefollowing year.
The fixed costs include the purchase price, insurance costs, road fund licence andregular maintenance. The cost of the vehicle was £20,000, and Compass assumes thatvehicle inflation will be 5%, giving a replacement cost of £21,000. With a predicted resalevalue of £5,000, this results in an annual charge for capital consumption of £4,000(£16,000/4). Compass could wish to recover the anticipated cost of a new vehicle ratherthan the historic cost as a means of attempting to ensure that it has sufficient funds toreplace the vehicle at the end of its useful life. Some organisations might also build in acharge for interest based on the capital value of the asset. This is to ensure that the assetgives a return that is at least equal to that which could be earned by investing fundselsewhere. This is particularly relevant in the public sector where recent changes in centralgovernment accounting have extended this concept from the NHS and local government(H.M. Government, 1994).
COST ANALYSIS AND DECISION MAKING 39
It is now December, and Compass wishes to calculate the estimated cost of operating itslorry fleet for the next year. Base data for the purposes of this calculation for the vehicle areas follows:
Cost of purchasing vehicle £20,000Life of vehicle 4 yearsResidual value £5,000Insurance cost £500Road fund licence £400Annual estimated mileage 25,000Set of tyres – replacement after 12,500 miles £600Fuel per 5 litres £3.50Average mileage for 5 litres 20Estimated vehicle inflation over life 5%Maintenance (5 times per year) £350
Coombs-02.qxd 3/18/2005 1:08 PM Page 39

Compass Ltd has data through this exercise that enable it to monitor and control the cost oftransport. The fixed costs will not change as the vehicle undertakes more miles, but the costsincurred will be spread over more miles thus reducing the unit cost per mile. Variable costs, onthe other hand, will change in direct proportion to the changed activity level.
This information is useful to Compass in that when tendering for work if the company hasused the vehicle up to the budgeted figure of 25,000 miles it will have covered the fixed costsof operating the vehicle. In any future tenders, therefore, it need only build in the variable costsof operating the vehicle. Obviously Compass would be well advised to monitor costs andusage of the vehicle in order to maintain up-to-date financial information so that it can takecorrective action should its financial projections prove to be inaccurate. It should also beremembered that there are other ways of calculating the costs of vehicle use. As an alternativeto cost per mile, Compass might choose to use an hourly charge-out rate.
The variable costs are as follows:
40 MANAGEMENT ACCOUNTING
£Tyres replaced after 12,500 miles (2 × 600) 1,200Fuel (25,000/20 × £3.50) 4,375
5,575Variable cost per mile (£5575/25,000) £0.223Cost per mile £0.489
Incremental Costs and Revenue
Coral Limited is a medium-sized company based in South Wales. It has had a number of yearsof relative success but, being conservative by nature, it has tended to serve the local marketonly. This market has shown signs of a decline and the directors are now considering whetherto expand the operation from its South Wales base into the West of England. They are attempt-ing to judge how successful this strategy will be over the next six months.
The following figures are an extract from the company’s existing budgeted profit and lossaccount for the next six months.
£Sales (20,000 units at £20 per unit) 400,000Selling costs:
Marketing 60,000Salaries of sales personnel 20,000
EXHIBIT2.3
Coombs-02.qxd 3/18/2005 1:08 PM Page 40

Commission costs (1% of sales) 4,000Travelling expenses of sales personnel 1,000Sales office costs 10,000Telephones 9,000Stationery 5,000
The company accountant has calculated that marketing expenditure will need to double in orderto achieve penetration of what has historically been a difficult area for the company to achieveeven modest sales. Two new sales staff will be employed at a cost of £20,000 on six-month con-tracts, plus there will be the need to train them at a cost of £2,000. If the operation is judged asuccess the salespersons’ contracts will be extended. A new office will be opened up at a rentalcost of £5,000 for six months. Additional telephone equipment will cost £1,000 and existingtelephone costs are projected to rise by 50%. Stationery costs will increase by £2,000. Travellingcosts will rise by £1,500. An additional office assistant will be required in the finance departmentto process orders and monitor commissions at a salary of £8,000 for six months. Estimated saleswill rise by 1000 units per month for the first two months and revenue per unit will fall to £18per unit in order to achieve initial market penetration. It is anticipated that this discount will onlybe necessary for two months and that sales from month 3 will rise to 2000 units per month. Thevariable cost of producing each extra unit is projected to remain at the current cost of £6.
The decision requires an incremental analysis of the impact on Coral to give the estimatedfinancial position first. It should always be remembered that these are financial projectionsonly and other issues will be relevant to any proposed new strategy. These issues are touchedupon after the calculations have been demonstrated.
COST ANALYSIS AND DECISION MAKING 41
Table 2.4 Incremental analysis of proposed expansion
Existing Projected Incremental budget for next budget for next costs and
six months six months revenues
£ £ £ £ £ £
Sales 400,000 596,000 196,000Marketing 60,000 120,000 60,000Sales salaries 20,000 60,000 40,000Commission 4,000 5,960 1,960Travelling 1,000 2,500 1,500Sales office 10,000 15,000 5,000Telephones 9,000 14,500 5,500Stationery 5,000 7,000 2,000Admin. asst. 0 8,000 8,000Training 0 2,000 2,000Variable 120,000 229,000 180,000 414,960 60,000 185,960production costs
Coombs-02.qxd 3/18/2005 1:08 PM Page 41

It will be seen from Table 2.4 that the effect of the expansion is to increase incrementalrevenue by £185,960 and, as such, on a financial basis the expansion is justified.
It should be remembered that the projections are simply estimates and may prove incor-rect. Coral would have to consider the impact of reducing the selling price of its product onexisting markets and indeed whether in its new market it will be able to raise prices as easilyas is suggested. We already know from the above that Coral has struggled in this new marketbefore and as such there is a doubt over the potential market. We are also aware that therehas been a slowdown in the ‘home’ market that may indicate that there is a more fundamen-tal problem with the product. There is, however, a large margin for error within the resultsobtained. It can also be seen in this exhibit that both fixed costs and variable costs have beensubject to incremental changes.
Recommended Further ReadingCoombs, H.M. and Evans, A. (2001) ‘Managing central support costs in localauthorities’, Journal of Finance and Management in Public Services, 2(1): 9–20.How to treat central overheads in local government is not a new issue. Since 1979, withthe greater competitive pressure local authority services have been under, it has becomevital that overheads be allocated on a basis which is transparent, flexible and real. Coombsand Evans first look at the definitions of central overheads in local government, dividingthem into corporate costs such as council meetings which are regarded as the cost ofdemocracy and not allocated, specialist costs such as back funding pensions which areagain not allocated, and the essential central support functions essential to run the ‘busi-ness’ which are fully allocated to services. Under a traditional approach these costs wouldhave broadly been allocated to services primarily on a timesheet basis. Administrativebuilding costs would be allocated on a floor area basis.
As an alternative to these arrangements the paper looks at service level agreements(SLAs) which are seen as written internal ‘informal contracts’ specifying the responsibil-ities of and the relationships between a client or service department and the supportservice provider. The written agreement:
• identified the providers and users of the service;• clarified the responsibilities between both parties over quality and costs of services
delivered;• enabled users and providers to monitor what was happening;• clearly identified the costs and charging mechanisms.
In terms of the practice of SLAs the research discovered that typical charging mecha-nisms included:
• payroll/salary systems – per employee, per transaction, cost per payslip processed;• internal audit – rate per hour, rate per person day, fixed charge plus time element;• revenue accounting – rate per hour, charge per person day;• cash management – per transaction, per posting;
42 MANAGEMENT ACCOUNTING
Coombs-02.qxd 3/18/2005 1:08 PM Page 42

• creditor payments – per payment, per invoice raised;• insurance – on-cost to premiums, rate per hour.
Drawbacks of SLAs were seen as the bureaucracy associated with the agreements andprocrastination by the overhead service providers. This was seen as a deliberate attemptby the providers to sabotage the initiative as it was not in their interests to pursue thispolicy. Other issues related to the question of under- and over-recovery of the costs ofproviding the central support. In addition, many managers in service departments felt theydid not have the experience to negotiate with, for example, the finance department whichto them held all the ‘aces’ in any negotiation.
In the conclusions the traditional system of apportionment of overheads to servicedepartments without attention to the costs and quality of those services given by centralsupport departments was seen as increasingly at odds with the pressure on resources facedby local government (and, indeed, all public sector services). There was also a discoveryof variations in the type of overhead apportionment systems used in the survey, althoughthe basic system was staff time based. Resources realised by the proper management ofcentral services overhead costs can potentially result in these resources being redirectedinto frontline service delivery. Service level agreements were seen as having the potentialto improve service delivery by support departments to service departments and improvethe quality of delivery of overhead services. They lead to emphasis on the customer giventhe central component of quality at a cost the service department is willing to pay. Thesurvey used revealed that of the 31 authorities who responded 29 had either introduced,were developing or considering introducing SLAs. While two authorities had rejected theprinciple of SLAs on the basis of the potential additional bureaucratic burden, they hadrecognised that their current systems of charging for central support services were in needof review. Discussions with employees of the local authorities showed that on balancethere was support for the idea of SLAs and that in some cases poor-quality service andprice had meant that potential clients to the local authority had been lost in the area ofeducation. It was pointed out, however, that the stimulus for these developments wasstatutory regulation and not the result of internal pressures. Interviewees felt that in somecases the delay in introducing SLAs was the result of central departments procrastinating.
The paper also pointed out that as well as the existence of actual SLAs it is the spiritin which those agreements are operated that is equally important if any such system is tooperate effectively. Thus whether SLAs are a solution to a problem, a bureaucratic night-mare or fall somewhere in between in terms of their ability to meet the needs of localgovernment service managers, only time will tell. They are clearly not suited for manysmall support services as the costs of setting up and maintaining such agreements wouldoutweigh any benefits, although there may be benefits in establishing a small-scale mem-orandum of understanding between providers and users setting out quality standards forservice delivery. However, if implemented and managed correctly, they do appear to haveconsiderable potential to improve the quality of services delivered by larger-scale centralsupport departments at a price and quality that service managers are prepared to pay. Thiscan only benefit the community the local authority is supposed to serve as extra resourcesare released, or protected, for frontline service delivery.
COST ANALYSIS AND DECISION MAKING 43
Coombs-02.qxd 3/18/2005 1:08 PM Page 43

Ezzamel M., Morris J., and Smith J.A. (2004) Accounting for NewOrganisational Forms. Research Update, 8–9 September, CIMA.At the time of writing this is an ongoing project which aims to identify the ways in whichmanagement accounting is informed by developments of new organisational forms whichare emerging because of increased business competition and developments in IT. The pro-ject methodology was to use face-to-face interviews to build a limited number of casestudies across a range of organisations and postal questionnaires to widen the sample base.Provisional results (pending publication of the final research study) indicate that changewas evolutionary and incremental rather than revolutionary or transformational. Importantfactors as change agents were new management teams and general market conditions.There was also a desire to reduce the staff base and fixed costs. In the public sector newcost centres were found to have been created and there had been the development of non-financial measures. An increase in outsourcing was also noted. In terms of the supply chainthis had evidenced itself by contracting out non-core services such as cleaning, IT andrecruitment and training. Overhead costs were thus reduced as opposed to the creation ofservice level agreements. The role of management accounting was discovered to havechanged from broadly recording to one of financial analysis and the provision of advice.
Case Study: SHB
SHB is a retailing company which has numerous retail outlets distributed throughout theUnited Kingdom selling a wide range of goods to the public. These goods include furni-ture and food, although primarily it sells clothes. It has also diversified its functions toinclude financial services such as credit cards and loans and insurance. Stores vary in size,with a number of medium-sized central town developments and 20 superstores nation-wide. It has also, as part of its expansion programme, opened a number of new outlets inEurope. In the UK it has recently begun to develop smaller stores on out-of-town ‘dis-count’ shopping parks which it uses to sell last season’s fashions and designs at reducedprices. This strategy has so far proved very successful as demand for product is high, rentsrelatively cheap in comparison with many of its traditional stores located in town centresand staffing costs low. It is also currently looking at establishing more of these outlets butselling food.
The stores operate with a managerial framework which gives considerable localautonomy to managers, allowing them to make local decisions appropriate to localneeds. It retains a number of head office functions for such activities as purchasing,accountancy and audit, legal services and human resources management. Store man-agers deal with the recruitment and dismissal of store staff but consult with central headoffice on corporate human resource policies and complex issues such as trade unionmatters. The head office is responsible for corporate decision making. Store managers areexpected to have worked in head office and at store level before they can manage asuperstore.
44 MANAGEMENT ACCOUNTING
Coombs-02.qxd 3/18/2005 1:08 PM Page 44

Agreed establishment Actual numbers in post(January 2002) (December 2004)
Accountancy and audit 45 48IT 120 118Legal 25 31Human Resources 47 55Corporate Strategy 198 200Corporate governance 60 80
Head office expenditure in the previous two financial years was £23,400,000 and£22,000,000, respectively. The major overspend on the legal budget in 2004 is concernedwith a legal case against the Inland Revenue over the interpretation of tax legislationunder European Union law.
The staffing compliment for each section was last formally agreed in January 2002.These numbers are as follows:
The corporate head office is sited in Birmingham as it represents the best locationgiven the distribution of the company’s stores. There are, in additon, a number of satel-lite offices which provide local contacts with the stores on a number of central supportissues, but excluding corporate strategy, IT and legal advice. The continental operationis managed directly from Birmingham in terms of central office functions althoughstore managers on the Continent have the same roles and responsibilities as thosein the United Kingdom. The head office deals with all financial services and relatedproducts.
The cost of the head office and regional support offices in the last year (2004) was asfollows:
Revised ActualBudget budget expense
Category of cost for year June 2004 for year£ £ £
Accountancy and audit 2,850,000 2,555,000 2,750,000IT 5,575,000 5,850,000 5,650,000Legal 4,500,000 5,750,000 6,950,000Human resources 1,850,000 1,950,000 1,975,000Corporate strategy 1,110,000 1,111,000 1,116,000Corporate governance 9,255,000 8,260,000 8,760,000
COST ANALYSIS AND DECISION MAKING 45
Coombs-02.qxd 3/18/2005 1:08 PM Page 45

The majority of the staff over the agreed establishment are on fixed term contractsexpiring in September 2005. Head office management staff at team level can employthese staff without formally increasing the establishment and with limited need forhigher authorisation.
The central office is supposed to be driven by the needs of the stores, but costs haveto be recharged. At the moment these are done simply on a staff time analysis basedon ‘actual’ time spent on each location by each function when the accounts are beingclosed in readiness for publication. ‘Actual’ time is recalculated every three years whena staff timesheet for a section is completed by the manager of a section. These sectionreturns are ultimately aggregated by function (e.g. Human Resources). This detailedinformation is not disclosed to the shareholders but is used by managers after the yearend to monitor store performance. No information is provided during the course of theyear, although head office costs are supposed to be controlled within the annualbudget. Some stores have started to employ their own specialists such as in accoun-tancy and audit under their discretionary budget powers. Store managers have alsoexpressed some concern over the company’s central buying policy as the quality ofclothing has deteriorated and styles are seen as old-fashioned. Store managers areheld responsible for any unsold stock and not central buying. Central buying is doneby the Corporate Strategy division at head office. Finally, the costs of financial servicesand related operations are separately identified together with the income on thoseproducts and allocated to the regional superstore nearest to the client’s home addressto give a geographical picture of where business is generated. Marketing campaigns,for example, are then directed based on such information.
1. Critically assess the above system of allocating head office costs to stores from botha head office and store manager’s point of view. Discuss the advantages and disad-vantages of the system from both points of view.
2. Discuss any possible alternatives available, including their advantages and disadvan-tages, from both the head office and store manager’s perspective.
3. What are the main features of any alternatives and how would you go about imple-menting them? Cover both qualitative and quantitative issues.
4. Prepare a report for management incorporating your critical analysis with recommenda-tions on a way forward.
Questions1. The Tuba Company commenced business on 1 April 2004 and during its first
production period produced 200,000 identical units of a product termed ‘the valve’.The company sold 175,000 units of ‘the valve’ during this period. As this was thecompany’s first period of operation there was no opening stock at the start. The25,000 units unsold are closing stock.
46 MANAGEMENT ACCOUNTING
Coombs-02.qxd 3/18/2005 1:08 PM Page 46

The costs for this period were as follows:
Manufacturing costs £
Direct labour 800,000Direct materials 400,000Manufacturing overheads 150,000
Non-manufacturing costs amounted to £175,000.
(i) Prepare the profit and loss account for the period.(ii) Explain what you understand by ‘period costs’ and discuss your treatment of
them in the calculations you have carried out. Explain fully why you havetreated them as you have.
(iii) The company believes that in period 2 it will only sell 50 per cent of theitems left in stock at the end of period 1. What implications do you think thishas for the Tuba Company.
2. Euphonium Ltd. has an opportunity to obtain a new contract for the production ofa new valve. The valve requires 200 hours of processing on machine A, which isalready working at full capacity on the production of another product. There is thusno way in which production of the valve can be accommodated unless productionof the other product is reduced. The lost contribution from the displaced productamounts to £500. In addition, the variable costs of the new valve amount to £1500.
(i) What price is the minimum that should be accepted?(ii) What implications are there for the company, in both the short term and the
long term, of accepting this special order?
3. Where would you allocate the following costs (e.g. selling and distribution, pro-duction, etc.) and who would you hold responsible for incurring these costs forcontrol purposes? Would you regard them as fixed, variable, semi-variable orstepped fixed costs? Are they direct or indirect costs?
Raw materials used in the manufacture of a company’s main productSecurity services for the warehousePerforming rights payments for music piped to the factory floorDirect labour paymentsOil used to lubricate productive machineryCosts of a sales promotion campaignDepreciation of factory machineryContract price for raw materialsOvertime payments on the factory floorSupervision costs on the factory floorForklift truck driver
COST ANALYSIS AND DECISION MAKING 47
Coombs-02.qxd 3/18/2005 1:08 PM Page 47

Rent where at production above 5000 units additional workspace is required to becontractedAudit feeFood costs in the works canteenPhotocopy rental in sales office with additional costs incurred by useFire insurance costs for factoryPower used in the factorySupervision of production operativesRoyalty paymentsFactory rentalIndirect materialsQuality audit engineerAccountancy office staffResearch and developmentMembership fee to the CBICompany’s pension contributions for factory workersCompany’s pension contributions for office staffDelivery vehicle expensesWages to factory temporary production operativesTelevision marketing campaignMaintenance mechanic’s wagesForeman wagesOffice stationeryManaging director’s salaryCost of board meetings, including non-executive salariesPayments to focus groups for comments on new productsPayments for trade magazinesAnnual awards dinner for factory employeesHead of marketing’s salaryStoreman’s wagesPetrol costs for salesmen
4. David is thinking of setting up a new van hire business. He has no experience of thisbusiness and is not financially qualified, but has had a go at estimating the costs hewill incur. Initially he will start with one van and has come to you for financial andbusiness advice as his financial adviser with the figures he has managed to obtain.
David’s figures are set out below:
£
Purchase cost of van 15,000 Service maintenance cost (twice per year) 500 per service
48 MANAGEMENT ACCOUNTING
Coombs-02.qxd 3/18/2005 1:08 PM Page 48

Spares/replacement parts per 2000 miles 100Insurance per year 1,500Vehicle licence 250 Tyres (after 30,000 miles), four at £75 each 300Trade in value (after 3 years or 120,000 miles) 1,000Diesel per gallon 2.80Average mileage per gallon of diesel is 25 milesEstimated annual mileage 40,000MOT cost after 3 years 30Maintenance and service costs after 3 years 4,500 per annum
The average mileage per gallon of diesel is 25 miles and the estimated annual mileage is40,000.
(i) Prepare a schedule for David of the costs of operating the van over annualmileages of 20,000, 30,000, 40,000 and 50,000 miles. This schedule shouldclearly identify: total fixed costs; total variable costs; total costs; fixed costsper mile; variable costs per mile; total costs per mile. Critically assess yourresults and prepare a report for David in which you clearly explain whatyou have done and any assumptions you have made in your calculations. Yourreport should clearly advise David an the factors he should consider in hisdecision as to whether or not to set up this business.
(ii) You have completed task (i). David has just rushed in to your office to adviseyou he has discovered he can lease the van over the three years at a cost of£150 per week. This cost covers all service and maintenance charges andincludes tyres. David would, however, be responsible for any damage causedby neglect of the vehicle. As a safety measure he thinks he should set aside£500 per year for this factor. What are the implications of this alternative forDavid and his business idea?
(iii) ‘The unit costs of operating a business fall as output increases’. Assess thisstatement critically.
5. There are numerous classifications of cost available. These might include, forexample, classification by type, by decision relevance, and by controllability. Theobjective of management accounting is to assist managers and decision makers inan organisation. Discuss the relationship between cost classification and the needsof managers and decision makers in a critical context.
6. You are working for an NHS Trust. The Trust manages three hospitals. Two ofthese, Triumph and BSA, are district general hospitals, while the third, Norton, isa small cottage-style hospital. The cleaning service contract for these hospitals ismanaged in-house by the Trust’s own cleaning services. The target for the clean-ing contract is the breakeven of revenue and expenditure. The contract was let twoyears ago and is due for renewal on 1 April 2005 so has one year to run.
COST ANALYSIS AND DECISION MAKING 49
Coombs-02.qxd 3/18/2005 1:08 PM Page 49

At the request of your section head you are monitoring the performance of thecontract for the financial year ending the 31 March 2004 and have obtained the followinginformation.
(1) Financial data: payments 2003/04
Triumph BSA Norton£ £ £
Cleaning staff – pay 66,320 79,500 39,000Employment taxes 2,750 3,650 1,600Pension costs 3,750 7,240 1,250Travelling expenses 880 720 180
Cleaning materials 42,250 56,530 36,390Window cleaning contract (external) 6,160 5,680 9,000Other contract services 800 1,210 1,980Miscellaneous 1,350 850 1,680Equipment purchased (revenue) 760 820 930
(2) Statistical data
Floor area (square metres) 110,000 125,000 27,250Average number of available staffed beds 590 720 130
(3) Additional Information
(a) Sundry creditors were:
31 March 2003 31 March 2004£ £
TriumphEquipment 180 120Cleaning materials 1,230 1,960
BSAWindow cleaning 2,520 1,100
NortonCleaning materials 2,440 3,690
(b) Cleaning materials issued from the central stores have not been included inpart (1) payments as they were issued in the last week of March 2004 and theFinance Department has only just been informed. These stock issues were:Triumph, £1,260; BSA, £1,140; Norton, £2,460.
(c) Stocks of cleaning materials in hand at each hospital at the year end were:
50 MANAGEMENT ACCOUNTING
Coombs-02.qxd 3/18/2005 1:08 PM Page 50

31 March 2003 31 March 2004£ £
Triumph 3,150 4,550BSA 2,540 1,980Norton 1,000 1,110
(d) The central stores cost for managing cleaning materials is to be apportioned tothe three hospitals and has been calculated for 2003/04 at £66,000. There is noagreed basis of allocation of this cost to the three hospitals.
(e) During 2003/2004 BSA hospital required that a cleaning equipment mainte-nance contract be negotiated for £600 per annum payable annually in advanceon 1 February in each year. This payment is included in (1) under other con-tract services. The contract is renewable annually now it has been signed.
(f) Outstanding bonuses in respect of BSA and Norton at the 31 March 2004 are1.5% of wages paid in the year. This has no effect on other wage related costs.
(g) The cost of management supervision by the cleaning supervisor is £18,000including overheads.
(h) Staff time for finance services provided by the Finance Department has yet tobe charged to the cleaning contract and is to be allocated to each hospital onthe basis of floor area. The costs calculated by the finance department are£20,000 for these services. This is in part based on the work that this year wentinto preparing a bid for the renewal (£10,000) of the contract on 1 April 2005.There will be significantly more work in the next financial year to prepare forthe retendering exercise.
(i) Cleaning the hospitals requires no capital equipment. (j) The value of the cleaning contract is £530,000. It is not broken down by indi-
vidual hospital.
As a management accountant working for the Trust you have been requested to preparea report on the cleaning service.
(i) Include a statement showing the cleaning costs for each hospital in comparisonwith the tendered price.
(ii) Discuss the relative cleaning costs for each hospital and outline the possible reasonsfor variations between them.
(iii) Comment on any qualitative factors you believe are relevant.(iv) Make appropriate recommendations based on your analysis in the context of
2003/04 and the retendering exercise due in 2005/06.
COST ANALYSIS AND DECISION MAKING 51
Coombs-02.qxd 3/18/2005 1:08 PM Page 51

Chapter 3COSTING PRODUCTS AND SERVICES
By the time you have finished studying this chapter, you should be able to:• implement the allocation and apportionment of overhead costs by traditional means;• determine overhead absorption rates;• make use of such rates in determining the costs of products and services and the value
of closing inventory;• critically evaluate such costs;• evaluate the contribution of activity-based costing to the costing of products and
services;• utilise the marginal cost approach to the costing of products, services and inventory.
IntroductionInitially in this chapter we will concern ourselves with total absorption costing (TAC).This is a system for determining the full cost of products and services. The full cost of aproduct is made up of direct costs and a share of indirect costs (or overheads). In order toachieve full cost, a number of stages have to be undertaken, as follows:
1. All costs are subdivided into direct costs and indirect costs. Direct costs (primarilydirect materials and direct labour) are traced directly to individual products.
2. Factory indirect costs are apportioned to cost centres.3. The totals of the costs of service department cost centres are reapportioned to
productive cost centres.4. Budgeted overhead absorption rates are calculated for each of the production cost
centres.5. The budgeted absorption rates are applied to products and services in order to
assist in calculating the full cost of the products or services.
Key Learning Objectives
Coombs-03.qxd 3/18/2005 1:08 PM Page 52

Allocation and Apportionment ofOverheads to Cost Centres
All costs can be subdivided into direct and indirect costs. Direct costs can be traced toeach unit of output, and include items such as direct materials, direct labour and directexpenses. Indirect costs represent all other costs. They are also known as overhead costs.They may relate to production or they may be of a more general nature. Examples areshown in Table 3.1.
We will be concerned only with direct costs and production overheads in calculatingthe full cost of products and services as these costs specifically relate to production. Theother overheads are not charged to each product but are, instead, charged to the profit andloss account for the year.
Production costs are allocated and apportioned to production cost centres. Examples ofproduction cost centres are the machining department, assembly department, finishingdepartment, production administration, and maintenance. Allocation of costs occurs whenthere is a clear link between a specific overhead and a specific department. Apportionmentoccurs when a clear link is absent and each department is charged with a fair share of over-head. For example, if the assembly department leases a specific machine, then the costs ofthe lease can be allocated directly to the assembly department. Contrast this with the costsof heating the factory; the costs of heating the assembly department cannot be separatelyidentified. In this situation, the heating costs are apportioned to departments and theassembly department will be charged with a share of the total heating cost. Examples ofapportionment bases are provided in Table 3.2.
We can now consider the application of such thinking to cost information. Table 3.3gives information relating to a factory that manufactures desks. The factory contains fourcost centres. The desks are physically worked upon in two of these cost centres, theassembly department and the finishing department. These are termed ‘production costcentres’. The other two cost centres provide services for these two production costcentres. These are the maintenance department and the factory administration department.These are termed ‘service cost centres’. As the service cost centres provide benefits to the
COSTING PRODUCTS AND SERVICES 53
Production overheads Other overheads
Foremen’s salaries Marketing costs
Factory manager’s salary Head office salaries
Depreciation of factory equipment Bad debts
Cost of heating for factory Finance costs
Factory rent Head office rent
Table 3.1 Examples of production and other overheads
Coombs-03.qxd 3/18/2005 1:08 PM Page 53

Production overhead Possible basis for apportionment
Foreman’s pay The number of employees in each cost centre, because theforeman’s workload is likely to be influencedby the number of employees in each cost centre.Alternatively, a foreman may be required to make an esti-mate of the amount of time taken up by each of the costcentres.
Depreciation of equipment This could be based upon the cost, or written-down value,of each item of equipment in the different cost centres.The reason for doing this is that depreciation is generallyrelated to the cost of assets. Other things being equal, themore costly the asset, the greater the depreciation charge.
Factory heating This apportionment may be based upon the floor area orvolume of each cost centre as these factors are likely todetermine the amount of heating required by each costcentre.
Factory rent This is usually apportioned on the basis of the floorarea of each cost centre.
Factory power This could be apportioned on the basis of the number ofmachines in each cost centre, but a more sophisticatedapproach would be to take account of the powerrequirements of each machine and allow for this inapportionment.
Indirect wages The apportionment could be related to the number ofdirect labour hours in each cost centre, or the number ofindirect employees in each cost centre. If there are anypart-time indirect employees, it will be necessary to takeaccount of full-time equivalent employees.
production cost centres, the latter will in turn be required to bear the costs of the servicecost centres.
The table shows the costs incurred by the factory and provides financial and statisticalinformation relating to the cost centres that will allow us to allocate and apportion the pro-duction overheads to the four cost centres. As may be seen in Table 3.3, the total costs ofthe service cost centres are to be reapportioned equally to each of the two productiondepartments.
We have now established the indirect costs and also the bases that should be usedto allocate and apportion them to the four cost centres. This is carried out by means ofan overhead analysis sheet. A completed overhead analysis sheet for 2005 is shown in
54 MANAGEMENT ACCOUNTING
Table 3.2 Examples of overhead bases
Coombs-03.qxd 3/18/2005 1:08 PM Page 54

Table 3.4. It may be seen that the indirect costs of £216,500 have been apportioned to thefour cost centres, with the total of each cost centre’s overheads shown at the foot of eachcolumn. At this stage one should check that the totals add up to the total of costs in thesecond column. A secondary apportionment is then carried out with the costs of the twoservice cost centres reapportioned to the production cost centres.
We have now completed stage 3 and apportioned the budgeted factory overheads to thetwo production cost centres, assembly and finishing. In this case, the service departmentscarry out work solely for the production departments, assembly and finishing, so the costsof the service departments are reapportioned directly. There will be cases when servicedepartments carry out work for each other, and this increases the complexity of analysis.
At the next stage, stage 4, budgeted overhead absorption rates are calculated for eachof the production cost centres. In this company, as Table 3.5 shows, the main factor of pro-duction in assembly is machinery, whilst the main factor in finishing is direct labour.Accordingly, machine hours will be used to absorb overheads in assembly and directlabour hours (DLH) in finishing. Each absorption basis is chosen because of the relative
COSTING PRODUCTS AND SERVICES 55
Indirect Costs Apportionment Production Servicecosts £ basis departments departments Totals
Assembly Finishing Maintce. Admin.
Factory manager 35,000 No. of 15 10 5 5 35employees
Foremen 70,000 No. of 15 10 5 5 35employees
Indirect wages 56,000 Allocation £37,500 £16,250 £8,000 £8,000 £56,000
Depreciation 25,000 Book values of £200,000 £30,000 £20,000 £250,000plant andmachinery
Heating 15,000 Floor area 50 50 20 30 150(sq. metres)
Power 8,000 Number of 6 1 1 8machines
Factory rent 7,500 Floor area 50 50 20 30 150(sq. metres)
Service Equally todepartments each production
dept.
Total 216,500
Table 3.3 Apportionment data
Coombs-03.qxd 3/18/2005 1:08 PM Page 55

importance of machine hours or labour hours in each cost centre. The budgeted annualactivities given in Table 3.5 will now form the basis of overhead absorption rates in eachcost centre, as shown in Table 3.6.
At stage 5, the overhead costs of the departments will be incorporated into productsusing these budgeted absorption rates. As we saw at the start of this chapter, a product’scosts are made up of direct costs and indirect costs. Information about two products isshown in Table 3.7. Using this information, we can calculate the full cost of each productby adding to the direct cost a share of factory overhead by utilising the budgeted absorp-tion rates and the information regarding hours for each product. This is summarised inTable 3.8.
56 MANAGEMENT ACCOUNTING
Apportionment ProductionCost £ bases cost centres Service cost centres
Assembly Finishing Maintenance Admin.
Factory manager 35,000 Factory 15,000 10,000 5,000 5,000employees
Foremen 70,000 Factory 30,000 20,000 10,000 10,000employees
Indirect wages 56,000 Allocation 23,750 16,250 8,000 8,000
Depreciation 25,000 Book value 20,000 3,000 2,000
Heat 15,000 Floor area 5,000 5,000 2,000 3,000
Power 8,000 Machines 6,000 1,000 1,000
Rent 7,500 Floor area 2,500 2,500 1,000 1,500
Sub-totals 216,500 102,250 57,750 29,000 27,500
Reapportionment of maintenance Equally 14,500 14,500 −29,000
Reapportionment of admin. Equally 13,750 13,750 −27,500
Totals 216,500 130,500 86,000
Table 3.4 Budgeted overhead analysis for 2005
Assembly Finishing
2,500 DLH 6,500 DLH
6,000 machine hours 200 machine hours
Table 3.5 Budgeted annual activity
Coombs-03.qxd 3/18/2005 1:08 PM Page 56

The Over- and Under-Absorption of Overheads
We saw above that the calculation of budgeted overhead absorption rates for both theassembly and finishing departments was a key step in the calculation of ‘full cost’. As wesaw, this is calculated as:
COSTING PRODUCTS AND SERVICES 57
Table 3.6 Overhead absorption rates
Machining Assembly
Budgeted overheads £ 130,500 86,000
Budgeted activity (hours) 6,000 6,500
Budgeted absorption rate £130,500/6,000 £86,000/6,500
per hour = £21.75 per machine hour = £13.23 per DLH
Table 3.7 Direct costs and production times
Product A Product B
Direct costs £23.50 £14.75
Machine hours (Machining) 4 4
DLH (Assembly) 6 3
Table 3.8 The full cost of products A and B
Product A Product B£ £
Direct costs 23.50 14.75
Overheads
Machining
4 hours at £21.75 per hour 87.00 87.00
Assembly
6 DLH at £13.23 79.38
3 DLH at £13.23 39.69
Totals £189.88 £141.44
Coombs-03.qxd 3/18/2005 1:08 PM Page 57

Budgeted overhead department costs
Budgeted departmental activity (machine hours or DLH)
Absorption rates are normally calculated before the start of the accounting year. As youcan see, this requires an estimate of costs and an estimate of activity and it aims to absorball costs by applying the budgeted absorption rate to production during the year. However,this will only occur if actual figures are the same as budgeted figures. However, suchequivalence between budget and actual is not guaranteed. It is more than likely that actualcosts will differ from budgeted costs and/or actual activity will differ from budgeted activ-ity. Using the machining department for illustration, the effect of differences betweenbudget and actual is illustrated below.
As we have seen, the budgeted absorption rate in the machine department for 2005 is£21.75 per machine hour. During January 2005 for the machine department we have:
Actual machine hours: 480 hoursActual overhead costs: £10,875
We can now consider the effect of this on the absorption of overheads in January (seeTable 3.9).
The under-absorption (also termed under-recovery) can either be carried forward to thenext month, or written off to a monthly profit and loss account. During the year, somemonths will experience under-absorption and others over-absorption so that, hopefully,they will cancel out by the year end. If, at the end of the year, the cumulative figure is aunder-absorption then this means that the company’s profit will be reduced as theseunder-absorbed overheads that cannot be charged to products will be charged as anexpense to the profit and loss account of the business. The opposite applies if there is anover-absorption, which will offset costs in the profit and loss account.
Reasons for the Apportionment and Absorption of Overheads
Stock Valuation
The TAC technique ensures that all production, including work in progress, incurs a shareof production overhead. For work in progress, the amount of overhead will reflect the
58 MANAGEMENT ACCOUNTING
Table 3.9 Overhead absorption in January
£
Overhead absorbed into production 480 hours × £21.75 per hour 10,440
Actual overhead cost 10,875
Under-absorption of overhead 475
Coombs-03.qxd 3/18/2005 1:08 PM Page 58

degree of completion of the products. Closing stock is valued at full cost, including directcosts and a share of production overhead. One consequence is that a share of the overheadcosts of one accounting period is transferred via closing stock into the following account-ing period. This technique is accepted by taxation authorities and is accepted in financialreporting as an acceptable methodology for the valuation of closing stock and work inprogress.
Product Costing
The process identifies the full cost of a product and this itself permits the calculation ofproduct profitability by comparing selling price with this full cost, ignoring the non-manufacturing costs of the company. The product cost can also act as a floor when set-ting the price of the product.
Cost Control
Cost apportionment and reapportionment are initially carried out at the budgeting stage.They thus make production and service cost centre managers aware of the budgeted costsat an early stage. Indeed, the process of budgeting overheads forces managers to reviewthese costs before they are integrated into the budget for the company. Thus it shouldassist managers in controlling their own budgets.
Justification for Reimbursement of Costs
Some government grant-funded activities relate the ceiling of grant to the full cost of theactivity being funded. The process for calculating the full cost needs to be verifiable andcapable of exposure to audit inspection. To its credit, the apportionment/absorption systemlays a clear audit trail from the collection of costs through to the absorption of costs intoproducts. It is an accepted and well-understood process.
Production Overheads are Product-Related
It is argued that products cannot be manufactured unless overheads are incurred. Indeed,the underlying assumption is that production overheads are regarded as product costs justas direct costs are. Indeed, the only reason to incur overheads is in order to manufactureproducts that mat be sold and earn a profit.
Criticisms of Apportionment and Absorption
We identify the following four criticisms:
1. The accuracy of product costs calculated under absorption costing is highly sus-pect. This is a consequence of the rather arbitrary apportionment of costs to costcentres. Changing the apportionment basis of any one overhead cost would change
COSTING PRODUCTS AND SERVICES 59
Coombs-03.qxd 3/18/2005 1:08 PM Page 59

a department’s total costs and, therefore, its budgeted absorption rate and, ofcourse, the full cost of products. It follows that the practice of using the productcost as a basis for constructing a product price is flawed because the product costitself results from a more or less arbitrary cost apportionment process.
2. In the illustration above, we have used different methods for absorbing overheadsin assembly and manufacturing, respectively. This is more accurate than, say, usingone overall rate; for example, apportioning total production overheads on the basisof direct labour hours so that:
The revised rate per DLH of £24.05 represents a significant increase over theassembly department rate of £13.23 per DLH. A study by Drury and Tayles (2000)found that a very small percentage of firms in the UK used a single plant-wide ratefor absorbing overheads.
3. The system uses broad averages to spread costs over products. The arbitrariness inthe process can lead to product undercosting or product overcosting. In undercost-ing a product consumes a relatively high level of resources but is reported to havea relatively low total cost. Overcosting implies that a product’s consumption ofresources is far lower than its reported cost. Next in this chapter we discuss activity-based costing, which may offer a way of refining the costing system.
4. In the short run many of the factory overheads will be fixed, and marginal costingoffers a way of dealing with short-run decisions involving costs; this is consideredlater in this chapter.
Activity-Based CostingThe system of absorption costing has evolved from the cost accounting thinking andsystems that were established in Victorian times. The conceptual basis and the systemsallied to this were established in an industrial environment in which the following fea-tures were endemic: direct labour costs and direct material costs were the dominantfactory costs; overheads were relatively small; information processing costs were high;there was an absence of intense global competition; there were low levels of automa-tion and a relatively limited product range. The cost accumulation system, which wasdeveloped in order to assemble product costs in the nineteenth-century environment,was total absorption costing. As we have seen, it attaches traceable direct costs (labourand materials) directly to products and then apportions factory overheads to products ina systematic but rather arbitrary fashion, with the proportion of overheads usually fol-lowing the volume of direct labour activity in a product. The underlying philosophy isthat products cannot be produced without incurring overheads so they must bear theirshare of overheads; most overheads are time-related (e.g. factory rent and foremen’s
Overhead costs=
£216,500= £24.05 per DLH
Direct labour hours 9,000
60 MANAGEMENT ACCOUNTING
Coombs-03.qxd 3/18/2005 1:08 PM Page 60

salaries) so the apportionment is usually linked to the time taken by labour to produceoutput.
However, during the late twentieth century absorption costing was increasingly criticisedby academics, for example Zimmerman (1979). During the last 20 years, the followingcriticisms have been made:
• There has been a systematic distortion of product costs caused by the perpetua-tion of convenient but inappropriate volume-based methods of production overheadapportionment.
• There has been a lack of visibility and transparency given to increasingly importantareas of overhead consumption.
• Non-factory overheads have been neglected even though these compromise signifi-cant elements of overhead expense.
• Decision making requires variable cost information, which traditional cost systemshave been unable to provide.
In 1987, Johnson and Kaplan published a seminal work, Relevance Lost: The Rise andFall of Management Accounting. They indicate two major environmental changes whichtraditional management accounting thinking had failed to address. The first of these wasthe phenomenal growth in the value of production overheads caused by factors such asinvestment in automation and research and development. As the overheads had grown insignificance, the direct labour costs had dwindled and were commonly only a small pro-portion of overhead costs. It was now more evident than ever that direct labour repre-sented an inadequate basis for the apportionment of overheads. The second factor was theincreasing competitiveness of the world economy. In order to compete effectively, firmsoften adopted practices with which traditional product costing was unable to work. Forexample, firms commonly met niche needs with short production runs and the same pro-duction line was commonly reconfigured for a different model. The traditional method-ology was simply incapable of producing accurate and representative product costs in thisenvironment. Yet the penalty for incorrectly costing and thereby incorrectly pricing prod-ucts in this marketplace was very severe. Johnson and Kaplan (1987) proposed a differ-ent way of thinking about costs and advanced a methodology termed activity-basedcosting (ABC),which would address many of the weaknesses of the traditional system.
The work was extremely well received in academic circles. Additionally, the environ-mental changes in the world economy were such as to raise hopes that the practitionersresponsible for developing and implementing systems in the corporate world would acceptit. In the past academic criticism of industrial accounting practice has often been ignoredbecause of the perceived irrelevance of academic research by practising accountants.However, in this case, the commercial connections of the academic home of Johnson andKaplan (1987) were such as to place the proposals at the centre of corporate thinking. Bothare based at Harvard Business School, which has been associated with strategic develop-ments in some of the largest companies in the United States. Additionally, many of theideas of ABC may be linked to the universally accepted strategies of corporate compara-tive advantage developed and articulated by Michael Porter (1985) at Harvard.
COSTING PRODUCTS AND SERVICES 61
Coombs-03.qxd 3/18/2005 1:08 PM Page 61

Overview
Some of the key differences between traditional absorption costing systems and ABC arehighlighted in Figure 3.1.
In absorption costing, as we have seen, overhead costs are apportioned to productiondepartments. There will usually be few of these. In ABC, on the other hand, activities thatcontribute to production are first defined; there will be a number of these. The costs of eachactivity are collected into an activity cost pool that represents the costs of undertaking thespecified activity for a year. Activities include: machine set-ups (concerned with setting upmachinery for production); purchase order costs (the costs of ordering raw materials); andinspection (the costs of quality control). Costs may be classified into support activities andproduction process activities. The former activities include inspection and purchase ordercosts. The latter activities include assembly, machining and finishing, and these may besynonymous with production departments. Within absorption costing the costs of supportservices are normally apportioned to production departments and amalgamated with allother costs, whereas in ABC they stand alone and are separately allocated as product costs.
Absorption costing normally uses one or two bases for absorbing overheads, namely DLHor machine hours. In ABC, on the other hand, there will be a range of different cost drivers.Cost drivers are factors that cause costs of the activity to increase; the direct cause–effect linkis not present in absorption costing. Examples of cost drivers are shown in Table 3.10.
62 MANAGEMENT ACCOUNTING
Figure 3.1 Absorption costing and ABC compared
Apportionments Absorption byTotal overhead to factory DLH orcosts e.g. departments Departments machine hours Product cost
Rent → Machining Machine hours →
Power etc. → Assembly Labour hours →
Total overhead Collected Activity cost Cost drivercosts according to pools ratese.g. activities e.g. e.g. Product cost
Staff costs → Purchase of Cost per →raw materials purchase order
Equipment costs → Machine set-up Cost per set-up →
Power → Machining Cost per →etc. products machine hour
Absorption costing
ABC
Coombs-03.qxd 3/18/2005 1:08 PM Page 62

Activity Cost Cost driver Pool Number of rates
Activity £ Cost driver cost drivers £
Production 15,000 The number of 50 £300 perscheduling production runs production run
Buying raw 16,500 The number of 110 £150 permaterials purchase orders purchase order
Material 18,000 The number 180 £100 per set upset-ups of set-ups
Machining 24,000 Machine hours 8,000 £3 per machineproducts hour
Quality control 18,500 The number 370 £50 perof inspections inspection
Total costs 92,000
Each cost driver will be associated with a cost driver rate that will be used to calculate theamount of activity pool resource cost to be charged to each product line. A cost driver rateis calculated by:
The costs of the activity cost pool
Number of cost drivers for the activity
Illustration
Eiger Ltd. makes two different models of ice axe using the same factory and equipment.They are the Popular, a mass market axe, and the Expert, for the very experienced moun-taineer. The annual production overhead of £92,000 has been analysed over five activitiesas is shown in Table 3.11. The cost drivers have been identified and counted and the costdriver rates have been calculated.
COSTING PRODUCTS AND SERVICES 63
Table 3.10 Cost pools and cost drivers
Activity cost pool Cost driver
Purchase of raw materials The number of purchase orders
Machine set-up costs The number of set-ups
Cost of machining products The number of machine hours
Inspection costs The number of inspections carried out
Table 3.11 Annual production overhead for Eiger ice axes
Coombs-03.qxd 3/18/2005 1:08 PM Page 63

The annual number of cost drivers is split between the two product lines as shown inTable 3.12.
We can now use the information about cost driver rates and the number of cost driversin each product line to calculate the activity-based cost for one Popular and one Expertice axe (see Table 3.13).
Overcosting and Undercosting of Products
In our criticisms of absorption costing we outlined that it may result in some productsbeing overcosted relative to their resource consumption and others undercosted. ABC islikely to reduce the likelihood of this because it is a much more refined system. Withregard to Eiger Ltd., absorption costing systems would have used a machine hour rate andthis would have been:
Production absorption rate =£92,000
8000 machine hours= £11.50 per machine hour
During the year Eiger Ltd. plans to make 3000 of the Popular model and 1000 of theExpert. Production of the Expert is much more complex and it is produced in smaller batchesand in shorter production runs. The Popular requires 1 hour and 40 minutes of machine timeper product, whilst the Expert requires 3 hours. Direct costs per ice axe are as follows:
64 MANAGEMENT ACCOUNTING
Popular Expert£ £
Direct Labour 8 12
Direct materials 12 15
20 27
Table 3.12 Cost driver breakdown
Number of cost drivers
Cost driver Total Popular Expert
Production runs 50 20 30
Purchase orders 110 60 50
Set-ups 180 70 110
Machine hours 8000 5000 3000
Quality control 370 120 250
Coombs-03.qxd 3/18/2005 1:08 PM Page 64

The total product costs utilising absorption costing and their comparison with ABCproduct costs are shown in Table 3.14. This under- and overcosting is referred to as cross-subsidization. Popular ice axes are cross-subsidizing Experts as they are bearing some ofthe costs of the latter, amounting to £2.92 per Popular. If the company uses product costsfor decision making, for example as a basis for determining a product price, then underabsorption costing Experts may be sold too cheaply.
Types of Activity Cost Pools
Cooper (1990) classified manufacturing activities into four distinct levels:
1. Unit-level activities. These are performed each time a unit of the product or serviceis produced. They consume resources directly in proportion to production output.
COSTING PRODUCTS AND SERVICES 65
Table 3.13 Activity-based cost per ice axe
Popular Expert
Cost driver Number of Total cost Number of Total costActivity rate cost drivers £ cost drivers £
Production £300 per 20 6,000 30 9,000scheduling production
run
Purchasing £150 per 60 9,000 50 7,500raw purchasematerials order
Machine £100 per 70 7,000 110 11,000set-ups set-up
Machining £3 per 5000 15,000 3000 9,000products machine
hour
Quality £50 per 120 6,000 250 12,500control inspection
Total cost £43,000 £49,000
Number of ice axes produced 3,000 1,000
£ £
Overhead cost per ice axe 14.33 49.00
Add direct costs 20.00 27.00
Total costs per ice axe 34.33 76.00
Coombs-03.qxd 3/18/2005 1:08 PM Page 65

An example is given by machine running costs with a cost driver of machine hoursas the increase or decrease in costs is caused directly and proportionately bychanges in production.
2. Batch-level activities. These are performed each time a batch of goods is produced –for example, each time a machine is set up for a different production run. Batch-level activities are fixed for all units within the specific batch and must be averagedover the number of units produced to produce a cost per unit.
3. Product-sustaining activities. These are performed so that production of a specificproduct can take place, for example, maintaining or upgrading product specifica-tions, or product design. These costs will be incurred irrespective of the number ofbatches or units that are produced.
4. Facility-sustaining activities. These are incurred in order that, for example, thefactory can engage in manufacture, and this includes things like the plant managerand factory rents. Such costs cannot be traced to individual products and, in ABC,they are shown as a deduction from the total gross profits of production.
The Benefits of ABC
Product Costing
As we have seen, the costs obtained under ABC are likely to be more accurate in reflect-ing underlying resource consumption than is absorption costing. This is particularlyimportant in a complex organisation, with many products operating in a range of com-petitive markets. Bhimani and Piggott (1992) found that factory managers found ABCinformation to be valuable in allowing them to identify overhead cost reduction opportu-nities. There is a summary of this article at the end of the chapter.
66 MANAGEMENT ACCOUNTING
Table 3.14 Product costs
Popular Expert£ £
Overhead
Popular £11.50 × 1.667 hours 17.25
Expert £11.50 × 3 hours 34.50
Direct costs 20.00 27.00
Product cost using absorption costing 37.25 61.50
Product cost using ABC 34.33 76.00
Absorption overcosting of Popular 2.92
Absorption undercosting of Expert 14.50
Coombs-03.qxd 3/18/2005 1:08 PM Page 66

Decision Making
It can be argued that the product costs are valuable for decision making. Although thecosts include overheads, such overheads are calculated using cost drivers that are basedupon a cause–effect relationship between activity cost pool and the associated costdriver.
Activity-Based Management
ABC, through the processes of pooling of activity costs and the identification of costdrivers, can lead to a range of applications. These include the identification of spare capa-city and the fostering of cost reduction by comparing the resources required under ABCwith the resources that are currently provided. This provides a platform for the develop-ment of activity-based budgeting in which the resource relationships identified by ABCare used to project future resource requirements. A study by Innes and Mitchell (1995) inthe United Kingdom reported that the cost management applications of ABC by firms out-weighed the product costing applications.
Service Organisations
These organisations, such as banks, hospitals and government departments, have verydifferent characteristics than manufacturing firms. Service organisations have almost nodirect costs, most of the costs are overheads and they do not hold stocks of service as theservice is consumed when it is produced. Absorption costing has generally been consid-ered inappropriate for these organisations, whereas ABC offers the potential of benefitsfrom improved decision making and cost management. Drury and Tayles (2000), in a UKsurvey, found that 51% of the financial and services organisations surveyed had imple-mented ABC, compared with only 15% of manufacturing organisations.
An Improved Role for the Management Accountant
ABC and activity-based management allow the management accountant to play a key partin maximising value from resources because of the level of understanding of key activityand cost information.
The Problems with ABC
1. Batch and product sustaining activities will need to be averaged over all units pro-duced in order to arrive at product costs. This may give the false impression thatthere is a direct relationship between marginal changes in output and these costs.
2. These systems are more complex than absorption costing and are more expensiveto operate. They also take a number of years to develop. All firms should considerthe costs and benefits of ABC, and for small companies in particular the costs mayoutweigh the benefits.
COSTING PRODUCTS AND SERVICES 67
Coombs-03.qxd 3/18/2005 1:08 PM Page 67

Per unit Totals£ £
Sales 15 75,000
Variable costs 9 45,000
Contribution 6 30,000
Fixed costs 24,000
Net profit 6,000
As can be seen, the contribution does not represent profit as we have to consider thefixed costs of the operation. We can regard the contribution as contributing to the fixedcosts and net profit of the organisation. In order to make a profit, the contribution mustexceed the fixed costs of the period.
Break-Even and Target Contribution
The unit contribution can be used to identify the break-even output of the company. Break-even is a situation in which a company makes neither profit nor loss. At break-even total
3. Hopper et al. (2003) warn of the dangers of implementing western managementaccounting practices in less developed countries. There is a summary of the articleat the end of this chapter.
Marginal or Variable CostingMarginal costing is based upon the segregation of costs into two groups, variable costsand fixed costs. As you learned in Chapter 2, variable costs are assumed to vary directlyin proportion with output in the short term. Examples include fuel for motor vehicles anddirect material costs. Fixed costs remain constant over a wide range of activity levels fora specified period of time, and they are not affected by changes in output. Examplesinclude rents of buildings and managers’ salaries.
Marginal costing assumes that: variable costs are product-related because they vary asproduction is increased or decreased, and that fixed costs are time-based as they relate toa specific accounting period.
Contribution
The concept of contribution is central to marginal costing. Contribution is defined as sell-ing price less variable costs. If production and sales are both expected to be 5000 in aperiod and selling price is £15, variable costs are £9 and fixed costs are £24,000 then:
68 MANAGEMENT ACCOUNTING
Coombs-03.qxd 3/18/2005 1:08 PM Page 68

Per unit Totals£ £
Sales (6000 units) 15 90,000
Variable costs (6000 units) 9 54,000
Contribution (6000 units) 6 36,000
Fixed costs 24,000
Net profit 12,000
Margin of Safety
The margin of safety is the difference between the budgeted (or actual) output and thebreak-even output. Thus, at 6000 units of output the margin of safety is 2000 units. Outputcan fall by 2000 units before it falls to break-even at 4000 units.
The margin of safety can also be stated in percentage terms:
Margin of safety× 100 =
2000 units× 100 = 33%
Budgeted output 6000 units
contribution will exactly equal total fixed cost and we can find the break-even sales levelquite easily by means of the following formula:
When 4000 units are sold, contribution will amount to (4000 × £6 =) £24,000, whichis equal to total fixed costs.
In an extension of this, unit contribution also allows the identification of the number ofsales units required to earn a target profit. In this case total contributions must fully coverfixed costs and earn the target profit. If the company in this case desires a net profit of£12,000 then the number of units that it must produce and sell is given by the followingformula:
The following statement demonstrates that the target net profit of £12,000 will be earnedif 6000 units are produced and sold:
Break-even =Fixed costs
=£24,000
= 4000 unitsContribution per unit 6
COSTING PRODUCTS AND SERVICES 69
Required units =Fixed costs and target profit
=£24,000 + £12,000
= 6000 unitsContribution per unit 6
Coombs-03.qxd 3/18/2005 1:08 PM Page 69

Break-Even Charts
The relationship between revenues, variable costs and fixed costs can be summarised in abreak-even chart, as is demonstrated in Figure 3.2. It shows the break-even point wheretotal revenue (TR) is equal to total costs (TC, at 4000 units in our example). Total costsrepresent the sum of variable costs and fixed costs (FC) at all levels of output.
There are some key assumptions underpinning the construction of a break-even chart.The most important of these is the linearity assumption, which is that variable costs andsales revenue are constant per unit of output and can be represented by straight lines. InFigure 3.2 it also assumes that fixed costs are at the same level throughout the range ofactivity. The previous chapter discussed stepped fixed costs, and these can be easilyaccommodated within the diagram.
The assumption of linearity of the cost and revenue functions may be considered to bethe Achilles’ heel of the break-even chart. However, the concept of the ‘relevant range’ isimportant here. It states that a manager will not be interested in the whole range of thebreak-even chart but in a relevant area, possibly from break-even to the budgeted level ofoutput and sales, and as long as the lines are linear within that range, that is sufficient forpurposes of decision making.
One benefit of the break-even chart for managers is that they can easily assimilate theinformation presented and the relationships between the key variables. It is also useful fordisplaying the range of profits and losses and it may be much easier for non-financialmanagers to understand than tables of data.
70 MANAGEMENT ACCOUNTING
£
TR
TC
FC
Units
Break-evenPoint
Figure 3.2 Break-even chart
Coombs-03.qxd 3/18/2005 1:08 PM Page 70

A contribution chart is shown in Figure 3.3. This chart shows the total contribution asthe difference between the total revenue and the variable cost (VC) lines. Fixed costs arerepresented by the difference between the variable cost and total cost lines. Break-even isat the junction of total revenue and total cost.
Marginal Costing as a Cost Collection System
The basis of marginal costing as a cost collection system is as outlined above. First, costsare broken down into fixed costs and variable costs. Secondly, fixed costs are regarded asperiod costs and not as product costs and are not carried forward in closing stock. In con-sequence, the value of closing stock will be less than under absorption costing, in whichclosing stock contains a share of factory costs, irrespective of whether they are fixed orvariable. Marginal costing is relatively infrequently used as a cost collection system.
Illustration
McCarthy & Sons produce wicker baskets, and the firm uses marginal costing as a costcollection system. Data for the first month of production are as follows:
Unit selling price £4 Production 6,000 basketsUnit variable cost £1.50 Sales 5,000 basketsFixed production overhead £9,000 Closing stock 1,000 basketsFixed selling costs £3,000
£Sales (£4 × 5,000) 20,000
COSTING PRODUCTS AND SERVICES 71
+
TR
TC
Contribution
FCVC
Units O
Figure 3.3 Contribution chart
Coombs-03.qxd 3/18/2005 1:08 PM Page 71

Costs of productionVariable costs (£1.50 × 6,000) 9,000Less closing stock (£1.5 × 1000) (1500) 7,500Contribution 12,500Fixed costs
Production costs 9000Selling costs 3000 12,000
Net profit 500
As may be seen, closing stock is valued at the variable costs of production. By contrast,the closing stock valuation in absorption costing would, as well as the variable costs,also have included a proportion of the fixed production overheads. This amounts to(1000/6000 × £9000 = £1500) because the closing stock of 1000 units is one-sixth ofproduction and should therefore bear one-sixth of fixed costs. This would increaseclosing stock from £1500 to £3000 and increase this period’s profit from £500 to £2000.However, in the next period the absorption costing profit will be lower than the marginalcosting profit because the former is carrying forward a higher cost to the next accountingperiod.
Conclusions This chapter makes the following points:
• Absorption costing is an accepted method of costing products and inventories.There is a well-established multi-stage process to apportion and absorb overheadsinto production.
• It has advantages, but is flawed from a decision-making perspective.• ABC offers improved product costing and an opportunity to improve decision
making and cost management.• ABC is complex, expensive and time-consuming. It is unlikely to be suitable for
small businesses but is suitable for service sector organisations.• Marginal costing can be used in decision-making, emphasising cost behaviour and
contribution. The relationships between variables can be summarised in a break-even chart or a contribution chart. Marginal costing can also be used as a costcollection system.
SummaryThe chapter has examined three approaches to product costing: absorption costing, activity-based costing and marginal costing. Absorption costing is widely used in practice, but
72 MANAGEMENT ACCOUNTING
Coombs-03.qxd 3/18/2005 1:08 PM Page 72

its crude approach to costing means that it has significant weaknesses. Activity-basedcosting uses the ideas of cost pools and cost drivers and offers a way of overcoming someof the weaknesses of absorption costing. Marginal costing, the third approach, may beused in two ways: in decision making and in cost collection. It emphasises cost behaviour,the importance of differentiating between variable and fixed costs, the concept of contri-bution and that of break-even.
Recommended Further ReadingBhimani, A. and Pigott, D (1992) ‘Implementing ABC: a case study oforganisational and behavioural consequences’, Management AccountingResearch, 3: 119–132.The authors carry out field study research within a pharmaceutical manufacturing com-pany, Evans Medical. The company manufactures vaccines, pharmaceuticals and ‘overthe counter’ products; in total the company manufactured 350 products and had a turnoverof £50 million. In the study the authors make use of interviews and document analysis andthe study was conducted over an eight-month period.
The aim of the research is to explore the behavioural and organisational consequencesthat can arise in a company upon the implementation of ABC and to examine such con-sequences from the perspective of predefined expectations about a change in an account-ing system. The study commenced with the company’s decision to introduce ABC andended at a stage when the new accounting system was running in parallel with the old.
The study examines the company’s rationale for installing ABC. The company had cometo the conclusion that its existing cost accounting system was inadequate in terms of prod-uct costs and in the production of broader management information. The aims of imple-menting ABC were to produce more accurate product costs, to produce regular cost andvolume reports and to identify those activities that were driving costs to permit moreeffective cost control and product improvement.
The article goes on to document the results from introducing the system. In summary,the new system appeared to produce more accurate product costs that were also in line withmanagement expectations. Moreover, the ABC system provided information enablingmanagement to reduce costs and obtain improvements, again in line with expectations.
The article then goes on to discuss the behavioural and organisational consequencesthat followed the implementation of ABC. The first of these relates to the perceived legit-imising of the accounting function. ABC requires accountants to gain ‘an appreciation ofmanufacturing processes, operational issues and production activities and had created theperception among factory and head office managers that the accounting data emanating …was now more firmly grounded in organisational processes’ (Bhimani and Piggott, 1992:127). Secondly, ABC information was capable of being used by managers to support theirown efforts to derive economies at the factory level. The previous system had been unin-telligible to them, but ABC information was intelligible and was used by factory man-agers to legitimise their decisions; it also improved communication by providing line
COSTING PRODUCTS AND SERVICES 73
Coombs-03.qxd 3/18/2005 1:08 PM Page 73

managers and accountants with a common language. Finally, it raised understandingof product profitability among factory managers, and their enhanced understandingproduced a broad shift in the balance of power from sales to factory. Sales managers hadplayed no part in the introduction of a new system and did not understand the significanceof the information that was being produced.
Hopper, T., Tsamenyi, M., Uddin, S. and Wickramasinghe, D. (2003) ‘The statethey’re in’, Financial Management, June: 14–19.Hopper et al. consider the relevance of western management accounting trends and idealsin the context of less developed countries (LDCs). They argue that the effective internaland external financial controls that are assumed by policy makers (e.g. those within coun-tries granting aid to LDCs) often do not occur in practice. They claim that often themarket-based reforms insisted upon by policy makers may frustrate rather than facilitateappropriate development. This, in turn, is likely to facilitate a lack of transparency, pooreremployment conditions, fraudulent activity, etc.
Hopper et al. argue that, rather than requiring specifically designed managementaccounting systems, the LDCs should manage well with ‘imported’ technology. The realproblem, they argue, is not that effective management accounting systems are not avail-able or in place, but that they are either ignored or applied in unintended ways. Hopperet al. continue that the special types of risk and uncertainties specific to developingeconomies can lead to short-termism, compounded by political volatility. They explainthat the problems of obtaining sufficiently rich information systems, and skilled, com-mitted employees may be beyond the reach of LDCs, and unskilled personnel may berequired to carry out a wide variety of tasks simultaneously. Effective and honest corpo-rate governance cannot be assumed in all such environments, the instability of govern-ment, and the level of corruption within officials often being crucial factors.
The valuation of companies (and the use of associated management accounting meth-ods) is not a straightforward matter where stable markets do not exist and where regula-tion is not complied with. Additionally, Hopper et al. question whether the variousfashionable theories regarding the interface of culture and management accounting applyin such LDC environments, as the basic theoretical assumptions of such theories areunlikely to be relevant.
Hopper et al. suggest a ‘package’ of possible areas for future research and developmentto overcome the problem of the lack of ‘fit’ of recognised mainstream managementaccounting ideas within LDC environments. Amongst these areas, Hopper et al. include:
• the relationships between management accounting, auditing and external regulation;• the study of types of enterprise that are uncommon or poorly researched within
western management accounting (e.g. plantations, small family-run firms);• ways of measuring performance according to criteria such as poverty reduction, rather
than profit maximisation, shareholder value maximisation, etc.;• budgeting within LDC governments;• the effects of cultural, political and ethnic issues particular to LDC economies;• the roles of transnational bodies such as the World Bank.
74 MANAGEMENT ACCOUNTING
Coombs-03.qxd 3/18/2005 1:08 PM Page 74

Case Study: Billy Griffiths
Billy Griffiths is the newly appointed management accountant for Hopeless Ltd. Thecompany has an appalling history in terms of its budget procedures and processes, withwidely fluctuating results over the three years of its existence. This situation led to Billy’sappointment, and his key initial task is to sort out these problems.
The company manufactures double glazing, making three products – windows, doorsand UPVC garage doors.These products are manufactured in three production departmentswhich are supported by two service departments – a canteen and a maintenance unit.
Billy has had some success in his first three months with the company, having beenable to calculate direct material costs and direct labour costs per unit. He is willing toadmit, however, that some of the basic data on which he worked is rather dubious,although sufficiently robust to make a start.
His next task is to turn to the allocation and apportionment of overheads and the cal-culation of appropriate hourly rates to serve as a basis for pricing. He has obtained thefollowing information to make his judgements:
COSTING PRODUCTS AND SERVICES 75
GarageWindows Doors doors
Production (units) 5,000 2,500 1,250
Prime Costs (£ per unit)
Direct materials 50 75 150Direct labour
Machine shop 12 22 45Assembly 26 40 64
Machine hours per unit 3 5 10
Machine Assembly Maintenanceshop shop Canteen unit Total
Budgeted overheads (£)
Allocated overheads 35,000 17,650 21,000 15,500 89,150
Rent and rates 32,450
Depreciation 25,000
Book value of machinery 250,000 350,000 50,000 45,000
Number of employees 12 25 5 3
Floor area (sq. metres) 4,500 5,500 1,500 500
Coombs-03.qxd 3/18/2005 1:08 PM Page 75

It is estimated that 65% of the maintenance section’s time is spent in the machine shop,and the balance in the assembly shop.
Billy is too busy to do the actual calculation and, as his assistant, the task has landedon your desk.
1. (a) Compile the spreadsheet for the above data, ensuring total flexibility if figureschange.
(b) Calculate a machine hour rate for the machine shop.(c) Calculate an overhead rate based on a percentage of direct wages.(d) Calculate the budgeted overhead cost of a unit of each of the products.
2. Flex the model by increasing all costs by 10% and see what happens to your results.What impact will this have, should this situation arise?
3. Management are aware that Billy is undertaking this process and are concernedabout the new process of apportioning overheads and the use of spreadsheets.Advisethem of the advantages and disadvantages of the new methods by specifically con-trasting the new process with the historical methods of managing overheads.
Case Study: Jim Davies
Jim Davies is the manager of one of six large distribution warehouses for Mars & Spars,a multinational clothing and footwear chain store. Jim’s warehouse operates as a profitcentre whereby purchasing officers based within his warehouse buy in items underappropriately negotiated contracts and ‘sell’ them on to the company’s UK-based stores,although occasionally the goods can be exported. These are his ‘customers’. Suppliers areboth UK and overseas companies.
Goods issued by Jim’s warehouse are charged to his ‘customers’ at the agreed contractprice plus variations for agreed factors such as inflation. Any cost outside the contract priceplus agreed variations are borne by the supplier. The charge to Jim’s customers is the costcharged to Jim plus 5%. This is thus effectively Jim’s performance measure as at the end ofthe year his warehouse must show a 5% ‘profit’ after allowing for all costs. This profit margindetermines not only Jim’s performance-related pay bonus but also that of every person whoworks in the warehouse and Jim’s distribution network. It also is a factor in determining Jim’spromotion chances.
Jim is feeling aggrieved. Every year for the past three years his operating surplus hasfailed to achieve the necessary 5% target. This has resulted in little or no performance-related pay and he is under pressure from his senior managers to explain why he is fail-ing to perform – particularly as the other five warehouses have all achieved theirtargets (and more in some cases). Jim conjectures that the way in which the companyallocates and apportions overheads to his warehouse causes the failure to achievetargets.
76 MANAGEMENT ACCOUNTING
Coombs-03.qxd 3/18/2005 1:08 PM Page 76

The following summary figures indicate the position for the last three years:
At present the company uses the following definitions of overheads:
• Corporate overheads – costs of board meetings, secretarial staff, board memberssalaries and expenses, etc.
• Technical support – financial, legal and personnel support, including such functions asbusiness planning, financial advice on budgets, equal opportunities policy advice, etc.
• Buildings – costs for every building owned or occupied by the company.
All these overheads are charged to a trading account for each section – legal, finance,personnel, IT etc. – and then charged to a frontline service such as Jim’s warehouse onthe basis of a staff time analysis for each division. Staff in the support departments fillin an individual timesheet every three years. They are asked to estimate the amount oftime they spend on each activity of the company and then these time sheets are analysedand used as the basis to apportion costs in the appropriate trading account. The last timesheet analysis was completed in 1990.
With buildings, all costs for all buildings are allocated to one central building account.These are then apportioned to all departments and functions on the basis of floor areaoccupied. For central overhead departments, the final costs are apportioned to all front-line services such as warehouses on the basis of the staff time analysis.
The net result of this process is that all costs of the overhead departments are fullyapportioned to frontline departments such as warehouses.
Having read and analysed the above case:
(a) Do you think the issue of overhead allocation is important to companies?(b) Why do you hold your point of view?(c) Identify what, if anything, is wrong with the above system.(d) What alternatives do you think might exist to the above?(e) Do you agree with Jim that overheads are the cause of all his problems?(f) How would you go about implementing any alternative?
COSTING PRODUCTS AND SERVICES 77
2004 2003 2002£000s £000s £000s
Sales 10,000 9,500 9,250
Cost of sales 7,500 7,020 6,950
Gross profit 2,500 2,480 2,300
Expenses
Operating costs 1,800 1,780 1,700
Central overheads 400 350 200
Net profit 300 350 400
Percentage return 3 3.7 4.3
Coombs-03.qxd 3/18/2005 1:08 PM Page 77

Notes
1. Electricity costs are split equally between heating and lighting (50%) and powerfor production machines (50%).
2. Materials requisitions during the year are expected to average 20 per day for Dept. M,15 per day for Dept. A, and 2 per day for each of Departments F and R.
3. There are two supervisors who cover the whole of the production and service oper-ations of the country. It is estimated that a production employee requires threetimes the supervision of a service employee.
4. Other overheads are incurred 90% on production and 10% on servicing. The indi-vidual production and service departments are treated as equally responsible fortheir share of such costs.
Questions1. Spot Ltd. produces three products, X, Y and Z in three production departments:
Moulding (Dept. M), Assembly (Dept. A) and Finishing (Dept. F). It also has twoservice departments responsible for repairs and maintenance (Dept. R) and fordevelopment and research (Dept. D).
Employees in Dept. R are paid total salaries of £24,000 per annum and completetimesheets to account for their time. Departments M, A, F and D utilise its servicesin the ratio 70:20:8:2 respectively.
Dept. D studies improvements in working practices and product designs. Thesalary costs of this department total £20,000 per annum, and its work is expectedto benefit the three production departments equally.
The management accountant has estimated that the following factory over-heads (excluding the salaries described above) will be incurred in the comingyear:
78 MANAGEMENT ACCOUNTING
Note £000’s
Rent and rates 240
Electricity 1 75
Establishment costs 200
Plant insurance 60
Plant depreciation 600
Materials handling 2 12
Supervisors’ salaries 3 60
Other overheads 4 72
Coombs-03.qxd 3/18/2005 1:08 PM Page 78

The budgeted production details for the coming year are expected to be as follows:
The following information is relevant to the company and its departments:
(a) Given that Dept. M is machine-intensive and Departments A and F are labour-intensive, calculate the total absorption cost per unit for each of the company’sthree products using the most reasonable overhead absorption rates.
(b) The managing director has heard that using overhead absorption rates based onestimated figures can result in the under- or over-recovery of overheads. Write abrief memorandum to the managing director explaining the advantages of usingestimated OARs, the situations in which under- or over-recovery of overheadsmay occur and the accounting treatment of such items.
2. A friend of yours is about to set up in business manufacturing and selling virtualreality jogging machines that will give users the perception that they are joggingthrough the countryside. The following information relates to the costs of produc-ing 3500 jogging machines per year:
Although these figures are based on the production of 3500 machines, production capa-city is 4000 machines per annum. The budgeted selling price is £280 per machine.
COSTING PRODUCTS AND SERVICES 79
Departments
M A F R D
Floor space (sq.m.) 100,000 71,000 25,000 3,000 1,000
No. of employees 15 8 5 2 2
Plant value (£000s) 2,200 500 250 40 10
Budgeted machine hours 56,000 6,000 500
X Y Z
Direct materials per unit (£) £3.70 £6.40 £8.90
Direct labour per unit (hours):
Dept. M (paid at £5.00 per hour) 0.4 0.6 0.7
Dept. A (paid at £4.50 per hour) 0.3 0.3 0.3
Dept. F (paid at £4.25 per hour) 0.1 0.2 0.3
Moulding machine time per unit (hours) 0.8 1.0 1.4
Expected output (units) 10,000 20,000 20,000
Coombs-03.qxd 3/18/2005 1:08 PM Page 79

The draft production overhead budget for next year contains the following departmen-tal budgets:
Machine-oriented overheads £16,500Set-up costs £38,920Material ordering £24,630Material handling £32,480
Following discussion with your friend, you ascertain that £207,000 of labour costs,100% of administration overhead, 30% of production overhead and 50% of selling anddistribution overhead are fixed in nature. All other costs are variable with the level ofproduction.
(a) Calculate the unit contribution of a jogging machine and the total contribution ofthe budgeted level of production and sales.
(b) Calculate the amount of profit at the budgeted level of production.(c) Construct a break-even chart, clearly showing the break-even point in units, the
margin of safety and the budgeted level of production.
3. Ontario PLC manufactures three products, X, Y and Z. The following table includesinformation relating to the manufacture of each product
80 MANAGEMENT ACCOUNTING
£
Material costs 260,000
Labour costs 320,000
Production overhead 160,000
Selling and distribution overhead 150,000
Administration overhead 60,000
Material Direct Machinecost per labour per time per Labour cost
Budgeted unit unit unit per unitProduct output £ (hours) (hours) £
X 6000 15 0.25 0.25 2
Y 8500 24 0.4 0.25 2
Z 4800 18 0.4 0.50 4
Coombs-03.qxd 3/18/2005 1:08 PM Page 80

Fixed overheads have been estimated by the company and represent both the appor-tionment of the company’s existing fixed overheads to the new bicycle and the additionalfixed costs incurred in the event of manufacture. Expansion beyond 7000 units willrequire the rental of additional premises and further additional fixed costs as shownabove. Maximum production and sales are estimated at 9,000 units.
(a) Recalculate the production overhead budget per product using activity-basedcosting, tracing costs to products by cost drivers.
(b) Discuss the assertion that activity-based costing is likely to produce a fairer unitproduct cost than total absorption costing.
4. The Dreamwheel Cycle Company is considering manufacturing a new bicycle andhas prepared the following estimates of cost and selling price:
The budget absorbs these overheads into production using a budgeted machine hourrate of £18.68 per hour. This is budgeted to produce overhead costs per product asfollows: X = £4.67, Y = £4.67, Z = £9.34. However, it has been proposed that the over-head budget be recalculated using activity-based costing. The following information hasbeen provided for this purpose:
COSTING PRODUCTS AND SERVICES 81
Number of Number of timesProduct Number of set-ups material orders material is handled
X 1 1 3
Y 4 3 10
Z 2 2 3
£
Unit labour cost 20.00
Unit material cost 15.00
Unit packaging cost 5.00
Proposed selling price 80.00
Budgeted fixed cost per period
0–7000 units 150,000
7001 units and above 320,000
Coombs-03.qxd 3/18/2005 1:08 PM Page 81

Notes:
1. The quality control costs are related to testing a random sample of orders dispatched.2. The central management costs are not attributed to any activities and are to be
absorbed on the basis of production staff hours.
For next year the production staff budget is £187,200 with a pay rate of £4.80 per hour.Apart from production staff and material costs, overheads are estimated at £1,010,000
and are made up as follows:
(a) Prepare a break-even chart for the bicycle identifying clearly the break-evenpoints, and identify the profits (or losses) that would be made with sales of 6000units and 8500 units.
(b) Comment on the results shown by the chart and interpret the key points shown bythe chart for management together with any limitations in your analysis.
5. An airline catering company produces three standard meal packs about which thefollowing information is available for next year:
82 MANAGEMENT ACCOUNTING
Expected output Production staff time Total material costsPack (numbers of packs) per pack (minutes) £
X 90,000 10 247,500
Y 70,000 12 250,000
Z 40,000 15 180,000
Notes £000
Ordering materials 300
Production run set ups 110
Quality control 1 90
Packing & dispatch of orders 60
Negotiation with customers 200
Central management costs 2 250
Total 1010
Coombs-03.qxd 3/18/2005 1:08 PM Page 82

Product Full Cost Price (Full cost ++ 20%)
X £7.80 £9.36
Y £9.50 £11.40
Z £12.10 £14.52
(a) Determine the full cost of each pack for next year using:
(i) an absorption approach with direct production staff hours as the absorptionbase.
(ii) an activity-based approach using the information given above.
(b) Comment on the results of your calculations and indicate the advantages anddisadvantages of moving to an activity-based approach.
In the coming year, the activity volumes are expected to be as follows:
In the current year and in previous years the company has absorbed overheads with pro-ductive staff hours as the absorption base. Prices have been based upon full cost plus 20%.In recent years prices have been steady using this approach. The costs and prices for thecurrent year are as follows:
COSTING PRODUCTS AND SERVICES 83
X Y Z
Set-ups 35 35 30
Orders for materials 85 110 105
Orders dispatched to customers 160 200 140
Coombs-03.qxd 3/18/2005 1:08 PM Page 83

Chapter 4MANAGEMENT ACCOUNTING AND THE PLANNING PROCESS – 1
By the time you have finished studying this chapter, you should be able to:• discuss the relevance of an organisation’s objectives to its budgeting processes;• describe the planning process for a number of different organisation types;• prepare master and subsidiary budgets for a number of different organisations.
Missions, Objectives, Aims, Goals, Targets and Plans
Accounting and business textbooks often use terms such as missions, objectives, aims,goals, targets, and plans interchangeably. It is a good idea to consider the meanings ofthese terms in order to avoid misunderstanding and/or ambiguity. The definitions givenbelow are not the only possible ones. In the practical accounting/business situation, it isimportant that users of such terms come to a common understanding of their meaningswithin the context in which they are used. Many organisations will produce their ownglossaries or ‘controlled vocabularies’ for these purposes.
The definitions given in Table 4.1 have been obtained from a number of dictionaries and arechosen for their everyday meanings, thereby avoiding any organisation-specific slant. A numberof features are evident in Table 4.1. Firstly, the different terms may mean different or similarthings and so we should avoid using terms with different meanings synonymously and, in thepractical situation, be precise about what we mean by a term. Secondly, each term has aneveryday meaning and ideally this should be the one allocated to the term to maximise under-standing across a broad range of users. Thirdly, some of the terms have a number of possiblemeanings, depending upon context and upon whether the term is used as a noun, an adjectiveor a verb. Again, precision should be sought when using such terms within a given context.
So, within our management accounting context, let us select the bits contained withinTable 4.1 that are most useful. We will probably end up with a collection of definitions
Key Learning Objectives
Coombs-04.qxd 3/18/2005 1:08 PM Page 84

Term Definition
Mission (Noun)
1. A specific task or duty assigned to a person or group of people: theirmission was to irrigate the desert.
2. A person’s vocation (Collins, 2000).
Mission statement
1. An official statement of the aims and objectives of a business or otherorganisation (Collins, 2000).
2. An explicit written statement of an organisation’s long-term aims andobjectives. Mission statements are designed to give substance to theperceived purposes of the organisation and provide all employees withan indication of what they are attempting to achieve through theircollective endeavours (Pass et al., 1995).
Objective (Noun)
1. Something which you try to do: the company has achieved its objectives; weset the sales forces certain objectives.Long-term or short-term objective – Aim which you hope to achieve within afew years or a few months (Collin et al., 2001).
2. What one intends to do or achieve: aim, ambition, design, end, goal, intent, inten-tion, mark, meaning, point, purpose, target, view (Roget, 1995).
(Adjective)
1. Considered from a general point of view, not from that of the person involved:you must be objective in assessing the performance of the staff; to carry out anobjective survey of the market (Collin et al., 2001).
2. Free from bias in judgement: disinterested, dispassionate, equitable,fair (Roget,1995).
Strategy (Noun)
Plan of future action: (e.g.) business strategy; company strategy; financial strategy(Collin et al., 2001).A plan or method devised to meet a need: (e.g.) strategies for dealing withdissatisfied customers (Penguin, 2000).
Long-term planning in the pursuit of objectives, or the art of this(Penguin, 2000).
Business strategy
The formulation of long-term plans and policies by a firm which interlocks itsvarious production and marketing activities in order to achieve itsbusiness objectives (Pass et al., 2000).
(Continued)
THE PLANNING PROCESS – 1 85
Table 4.1 Some dictionary definitions of common business terms
Coombs-04.qxd 3/18/2005 1:08 PM Page 85

Term Definition
Aim (Noun)
Something which you try to do: one of our aims is to increase the quality of ourproducts (Collin et al., 2001).
(Verb)
To try to do something: we aim to be No. 1 in the market in two years’ time (Collinet al., 2001).
Goal (Noun)
1. Aim, something which you try to do: our goal is to break even within twelvemonths (Collin et al., 2001).
2. The aim or object towards which an endeavour is directed.The terminal point of a journey or race (Collins, 2000).
Target (Noun)
1. Thing to aim for: monetary targets, production targets, sales targets (Collinet al., 2001).
2. An object or area aimed at the object of an attack or takeover bid. A fixed goalor objective, etc. (Collins, 2000).
(Verb)
1. To aim to sell.To target a market – to plan to sell goods in a certain market (Collin et al., 2001).
2. To make a target of. To direct or aim (Collins, 2000).
Tactics (Plural noun, treated as singular or plural)
1. (a) The science and art of disposing and manoeuvring forces in combat.(b) The art or skill of employing available means to accomplish an end.(c) A system or mode of procedure (Penguin, 2000).
2. The manoeuvres used or plans followed to achieve a particular short-term aim(Collins, 2000).
Plan (Noun)
1. Organised way of doing something: contingency plan, government’s economicplans (Collin et al., 2001).
2. A detailed scheme, method etc., for attaining an objective. An outline, sketchetc. (Collins, 2000).
(Verb)
1. To organise carefully how something should be done: to plan for an increase inbank interest charges, to plan investments (Collin et al., 2001).
2. To form a plan (for) or make plans (for). To have in mind as a purpose; intend(Collin et al., 2001).
86 MANAGEMENT ACCOUNTING
Table 4.1 (Continued)
Coombs-04.qxd 3/18/2005 1:08 PM Page 86

such as those in Table 4.2 (these are only the authors’ attempts at definition; many othervariations are possible).
So what can we learn from all this? Well, as we can see from Table 4.2, the differencesin meaning between the terms can be quite subtle. Sometimes the definitions (e.g. for objec-tives, aims, targets and goals) are just about identical. Generally though, in practice, theterms tend to be differentiated in terms of their time horizons and specificity. For example:
• Missions tend to be long-term and laid out in broad terms, without attempts beingmade to quantify them specifically.
• Objectives and aims tend to be medium-term and more specific in terms of what isintended to be achieved. Again, the positions to be reached may be expressed inmainly non-quantitative terms.
• Goals and targets tend to be medium-term or short-term and may be expressed interms of specific levels of achievements and tend to involve more specific quantifi-cation and deadlines.
• Plans tend to be quite specific (the shorter-term they are, the more specific they tendto be) and are usually quantified in some detail. They will, in order to ensure thatthey are complied with, lay out specific deadlines for each key stage. They may alsoinvolve the analysis of priorities and constraints.
• Budgets tend to be expressed mainly in monetary terms, although they may focuson the amounts of physical resources (materials, labour time) required.
THE PLANNING PROCESS – 1 87
Term Definition
Budget (Noun)
1. (Business) Preliminary financial plan for the future needed to effectively andefficiently function. It may be short-term (1 year or less), intermediate-term(2–3 years), or long-term (3 years or more). The shorter the time span, the moreaccurate the budget because there are fewer uncertainties. Short-term budgetsare more detailed and specific so they are more meaningful for everydayoperations. Intermediate-term budgets are most concerned with tracking thesuccess of projects undertaken and to be undertaken. Long-term budgets arebroad goals and are translated into short-term plans. The budget period variesdepending on objectives, use, dependability, risk, instability and manufacturingcycle (Shim and Siegel, 1995).
2. An estimate of income and expenditure for a future period, as opposed to anaccount, which records financial transactions after the event (Bannock andManser, 1999).
(Verb)
To plan probable income and expenditure: we are budgeting for £10,000 of salesnext year (Collin et al., 2001).
Table 4.1 (Continued)
Coombs-04.qxd 3/18/2005 1:08 PM Page 87

Term Management accounting meaning
Mission An important task that an organisation believes it is its duty to do.
Mission statement
An explicit statement of the aims and objectives of a business or otherorganisation – providing employees with an indication of what they are attemptingto achieve through their collective endeavours.
Objective Something which an organisation intends to do or achieve; a result that theorganisation intends to make happen.
Strategy A plan of future action, usually long-term, in the pursuit of objectives.
Aim A result that an organisation’s plans or actions are intended to achieve.
Goal An organisation’s aim, objective or purpose.
Target A level or situation which an organisation intends to achieve or aim at.
Tactics The plans followed to achieve a particular short-term aim.
Plan A set of decisions about how an organisation intends to do something, or to ensurethat an event or result should happen in the future.
Budget A financial plan, which may be short-term or longer-term, showing probable(planned) income and expenditure.
As was stated earlier, in the practical situation, an effort should be made to use terms care-fully so that confusion is avoided. We cannot, however, avoid the subtle variations ofmeaning produced by the richness of language.
Let us use the analogy of a football team to illustrate how these terms might be used.The football team has a mission – ‘to be the best team in the country’ or somethingsimilar. You may disagree with the team’s idea of what its mission is; indeed, there are alarge number of missions that might be suggested. It is therefore important that the teamshould be explicit in what its mission is, in order to avoid ineffective actions by itsmembers. Notice also that we are considering the team’s mission rather that the missionsof the individual team members.
How can the team achieve its mission? Obviously, it needs to determine how it willknow when it has achieved the mission. The team may decide that one indicator of beingthe country’s best team would be to come top of the country’s premier football league.Another possible indicator, a more exacting one, would be to come top of the league forseveral years consecutively.
Assuming the team chooses the indicator of topping the league for the current year, itsambitions are now becoming a little more ‘concrete’ – the team now is agreed on what itmust do to consider itself successful. The team could, of course, achieve its ambition in anumber of ways, including ‘fixing’ matches, but let us assume that it has honourable
88 MANAGEMENT ACCOUNTING
Table 4.2 Some attempts at defining some common terms used inmanagement accounting
Coombs-04.qxd 3/18/2005 1:08 PM Page 88

intentions. Also, let us assume that the mission agreed by the team is also agreed by itsmanager, financiers and supporters. The issue of identifying missions, objectives andplans that all affected parties can agree to is a particularly difficult issue in practice.
In this analogy, then, the team has identified its mission (being the best football teamin the country) and an indicator of when it will have achieved that mission. This indica-tor (winning the league for this year) can be considered to be the team’s objective. Thisobjective (following our general description of an objective) is specific (you either winthe league or you do not) but non-quantitative (there are no numerical values involved inthe statement of the objective). Additionally, the objective (winning the league this year)has a specific time limit.
How will the team achieve its objective of winning the league this year? Obviously itneeds to win matches. It may not have to win them all, however; much will depend uponthe scoring/points system in place. A strategy for achieving the objective might involvemaking the most of the way in which the points system operates, to the team’s advantage.It would be ideal, of course, to win all matches, but this may be both unrealistic andunnecessary.
Looking at team ambitions at a lower level, the team needs to maximise its successduring matches. It needs to win most of its games. It may therefore set itself a shorter-term target of winning a particular game, or of scoring a certain number of goals in amatch, or of scoring from a certain percentage of penalties. It will plan how to do this byconsidering and forming tactics for each game (and these tactics may change as eachgame develops). An important point here is that each game may require different tacticsand the team must to able to respond flexibly to changing conditions.
Finally, we cannot resist observing that, in any particular football match, the goal is avery specific target at which the ball must be aimed!
The Organisational Planning Process – An Overview
All of this applies equally well to the ‘games that businesses play’. A business will havea mission that may be expressed in a formally written mission statement (at least in thecase of larger, formally managed businesses). Such mission statements might include,for example, ‘to provide world-class products to a world market’ or ‘to be market leaderin logistical services provision’. The longer-term strategy of the business should, logi-cally, be closely focused on achieving the ambitions expressed in the mission statement.Management texts suggest that a business may ‘lose its way’ if the mission, objectivesand lower-level targets are not co-ordinated.
In order to put its longer-term broad strategy into place, the business will set morespecific strategies for marketing, production, human resources, procurement and the like.Each of these strategies will be put into effect in the short term by means of specificplans, performance targets and budgets. Obviously, all of these are forward-looking. Thebusiness also needs to ensure that such plans and targets are adhered to and, if necessary,
THE PLANNING PROCESS – 1 89
Coombs-04.qxd 3/18/2005 1:08 PM Page 89

modified to cope with actual conditions. This is where performance monitoring, feedbackand reporting come into the equation. These processes are discussed in Chapters 7 and 10.Figure 4.1 illustrates the processes described above. Other versions of this diagram maybe found in most business management texts.
The planning process, then, takes place at many levels – strategic, tactical, operational,etc. and the financial aspects of each type of planning may be known as budgets. Budgetsmay be applied at any level, although at the higher levels of strategic and tactical planning,the term financial planning tends to be used in preference to ‘budgeting’.
The Users and Uses of BudgetsAs we have seen above, budgets and budgeting may be applied at any level of manage-ment. The higher levels of financial planning are covered in texts devoted to financialmanagement and investment appraisal such as those by Samuels et al. (1999) and Brealeyand Myers (2002). Here we will be concentrating on medium- to short-term, lower-levelprocesses, generally with a time horizon of one year or less. In practice, the managementaccountant’s work is likely to encompass both short-term budgeting and the longer-termfinancial planning activities.
What is a Budget?
As we have seen, a budget is often thought of as a financial plan. A budget may, however,be expressed not only in financial terms but also in quantitative terms (e.g. budgets forlabour hours, material purchases, or units of sales). Each of these will, however, haveobvious implications for financial outcomes and may be seen as a subset of, or ‘workingpaper’ towards, the related financial budget.
90 MANAGEMENT ACCOUNTING
Mission
Overall strategy
Lower-level strategies
Objectives/goals/aims
Tactics/plans/targets
Monitoring/feedback/reporting
Figure 4.1 The strategy and planning process
Coombs-04.qxd 3/18/2005 1:08 PM Page 90

A budget will describe, as a minimum, estimated amounts (financial and/or non-financial)which will be incurred or earned as the result of a planned course of action and considerthe timing of the incurrence/earning of these amounts.
Who uses Budgets?
Not everyone, of course, is responsible for preparing budgets, but everyone within anorganisation will be affected by them, sometimes without realising it consciously. A man-ager will be required to set budgets for her/his area of responsibility and to manage theprocesses within her/his remit in order to ensure that the budget is achieved. Thus, themanager’s subordinates will each bear an individual responsibility to ensure that aspecific area of activity complies with the values and expectations expressed within theoverall budget.
Budgets are, of course, internal to the organisation and, like most managementaccounting information, do not form part of the organisation’s published financial state-ments. Nevertheless, such budgetary information can be of great use to competitors if theycan obtain it (usually by foul means!).
What are Budgets Used For?
As well as the obvious uses of budgets (to quantify the planning process and to form abasis of performance monitoring) they may have a number of associated, subsidiary uses.These are listed in Table 4.3. Again, a common organisational problem is co-ordinatingthe range of uses/users of budgets in such a way that processes such as pay negotiationsand cash collection do not result in actions that are contrary to the higher-level objec-tives/mission upon which the budget is based – organisational coherence.
THE PLANNING PROCESS – 1 91
Table 4.3 Uses of budgets
Primary uses • quantifying planned resource usage (materials, labour, etc.)• quantifying income generation• quantifying resource procurement (materials, outsourced components,
subcontractors)
Secondary uses • quantifying payment for resources (cash budgeting)• quantifying collections of cash (from debtors, etc.)
Tertiary uses • telling people what they are meant to achieve• basis of negotiation• means of communication• component of reward/payment systems
Coombs-04.qxd 3/18/2005 1:08 PM Page 91

The Budget Preparation Process – General Principles
As we have seen already, budgeting takes place at many levels, although here we will beconsidering a one-year time horizon. Let us consider the yearly budget preparationprocess for a manufacturing organisation. What would be the main questions to beaddressed for an annual budget? An attempt is made to put together some reasonablequestions in Table 4.4.
Obviously, the budget for even a small manufacturing firm can be quite complex.A separate ‘mini-budget’ could be prepared for each of the items in Table 4.4, the size andtiming of many items being dependent or related to a number of other items. For exam-ple, when we pay for materials depends upon the sources from which we purchase themand the characteristics of their credit terms. What materials must be purchased depends
92 MANAGEMENT ACCOUNTING
Table 4.4 Some questions to be asked when preparing a manufacturingfirm’s annual budget
What products are we going to sell?How much of each product are we going to sell?When will we sell the products?Where will the products be sold?If we buy in the products for selling on:
• When will we buy them?• Who will we buy them from?• How much will we pay for them?
If we make the products:
• Materials:
� How much of each material will we need?� Where will we get the materials and when?� How much will we pay for the materials and when?� How much will we buy and how much will we keep in stock?
• Labour:
� How much labour will we use?� How many people of each type will we need?� When will we employ them?� When will we pay them?
• For each type of cost (salaries, insurance, rents/rates, administrative expenses, stationery,phone, heating, lighting, etc.)
� How much will we need?� When will we need it?� Who will supply it?� When will we pay for it?
Coombs-04.qxd 3/18/2005 1:08 PM Page 92

Products Sales units Selling price £/unit
A 240 1000B 360 800C 120 1500
upon on stock policies and usage requirements, which depend, in turn, on productionplans.
Ideally, therefore, budgets at the detailed level should ‘cascade down’ from the higher-level budgets which are closely dovetailed into the organisational objectives. In real life,of course, there will also be an element of ‘bottom-up’ planning. Although the organisa-tion might wish to produce X units of a product, constraints on the materials or labourmay prevent the required number of sales units being produced. An iterative processtherefore ensues in which constraints, objectives and priorities are considered in order toproduce the optimal effect.
Let us use a simple example to illustrate the budgeting process. Exhibit 4.1 demon-strates a budgetary process in a simple manufacturing firm.
Illustration of Budgeting Within a Small Manufacturing Firm
Buddy Ltd has the following basic plans for the forthcoming year:
It is likely that sales of products A and C will be even throughout the year, whereas product Bwill be sold in four equal consignments taking place at the end of each quarter.
All sales will be made on credit terms of 30 days and the opening trade debtors’ positionat the start of the budget year is expected to be £50,000.
All of the company’s products will be manufactured in-house and they have the followingresource requirements:
THE PLANNING PROCESS – 1 93
EXHIBIT4.1
Material X Material YUnits of material Cost per Units of material Cost per
required per unit of required per unit ofProduct unit of production material (£) unit of production material (£)
A 3 50 4 60B 2 3C 4 5
Coombs-04.qxd 3/18/2005 1:08 PM Page 93

Direct labour employees are paid at £5 per hour for a 40-hour week. After taking into accountillness, leave etc., these employees work, on average, for 45 weeks of the year. Ten directlabourers are employed and any hours in excess of those normally available will be paid atan overtime rate of ‘time and a half’ (i.e. 50% above the normal rate). It is intended tomaintain a constant number of direct labour employees throughout the budget year.
In addition to direct costs, the following monthly regular indirect costs are planned:salaries and indirect labour, £10,000; Administration, £8,000. Advertising campaigns areplanned for months 4 and 8 at a cost of £15,000 each.
Suppliers of materials are paid 2 months after the materials are delivered. The openingtrade creditors’ position at the start of the budget year is expected to be £40,000.
Wages and all overheads are paid one month in arrears. Creditors for wages andoverheads are expected to be £25,000 at the start of the budget year.
At the start of the budget year, Buddy Ltd will have the following stocks of its finishedproducts:
At the start of the budgeted year, the following material stocks will be available:
Note that the unit material costs given in the table above are those for the opening stocks,that is, costs relating to the year before the budget period. Thus they will not necessarily bethe same as the unit material costs relating to the budget period. It is intended to reducedirect material stocks by 20% by the end of the budgeted year.
Buddy Ltd’s products have the following direct labour requirements per unit of production:
94 MANAGEMENT ACCOUNTING
Unit cost Total cost
Material Units £ £
X 200 45 9,000Y 100 55 5,500
Products DLH
A 20B 15C 40
Budgeted opening Prime cost Totalstocks of finished per unit cost
Product goods (units) £ £
A 50 500 25,000B 60 350 21,000C 80 650 52,000
Coombs-04.qxd 3/18/2005 1:08 PM Page 94

Buddy Ltd’s budgeting objective here is to make and sell the budgeted quantities at thebudgeted selling prices. We will assume that demand is sufficient for the budgeted salesquantities at the budgeted selling prices, but we will need to check that the company hassufficient resources at its disposal to make the required units of the products.
Before we calculate the required resources, we need to calculate how many units of itsproducts the company needs to make, given the information we have about its opening andclosing budgeted stock levels. The following table may be called a Production budget:
Note that the unit prime costs given in the table above are those for the opening stocks, thatis, costs relating to the year before the budget period. Thus they wil not necessarily be thesame as the unit prime costs relating to the budget period. Buddy Ltd intends to increase itsfinished goods stocks to 100 units of each product by the end of the budget year.
Let us follow the process of preparing Buddy Ltd’s budgets for the forthcoming year. Thebasic approach is illustrated in Figure 4.2.
THE PLANNING PROCESS – 1 95
Define objective
Identify limiting factor
Prepare limiting factor budget
Prepare subsidiary budgets
Prepare master budget
Consider acceptability of master budget
Figure 4.2 Buddy Ltd’s budgeting process
ProductA B C
Budgeted sales units 240 360 120
Budgeted closing stocksof finished goods 100 100 100
340 460 220
less Opening stock available (50) (60) (80)
= Required units of production 290 400 140
Coombs-04.qxd 3/18/2005 1:08 PM Page 95

For the purposes of this illustration, we will assume that Buddy Ltd can find adequate sup-plies of these materials and hence that materials availability is not a limiting factor. If it werea limiting factor, Buddy Ltd would need to rethink its budget and consider issues such as:
• Should fewer units of both products (or a different mix of products) be made?• Should it buy in finished products in order to make up for the shortfall of available
materials?
We can see now that Buddy Ltd needs (870 + 800 + 560 =) 2230 units of material X and(1160 + 1200 + 700 =) 3060 units of material Y. We can therefore calculate the amounts ofeach material that Buddy Ltd needs to purchase, taking into account its budgeted openingand closing stock levels:
Next, now that we know the quantities of each product that Buddy Ltd will have tomanufacture, we can turn our attention to the materials that will be required to produce theproducts. What are Buddy Ltd’s materials requirements?
96 MANAGEMENT ACCOUNTING
Product
A B C
Budgeted units of production 290 400 140Units of material requiredper unit of production: X 3 2 4
Y 4 3 5Budgeted total units ofeach material required: X 870 800 560
Y 1160 1200 700
X Y
Units of material needed for production(see above calculations) 2230 3060
add Budgeted closing stock(taking account of the intended 20% decrease) 160 80
2390 3140
less Opening stock available (200) (100)Therefore, material purchases required(in units) = 2190 3040
Coombs-04.qxd 3/18/2005 1:08 PM Page 96

Note that we are assuming that Buddy Ltd has only one type of direct labour working in onlyone department. If there was a mix of different labour types, operating within a number of dif-ferent departments, each having its own limitations, then this example would be somewhatmore complicated – and a lot more like real life!
The second stage in the budgeting process (Figure 4.2) was identifying the limiting factor.We have assumed that demand is sufficient to allow Buddy Ltd to sell its budgeted salesquantities and that sufficient materials supplies are available. What about labour availability?Well, we are informed that if insufficient labour hours are available within normal hours,Buddy Ltd will be able to use overtime hours to make up the shortfall. So, it appears thatthere are no limiting factors here. Demand, materials availability and labour capacity canall be dealt with.
There are, however, practical limits to such capacity. Should demand for Buddy Ltd’sproducts surge, then sufficient materials may be difficult to obtain. Similarly, there areobvious limits to the extent to which the labour force can work overtime, including social andlegal implications. Of course, materials shortages can often be overcome by substitutingmaterials or by outsourcing, as outlined above. Labour shortages might, in the longer term,be overcome by product redesign or by the recruiting of further employees.
In the present example, given that there are no obvious limitations on materials or labour,then the budget is driven by how much is produced, which in turn is driven by the level ofdemand. Effectively, sales demand is the limiting factor and hence the sales budget is thebudget out of which all the other budgets are constructed.
Let us check on the requirements for direct labour:
• Should it redesign the products in order to utilise different, but readily available materials?• Would Buddy Ltd be able to obtain more materials if it was prepared to pay a higher
price for them, or pay for them more quickly?
We can also now calculate the cost of purchasing the required materials:
THE PLANNING PROCESS – 1 97
X Y Total
Purchase requirements (units): 2190 3040Purchase cost per unit £50 £60Purchase cost £109,500 £182,400 £291,900
Product
A B C Total
Budgeted production units 290 400 140Labour hours required per unit 20 15 40Total labour hours required 5,800 6,000 5,600 17,400
Coombs-04.qxd 3/18/2005 1:08 PM Page 97

Now that we have done most of the ‘hard thinking’, we can now start to put together thebudgets for Buddy Ltd. As production, and most other factors, are even throughout the year, weshall produce a budget for the year as a whole. Although sales of product B take place at theend of each quarter, this will merely have an effect on stock levels within the budget year.
In real life, it is likely that a number of matters would make this simple scenario unlikelyand hence require budgeting on a monthly (or other periodic basis):
• Labour capacity will tend to vary throughout the year, for example during traditionalholiday periods and because of sickness. Stocks would therefore need to be built up tocompensate for lack of production during those periods.
• Demand may be seasonal.
Let us now put together the budgets in the order suggested by Figure 4.2. First, the salesbudget:
Does Buddy Ltd have enough capacity within normal hours to produce the required units? Thiscan be ascertained easily. Buddy Ltd’s available direct labour capacity is 10 direct labourers ×38 hours per week × 45 weeks per year = 17,100 direct labour hours. So we can see thatBuddy Ltd has a shortfall of (17,400–17,100=) 300 direct labour hours. This shortfall can,however, be made up for by overtime working and these overtime hours will be paid at theovertime rate of 1.5 × the normal hourly rate. Therefore, the budgeted direct labour cost willbe 17,400 × £5/hr = £87,000.
A additionally, there will be an overtime premium overhead cost of 300 hours × 50% × £5/hr =£750. Note that the budgeted overtime premium cost is treated as an overhead, rather than asa direct labour cost, as it is not a regular feature of the production process. Should there be acontinued and increasing need for overtime working, it is likely that the company would review itsdirect labour requirements.
We have already identified one budgeted overhead cost, an overtime premium cost of£750. What other overheads does Buddy Ltd have? The only other overheads identified withinthis example are:
98 MANAGEMENT ACCOUNTING
£/month £/year
Salaries and indirect labour 10,000 120,000Administration costs 8,000 96,000Advertising campaigns: 2 at £15,000 each 30,000
Product A Product B Product C Total£ £ £ £
Sales 240 × £1,000 240,000360 × £800 288,000
120 × £1,500 180,000708,000
Coombs-04.qxd 3/18/2005 1:08 PM Page 98

Finally, the materials usage budget:
What about the cost of these materials? We know, from the materials usage budget,what the material quantities required are. Where will these materials be obtained?Some, obviously, will be obtained as new purchases. Buddy Ltd will also have a quantityof opening materials stocks at the beginning of the budget period. Let us assume (aswe are not told) that these opening stocks are used equally between products A andC and that (following a first-in, first-out assumption) they are used up before thenewly purchased materials. Thus, the cost of the materials consumed in production willbe a mixture of the cost of opening stocks (which have a different unit cost) and newpurchases:
Next, the production budget:
THE PLANNING PROCESS – 1 99
Product A Product B Product C
Budgeted units ofproduction = 290 400 140
Product A Product B Product C
Units of production(see production budget) 290 400 140
Units Units of Units Units of Units Units ofMaterial material Material material Material materialper unit required per unit required per unit requiredof prod’n of prod’n of prod’n
Material X 3 870 2 800 4 560Material Y 4 1,160 3 1,200 5 700
Product A Product B Product C Total
Material X:Required units of material 870 800 560
£ £ £ £Cost of opening stocks used
100 units × £45 4,500100 units × £45 4,500
(Continued)
Coombs-04.qxd 3/18/2005 1:08 PM Page 99

Finally, here is the direct labour budget:
Here is the materials purchases budget:
100 MANAGEMENT ACCOUNTING
Product A Product B Product C Total
Costs of new purchases Used (balance)
770 × £50 38,500800 × £50 40,000460 × £50 23,000Subtotal 43,000 40,000 27,500 110,500
Material Y:Required units of material 1,160 1,200 700
£ £ £Cost of opening stocks used
50 units × £55 2,75050 units × £55 2,750
Costs of new purchases Used (balance)
1,110 × £60 66,6001,200 × £60 72,000
650 × £60 39,000Subtotal 69,350 72,000 41,750 183,100
Total 112,350 112,000 69,250 293,600
Material X Material Y Total
Purchase requirements (units): 2,190 3,040Purchase cost per unit £50 £60Purchase cost £109,500 £182,400 £291,900
Product A Product B Product C Total
Direct labour hours required: 5,800 6,000 5,600Direct labour cost per hour £5 £5 £5Direct labour cost £29,000 £30,000 £28,000 £87,000
(Continued)
Coombs-04.qxd 3/18/2005 1:08 PM Page 100

The master budget is simply a summary of all the other budgets and often takes the formof set of budgeted accounts. It has little use for control purposes at the detailed level butdoes, at least, show the overall budgeted position (to tell us whether we will make a profit)and allows a check on whether the various detailed budgets come together as a coherentwhole.
As explained earlier, if the overall outcome indicated by the master budget does not meetwith approval, adjustments will be made and a process of iteration will ensue until thebudget is ‘right’. Of course, there is a limit to how many times this process can be carried outbefore the budget is finalised, but the power of modern software and hardware facilitates theprocess well.
Although all of the above calculations might, in practice, be undertaken using spreadsheetsoftware, the larger firm is more likely to apply more systematised software, probablyintegrated with its other financial and non-financial systems. Such software, used bymultinational organisations, is sometimes known as enterprise resource managementsoftware and is rapidly becoming more sophisticated.
Note that here we have not included the usual ‘add-ons’ of employers’ national insurance,pension contributions, and so on, that are often treated as part of the labour rate in practice(as we are not supplied with the requisite information here).
We saw, when producing the direct labour budget, that Buddy Ltd had no spare labourcapacity. The budgeted total cost of the direct labour force to the company is 52 weeks × 38hours × £5/hr × 10 employees = £98,800 (assuming that employees are paid every week,even if ill, on holiday, etc.). But we have calculated that the direct labour cost of production isonly £87,000. The difference of £11,800 represents the cost of holiday pay, sick pay, and soon, and is usually treated as an overhead cost. Another labour-related overhead cost is theovertime premium of £750 that we calculated earlier. So Buddy Ltd’s overhead budget lookslike this:
THE PLANNING PROCESS – 1 101
£ per year
Labour-related overheads: Holiday and sick pay 11,800Overtime premium 750
Salaries and indirect labour £10,000 per month = 120,000Administration £8,000 per month = 96,000Advertising 2 campaigns at £15,000 each = 30,000
Total overhead cost budget 258,550
Coombs-04.qxd 3/18/2005 1:08 PM Page 101

Buddy Ltd’s Budgeted Profit & Loss accountProduct A Product B Product C Total
Sales Units 240 360 120£ £ £ £
Revenue 240,000 288,000 180,000 708,000
Cost of salesUnits of production 290 400 140
£ £ £ £Cost of materials used(see materials budget) 112,350 112,000 69,250 293,600Direct labour cost(see direct labour budget) 29,000 30,000 28,000 87,000Prime cost of production 141,350 142,000 97,250 380,600
addOpening stocks of finished goods, at prime cost (given) 25,000 21,000 52,000 98,000
lessClosing stocks of finished goods, at prime cost*
(49,000) (35,500) (70,000) (154,500)Cost of sales 117,350 127,500 79,250 324,100
Gross profit 383,900less Overhead costs (258,550)
Budgeted net profit 125,350
* Calculation of prime cost per unit of stock produced during the budget period.Assuming a FIFO basis:
Product A Product B Product C£ £ £
Materials: X 3 × £50 1502 × £50 1004 × £50 200
102 MANAGEMENT ACCOUNTING
Coombs-04.qxd 3/18/2005 1:08 PM Page 102

Y 4 × £60 2403 × £60 1805 × £60 300
Labour 20 × £5 10015 × £5 7540 × £5 _____ _____ 200
Prime cost per unit 490 355 700
The budgeted closing finished goods stock of each product is 100 units, so value of closingstocks is:
£Product A 49,000Product B 35,500Product C 70,000Total 154,400
As we are not given details of Buddy Ltd’s opening balance sheet at the start of the budgetperiod, other than for stocks, debtors and creditors, we cannot produce its budgeted balancesheet. We can, however, calculate the effects on Buddy Ltd’s balance sheet during the budgetyear. First, though, we need to produce a cash budget for the year.
£ £InflowsCash from sales: we know that Buddy Ltd intends to make £708,000 of sales during the year. We also know that the opening tradedebtors will be £50,000.
Opening debtors (will be received during the budget year) 50,000+ Sales made 708,000−Closing debtors (not received until after theend of the budget year) = 1/12 × £708,000 = (59,000)= Cash received from sales during budget year 699,000
THE PLANNING PROCESS – 1 103
Coombs-04.qxd 3/18/2005 1:08 PM Page 103

OutflowsMaterial purchasesOpening trade creditors = 40,000+ Materials purchases (all on 2 months’ credit) 291,900− Closing trade creditors = 2/12 × £291,900 = (48,700) [approx]= Cash paid for materials during budget year 283,200
Direct labour and overheadsDirect labour cost 87,000Total overhead cost 258,550Total labour and overhead cost 345,550+ Opening creditor 25,000− Closing creditor = 1/12 × 345,550 = (28,800)= Cash paid out during budget year 341,750
Thus the change in cash resources during the budget year is:
Total inflows − Total outflows = 699,000 − (283,200 + 341,750) = £74,050
Let us now look at the effects of the budget year on Buddy Ltd’s balance sheet:
£ £Assets:Increase in cash 74,050
Increase in trade debtors (59,000 – 50,000) 9,000
(Decrease) in materials stocks:
Closing Openingstocks stocks(calculated) (given)
£ £Material X 160 × £50 = 8,000 9,000Material Y 80 × £60 = 4,800 5,500
12,800 14,500 (1,700)
104 MANAGEMENT ACCOUNTING
Coombs-04.qxd 3/18/2005 1:08 PM Page 104

Increase in finished goods stocks:closing openingstocks stocks(calculated) (given)
£ £Product A 100 × £490 = 49,000 25,000Product B 100 × £355 = 35,500 21,000Product C 100 × £700 = 70,000 52,000
154,500 98,000 56,500
137,850Liabilities:(Increase) in trade creditors
(40,000 − 48,700) = (8,700)
(Increase) in creditors for wages and overheads:
= (25,000 – 28,000) = (3,800)(12,500)
∴Total effect on balance sheet (a net increase in assets) = 125,350
Note that, as we would expect, this increase in budgeted balance sheet net assets is equal tothe budgeted net profit that we have calculated.
So, we have produced the main budget statements for Buddy Ltd as required, but howrealistic has this example really been? A few (!) matters that may go towards complicatingthings for Buddy in real life are given in Table 4.5.
Toll Processing or Contract ManufacturingToll processing is a recent trend in manufacturing industries, particularly multinationalgroups. Previously, a company might have manufactured products or components, or car-ried out a production or refining process, using materials that it has purchased fromanother company within the group. Under a toll processing arrangement, the same oper-ation or processing is undertaken but the materials being worked upon do not changeownership: the processing company undertakes work on materials provided by the cus-tomer company, and returns the processed materials to the customer. Thus, instead of theprevious situation where the materials are purchased from and the processed output soldback to the customer, under toll processing the processing company simply charges thecustomer a ‘tolling fee’ for the services provided.
THE PLANNING PROCESS – 1 105
Coombs-04.qxd 3/18/2005 1:08 PM Page 105

The reasons behind toll processing are varied, ranging from economic effectiveness(in terms of specialisation, decentralisation, or risk management) to tax avoidance/evasion.
106 MANAGEMENT ACCOUNTING
Table 4.5 Some possible complicating factors in real-life budgeting
Possible complications Solution approaches
Vast range of products and a need for careful Strategic approaches to product portfolioallocation of resources to products analysis and application of mathematical
approaches such as linear/integerprogramming
Non-linear relationships between sales price Some mathematical approaches possible.and demand Multi-scenario modelling using advanced
software
Changing goals, targets, tactics, etc., and/or Need for a more flexible, less detailed approachunexpected changes in resource to budgeting. Extensive use of computeravailability. modelling
Multinational buying and selling leading to Need for a co-ordinated modelling approachcomplex effects upon profits, involving input from, and negotiation betweendepending on the geographic all relevant parts of the multinational groupmix of resources and customers
Changes and/or differential effects in Need to take a more flexible approach;inflation rates potential for ‘what if ’ analysis
Potential for reducing labour costs by Budget model to build in various possibilitiesoutsourcing or relocating operations for location, etc., including potentialoverseas implications for other non-labour related
factors, e.g. communications, logistics,treasury
Potential changes in corporate structure Incorporate potential effects (where because of take-overs, etc. foreseeable/quantifiable) into higher-level
models
Changes in pricing/stocking/profit structures Ensure that alternative budgeting because of move to a contract manufacturing models produced. Budgeting approaches (toll processing) organisational set-up used will be basically the same but the
emphasis may change to focus on thecharacteristics of the new set-up,including increased focus on overheads,transfer pricing, service fee structures
Wish to calculate profits at a more detailed Application of a form of absorption product level costing (either traditional or activity-based)
to overhead costs, being careful that the extra ‘information’ produced is reliable/useful
Coombs-04.qxd 3/18/2005 1:08 PM Page 106

Toll processing may take place within any manufacturing or processing industry, andmay take place within groups (e.g. to minimise taxation by taking advantage of differen-tial local tax rates/rules) or between ‘arm’s length’ parties. It is found noticeably withinoil, chemicals, pharmaceuticals and computer industries.
Organisational Contexts andBudgeting Requirements
We have considered the basic budgeting requirements of the manufacturing sector in thepassages above and have examined some of the complications that may arise. Of course,in some countries the services sector has grown rapidly. Similarly, in many ‘advanced’countries, the public sector, measured in terms of employment figures, is larger in sizethan any industrial or other sector. It may therefore appear that the traditional emphasisof management accounting texts upon manufacturing businesses may have an inappro-priate bias. This is true to an extent, but there are a number of ‘extenuating factors’:
• Many of the features of manufacturing and service organisations are similar. Bothsectors, for example:
� use materials (manufacturers to a larger extent)� may outsource resources or processes� use labour, although the ‘admin’ activities will be a higher proportion within
service organisations. The meaning of ‘direct labour’ will vary, though, betweenservice and manufacturing organisations.
� make sales. There is also a degree of cross-over in that, increasingly, in certainsectors such as metals, pharmaceuticals and chemicals, manufacturers may processgoods for others. Such toll manufacturers or contract manufacturers may thereforemanufacture goods in their own right or provide a processing service (or both).
• The processes of setting objectives, aims, goals, etc. and of planning, budgeting, etc.are similar in principle for both manufacturing and service sectors. Any differenceslie in the detail and emphasis within the budgets and plans of each sector.
• The public sector is vast and covers a broad range of organisations. Many of theseorganisations will apply similar approaches to planning/budgeting to those used inthe manufacturing and service sectors. Indeed, in the search for ‘best practice’, UKpublic sector bodies often turn to the manufacturing/service sectors for inspiration.Recently acquired approaches include activity-based costing and balanced score-card approaches to performance management.
• The public sector (particularly the various forms of government) contains specialised,publicly owned, forms of service organisation.
There are, of course, also significant differences between the public sector and othersectors. As stated above, the public sector is ‘publicly owned’ in that it is financed bypublic contributions. Hence, its objectives and goals should reflect public wishes. It is
THE PLANNING PROCESS – 1 107
Coombs-04.qxd 3/18/2005 1:08 PM Page 107

thus inappropriate for public sector organisations to follow an overall objective of profitmaximisation to the detriment of social objectives and considerations. The budgetingmodels illustrated above still apply, but the objective is more likely to be framed in termsof such matters as minimising cost, optimising service provision, and optimising quality.Profit (or, more precisely, cost reduction) becomes more of a limiting factor than an objectivein itself.
One further significant factor of some public sector organisations is that of incre-mentalism. Incrementalism is a name given to the public sector’s tendency to takea short-term, year-by-year approach to budgeting (see Coombs and Jenkins, 2002).Basically, because of a government’s need to control costs within the framework oflong-term social and economic objectives, there may be a tendency to impose top-down‘caps’ (i.e. upper limits) on expenditure. This in itself is not necessarily a problem(except that it may result in a rather short-term bias). However, in some publicsector organisations, a failure to use (i.e. spend) the allocate budget limit will lead to a reduction in the following year’s allocation of funding to that part of the organisation,resulting in a gradual and continuous upward ‘creep’ in spending. A failure to allow adepartment to benefit directly from its cost savings or income-generating activities canlead to similar consequences.
In the public sector (but not only in the public sector – similar characteristics may beexhibited in many large companies) over-formalisation of planning systems often occurs.This may lead to a high degree of bureaucracy whereby:
• expenditure may not be committed to a project /service unless it has been plannedand approved well in advance;
• over-rigid rules are enforced regarding the reallocation of budgets from one project/service to another;
• it may be easier to obtain authorisation for smaller-scope projects than for moremeaningful/strategically important projects.
Such features may lead to ineffectiveness creeping into the organisation, with an increas-ing emphasis on short-term and less strategic issues. Limiting factors are often imposedfrom within the organisation rather than from without it. Labour availability, for example,may be more a matter of limits imposed on the maximum size of a department than ofhow much labour is available in the external labour market.
Having said all of this, things are changing and successive governments have madeefforts to become more effective, efficient and economical, though not always success-fully. Recent years have seen much criticism of efforts to improve effectiveness of sectorssuch as public health, public transport and education. Moves are also afoot in the UKpublic sector to align accounting practice with the ‘best practice’ of the private sectors,although much of this emphasis (e.g. via the Resource Accounting Manual, maintained bythe Financial Reporting Advisory Board) is on financial rather than management accountingissues.
108 MANAGEMENT ACCOUNTING
Coombs-04.qxd 3/18/2005 1:08 PM Page 108

Behavioural Consequences of BudgetaryControl Systems
Obviously, planning and control systems are linked inextricably to the ways in whichpeople behave. Such systems consider and deal with what people are meant to do (mis-sions, objectives, goals, etc.), how they should do it (plans), what they should allocateresources to (budgets) and how well they do it (budgetary control mechanisms). As thiswas such an obvious area for research into the social aspects of budgeting, it was one ofthe first ‘growth areas’ in management accounting research, leading to a wealth of laterresearch. Some of this research is outlined below and covered more extensively in therecommended further reading section.
Amigoni (1978) attempted to prepare a conceptual framework for the design of manage-ment control systems which was tailored to corporate and environmental characteristics. Heclaimed that there were two main factors for consideration, the degree of complexity andthe degree of discontinuity that existed within the business system/environment. He sug-gested that management control systems research should concentrate on how to deal withcomplex companies in highly turbulent environments. Effectively, Amigoni argued that, asregards budgeting and control systems, it was not a case of ‘one size fits all’. The controlsystem, the plans that it contains, and its degree of flexibility must all be carefully tailoredto have optimal relevance to the particular organisation and its current and future environ-ment. This does not mean that every aspect of a budgetary system must be complex, at leastnot more complex than is necessary to achieve the intended outcomes.
Otley and Berry (1980) argue that many of the theories of accounting control and organi-sation are outdated and that several issues need to be resolved before the cybernetic (closed-loop feedback) control model can be applied confidently to accounting information systems.They argue that control and organisation are unclear concepts and that objectives may changeover time. Otley and Berry draw attention to how the different types/natures of organisation(normative, instrumental, coercive) may impact on the required nature and information ofcontrol systems. They draw attention to the role of power relationships within organisationsand the impact that these may have on the nature and outcomes of control systems. Otley andBerry argue that most management accounting information systems fail to produce predic-tive information for problem-solving because of difficulties in obtaining data. They thereforeargue for a contingent approach to systems design. They identify the practical problems ofidentifying the conditions for control (objective, measuring device, predictive model, choiceof alternative actions) and the need for compromise or consensus in the real world. They con-clude that a holistic approach to control is optimal. In essence, Otley and Berry make a similarcase for ‘tailored’ systems to that of Amigoni.
Briers and Hirst (1990) provide an extensive review of the literature in this area andattempt to assemble an analytical framework using supervisory style as the key independentvariable. They point, particularly, to the piecemeal, selective and method-driven nature ofprevious studies and to these studies’ overdependence on statistical analysis and subsequentinference. They argue that, while a contingency theory underpinning (see Chapter 7) is
THE PLANNING PROCESS – 1 109
Coombs-04.qxd 3/18/2005 1:08 PM Page 109

common in this area, they have some concerns about contingency theory’s lack of conceptualclarity and the ambiguity of constructs such as ‘environmental uncertainty’, ‘job perfor-mance’ and ‘budget performance’ and their interrelationships. They argue that the effects ofthe choice of supervisory style are ‘neither a simple nor inevitable consequence of a partic-ular supervisory style’. Briers and Hurst then attempt to identify possible factors uponwhich the optimal control system design would be contingent. They make reasonably clearthat the application of a ‘tailored’, contingency theory approach is neither easy nor obvious.
ConclusionsThis chapter has:
• reviewed terms such as strategy, mission, objectives, goals and aims, and emphasisedthe need for clarity of meaning;
• shown that effective budgeting depends on setting clear objectives, reliable moni-toring and feedback systems and effective reporting;
• argued that budgets affect everyone in an organisation, whether they are involved insetting or being assessed by them;
• stated that budgetary practices may vary depending upon the organisation andenvironmental setting;
• shown that budgets may have unintended consequences if used inappropriately.
SummaryIn this chapter we have focused on the budgetary control aspects of management account-ing. We have considered the scope for confusion that may arise from the use of wordssuch as strategy, goals, aims, missions and target, and urged the management accountantto specify meanings where possible. Budgeting is an activity that links these terms andpermeates all levels of all organisations.
We have seen that budgetary control depends upon clear objectives and the implemen-tation of effective monitoring systems. We looked, in some depth, at the typical activitiesinvolves in producing a master budget for a typical organisation. Budgets were seen to havea wide range of uses, from control to communication. Finally, we observed that a varietyof views exist upon the nature, requisites and possible outcomes of budgetary practices.
Recommended Further Reading Amigoni, F. (1978) ‘Planning management control systems’, Journal of BusinessFinance and Accounting, 5(3): 279–292.Amigoni attempts to prepare a conceptual framework for the design of management con-trol systems which is tailored to corporate and environmental characteristics. He claims
110 MANAGEMENT ACCOUNTING
Coombs-04.qxd 3/18/2005 1:08 PM Page 110

that there are two main factors for consideration: the degree of complexity and the degreeof discontinuity. The former takes into account:
• independent variables, such as the company’s structural complexity and degree ofenvironmental turbulence;
• distinctive features, such as detail, relevance, formality and control style;• control tools, such as financial accounts, ratios, management accounts, and budgets.
The degree of discontinuity is concerned with the adaptability of the system: if theassumptions about the economic scenario are wrong, or change frequently, the systemwill be unable to adapt.
Amigoni argues that the distinctive features of management control systems are asfollows:
• degree of detail in management accounting information, e.g. product/divisionalanalysis;
• degree of relevance (to individual managers);• degree of selectivity – the greater the selectivity, the higher the ratio of relevant to
irrelevant information, i.e. the better the system is;• degree of formal responsibility;• degree of procedural rigidity – ‘standard’ v. ‘contingency’ systems;• style of control – tight v. loose (socially/individually aware managers);• quickness (between event and management response);• orientation (to the past or to the future).
He suggests connections between environmental variables and management controlsystem features. A stable environment has
• lots of business units and communications, therefore more detailed systems andoutput orientation;
• more complex organisational structures, therefore more system relevance, selectivityand degree of detail at lower levels;
• a higher degree of formal responsibility and procedural rigidity, and a tightercontrol style.
A turbulent environment, on the other hand, is a more discontinuous one, with systemsoriented to future and a high degree of quickness.
According to Amigoni:
• cost accounting increases the relevance of information and increases formalresponsibility;
• budgeting (with responsibility accounting) increases formal responsibility,increases procedural rigidity (often with ‘tight’ style) and has limited orientation tothe future (although the use of NPV analysis increases future orientation).
THE PLANNING PROCESS – 1 111
Coombs-04.qxd 3/18/2005 1:08 PM Page 111

He suggests that management control systems research should concentrate on how to dealwith complex companies in highly turbulent environments (see also Preston, 1995).
Otley and Berry (1980) ‘Control, organisations and accounting’, Accounting,Organisations and Society, 5(2): 231–244.Otley and Bory argue that many of the theories of accounting control and organisation areoutdated and that several issues need to be resolved before the cybernetic (closed-loopfeedback) control model can be applied confidently to accounting information systems.They make some suggestions for research in this respect.
Control is an unclear concept, argue Otley and Berry. They discuss the various possiblemotivators for control systems, such as domination vs. regulation, monitoring vs. taking actionand so on. Additionally, the idea of the ‘organisation’, they maintain, is unclear. Organisationsare ‘social constructs’ continually evolving and modifying to adapt to their situations and thateven organisational objectives may change over time. Otley and Berry explore the concepts ofplanning and control. They suggest that planning may be seen as ‘future control’ or that ‘con-trol’ may, in fact, be seen to contain both the components of planning and control.
Otley and Berry further discuss the types of organisational nature that may exist, refer-ring to the earlier work of Amitai Etzioni, who established that organisations may haveseveral natures – normative, instrumental or coercive. The nature of the organisation has,of course, implications for the required control systems and the information to be pro-duced. Additionally, the role of power within the organisation would need to be accountedfor within the control system’s design. Otley and Berry refer to the work of Stafford Beerwho criticised the naïve ideas of causality accepted by many observers, i.e. to what extentcan organisations/control be modelled by mathematical models or replicated in humanorganisms? They argue that most management accounting information systems fail toproduce predictive information for the ‘problem-solving’ function of management becauseof obvious difficulties in obtaining the data. They argue for a contingent approach todesigning management accounting information systems and that little research has beencarried out in this respect.
They refer to Keith Tocher’s four conditions for control – an objective, a measuringdevice, a predictive model, and a choice of alternative actions – but ask how easy is it todefine/design these in practice. (They also refer to Vickers’ more detailed control processmodel.) Such models, they comment, pay little attention to notions of compromise or con-sensus as found in the real world (or domination, power, encouragement or agencyaspects) and the accountant’s role/position in all of this.
They go on to look, in more depth, at Tocher’s four conditions for control, examiningthe problems involved, for example:
1. Objectives – problems of defining, deriving or clarifying,2. Measuring devices – necessarily simplistic/reductionist – but representative
surrogates?3. Predictive models – are they ever complete/reliable? Accounting measures are only
a small part of the whole, and 4. Choices of action – identification and persuasion to change are both prerequisites.
112 MANAGEMENT ACCOUNTING
Coombs-04.qxd 3/18/2005 1:08 PM Page 112

Otley and Berry conclude that a holistic approach to control would be best and thataccounting procedures, although presently inadequate, may prove to be the best basis forsuch development.
Briers, M. and Hirst, M. (1990) ‘The role of budgetary information inperformance evaluation’, Accounting, Organisations and Society,15(4): 373–398.Briers and Hirst provide an extensive review of the literature in this area and attempt toassemble an analytical framework which, using supervisory style as their key independentvariable, categorises other variables involved into those which are:
• antecedents – having a causal effect upon supervisory style;• moderators – where supervisory style is thought to depend on their value;• intervening – if they are both affected by supervisory style and also have a causal
effect on the dependent variable of interest (e.g. dysfunctional behaviour, job perfor-mance, budgetary performance).
They argue that, while their literature review indicates the complexity of their area ofstudy and that, generally, a contingency approach seems to have found favour, previouswriting has demonstrated failings conceptually and methodologically. They point, partic-ularly, to the piecemeal, selective and method-driven nature of previous studies and theiroverdependence on statistical analysis and subsequent inference.
Briers and Hirst also point to the conflicts between earlier analyses and make somesuggestions as to possible causes of such conflicts. They draw attention to the difficultiesin identifying the nature/interrelationships and significance of the variables identified inearlier studies, which include:
• technical features of systems;• styles of use;• implications of participation/pseudoparticipation;• economic conditions;• environmental uncertainty;• degree of multidimensional communication;• degree of existence of informal information systems;• the nature of interpersonal relationships;• the time focus of performance management systems (short or long term)• the degree of task uncertainty;• business strategy (defender, prospector, analyser);• business culture/philosophy;• the role of technology;• budget emphasis and budget pressure, etc.
They argue that, while a contingency theory underpinning is common in this area, theyhave some concerns about it:
THE PLANNING PROCESS – 1 113
Coombs-04.qxd 3/18/2005 1:08 PM Page 113

• a lack of conceptual clarity (what exactly is contingency theory?);• a lack of clarity in the understanding of the nature of change;• the ambiguity of constructs such as ‘environmental uncertainty’, ‘job performance’
and budget performance’ and their interrelationships.
They conclude that ‘the use made of accounting information in performance measurementis neither a simple nor inevitable consequence of its availability’ and that the effects of thechoice of supervisory style are ‘neither a simple or inevitable consequence of a particularsupervisory style’. Whilst their study is intellectually demanding, it does provide a usefulchecklist of the factors which may impact on performance evaluation.
Case Study: Budget Preparation
SIG PLC manufactures two types of crampon: peaks and grips. The current factorymanager, E. Whymper, formed the company in 1986. The company uses a standard costsystem and fully absorbs factory overheads into the cost of production. Closing stocks offinished goods are valued at the standard cost of production. Production and sales areplanned to be at the same monthly level throughout the year 2002.
The estimated balance sheet for the year ended 31 December 2001 is as follows:
SIG PLCBalance Sheet as at 31 December 2001
Assets employed £000 £000 £000Fixed assets Cost Depn NetPlant and machinery 700 140 560
Current assetsStockRaw materials 53Finished goods 80 133Debtors 30Cash 109
272
less Current liabilitiesCreditors 12Proposed dividend 60Provision for taxation 13 85Working capital 187
747
114 MANAGEMENT ACCOUNTING
Coombs-04.qxd 3/18/2005 1:08 PM Page 114

The following numbers of direct employees work in each of the production depart-ments: machining, 22; finishing, 10. All employees work a 38-hour week and receive paidleave for 5 statutory bank holidays and 15 additional days per year. The normal workingweek is five days. Any overtime is paid at time and a half.
Factory overheads are fully absorbed into production, using direct labour hours. At theplanned output levels the following costs are forecast:
£000Indirect labour 30Indirect materials 22
Financed byShare capital 646Retained profit 101
747
The following information has been obtained for the purpose of preparing the budgetfor the year ending 31 December 2002:
Sales Forecast Peaks GripsPlanned selling price per unit £110 £130Forecast sales volume (units) 6,400 4,200
Direct CostsThe following standard costs have been estimated for the year 2002.Materials £
Teal (per kilogram) 9Spake (per litre) 5
Direct labour £/hourMachining department 6Finishing department 5
The standard direct material and standard direct labour content of each unit of thefinished product is as follows:
THE PLANNING PROCESS – 1 115
Peak Grip
Teal 4 kg 4 kgSpake 3 litres 3.5 litresMachining direct labour 3 hours 4 hoursFinishing direct labour 2 hours 3 hours
Coombs-04.qxd 3/18/2005 1:08 PM Page 115

Forecast selling and administrative expenses (in thousands of pounds) are as follows:
Selling expensesSalaries 43Advertising 20
Administrative expensesOffice salaries 34Sundry expenses 10Professional fees 5
The following stock forecasts are available:
Repairs 11Rates 22Canteen 16Depreciation 70Heat and light 3Power 6Factory management 49
The factory has three cost centres: machining department, finishing department and ageneral service department. Data relating to these three cost units for 2002 are as follows:
116 MANAGEMENT ACCOUNTING
Data Machining dept. Finishing dept. General service dept.
Indirect labour hours 3500 1000 300Indirect materials £13,000 £5,000 £4,000Repairs £5,000 £4,000 £2,000Factory managers £16,000 £19,000 £14,000Plant and machinery values £600,000 £100,000 0Floor area 2000 sq.metres 500 sq. metres 500 sq. metresMachine hours 5500 1500 0Canteen employees 2
Raw materials Teal (kg) Spake (litres)
Opening stock 5000 (£46,000) 1400 (£7,000)Closing stock 4900 2300
Finished goods Peaks Grips
Opening stock 90 (£5000) 920 (£75,000)Closing stock 700 520
Coombs-04.qxd 3/18/2005 1:08 PM Page 116

The costs of raw materials purchases, direct labour, factory overheads, selling andadministrative expenses will be met in full in cash. At 31 December 2002 it is estimatedthat outstanding debtors and creditors will stand at £23,000 and £21,000, respectively.Tax owing at 31 December 2001 will be paid by 1 September 2002 and proposed divi-dends will be paid in the first three months of 2002. Machinery purchases during the yearare estimated to cost £45,000 and will be paid for.
Any profits are taxed at the rate of 23%.You are required to produce the following budgets and working papers for 2002.
THE PLANNING PROCESS – 1 117
Product Units Selling price £ Revenue £
PeaksGripsBudgeted revenue
Peaks (units) Grips (units)
Forecast salesPlanned finished goods closing stockTotal units requiredLess finished goods opening stockBudgeted production
Production Budget (2)
Sales Budget (1)
Peaks Grips
Raw Content Output Usage of Content Output Usage of Total material per Peak of Peaks raw material per Grip of Grips raw material usage
TealSpakeTotal – – – – – – –
Direct materials used budget (3)
Coombs-04.qxd 3/18/2005 1:08 PM Page 117

118 MANAGEMENT ACCOUNTING
Teal (kg) Spake (litres) Totals
Planned closing stock –Production requirement (3) –Total required –Less: opening stock –Purchase requirement –
£ £ £Cost per unit –Budgeted purchasesAdd o/stock raw mats.
Less c/stock raw mats.Cost raw mats. used
Cost of Direct Materials Purchases and Cost of Usage Budget (4)
Dept./ Labour hrs Units of Total labour Wage rate Total labourProduct per unit output hours per hour costs
£ £MachiningPeaksGripsFinishingPeaksGripsTotals – – –
Direct Labour Budget (5)
Available Idle OvertimeDept. Peak hrs Grip hrs Total hrs Hours time hrs hours
ManFin
Overtime/Idle Time Working Papers Hrs.
Dept. Wages O/T Total T Labour OT Prem Idle T
ManFin
£
Coombs-04.qxd 3/18/2005 1:08 PM Page 118

THE PLANNING PROCESS – 1 119
GeneralTotal Manufacturing Finishing service
Apportionment costs department department departmentbasis £ £ £ £
CanteenDepreciationHeat and lightIndirect labourIndirect mats.ManagementPowerRatesRepairOvertime prem.Idle timeTotal costReapportionmentsTotal costsPlanned activity (hrs.)Rate per hour
Factory Overhead Costs Budget (6)
Peak Grip
Cost perunit (DLH, Cost per Cost perlitre or kg) Units in peak Units in grip
£ one peak £ one grip £
Direct materialsTealSpakeDirect labourMachiningFinishingUnit prime costFactory overhead:
Machining:Finishing
Unit production cost
Standard Manufacturing Cost (7)
Coombs-04.qxd 3/18/2005 1:08 PM Page 119

120 MANAGEMENT ACCOUNTING
Units Unit cost £ Total cost £
Raw materialsTealSpake
Total cost
Finished goodsPeaksGrips
Total cost
Closing Stock Budget (8)
£
Direct materials used (4)Direct labour (5)Factory overhead (6)add Finished goods opening stockless Finished goods closing stockBudgeted cost of goods sold
Cost of Goods Sold Budget (9)
Selling Expenses £ £
SalariesAdvertising
Administrative ExpensesOffice salariesSundryProfessional fees
Totals
Selling and Administrative Expenses Budget (10)
Coombs-04.qxd 3/18/2005 1:08 PM Page 120

Assets Employed £000 £000 £000
Fixed assets Cost Depn NetPlant and machinery
(Continued)
THE PLANNING PROCESS – 1 121
£ £
Opening cash balanceAdd receiptsTotal cash availablePayments
Purchases (4)Direct labour (5)Factory ohead (excluding dep’n) (6)Selling and admin (10)TaxMachinery purchase
Total paymentsBudgeted closing cash balance
Budgeted Cash Flow (11)
£
Sales (1)less Cost of sales (9)Budgeted gross profitless Selling and admin. expenses (10)Budgeted net profit before taxTaxationBudgeted net profit after tax
Budgeted Trading Profit and Loss Account Year Ended 31 December 2001 (12)
Budgeted Balance Sheet as at 31 December 2002 (13)
Coombs-04.qxd 3/18/2005 1:08 PM Page 121

Current assetsStockRaw materialsFinished goodsDebtorsCash
Less Current liabilitiesCreditorsProvision for taxation
Working capital
Net assets employed
Financed by
Share capital
Retained profit: at 31.12.01add Year to 31.12.02
Capital employed
Questions1. The production manager of the company for which you are an assistant accountant
has recently sent you the following memorandum:To: Assistant AccountantFrom: Production ManagerDate: 1 September 2004
Subject: Accounting Terms
I have, as you know, been attempting recently to gain a better understanding of the finan-cial side of our business, particularly in the management accounting area. I should there-fore be grateful if you would explain to me (in simple language) the following matters:
1. Budgets, forecasts and plans: I am unsure as to the differences (if any) betweenthese terms. Would you please explain these differences and the significance thesedifferences would have for me.
2. Budgets and standards: Is a budget the same as a standard? I have always workedon the assumption that it was.
3. Cash budgets: What is the point of producing cash budgets when we already spendan enormous amount of time on producing profit-based budgets? Producing cash
122 MANAGEMENT ACCOUNTING
Budgeted Balance Sheet as at 31 December 2002 (13) (Continued)
Assets Employed £000 £000 £000
Coombs-04.qxd 3/18/2005 1:08 PM Page 122

(a) Prepare a cash budget for the months of October, November and December 2005.(b) Prepare a schedule of outstanding debtors at the end of each of the months of
October, November and December 2005.
4. The Amplifying Manufacturing Co Ltd issued £300,000 of share capital for cash on1 January 2004, the date of its incorporation. In the following two weeks it raised anadditional £50,000 by way of a loan from its local bank and spent £200,000 onmachinery. The machinery is expected to last 10 years. The company rents a factoryat a cost of £10,000 per month, paid on the last day of each month. Additional fixedcosts (excluding depreciation) of £10,000 are paid monthly.
budgets seems superfluous when we are in a profit-making position. Surely cashbudgets are only relevant when a bank overdraft situation is likely?
4. Production budgets: I see that you have once again instructed managers to preparetheir budgets. Is the production of budgets not your department’s responsibility?Line managers have enough of a problem managing without the further burden ofhaving to produce budgets.
Perhaps you could let me have your comments.
Respond to the production manager’s points. Your answer should be in the form of amemorandum.
2. The company you work for has asked you to write an introductory section to itsbudget manual. Some managers have complained that they do not really under-stand the reasons for spending such significant resources on producing budgets.
Write an introductory section for a budget manual entitled ‘The Reasons for PreparingBudgets’.
3. CZD Ltd supply records, tapes and CDs to retail outlets. You are presented withthe following financial information and are required to complete the cash budgetfor the three months ending 31 December 2005.
Opening cash 1/10/05 is £16,000.Creditors give one month’s credit.Salaries are paid in the same month as they are earned.Other expenses are paid one month in arrears and include £2000 depreciation each month.Credit sales are settled 30% in the month of the sale and the remainder one monthfollowing the sale.
THE PLANNING PROCESS – 1 123
Cash sales Credit sales Purchases Salaries ExpensesMonth £ £ £ £ £
September 25,000 40,000 70,000 6,000 7,000October 28,000 45,000 68,000 6,000 7,000November 28,000 40,000 59,000 6,000 7,000December 30,000 38,000 60,000 6,000 7,000
Coombs-04.qxd 3/18/2005 1:08 PM Page 123

The inventories at 30 September 2004 are as follows: leather, 1800 ft; small buckles,2000; large buckles 1200.
In future the company desires month’s end inventories as follows:
Finished goods: 10% of current month’s salesLeather: 40% of current month’s production requirementSmall buckles: 30% of current month’s production requirementLarge buckles: 30% of current month’s production requirement
(a) Prepare a production budget for small and large belts for October and November 2004.(b) Prepare a purchases budget for October and November 2004.(c) Prepare a wages budget for October and November 2004.(d) Comment on the difficulty of obtaining data when production budgets are being prepared.
During its first six months of trading the company expects to sell the following numbersof amplifying widgets: January, 1000; February, 3000; March, 5000; April, 7000; May,9000; and June, 12,000. Of these sales 10% each month will be cash sales; the remainderare on credit, with debtors paying 40% in the month following the sale and 60% in themonth following that. The selling price of each amplifying widget is £12.
The company will produce the following number of widgets each month: January,4000; February, 5000; March, 7000; April, 9000; May, 12,000; June, 15,000. Materialscost £3 per widget and are purchased in the month of production on one month’s credit.Labour costs at £3 per widget are paid in the month of production, as are other variableoverhead costs of £1 per widget.
(a) Prepare monthly budgets for production, cost of materials and direct labourfor the first six months of trading.
(b) Prepare a monthly cash budget for the Amplifying Manufacturing Co Ltd forits first six months of trading. Show clearly the closing cash balance eachmonth and the total cash flows over the period.
5. Belt plc sells men’s and boy’s belts that are cut to order. Each foot or fractionthereof sells for £2. Small belts average 2 feet and large belts average 3 feet inlength. The leather is purchased from a local tannery at 90 pence per foot. Thebuckles are purchased at 50 pence for the small size and 75 pence for the large size.
Direct labour requirements are 10 minutes for a small belt and 15 minutes for a largebelt. Skilled labour costs £5 per hour.
Machine requirements are 5 minutes for a small belt and 6 minutes for a large belt.Machine time costs £6 per hour.
Sales are expected to be 10% more than last year. Last year, the company’s sales duringOctober and November were as follows:
124 MANAGEMENT ACCOUNTING
October November
Small belts 3000 2600Large belts 1400 1500
Coombs-04.qxd 3/18/2005 1:08 PM Page 124

Chapter 5MANAGEMENT ACCOUNTING ANDTHE PLANNING PROCESS – 2
By the time you have finished studying this chapter, you should be able to:• use and understand specific non-quantitative techniques to estimate costs;• use and understand relevant quantitative techniques to estimate costs;• interpret the results of your analysis and advise management accordingly;• discuss advances in budgetary techniques and their influences in new organisational
environments;• outline a selection of contemporary management accounting approaches and techniques;• appreciate the role and philosophy of just-in-time production as a means of stock
control.
Cost EstimationIt might be assumed that it is reasonable to suggest that the identification of cost behav-iour is relatively straightforward in the business world. This is, however, far from the case,but determining how cost will change with output, or other measures of activity associ-ated with, for example, service delivery, is essential. To give a few examples of the prob-lems encountered:
• Direct labour is often treated as a variable cost. For companies, however, whichretain a static workforce because of the skills possessed and who thus cannot besimply hired and fired, direct labour is treated as a fixed cost.
• Depreciation of assets is suggestive of being a fixed cost yet certain assets are morelikely to be exhausted by production level changes than by time.
Key Learning Objectives
Coombs-05.qxd 3/18/2005 1:08 PM Page 125

• Time has an impact on cost classification, as the longer the time period the morelikely the cost is to become variable.
• Tight budget control systems with positive management intervention are more likelyto keep costs under control than weaker systems.
The first section of this chapter is thus concerned with developing an understanding ofthese issues given their actual and potential impact on managerial decision making. Webegin with relatively straightforward techniques before moving on to discuss techniquesusing more quantitative analysis.
Engineering MethodsUnder this system of estimating cost behaviour a study is undertaken of the technologicalrelationships between outputs and the inputs required to achieve those outputs. Various tech-niques are used associated with work study and time and motion methods. By their naturethey are more practical where there is a significant repetition of a manufacturing productiveprocess, although they can be applied equally well to administrative and selling functions.The disadvantages of using engineering methods, however, are associated with attemptingto measure overhead costs. In addition, in recent years as UK manufacturing has gone intodecline, such techniques may not be as relevant. Those large-scale manufacturing businesseswhich remain in the UK are no longer huge employers of labour but are likely to have highlyautomated production techniques with a major emphasis on the identification and controllingof overheads for which the engineering method is not ideally suited.
Inspection of AccountsUnder this system the accountant and manager classify each item as wholly fixed, whollyvariable, semi-variable or semi-fixed. This process is clearly subjective and different indi-viduals might get different results even if the technical reasons for the alternative choicescan be fully justified. This analysis might well be based on historical data; however, indecision making managers are dealing with the future, with all its complexities and uncer-tainties. In summary, inspection of accounts methods leads to arbitrary decisions and aconsequent potential for lack of precision. As such its approach cannot be recommendedfor use in managerial decision making.
High–Low MethodThis method consists of looking at the period of highest and lowest volumes of produc-tive activity and comparing the cost changes that result from the two levels. This is illus-trated by the following example:
126 MANAGEMENT ACCOUNTING
Coombs-05.qxd 3/18/2005 1:08 PM Page 126

For these data
Variable cost =Change in cost related to change in output
Change in activity level
=£12,500
10,000= £1.25 per unit
Fixed cost = Total cost − (Number of units × Variable cost per unit)= £25,000 − (10,000 × £1.25)= £12,500
This method assumes a straight line relationship between costs and output levels lyingbetween the two observations. This may of course be incorrect as by taking extremes (thehighest and lowest) these production levels and their associated cost behaviours may beatypical and thus unrepresentative. While the method may have the advantage of simplic-ity, it cannot be recommended.
Mathematical MethodsThese methods centre on the technique of regression analysis. In their simplest form, the rel-evant costs and the related cost driver data can be plotted on a graph and a ‘line of best fit’drawn in by eye. While this method is simple to use and provides a visual indicator of howcosts depend on their driver, the process is subjective and can thus give different results.
The most appropriate method therefore is one involving mathematical equations,although today the development of packages such as Microsoft Excel makes it easier tomanipulate the numbers. The process involves deriving a regression equation which isused to identify the relationship between cost (the dependent variable) and cost driver (theindependent variable). This driver is an activity measure (number of direct labour hours,number of machine hours, etc.). The model can be adopted for use with a single inde-pendent variable (simple regression) or where there are two or more independent vari-ables (multiple regression).
Table 5.1 shows maintenance costs and direct machine hours for the last 10 accountingperiods for a company. It is assumed for the purpose of this exercise that maintenancecosts are correlated with machine hours. Maintenance costs are the dependent variable (Y)
THE PLANNING PROCESS – 2 127
Lowest Highest
Volume of production 10,000 20,000Cost (£) 25,000 37,500
and
Coombs-05.qxd 3/18/2005 1:08 PM Page 127

and machine hours the independent variable (X). While the graph based on the informationin this table in Figure 5.1 has been produced using Excel, what follows is the detail of thecalculation to show how the technique may be applied. Table 5.2 shows the regression cal-culations that would be performed by Excel to ultimately produce the graph discussedlater in this section.
128 MANAGEMENT ACCOUNTING
Table 5.1 Total maintenance costs and direct machine hours for the past10 accounting periods
Direct machine hours Maintenance costsAccounting period X Y
1 990 20602 920 19803 690 16504 770 17105 860 20206 550 17507 450 16508 320 16609 250 1570
10 290 1680
y = 0.5464x+ 1440.2R2 = 0.7162
0
500
1000
1500
2000
2500
0 200 400 600 800 1000 1200
Machine Hours
Mai
nten
ance
Cos
ts
Series1 Linear (Series1)
Figure 5.1 Graph of maintenance costs against direct machine hours
Coombs-05.qxd 3/18/2005 1:08 PM Page 128

The regression line is the ‘line of best fit’ and is that line which when compared with otherpossible lines is that one which minimises the square of the vertical deviations from theobserved points. The equations used are:
Σy = na + bΣx,
Σxy = aΣx + bΣx2.
In the above formula n is the number of observations, in this example 10. Substituting thedata in Table 5.2,
17,730 = 10a + 6,090b,11,169,300 = 6,090a + 4,389,100b.
Solving these equations results in an answer of b = 0.55 and a = £1,440, which naturallyagrees with the result obtained using Excel.
This gives us an indication that at 770 hours of activity, maintenance costs are estimatedat £1,863 (£1,440 + 0.55 × 770). In fact they were £1710 and, since the equation is basedon an average, they do not match exactly and it is essential that managers in making adecision based on these data realise how reliable they are.
An indication of reliability is given by (amongst other possible measures) the coeffi-cient of determination (r2). This has been calculated by Excel at 0.7162. This means thatwe can explain 71.62% of the relationship between the two variables. The measure of theassociation between the two variables is referred to as correlation. The square root ofthe coefficient of determination is the correlation coefficient (r). The lower the value of thecoefficient of determination the less the linear relationship. The closer to 1 the strongerthe linear relationship. In this case 28% of the relationship is unexplained by the inde-pendent variable used. Managers would need to consider this when reaching decisions onhow to use this relationship between the variables discovered by the analysis.
THE PLANNING PROCESS – 2 129
Table 5.2 Regression analysis calculations
Direct machine hours Maintenance costsX Y X2 XY
990 2,060 980,100 2,039,400920 1,980 846,400 1,821,600690 1,650 476,100 1,138,500770 1,710 592,900 1,316,700860 2,020 739,600 1,737,200550 1,750 302,500 962,500450 1,650 202,500 742,500320 1,660 102,400 531,200250 1,570 62,500 392,500290 1,680 84,100 487,200
6,090 17,730 4,389,100 11,169,300
Coombs-05.qxd 3/18/2005 1:08 PM Page 129

Other possible methods include the standard error of the estimate and the standard errorof the coefficient (for a fuller explanation see Drury, 2004).
In the example above there was one dependent variable and one independent variable.In reality, a number of variables are likely to influence costs. In the case of machine main-tenance it might include the frequency of the servicing intervals and not just hours ofoperation. Thus what is required is the identification and analysis of all variables whichcan affect cost. This leads to a multiple regression equation of the form
y = a + b1x1 + b2x2 + b3x3 ….
Again, various computer programs exist to solve such equations and report the degree ofreliability managers can place on the results in terms of decisions based on the answerobtained. One further complication is that multiple regression assumes no correlationbetween the independent variables. This condition is called multicollinearity and preventsthe availability of sufficient information to enable the regression coefficients to be deter-mined, although writers such as Kaplan (1982) suggest this problem can be ignored incertain circumstances. To explain further, an example might include a company whichmanufactures a range of closely-related products where each product’s output is treatedas a separate variable, yet in reality, the demand for these products is highly correlated. Inthis situation, the regression coefficients would be meaningless and any predictions, basedon the results obtained from a multiple regression analysis where such relationships exist,would be misleading and potentially dangerous as the wrong decisions could be made.
Finally in this section, we turn to the conditions for applying the techniques above,although they are common to any similar activity:
• Cost and activity data are matched so that they relate to the same period, otherwisewe are not comparing like with like.
• Sufficient observations of cost behaviour are made to support the statistical analysis. • When using data under conditions of inflation the observed costs should be adjusted
to place them on the same price basis. • Any technology changes should also be taken into account. This is known as the
learning curve phenomenon.• Known changes that will take place in the period for which the forecast is being
made should be taken into account.• Recognition should be given to those accounting policies which have the potential to
distort the results. This particularly applies where fixed costs are allocated to produc-tion departments and as such may appear variable when it is known they are fixed.
Advances in Budgetary TechniquesIn the previous chapter we looked at the general principles of the budget preparationprocess and the impact of the organisational context on budgeting requirements. In thissection of this chapter we turn to look at advances in budgetary techniques.
130 MANAGEMENT ACCOUNTING
Coombs-05.qxd 3/18/2005 1:08 PM Page 130

Zero-Based Budgets
Traditional methods of budgeting have taken the current level of operating activity (thebase) as the starting point and then adjusted this starting point for expected changes. Asthese changes are normally made at the margin of the existing budget and do not involvea fundamental review of the base budget, the term incremental budgeting is used todescribe this process. In this context it can be seen that any inefficiencies in the base canbe overlooked. Again we would, however, point out that many industries are under severecost pressure so this may present a somewhat simplistic view of the world, and probablyconsiderably more work goes on reviewing the base budget from the previous period thanmany textbooks appear to suggest.
The alternative solution presented to the problem of inefficiency in the base is termedzero-based budgeting (ZBB) or sometimes priority-based budgeting. As can be imagined,under this system each manager in charge of an authorised programme has to justify eachitem of expense as if the programme was totally new to the organisation. This solutionwould thus reject the concept of an existing base and raise issues over whether the functionshould be performed at all, how it should be performed, how much should it cost to performand so on. Managers are thus constantly questioning the way in which an activity is deliv-ered and if it is to the benefit of their organisation. Advantages of ZBB are as follows:
• ZBB allocates resources according to priorities which managers decide are essentialor less essential.
• As budget allocations are related to business objectives, this results in resourceallocation being improved.
• Managers, in having to defend their budgets, are forced to plan ahead and justifyactivities.
• Managers feel a greater sense of ownership as a result of the process.• ZBB creates a questioning and critical attitude to processes and procedures amongst
managers.• Resources are allocated on the basis of need and benefits received in line with the
objectives of the organisation.
The disadvantages of ZBB are:
• Other than in the smallest organisations, it is not possible from a time basis toconstantly be reappraising activities.
• The organisation could lose sight of its strategic goals if its gets obsessed with ‘navelgazing’.
• The bureaucracy of meetings and reports can overwhelm managers.• In government organisations managers are locked into delivery of certain pro-
grammes by law, although this should not stop them questioning the methods ofdelivery to seek efficiencies.
• In some organisations activities are highly interlinked and difficult to separate. Ina university, for example, staff could teach on a variety of courses, so closing onecourse may not achieve a great deal or may be completely impractical.
THE PLANNING PROCESS – 2 131
Coombs-05.qxd 3/18/2005 1:08 PM Page 131

As a way of mitigating some of the disadvantages the organisation could target certainactivities for a full review, such that over time it covers the organisation as a whole. Thismay work in certain cases. However, in complex organisations such as a university a deci-sion to zero-base the budget of one school or department while ignoring others in fore-casting a particular budget year sounds straightforward, but there can be many complexrelationships with other schools or departments which again overwhelm managers interms of the detail to be considered.
It should also be remembered that there are benefits to the incremental budgetingapproach which can be ignored if a manager focuses on a single technique such as ZBB.One major advantage of incrementalism is that it can minimise conflict as it facilitates theconsensus-produced bargain. It may trade some inefficiencies in that type of budgetprocess for the greater benefit of goal congruence amongst managers. As can be imagined,a core feature of ZBB is the conflict between managers in the fight to gain scarceresources built in as a fundamental principle especially when people’s behavioural char-acteristics are brought into consideration. Thus the qualitative gains of incrementalismin the areas of company harmony could outweigh any minor inefficiencies sacrificedthrough not using ZBB.
Option Budgets
A variation on ZBB that may add to the efficiency with which it can be made to operate isthe use of option budgets. Under this system managers are required to consider how theirdepartment/service would respond to a 5% or 10% cut in expenditure (increases are equallypossible). These options are designed to force managers to think through their policies andoperating procedures by again forcing them to question what they do and how they do it.
Planned Programme Budget Systems
This is a public sector technique which gained some credence in the 1970s as a way for-ward. It is intended to be a fully rational and corporate system. In essence, it attempts toidentify the goals and objectives of the organisation in each area of activity and analysethe results of activities against objectives within programmes. Activities are multidimen-sional and cross traditional departmental boundaries. They are also extend beyond thetime period of a year. Thus the concentration is on programmes which encompass allorganisational endeavours to achieve the specific outcomes that the programme is set upto deliver. Programmes are broken down into objectives, subobjectives and activities tomake a coherent whole. A programme with an objective of delivering care and support forthe elderly, for example, could have health care activities, accommodation activities, edu-cational activities and so on with a range of complex objectives which together should addup to the overall programme objective.
As can be imagined this results in very demanding programme structures which crosstraditional departmental boundaries. It is difficult to allocate activities to programmes, as
132 MANAGEMENT ACCOUNTING
Coombs-05.qxd 3/18/2005 1:08 PM Page 132

some activities will contribute to objectives across a number of potential programmes.Coombs and Jenkins (2002: 93) point out that financial information is equally complexand leads to the allocation of joint costs over a number of programmes with a widevariety of allocation bases available. As a result of these issues, interest in the techniquehas faded.
Formula Budgets
Under the 1988 Education Reform Act in the UK the process of delegating budgets toschools was begun. After taking account of mandatory and discretionary retentions, thelocal authority is required to distribute what remains to schools through the use of a formulato give the individual school budget. The elements which the local authority can retain havebeen reduced over time, thereby transferring more of the education budget to schools.
The elements contained in the formula distribute money on the basis (as appropriate tothe level of education provided by the school) of pupil numbers, sixth-form provision,school meals activities and the provision of nursery education. It is the job of the schooland its governors to balance their expenditure against the funding distributed by the for-mula. It is this requirement to balance which places significant budget pressure onschools. It also impacts on quality in that if a school can, for example, drive up its exam-ination results it can attract pupils in, and with extra pupils come more resources. Thiseffectively introduces to some effect an element of the market system in the budgetprocess for schools. There may, however, be a time lag between attracting any extra pupilsand gaining extra resources, as the school still operates within the local authority budget-ing time framework. Control at the local level is increased as the school has its own bankaccount and therefore increased ownership and control of its delegated budget.
Activity-Based Cost Management
In contrast to the traditional ways of reporting budgets, activity-based cost managementattempts to critically assess costs by activity and to provide managers with informationon why costs are incurred in any process (see also the discussion of activity-based cost-ing in Chapter 3). It also aims to look at the output from that activity. The processconcentrates on cost drivers and divides activities into value-added activities and non-value-added activities. By concentrating on non-value-added activities it is possible in thebudget process to reduce these without impacting on the customer’s use of the product orservice. Managers are thus able to prioritise where they should be reducing waste andinefficiency.
Under the traditional approach to budgeting, costs are allocated against subjective (i.e.judgemental) headings – payroll, premises costs, transport and so on. As has been statedabove, there is no information linking costs with outcomes from the expenditure. Underactivity-based budgets major activities are linked to the resource inputs. In summary, theprocess is as follows:
THE PLANNING PROCESS – 2 133
Coombs-05.qxd 3/18/2005 1:08 PM Page 133

• Identify and define activities and activity pools.• Directly trace costs to activities and cost objects where possible.• Assign costs to activity cost pools.• Calculate activity rates.• Assign costs to cost objects using the activity rates and activity measures.• Prepare necessary reports.
The organisation is now in a position to focus on managing activities as a way of elimi-nating waste and reducing delays and defects. This information can be used to directlyimprove the budgeting and budgetary control processes.
Benchmarking provides a structured approach to identifying the activities with thegreatest room for improvement. In the public sector, for example, many organisationshave formed ‘benchmark clubs’ as a source of information to identify waste and ineffi-ciency. In the private sector trade associations exist to help ensure that efficiency gainscan be achieved but within a confidential information-gathering process. This is not toignore the information that a company can itself generate over time and can access at aparticular point in the budget decision cycle. By examining the number of times a partic-ular activity is set up or the number of engineering changes, attention is focused on areaswhere a detailed study may reduce the volume of such activities and consequently costs.
Within this process, value chain analysis, which links sets of activities from the begin-ning of the production process through to the end use of the product or service, is becom-ing the increasing focus of attention. If each activity in that process is viewed as acustomer–supplier relationship all opinions can be used to improve that process so thatbudgets reflect optimum opinions. It should be recognised that we are stressing cost man-agement as being the key, rather than cost imposition on products and services.
Balanced Scorecard
The objective of the balanced scorecard is to express an organisation’s strategy and missionin a comprehensive set of range of performance measures which provides a framework forimplementing strategy. It inevitably provides a framework against which performanceagainst those measures can be tested over time. It is important to recognise that such aframework is based on measures other than financial. The balanced scorecard is made upby setting four key perspectives – finance, customers, internal business processes, andlearning and growth, although variations are possible. Figure 5.2 shows the balancedscorecard performance matrix for an administrative unit and defines the key areas as:people, to develop and enable people to progress; processes, to aim for continuousimprovement; resources, to use them wisely; and, service, to respond to the needs of cus-tomers. The concept is relatively straightforward to implement:
• Staff from each frontline unit identify the goals that are most critical to their unit’ssuccess.
• They then devise a measure (‘metric’) to track the unit’s performance at achievingeach of these goals.
134 MANAGEMENT ACCOUNTING
Coombs-05.qxd 3/18/2005 1:08 PM Page 134

• The result is staff have created a set of metrics under each of the core values whichis referred to as the unit’s balanced scorecard.
• Finally staff assess progress over time and revise as necessary.
In this example it is these core values which drive the organisation and, taken together,they point out virtually all things the organisation must do to be successful. Each of thework units is seen as achieving success by putting the organisation’s core values into prac-tice and tracking achievement through the metrics.
The term ‘balance’ arises from the desire to balance quantitative and qualitative per-formance measures in both the short term and long term. The scorecard is an attempt toreduce managers’ concentration on short-term changes by emphasising the longer-termconsequences. An emphasis on expenditure in a particular function in the short term isplanned to lead to improvements in non-financial measures such as customer satisfactionwhich will lead to growth in long-term sales and income.
Let us examine the four elements in more detail. The financial perspective could exam-ine the profitability of following a particular strategy. Many businesses aim to reducecosts in comparison with their competitors, or to utilise spare capacity. Target performancewould be set in financial terms for each of these strategies to measure their effect on thebottom line, with initiatives to achieve the strategies. This would be expressed in finan-cial terms so that actual performance can be compared with plan.
The customer perspective identifies the target market segments and measures the com-pany’s success in each area. An objective might be to increase market share. For a multi-product company this could be expressed in terms of increasing a particular segment. For
THE PLANNING PROCESS – 2 135
• Financial Services: YTD actual expenditures minus budgeted expenditures
• Financial Services: % of financial reports distributed on schedule
• Management Info. System: % of time servers and network are ‘up’
Resources
• Financial Services:
• Management Info. System:
% of action items inQuarterly Technologyplan that have beencompleted
% of transactionsprocessed within 7 days
Processes
People
Administrative Unit
Service
(A unit within ASUC Auxiliary)
• Customer satisfaction survey
Average time to first response for help requests
Average time to completion for help requests
• Staff climate survey• Staff individual learning plans• Injury/illness prevention plan• Injury/illness rate
• Management Info. System:
• Management Info. System:
Figure 5.2 Balanced scorecard (University of California – Business and AdministrativeServices)
Coombs-05.qxd 3/18/2005 1:08 PM Page 135

a company such as Sony this might be to increase the share of the plasma TV market.Target performance could then be expressed as a percentage increase in market share asmeasured against actual performance in due course.
The business processes (internal) would be identified, such as improving the yield fromthe raw materials input into a particular manufacturing process. Specific initiatives wouldbe identified to do this and a percentage increase in yield set as a target. Again actualresults could be compared with the target. Targets could be set by benchmarking againstcompetitors. Improvements in the operational process could benefit customers throughbetter quality or improved delivery times, while the bottom line would also improve.
The learning and growth perspective would include developing skills through measuressuch as improved training, with target numbers set to benefit from the training. This couldbe extended to include improved manufacturing processes and enhanced IT.
While presented above as separate paragraphs, each of the processes is linked asimproved training could improve operational business practices which leads to better cus-tomer relationships and finally to a better financial position. It should also be rememberedthat each company, even if operating in the same industry, would have a different score-card depending on its own strategy and assessment. Finally, by invoking a balanced score-card process we should be involving more people in the company, potentially improvingmotivation and a feeling of ‘belonging’ to the process.
The balance scorecard is equally appropriate for use in the public and not-for-profitsectors and is discussed further in Chapter 10.
Business Process Re-engineering
This area concentrates on making substantial changes (or re-engineering) to the businessprocesses which operate within an organisation. Within the business process will be aseries of activities which make up that process. The objective is to concentrate on improve-ment such that the business sees cost reduction, quality improvement and increasedcustomer satisfaction. This can be seen as one element of a balanced scorecard or an activ-ity in its own right.
Economic Value-Added Analysis
Economic value-added analysis aims to measure the value created for shareholders by abusiness unit or company. The objective is that these have an ability to earn more than thecost of capital, and the framework provided allows firms to assess various options toincrease value to shareholders. Trade-offs between reinvesting in existing businesses,investing in new businesses and returning cash to the shareholders can be compared. Inthis process the cost of capital is highly visible to managers and attention can be focusedon making investment decisions which are in the best interests of stockholders. Thismeans that attention is also focused on the disposal of or, improvement in the use of,underutilised assets.
136 MANAGEMENT ACCOUNTING
Coombs-05.qxd 3/18/2005 1:08 PM Page 136

The elements of the technique are the following:
• Determination of income generated by a new business and the extra value createdby the potential investment opportunity.
• Estimation of the return required by shareholders. This requires a calculation of thecost of capital.
• Determination of the economic value added of each business. This is achieved bydeducting the expected return to the shareholders from the value created by the firmor business unit by the new project. This return has to be above that required byshareholders for the investment to take place. This analysis is claimed by its propo-nents to be suitable for one-off major investment decisions or everyday decisionmaking in an enterprise.
Beyond Budgeting
A view is emerging that annual budgeting tends to fix a company’s thinking and responseto events when the world is changing. This limits flexibility in responding to these events.There is an argument that the budget in effect reflects the previous year’s reality, and thisis what locks companies and managers into the past rather than thinking about what is hap-pening to the business in the present. Rolling or perhaps monthly forecasting and budgetsfocus thinking on current and future realities and contexts. This is not seen as managingchange as this is outside the control of the organisation, but rather as an attempt to be aheadof change or more in control of the response to the challenges facing the organisation. Thisimportance may be emphasised in the knowledge-based economies that the western worldhas increasingly developed. Knowledge-based companies face competition which detractsfrom any innovation made particularly in respect of the time horizon for the life of prod-ucts, which is becoming shorter and shorter. Prices are also falling and quality rising. Firmsneed to be operating at the excellent end of the quality spectrum if they are to continue toflourish and be close to their customers. Managers are also talented people in short supply.This type of individual seeks freedom, challenge and responsibility. Traditional time-consuming and ‘legalistic’ budget processes can be off-putting for such persons. The rapidproduction of new solutions to constantly changing issues in the competitive environmentand strategies also depends on attracting and retaining such individuals.
In this view of the world the traditional budget is seen as the fixed point around whichall management processes are based and aligned. This determines how managers behaveand the activities and objectives on which they focus. Annual budgeting is seen as absorb-ing considerable management time, and the monthly budget actual comparisons asprimarily about control. Managers will not exceed their budgets by perhaps spending nec-essary resources outside the planned budget cycle to react to events because their bonusor even their jobs will depend on it. This, in a globally competitive world where, when thebudget was set, circumstances were entirely different from those pertaining when any com-parisons are being made and decisions required. Inflexibility is thus seen as the key fail-ing of traditional budgeting and companies are being urged to move towards continuous
THE PLANNING PROCESS – 2 137
Coombs-05.qxd 3/18/2005 1:08 PM Page 137

rolling forecasting to enable speedy and co-ordinated adaptations to actual and anticipatedchanges in the business environment.
Under rolling monthly forecasts of financial performance and for other non-financialvalue drivers, managers are forced to confront current and future opportunities and risks.In essence, the beyond budgeting model calls for devolving managerial responsibilitywhere power and responsibility go hand in hand. The system:
• creates and fosters a performance climate based on competitive success. Goals areagreed external benchmarks and not internal negotiated fixed targets. The focus ison beating the competition not other managers for a slice of resources.
• motivates people by giving them challenges, responsibilities and clear values asguidelines. Rewards are team-based, recognising that no single person can act aloneto achieve goals.
• devolves performance responsibilities to operational management closer to the ‘coalface’. This uses know-how from the individuals and teams at the customer front toadapt quickly to changing market needs.
• empowers operational managers to act by giving them the capability to do so byremoving resource constraints. Key ratios are set rather than detailed line by linebudgets. Local access to resources is thus based on agreed parameters rather than online by line budget authorisations. This is aimed at speeding up the response tochanging threats and exploiting new opportunities as quickly as possible.
• establishes customer-orientated teams that are accountable for profitable customeroutcomes. Frontline units agree resource and service requirements with serviceunits and standards of service from these departments (service level agreements).
• creates transparent and open information systems throughout the organisation. Theinformation system should provide fast, open and distributed information for multi-level control. The IT system is crucial in flexing the key performance indicators aspart of the rolling forecasting process.
It can be seen that the above represents a private sector view of the world; the legal frame-work of public sector organisations would probably prevent such a system being extended tothem. As with all alternatives, the success of a particular process depends on the needs of theindividual organisation. The alternative of ‘beyond budgeting’ places considerable emphasison organisational and managerial cultural changes, and without these it is doomed to failure.
Just-in-Time Stock Control and Production Systems
It will have been gathered from what has just been said that there have been tremendouschanges in the business environment. These changes show no sign of slowing down – ifanything, the pace of change is quickening. Companies have had to react or cease trading.One of the reactions to change has been to use just-in-time (JIT) stock (inventory) controlsystems. An example of a company which use such methods is Toyota, although it is com-mon among other car-producing companies. In this type of organisation the management
138 MANAGEMENT ACCOUNTING
Coombs-05.qxd 3/18/2005 1:08 PM Page 138

view is that holding stock is a waste of a resource and should be minimised throughcareful planning throughout the supply chain. One obvious saving is the gains in interestearned (or saved on the bank overdraft) through not having money tied up in stock. Otherbenefits include reduction in handling costs, reduced risks of obsolescence of stock,increased production space available and reduced stockholding-related security costs.There may be a reduction in suppliers, saving in paperwork and time, although often therewill be a substantial time commitment invested in the supply chain to ensure everyone isfully aware of the objectives of each party.
JIT production systems are systems where each component is produced immediatelyit is needed in the next stage of production of a product. Production is thus triggered bydemand. At the end of the line is the customer asking for finished product, and it isthe request for supply which triggers everything back to an order for raw materials.Traditional systems tended to be push-through systems in that the budget would predictthat a certain level of sales and production occurred, thus building up stocks of raw mate-rials, work in progress and finished goods.
Features of JIT include:
• production organised in work units or cells;• multi-skilled workers who can perform a variety of tasks and operations;• emphasis on total quality management (TQM) to eliminate defects as such defects
disrupt the planned time cycles and even shut down production altogether;• reduced lead and set-up times;• careful selection of suppliers who deliver on time and to the required quality;• a claimed reduction in paperwork.
TQM, referred to above, is a system designed to continuously improve quality throughfocusing on customer needs and systematic problem solving through teams involvingfrontline workers. If a worker in a production unit or cell discovers a quality problem theproduction line is halted until the problem is solved. JIT creates an urgency to solve theproblem as delays are now costly as there are no (or minimal) buffer stocks to call on.Energies are thus concentrated on:
• identifying in a systematic manner what has gone wrong and planning to avoid ithappening again (planning stage);
• implementing corrective action (perhaps on a small scale first) to prevent ithappening again (doing stage);
• evaluating the results of the change in practice (checking stage);• assessing that the problem has now been solved and, if relevant, extend the agreed
solution to the whole system (action stage).
It should be remembered that JIT is not confined to manufacturing industry but isrelevant to hospitals and even accounting practices (service sector) through the focus onthe customer. In terms of a service industry such as accounting, an important element ofTQM is the customer satisfaction survey.
THE PLANNING PROCESS – 2 139
Coombs-05.qxd 3/18/2005 1:08 PM Page 139

ConclusionsThis chapter has:
• used and developed specific non-quantitative techniques to estimate costs;• examined the quantitative techniques used as a way of estimating costs;• discussed the interpretation of the results of analysis in the context of advice to
management;• outlined advances in budgetary techniques and their influences in new organisa-
tional environments;• reviewed a selection of contemporary management accounting approaches and
techniques;• developed an appreciation of the role and philosophy of just-in-time systems in the
modern business environment.
SummaryThe first part of this chapter pointed out that while the identification of cost and costbehaviour appears to be relatively straightforward in theory, it is far more complex in real-ity. Various methods were explored to help managers identify how costs behave, althougheach has its limitations. The second part of the chapter explored various advances in bud-geting techniques to indicate how the forces of change unleashed by an increasingly com-petitive world were compelling a variety of responses in both private and public sectororganisations. A range of these techniques were explored to allow the reader to gain abroad understanding of the key issues associated with the techniques.
Recommended Further ReadingBurns, J. (2000) ‘The dynamics of accounting change – interplay between newpractices, routines, institutions, power and politics’, Accounting, Auditing andAccountability, 13(5): 566–596.In this paper the author looks at a small chemicals manufacturer (Becks) located in theNorth of England. The company had suffered severe cash-flow problems and conse-quently needed to move towards a results-orientated approach to decision making andcontrol. This approach was supported by new accounting practices imposed by the man-aging director and locally developed accounting solutions by financially aware depart-mental managers. There were still issues about the adoption of the approach particularlyin the product development department (PDD); which was widely seen as doing sciencesimply for its own sake and not for the benefit of the organisation. There were weak, or non-existent, controls in this department over product development and innovation. The primaryfocus of the paper is how the dynamics of accounting change in a unique organisational
140 MANAGEMENT ACCOUNTING
Coombs-05.qxd 3/18/2005 1:08 PM Page 140

setting interacted with organisational culture. Thus the paper is concerned with how andwhy accounting change evolves in the way it does, through time and within the organisa-tional context.
The company was established in the 1970s; by 1995 there were 150 employees andturnover was £20 million. The economic recession of the late 1980s saw demand fallsignificantly, and productive capacity became considerably underutilised. Bankruptcyloomed. This cash-flow crisis, which was caused by primarily external factors, createdrecognition for and stimulated the need to change. Much of the company’s traditionalbusiness was in so-called ‘captives’ companies locked in by period contracts. Asthe external market for chemicals changed these organisations failed to renew contracts,creating considerably underutilised capacity. The bank was unwilling to extend theoverdraft, forcing the company to seek alternative sources of finance. The marketingdepartment stated the experience was ‘like a Siberian wind blowing straight throughyou’ making the company realise that ‘it was a small and very vulnerable business’(p. 575).
In addition to revising other strategies, greater emphasis was placed on developing newproducts internally. This affected the PDD in that it had to develop more products whichcould be sold successfully within more acceptable timescales. The board felt, given legalissues, that product costs could not readily be reduced and an alternative sales and marketfocus was needed. Production costs had already been cut as much as possible.
Becks wished to see the PDD recognising its profit role. New accounting techniqueswere introduced to increase awareness of profitability and to prioritise new productswhich could be brought to market faster. Scientific expertise was thus supplemented byattempting to develop accounting ways of thinking about profit and cost. This requirednew reports and reporting processes. Analysis was thus required to establish the basisfrom which the results-orientated approach could be developed. The initial investigationrevealed that about 50–60% of time was spent on research (primary tasks) and 40–50%on administration (secondary tasks). Only one product which had been developed in theperiod of study was seen as making an acceptable return. The change in approach sawchemicals, yields and products being expressed in terms of ‘pound notes’ (p. 578). Thisincluded emphasis on start and finish dates, hours devoted to the project, costs, technicaldifficulty of the process, and so on. A target of 75% of scientific time on primary taskswas set. In this process the managing director drove change through the exercise of powerwithin the company. This was backed by his accounting expertise. The essence of suchchallenges to the PDD was to translate technical scientific feedback at board level intorecognition of what the PDD was contributing to profit and results. The paper claims thatthrough the skilful manipulation of accounting terms the board was convinced of the needfor and desirability of new accounting.
In the context of this chapter the paper illustrates that the mobilisation of power isneeded to effect change, even where such change is essential for the survival of the organ-isation. Such power was mobilised following a crisis caused by external factors. Interestingly,despite this process the PDD still maintained its traditional ways of thinking, althoughpresumably in a more questioning, results-orientated environment. In this context, as thepaper concludes, accounting change is not ‘the end’ but part of the process.
THE PLANNING PROCESS – 2 141
Coombs-05.qxd 3/18/2005 1:08 PM Page 141

Your first step was to collect data for the last 12 months for the assembly departmentand the machine service department. These data have been summarised on page 142.
Case Study: Tuba Accessories
Tuba Accessories produces a standard navigation system for motor vehicles. Its assemblydepartment is largely mechanised and most of the costs of the department are producedby the two overhead support centres – assembly support and machine service.
You are the assistant to the manager of the assembly department, Charlie Cregan.Each department is evaluated by comparing its actual costs with its flexed budget. This
comparison is effected on a monthly basis through the year. The differences between theactual expenditure and the flexed budget are referred to as ‘operational cost variances’ bythe company. Each department is responsible for investigating its own operational cost vari-ances and, each month, the manager of each department has to make a presentation of find-ings and remedial action in a senior management meeting that is chaired by Alastair Graham,the company’s managing director.
During the past 12 months the assembly department’s cost variances have been neg-ative in most months and its manager has regularly attributed this to the inaccurate bud-geting of overhead costs. However, Alastair Graham has not been convinced by thisargument because Charlene O’Donaghue, the management accountant, has stressedthat the method of predicting overheads is based on the current methodology used inmanufacturing companies.
The assembly manager is very keen to establish whether there is a better basis forprojecting the overhead budgets for the next 12 months and, knowing that you have stud-ied accountancy at university, has asked you to undertake an investigation of the currentsystem and to examine alternative approaches.
142 MANAGEMENT ACCOUNTING
Units Assembly support Machine service Month produced costs (£000) costs (£000)
1 8000 37.9 702 7400 33.8 66.93 7000 30.5 65.14 6500 33.9 63.25 6200 32.4 61.26 8000 39.3 70.17 5000 28.2 56.28 4300 26.6 53.59 6200 33.8 61.2
10 8200 39.4 71.111 8000 38.1 70.312 9200 41.5 76.5
Coombs-05.qxd 3/18/2005 1:08 PM Page 142
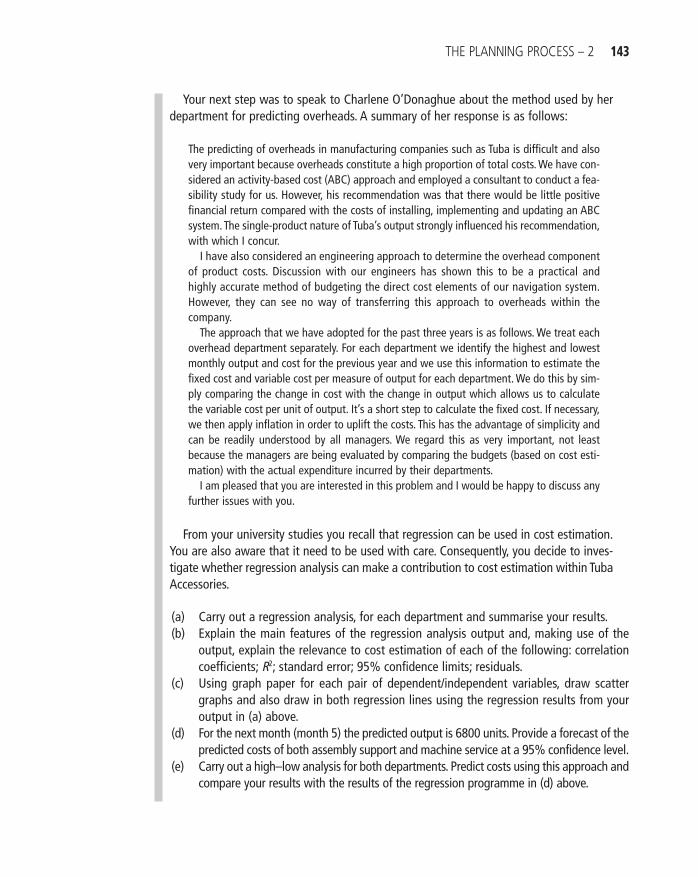
Your next step was to speak to Charlene O’Donaghue about the method used by herdepartment for predicting overheads. A summary of her response is as follows:
The predicting of overheads in manufacturing companies such as Tuba is difficult and alsovery important because overheads constitute a high proportion of total costs. We have con-sidered an activity-based cost (ABC) approach and employed a consultant to conduct a fea-sibility study for us. However, his recommendation was that there would be little positivefinancial return compared with the costs of installing, implementing and updating an ABCsystem. The single-product nature of Tuba’s output strongly influenced his recommendation,with which I concur.
I have also considered an engineering approach to determine the overhead componentof product costs. Discussion with our engineers has shown this to be a practical andhighly accurate method of budgeting the direct cost elements of our navigation system.However, they can see no way of transferring this approach to overheads within thecompany.
The approach that we have adopted for the past three years is as follows. We treat eachoverhead department separately. For each department we identify the highest and lowestmonthly output and cost for the previous year and we use this information to estimate thefixed cost and variable cost per measure of output for each department. We do this by sim-ply comparing the change in cost with the change in output which allows us to calculatethe variable cost per unit of output. It’s a short step to calculate the fixed cost. If necessary,we then apply inflation in order to uplift the costs. This has the advantage of simplicity andcan be readily understood by all managers. We regard this as very important, not leastbecause the managers are being evaluated by comparing the budgets (based on cost esti-mation) with the actual expenditure incurred by their departments.
I am pleased that you are interested in this problem and I would be happy to discuss anyfurther issues with you.
From your university studies you recall that regression can be used in cost estimation.You are also aware that it need to be used with care. Consequently, you decide to inves-tigate whether regression analysis can make a contribution to cost estimation within TubaAccessories.
(a) Carry out a regression analysis, for each department and summarise your results.(b) Explain the main features of the regression analysis output and, making use of the
output, explain the relevance to cost estimation of each of the following: correlationcoefficients; R2; standard error; 95% confidence limits; residuals.
(c) Using graph paper for each pair of dependent/independent variables, draw scattergraphs and also draw in both regression lines using the regression results from youroutput in (a) above.
(d) For the next month (month 5) the predicted output is 6800 units. Provide a forecast of thepredicted costs of both assembly support and machine service at a 95% confidence level.
(e) Carry out a high–low analysis for both departments. Predict costs using this approach andcompare your results with the results of the regression programme in (d) above.
THE PLANNING PROCESS – 2 143
Coombs-05.qxd 3/18/2005 1:08 PM Page 143

The following calculations are provided:
ΣY = 129, ΣX = 60.5, ΣXY = 682, ΣX 2 = 325.25, ΣY 2 = 1441.
Using regression analysis, estimate, for manufacturing overheads, the fixed cost and variablecost per direct labour hour. Use your model to estimate the cost at 4000 direct labour hours.
2. Extra Accessories produces a navigation system for motor vehicles. Its assemblydepartment is largely mechanised and most of the costs of the department areproduced by the two overhead support centres – assemby support and machineservice. Each department is evaluated by comparing its actual costs with its flexed
(f) Explain the major limitations with regard to the use of regression analysis in costestimation in Tuba Accessories.
(g) You are to make two presentations of your results: first, to the company’s managementaccountant; and second, to a group of senior managers which is chaired by the man-aging director. What alternative approaches might you adopt in presenting your resultsto these two parties?
Questions1. Trent PLC produces a single product. Currently, the company is attempting to
improve the way it estimates its manufacturing overheads. The following informa-tion has been collected for the last 12 months, and one independent variable hasbeen identified as a key cost driver – direct labour hours (DLH):
144 MANAGEMENT ACCOUNTING
Overhead DLHMonth (£000s) (000s)
1 10 42 12 63 14 74 11 65 9 46 8 37 8 3.58 9 49 10 5
10 11 511 12 612 15 7
Coombs-05.qxd 3/18/2005 1:08 PM Page 144

You have carried out regression analysis on each pair of dependent/independentvariables and the results are as follows:
(a) For next month the expected output is 6800 units. Provide cost forecasts forboth departments at that level of output.
(b) Using the high–low method, determine the fixed costs and unit variable costsfor both overhead support departments and project total costs for both depart-ments when 6800 units are produced.
budget. During the past 12 months, the assembly department’s cost variances havebeen negative in most months and its manager attributes this to the inaccurate bud-geting of overhead support costs. The assembly manager is very keen to establish abetter basis for projecting the budgets for the next 12 months and has asked you toundertake a cost investigation as a basis for improved budgetary preparation.
Your first step was to collect data for the last 12 months for the overhead supportdepartments:
THE PLANNING PROCESS – 2 145
Assembly Machine Units support costs service costs
Month produced £000 £000
1 8000 37.9 702 7400 33.8 66.93 7000 30.5 65.14 6500 33.9 63.25 6200 32.4 61.26 8000 39.3 70.17 5000 28.2 56.28 4300 26.6 53.59 6200 33.8 61.2
10 8200 39.4 71.111 8000 38.1 70.312 9200 41.5 76.5
Dependent Assembly Machinevariable support costs service costs
R 0.939 0.998R2 0.882 0.996a £12,830 £32,608b £3.11 £4.69
Independent variable: Units produced
Coombs-05.qxd 3/18/2005 1:08 PM Page 145

(c) Explain why the estimates obtained in (a) and (b) above are different.(d) Discuss three limitations with regard to the use of regression in cost estimation.
3. Carveri Brown is a leading manufacturer of navigational fins. It currently adopts asubjective approach to classifying overheads into their fixed and variable elementsfor purposes of cost estimation. It is not entirely satisfied with its current approachand is looking for a more scientific way of estimating costs.
For each of the last 12 months it has collected the following data: monthly productionoverhead costs; monthly machine hours; and monthly output. The data have been inputinto a computer package which has produced the following regression statistics:
• Using monthly machine hours as the independent variable and production overheadcosts as the dependent variable:
y = −500 + 1.2x, r2 = 0.96, n = 12.
• Using monthly output as the independent variable and production overhead costs asthe dependent variable:
y = 500 + 4.9x r2 = 0.94, n = 12.
(a) Calculate each independent variable’s estimate of production overheads in amonth when 5000 machine hours will be used to produce 1000 fins.
(b) Comment on the relative value of each of these independent variables to costestimation in this case.
(c) Identify five limitations of regression in cost estimation and explain carefullywhy each is a limitation.
4. Explain why a standard costing system may be less useful in the following manu-facturing environments:
(a) just-in-time manufacturing.(b) total quality management.
5. The use of incremental budgeting processes may lead to the carry-forward ofinefficiencies in organisations. Examine the contribution of each of the followingin improving efficiency in such organisations:
(a) zero-based budgets.(b) planned programme budget systems.
146 MANAGEMENT ACCOUNTING
Coombs-05.qxd 3/18/2005 1:08 PM Page 146

Chapter 6MANAGEMENT ACCOUNTINGAND THE CONTROL PROCESS – 1
By the time you have finished studying this chapter, you should be able to:• explain the nature of organisational control;• understand the key nature of control information;• prepare flexible budgets for control;• calculate standard costs and variances for purposes of control;• examine the interpretation of variances and other control data.
The Nature of Organisation ControlThis section looks at two aspects of control: the control process itself and feedback concepts.
The Control Process
You have seen in the previous two chapters that all organisations need to engage inplanning. Planning is essential in order to achieve the objectives of the organisation.These objectives can be very diverse, and examples are: to achieve a target profit for theyear, to manufacture 25,000 items in a year, and to teach 300 students in the period fromSeptember to June.
Plans that are stated in money or financial terms are called budgets. Therefore a com-pany will have a profit budget, a factory will have a production budget and a school willhave a teacher budget.
Many organisations will also have a multi-year budget, say a three-year budget. Thedetailed annual budget will form the first year of this three-year period. The budget rollsforward through time, with the second year becoming the first year as another year isadded in to make the third year.
Key Learning Objectives
Coombs-06.qxd 3/18/2005 1:09 PM Page 147

The budget sets out in financial terms what the organisation plans to achieve in theforthcoming year. It is essential if the organisation is to succeed and represents an importantfirst step on the road to success. The organisation should follow this up by checking onprogress regularly in order to achieve its goals by the year’s end. This process of regularchecking is termed management control. Management control has two important aspects:
• There must be a regular (e.g. monthly) comparison of the budget against what isactually achieved.
• Having made such a comparison, managers must make the necessary changes toensure that any underachievement can be corrected and the budget achieved.
Feedback Concepts
The process of comparing plans against actual output and expenditure is termed feedback.It has two different dimensions. Feedback control is the process of looking back in timeand comparing the budget against actions. This is a regular and recurring process so thatevery month, say, the budget is compared with actual outcomes. An example of a feed-back statement is shown in Table 6.1. This statement is for the third month in the univer-sity’s financial year, which commences on 1 August. It shows in the second, third andfourth columns the cumulative figures for the first three months of the year. The varianceshows the difference between budget and actual; as actual expenditure exceeds budget,this is signified by the letter A for ‘adverse’. The last three columns show the figures forthe month of October; October is the third and most recent month. Of the cumulative vari-ance of £10,400 adverse, £2000 was generated in October. As you can see, the statementlooks backwards and is an example of feedback control; by informing the head of depart-ment of the significant overspending on salaries, it should lead to investigation of theproblem and to steps to correct the situation.
For a feedback system to operate effectively there is a need for:
• objectives for the period that can be quantified;• outputs for the period that can be compared with the objectives;• a reporting system that effectively compares the objectives and the outputs;• the capacity to take action if objectives and outputs are not the same.
148 MANAGEMENT ACCOUNTING
Table 6.1 Expenditure control statement for a university department
Cumulative Cumulative Cumulative October October OctoberExpenditure budget expenditure variance Budget Exp. variancehead £ £ £ £ £ £
Salaries 150,000 160,400 10,400 A 50,000 52,000 2000 A
Coombs-06.qxd 3/18/2005 1:09 PM Page 148

The feedback control loop in Figure 6.1 illustrates this diagrammatically:
• The budget for the month is derived from the budget for the year so that the annualobjective is broken down into monthly objectives.
• Feedback involves monitoring the actual results for the period by comparing themagainst the budget for the period and identifying differences.
• If the differences require action then control involves carrying out that action. It maybe necessary to take action to improve operations so that they are more effectivenext month. Alternatively, action on the budget itself may be required if, for exam-ple, material prices have increased significantly since the start of the year, renderingthe budget out of date.
Feed-forward control involves trying to predict outputs against desired outputs. Anexample is the monthly cash budget. If this shows that a negative cash balance is likely tooccur in a specific month, it alerts management who can then try to take preventativeaction by rephasing expenditure or by ensuring that overdraft facilities will be in place.So, feed-forward control is about trying to take action before an event occurs in order toinfluence the sequence of events.
Feed-forward control attempts to take corrective action before an event, whereas feed-back control takes corrective action after the event. But, sometimes it will prove impossi-ble to predict problems, however refined the forecasting process. It has been pointed outby Lyne (1995) that the development of a predictive model requires more than technicalproficiency. He argues that in order to get the individuals to perform at a predicted levelof activity, it is necessary to know how those individuals are motivated. Lyne’s article issummarised at the end of this chapter. We will return to the issue of motivation later inthis chapter and in the next.
THE CONTROL PROCESS – 1 149
Feedback
Feedback
Budget for themonth
Monthly operations Actual results
Monthly comparison of the month’s budget and the actual results for the month (feedback) andthen taking corrective action (control)
Budget for the year
Figure 6.1 Feedback control loop
Coombs-06.qxd 3/18/2005 1:09 PM Page 149

Information for ControlThis section considers the issues of summarising information and qualities of controlinformation.
Summarising Information
The control system consists of layers of feedback systems, each of which involves sum-marising lower-level reports. In this process, information is lost. Figure 6.2 illustrates thisprocess, showing how information is summarised or filtered. The head of the MachineDepartment sees a detailed performance report for that department as this is the manager’sresponsibility. However, the factory manager has to oversee the management of the factoryand the three production departments. In consequence, the factory manager sees a sum-marised report of each department’s performance. At a higher level of summary, the man-aging director is responsible for three factories, finance and marketing and receives asummarised report on each factory. The information has to be summarised in this fashionin order to make it manageable. However, at each stage of summarisation, information islost; one consequence of the system may be to conceal important detailed information fromtop management.
150 MANAGEMENT ACCOUNTING
Managing Director
Head Office (£000)Finance 100Marketing 500Factory 1 1500Factory 2 1700Factory 3 1200Total 5000
Factory Manager
Factory 2 (£000)Management 120Machine Dept. 950Assembly Dept. 350Finishing Dept. 280Total 1700
Machine Dept. Manager
Machine Dept. (£000) Direct materials 300 Direct labour 400 Indirect labour 150 Power 40 Maintenance 60 Total 950
Figure 6.2 The information summarising process
Coombs-06.qxd 3/18/2005 1:09 PM Page 150

Qualities of Control Information
The summarised reports in Figure 6.2 would form the focus for the preparation of controlinformation. For such information to be effective and be valuable to the user, it shouldmeet the following criteria:
• Timeliness. The information should be made available by a certain date. For exam-ple, the monthly control statement should be provided by, at most, a week aftermonth’s end in order to give the appropriate manager time to use the information inthe most effective way.
• Clarity. The user should be able to read and assimilate the information quickly. Theinformation should be clear and unambiguous, avoiding unnecessarily complextechnical terminology. Clarity is assisted by the use of subtotals, totals and the useof graphs. Superfluous detail may be sacrificed.
• Succinctness. Information should not be excessive as this will waste the manager’stime. There should be communication between providers and users of informationto determine what the latter require.
• Relevance. The information should be relevant to the requirements of the user.Although the information should be succinct, it should also be complete so that theuser does not need to access other sources of information. The provision of irrele-vant information is unhelpful to the user.
• Accuracy. If the statement lacks accuracy, this may embarrass the user and lead toa loss of confidence in the information. However, not every manager needs the samelevel of accuracy. In Figure 6.2, the assembly manager will need much more detailedinformation about the different elements of the Assembly Department than will themanaging director.
• Cost-effectiveness. The benefit to the user manager must exceed the cost of provid-ing the information.
If these criteria are followed, user managers will gain confidence in the control informa-tion and this may assist in raising the profile and prestige of the management accountingfunction.
Fixed and Flexible BudgetsThis section considers:
• the different objectives of fixed and flexible budgets;• the benefits of flexible budgets;• the preparation of flexible budgets;• the calculation of variances from flexible budgets.
THE CONTROL PROCESS – 1 151
Coombs-06.qxd 3/18/2005 1:09 PM Page 151

First we will consider the comparison of the actual data with the fixed budget and thenwith a flexible budget. Comparison with the fixed budget for June gives the results shownin Table 6.2.
The cost variance is calculated by subtracting the actual costs from the budgeted costs.If the actual costs exceed the budget, this is termed an adverse variance as it increasescosts over budget. On the other hand, if budget exceeds actual, this is termed a favourablevariance. In this case, we have an adverse variance of £1,400. However, as can be seen,
Fixed Budgets
Chapters 4 and 5 introduced you to budgets and budgeting. The budgets discussed werefixed budgets. A fixed budget is one that is based on one level of output; it is not usuallychanged after it is agreed. The fixed budget is used for planning purposes. The budgetedprofit and loss account, budgeted balance sheet and cash budget constitute the highestlevel of fixed budgets and together may be termed the master budget. The master budget,including the budgeted net profit, will be discussed by and approved by the board of direc-tors. Once approved by the board, the master budget becomes officially the company’starget for the forthcoming financial year.
Flexible Budgets
A flexible budget is designed to change as the underlying volume of activity changes. Itdoes this by considering the factors that cause costs to change as the volume of activitychanges. Flexible budgets have two principal benefits:
• They allow the firm to project outcomes, including key variables such as profit, atdifferent levels of activity. This is useful if the firm is unsure about some key issues,such as the potential sales for the year. A firm may also engage in ‘what if’ or sen-sitivity analysis in order to determine the impact on profitability and cash of changesin key variables such as sales, production and costs.
• They can be used for feedback control after the actual costs for a specific periodhave been determined. There can be valuable control information if the actual costsfor a period are compared with the flexed budget for the period rather than with thefixed budget. The following illustration demonstrates this.
152 MANAGEMENT ACCOUNTING
Fixed budget for June Actual data for June
Output 3,000 units 3,500 unitsProduction costs
Variable costs (£, at £3 per unit) 9,000 10,400Fixed costs (£) 10,000 10,000
Coombs-06.qxd 3/18/2005 1:09 PM Page 152

the variance arises because output is 500 units more than the budget; it would be expectedthat the variable costs of producing 3500 units exceeds the budgeted variable cost of pro-ducing 3000 units. In this situation, a better comparison is between the actual costs and aflexible budget. The flexible budget restates the fixed budget for June, making allowancefor the actual output of 3500 units and the actual costs of producing 500 more units. Thisis demonstrated in Table 6.3.
Comparison with a flexible budget for 3500 units demonstrates that in June the actualcosts are less than the flexed budget, and this is reflected by the £100 favourable variance.
The Development of Flexible Budgets
In order to develop flexible budgets, we need to understand the way that costs behave. Directcosts (direct labour and direct materials) will often have a linear relationship with output, sothat costs double as output doubles. At the other end of the cost spectrum, fixed costs such asrent and managerial salaries are unlikely to change as volume changes. You read in Chapter 2that some fixed costs increase in a step cost fashion. An example is foremen’s salaries thatdouble when a factory moves from a single-shift system to a two-shift system. Other indirectcosts such as power may be semi-variable in nature, reflecting an annual standing charge anda variable cost element that is related to the amount of power consumed.
We will now give an example to demonstrate the construction of a flexible budget.Using the following information, we will produce flexible budgets for the production of3000, 6000 and 9000 units:
THE CONTROL PROCESS – 1 153
Table 6.2 Comparison with a fixed budget
Fixed budget Actuals Variances
Output 3,000 units 3,500 unitsCosts
Variable costs (£) 9,000 10,400 1,400 AdverseFixed costs (£) 10,000 10,000 0Totals (£) 19,000 20,400 1,400 Adverse
Table 6.3 Comparison with a flexible budget
Flexible budget Actuals Variances
Output 3,500 units 3,500 unitsCosts
Variable costs (£, at £3 per unit 10,500 10,400 100 Favourablein the flexible budget)Fixed costs (£) 10,000 10,000 0Totals (£) 20,500 20,400 100 Favourable
Coombs-06.qxd 3/18/2005 1:09 PM Page 153

We are now able to prepare the flexible budgets, as shown in Table 6.4. These demon-strate how total costs behave at the different levels of output shown. Also of interest arethe total variable costs, which can be calculated by multiplying the output by the unit cost.As the fixed costs have also been identified, flexible budgets can be prepared for any levelof output.
The costs that change must be variable, and the variable cost per unit is £21,000/7,000 = £3.The variable cost information can now be used to calculate the fixed cost element:
Variable costsDirect material A £4 per unit of outputDirect material B £1.50 per unit of output
Semi-variable costs: Output Costs (£)3,000 13,0005,000 19,0008,000 28,000
10,000 34,000
Fixed overhead: Output Costs (£)0–4,000 25,000
4,001–8,000 35,0008,001–12,000 47,000
The first task is to segregate the different elements of the semi-variable overheads. Thisinvolves the use of the technique termed the ‘high-low’ method, which you met in Chapter 5.It involves the selection of the lowest and highest levels of output and costs, calculatingthe differences between them, and uses this information to identify the variable costs.
154 MANAGEMENT ACCOUNTING
Output Costs (£)
High 10,000 34,000Low 3,000 13,000Change 7,000 21,000
£
Total costs at 3000 units 13,000Less variable cost at 3000 units = 3000 × £3 = 9,000Therefore, fixed costs 4,000
Coombs-06.qxd 3/18/2005 1:09 PM Page 154

Calculating Budget Variances
We can use the power of the flexible budget to generate variances. Let us assume that inthe month of May, output was 5560 units and the costs were as shown in the ‘actual’ columnin Table 6.5. The flexible budgets for the variable costs are calculated by multiplying theunit costs by May’s output. The fixed costs are taken from the data in the previous illus-tration. The last column contains details of the variances between the flexed budget andactual costs. As has been indicated above, if the flexed budget exceeds the actual cost, thisgenerates a favourable (F) variance, while if the actual cost exceeds the flexed budget, thisresults in an adverse (A) variance.
THE CONTROL PROCESS – 1 155
Table 6.4 Flexible budgets at different levels of output (£)
OutputUnit cost 3,000 6,000 9,000
Variable costsDirect material A 4 12,000 24,000 36,000Direct material B 1.50 4,500 9,000 13,500Direct labour 6 18,000 36,000 54,000Semi-variable overhead: 3 9,000 18,000 27,000
variable costsTotal variable costs 14.50 43,500 87,000 130,500Semi-variable overhead: 4,000 4,000 4,000
fixed costsFixed costs 25,000 35,000 47,000Total costs 72,500 126,000 181,500
Table 6.5 Calculating flexed budget variances
Output: 5560 unitsCost per unit Flexed budget Actual costs Variances
Cost element £ £ £ £
Variable costsDirect material A 4 22,240 22,220 20 (F)Direct material B 1.50 8,340 8,440 100(A)Direct labour 6 33,360 33,550 190(A)Semi-variable 3 16,680 15,040 1,640 (F)Total variable costs 14.50 80,620 79,250 1,370 (F)
Fixed costsSemi-variable 4,000 3,920 80 (F)Fixed 4001–8000 35,000 35,050 50 (A)Total fixed costs 39,000 38,970 30 (F)Total costs 119,620 118,220 1,400 (F)
Coombs-06.qxd 3/18/2005 1:09 PM Page 155

The Construction of Standard Costs
There are two methods for setting cost standards: the analysis of past costs and functionalanalysis.
• Analysis of past costs. Companies with a history of production experience will havea record of past costs, and these can provide a reliable basis for generating standard
The variances in the final column show that in total the actual cost is £1400 less thanthe flexible budget cost. Examination of the individual variances shows that to a largeextent the overall favourable variance is largely due to the semi-variable favourablevariance of £1,640.
Standard Costing and Variance AnalysisThis section considers:
• the definition of a standard cost;• the construction of standard costs, including behavioural issues;• the advantages of standard costing;• the concept of standard time;• the use of standard costs in variance analysis;• the interpretation of variances;• performance ratios.
The Definition of a Standard Cost
A standard cost is the planned unit cost of a product or service. It normally has a physicaland a financial component. For example, a bicycle factory has a wheel-building departmentand within this the standard costs of a wheel are shown in Table 6.6.
156 MANAGEMENT ACCOUNTING
Table 6.6 Standard cost statement for one wheel build
Item Quantity Price (£) Standard cost (£)
Wheel rim 1 7 7.00Spokes 36 0.15 each 5.40Hub 1 3.30 3.30Labour 0.75 hours 6 per hour 4.50Variable overhead 0.75 hours 2 per hour 1.50Fixed overhead 0.75 hours 4 per hour 3.00Total 24.70
Coombs-06.qxd 3/18/2005 1:09 PM Page 156

costs. Where these are used, adjustments to past costs will need to be made to reflectchanges in price levels and wage costs. However, even where historical data areavailable, their use may be invalidated by technological change. Of course, thisapproach cannot be used for new production methods.
• Functional analysis. This requires the involvement of engineering and work studystaff. Engineers will be required to specify material requirements and calculate howmuch should be used to produce the product. The purchasing department will berequired to determine the price of raw materials and components. Work study expertsand engineers will work together to determine the labour time required, whilstrepresentatives from human resources will advise on rates of pay for the grades oflabour stipulated. However, the overhead element of the standard cost may be diffi-cult to estimate. The figure may simply be related to labour hours or, preferably, willbe related to cost driver consumption in an activity-based costing environment.
The level of difficulty of standards should be considered when they are set. It is possi-ble to distinguish between ‘ideal’ and ‘attainable’ standards. Ideal standards assume thatemployees work at 100% efficiency as they make no allowance for wastage or ineffi-ciency. They assume ideal technological conditions, and it is invariably impossible to dobetter than the standard. They are unlikely to be used in practice as they may be expectedto demoralise workers due to an expected preponderance of adverse variances.
Attainable standards are set at high but achievable levels. They assume a brisk level ofworking. They also assume normal working conditions and make allowance for idle timeand breakages. There are opportunities for workers to do better than attainable standardsso that they generate a mix of favourable and adverse variances. The combination of stan-dards that are attainable and favourable variances that result from effective working islikely to motivate employees. Preston (1995) argues that budgetary systems risk stiflingcreativity within organisations. The article is summarised at the end of this chapter.
Argyris (1953) raised awareness of the dangers of setting impossible standards over50 years ago. He observed that such standards led to the formation of informal anti-companysubgroups amongst workers whose objective was to frustrate attainment of the standard.He also pointed out the intolerable pressure felt by supervisors caught between thedemands of senior management and the workforce. Argyris proposed that budget holdersshould participate in the budget-setting process (the term budget holders refers to man-agers who are responsible for controlling budgets). He argued that participation was likelyto produce more realistic budgets and lead to feelings of ownership and commitment asthe budget was internalised by participants. Participation can also improve communicationin a company; the act of participating spreads knowledge about the company’s objectivesand activities. Additionally, it allows an opportunity for managers to input their detailedknowledge into the budgeting process.
Ouchi (1979) discusses several types of control; the article is summarised at the end ofthis chapter.
However, other writers have indicated that participating managers may seek to build in‘budgetary slack’ so that the budget is set at a slightly lower level, making it easier toachieve. To guard against this, it may be necessary to establish reference points such as
THE CONTROL PROCESS – 1 157
Coombs-06.qxd 3/18/2005 1:09 PM Page 157

past performance or performance in another part of the company. Even so, senior managershave the responsibility for achieving profit targets that may have been agreed by the boardof directors, and as such targets will invariably override the results of participative budgets,many companies impose budgets but allow managers a certain amount of freedom inachieving them. For example, a report in the Daily Telegraph on 22 January 2004 on theUK telecom company mmO2 quotes its chief executive, Dave McGlade, attributing a largepart of the company’s success to ‘setting managers from one end of the business to theother a few clear, simple targets then giving them the freedom to get on with their jobsand make decisions on the spot’.
Advantages of Standard Costing
• They are of help in building up costs for budgeting. They also provide a significantinput to flexible budgeting to assist with decision making and control.
• They lead to a detailed comparison of standard and actual costs. This forms a veryimportant feedback control function. The size of variances alerts managers as to thecosts that are most in need of attention and corrective action.
• They assist in evaluating managerial performance by highlighting fixed and variablevariances.
• They provide targets for managers and employees to aim at and to achieve. Byachieving or improving on standard costs, they are more likely to achieve the budget.
• A standard costing system simplifies inventory valuation as goods are taken intoclosing stock at the standard cost of production made up of direct material, directlabour, variable production overhead and fixed production overhead.
The Concept of Standard Time
Standard time refers to the quantity of output that should be produced in a specific period.Thus, a standard minute refers to the amount of work that should be produced in a minuteand a standard hour the amount of work to be produced in an hour. Standard time is notan input measure. It does not refer to the actual time worked. Instead it refers to theamount of time represented by the output of the period.
For example, the standard amount of time to build a cycle wheel in Table 6.6 is0.75 hours or 45 minutes. In a six-hour period, a wheel-builder completes seven wheels.The standard time represented by the production of seven wheels is 7 × 45 minutes = 5hours 15 minutes. As can be seen, the wheel-builder has taken 6 hours to complete 5 hours15 minutes of output and would be regarded as inefficient.
As well as a measure of efficiency, standard time also offers a way of adding togetherdifferent products or different types of activity as the following examples illustrate.
Different Products
A factory produces three types of office furniture, and the standard times for the produc-tion of one of each are as follows:
158 MANAGEMENT ACCOUNTING
Coombs-06.qxd 3/18/2005 1:09 PM Page 158

In a week the factory produces 25 chairs, 49 stools and 25 desks. The total standard timerepresented by this output is shown in Table 6.7.
This demonstrates that the different products can be added together through their standardtimes of production. From a control perspective, the 3480 standard minutes (= 58 standardhours) of output of Table 6.7 could be compared with the budgeted total of standard hours.
If actual hours worked exceeded 58 hours, it would indicate the workforce was inefficient.
Different Types of Activity
In a garage the standard times shown in Table 6.8 have been established for differenttasks. These form the basis of charges to customers so it is important that mechanics keepto them. Table 6.8 also shows the activities completed in a 37.5-hour week.
As can be seen, the mechanic has completed 39.5 standard hours of work, whichexceeds his 37.5 hours of actual input. For the company there is a monetary benefit
THE CONTROL PROCESS – 1 159
Product Standard time (minutes)
Chair 30Stool 20Desk 70
Table 6.7 Standard times of output
Standard time Total standard Product (minutes) Units time (minutes)
Chair 30 25 750Stool 20 49 980Desk 70 25 1750Total 3480
Table 6.8 Standard times of activities
Activities completed
Standard StandardActivity time (hours) Number Time (hours)
Short service 0.75 10 7.5Long service 1.5 14 21Clutch change 2 5 10Wheel bearing change 0.5 2 1Total 39.5
Coombs-06.qxd 3/18/2005 1:09 PM Page 159

because it is able to charge out to customers an additional 2 standard hours over and abovethe 37.5 hours that it has paid the mechanic for.
The Use of Standard Costs in Variance Analysis
To illustrate the use of standard costs in control, we now consider the calculation andinterpretation of cost variances. In order to illustrate this, we will consider the example ofa company that manufactures a single product and has established a system of standardcosting. The standard costs and annual budget for the current year are shown in Table 6.9.
The overhead costs, both variable and fixed, are charged to the product via the directlabour time. As can be seen, the product consumes 30 minutes of both overhead costelements, the amount of labour time required to produce one unit. The total budget forthe year is calculated by multiplying each standard cost by the annual output of 120,000units.
It is planned to produce the annual output of 120,000 units evenly through the year,with 10,000 units produced each month. The fixed overheads are planned to amount to£20,000 per month.
During October, actual output and costs were as shown in Table 6.10. The total costvariance for the period is calculated by comparing what it should cost to produce 8,000units (the standard cost of 8,000 units) with the actual costs as follows:
160 MANAGEMENT ACCOUNTING
Table 6.9 Standard costs per unit and annual budget
Standard costs per unit
Components of Standard cost Annual budget forCost element standard cost per unit (£) 120,000 units (£)
Direct materials 2 kg at £1 per kg 2.00 240,000Direct labour 30 minutes at £5 per hour 2.50 300,000Variable overhead 30 minutes at £3 per hour 1.50 180,000Fixed overhead 30 minutes at £4 per hour 2.00 240,000Totals 8.00 960,000
Table 6.10 Actual output and costs for October
Output: 8000 units
Costs £
Direct materials: 16,300 kg at £0.98 per kg 15,974Labour: 3950 hours at £5.06 per hour 19,987Variable overhead: 3950 hours at £3 per hour 11,850Fixed overhead 20,400Total 68,211
Coombs-06.qxd 3/18/2005 1:09 PM Page 160

As may be seen in the table:
• Direct materials, direct labour and variable overhead all show favourable variances.• Fixed overhead shows a large adverse variance that swamps the three favourable
variances and produces a large adverse total cost variance. • The bottom row shows the make-up of the total cost variance, which comes to
£4,211 adverse.
Subvariances
The next stage is to analyse each variance further. We will use the data in Tables 6.10 and6.11 to calculate the subvariances described in Table 6.12.
The material price subvariance is given by
(Standard price per kg − Actual price per kg) × Actual kg= (£1 per kg −£0.98 per kg) × 16,300 kg= £326 F.
This variance is favourable because the actual price paid per kilo is less than the standardprice of £1 per kilo, Material price variances may be caused by: purchasing in favourablemarket conditions, price increases since the budget was set, taking advantage of quantitydiscounts or purchasing non-standard quality materials.
Total cost variance = Standard cost of output − Actual costs= (8000 units × £8) − £68,211= £64,000 − £68,211 = − £4,211.
As the actual costs exceed the standard costs, there is an adverse variance of £4,211.The variances for each of the costs can be calculated using the same formula and
the variances can be set up in a table as shown in Table 6.11.
THE CONTROL PROCESS – 1 161
Table 6.11 Variances for October (£)
Standard cost Standard costs Variances (standard Cost element per unit of 8000 units Actual costs cost – actual)
Direct materials 2 16,000 15,974 26 (F)Direct labour 2.50 20,000 19,987 13 (F)Variable overhead 1.50 12,000 11,850 150 (F)Fixed overhead 2 16,000 20,400 4,400 (A)Totals 8 64,000 68,211 4,211 (A)
Coombs-06.qxd 3/18/2005 1:09 PM Page 161

Variance Subvariance 1 Subvariance 2
Direct materials This is the materials price subvariance This is the materials usage subvarianceand is calculated by comparing the and is calculated by comparing the standard purchase price of raw materials standard quantity of raw materials usedwith the actual price paid (for the output achieved) with the actual
quantities used
Direct labour This is the rate subvariance and is This is the efficiency subvariance calculated by comparing the standard and is calculated by comparing the wage rate with the actual wage rate standard number of labour hours (for
the output achieved) with the actuallabour hours
Variable overhead This is the expenditure subvariance and is This is the efficiency subvariance and is calculated by comparing the standard calculated by comparing the standard variable overhead based on actual hours hours of production with the actual worked with the actual variable overhead. labour hours. That is, it compares the That is, it calculates what the variable standard hours of output with the actualoverhead should be for the hours worked hours of inputand compares this with the actualoverhead
Fixed overhead This is the expenditure subvariance and This is the volume subvariance and is is calculated by comparing the fixed calculated by comparing the overheads overhead budget with the actual fixed absorbed by the actual output and theoverhead fixed overhead budget
Material usage variance is
(Standard material use − Actual material use) × Standard price per kg((8000 units of output × 2 kg per unit) −16,300 kg) × £1 per kg= (16,000 kg − 16,300 kg) × £1 per kg= £300 A.
In this case the variance is adverse because we have used 300 kg more than the stan-dard use of 16,000 kg for the output of 8000 units. Material usage variances may becaused by excessive waste due to a poorly trained workforce or due to substandard mate-rials. It may also be caused by poor storage or machine breakdown resulting in damageto raw materials. In this case, there is a favourable price variance that may have been dueto the purchase of slightly lower-grade materials. The adverse use variance may reflecthigher waste associated with the purchase of poor quality materials.
The two materials subvariances of £326F and £300A sum to the materials variance of£26F calculated in Table 6.11.
162 MANAGEMENT ACCOUNTING
Table 6.12 Subvariances
Coombs-06.qxd 3/18/2005 1:09 PM Page 162

The wage rate subvariance is given by
(Standard rate per hour − Actual rate per hour) × Actual hours worked(£5 per hour − £5.06 per hour) × 3950 hours = £237 A.
The variance is adverse because the actual rate of pay per hour is greater than the stan-dard hourly rate. Wage rate variances can be caused by recruiting the incorrect grade oflabour, by inadequate supply of the right grade of labour in the labour market, byunplanned overtime working and by an increase in wage rates since the start of the year.
The wage efficiency sub-variance is calculated as
(Standard labour hours − Actual labour hours) × Standard wage rate((8000 units × 0.5 hours per unit) − 3950 hours) × £5 per hour= (4000 hours − 3950 hours) × £5 per hour = £250 F.
This variance is favourable because the actual hours worked are 250 hours less than thestandard of 4000 hours. Efficiency subvariances may also be caused by recruiting thewrong grade of labour or by inadequate training. They may also be caused by machinebreakdown or by wasting time dealing with poor-quality materials. Low levels of moti-vation in the workforce may also be a contributing factor, and this might be attributed toa range of things including levels of pay, stress levels and poor working conditions. In thiscase the rate variance is adverse as the rate paid was £5.06 rather than £5.00 and this mayhave led to the favourable efficiency variance.
The two wage rate subvariances of £237A and £250F sum to the wages variance of £13Fcalculated in Table 6.11.
The variable overhead expenditure subvariance is given by
(Standard variable overhead rate per hour × Actual hour worked) − Actual cost.(£3 per hour × 3950 hours) − £11,850 = £11,850 − £11,850 = 0.
Causes of the overhead variable expenditure subvariance would depend on the con-stituent elements of variable overheads, For example, there could be an increase in thecosts of power (a variable overhead).
The variable overhead efficiency subvariance is calculated as
(Standard hours of output − Actual hours of input) × Standard variableoverhead rate per hour= ((8000 units × 0.5 hours) − 3950 hours) × £3= (4000 standard hrs − 3950 hours) × £3 per hour= 50 hours × £3 = £150F.
THE CONTROL PROCESS – 1 163
Coombs-06.qxd 3/18/2005 1:09 PM Page 163

This variance is favourable because we have produced 8000 units in 50 hours less thanthe standard time of 4000 hours. The causes of this variance are similar to the causes ofthe labour efficiency variance listed above.
Again, it can be seen that when the variable overhead variances of £0 and £150F areadded together they equal the variable overhead variance in Table 6.11.
The fixed overhead expenditure subvariance is given by
(Budgeted fixed overhead − Actual fixed overhead)= £20,000 per month − £20,400 = £400 A.
This variance is adverse because actual expenditure is £400 more than the budgeted fixedoverhead for the month. As these are fixed overheads, we would expect that actual over-heads would equal budget overhead. For the precise causes of fixed overhead varianceswe would need to examine the constituent elements of the fixed overhead cost. For exam-ple, it may be that we have (erroneously) paid next month’s rent as well as this month’s.
The fixed overhead volume subvariance is calculated as
(Standard fixed overhead cost per unit × Output) − Budgeted fixed overhead= (8000 units × £2 per unit) − £20,000 per month= £16,000 − £20,000= £4,000A.
This variance is associated with the total absorption costing system dicussed in Chapter 2.The standard overhead cost per unit is the same as the fixed overhead absorption rate perunit. Therefore, in this case the variance is adverse because our output of 8000 unitsabsorbs only £16,000 of fixed overhead whereas the fixed overhead budget for the periodis £20,000. We have failed to recover all the budgeted fixed overhead from the month’sproduction. The budget for the month planned for the production of 10,000 units, each ofwhich would have absorbed £2 of fixed overheads, amounting to £20,000. As we haveproduced 2000 units less than the budget, this means that we have failed to recover 2000units × £2 of fixed overhead. The adverse variance is the result of failing to produce at thebudgeted level. However, the underproduction may be the result of either or both of thefollowing factors:
• The failure of the labour force to work sufficient hours. In this case 3950 hours wereworked, but budgeted hours were 30 minutes per unit × 10,000 units = 5000 hours.
• Inefficient working by the labour force in their working hours. In this case 3950 hourswere worked and 4000 hours of output (8000 units) produced. Therefore, the labourforce was efficient and the failure to produce 10,000 units is due to working 3950rather than 5000 hours in the month. The reasons for this need to be investigated.
When the expenditure variance (£400A) is added to the volume variance (£4,000A),they sum to the total fixed overhead variance of £4,400A in Table 6.11.
164 MANAGEMENT ACCOUNTING
Coombs-06.qxd 3/18/2005 1:09 PM Page 164

The variances may be summarised as in Table 6.13 in a statement that reconciles thestandard cost of production to the actual costs, showing the subvariances in detail.
Interpretation of Variances
The individual variances described in the previous section may have one or more causes,which may or may not be clear. Before we can correct such variances, we need to under-stand the reasons for them. Only then can we identify what steps should be taken toaddress them. Five types of causes may be identified:
• Inefficiency in operations, for example, purchasing raw materials at an uneconomicprice, leading to an adverse price variance; productive inefficiency by labour, so thatactual hours worked exceed standard hours of output, or the recruitment of the wronggrade of labour.
• Incorrect plans or standards. These include plans that were originally incorrect,such as the incorrect price per litre for materials, and plans that were originallycorrect but have been invalidated by environmental changes.
• Poor communication of standards. Standards may contain errors, may arrive afterwork has started, or may be set out in such a way as to cause confusion.
• Interdependence of variances. One variance may be influenced by another. Forexample, the employment of unskilled labour may give a favourable rate variance,but if the work is skilled it will probably result in a unfavourable efficiency variance;
THE CONTROL PROCESS – 1 165
Table 6.13 Reconciliation of standard and actual costs of production
£ £
Standard costs of production* 64,000
Direct material variancesPrice subvariance 326 FUse subvariance 300 A 26 F
Direct wages varianceRate subvariance 237 AEfficiency subvariance 250 F 13 F
Variable overheadExpenditure subvariance 0Efficiency subvariance 150 F 150 F
Fixed overheadExpenditure subvariance 400 AVolume subvariance 4000 A 4400 A
Actual costs 68,211
*See Table 6.11.
Coombs-06.qxd 3/18/2005 1:09 PM Page 165

a favourable material price variance may be the result of buying poor-quality materialsand this may lead to an adverse material use variance (as more waste is likely toresult) and an adverse labour efficiency variance as workers take longer to processsubstandard materials.
• Random fluctuation around standards. Humans are not machines and cannot beexpected to work as consistently as machines. Efficiency will fluctuate. Consequently,a labour standard, for example, may be viewed as a long-run average that performancewill conform to. In this situation, one must accept that in some periods performancewill be better than the standard and at some times worse.
Performance Measures
There are three non-financial performance measures that provide a perspective on factoryoperations. The production volume (PV) ratio, given by
PV ratio =Standard hours of actual output
× 100,Budgeted standard hours
expresses actual output as a percentage of budgeted output. If actual output is more thanbudgeted output the ratio will be more than 100% and if lower than budgeted output it willbe less than 100%. Using the data in Tables 6.9 and 6.10, we can calculate the PV ratiofor the factory:
PV ratio =4000 std. hours
× 1005000 std. hours
= 80%.
Standard hours of actual output is 30 minutes per unit multiplied by actual output of 8000units. Budgeted standard hours is 30 minutes per unit multiplied by the budgeted outputof 10,000 units. This ratio reflects the fact that output was only 8000 units compared withthe budget of 10,000 units.
The efficiency ratio,
Efficiency Ratio =Standard hours of actual output
× 100,Actual hours worked
expresses output as a percentage of hours worked. If the workforce is as efficient as the stan-dard, the ratio will be 100%. If the workforce is less efficient, standard hours will be lessthan hours worked and the percentage less than 100%. Using the data in Tables 6.9 and 6.10:
Efficiency ratio =4000 standard hours
× 1003950 hours worked
= 101%.
166 MANAGEMENT ACCOUNTING
Coombs-06.qxd 3/18/2005 1:09 PM Page 166

The workforce has thus been more efficient than the standard – something that we knewfrom the variance analysis.
Finally, the capacity usage ratio
Capacity Usage Ratio =Actual hours worked
× 100,Budgeted working hours
as its name implies, measures to what extent factory capacity has been used in the period.It expresses actual hours as a percentage of budgeted working hours. If actual hours areless than budgeted hours, this produces a percentage below 100%, signifying that capa-city was not used fully. Using the data in Tables 6.9 and 6.10,
Capacity usage ratio = 3950 hours worked
× 1005000 budgeted hours
= 79%.
In this case we used only 79% of the planned working hours in the month; in itself thiswould lead to the failure to achieve the month’s planned output.
ConclusionsThis chapter has demonstrated that:
• budgets are an essential tool of control. Control can be feed-forward or feedback.• control information should possess various key qualities if it is to be effective.• flexible budgets are useful for projecting different outcomes and also serve as a
basis for control. They allow the calculation of variances.• a standard cost represents the planned unit cost of a product or service. They can
form the basis of cost systems and they are also used to generate a wealth of varianceinformation.
• generating the variances has to be followed by their interpretation in order to makemanagerial use of the control information.
SummaryAll organisations need to engage in planning, but in order that planned outcomes areachieved it is essential that organisations engage in control. Control information alertsmanagers to deviations from plan and allows them to take action to change the course ofevents. The master budget is of little value for monthly control. Instead, flexible budgetsmay be used; they flex budgeted costs to reflect actual outputs. Variances are then gener-ated by comparing the flexed budget costs with the actual costs.
THE CONTROL PROCESS – 1 167
Coombs-06.qxd 3/18/2005 1:09 PM Page 167

Standard costs are developed relating to one unit of output or one unit of a service. Itis important to set standards that are achievable but challenging. If standards are set at toodifficult a level they may lead to a demoralised workforce. In a standard cost system, clos-ing stocks are valued at standard cost of production. Standard costs themselves can beused to generate a range of variances; these include direct materials, direct labour, vari-able overhead and fixed overhead. The interpretation of each of these variances is impor-tant. Finally, we examined three performance ratios (production volume, efficiency andcapacity usage) and saw how they were related to the variances.
Recommended Further ReadingOuchi, W. G. (1979) ‘A conceptual framework for the design of organisationalcontrol mechanisms’, Management Science, 25(9): 833–848.Ouchi describes three mechanisms to cope with evaluation and control:
• markets, precisely measuring and rewarding individual contributions;• bureaucracies, relying on a mix of close evaluation and social acceptance of
common objectives;• clans, relying on relatively complete socialisation to remove incongruent objectives.
He uses a case based in a large organisation’s parts division to show how an organisa-tion can use control mechanisms to move towards achieving its objectives.
In the warehouse, the supervisor uses a mix of formal authority and the trust andrespect of the workers for him (i.e. formal and implicit informal agreements).
In the purchasing department, the relationship of supervisor and workers is more at‘arm’s length’ (i.e. a ‘market’ mechanism), purchasing agents needing only market/priceinformation to make purchasing decisions. Markets are not perfect, however, therefore adegree of bureaucratic control over purchasing officers is needed (i.e. a mix of market andbureaucratic controls).
Where bureaucratic control is used, administrative costs will be high if qualitative aswell as quantitative control measures are needed. In the warehouse, he points to the prob-lems of using a market-based mechanism to control and explains that, if teamwork isrequired, the allocation of rewards may be problematic. He demonstrates that trying to setup an internal market will often result in over-bureaucratisation. Bureaucratic control ispreferred where frictionless markets do not exist.
He concludes that where objectives are clear but tasks are often uncertain, complex andinvolve teamwork, the formation of clans removes much of the need for close bureaucraticcontrol.
Ouchi provides a model that tries to relate the control type used (market, bureaucracyor clan) to the social and information requirements of such control systems. Hence,depending upon the control type used, prices, rules or tradition will have varying degreesof legitimacy. This model also assumes the existence of the self-interest of all participants.
168 MANAGEMENT ACCOUNTING
Coombs-06.qxd 3/18/2005 1:09 PM Page 168

He points to the problems of obtaining perfect transfer prices and hence the need for alayer of imposed bureaucratic control, which in turn requires acceptance of authority, towork. He criticises existing organisational theory (Simon, March, Parsons, etc.) forconcentrating on the bureaucratic form and overlooking the others’ importance.
Ouchi compares the costs of obtaining the ‘right’ people and using (simpler/cheaper)results (market) controls, with having to use the more expensive action (bureaucratic)controls. He suggests the former results in a higher level of staff commitment, whereasthe latter may alienate employees. He proposes another model that interrelates threefactors – people treatment, form of commitment and control type – and suggests that thedegree of employee commitment is related directly to the type of control required. Hedescribes how the type of control used may lead the organisation to become coercive, withassociated ethical issues.
The bureaucratic control type, argues Ouchi, may be unsuitable for many organisations.In order for the organisation to make rational decisions, it must be able to measure relevantinformation. He gives examples of conditions affecting the measurement of behaviour andoutput. In some organisations, such as research laboratories, schools and government agen-cies, outputs and behaviour are both difficult to measure, thus the clan approach may workbest, along with careful selection of employees – a loose coupling approach.
He points to two main underlying issues affecting the form of control – the degree of clar-ity with which performance can be assessed, and the degree of goal incongruence – and tothe fact that, to enable co-operation in organisations, people must be able to trust each other.
Lyne, S. (1995) ‘Accounting measures, motivation and performance appraisal’,in D. Ashton, T. Hooper and R. Scapens (eds), Issues in Management Accounting,pp. 237–257. Hemel Hempstead: Prentice Hall.Lyne’s article attempts to produce a compendium of recent ideas in control system andmotivation theories. He defines control as the ‘regulation and monitoring of activities’ andregulation as ‘ fulfilling what has been laid down’ and as ‘adapting to requirements’. Hecomments that control has two aspects – motivation and performance measurement.
Lyne refers to Hopwood (1974) who identifies four classes of control – administrative,organisational, social and self – each having an effect on motivation. He notes the limitedapplication/value of accounting controls. He quotes Otley and Berry’s (1980) ideas ofprerequisites for effective control systems (i.e. clear objectives, output measure related toobjectives, good predictive models and the ability to take action). He comments on theneed for dual-loop feedback and feedforward and notes that organisations often seem tolack the flexibility to consider altering objectives.
He goes on to give an overview of four recognised groups of theories of motivation:
• needs-satisfying theories – Maslow’s hierarchy of needs;• achievement theories – McClelland’s hierarchy of motivators;• motivation/hygiene theories – Herzberg;• equity theories – based around the demotivating dissatisfaction arising from a sense
of inequity.
THE CONTROL PROCESS – 1 169
Coombs-06.qxd 3/18/2005 1:09 PM Page 169

Lyne next discusses expectancy theory (Ronen and Livingstone, 1975) in some detail.Such theories are based on ideas from psychology and incorporate a wide range of inter-nal and external factors in an attempt to predict/explain motivation in terms of expectedutility. He does not, however, suggest that such ideas have great practical applicability.
Lyne comments on the need to use realistic targets in order to maintain motivation andavoid reducing aspiration levels – see Stedry and Hofstede (1968) and Locke’s (1968)questionable lab-based experiments. He also argues that flexible budgeting with regularlyadjusted targets is necessary for effective motivation.
In discussing the relationship between accounting measures and performance evalua-tion, he refers to the usefulness of ex post measures (e.g. planning and operational vari-ances) as a way of improving the validity of performance monitoring. He also identifiesthe problem of budgetary slack as a ‘predetermined attempt to manipulate the objectiveor target’. He argues that it arises when two conditions exist – incongruent personal andorganisational goals; and information asymmetry. He relates the latter idea to those preva-lent in agency theory and cites the work of Walker and Choudhury (1987).
In terms of the effects of the style of use of budgets (in order to optimise their motiva-tional effects), he notes the work of Hopwood (1972) who identified four different styles:
• budget constrained;• budget profit style;• profit conscious;• non-accounting.
He also refers to Otley (1978) who looked empirically at the effects of such styles onmanagers in various degrees of task uncertainty.
He refers to Kennis’s (1979) study of participation on job satisfaction, job tension andjob attitudes and how such work relates to Hofstede’s improved model of participationand other models which focus on intervening variables which affect performance, such aspersonality types, organisational attitudes, motivation, uncertainty, and role ambiguity. Inthis respect he outlines, and criticises as unrealistic, the attempts which have been madeat ‘management by objectives’.
He concludes that motivation and performance appraisal, whilst involving accountingmeasures, have a much wider context.
Preston, A. (1995) ‘Budgeting, creativity and culture’, in D. Ashton, T. Hopper andR. Scapens (eds), Issues in Management Accounting (2nd edition) pp. 273–298.Hemel Hempstead: Prentice Hall.Preston explores ways in which budgeting contributes to or impedes the creative process. Helooks at two models of creativity: the rationalist model and the social constructionist model.
The rationalist model represents the view that the ‘natural order’ is knowable if all rel-evant variables are identified, along with their relationship rules. Therefore, with perfectinformation, perfect prediction is possible. In this view, creativity is a mysterious factor,not yet understood but ultimately understandable.
170 MANAGEMENT ACCOUNTING
Coombs-06.qxd 3/18/2005 1:09 PM Page 170

The traditional response of management accounting has been to try to improve quantitativetechniques to deal with uncertainty (on the basis that systems work to a predetermined,predictable order), although practical people appreciate that perfect information is notlikely and that creativity plays a part. Creativity is seen here in the forms of adaptabilityand flexibility, and these are enhanced (and creativity promoted) when organisationalstructure and leadership style are ‘got right’, although different combinations of suchfactors may be possible.
Preston argues that organisational structure and budgetary style are closely related andthat traditional (textbook) budgeting seems to assume mechanistic rather than ‘organic’structures. He quotes Mintzberg (1975) who criticises budgetary systems for concentratingon easy-to-measure events; providing out-of-date, historical information; oversimplifyingor reducing information; and concentrating on internal rather than external factors. This,Preston argues, often leads to managers ‘ignoring traditional budgeting systems’ outputs.Therefore, information is hardly likely to contribute to the essential organisational creativ-ity. Traditional budgeting is based on highly authoritarian systems of management.
Preston refers to Otley (1980) who argues for budgetary systems which (while stillessentially rationalist) are tailored around contingent environmental factors, that non-financial, qualitative information often will enhance a system’s outputs and that, by par-ticipation (cf. Ouchi’s ‘clans’), the more organic organisational structure can be adaptedto by the budgetary system. He argues that organisations and environments reciprocallycreate each other and that organisational boundaries are difficult to define. Budgetaryactivities may affect the external environment, for instance, Within organisations, it is theinteractions of individuals that ‘construct’ the organisation, therefore the idea of prede-termined order is flawed in that it ignores or overlooks the self-determination of individ-uals. (The rationalist view effectively says that individuals will react in predeterminedways to known stimuli.)
In the social constructionist model, behaviour is seen as the product of creativeprocesses. An individual’s response to a stimulus, situation or event depends on the indi-vidual’s interpretation of the stimulus; that is, meanings are constructed by social inter-action. These meanings are then internalised and shared between individuals. Thereforebudgets, accounts and formulae have constructed meanings which can change and whichare only symbolic representations of reality, The source of creativity/adaptability is theredefinition of constructed meanings (see his example concerning the NHS on p. 283).
Preston argues that ‘creativity … rests upon the potential in individuals to look at theworld anew and to interpret what they see differently’. This reinterpretation is bound,however, to be affected by social interaction and shared meanings. Preston argues (a littlelike Ouchi) that ‘shared beliefs’ and values lead to the organisation as a ‘constructedorder’, but points to the organisation as a set of interrelating individuals. Organisationsare thus the shared meanings/values/beliefs of the individuals within them. The rules ofsuch systems are not like those in the rationalist model, but rather are ‘rules in process’,continuously changing and reinterpreted.
The meaning of budgets within this social contructionist perspective may not neces-sarily be the same to all organisational participants. Preston cites NHS budgets as a way
THE CONTROL PROCESS – 1 171
Coombs-06.qxd 3/18/2005 1:09 PM Page 171

of making more informed decisions to optimise the use of resources, or as a cost-cuttingtool. Hence doctors’ refusing to participate in the ‘Trojan horse’ of budgeting. Often,Preston notes, managers may go along with budgeting because they think it makes themlook good/rational managers, even though they have no faith in budgets. If budgets areinterpreted as a pernicious form of control, this may lead to stifled creativity (apart fromcreative accounting maybe!).
Budgets, states Preston, may not be a neutral process in that they may shape individ-uals’ interpretations by, for example, narrowing focus and hence stifling creativity.Excessive budgeting may change the nature of an organisation’s culture from aesthetic tohard-nosed.
Budgets may be seen as a ‘political bargaining process’ where those with budgets getthe allocations they want and big allocations give power (a self-perpetuating process?) –thus budgets are both an instrument and reflection of power.
Budgeting, Preston argues, may lead to a culture of rationality and consistency, andthis, in turn, may limit creativity and promote unidirectional behaviour (as specified in arigid budget). To create a more appropriate budgeting system, participation is needed andshould allow for improved solutions to problems as they arise.
Preston identifies the work of March (1976) who suggests the following ideas todeformalise/destandardise budgeting systems:
• treating goals as hypotheses (where uncertainty is high);• treating intuition as real;• treating hypocrisy as transitory, for example, using semi-confusing information
systems to provide the inconsistencies necessary to stimulate creativity;• treating memory as an enemy – breaking the link between the past and the future;• treating experience as a theory – the past ‘reality’ can be reinterpreted to have another
meaning.
Formalised systems, like budgeting, may eradicate the creative behaviour essential toan organisation’s survival.
Case Study: Budget Preparation and Variance Analysis
Eiger PLC manufactures two types of high-quality ice axe, M1 and M2. The current man-aging director, C. Chaplin, formed the company in 1996. Your position is that of man-agement accountant and you normally report to the finance director; occasionally youare required to report to the managing director.
The company uses a standard cost system and fully absorbs factory overheads into thecost of production. Closing stocks of finished goods are valued at the standard cost ofproduction. Production and sales are planned to be at the same monthly level through-out the year 2004.
172 MANAGEMENT ACCOUNTING
Coombs-06.qxd 3/18/2005 1:09 PM Page 172

The estimated balance sheet for the year ended 31 December 2003 is as follows:
EIGER PLCBalance Sheet as at 31 December 2003
Assets employed £000 £000 £000Fixed assets Cost Depn Net
Plant and machinery 600 120 480
Current assetsStockRaw materials 54Finished goods 79 133Debtors 200Cash 79
412
less Current liabilitiesCreditors 40Proposed dividend (payable March 04) 30Provision for taxation (payable Sept. 04) 10 80Working capital 332
812
Financed byShare capital 750Retained profit 62
812
The following information has been obtained for the purpose of preparing the budgetfor the year ending 31 December 2004. First, the sales forecast is:
Next, direct costs:Materials (£)
Carbon steel - per kilogram 25Key rubber- per kilogram 13
Direct labour (£/hour)Machining department 6.50Finishing department 5
THE CONTROL PROCESS – 1 173
M1 M2
Planned selling price per unit £125 £180Forecast sales volume (units) 6,500 6,300
Coombs-06.qxd 3/18/2005 1:09 PM Page 173

Turning now to the direct labour force, the following numbers of direct employees workin each of the production departments: machining, 22; finishing, 10. All employees work a38-hour week and receive paid leave for 5 statutory bank holidays and 15 additional daysper year. The normal working week is five days. Any overtime is paid at time and a half.
Factory overheads are fully absorbed into production, using direct labour hours. At theplanned output levels the following costs (in £000) are forecast:
Indirect labour 30Indirect materials 22Repairs 11Rates 22Canteen 16Depreciation 70Heat and light 3Power 6Factory management 49
The factory has three cost centres: machining department, finishing department and ageneral service department. Data relating to these three cost units for 2004 are as follows:
The standard direct material and standard direct labour content of each unit of thefinished product is as follows:
174 MANAGEMENT ACCOUNTING
M1 M2
Steel 2 kg 3 kgRubber 1.5 kg 2 kgMachining direct labour 3 hours 4 hoursFinishing direct labour 2 hours 3 hours
Machining Finishing General service Data dept. dept. dept.
Indirect labour hours 3500 1000 300Indirect materials £13,000 £5,000 £4,000Repairs £5,000 £4,000 £2,000Factory managers £16,000 £19,000 £14,000Plant & machinery values £600,000 £100,000 0Floor area 2000 sq. metres 500 sq. metres 500 sq. metresMachine hours 5500 1500 0Canteen employees 2
Coombs-06.qxd 3/18/2005 1:09 PM Page 174

The following stock forecasts have been made:
Raw materials Steel (kg) Rubber (kg)Opening stock 1900 (£46,000) 620 (£8,000)Closing stock 2000 900
Finished goods M1 M2Opening stock 90 (£5,000) 920 (£74,000)Closing stock 700 520
Selling and administrative expenses have been forecast as follows:
Selling expenses (£000)Salaries 43Advertising 20
Administrative expenses (£000)Salaries 79Sundry expenses 12Professional fees 5
The costs of direct labour, factory overheads, selling and administrative expenseswill be met in full in cash. Raw materials are purchased on one month’s credit andthe amount outstanding on the balance sheet at 31 December 2003 will be paidin January 2004. All sales are made on a two-month credit basis so the debtors inthe balance sheet will make their payments in January and February. Tax owing at31 December 2003 will be paid on 1 September 2004 and proposed dividends willbe paid in March 2004. Machinery purchases during the year are estimated to cost£30,000 and will be paid for in June. Rates are paid quarterly in January, April, Julyand November.
Profits are taxed at the rate of 23%.The budgets for 2004 are shown below.
THE CONTROL PROCESS – 1 175
Sales Budgets
Product Units Selling Price £ Revenue £
M1 6,500 125 812,500M2 6,300 180 1,134,000Budgeted Revenue 1,946,500
Coombs-06.qxd 3/18/2005 1:09 PM Page 175

M1 M2 Raw usage of usage of material Content Output raw Content Output raw Total(kg) per M1 of M1 material per M2 of M2 material usage
Steel 2 k.g. 7,110 14,220 3 5,900 17,700 31,920Rubber 1.5 k.g. 7,110 10,665 2 5,900 11,800 22,465
176 MANAGEMENT ACCOUNTING
Production Budget
M1 M2
Planned sales 6,500 6,300
Planned finished goods closing stock 700 520
Total units required 7,200 6,820
Less finished goods op. stock 90 920
Budgeted production 7,110 5,900
Direct Materials Purchase Budget
Steel Rubber Totalkg kg £
Planned closing stock 2000 900
Production requirement 31,920 22,465
Total required 33,920 23,365
less Opening stock 1,900 620
Purchase requirment 32,020 22,745
Cost per unit (£) 25 13
Budgeted purchase (£) 800,500 295,685 1,096,185
add Opening stock 54,000
1,150,185
less Closing stock 50,000 11,700 61,700
Cost of raw material used 1,088,485
Direct Materials Used Budget
Coombs-06.qxd 3/18/2005 1:09 PM Page 176

Total hoursDept required Available Hrs. Idle time Hrs. Overtime Hrs.
Manufacture 44,930 40,128 0 4,802Finishing 31,920 18,240 0 13,680
Total Direct Overtime (£) Labour. Premium Idle TimeManufacture 292,045 15,606.5 0Finishing 159,600 34,200 0
Holiday PayWorking PaperDept Employees Days/year Hours/year Cost £Manufacture 22 440 3,344 21,736Finishing 10 200 1,520 7,600
Total 29,336
THE CONTROL PROCESS – 1 177
Direct Labour Budgets
Labour hrs units of total labour wage rate total labourper unit output hours per hour £ costs £
MachiningM1 3 7,110 21,330 6.5 138,645M2 4 5,900 23,600 6.5 153,400Finishing 44,930 292,045M1 2 7,110 14,220 5 71,100M2 3 5,900 17,700 5 88,500Totals 31,920 159,600
Overtime/Idle Time Working Papers (Hours)
Factory Overhead Costs Budget
Apportionment Total Machining FinishingBasis Costs £ Dept. £ Dept. £
Canteen GSd employees 16,000Depreciation P&M Valn. 70,000 60,000 10,000Heat and light Floor area 3,000 2,000 500Indirect labour ILH 30,000 21,875 6,250Other ind. Labour 49,807 15,607 34,200Holiday pay 29,336 21,736 7,600Indirect materials Direct 22,000 13,000 5,000Management Direct 49,000 16,000 19,000Power M/C Hrs. 6,000 4,714 1,286Rates Area 22,000 14,667 3,667Repair Direct 11,000 5,000 4,000Total Costs 308,143 174,598 91,502Reapportion GSD 24,579 17,462Revised Totals 199,178 108,965Planned Activity 44,930 31,920Rate/dlh 4.43 3.41
Coombs-06.qxd 3/18/2005 1:09 PM Page 177

178 MANAGEMENT ACCOUNTING
Cost per M1 M2unit of input units in COST units in
£ one M1 £ one M2
Steel 25 2 50 3Rubber 13 1.5 19.5 2Direct labour
Machining 6.5 3 19.5 4Finishing 5 2 10 3
Unit prime cost 99Factory overheadMachine 4.43 3 13.30 4Finishing 3.41 2 6.83 3Unit production cost 119.13Selling Price 125Budgeted margin 5.87
Closing Stock Budget
Units Unit Cost Total Cost
Raw MaterialsSteel 2000 25 50,000Rubber 900 13 11,700Total Cost 61,700Finished goodsM1 700 119.13 83,388.60M2 520 169.97 88,386.13Total cost 1220 171,774.73
Costs of Goods Sold Budget
£
Direct Materials used (3) 1,088,485Direct Labour (5) 451,645Factory overhead (6) 308,142.5Add: Finished goods opening stock 79,000
1,927,273Less: Finished goods closing stock 171,775Budgeted cost of goods sold 1,755,498
Coombs-06.qxd 3/18/2005 1:09 PM Page 178

THE CONTROL PROCESS – 1 179
Selling and Administrative Expense Budget
Selling Expenses £
Salaries 43,000Advertising 20,000 63,000
Administrative Expenses
Office sals. 79,000Sundry 12,000Prof.fees 5,000 96,000
Totals 159,000
Budgeted Cash Flow
Total
Cash inflowsReceipts from debtors 1822.1Total receipts 1822.1
Cash outflowsPayments to creditors 1044.8Wages 451.65F Overheads 216.14Rates 22Selling & admin. 159Dividends 30Taxation 10Machinery 30
Total Payments 1963.6NCF −141.5Balance b/f 79Balance c/f −62.54
Coombs-06.qxd 3/18/2005 1:09 PM Page 179

Having prepared the budgets for 2004, you are now required to deal with the follow-ing issues.
You have already been informed that planned outputs and costs will be incurred evenlythrough the year. The actual output and costs for the first quarter of 2004 were as follows:
180 MANAGEMENT ACCOUNTING
Balance Sheet as at 31 December 2004
Assets Employed £000 £000 £000
Fixed Assets Cost Depn Net
Plant and machinery 630,000 190,000 440,000
Current AssetsStockRaw materials 61,700Finished goods 171,775Debtors 324,416.7Cash −62,540.42
495,351
Less Current LiabilitiesCreditors 91,348.75Provision for taxation 7,361 98,709Working capital 396,642
836,642
Financed byShare capital 750,000Retained profit 86,642 836,642
Budgeted Trading Profit and Loss Account 2004
£
Sales 1,946,500less Cost of Sales 1,755,498Budgeted Gross Profit 191,002Less Selling and admin. Expenses 159,000Profit before int. & tax 32,002Interest 0Budgeted net profit before tax 32,002Taxation 7,361Budgeted net profit after tax 24,642
Coombs-06.qxd 3/18/2005 1:09 PM Page 180

Write a memorandum to the managing director of Eiger PLC in which you interpret thekey results of the first quarter. Your objective is also to provide any key recommendationsthat result from your analysis and interpretation. You should attach to your memoran-dum a statement of ratios and variances that you have calculated from the informationfor the first quarter.
ProductionProducts: M1 1400
M2 1150
Costs:Direct materials usage: 6255 kgs. of Steel at a total cost of £156,375.
4444 kgs. of Rubber at a total cost of £57,772
Direct labour costs:Machining Department 9032 direct labour hours at a direct wages cost of £60,966.Finishing Department 6255 direct labour hours at a wages cost of £31,275.
The fixed factory overheads for the period are appended below. They include an appor-tionment from the service department.
THE CONTROL PROCESS – 1 181
Machining Finishing£ £
Depreciation 15000 2500Heat and light 530 130Indirect labour 5468 1563Idletime/overtime premium 6500 3655Holiday pay 5434 760Indirect materials 2970 1105Management 4000 4750Power 1002 289Rates 3667 917Repair 1250 1000Reapportion General Service Department 6145 4366Total overhead costs £51,966 £21,035Notes:Overtime hours 1462Idle time hours 1000Holiday hours 836 152
Coombs-06.qxd 3/18/2005 1:09 PM Page 181

For the year ended 31 December 2004 fixed factory costs were as follows:
Management £35,600Depreciation 12,500Insurance 5,600Rates 11,000
With the exception of depreciation, all fixed and semi-variable overheads will increase by5% with effect from 1 January 2005.
(a) Prepare flexible budgets for monthly output levels of 55,000 and 65,000 units forthe year ended 31 December 2005.
(b) Explain the principal benefits that firms obtain from the preparation of flexiblebudgets.
2. Great Lakes Co. is about to commence the final quarter of activity for the currentfinancial year. The results for the first three quarters of the year have been asfollows:
Questions1. Drum Ltd. makes a single product, using a process involving stamping a circle out
from sheet steel, covering it with hide and attaching it to a sidepiece.
For 2004 the standard materials costs and requirements have been as follows: 0.4square metres of sheet steel at £5.20 per square metre; 0.8 square metres of hide at £9.20per square metre; sidepiece at £4.20. Price increases relating to these raw materials havebeen notified for the year 2005. Sheet steel will fall in price by 10%, whilst hide willincrease in price by 10% and the sidepiece will cost £5.
It takes 30 minutes of labour to punch out the metal, cut the hide and complete theassembly of the product. Labour currently costs the company £4 per hour, and this willincrease by 4% with effect from 1 January 2005.
Semi-variable overheads measured at different levels of output in 2004 were:
182 MANAGEMENT ACCOUNTING
Output Costs (£)
30,500 20,22545,560 27,00263,620 35,12981,040 42,968
Coombs-06.qxd 3/18/2005 1:09 PM Page 182

Notes:
(i) The variable elements of production costs are related to the volume of production.The variable element of selling and distribution costs is related to the volume ofsales.
(ii) During the fourth quarter of the year sales volume is expected to range between18,000 and 24,000 units; production will be set equal to sales in the quarter. Thecompany has been informed that the unit price of materials will increase by 8%in the fourth quarter.
(iii) For the whole of the year the selling price is £30 per unit.
Prepare flexible budgets for the final quarter at production (and sales) levels of 18,000and 24,000 units. Forecast the profit at these sales levels.
3. Omega PLC manufactures a product for which the standard cost data are as follows:
THE CONTROL PROCESS – 1 183
Q1 Q2 Q3
Sales volume 12,000 20,000 18,000 Production volume 15,000 25,000 18,000
Costs (£000)Direct materials 150 250 180Direct labour 130 190 148Depreciation of plant 12 12 12Other production overheads 50 70 56Administration costs 30 30 30Selling and distribution costs 38 50 47
Total costs 410 617 473
Cost per input Cost per unit Units of input unit (£) of output (£)
Direct materials 3 kg 5 15Direct labour 2 hours 4 8Variable overhead 2 hours 2 4Fixed overhead 2 hours 10 20Standard cost 47
Coombs-06.qxd 3/18/2005 1:09 PM Page 183

The budget for the month of April was set at an output of 5000 units and a total cost of£235,000.
The actual output and costs for the month of April were as follows:
Actual output 4800 unitsActual costs (£)Direct materials (14,480 kg) 73,656Direct labour (9700 DIH) 38,800Variable overhead 18,960Fixed overhead 99,000Total costs £230,416
(a) Calculate the following variances and associated subvariances for April: totalcost; Direct material; Direct labour; Variable overhead; Fixed overhead.
(b) Interpret the information provided by the fixed overhead variances in this case.
4. Trimtone Limited’ is a company that manufactures the Trimouse. At the start of theyear the budgeted costs per unit of the Trimouse were as follows:
Direct costs
Direct material: 4.5 kg at £12 per kgDirect labour: Skilled: 3 hours at £14 per hour
Fixed overheads: Overheads are budgeted to be £47,250 per annumOverheads are absorbed on a basis of total labour hours
Budgeted production: 1,500 units
During the period the following costs were actually incurred:
Direct materials: 7,100 kilograms were used, costing £74,550 in totalSkilled labour: 4,275 hours worked at a total cost of £70,110Fixed overheads: Overheads incurred were £52,025Actual production: 1,450 units
The production manager has expressed concern that the total costs seem to be running attoo high a level against budgeted costs forecast at the start of the year. You work in thefinance department, and the production manager has approached you to see if you cananalyse the causes of the problem.
(a) Calculate the budgeted standard cost of one Trimouse.(b) Prepare a statement analysing the high level of costs that are worrying the produc-
tion manager using appropriate materials, labour and overhead variances.
184 MANAGEMENT ACCOUNTING
Coombs-06.qxd 3/18/2005 1:09 PM Page 184

Indicate the weaknesses of the cost report presented above and explain how it could beimproved.
(c) Making use of your results in (b) interpret for management the key features of thefirm’s performance.
5. Wrycooder Guitars is a manufacturer of one standard type of guitar. Its recentbudgetary report for its assembly department for October 2004 is as follows:
THE CONTROL PROCESS – 1 185
Department: Assembly Month: October 2004 (Month 7)Annual output: 24000 guitars This month’s output: 2300 guitars
Annual budget Month’s budget Actuals VariancesCost element (£) (£) (£) (£)
Labour 240,000 20,000 21,340 1,340 AMaterials 480,000 40,000 46,500 6,500 APower 12,000 1,000 1,100 100 ADepreciation 96,000 8,000 8,000 0Totals 828,000 69,000 76,940 7,940 A
Coombs-06.qxd 3/18/2005 1:09 PM Page 185

Chapter 7MANAGEMENT ACCOUNTING ANDTHE CONTROL PROCESS – 2
By the time you have finished studying this chapter, you should be able to:• discuss the relevance of, and improvements which might be made to, standard costing
in contemporary organisational environments;• analyse variances in order to provide the most appropriate information;• calculate the probable benefits of a variance investigation;• outline the theoretical background to the control process;• explain and apply within a management accounting context, statistical control methods.
Further Aspects of Standard CostingIn Chapter 6 we looked at the basics of standard costing techniques and noted that,although based on sound principles, the techniques had a number of limitations in certainenvironments. Here we will look a little further at these limitations and consider approachesthat have been suggested for increasing the efficacy of standard costing.
Let us start with a look at one of the more common ‘extended’ applications of standardcosting.
Within the field of material variances, we have already studied the calculation of mate-rials price and usage variances. Although these are useful variances, it is likely that, in atleast some cases, those held responsible for variances will want to carry the analysis fur-ther in an attempt to isolate the actual causes of the variances and to try resolving them.In the pages that follow, we will see how the various possible factors leading to the exis-tence of a variance may be identified through analysis.
One reasonable, obvious reason why a materials usage variance may occur is that, wherea product involves the use of a mixture of different materials, the actual proportion of mate-rials used may differ from the standard ‘mix’. It is possible to analyse the proportion of the
Key Learning Objectives
Coombs-07.qxd 3/18/2005 1:09 PM Page 186

overall materials usage variance that has resulted from using materials in non-standardproportions. Such a variance may be termed a materials mix variance. The principles ofcalculating and interpreting such variances are illustrated below.
We will also explore other avenues of analysis. Standard costs are based upon standardusages and standard unit costs. In either case the standard itself may be poorly chosen. It istherefore possible, given sufficient information, to isolate the effects of poor planning. Suchanalysis may establish ‘planning variances’ (that is, those caused by poor planning) and maygo even further in attempting to establish the extent to which this poor planning wasunavoidable. The principles are also illustrated in the calculations and discussion below.
Mix Variances
A company produces product X, composed of materials A and B. Standard data forproduct X are as follows :
£Material A: 3 kg @ £3 per kg = 9Material B: 2 kg @ £5 per kg = 10Total materal cost per unit of Product X = 19
Actual data were as followsUnits of Product X produced = 20 units
Actual materials usage:Material A: 55 kg costing £200Material B: 44 kg costing £230
Analysis of materials variances:
Traditional variances:Materials price variances [actual materials @ std materials price – actual materials @actual price]:
£Material A: [55 kg × £3/kg] − [£200] = (35) advMaterial B: [44 kg × £5/kg] − [£230] = (10) advTotal materials price variance = (45) adv
Materials usage variances (traditional):{= [std Q allowed for actual production − actual usage] × std material price}
£Material A: {[20 units × 3kg] − 55 kg} × £3/kg = 15 favMaterial B: {[20 units × 2kg] − 44 kg} × £5/kg = (20) advTotal materials usage variance = (5) adv
THE CONTROL PROCESS – 2 187
Coombs-07.qxd 3/18/2005 1:09 PM Page 187

Check:
Total materials variance == std material cost allowed for actual production
− actual materials cost
£for Material A = [20 units × 3 kg × £3/kg] − £200 = (20) advfor Material B = [20 units × 2 kg × £5/kg] − £230 = (30) advTotal materials variance[= price + usage variances] = (50) adv (correct)
Variances focusing on mix aspects:
Materials mix variance:By comparing the amount of materials actually used with the proportion of each material thatwe would expect to see in the finished product, we can isolate the effects of non-standardmixes of materials. (Note that, actually, we are examining here the proportions of eachmaterial input to the product, rather than the materials mix evident in the process outputs).
What were the standard proportions of materials A and B?Well, in the standards the material quantities were in the proportions 3:2, i.e. 0.6 of the
material content of each unit of product X should consist of material A.We can see that, in the actual mix, there were 55 kg of material within the total of 99 kg
of material used, i.e. a proportion of material A of 55/99 = 0.555r of the actual mix.Therefore there is a mismatch between the standard and actual mixes in that there is a
lower proportion of material A which has the lower standard cost of £3 per kg. Thereforethis will mean that a higher proportion of the more expensive material B will be evident,leading to a higher materials cost per unit of product X.
Materials mix variance == [std proportion of material in actual mix − actual quantity of
material] × std material price
For Material A:= {[0.6 × 99kg] − 55kg} × £3/kg = £13.20 fav
For Material B:= {[0.4 × 99kg] − 44kg} × £5 /kg = £(22.00) adv
_______
Total Materials mix variance = £(8.80) adv
Of course, the mix variance is just one part of the explanation of the non-standard use ofmaterials. It has isolated the effect of non-standard mix from the rest of the materialsusage variance. The remaining part of the materials usage variance, i.e. the ‘mix adjustedusage variance’ is often referred to as the materials yield variance and is calculated thus:
188 MANAGEMENT ACCOUNTING
Coombs-07.qxd 3/18/2005 1:09 PM Page 188

Materials yield variance == [std allowed usage of material
− std proportion of actual materials usage] × std material price
For material A = {[20 units × 3 kg] − [99 kg × 0.6]} × £3/kg = £1.80 favFor material B = {[20 units × 2 kg] − [99 kg × 0.4]} × £5/kg = £2.00 fav
Therefore, total materials yield variance = £3.80 fav
Note: Mix variance + Yield variance = Materials usage variance.
Check: £(8.80) + £3.80 = £(5) adverse (Correct)
The technique of analysing mix variances separately can be extended to most situations wherean element of mix exists. Practising accountants must, however, consider carefully the pay-offbetween cost and complexity/usefulness of information. Information overload is an evil to beavoided and indulging in it can put the accountant at a distance from his/her colleagues.
Although mix variances are used in practice (e.g. in steel and chemical processingindustries) they are sometimes used selectively. Such variances may be used to highlightspecific factors upon which management wishes to focus without necessarily preparing acomplete network of variances. Similarly, such variances may be calculated in non-financialterms only rather than attempting to show the effects on budgeted/actual profits. Furtheranalysis of variances could take many forms. Figure 7.1 suggests some possible avenuesthat could be explored, using a materials cost variance for illustration.
THE CONTROL PROCESS – 2 189
Materials cost variance
Possible analysisby: material type, period, supplier, etc.
Materials yield variance
Materials price variance
Analysis into controllable and uncontrollable aspects
Analysis by cause: e.g.ineffectiveplanning orineffectiveoperations
Materials usage varianceProduction site, etc.
Materials mix variance
Operationalaspects
Planningaspects
etc.
Avoidableaspects
Unavoidableaspects
Figure 7.1 Possible avenues for exploring variances in more depth
Coombs-07.qxd 3/18/2005 1:09 PM Page 189

Another possible way of visualising the richness of possible variance analysis isdemonstrated in Figure 7.2, using materials variance as an example.
A numerical illustrationNow let’s put some numbers to the above variances to see how they would look in prac-
tice. Exhibit 7.1 contains an illustration of the calculation of some of the variances describedabove.
Illustration of a More Comprehensive Analysisof Materials Variances
A company’s materials data for a period were as follows:
Actual data:
Units of product produced = 110 units
Materials purchased and used:Materials X: 230 kg costing £720Material Y: 280 kg costing £500
Budget data:
Budegeted production = 100 units of product
Standard data:Per unit of product
Material X: 2 kg @ £3/kgMaterial Y: 3 kg @ £2/kg
Ex-post (‘after the event’) dataWith hindsight, it is realised that the person who set the materials standards should haverealised that a more realistic usage standard for material X would have been 2.2 kg perunit of product.
Similarly, obvious changes in the market for material Y should have made the personwho set the price standards realise that the standard price for Y should have been set at£1.80 per kg.
190 MANAGEMENT ACCOUNTING
EXHIBIT7.1
Coombs-07.qxd 3/18/2005 1:09 PM Page 190

Analysing the dataLet us construct a table which presents the data available in a readily analysable way:What is the ‘standard mix’? In this example, we can calculate it as follows:
Material
X
Y
THE CONTROL PROCESS – 2 191
Analysis byproduct
Analysis bytype of material
Analysis bysupplier, location,production line,subsidiarysupplier, etc.
Price and usage aspects
Mix and non-mix aspects
AvoidableAvoidable
andand
unavoidableunavoidable
aspectsaspects
Avoidable
and
unavoidable
aspects
Overall cost aspects
Figure 7.2 The multidimensional aspects of (materials) variance anaylsis
Actualmaterials@ actual
price
(i)
230 kgcosting £720
280 kgcosting £500
Actualmaterials
@ stdprice
(ii)
230 kg @£3 = £690
280 kg @£2 = £560
Actualmaterials
in stdproportions@ std price
(iii)
204 kg @£3 = £612
306 kg @£2 = £612
Std quantitiesallowed for
actualproduction,@ std price
(iv)
100 units × 2 kg@ £3 = £600
100 units × 3 kg@ £2 = £600
Actualmaterial
quantities @realistic std
price
(v)
230kg @£3 = £690
280 kg @£1.80 = £504
Std allowedquantities (atrealistic std
usage rate) @originalstd price
(vi)
100 units × 2.2 kg@ £3 = 660
100 units × 3 kg@ £2 = £600
Coombs-07.qxd 3/18/2005 1:09 PM Page 191

Standard mix = 2 kg of X + 3kg of Y = 5 kg in total.
i.e. standard proportions are 40% X to 60% Y, by weight.
The total actual usage of materials was 230 kg of X and 280 kg of Y, i.e. 510 kg in total.
Therefore, the actual materials if they had been in the standard proportions would havebeen in the following proportions:
Material X [510 × 40%] = 204 kgMaterial Y [510 × 60%] = 306 kg
Variance Analysis:
Let us start by calculating the ‘traditional’ materials variances (A = adverse,F = favourable)
Materials price variance (= (ii) − (i) in the table above):
£Material X = £690 − £720 = (30) AMaterial Y = £560 − £500 = 60 FTotal materials price variance = 30 F
Materials usage variance ( = (iv) − (ii)):
Material X = £600 − £690 = (90) AMaterial Y = £600 − £560 = 40 FTotal materials usage variance = (50) A
Now, analysing the materials usage variances further in order to isolate the effects of non-standard mix:
Materials mix variances ( = (iii) − (ii)):
Material X: = £612 − £690 = (78) AMaterial Y: = £612 − £560 = 52 FTotal materials mix variance = (26) A
Materials yield variances ((iv) − (iii)):
Material X: = £600 − £612 = (12) AMaterial Y: = £600 − £612 = (12) ATotal materials yield variance = (24) A
192 MANAGEMENT ACCOUNTING
Coombs-07.qxd 3/18/2005 1:09 PM Page 192

Note that the total materials mix variance [(26) A] plus the total materials yield variance[(24) A] must equal the total materials usage variance [(50) A].
Now, analysing the materials price variances − for Material Y − further, to isolate theeffects of ineffective planning:
Materials price planning variance − for Material Y:
= (ii) − (v) = £560 − £504 = £56 F
Materials price operational variance for Material Y:
= (v) − (i) = £504 − £500 = £4 F
Note that the materials price planning variance [£56 F] plus the materials price operationalvariance [£4 F] must equal the materials price variance for material Y [£60 F − see above].
Taking a similar approach, we can isolate the planning variance aspects of the materialsusage variance for Material X:
Material usage variance for Material X (see above) = £(90) AMaterials usage planning variance [(iv) − (vi)] = £600 − £660 = £(60) AMaterials usage operational variance [(vi) − (ii)] = £660 − £690 = £(30) A
Check:Material X usage planning variance + usage operational variance = usage variance (√).
As mentioned earlier, such analyses as those above can be taken to extreme extents. Wecould, for instance, have calculated the mix and yield variances at the realistic standardmaterials prices, or have used the realistic standard usage rates for X etc. What, however,would these ‘extra’ variances have told us? Well, for such variances to be useful, it mustbe possible for users to understand them. Let us have a go at understanding the meaningof the variances we have calculated above.
Interpreting Mix and Yield Variances
The materials usage variance is a useful indicator of non-standard usage rates but it canbe distorted when materials are used in proportions that are not standard. In Exhibit 7.1,the standards assume that materials will be used in proportions 2 kg of X to 3 kg of Y. Inthe actual mix, these proportions are not maintained.
The adverse mix variance for X tells us that, in total, the use of a non-standard mix costthe business an extra £26. The individual mix variances indicate that the overall £26adverse variance was caused by using more than the standard allowance of X (which ismore expensive) and less of Y (which is less expensive).
The yield variance is simply a reworked usage variance undistorted by the non-standardmix effect.
THE CONTROL PROCESS – 2 193
Coombs-07.qxd 3/18/2005 1:09 PM Page 193

While mix variances can be useful for identifying the effects of non-standard materialsmix, they must be interpreted carefully. Although, for example, using less than the standardproportion of Y has ‘saved’ material costs, this may mean that the product becomes use-less, or that labour costs increase as the product becomes more difficult to operate upon.
A similar approach may be taken to any factors which may be subject to variation inmix, so that variances such as sales mix variances and labour mix variances could becalculated. Again, the full significance of non-standard mixes for quality, marketabilityand efficiency must be considered carefully.
Interpreting Planning and Operational Variances
We analysed, in Exhibit 7.1, the materials price variance for material Y in the aspectscaused by ineffective planning (the sales price planning variance) and by operationalfactors (the sales price operational variance). What can these variances tell us? Again, wemust take care in interpreting them.
The sales price variance tells us the amount by which profits have been affected by theuse of non-standard selling process. Of course, the sales price variance might be causedby one of two factors (or both): increases/decreases in sales price above/below the stan-dard; and the use of an inappropriate standard. That is to say, the sales price planning vari-ance tells us how much of the sales price variance was caused by poor planning; whereasthe sales price operational variance gives us an adjusted sales price variance, undistortedby the effects of this bad planning.
Once again, questions need to be addressed when interpreting the sales price planningvariance, such as:
• How should the realistic standard be established and how should subjectivity beminimised?
• Was the error in setting the standard unavoidable?
Some writers have suggested that planning variances could be split into their ‘possiblyavoidable’ and ‘unavoidable’ components – but we must take care not to get too carriedaway! If we were to follow the route suggested by such authors, it would be possible for amanager to argue that his/her adverse planning variance was caused largely by poor plan-ning and that he/she had not been responsible for setting the standards. Attention would thenpass to the person who had set the standard who, in turn, might then ‘pass the buck’ bysuggesting that the planning error was largely unavoidable. Splitting the materials usagevariance into planning and operational aspects leads us to a similar set of considerations.
Standard Costing in Non-Manufacturing Environments
Standard costing evolved in reponse to a particular type of environment. After all, theterm ‘standard costing’ refers to an environment in which repetitive activities lead to
194 MANAGEMENT ACCOUNTING
Coombs-07.qxd 3/18/2005 1:09 PM Page 194

standardisation of resource usage (standard time, standard resource usage). Such anenvironment exhibited the features of the mass production of components or productsover considerable periods of time.
The nature of today’s business environment is rather different. Long production runs ofstandard products have, in many cases, given way to shorter runs of much more diverseand customised products in response to customer expectations. Wider markets, stimulatedby more effective communications technologies, have also led to businesses’ needing tobecome more flexible and responsive. Consequently, in many but not all cases, the manu-facturing business environment has moved away from the fundamental characteristicstraditionally associated with standard costing techniques.
Of course, the market for services and service organisations has expanded rapidly ashave, in many countries, the size and range of public sector organisations. So, does stan-dard costing still play a useful role in such environments? To an extent, yes.
In modern ‘high tech’ manufacturing environments, elements of standardisation willstill be found. Materials will still be used within products, although the use of thesematerials may change more rapidly as products are redesigned more frequently and asthe business responds to consumer tastes. Direct labour input to products will, how-ever, tend to decrease in relevance as technology is increasingly harnessed. Althoughlabour will still be utilised, this will tend to be more in the nature of a fixed overheadthan a direct variable cost. Thus the nature of labour variances must change. Overheadcosts will become a more significant aspect of the overall cost structure and the emphasisof overhead costs will reflect the greater effort being put into marketing, technologicaldevelopments, communications, and so on. Thus, the traditional cost structures associatedwith standard costing have been replaced by a less standardised, overhead-heavy, morenon-production-biased cost structure.
Although standard costing approaches can still be applied to such situations, severalfactors must be considered:
• the extent of standardised processes;• the benefits to be gained, in terms of improved management information, by apply-
ing standard costing approaches;• the problems associated with trying to ‘force’ ill-fitting techniques into an unsuit-
able environment.
Conversely, the ‘standard’ application of standard costing techniques may be replaced bya more relevant, tailored application by:
• concentrating less on extreme accuracy and detail and more on broader, more strate-gic issues;
• investing less in time-consuming, over-formal systems and, instead, using standardcosting approaches more as a useful aid to planning and cost control;
THE CONTROL PROCESS – 2 195
Coombs-07.qxd 3/18/2005 1:09 PM Page 195

• making increased use of flexible, user-friendly software to increase the speed withwhich standard costing techniques may be used and to increase the ‘disposability’of the standard costs being used.
Each case must be judged on its merits and care must be taken to avoid dogged attemptsto apply outdated techniques. This is, of course, a philosophy that should be followedwherever systems are in danger of becoming outdated or obsolete. Similar questionsabout the usefulness and appropriateness of standard costing apply to non-manufacturingand public sector environments.
Service (Non-Manufacturing) Environments
Service organisations, although they do not produce physical products, share many (stan-dardised) characteristics with manufacturing organisations:
• They employ labour, though the relationship between hours worked and units ofservice provided may not always be clear.
• They incur overheads (occupy buildings, use electricity, pay for insurance, etc.).• They need to market their services at home and overseas.
There are some differences, unsurprisingly, between service and manaufacturingorganisations:
• The level of stocks in a service organisation is likely to be much lower, Althoughconsumable materials may be stored, there can be no stocks of ‘finished goods’in a service organisation. An airline cannot, for instance, carry a stock of unusedtravel slots, or places on chartered flights from previous periods – once they havegone, they have gone! Work-in-progess stocks may need to be evaluated, how-ever, for example in the case of ‘incomplete work’ carried out by solicitors oraccountants.
• There is likely to be a greater emphasis on indirect (overhead) costs, although it isfeasible to treat labour costs as direct to a unit of service output when hours arerecorded to jobs (e.g. in a vehicle repair workshop). Overall, however, and in theshorter term, labour is relatively fixed and is thus essentially an overhead item.
• The focus of the business may be on throughput, rather than on detailed analyses ofessentially fixed costs.
• The focus may be more on the customer, or the major contract, than on repeatedmass output of small-scale units.
The use of traditional standard costing under such conditions is thus questionable.Although attempts have been made to use standard costing within such environments, this
196 MANAGEMENT ACCOUNTING
Coombs-07.qxd 3/18/2005 1:09 PM Page 196

may be more evidence of resistance to change than a case of applying the most appropriatesolution to modern organisational issues. Not a great deal of research appears to havebeen undertaken on the subject of the application of standard costing techniques to non-manufacturing environments, possibly as a result of the lack of ‘fit’ of the techniques insuch settings.
Non-manufacturing environments, with their emphasis on overhead costs, are likely tobe environments in which activity-based costing approaches may be applied to advantage.Drury (2004) mentions the work of Kaplan (1994) and Mak and Roush (1994) whosuggest a specialised application of standard costing to activity costs and cost drivers.The resultant variance calculations, however, give the impression of being an academicexercise with little useful application (or comprehensibility) for everyday non-financialmanagers.
Statistical Approaches toVariance Investigation
We have examined the use of variances to isolate the components of an overall variance.Such analysis will not tell the investigator the answers to the following questions,amongst others:
• What caused the variance?• Was the variance the outcome of a continuing or one-off issue?• Was the variance directly related to other variances (i.e. was the underlying cause of
the variance a single factor or one of several interconnected factors)?• How long it would take, and how much it would cost, to investigate the variance
further?• Would such further investigation be likely to identify the cause of the variance?• Would the cost of the investigation, and any subsequent corrective action, be justified
by the benefits?• How would these benefits be identified and evaluated?
Questions such as these can be presented within a network/tree such as that in Figure 7.3.Such a diagram can be extended almost indefinitely given the number of outcomes thatcan occur (you might want to try this for yourself).
In Exhibit 7.2 we use some data to illustrate the general approach that mightbe taken to the process outlined within Figure 7.3. Again we must be careful here. Theanalysis described in Exhibit 7.2 would be dependent upon a great deal of estima-tions and it would be foolish to get too carried away with the application of suchtechniques.
THE CONTROL PROCESS – 2 197
Coombs-07.qxd 3/18/2005 1:09 PM Page 197

198 MANAGEMENT ACCOUNTING
How long will it take,and how much will it cost,
to find out?
Costs exceedbenefits?
What if we getit wrong thefirst time?
Cause notidentified
Causeidentified
The usualvariance
analysis…
How big was thevariance?
What causedthe variance?
Varianceidentified
Tryagain?
Tryagain?
One-offcause
identified
Recurringcause
identified
Benefitsof
corrective
Corrective actionnot identified
Corrective actionidentified
Take correctiveaction
Unsuccessful? Successful? Continue tomonitor
Quantified varianceanalysis, i.e. calculatingthe size of the variouscomponent variances
Costs ofcorrectiveaction?
Figure 7.3 Variance investigation tree
Coombs-07.qxd 3/18/2005 1:09 PM Page 198

Using the data above we can identify the costs and expected value of benefits resultingfrom an attempt to ‘cure’ the variance. Figure 7.4 displays the data in the form of a ‘prob-ability tree’. In numerical terms:
Application of Statistical Techniques to the VarianceInvestigation/Correction Decision
A company has identified a cost variance for a period. Experienced staff within the companyhave produced the following estimates:
Probability of the variance having a identifiable cause = 70%
Probability of being able to identify appropriate correctiveaction = 60%
Probability of corrective action being successful = 80%
Probable cost of identifying the cause = £100
Probable cost of identifying appropriate corrective action = £80
Probable costs of corrective action = £150
Probable benefits:
if variance is a one-off event = £1000
if variance is recurring = £5000
Probability of variance being caused by a one-off factor = 50%
Please bear in mind that these figures have been made up! We are merely trying to illustratea general approach here. If you think about these data you will see that, in reality, to try toassess all these factors in detail would be highly unfeasible. The likelihood is that, in the prac-tical situation, such techniques would be applied sparingly and, even then, to one subset ofthe problem at a time.
Cost of successfully ‘cured’ variance = £100 + £80 + £150 = £330
Probability of achieving success in curing the variance = 0.7 × 0.6 × 0.4 = 0.168
Probability of the variance being a recurring one = 0.168 × 0.4 = 0.0672
Therefore, expected value = 0.0672 × £5000 = £336
Probability of the variance being non-recurring = 0.168 × 0.6 = 0.1008
Therefore, expected value = 0.1008 × £1,000 = £101
THE CONTROL PROCESS – 2 199
EXHIBIT7.2
Coombs-07.qxd 3/18/2005 1:09 PM Page 199

Therefore expected net value of the investigation and correction process = £336 + £101 −£330 = £107
Therefore the investigation and correction process has a positive value of £107 and is thusprobably worthwhile.
200 MANAGEMENT ACCOUNTING
Benefit = £1000Benefit = £5000
Cause identifiedp = 0.7
Variancecontinues
Action identifiedp = 0.6
Action notidentifiedp = 0.4
Cost of identifyingappropriate
corrective action= £(80)
Variancecontinues
Cause not identifiedp = 0.3
Variancecontinues
Variance isrecurringp = 0.4
Variance is non-recurringp = 0.6
Not successfulp = 0.6
Successfulp = 0.4
Cost of undertakingcorrective action
= £(150)
Cost of identifyingthe cause of the
variance= £(100)
Figure 7.4 Probability tree for Exhibit 7.2 data
Coombs-07.qxd 3/18/2005 1:09 PM Page 200

Of course, we must bear in mind the limitations of such a statistical approach to thisdecision. The reliability of our conclusion is entirely dependent upon the accuracy of theestimated costs, benefits and probabilities in the data used.
Normal Distribution Theory
One of the quantities that would have to be estimated in Exhibit 7.2 is the probabilitythat the observed variance was caused by an identifiable cause (i.e. other than randomfactors). Any variance can be caused by the everyday, random variations that occurin most observed data. Normal distribution theory is based upon the assumption thatdata are often normally distributed around a mean and that the use of standard devi-ation based calculations can identify the probability of an occurrence. Exhibit 7.3illustrates how such statistical techniques could be applied to variance investigationconsiderations.
The Use of Normal Distribution Theory inVariance Investigations
Statistical investigation of past periods has identified that a particular direct unit variance hasa mean value of £100, with a standard deviation of £20. Consequently, a value of £100 hasbeen used as the standard cost per unit for this item. In the latest period, the same cost itemhad an observed value of £130.
The company wishes to use normal distribution theory to decide whether the variance fromstandard (i.e. £30 adverse) is likely to be worth investigating – that is, whether the variance islikely to have an identifiable, non-random, cause.
We can present the data above in a normal distribution graph. In Figure 7.5 the shadedarea X represents the probability that an observed cost of £130 or greater would occur undernormal conditions, that is, that the adverse variance of £30 had a non-random cause.
From normal distribution tables we can see that the probability of a cost of £130 or aboveis only approx. 7% (i.e. a Z score of 30/20 = 1.5), hence there is a 7% probability that thevariance was the result of random unassignable causes. Thus we can conclude that there isonly a small chance that the variance would not have an assignable cause.
How useful is this analysis? Well, we would still need to apply some subjective judgementand the analysis is only as good as our assumptions:
• The probability of the variance’s occurring is only as reliable as the data upon whichthe calculations have been based.
• The value calculated does not give a positive yes/no answer to the question of whetherit is worth investigating the variance. Although in the research world a figure of 5% or10% is sometimes used to indicate whether something is significant, this approach isstill arbitrary to some extent.
• The likelihood that the variance has an assignable (i.e. non-random) cause does notguarantee that it has a readily identifiable cause.
THE CONTROL PROCESS – 2 201
EXHIBIT7.3
Coombs-07.qxd 3/18/2005 1:09 PM Page 201

Control Systems and their Influenceon Organisational Design
The interface between control systems and human behaviour has been a fertile ground forresearch activity. The application of accounting control systems may always lead to unde-sired behavioural consequences, sometimes even resulting in behaviour that is the oppo-site of that which was intended. All management accounting activity, whether in the areaof standard costing, budgeting, decision making or control, carries with it the dangers ofunintended adverse behavioural responses.
As we have seen in this and earlier chapters, enthusiasm to apply a given control tech-nique may lead one to ignore the potential human reactions. Below are some brief sum-maries of some of the noted authors in this area. Fuller summaries of these articles aregiven in the recommended further reading section at the end of this chapter.
Principal–Agent Theory
Principal–agent or agency theory, discussed in more depth in Gietzmann (1995), considersthe behavioural impacts of transactional relationships that exist within and between organi-sational players. In any transaction or business relationship the parties involved will haveunequal amounts of power. The party in the stronger position (the principal) will attempt toenforce his/her requirements upon the weaker party (the agent) via the use of monitoring andcontrol mechanisms. Management accounting systems may constitute such controls. The
202 MANAGEMENT ACCOUNTING
Figure 7.5 Investigation of latest direct unit variance in Exhibit 7.3
σ
100 120 130
area x
Coombs-07.qxd 3/18/2005 1:09 PM Page 202

agent, whose rewards or potential penalties will depend upon being seen to behave in themanner required by the principal, will be keen to be seen to be performing well. Thus theagent may be tempted to induce a degree of bias and incomplete/misleading information intothe system (‘moral hazard’). The agent’s ability to do this will depend on the degree to whicheach party has access to the ‘true position’. Thus ‘information asymmetry’ is a significant factorin the process. Such ideas are of obvious relevance to management accounting, whose effec-tiveness is only as good as the reliability of the information it produces.
Gietzmann (1995) gives an introduction to the underlying principles of agency theory,discussing the inferential control problem, moral hazard, and asymmetric information.Although the principal within a principal–agent relationship can select some form ofreward system (e.g. results-based wages), there is no guarantee that this will result indesirable actions by the agent. Gietzmann describes, and illustrates mathematically, theprinciples and assumptions behind agency cost–benefit calculations when trying to opti-mise the agent’s or principal’s utility.
Chwastiak (1999) claims that principal–agent theory is loaded with capitalist subjec-tivity and that it thus legitimises exploitation of weaker parties – it is in the principal’sinterest. Chwastiak argues that it should have the aim of human enrichment rather thanmaterial gains for the owners of businesses. Accounting is seen as being representative ofthis process of abandonment of human rights/needs in favour of corporate interests. Suchsystems, Chwastiak argues, see humans as a means to an end, and impose a cold ratio-nality on organisational decision making and control systems. Chwastiak argues that account-ing, by taking a more holistic approach, could go some way to righting the balancebetween the means and ends of production.
Contingency Theory
Contingency theory, as it applies to management accounting, states that no one system isideal for all situations. The effectiveness of a control or planning system will be dependentupon the extent to which it ‘fits’ the environment within which it operates. Managementaccountants must therefore be careful to optimise the appropriateness of the systems thatthey produce, and to monitor these systems’ response to change.
Otley (1980) attempts to construct an improved model of a contingency theory of man-agement accounting based around organisational control and effectiveness. He criticisesmany models of contingent variables as difficult to monitor/measure and as oversimplis-tic. He says that it is often ‘impossible to separate the effect of an accounting informationsystem from other controls; they act as a package and must be assessed jointly’. He addsthat a fundamental issue is to find useful and meaningful ways of measuring effectiveness.
Behavioral Impacts, the Aspects of Power and Social Groupingsand the Importance of Ethical Considerations
Robson and Cooper (1989) suggest that organisational goals exist within a ‘social world’and are thus ‘constructions’, so management control systems may be seen as ‘power
THE CONTROL PROCESS – 2 203
Coombs-07.qxd 3/18/2005 1:09 PM Page 203

systems’. They identify several approaches to the idea of power. It is possible, theycontend, to see power as either a positive or negative phenomenon, in the context of man-agement accounting/control.
They examine the implications of different views of the sources/effects of power formanagement control systems and draw the links between their analysis and such areas asprincipal–agent theory and the ‘received wisdom’ regarding the traditionally assumedpurposes of management accounting systems.
Merchant (1998) identifies the need to consider the rights, values and ethics of all stake-holders, and presents a range of socialist and capitalist views of management issues.He argues that a consideration of the ethical aspects of management issues may preventmanagers/management accountants being ‘unreservedly optimistic’. He discusses the dif-ferences between ethical and legal stances and explains that laws can be oversimplistic (e.g.‘do no harm’, ‘never lie’) in a business context, although he argues that some (e.g. ‘do untoothers’) can work quite well. He presents various models of ethics, describing how they mayapply to management control issues. He suggests a framework for analysing ethical issues,which is essentially applicable in a similar fashion to many other decision-making models.
Merchant also gives an analysis of the ethical aspects of the budgetary slack/padding deci-sion (e.g. the advantages of protecting the ‘weak’ against the disadvantages of inherentlyfraudulent practice). He provides similar, interesting analyses of the ethical issues involvedin management control areas such as the ‘massaging’ of earnings and ‘creative accounting’.
Additional commentaries on the role of power and ethics within management account-ing are given by Burns (2000) – see the further reading section at the end of this chapter.
The Theory of Constraints
The theory of constraints is an idea promulgated by Goldratt and Cox (1984). Goldrattargues that commercial organisations should have only one goal – ‘to make more profitnow and in the future’ – thus performance measures must indicate the firm’s progresstowards this goal.
Goldratt argues that by focusing on the ‘cost world’, management accountants tend tocreate ‘local optima’ which are not necessarily congruent with global optima. The theoryof constraints, also known as throughput accounting, promotes the idea that global per-formance (i.e. performance of the whole organisation) may be usefully gauged (Goldratt,1990a) in terms of:
• throughput, which is defined as sales less raw (direct) materials;• inventory, i.e. money invested in things which it is intended to sell (including plant,
property, equipment and stocks);• operating expense, i.e. money spent on converting inventory into throughput
(note that Goldratt’s definitions of these items are not the traditional ones). The overallaim (goal), according to Goldratt, is to ‘increase throughput while decreasing inventoryand operating expense’. Goldratt feels that this focus should be enough to ensure the
204 MANAGEMENT ACCOUNTING
Coombs-07.qxd 3/18/2005 1:09 PM Page 204

Priority Cost-world orientation (focus) Throughput-world orientation
1st operating expense throughput2nd throughput inventory3rd inventory operating expense
Goldratt argues that, although many apparent constraints exist within an organisation,only a few real constraints (bottlenecks) exist, and he calls the process of isolating (andeliminating) these ‘focusing’.
A wider reading of Goldratt’s work (which evolved and developed over time) is neces-sary to fully understand his proposals (see Goldratt, 1990b). Many criticisms have beenmade of Goldratt’s work, for example regarding its potential to increase short-termism,although Goldratt has commented that a contingent/flexible approach should be takenwhen applying the principles of the theory of constraints within any organisation.
The Link between Control and Decision making
One thing should be relatively clear from a reading of the authors mentioned above. Thevarious considerations of ethics, agency relationships and power all have implications forboth control and planning systems. The behavioural consequences resulting from controlsystems set up in the past may also be observed in the future, as a result of the decisionsmade today. In effect, the planning systems of today lead to the control systems of tomorrowand so planning and control systems are part of a continuum, rather than separate entities.This understanding implies that management accountants should consider both aspectssimultaneously within their professional activities.
ConclusionsThis chapter has shown that:
• standard costing needs to be adapted in an effort to increase its appropriateness tomodern business environments.
success of the organisation and, for control purposes, suggests suitable performancemeasures, including:
• net profit (throughput minus operating expense)• return on inventory (net profit divided by inventory)• productivity (throughput divided by operating expense)• inventory turnover (throughput divided by inventory).
Goldratt argues that, to maintain continuous improvement, management accountantsshould change their priorities as follows:
THE CONTROL PROCESS – 2 205
Coombs-07.qxd 3/18/2005 1:09 PM Page 205

• care should be taken not to produce standard costing information that is unnecessary,irrelevant or of little value;
• variances should be analysed in the most appropriate way, to suit the user’s needs;• a significant amount of theoretical background exists to the control process which
can help the management accountant to understand the context and impacts of her/hisactivities;
• among the most significant theories are contingency theory, agency theory andtheories associated with ethics and power.
SummaryIn this chapter we have considered the extent to which standard costing is still relevant intoday’s organisational environment. We have seen that standard costing’s history is in theindustrial, mass-production setting and that its significance may be less today, particularlyin non-manufacturing environments. We have looked at some attempts to increase itsrelevance but have also realised that one should not get too carried away in trying to main-tain a technique for its own sake. We have looked in more detail at some of the behav-ioural theories that underlie the practice of management accounting. It is importantto realise that, when studying such theories, we take a critical and enquiring stance andconsider the practical applicability of such theories to any given setting.
Recommended Further ReadingOtley, D.T. (1980) ‘The contingency theory of management accounting:achievement and prognosis’, Accounting, Organisations andSociety, 5(4): 413–428.Otley attempts to construct an improved model of a contingency theory of managementaccounting based on organisational control and effectiveness.
He cites the contingency approach, according to which ‘there is no universally appro-priate accounting system’. He mentions the work of Charles T. Horngren who argues thatthe management accounting system and the organisation structure are inseparable, and thatof J. Dermer (Management Planning and Control System, 1977), who argues that there isno prescribed system, only possibilities of what might be done in any particular situation.Otley’s empirical results (to 1980) suggested the following contingent variables:
• the effect of technology structure (production technology, task complexity/variety, etc.)• the effect of organisation structure (hierarchy, rigidity, style of budget use, etc.)• the effect of the environment (competition types/force etc.)
Otley suggests that the earlier contingency theory of organisations led to the applicationsto management accounting although, since 1979, the contingency theory of organisationshad been heavily criticised. He refers to the work of a number of writers in this area:
206 MANAGEMENT ACCOUNTING
Coombs-07.qxd 3/18/2005 1:09 PM Page 206

• Bruns and Waterhouse ‘Budgetary control and organization structure’, (1975) suggesttwo modes of control strategy (administrative and interpersonal) suitable for differentorganisational arrangements.
• In 1977 D.C. Hayes published an article, ‘The contingency theory of managementaccounting’, in which he suggests that subunit interdependence, environmental rela-tionship and internal factors of subunits are important to subunit performance.
• L.A. Gordon and D. Miller’s article ‘A contingency framework for the design ofaccounting information systems’ (1976) tried to construct a comprehensive frame-work of contingent variables. Waterhouse and Tiesen ‘A contingency framework formanagement accouting systems research’, (1978) propose a much simpler frame-work with two main variables – environment (simple/complex; static/dynamic) andtechnology (degree of routineness, etc.).
• Dermer suggests that management accounting information system design dependsupon the objectives of the system; the differentiation and decentralisation formchosen; the nature and mix of the processes being controlled; and the managerialstyle of senior managers.
Otley proposes a linear framework of AIS design:
contingent variables—organisational design—type of AI system—organisational effectiveness
He criticises many models of contingent variables as difficult to monitor/measure and asoversimplistic. He says that it is often ‘impossible to separate the effect of an [accountinginformation system] from other controls; they act as a package and must be assessedjointly’.
Otley and Berry (1980) suggest that four characteristics are necessary for effectivecontrol:
• clearly specified objectives;• a measure of the degree of attainment of that objective;• a predictive model of the likely outcomes (of the control system);• the ability and motivation to act.
They add that a fundamental issue is to find useful and meaningful ways of measuringeffectiveness and of gauging the effect of the accounting information system information.
Robson, K. and Cooper, D.J. (1989) ‘Power and management control’, inW.F. Chua, E.A. Lowe and A.G. Puxty (eds), Critical Perspectives in ManagementControl, London: Macmillan, pp. 79–114.Robson and Cooper suggest that organisational goals exist within a ‘social world’ andare thus ‘constructions’, so management control systems may be seen as ‘power systems’.They identify several approaches to the idea of power, some of which are outlined below.It is possible to see power as either a positive or negative phenomenon, in the context ofmanagement accounting/control.
THE CONTROL PROCESS – 2 207
Coombs-07.qxd 3/18/2005 1:09 PM Page 207

Objectivist approaches have a behavioural concern with ‘who has power’. Power is anegative force, denying the interests of others. Empirically:
• pluralism concentrates upon observing conflict as society or organisations try toinfluence others.
• elitism also looks at who decides ‘what is to be decided’, by focusing on observableconflicts.
• radicalism involves identifying the ‘real interests’ of those over whom power isexercised (i.e. not the artificial ‘needs’ into which they have socialised). This, ofcourse, is difficult to do.
Overall, the objectivist paradigm treats power as ‘an exercise and a simple relationbetween individuals’. Few management control/accounting textbooks mention power, itsorigins, forms or effects, except when conflict is at issue (e.g. in identifying who influ-ences budgets and strategies). Very few studies of management control and power takeeither elitist or radical approaches. They all tend to ignore the source of power and tendto focus on the actions of individuals.
The integration approach is concerned with the ‘power to do’, that is, power as an‘economic medium’. In this context, power is legitimised through ‘binding obligations’secured by those with the capacity to do so, via collective, normative consensus. Here,power need not be linked with conflict if societal, normative consensus exists. It recog-nises, however, that ‘common goals’ may arise via manipulation. Power is seen as a prop-erty of societies, through social conditioning, for example at school and via everyday life(a view similar in some ways to that of Foucault). Within this paradigm, the managementcontrol literature sees power as an ‘enabling force’ within a reasonably static and harmo-nious environment. It thinks of principal–agent theory as merely the principal’s problem,and that if the principal is satisfied, so will be the agent. Robson and Cooper refer to workof Michael Crozier, who sees the source of power in the control of ‘critical uncertainties’,and to that of John French, Jr. and Bertram Raven, who identify power as having five mainsources or types – reward; expert; coercive; legitimate; referent. Such ideas, similar to thoseof Talcott Parsons, arise out of the ‘social system’ concept. Some views add that powercomes additionally from environmental, as well as, organisational factors (i.e. from outsideas well as within the organisation).
Marx suggests that power is derived from past actions, economic practices and modesof production. Historical materialism looks at the social transformation and power rela-tionships that derive from different modes of production. Robson and Cooper refer toNicos Poulantzas who sees power as the ‘capacity of a class to realise its objective inter-ests’, but denies that class is the foundation of power. He sees power as being an effectof the levels in the hierarchical order, rather than as residing within the levels (i.e. powertends to overlook the individual as a ‘conscious, self-determining entity’). Robson andCooper point to other factors affecting power, such as state exploitation, gender conflictand racial discrimination, and criticise historical materialism for adding little to ourknowledge of the operation of power in everyday life, while conceding that it does recog-nise power’s historical context.
208 MANAGEMENT ACCOUNTING
Coombs-07.qxd 3/18/2005 1:09 PM Page 208

Robson and Cooper feel that taking a historical materialist approach puts managementcontrol in a historical context and sees management control systems as dynamic and con-tingent, helping to produce the social world in which they operate. Management is seen ashaving little autonomy (i.e. it must follow the wishes of capitalists, in conflict with labour).Standard costing is, for example, seen as a means of transferring specialist knowledge tomanagers who can then control the work, thereby dominating labour. Return on capitalemployed is also seen as a tool of the domination of labour by capitalists. Much academicwork has revolved around the ‘labour process’, the appropriation process, direct surveil-lance and the coercion of productive labour via formal organisation, planning, reward andtraining systems all in the interest of capitalists’ enlarging the capital. They refer to thework of P. Armstrong, who discusses the increasing centrality of the role of accountants inindustry (by taking advantage of their role in the appropriation process).
Concerning disciplinary power, Robson and Cooper also refer to Foucault (1977), whounderlines the notion of progress by the delegitimising of the present. He argues that(through surveillance, regulation of the ‘self’, etc.), power produces knowledge. Foucaultargues that power is exercised more efficiently through invisible, ‘lenient’ approaches toproduce the human being as a ‘docile body’. Discipline can be seen as a form of domi-nation, or as a way of increasing utility. He argues that disciplinary power creates indi-viduals, how to position/judge them and how to induce self-regulation.
Robson and Cooper discuss the implications for management control (and managementaccounting) of the foregoing. The surveillance of managers via cost accounting, budgets andperformance reports increases the domination of (power over) managers and productiveworkers, and faster communications increase the ability to dominate/discipline. Much ofcurrent accounting systems (see Loft, 1995) relates to the control of industry by the militaryduring the war years, as the idea of ‘intelligence’ crossed over to the industrial sector. R&Cconclude that management control practices have not evolved out of a rational need tocontrol/allocate resources. The desire on the part of capitalists and the state to dominate has,they argue, played a big part. Power (if we agree with Foucault) comes with knowledge.
Merchant, K.A. (1998) ‘Management control-related ethical issues andanalyses’, in Modern Management Control Systems, Prentice Hall, pp. 697–712.Merchant identifies the need to consider the rights, values, and ethics of all stakeholders,and presents a range of socialist and capitalist views of management issues. He argues thata consideration of the ethical aspects of management issues prevent managers and man-agement accountants being ‘unreservedly optimistic’. He suggests that senior managers(such as management accountants) have the opportunity to act as ‘moral exemplars’. Hediscusses the differences between ethical and legal stances and explains that laws can beoversimplistic (e.g. ‘do no harm’, ‘never lie’) in a business context, although he argues thatsome (e.g. ‘do unto others’) can work quite well.
Merchant presents various models of ethics, describing how they may apply to manage-ment control issues. He explains that Utilitarianism judges the ‘righteousness’ of actionsbased on their consequences (and the amount of good or bad they cause). He explains thatthere is a need to consider group vs. individual utility giving the examples of the decisionsthat need to be taken wherein ‘the needs of the many outweigh the needs of the few’.
THE CONTROL PROCESS – 2 209
Coombs-07.qxd 3/18/2005 1:09 PM Page 209

Merchant considers the issues of Right and Duties. He poses the question of how we knowwhat rights are or whether they actually exist. He comments on the dangers of the over-proliferation of claimed rights. Justice, Merchant explains, is based on equity, expressedthrough the introduction of systems of penalties, compensation and so on. Additionally,Merchant considers the concept of Virtues – integrity, loyalty, courage etc. – and he describeshow such concepts are difficult to define and impose in the practical situation.
Merchant gives an example of a ‘code of conduct’ and the difficulties its applicationmight cause. He suggests a framework for analysing ethical issues which is essentiallysimilar to any other decision-making model:
• defining the ‘facts’;• defining the ethical issues;• specifying alternative courses of action;• evaluating and choosing the best alternative.
Merchant also gives an analysis of the ethical aspects of the budgetary slack/padding deci-sion (e.g. the advantages of protecting the ‘weak’ against the disadvantages of inherentlyfraudulent practice). He provides similar, interesting analyses of the ethical issues involvedin management control areas such as the ‘massaging’ of earnings and ‘creative accounting’.
Gietzmann, M. (1995), ‘Introduction to agency theory in management accounting’,in Ashton D, Hopper T and Scapens R, Issues in Management Accounting(2nd edition), Hemel Hempstead, Prentice Hall, 259–272.Principal–agent theory or agency theory relates to decentralised organisations and arisesout of the need for delegation. Where delegation exists, the transparency of decision makingdisappears. Agency theory looks at the ‘costs’ of delegation arising out of such unobserv-ability of decision making at other levels.
The organisation can be seen as a set of transactions or relationships between princi-pals and agents and controls designed (with their associated cost effects) to ensure that theagent acts in the best interests of the principal.
Gietzmann gives an introduction to the underlying principles of agency theory, focus-ing on the inferential control problem and on moral hazard.
The inferential control problem is that performance measurement is usually carried outby results/outputs and thus the principal can only infer what efforts/actions by the agentcaused these (imperfectly measured and represented) results. Chance, for instance, willhave some indeterminable effect on results. Similarly, the causal relationship of input/result is not perfectly known by the agent. Agency theory also assumes wealth-maximisingand work-averse (theory X) agents.
Moral hazard concerns itself with the problem that, although the principal can selectsome form of reward system (e.g. results-based wages), there is no guarantee that this willresult in desirable actions by the agent.
The article describes, and illustrates mathematically, the principles and assumptionsbehind agency cost–benefit calculations when trying to optimise the agent’s/principal’sutility. The illustration presented is worth following through to obtain a feel of the
210 MANAGEMENT ACCOUNTING
Coombs-07.qxd 3/18/2005 1:09 PM Page 210

assumptions and quantifications, which would be necessary, if one were to attempt apractical application of the theory.
One issue to consider (again, an illustration is given) is that the effort required toproduce an optimum reward for the agent may not be the highest effort level, nor thatwhich is optimal to the principal.
Throughout the article, the idea of the asymmetry of information is identified, an ideawhich has implications for many areas of management accounting.
Chwastiak, M. (1999) ‘Deconstructing the principal–agent model: a view fromthe bottom’, Critical Perspectives on Accounting, 10: 425–441.Chwastiak claims that principal–agent theory is loaded with capitalist subjectivity andthat it thus legitimises exploitation; that is, principal–agent theory is seen as being in theprincipal’s interest. He argues that PAT should have the aim of human enrichment ratherthan material gains.
Chwastiak argues that principal–agent theory is legitimised by giving the appearance thatit is in everyone’s interest, good for the labour force as well as for the principal. It does soby equating wealth accumulation with self-realisation, thus ignoring the richer aspects of thehuman experience. He argues that principal–agent theory supports the growth of the economy,ignoring human needs. Accounting is seen as being representative of this process of aban-donment of human interests for corporate ones. Such systems see humans as a means to anend, and impose a cold rationality on organisational decision making and control systems.
Chwastiak suggests that such exploitative systems tend to alienate agents and destroytheir potential for autonomy and self-fulfilment. Additionally, such systems, he claims,will tend to have destructive effects upon the environment and world order. Chwastiakrecommends that a system that supports organisational ‘kinship’ rather than partisan rela-tionships (as in principal–agent theory) should be sought and that accounting, by takinga more holistic approach, could go some way to righting the balance between the meansand ends of production.
The rather emotional, left-wing, revolutionary style of the article may not find much favourwith accounting/finance-based readers, but this may be a result of such readers’ entrenchedtraditionalist views (as a result of their conventional business/accounting education?).
Case study: Dayview Ltd
Dayview Ltd was established in 1975 and manufactures a range of night-sighting opti-cal (NSO) equipment. The company was founded by two brothers, Mike and Terry Scope,both of whom had previously worked as skilled engineers in the optical instrumentindustry.
Until 1994, the company had produced its products entirely under contracts withthe British armed forces. Since 1994, it has supplied, also via annual contracts, three over-seas military customers. The new overseas contracts have required modificationsto Dayview’s standard product specifications and have resulted in a total range of sixproduct variations.
THE CONTROL PROCESS – 2 211
Coombs-07.qxd 3/18/2005 1:09 PM Page 211

The Scope brothers have recently become increasingly worried about the declinein volume of their company’s sales to the military and they have been exploring newproduct/market possibilities. Several potential new developments have been identified,including the following:
• Multi-purpose spectacles. A recent discovery by a Dublin-based sunglasses manu-facturer, O’Clea and Co., has made it possible to design spectacles that could pro-vide sun protection during the day as well as enhancing vision if worn at night. Itis envisaged that such a new product would appeal to both the outdoor pursuitsand fashion markets.A tentative agreement has been reached whereby Dayview Ltdwould develop and perfect the products and all marketing services would be man-aged by O’Clea and Co.
• Extension of existing markets. Despite the decline of the military markets, TerryScope is convinced that the company’s existing NSO products could, with someslight modifications, be made attractive to the outdoor pursuits market. Substantialcost savings would have to be made, however, in order to be able to offer suchproducts at prices which would be acceptable to customers in the new market.
The company is quite cash-rich at present and Terry has suggested to Mike and theother shareholders that the company’s surplus liquidity could be used to finance a sub-stantial increase in the company’s manufacturing equipment and storage facilities.
Hitherto, the company has utilised mainly skilled labour-based methods of manufacture,but Mike insists that the proposed product developments would require a considerablemodernisation of production methods, including the introduction of highly automated pro-duction systems and the need to embrace modern ideas such as just-in-time manufactur-ing and total quality management. It is felt by the Scope brothers that the potentialincrease in the company’s markets should counteract the need to make staff redundant asa result of the new technology. Rather, they hope, some of the productive staff will bemoved into administrative roles in order to manage the larger and more complex company.The brothers have already earmarked some of the less efficient production staff for theseroles, including a large proportion of the company’s long-serving employees.
Dayview Ltd’s finance manager, Iris Coffey, is worried about the future, although shehas not expressed her fears to either of the Scope brothers. They are too busy, she rea-sons, with the technical side of the business to be bothered with problems of a generalmanagerial or financial nature. Although Iris’s official duties are financially-orientated, asthe firm has expanded she has additionally become its unofficial general manager andadministrative manager. Her concerns about the future are related to several areas:
• Iris is not a formally trained or qualified accountant. What financial knowledge shedoes have has been acquired through her employment by Dayview Ltd, which shejoined nine years ago. She feels that the planned expansion of the company willplace her ‘out of her depth’.
• Although she has taken upon herself many additional administrative duties, Irisfeels that she will not have the time for these in the future, nor does she feel that
212 MANAGEMENT ACCOUNTING
Coombs-07.qxd 3/18/2005 1:09 PM Page 212

she has the experience or skills to manage the additional (ex-production) staffresulting from Terry and Mike’s reorganisation plans.
• The company’s current financial systems have been developed to satisfy therequirements of Dayview Ltd’s auditors. Apart from a rudimentary standard cost-ing system (which has not been altered, since it was installed by a friend of Mike’sin 1991) and a budgeted profit and loss account which is produced twice a year,there is little produced in the way of management information.
• The demands being made on Iris’s time have meant that a backlog of creditors hasbuilt up this year and several component suppliers are complaining that they havenot been paid for several months. Iris hopes to settle these matters soon and iskeen not to let the Scope brothers know about her inefficiency in this area.
Dayview’s existing production operatives have heard, from Iris, about the Scope brothers’plans. Naturally, they are worried about the security of their future employment and,because many of the operatives rely heavily on piecework bonuses and overtime pay, thereis great concern about of their future roles within Dayview Ltd. Many of the company’s pro-duction workers have worked for Dayview Ltd since it was established and they havebecome very proficient at producing the company’s products well within the standardtimes. They fear that, even if they remain within production roles, the company’s plannednew products and production methods will disturb their comfortable working lives. Someoperatives have started to seek similar employment elsewhere in the local area.
Dayview employs a production manageress, Ida Seymour, who is very keen to maintainthe quality of the company’s products. She is concerned that an expansion of DayviewLtd’s product range, combined with new technology and cost-cutting exercises, could havean adverse effect on quality. Although she has been aware for several years that the pro-ductive workforce is not over-stretched by the existing standard times, she has not relayedthis information to the Scope brothers as she feels that quality would suffer under a morestringent regime.Additionally, the relaxed factory atmosphere has made it possible for herto maintain good social relationships with members of the productive workforce.
Ida is rather worried that the rumoured reorganisation plans would mean her being incontrol of technology and production methods with which neither she nor the workforcewill have had any previous experience. She is also worried that, if staff are moved tooffice positions on the basis of their apparently low efficiency, she will lose the veryworkers who she rates as being responsible for the presently high quality standards.
Given below are examples of Dayview Ltd’s existing reports.
Dayview Ltd
Budgeted Profit and Loss Account for January 2004£ £ £
Sales: Military – UK 95,000Military – overseas 20,000
115,000
THE CONTROL PROCESS – 2 213
Coombs-07.qxd 3/18/2005 1:09 PM Page 213

Materials: direct 20,000bought-in parts 15,000
35,000Direct labour 30,000Factory overhead 20,000
85,000Stock adjustment (15,000)Factory cost of sales 70,000Gross profit 45,000Non-factory overheads (20,000)NET PROFIT 25,000
Dayview Ltd
Budget Report December 2003
Budget Actual Variance %£000 £000 £000
Sales: Military – UK 100 90 (10) (10)Military – o’seas 15 20 5 33
115 110 (5) (4)Materials: Direct 20 23 (3) (15)
Bought-in 12 14 (2) (17)32 37 (5) (15)
Direct labour 22 18 4 18Factory overhead 16 23 (7) (46)Stock adjustment (12) (12) —Factory cost of sales 58 66 (8) (14)Non-factory overheads 20 18 2 10Total costs 78 84 (6) (8)NET PROFIT 37 26 (11) (30)
Dayview Ltd
Standard Cost Card Product NSO 1
Last Update: 21st Nov 1998Units £ per unit £ per unit
of resource of productMaterials: Matl’l A 2 15 30
Mat’l B 1 20 20Mat’l C 10 10 10
60
214 MANAGEMENT ACCOUNTING
Coombs-07.qxd 3/18/2005 1:09 PM Page 214

Components: Comp. L 5 1 5Comp. M 4 2 8Comp. N 1 5 5Comp. O 3 6 18Comp. P 1 2 2Comp. Q 1 12 12
50Direct Labour:
Grade I 2 4 8Grade II 5 5 25Grade III 3 3 9
42PRIME COST 152Factory Overhead@ 30% prime cost 46Total production cost 198GROSS PROFIT@ 40% selling price 132SELLING PRICE 330
1. In a management accounting information system context, identify the main behav-ioural problems which have occurred, and which are likely to occur in the nearfuture, at Dayview Ltd. You should make reference to appropriate literature indiscussing these problems.
2. Discuss the extent to which such problems might be overcome by making changesto Dayview Ltd’s management accounting information system.
3. Analyse the extent to which Dayview Ltd’s present decision-making process followsa classical decision-making model.
4. Suggest improvements which could be made to Dayview Ltd’s current managementaccounting information system in an effort to improve the company’s decision-making, atboth an operational and a strategic level. Be specific about the information required.
Questions1. ‘The necessity for constantly increasing efficiency is a basic fact of business life.
Budgets are utilised as pressure devices for that purpose. But because of theeffect of budgets on people, they tend to generate forces which in the long rundecrease efficency’ (Argyris, 1953). Explain the ways in which budgets can inthe long run decrease efficiency and examine how management can prevent thisoccurring.
THE CONTROL PROCESS – 2 215
Coombs-07.qxd 3/18/2005 1:09 PM Page 215

2. A new management accountant in your company has sent to managers of thecompany the following memorandum:
To: Production Plant ManagersFrom: P. Richards, Management AccountantSubject: Management InformationDate: April 30, 2004
The first area to which I shall be attending is the budgetary control system. In my view themain problems have been those of quantity and quality of information. You have been receiv-ing too little information to control effectively. I intend to provide you with much more infor-mation although, of course, this will mean slight delays in its preparation.
Referring to the issue of quality of information, you have become used to receiving infor-mation that is not accurate enough. You cannot be expected to manage effectively without thebackup of reliably accurate information. I shall therefore be installing new computerizedsystems to increase the accuracy and reliability of the control information that you receive.
As you are aware, the manufacturing process is very complex and technical. It seems thatcurrent budgetary reports are produced in a form that fails to reflect this degree of complexity.I shall ensure that in future the nature of the control information produced matches the tech-nical complexity of the production process.
Finally, there seems to have been some slowness in preparing annual budgets in the past. Inorder to overcome this problem, I shall endeavour to provide you with your annual budgets ingood time. Should you find that problems arise out of using these budgets, please inform meas soon as possible.
The memorandum has received an unfavourable response from plant managers. Discussthe underlying reasons that are likely to have caused the adverse reaction.
3. The production manager at Breaklack has been called to an urgent meeting by themanaging director to discuss his annual performance-related bonus payment.
He has been unhappy in his job for some time, and has found it increasingly difficultto meet the production targets set for him by the sales manager, or to stay within thebudget imposed by the management accountant, and has never had any input into thesetting of these targets. He knows the level of his bonus payment is dependent on meet-ing the targets set, and is fearful that he will not receive enough to pay for the summerholiday he has just booked!
Having never had any training in budgetary control, he finds it difficult to understandthe adverse variance reports that arrive on his desk every two months, or even how his costtargets are worked out in the first place. He has heard the accountant talking about ‘stan-dard costs’ but has no idea what these are. Over the past six months the material priceadverse variance has been increasing dramatically, but he cannot understand why, as allmaterials come from the central stores and are bought by the purchasing manager with-out reference back to the production department.
He has also often wondered why his budget for materials and labour never seems toincrease, even though the sales manager regularly asks him to increase production to meet
216 MANAGEMENT ACCOUNTING
Coombs-07.qxd 3/18/2005 1:09 PM Page 216

an increased level of anticipated sales. He usually manages to meet these increasedtargets, but his staff often have to work overtime to do so. Having discussed the matterwith the production supervisor they were in agreement that increasing productionwas bound to lead to higher costs in some areas – so why was this never reflected in hisbudget?
(a) Discuss the underlying problems with the budgetary control system in oper-ation at the company.
(b) Identify ways in which the system could be improved.
4. Discuss the key factors that would be considered in determining whether a costvariance should be investigated.
5. Examine the interrelationships of budgeting, creativity and culture and discussthe implications of such interrelationships for management control systems.
6. Contingency theory has played a significant role in the management accountingliterature of the past two decades. Critically examine the role of contingencytheory in contemporary management accounting thinking.
7. Various writers have commented upon the prerequisites for control, that is, the con-ditions and control system features that must be in place before effective controlmay take place. Identify and explain the prerequisites necessary for accounting con-trol and analyse the difficulties that might be experienced in achieving them.
8. Discuss the interrelationships between principal–agent theory and performancemeasurement systems within multinational corporations.
9. Critically compare the interpretations of management accounting history of the‘relevance lost’ and ‘traditional/classical’ schools of thought, commenting on theimplications of such interpretations for the practice of management accountants.
10. The theory of constraints as described by Eliyah Goldratt, has generated someinterest in management accounting circles in recent years. Critically examine theconceptual basis of the theory of constraints and evaluate its usefulness to man-agement accounting practitioners.
11. The focus of management accounting research has moved, in recent years, awayfrom a prescriptive/normative mode towards more prescriptive/analytical approaches.Identify the factors influencing this change in research focus, and assess theirimportance.
12. Preston (1995) suggests that relationships exist between budgeting, creativityand culture. Examine the influence of budgetary processes and styles on creativ-ity within an organisation and explain the associated consequences for strategicmanagement.
13. ‘The management accountant’s role is that of a servant of managers, assistingthem by supplying appropriate information. Management accountants thus havelittle need to consider ethical or empowerment issues.’ Give, and justify, youropinion on this statement.
14. Evaluate the significance of principal–agent theory for management accountantsand outline its conceptual and practical limitations.
THE CONTROL PROCESS – 2 217
Coombs-07.qxd 3/18/2005 1:09 PM Page 217

15. Why would anyone take the trouble to study the history of management accounting?Identify the benefits and beneficiaries of such a study, examining critically thework already carried out in this area.
16. Several writers have drawn attention to the ‘contingent variables’ which determinemanagement accounting information systems. Identify, and discuss the signifi-cance of, such contingent variables and examine the practical value of the contin-gency theory of management accounting.
17. Various views exist on whether management accounting has been reactive orproactive in the development of western businesses. Critically analyse the roleplayed by management accounting in shaping the evolution of businesses inwestern economies, and comment on the views of the ‘labour process’ school ofthought.
18. Coad (1999) proposed that the personal orientation of management accountantsmight affect their choice and application of management accounting systems.Evaluate this proposition.
19. Two theories prominent in management accounting thought are principal–agenttheory and contingency theory. For one of these theories:
(i) analyse the main implications for management accounting within a fast-moving environment;
(ii) critically analyse the theory’s underlying assumptions.
218 MANAGEMENT ACCOUNTING
Coombs-07.qxd 3/18/2005 1:09 PM Page 218

Chapter 8OPERATIONALDECISION MAKING
By the time you have finished studying this chapter, you should be able to:• decide how to allocate scarce resources;• use various costing techniques to make decisions on the utilisation of scarce resources;• interpret the results of your analysis and advise management on such decisions;• understand the application of the marginal costing/contribution approach to management
decisions;• recognise the importance of risk in the decision-making environment;• recognise the importance of both quantitative and qualitative factors in decision making.
IntroductionSo far in this book we have looked at the basics of management accounting and costingtechniques. This chapter aims to apply these techniques to reach relevant decisions in the‘real’ world. Inevitably in this ‘real’ world of the management accountant we are dealingwith both quantitative and qualitative factors in reaching decisions, although many tradi-tional textbooks tend to concentrate on the financial aspects of any decision. Hence thischapter will also attempt to recognise those factors other than financial ones which playan important part in the managerial decision-making environment. In this context thechapter develops a ‘qualitative’ matrix which aims to provide a frame of reference formanagers to quantify these non-financial factors as a guide to decisions. This frameworkis seen as relevant to both the public and private sector. The chapter also looks at theimportance of an understanding of risk by managers in the decision-making and businesscycle and how to respond to – or better still prepare for – these eventualities. It is alsovitally important that managers are able not only to understand the information theyreceive but also to interpret such information to maximise the benefits of decisions. In theprivate sector, therefore, the general assumption of profit maximisation is taken. For the
Key Learning Objectives
Coombs-08.qxd 3/18/2005 1:09 PM Page 219

public sector such decisions are inevitably more complex due to their social, political andenvironmental context. It is hoped that as the chapter unfolds it will, through the tech-niques described and developed, provide a frame of reference to assist managers in poten-tially complex situations in whatever sector they work.
Marginal Cost and Marginal RevenueAs stated above, in the private sector the goal of companies has been assumed for sim-plicity to be profit maximisation. Other goals are possible such as sales revenue maximi-sation or just growing the sheer size of the company, which may be measured by suchfactors as the number of employees or the number of subsidiaries it controls. Profit max-imisation can be achieved in the short term through perhaps setting high prices for prod-ucts, or in the long term by some form of market penetration exercise. All strategies willbe reflected ultimately in the amount of product to be produced and sold. In the publicsector the emphasis has traditionally been on the cost of services. A greater emphasis todayis being placed on increasing performance through achieving value for money, defined aseconomy, efficiency and effectiveness in the delivery of services. Where possible, however,more emphasis is also being placed on generating extra revenue as public sector budgetscome under increased pressure due to a lack of available resources from general taxation.
In both the public and private sector the concepts of marginal cost and marginal revenueare relevant. Marginal revenue is the increase in unit revenue which corresponds to anincrease in the unit provision of a service or product produced and sold. Marginal cost isthe increase in cost for a unit increase in the service or product produced and sold. If mar-ginal revenue is in excess of marginal cost then increasing the production or supply of aproduct or service will generate a profit on that unit. If marginal cost exceeds marginalrevenue a loss will occur. In the public sector, for those services where no extra revenuecan be generated because they are provided as free goods, we are dealing with the mar-ginal cost of producing one extra unit of service. There will be no marginal revenue asso-ciated with such services and decisions would be made on the marginal benefit achievedfor clients from the extra expense incurred. In the health service, for example, this can bemeasured by the improved quality of life that an operation can bring.
In decision making in the above context it is important to recognise the use of contribu-tion analysis. ‘Contribution’ represents the difference between the selling price for a prod-uct or service and the variable costs of providing that product or service. It goes towardsinitially covering fixed costs, assuming that the selling price exceeds the variable cost.Once fixed costs are covered it is a contribution to profit. It is clear that in order to use thisanalysis we need to disaggregate costs into their variable and fixed components, making anunderstanding of cost behaviour essential. In this context the traditional format of the profitand loss account which essentially concentrates on a functional format – selling and distrib-ution, administration – provides inadequate information for planning, control or decisionmaking. This is because it does not classify costs by their behaviour.
As can be seen from Exhibit 8.1, the contribution approach divides costs into their fixedand variable elements and then deducts this from the sales figure to arrive at the contribution
220 MANAGEMENT ACCOUNTING
Coombs-08.qxd 3/18/2005 1:09 PM Page 220

margin. As stated, it can be seen that this represents the contribution to cover the remainingfixed cost elements of the expenses. The development of such statements is a decision forthe organisation and should be designed so as to facilitate internal planning, control anddecision making. In designing the format of the statement it is also possible that it canfacilitate the appraisal of managerial performance, in particular where there is segmentedreporting of profit and loss data or to emphasise different elements of the budget. It shouldalso be observed that the results achieved are identical whichever approach is adopted. Allthat has been changed is the classification of costs incurred by the business.
Contribution Statement Compared with a FunctionalFinancial Reporting Type Approach
Contribution Approach Functional Approach
£ £
Sales Income 120,000 120,000
Less Variable Expenses
Variable Production 55,000Variable Selling 10,000Variable Administrative 5,000
70,000 Cost of Goods Sold 59,000*Contribution Margin 50,000 Gross Profit (Margin) 61,000
Less Fixed Expenses Less Operating Costs
Fixed Production 4,000 Selling 30,000Fixed Selling 20,000 Administration 20,000Fixed Administration 15,000
39,000 ______
Net Profit 11,000 11,000
*Cost of sales includes both fixed and variable costs
Assumptions of the Marginal Cost Approach
• Fixed costs remain fixed in the short term, irrespective of the level of activity. • Fixed costs are not directly related to specific units.• Variable costs vary directly in proportion to activity levels.• Total costs can be split between fixed and variable elements.
OPERATIONAL DECISION MAKING 221
EXHIBIT8.1
Coombs-08.qxd 3/18/2005 1:09 PM Page 221

Wage costs are treated as variable as gardeners are brought in and paid a daily rate peracre. This is traditional in the industry, although some of the shrubs require higher skilllevels, hence the different variable costs for wages. No problems have been experiencedin the past in acquiring suitable skilled labour at the budgeted rates.
Fixed costs cover management salaries, business rates on the office premises, sellingand distribution costs. Since the business is classified as a farm, agricultural land is notsubject to business rates.
This problem should be tackled in two stages. The first stage is this to identify the con-tribution per shrub per acre, as land is the limiting factor (Table 8.2). As can be seen, thegreatest contribution per acre of land is from the bay trees. Table 8.3 shows the results forthe growing period, taking account of the existing contract with the National Trust. It canbe seen that bay trees provide the greatest contribution per limiting factor and as suchshould be selected to be grown in preference to the other alternatives.
Using Contribution Analysis for Decision Making
As stated in the Introduction, this chapter is concerned with decision making and there-fore this section examines contribution analysis as a relatively simple but powerful tech-nique in a decision-making context for a service industry.
Weeds R Not Us is a garden centre business of long standing operating in the Vale ofEvesham in the Midlands of England. It can sell all it grows, given the rising interest inits activities following the popularity of gardening programmes on radio and television.The objective of the garden centre is to maximise revenues by growing and selling thoseflowers and shrubs which contribute most to that objective. It has a total of 40 acres ofland that it can access.
As well as passing trade from amateur horticulturists, the garden centre supplies astately home belonging to the National Trust. Under the terms of the contract it must sup-ply 420 begonias, 185 fuchsias, 576 dianthuses and 110 bay trees for each of the next fiveyears. Past experience shows that it can sell up to 4500 shrubs of any type, but these fourshrubs are particularly popular and well suited to the soil and English climate.
The garden centre has considerable experience in budgeting, and Table 8.1 shows thebudgeted cost for the next growing season.
222 MANAGEMENT ACCOUNTING
Table 8.1 Budgeted cost for shrub growing
Begonias Fuchsias Dianthuses Bay trees
No. of shrubs per acre 210 185 192 220Selling price each £16 £19 £18 £21Variable costs per acreSeedlings £160 £220 £240 £325Wages £35 £30 £20 £25Fixed cost per annum £65,000
Coombs-08.qxd 3/18/2005 1:09 PM Page 222

In making the decision to concentrate on bay trees, however, the management would needto consider a range of other factors. Gardening is subject to changing fashions as much asany other business. As such they would need to consider market trends so the historic infor-mation for the centre on sales can only provide a guide to the future. Equally, the businessneeds to be aware of the competition in the area, new housing developments coming intothe area or even industrial decline, as all will have a potential impact on sales in what is adiscretionary purchase. It might be possible to negotiate other contracts to ensure that in theevent of a change in consumer demand the centre will continue to flourish. The business isthus not immune from risk, despite having sold all it can produce in the past. In addition,given that it is a gardening business, the weather will have an important influence.
Financial Modelling using Contribution
The objective of financial modelling is to present a representation of business reality. Inessence, the model should allow various assumptions to be made and then varied in orderto carry out sensitivity analysis. In the context of contribution, one of the more basic finan-cial models that maybe employed is that of break-even analysis. This, can be used to sum-marise the effect that sales volume changes can have on an organisation’s revenues, costsand, therefore, profit. Break-even analysis is often considered under the heading cost–volume–profit analysis. The model is frequently used to present the effects on profits of various deci-sions as many individuals prefer a picture as opposed to a mass of figures and, consequently,
OPERATIONAL DECISION MAKING 223
Table 8.2 Contribution per acre
Begonias Fuchsias Dianthuses Bay Trees
Revenue £3360 £3515 £3456 £4620Variable costs £195 £250 £260 £350Contribution £3165 £3265 £3196 £4270
Table 8.3 Maximum contribution and profit available
TotalBegonias Fuchsias Dianthuses Bay Trees £
Sales to National Trust 420 185 576 110Acres required 2 1 3Acres for bay trees 14Contribution per acre £3,165 £3,265 £3,196 £4,270Total contribution £6,330 £3,265 £9,588 £59,780 £78,963Fixed costs £65,000Net profit £13,963
Coombs-08.qxd 3/18/2005 1:09 PM Page 223

find it easier to understand. It should, however, be remembered that many managers use acomplex range of tools and data to forecast profits or losses and their ability to understandshould not be underestimated. In that sense what follows needs to be assessed as part of thecontribution to a holistic managerial decision-making process.
To build an example of this concept we will assume a company is in the business of mak-ing picnic baskets, amongst other products, for sale to the general public and has providedthe information contained in Exhibit 8.2. The exhibit is structured such that we will calculatethe break-even model first and then use the data in the exhibit to construct further analysis.
The Hardy Out Door Company
The Hardy Out Door Company has obtained data on its production of picnic baskets for sale tothe general public. As might be expected, it is a seasonal business. The financial results for thelast financial year were as follows:
Units produced and sold 5,800Selling price £59.00Fixed overheads 81,000
Variable costs per unit
Wages £25.50Materials £10.20Overheads £2.30
A budget has been prepared for the next financial year, showing the following information:
Units to be produced and sold 6,200Selling price £60.00Fixed overheads to rise by £9,000
Variable costs per unit
Wages £26.50Estimated material costs £10.50Overheads to rise by £0.70
Fixed costs are allocated to the part of the premises used to produce the picnic baskets on thebasis of floor area.
The following results were achieved during the three years prior to the last year. Thus thecompany has sales and cost data for the last four years.
Sales are normally made direct to the public, but a well-known retail company has justapproached the firm with an order of 1000 units. They have indicated, however, that they areonly willing to pay a maximum of £54 per basket.
224 MANAGEMENT ACCOUNTING
EXHIBIT8.2
Coombs-08.qxd 3/18/2005 1:09 PM Page 224

Company management has just heard about the technique of break-even analysis(although you first read about it in Chapter 3) and has requested information regarding thebreak-even point and also the production of relevant graphs based on the predicted resultsfor the next financial year. They also want comments on the information provided.
As stated in Chapter 3, the first step in this analysis is to calculate the contribution for thecoming financial year. Contribution equals selling price minus variable costs:
£60.00 − (£26.50 + £10.50 + £3.00) = £20.00
To calculate the break-even figure we divide the fixed costs (£90,000) by the contribution(£20) which gives the break-even point in terms of the sales unit figure as 4500. Thus,once the company sells 4500 units every extra sale is a contribution to profit as fixedcosts have been covered. Once the break-even figure has been achieved any additionalsales represent what is termed the margin of safety. This means that the company hasa ‘comfort’ zone by which sales can decline before it moves into a loss-making situation.It should be pointed out that sales below break-even are not termed ‘the margin ofdanger’, although in the long term all costs must be covered if any company is tosurvive.
Figure 8.1 shows the break-even chart. The relevant range has been assumed to bebetween 2000 units and 6500 units. Outside this range the assumptions of straight-linerelationships might not hold. As can be seen activity levels below 4500 units represent aloss. In contrast, any activity level above 4500 units results in a profit being made.
Figure 8.2 is an alternative presentation to Figure 8.1, with the advantage of placingemphasis on the total contribution, which managers may prefer.
The third alternative method of presenting the information is shown in Figure 8.3. Thisgraph, as the title suggests, stresses the relationship between sales volume and profit or loss.By reference to the graph it can be seen that if sales are equal to zero the total loss incurredis the amount of the fixed costs. The line representing units produced and sold allows us toread off the profit or loss at any point along that line.
These graphs allow managers to interpret what will happen to company profits under dif-ferent market conditions. In addition, assumptions on price and variable cost, for example, canbe varied again to assess the impact that such changes have on the business and the graphsredrawn for visual impact.
The straight lines drawn in these graphs represent accounting assumptions on cost andprice behaviour and, by their nature, these differ from those made by economists. The effect ofmaking accounting assumptions is that the functions are all linear and that, in the case of the
OPERATIONAL DECISION MAKING 225
Last Year – 1 Last year – 2 Last year – 3
Actual sales 6,100 6,500 6,400Selling price (£) 58 55 54Fixed costs (£) 85,260 81,810 79,905Variable costs (£) 278,750 247,000 249,600
Coombs-08.qxd 3/18/2005 1:09 PM Page 225

226 MANAGEMENT ACCOUNTING
500,000
400,000
300,000
200,000
100,000
01000 2000 3000 4000 5000 6000 7000
Costs and revenue (£)
Units produced and sold
Relevant range
Total cost
TotalVariableCosts
Totalfixedcosts
Profit
Loss
Total revenue
Break-evenPoint
Variable costVariable cost
Fixed costsFixed costs
500,000
400,000
300,000
200,000
100,000
01000 2000 3000 4000 5000 6000 7000
Costs and revenue (£)
Units produced and sold
Relevant range
Total cost
Profit
Loss
Total revenue
Break-evenPoint
Figure 8.1 The break-even chart
Figure 8.2 The contribution graph
Coombs-08.qxd 3/18/2005 1:09 PM Page 226

example shown, there is only one break-even point. The break-even chart can also beamended if stepped fixed costs were involved. All that would happen is that at the ‘step-up’point the variable cost line and the sales revenue line would move up by the amount of thestep to form higher parallel lines. This could result in two break-even points, one below thestep and one above the step.
Setting Target Profits
While management will be interested in the break-even figure as the number of units thatneed to be sold to cover costs, they will be more interested in profits that can be earnedfrom the product. To this extent a target profit figure of £10,000 could be input into thecalculation. One way of doing this is to treat the target as the equivalent of extra fixed costs.In this context we would require unit sales of 10,100 to achieve a target profit of £10,000:(Fixed costs (£91,000) + target profit (£10,000))/contribution (£10). Management can nowassess whether this level of sales activity can be achieved.
OPERATIONAL DECISION MAKING 227
+ 100,000
+ 75,000
+ 50,000
0 1000 3000 4000 5000 6000
− 25,000
− 50,000
− 75,000
−100,000
Profit
Break even point
Units producedand sold
Relevant range
Profit
2000
Loss
Loss
Figure 8.3 The profit-volume-graph
Coombs-08.qxd 3/18/2005 1:09 PM Page 227

The Model in Context
Exhibit 8.2 contains additional information to help set the decision in the real world. Ascan be seen, sales have declined from 6400 units four years ago to 6200 units last year,while the company is now estimating sales at 5800 for next year. Is this reasonable as theprice has risen again? The projected break-even is at 4,500. Table 8.4 shows the results forthe last four years and reveals an interesting picture. Unit variable cost is calculated bydividing the total variable cost by the number of units sold.
The analysis begins to reveal a picture of the company as having a rising cost basewhich it is attempting to cover by raising prices. The price rises undertaken have been suf-ficient to compensate for these cost rises and the break-even target has fallen as the con-tribution has risen over the period. Profits have consequently increased. A significantcontribution to this rise was the fall in fixed costs in the last financial year. In the nextfinancial year fixed costs are predicted, however, to rise by 11%.
Sales are in decline so this raises concerns as to whether the target sales figure for next yearwill be achieved, particularly as the price has again been increased. The break-even salesfigure has been around 4000–5000 units for a while and the projection for next year lies inthe middle of this range. The margin of safety at a projection of 5800 units is clearly 1300,and this may provide a sufficient cushion to absorb any lost sales due to the price rise.
Unit variable costs have remained reasonably stable over the period shown. Furtherrises in these costs are forecasted to occur in the next financial year.
The exhibit comments that fixed costs are allocated to picnic baskets on the basis offloor area. This suggests that other products are being made in the workspace available inthe production unit. A reasonable question therefore concerns whether the rise in fixedcosts results from a change in the basis of allocation and whether this is fair. Furtherresearch is needed.
Outside of financial issues the company would need to consider issues such as designas it is possible that a price rise coupled with a dated design could lead to a failure to sellproduct despite a history of acceptable sales levels. This would be considered in the contextof competitor analysis and risk.
228 MANAGEMENT ACCOUNTING
Table 8.4 Analysis of past performance
Last year Last year −− 1 Last year −− 2 Last year −− 3
Actual sales 6,200 6,100 6,500 6,400Income (£) 359,600 353,800 357,500 345,600Fixed cost (£) 81,000 85,260 81,810 79.905Variable costs (£) 235,600 228.750 247,000 249,600Profit/(loss) (£) 43,000 39,790 28,690 16,095Selling price (£) 58 58 55 54Unit variable cost (£) 38 37.50 38 39Contribution (£) 20 20.50 17 15Breakeven units 4,050 4,159 4,812 5,327
Coombs-08.qxd 3/18/2005 1:09 PM Page 228

With regard to the potential new order for 1000 units at £54 each, as variable costs are£40 there is a contribution of £14 towards fixed costs. Serious consideration can thereforebe given to the order as it represents guaranteed sales and improved cash flow (subject tofinancial appraisal of the retail company). The company may also see this order as com-pensating for any further falls in sales given the historical picture.
Assumptions Underpinning Break-Even Analysis
Relevant Range
The accounting model presented is based on the assumption of linearity over the relevantrange. This is the key to understanding the model and the cost/income behaviours repre-sented. It attempts to provide an accurate picture over the range of output and sales thatthe business can realistically achieve in the planning horizon envisaged. In the case ofFigure 8.1 this might be a range of 2000 to 6500 as shown. Outside this range, theassumption of linearity would not hold. It is within this range that the business hasreliable information on cost and cost behaviour.
Fixed Costs
The assumption for fixed costs again is related to the relevant range, here the accountantassumes that over the levels of activity envisaged the costs the business is committed tomeeting are known and can be represented in a linear manner. It is possible to reconstructthe graph without too much difficulty if the fixed costs follow a stepped pattern as out-lined in Chapter 2.
Revenue Line
The total revenue line again is linear. As you will be aware, if you wish to sell more prod-uct the economist would consider supply and demand and suggest price reductions toachieve higher sale volumes. Here the accountant, however, assumes that the business isoperating in a market where the selling price tends to be fixed in the short term. As statedabove, the figures can be redrawn with alternative selling prices (and costs) to present analternative picture to managers. Again, however, within the relevant range the assumptionof linearity for the total revenue line is assumed to hold.
Time Horizon
The assumptions hold over the time horizon envisaged. Typically, as in this example, thistime horizon is one year. If we consider typical fixed costs, property taxes are normallyknown for a year in advance and it is possible to budget reasonably accurately for man-agerial salaries (including any salary increments or pay rises). Operating capacity willalso be known reasonably well in advance as it takes time to plan and commission newproductive capacity. In the longer term, however, there will be a need to change theassumptions on which the model is based.
OPERATIONAL DECISION MAKING 229
Coombs-08.qxd 3/18/2005 1:09 PM Page 229

Cost Split between Fixed and Variable
The model assumes that it is relatively easy to split fixed and variable costs. In practicethis is not as easy as is suggested, but it has to be done as accurately as possible if themodel is to work. Fixed costs are assumed to be unrelated to the level of activity. Thisassumption will normally only hold true in the short term.
Stock is Ignored
The model takes no account of stock. This is, however, acceptable as basically the modelis trying to influence managerial decision making and as such cannot be totally represen-tative of what will actually happen. It is thus just one of the tools for decision making bymanagment.
Single Product/Constant Sales Mix
The illustration used in this section has concentrated on one product. In more complexanalysis it is possible to assume that sales will be in accordance with a preplanned salesmix. This is carried out by measuring sales volume using standard batch sizes based onthis planned mix.
Complexity in the Production Process
Cooper and Kaplan (1987) undertook an analysis in which they suggest that firmsneed to be aware of the complexity of the manufacturing process where multipleproducts are manufactured. They suggest that many so-called fixed costs vary withthe range of items manufactured as opposed to the volume of manufacture. Thus, ascomplexity related costs do not vary significantly, in the short term the emphasis incost–volume–profit techniques will tend to show a growth in short-term profits asnew product variants are introduced. They will, however, potentially cause a rise infixed costs in future periods resulting in long-term disadvantage to the firm. The workof Kaplan is placed in context by Otley (2001) – see the section on further readinglater in the present chapter.
Consumer Behaviour
While reducing the price of a product should in theory generate more revenue, in practiceconsumer behaviour is complex. A reduced price may cause consumers to question qualityeven if there are no grounds to do so. Fashion changes can also dictate the purchase ofgoods. In the case of wicker picnic baskets the market has been adversely affected by thesale of ‘cool boxes’ as they possess better insulating properties.
To conclude this section, Exhibit 8.3 contains an illustration of the core formulas associatedwith break-even analysis.
230 MANAGEMENT ACCOUNTING
Coombs-08.qxd 3/18/2005 1:09 PM Page 230

Break-Even and Related Formulas
Sales − Variable Costs = Fixed Costs + Profit (or −Loss)
Contribution = Selling Price − Variable Costs
Profit/(Loss) = Contribution − Fixed Costs
Break-even (units) =Fixed Costs
Contribution
Break-even (sales value) =Fixed Costs × Sales Units
Contribution
Margin of safety (units) =Profit
Contribution per unit
Margin of safety (sales value) =Profit × Sales
Contribution
Linear ProgrammingThe earlier garden centre example concentrated on one limiting factor, which was land.In order to maximise contribution the land was allocated to production by reference to thecontribution per limiting factor. In practice, decision makers find that there is normallymore than one limiting factor. In the manufacturing process these might be limited to theavailable labour, the available machine hours and the available materials. Effectively, inour garden centre example the limited factor equivalents to the manufacturing processcould be land (materials) and labour.
The technique used to solve these decision dilemmas is termed linear programming,and this section of the chapter explains how the technique can be applied.
Maximise Contribution
A company manufactures two products, X and Y. During the next budget period it is estimatedthat there will be only 4200 direct labour hours available and that the supply of the commonmaterials used by both products is restricted to 3600 units. Machine hours available arelimited to 4000.
OPERATIONAL DECISION MAKING 231
EXHIBIT8.3
EXHIBIT8.4
Coombs-08.qxd 3/18/2005 1:09 PM Page 231

The budget for the next period shows the following standard information per unit of eachproduct:
Product X £ £ Product Y £ £Standard selling price 40 Standard selling price 59less lessMaterials 6 Materials 8Labour 15 Labour 30Variable overhead 4 Variable overhead 4
25 42Contribution 15 17
Product X uses 3 units of material per unit produced, while product Y uses 4 units of materialper unit produced. Material cost is £2 per unit.
Product X uses 3 hours of labour, while product Y uses 6 hours. The labour rate is£5 per hour.
Variable overheads are allocated on the basis of machine hours. The rate is £1 per hour.Product X uses 4 hours of machine time, as does product Y.
The sales department estimates that the organisation can sell an unlimited number of unitsof product Y, but that X is limited to 550 units.
Clearly this is a much more complex problem for the manager operating in this businessenvironment than the garden centre decision maker, and linear programming is needed tosolve it. Solutions can be found both graphically (two products) and by the manipulation ofmathematical formulas (more than two products). Excel can be used to perform the mathe-matics, and the manager must then correctly interpret the results.
As the term linear programming implies, all relationships are assumed to be linear:
• The contribution per unit produced and sold within the relevant range remainsconstant, and therefore are linear.
• Resources utilised are constant whatever the units produced, and are therefore linear• Units produced and resources allocated/available are infinitely divisible.• The objective is to maximise the contribution.• All variables in the equation must be equal to or greater than zero.
To solve the problem we state it mathematically by setting up an objective function.Denoting the contribution by C, we must
maximise C = 15X + 17Y,
subject to:
materials 3X + 4Y ≤ 3600,labour 3X + 6Y ≤ 4200,machine hrs 4X + 4Y ≤ 4000.
232 MANAGEMENT ACCOUNTING
Coombs-08.qxd 3/18/2005 1:09 PM Page 232

Here the constraints have been expressed by relating the quantities of each resource used by eachproduct against the maximum available resource for each of those elements in the productionprocess. Taking materials as an example, the equation 3X + 4Y means that 3 units of material areused to produce product X and 4 units of material used to produce product Y in the final solutionwhen we know the decision as to how many units of each product will be made cannot exceed3600 units of material. A similar logic applies to each of the other constraints.
To satisfy the final assumption outlined earlier, product X must be greater than or equal tozero but, given the maximum we can sell, be no greater than 550. As Y has no upper limit theassumption here is that product Y must be greater than or equal to zero. This assumption ofnon-negativity avoids getting results which are counter-intuitive. This is expressed as
0 ≤ X ≤ 550, Y ≥ 0.
Let us use the graphical method first. Figure 8.4 shows the constraints plotted for thequantities of the two products that can be produced. The only region on the graph which sat-isfies all four constraints is within the area ABCD. This is known as the feasible region. Outside
OPERATIONAL DECISION MAKING 233
Quantityof X
produced
1600
1400
1200
1000
800 A
600
400
200
D200 400 600 800 1000 1200
Quality of Y produced
X = 800
Labour constraint
Materials constraint
Machine hours constraint
B
C
Contribution = £5100
Feasible region
Figure 8.4 Graphical solution to contribution maximisation problem
Coombs-08.qxd 3/18/2005 1:09 PM Page 233

this region it is not possible to satisfy all four constraints. It is still, however, necessary to findwhich production level for X and Y maximises contribution. If we therefore choose a randomcontribution line of £5,100 this would represent 340 units of X or 300 units of Y. As stated,our objective is to maximise contribution so higher-level contributions can be represented bydrawing parallel lines until we reach the boundary of the feasible region. In this example thefarthest we can move from the origin and still satisfy the constraints is at point C. It shouldalso be noted that the materials constraint lies completely outside the boundary of thefeasible region and it is the other three constraints which are crucial in determiningproduction.
Reading from the graph the maximum contribution is achieved at approximately 600 unitsof X and 400 of Y. This is proved below:
contribution at point A is 800 × £15 + 0 × £17 = £12,000;contribution at point B is 800 × £15 + 200 × £17 = £15,400;contribution at point C is 600 × £15 + 400 × £17 = £15,800;contribution at point D is 0 × £15 + 700 × £17 = £11,900.
As indicated by the word ‘approximately’, it is obviously not always possible to measurefrom a graph the exact output at point C, and consequently a more accurate alternative isto solve the simultaneous equations which can be formed from the binding constraints atthat point:
4X + 4Y ≤ 4000, (1)
3X + 6Y ≤ 4200. (2)
Multiply equation (1) by 3 and equation (2) by 2,
12X + 12Y ≤ 12000,6X + 12Y ≤ 8400.
By a process of division 6X equals 3600, so X is 600. By substitution, Y is 400. This is thefinancial calculation result, but it cannot be divorced from the marketing information. Thequestion in this case is that from marketing we believe we can sell an unlimited number ofY and a maximum of 550 for X. While further research may be needed into these claimsthe results, now that we have a potential production plan produced by solving the equation,indicate that the initial market research supports that production plan.
This can be further developed by use of Table 8.5 to show if it is worth attempting toprocure more of the scarce resources. What the table shows is that we have no spare capacityin either labour or machine hours, but spare capacity in materials. If we could remove theseconstraints would it be worth the company paying a premium to do so. If we take labour, theequations would be revised:
4X + 4Y = 4000 (unchanged machine hours),3X + 6Y = 4201 (revised labour constraint).
234 MANAGEMENT ACCOUNTING
Coombs-08.qxd 3/18/2005 1:09 PM Page 234

Therefore the value of an additional unit of labour is £0.66. This is the opportunity cost or shadowprice. The company is thus able to pay up to £0.66 over and above the present cost of labour andstill obtain a contribution towards fixed costs.
Obviously it is not possible to produce and sell 0.67 units of X and 0.33 units of Y. Outputhas to be expressed in whole numbers, but the basis of the calculation can be used to calcu-late the revised optimal output if extra units of labour are available.
Developing this theme, the company is advised that 50 extra units of labour are availableat £5.50 per hour. This is below the opportunity cost by £0.16. The revised equations are now
4X + 4Y = 4000,3X + 6Y = 4250.
X is now 583.33 and Y is 416.67. This makes the total contribution £15,833. At thislevel of production we still satisfy the material constraints as we would use only 3417units of material. Therefore the decision that the company should take is to buy in the extralabour.
Solving, we obtain
X = 599.67 and Y = 400.33.
Therefore the planned production of X should be reduced by 0.33 and Y increased by 0.33.This is termed the marginal rate of substitution. The change in contribution arising fromobtaining one extra element of labour is
OPERATIONAL DECISION MAKING 235
Constraints used Total at optimum Total Spare Shadow
Constraint available (hrs per product) used capacity price?
Labour 4200 1800 X, 2400 Y 4200 0 YesMaterials 3600 1800 X, 1600 Y 3400 200 NoMachines 4000 2400 X, 1600 Y 4000 0 YesMarket 800 600X 600 200 No
Table 8.5 Shadow prices – resource table
Increase in contribution from Y is (0.33 × £17) £5.61Decrease in contribution from X is (0.33 × £15) £4.95Increase in contribution £0.66
Coombs-08.qxd 3/18/2005 1:09 PM Page 235

Ingredient X costs £20 per litre, and Y costs £40 per litre.The maximum that can be stored on site is 100 litres of each ingredient and the objective
of the company is to decide how much of the ingredients should be added to every 5,000litres of the additive to minimise costs.
minimise Z = 20X + 40Y,
Subject to
3X + 8Y ≥ 600,4X + 4Y ≥ 400,3X + 5Y ≥ 450.
Note the equations are now greater than or equal to the minimum requirements. Thelimitations on storage are expressed by the equations:
X < 100,Y < 100.
Finally the non-negative constraint is X, Y ≥ 0.Figure 8.5 shows the graph obtained by plotting the constraints. The feasible region is
bounded by the points P, Q, R, S and T. Drawing in the minimum cost line Z = 20X + 40Yand moving this line inwards towards the origin would give the minimum cost at thenearest point of the feasibility region that the line would touch to the origin. This is point Q
Cost Minimisation
The above example has concentrated on maximising contribution, but managers mayalso be interested in cost minimisation. This is illustrated in the following examplewhich relates to a business manufacturing a fuel additive, Polycon, for tractors toimprove engine performance. Every 10,000 litres of the product requires three elements:600g of A, 400g of B and 450 g of C. In order to obtain these additives, it is necessaryto purchase two ingredients, X and Y, which contain them. This information is set outbelow:
236 MANAGEMENT ACCOUNTING
EXHIBIT8.5
Composition (g) of
X Y
Additive A 3 8Additive B 4 4Additive C 3 5
Coombs-08.qxd 3/18/2005 1:09 PM Page 236

and the minimum cost is 66X + 50Y = £3,300. This could also be solved by using the simulta-neous equations for point Q: solving
3X + 8Y = 600,3X + 5Y = 450.
gives X = 66.67 and Y = 50. Thus if the company is to achieve its decision objective ofminimising the cost of the additives while satisfying all constraints, it would mix 66 units ofX and 50 of Y in each batch of 5000 litres produced.
OPERATIONAL DECISION MAKING 237
Litresof XLitresof X
200200Y = 100Y = 100
175175
150150
125125
PP X = 100X = 100 TT
SS
100100
7575 QQ
Feasible region Feasible region
5050
RR
2525
2525 5050 7575 100100
Litres of YLitres of Y
3X + 8Y = 6003X + 8Y = 600
3X + 5Y = 4503X + 5Y = 450
Z = 20X +40YZ = 20X +40Y
4X + 4Y = 4004X + 4Y = 400
Figure 8.5 Graphical solution to cost minimisation problem
Coombs-08.qxd 3/18/2005 1:09 PM Page 237

Relevant CostingIn making managerial decisions it is essential that managers recognise the importanceof considering only relevant costs and benefits. This section looks at these issues. Itdeals first with financial costs and benefits, and then goes on to develop a technique toenable managers to consider qualitative issues in decision making. In financial terms,the relevant costs and benefits relate to the future cash flows of the organisation whichwould differ as a result of implementing the decision. This type of analysis thusconcentrates on the incremental or differential changes that must be considered. Anycash flows that would remain the same for any alternatives that are being considered areirrelevant.
This section considers four areas:
• ceasing (or shutting down) production of a product or service;• the make or buy decision;• pricing;• special orders.
Cessation of Production of a Product or Service
Managers are frequently required to consider whether a particular product, service orsection is unprofitable and thus should be discontinued. It is particularly important thatmanagers define closely what is meant by ‘unprofitable’. Even if a product or service isseen as making a ‘loss’ if its variable costs are less than its selling price, it is making acontribution towards fixed overhead. Clearly this contribution would be lost if produc-tion or supply ceased. It may also be the case that sales of other products or services maysuffer.
Ceasing Production
Country Limited makes three products (picnic baskets, picnic seats and picnic tables) anduses an absorption costing basis. In addition, you discover that production overheadsof £333,000 consist of £200,000 which are fixed. The variable element for each of thethree products is: picnic baskets, £3,000; picnic seats, £45,000; and tables £85,000.Non-production overhead is entirely fixed. There are no opening and closing stocks as allitems are made to order, with just-in-time management techniques.
The information in Table 8.6 has been extracted from the budget forecast for nextyear. In order to reach the correct decision the above information is recast as shown inTable 8.7.
EXHIBIT8.6
238 MANAGEMENT ACCOUNTING
Coombs-08.qxd 3/18/2005 1:09 PM Page 238

It can be seen that in Table 8.7 the restated budget for picnic baskets neither makes a profitnor contributes towards fixed overheads. It would thus appear that the decision on a profitmaximisation basis would be to close this line. However, we need to give further consideration toa number of points:
• The accuracy of the budget forecast; here we could consult historical data, for example.• The obviously integrated nature of the product mix, as closing picnic baskets may cost
the company sales. They may even be included as a loss leader or even frequently givenaway with the table and chair sets to further encourage sales.
• Are the figures for the variable element of production overhead accurate?• If the decision to close the picnic basket line is to be made, managers need to consider
its contribution to the long-term business plans of the organisation.• As all stock is bought on a just-in-time basis there are no stock holding or stock pricing
costs, but does the budget reflect agreed contract prices with suppliers?
OPERATIONAL DECISION MAKING 239
Picnic baskets Picnic seats Picnic tables Total
Sales (units) 2000 24000 6000 32000£ £ £ £
Sales revenue 31,000 480,000 600,000 1,111,000Direct material – variable 18,000 150,000 80,000 248,000Direct labour – variable 12,000 100,000 90,000 202,000Production overhead 8,000 150,000 175,000 333,000Non-production overhead 15,000 25,000 40,000 80,000Profit (loss) (22,000) 55,000 215,000 248,000
Table 8.6 Country Limited absorption budget statement
Picnic baskets Picnic seats Picnic tables Total(£) (£) (£) (£)
Sales 31,000 480,000 600,000 1,111,000
Variable costsMaterials 18,000 150,000 80,000 248,000Labour 12,000 100,000 90,000 202,000Overheads 3,000 45,000 85,000 133,000
33,000 295,000 255,000 583,000
Contribution (2,000) 185,000 345,000 528,000Fixed costs 280,000Profit 248,000
Table 8.7 Country Limited restated contribution budget statement
Coombs-08.qxd 3/18/2005 1:09 PM Page 239

• The contribution on picnic baskets is only a small negative, so could the price beincreased.
• Are any efficiency gains in the use of labour and materials possible?
The above points concentrate on financial issues only and we will return in the final sectionof this chapter to consider the qualitative issues concerning such decisions.
Make or Buy Decisions
Where a company carries out several processes within the value chain, it is following apolicy of vertical integration by controlling all aspects of production. While this may havea number of advantages for the company in terms of control of the supply process, it maynot necessarily be the most cost-efficient way of managing the business. Thus a decisionto make the part or buy it from an external supplier is naturally termed a make or buy deci-sion. By buying from a supplier, that supplier can potentially maximise the benefits ofeconomies of scale which may also result in better quality and not just lower prices.Obviously there are situations in which a company would never consider subcontractingproduction, for example, where it would put its competitive position at risk either throughdisclosing trade secrets or risking poor quality.
Avoidable and Unavoidable Costs
Tenby Ltd. produces product X, for which the following information is available:
An outside UK-based supplier has indicated that it can supply the 10,000 units required at aprice of £20 per unit. The question for Tenby is what are the avoidable and unavoidable costsof producing product X. These costs are set out in Table 8.8.
As can be seen, the price differential in favour of in-house manufacture is £1.50 per unit –£15,000 for 10,000 units for the budget period. Depreciation is a sunk cost in relation to
240 MANAGEMENT ACCOUNTING
EXHIBIT8.7
Cost category Unit cost (£)
Direct materials 10Direct labour 5Variable overhead 1Section Supervisor 2.5Depreciation 2Fixed overhead 4Total 24.5
Coombs-08.qxd 3/18/2005 1:09 PM Page 240

product X and may be for special machinery to make the product, but it is ignored in thedecision. The fixed overhead represents general overhead apportioned to the productand as such is unavoidable. All other costs are relevant to the decision as they vary withthe production of the product; in the case of the supervisor, this cost can be avoided byredundancy.
If we assume now that the supervisor would be entitled to a redundancy payment of£12,500 on top of the above calculation, then we can see that there is still a cost differentialin favour of manufacture of product X, even if now it is only £2,500. This requires furtherthought, however, in that if in the next budget period the alternative supplier came forwardagain, how would we treat this cost? In this situation the company has already effectivelyused the £12,500 once to make the ‘make’ decision and as such should only count £2,500 asbeing unallocated. Next year (and assuming no other changes) the decision would be to buy.A more sophisticated analysis would incorporate discounted cash-flow analysis, which will bediscussed in Chapter 9.
Finally, in this section opportunity cost needs to be mentioned. It has been assumed in theabove example that the capacity potentially released by a buy decision will be idle. It could,of course, be used to manufacture an alternative product. If this were possible then Tenbywould need to consider the value of the opportunity forgone in reaching its decision. Thishas particular implications for the use of the specialist machinery mentioned above.
Relevant Costing Explored
Relevant costs and revenues are those that will occur in the future and are relevant tospecific decisions. The idea of cost relevance can be illustrated as follows.
A company has 100 components in stock at a manufacturing cost of £100,000, but theprospective customer can no longer afford to pay for them and it has proved impossibleto find an alternative customer for the components. Two alternative uses for the compo-nents have been identified (see Table 8.9):
OPERATIONAL DECISION MAKING 241
Cost Budgeted Avoidable Cost category Unit Cost (£) Per Unit (£)
Make Buy
Direct Materials 10 10Direct labour 5 5Variable overhead 1 1Section supervisor 2.5 2.5Depreciation 2Fixed overhead 4Total Cost 24.5 18.5Purchase Price 20
Table 8.8 Avoidable costs
Coombs-08.qxd 3/18/2005 1:09 PM Page 241

• Convert them into garden gnomes at a cost of £30,000 and then sell them for£50,000, incurring carriage costs of £1000.
• Scrap the components for £5000. Carriage costs will also be £1000.
This approach gathers together all the costs and revenues. However, in terms of thedecision whether to convert or scrap the components, not all of the costs are relevant. Thenon-relevant cost in this case is that of manufacturing: this is a historic or ‘sunk’ cost andhas already been incurred, whichever decision we make. We can remove it from Table 8.9,to give the statement in Table 8.10. As the statement shows, the preferred option is con-version. Conversion will lead to an increase in future net cash flows of £19,000, whereasthey will increase by just £4,500 under the scrap option.
Relevant costs have the following characteristics:
• They are future costs.• They are differential costs (they differ between different alternatives).• They are decision-specific (if you change the decision, the relevant costs will
change).
242 MANAGEMENT ACCOUNTING
Conversion (£) Scrap (£)
Revenue 50,000 5,000Costs
Manufacturing 100,000 100,000Conversion 30,000Carriage 1,000 500
Total costs 131,000 100,500Loss 81,000 96,500
Table 8.9 A conventional approach to identifyingrevenues and costs
Conversion (£) Scrap (£)
Revenue 50,000 5,000Relevant costConversion 30,000Carriage 1,000 500Total relevant costs 31,000 500Net cash flow 19,000 4,500
Table 8.10 Relevant costs and revenues
Coombs-08.qxd 3/18/2005 1:09 PM Page 242

We now examine the application of relevant cost principles in three cost areas: salariesand wages, materials and depreciation.
Salaries and WagesIf there is spare capacity in the workforce, the relevant cost of wages is zero if the work-force is paid whilst spare capacity exists. If there is no spare capacity, the relevant cost oflabour may be represented by the following cases:
• The costs of overtime working when the existing workforce is required to workovertime to complete the project. In this situation the relevant cost is the cost ofovertime working.
• The cost of bringing in new workers to cover for existing workers when this is doneto take work off existing workers to allow them to work on a new project. In thissituation, the relevant cost is the cost of the replacement workers.
• The contribution that is lost when workers are transferred from another project. Thisoccurs when the labour force is fully employed and where workers must be movedaway from one profitable area in order to work on another. In this situation, therelevant cost of labour is its opportunity cost.
MaterialsThe relevant costs of materials depend initially on whether the materials are to be pur-chased or are in stock. If they are to be purchased, then the relevant cost is the futureacquisition cost of the materials.
If they are already in stock, then the book value (or the historic cost of the materials) isirrelevant, as it is a historic or sunk cost. However, materials in stock do have a relevantcost. If the materials are in continuous use within the business, then the relevant cost isequal to the replacement cost of the materials. This is because, if materials are in contin-uous use, once they are used they will be replaced. If, on the other hand, the materials arenot in continuous use – for example, they are obsolete, ordered in error or have becomesurplus to requirements – then their relevant cost is their opportunity cost and this may beestimated as the greater of their net realisable value and their value in alternative use.
The net realisable value is equal to the sales proceeds less the selling costs, for example,carriage. The value in alternative use is the saving obtained by using the material elsewherewithin the company, for example, in place of another material that is currently in use.
The following example demonstrates the application of these principles to the relevantcost of material. A contract requires 1000 kg of material A, 500 kg of material B and 200units of C.
Material A is in continuous use by the company. The company currently has 400 kg instock at a total book value of £2000. Future purchases of material A will cost £5.20 perkilogram.
There are 100 kg of material B in stock, with a total book value of £350 if used on thecontract. Material B will not be replaced. It has no anticipated use other than disposal for£1.20 per kilogram. Its replacement cost is £2.80 per kilogram.
OPERATIONAL DECISION MAKING 243
Coombs-08.qxd 3/18/2005 1:09 PM Page 243

There are 300 units of C in stock. This material is not in regular use by the companyand would realise only £1.50 per unit if sold, whereas its original price was £2.75 per unit.Its replacement price is £2.50 per unit. However, the stock of C could be used in the busi-ness in place of another component, Y, if £1.20 were spent on the conversion of eachunit of C. Y is in continuous use by the business and its current replacement price is£2 per unit.
Table 8.11 summarise the relevant costs for this example
DepreciationDepreciation is based upon the historic cost, estimated life and estimated scrap value offixed assets. Because deprecation is related to historic or sunk cost, it is not a relevantcost. However, the use of equipment that is owned can have a relevant cost, as is illus-trated in the following situations:
• Using equipment on a project may result in a reduction in its resale value as a resultof the additional wear and tear or because holding on to the asset reduces its resalevalue. In both cases the reduction in resale value may be regarded as a relevant cost.
• Equipment may be hired out to other companies. If such equipment is to be used ona project, then the hire charge revenue that is forgone by the company should beregarded as a relevant cost.
244 MANAGEMENT ACCOUNTING
Material AMaterial A is in continuous use and so all material to be used should be valued at replacement
cost. 100 kg × £5.20 520The book value is sunk or historic cost.
Material BMaterial B is not in continuous use and the relevant cost of materials in stock is its opportunity
cost. £1.20 × 100. 120Additionally 400 kg. will be purchased at a cost of 400 kg × £2.80. 1120The book value is sunk or historic cost.
Material CThere are sufficient items in stock. Material C is not in regular use and its relevant cost is its
opportunity cost. If sold, it will realise 200 kg × £1.50 = £300.If converted and used in place of Y, it will save the company 200 kg × (£2 – £1.20) = £160.C’s opportunity cost is the higher of these 300The book value is sunk or historic cost.
Total relevant cost of materials £2060
Table 8.11 Relevant cost of material, and explanations
Coombs-08.qxd 3/18/2005 1:09 PM Page 244

Reviewing a Project
A project which to date has cost the company £50,000 is under review. It is anticipated that,should the project be allowed to proceed, it will be completed in one year when it willgenerate income of £250,000. Shown below are the additional expenses that the managingdirector estimates will be necessary to complete the work.
• Materials, £90,000. These have just been received and paid for. They have cost £90,000and if not used on the project would have to be disposed of by special means at a costof £5,000.
• Labour, £60,000. The men are highly skilled and very difficult to recruit. They have beentransferred to the project from a production department and, at a recent board meeting, theworks director claimed that if the men were returned to him he could earn the companyeach year a contribution of £80,000 over and above the cost of materials and labour.
• Project staff, £40,000. A decision has already been taken that this will be the last projectundertaken, and consequently when work on the project ceases, the staff will be maderedundant.
• Share of general building services, £35,000. The managing director is not very sure whatis included in this expense. He knows, however, that the accounts staff apportion similaramounts each year to each department.
OPERATIONAL DECISION MAKING 245
EXHIBIT8.8
Revenue £
£150,000 is future income and is relevant 250,000
Costs
£50,000 is a sunk cost and is not relevant
Materials. Historic cost is not relevant as the materials have been delivered and paid for. (5,000)However, if the company does not proceed with the contract, the relevant cost of disposalwill be saved if the company proceeds with the contract.
Labour. In this case the £60,000 cost of labour is a common cost as it will be incurred whether 140,000or not the company goes ahead with the project. The works director estimates that the labourcould earn a contribution of £80,000. As this is is after deducting labour costs, which are notrelevant, the company will loose (£80,000 + £60,000) as a result of undertaking the contract.This the opportunity cost of labour in this case.
Project staff. This is a relevant cost as it will only be incurred if the project goes ahead. 40,000
Share of building services represents an apportionment and is a common cost that will beincurred irrespective of whether the project proceeds.
Total relevant costs 175,000
Net cash flow 75,000
Table 8.12 Calculation for Exhibit 8.8
Coombs-08.qxd 3/18/2005 1:09 PM Page 245

Assuming the estimates are accurate, and given that Table 8.12 shows that the net cash flowis positive, the managing director is advised to allow the project to proceed.
Qualitative Factors in Decisions
The above section covered the financial analysis in make or buy decisions but qualita-tive factors can be important. The following applies a public sector technique knownas desiderata to such analysis. While it is normally used on capital projects, thereis no reason why it cannot be used in the private sector in this or any other type ofdecision.
As was seen in Exhibit 8.6, Tenby considered on a financial basis that the makedecision was the correct one. We will now add an overseas supplier to the equationwho has come in with an offer price of £18.00 per unit. Should Tenby thus use thissupplier?
The company now needs to draw up a list of other issues (the desiderata) which affectits choice. This would be done possibly by a team of individuals to ensure all factors areconsidered. Table 8.13 illustrates the result of such discussions.
In terms of the factors identified for this company, we can see that the make decisionscores highest. Other managers might include other factors, such as exposure to foreignexchange risk. The financial decision, while marginally favouring buying from overseas,
with the new information provided is outweighed in this instance by the qualitative factorsnow input into the decision. Managers would need to assess the significance of this result.The advantage of the use of desiderata is that quantitative information has now beenexpressed in numeric terms. Obviously such information is subjective, but it is an attemptto move the debate over such issues forward to give managers more information in a man-ageable format to arrive at the correct decision for their company. The technique can also
246 MANAGEMENT ACCOUNTING
Table 8.13 Desiderata table for make or buy appraisal
Criteria Option 2 important Weights in Option 1 score: UK Option 3to Tenby the decision score: make source score: Overseas
Reliability of Supply 25 25 20 10Impact on motivation 15 12 8 7
of company workforceCustomer reaction 10 5 5 5Quality of supply 50 45 40 28Total benefits 100 87 73 50
Coombs-08.qxd 3/18/2005 1:09 PM Page 246

be used in a variety of decision-making situations and is further explored in Chapter 9when capital investment decisions are considered.
Pricing Decisions
There are two types of pricing decision, which relate to either internal customers or externalcustomers. In the former case, one division of an organisation charges another for goodsor services provided, and this is known as transfer pricing. In both the public sector andprivate sector such transfer prices may be subject to an internal service level agreementwhich is effectively an internal contract for the supply of goods or services at a set priceand set quality.
Cost Plus Pricing
In simple terms, the pricing decision is about covering costs and earning a mark-up whichrepresents profit. The problem comes in what to include in the costs. One approach couldbe to take prime costs (all direct costs) and add production overheads to give the full pro-duction cost. Full production cost would then form the basis for the addition of the mark-up percentage (say, 25%). By this method the firm has a cushion in the price for anybudget variation, but there is no guarantee that the price at 25% over production costs willcover other non-productive costs such as selling and distribution and give a satisfactorylevel of profit. The alternative is to include non-production costs in calculating the unitcost of output and then to add the mark-up percentage. By this method the companywould hope to reduce the failure to cover all its costs. The final alternative, cost plus,would be to calculate the variable cost per unit of production and then add on a largeprofit mark-up to cover all fixed costs (production and non-production), but this is a high-risk strategy as all fixed costs might not be covered. In addition, whatever price is set, thecompany would need to consider the marketplace and the actions of its competitors as thepercentage mark-up needs to be realistic in terms of achievability.
On page 229 we looked at the issue of a special order and recognised that the companywould accept the order as the price was above unit variable cost. Production and non-production overheads were unaffected by this decision and the order represented cashflow to the company. There is, of course, a danger that other customers could hear of thediscounting on normal selling price and therefore expect similar treatment.
Lowering the price raises the issue of selling below costs and whether this is accept-able in any circumstances. The following suggestions are made:
• A new product is being introduced and the company wishes to create demand so itsets a price below cost in anticipation of raising the price later. There is, of course,a danger that this may not be possible.
• The market is in recession and as such a company needs cash flow. It would, ofcourse, hope to cover variable costs at a minimum as in the short term it can ignorefixed overheads to generate cash flow.
OPERATIONAL DECISION MAKING 247
Coombs-08.qxd 3/18/2005 1:09 PM Page 247

• Product life cycles are important. In the early days of the product, when there is adesire to recover the investment costs, a high price (coupled with a positive con-sumer image) will be set. As the product moves through its life cycle prices may bereduced to continue to sell the product. In this context the decision maker is into lifecycle costing, under which an attempt is made to track budgeted and actual costsand associated revenues through each stage of the product life cycle.
• Predatory pricing (loss leading) may be used to enter a new market and attract salesand potentially customer loyalty.
• Defensive pricing to defend the market from a potential entrant to ensure that themarket is unattractive to that potential entrant.
• To use spare capacity (as with a special order) since fixed costs would be coveredby the normal activities and pricing policy of the company.
Target Costing
Under this system management would set a potential target price based on capturing anenvisaged share of the market. The firm will thus take direct account of market intelli-gence and will build the product (or provide the service) to this target price. The priceobviously builds in a profit percentage, and costs are budgeted to come in below thisfigure. The advantages of this method are as follows:
• The price is set in advance based on specific market intelligence and requiresdetailed consideration of all relevant strategic information.
• Once the price has been established tight budgetary control is vital if planned profitsare to be delivered. Once the price is set managers are forced to find savings if oneparticular element of the budget shows increased costs, otherwise the company’sstrategy is at risk of failure.
• It overcomes the problem of cost-based prices which can ignore the marketplace. Interms of the delivery of a service, for example, it is not unusual for public sectororganisations to simply increase prices by the rate of inflation (usually from 1 April)without any demand analysis. This clearly ignores market information.
Transfer (Internal) Prices
It is quite common for larger organisations to employ an internal market system whereone segment of the entity will trade with another to encourage efficiency. Under thissystem income for one segment is expenditure for another, although when the consoli-dated accounts of the organisation are compiled these transactions will cancel each otherout. It is important that these internal prices are set to optimise the results for the businessas a whole and not to encourage suboptimizing where the goals of a segment are seen asmore important by managers in the segment than the best interests of the company as awhole. The summary of the article by Spicer (1988) at the end of this chapter places trans-fer pricing in an organisational context. The topic is also developed further in Chapter 10.
248 MANAGEMENT ACCOUNTING
Coombs-08.qxd 3/18/2005 1:09 PM Page 248

The objectives of a system of transfer prices should be to:
• report results for each segment which reflect the managerial performance of thesegment or division;
• motivate individual managers to make sound decisions such that their results alsoimprove the results of the company as a whole;
• support segment autonomy while not undermining decision making in the organi-sation as a whole.
There are a number of alternative bases for transfer pricing available including: nego-tiated prices, opportunity cost, total cost, variable cost, and adjusted market price.
In these decisions the role of the management accountant is to supply decision-relevantinformation and to interpret that information. In giving advice on setting transfer prices,whatever price is to be charged will be based around the objectives set out above.
ConclusionsThis chapter has:
• used various costing techniques to make decisions on the utilisation of scarceresources;
• shown how to interpret the results of analysis to advise management on suchdecisions;
• developed an understanding of the application of marginal costing/the contributionapproach to management decisions;
• recognised the importance of risk to the management decision making environment• recognised the importance of both quantitative and qualitative factors in the decision-
making environment.
SummaryHaving read this chapter, you have reviewed the utilisation of scarce resources to max-imise profits within an organisation based on an understanding of the contribution per unitof scarce resource. This was then developed to examine how break-even analysis can con-tribute to a manager’s understanding of business behaviour. The identification of fixedand variable costs via a variety of techniques was considered and decision making exam-ined using a method to quantify qualitative factors. Finally, the chapter looked at pricingboth from an external and internal perspective. It should be remembered that there israrely a single correct answer to the decisions required by managers. What is important isthat the data available are analysed correctly and presented in a form which managers can
OPERATIONAL DECISION MAKING 249
Coombs-08.qxd 3/18/2005 1:09 PM Page 249

use. It is therefore crucial that the management accountant provides that information inthe form required and that managers are aware of their information needs in specific cir-cumstances. This represents a considerable challenge to both parties.
Recommended Further ReadingOtley, D. (2001) ‘Extending the boundaries of management accountingresearch: developing systems for performance management’, BritishAccounting Review, 33(3): 243–261.This paper opens by pointing out that by the mid-1980s the practice of managementaccounting was in decline, with little in the way of new developments for decades.Therefore management accounting was seen as irrelevant to contemporary organisationsand, even worse, its influence seen as counterproductive to good managerial decisionmaking. Otley points out that since 1987, when Johnson and Kaplan’s book RelevanceLost appeared, Johnson appears to have given up on accounting to emphasise ‘softer’areas, while Kaplan has pushed forward the reinvention of management accounting prac-tices. Kaplan’s work is essentially strategic management accounting, through a changein emphasis of the historic context of cost accounting to become forward-looking, to con-centrate on planning, to move from an emphasis on cost to one on value, to stress mar-keting as well as production and recognise external clients and competitors as opposed tothe internal factors. While the author feels that this emphasis perhaps undervalues the con-tribution of previous practice, he goes on to quote a past president of the CharteredInstitute of Management Accountants as claiming this new emphasis releases ‘the man-agement accountant from the factory floor’(Bromwich and Bhimani, 1989).
Otley goes on to look at the so-called second major innovation to come from Kaplan (seeKaplan and Norton, 1996), the ‘balanced scorecard’, which is seen as a framework for per-formance measurement that includes both financial and non-financial elements in thestrategic decision-making process. However, he points out that the literature on the bal-anced scorecard shows a lack of coverage of target setting, resource allocation, reward sys-tems design, and the separation of tactical and strategic feedback, despite diagramscovering these items in the 1996 book. In contrast, the economic value-added techniquedeveloped by Stern Stewart Corporation is seen as putting no ‘explicit’ emphasis on strat-egy either in practice or in theory, but adherence to the principle of generating shareholdervalue is achieved by close attention to each stage of the management process. Performancemeasurement is core to the system, and rewards devised to mitigate inappropriate behav-iour within feedback processes which update targets over time to achieve ‘value added’.Initially these approaches were seen as in conflict, but more recently a more collaborativeapproach seems to be developing, taking the benefits of both ideas. In the context of thepaper by Otley, what is stressed is that management accounting practices have changedradically over the past fifteen years. This is through the linking of financial and non-financialmeasures and presents major challenges to the discipline.
250 MANAGEMENT ACCOUNTING
Coombs-08.qxd 3/18/2005 1:09 PM Page 250

The remainder of the paper goes on to explore issues of how management accountingresearch has adopted to this environment. Otley’s answer is ‘not very well’ in that the dis-cipline seems to have become somewhat sterile, perhaps losing touch with managementpractices. The theme of the paper is the widening role of the management accountant inboth public and private organisations. The call in the paper is to put ‘management’ backinto management accounting; the interest in ‘real’ organisations in understanding anddeveloping their systems of performance management has never been greater. Otleyconcludes by saying that in his opinion management accounting researchers should ‘seizethese opportunities’.
Spicer, B.H. (1988) ‘Towards an organisation theory of the transfer pricingprocess’, Accounting, Organizations and Society, 13(3): 303–22.Spicer’s article builds upon the work of Watson and Baumler (1975) relating to the behav-ioural aspects of transfer pricing (TP).
The classical approach makes assumptions about the firm (e.g. profit maximising) andtries to develop an optimal TP model using an analytical (linear programming) approach.The assumptions, however, limit the wider organisational analysis of the effects of TP,for example on the firm’s various strategies of diversification, management accountingand control. It must be recognised, however, that the benefits of any chosen TP system arecontingent upon the organisational structure of the firm.
The firm, states Spicer, can be seen as a network of transactions whose costs vary withcomplexity. These transactions (both internal and external to the firm) and their associ-ated choices, have associated problems, such as bounded rationality and opportunism.Therefore moral hazard is introduced into exchange relationships (by taking advantage ofasymmetric information).
Spicer refers to Watson and Baumler, who argue that authors on TP have failed to ‘offera coherent theory of decentralisation’ so that the relationship between TP and decentrali-sation is not well thought out. The TP system should try to optimise effective differentia-tion (i.e. segmentation) and integration (i.e. common purpose) of the firm. TP enhancesdifferentiation by pinpointing responsibilities and, via negotiation, can aid in the integra-tion process. Spicer refers to Swieringa and Waterhouse (1982) and Eccles (1985) whocomment that the process of TP (rather than the details) may be useful in furtheringorganisational control. They concluded that the need for (and details of) the TP processwill depend heavily upon the diversification and decentralisation strategies of thecompany – the more a firm is diversified, the less likely it is to have a high level of inter-divisional transfers and the less of a problem TP is.
Spicer argues that two decisions are necessary: the design of the intermediate product(standardised or specialised/unique) and whether to make or buy the intermediate prod-uct. He provides a table examining the dimensions of such decisions and states that thecosts and hazards associated with such decisions are dependent upon the investments inassets necessary, the degree of uncertainty, and the extent (frequency and volume) ofactivity.
OPERATIONAL DECISION MAKING 251
Coombs-08.qxd 3/18/2005 1:09 PM Page 251

Spicer goes on to analyse this further, looking at a particular case where the intermediateproduct is made within the firm and transferred between different profit centres with dif-ferent profit streams. This analysis looks specifically at: the dimensions of intrafirm trans-actions, internal contracting hazards (how they arise and how they can be dealt with), andthe need for adaptation and co-operation (to achieve overall objectives). The analysis dis-cusses these factors at length and also considers the factors involved in deciding thedegree of managerial autonomy in the TP process.
Spicer puts forward nine hypotheses, drawn from the preceding discussion, relating tothe factors likely to affect the mode and process of TP likely to be chosen by an organi-sation. These hypotheses deal with the effects on TP of factors such as: diversificationstrategy; product design; organisational structure; transaction-specific investment; fre-quency and volume of transactions; degree of uncertainty; degree of conflict; the need forarticulation and negotiation; the bases of TP (e.g. cost- or market-based); and degree ofcentral control.
Overall, using a contingency approach, the article attempts to place TP within a widerorganisational context and prepares the ground for further empirical research.
Case Study: The Odd-Job Manufacturing Company
The Odd-Job Manufacturing Company (OJMC) produces toolboxes from plastic andmetal in a single plant. The basic product is made from strong 5 mm plastic with a plas-tic handle and metal hinges and wheels. The company has a good reputation in themarket because the standard toolbox is a high-quality item, has been well-produced andhas sold well for many years.
Two years ago the company decided to expand its product line and produce bespokeboxes for the different retail outlets, usually those that specialise in do-it-yourself supplies.These boxes differ from the standard because they are produced in a range of sizes, theyhave a metal handle and carry the logo of the specific retail outlet. The standard one-sizetoolboxes are simply imprinted with the company’s initials, OJMC.
In order to reduce the labour cost of the speciality toolboxes, much of the assembly workis done by automated machines. These machines are used to a much lesser degree in theproduction of the standard toolbox. With the lower cost of labour, the accounting depart-ment has determined that the speciality toolboxes are less costly to manufacture than thestandard toolboxes. This is shown in the summary data below. Because the bespoke tool-boxes are special-order items, they are priced at a higher level than the standard toolbox.
The managing director of OJMC, T.E.N. Onsaw, exploded when he saw the abovefigures and demanded, ‘Why do we produce the standard item? It seems time to cutback, cut the standard, just produce the special lines and see if we can grow them more.’
The company’s marketing director, Pierre Lasterboard, commented, ‘I agree that thebespoke business is working better and there seems to be plenty of work out there,
252 MANAGEMENT ACCOUNTING
Coombs-08.qxd 3/18/2005 1:09 PM Page 252

Note that the manufacturing overhead is absorbed via direct labour hours and theabsorption rate of £15.69 per hour is obtained from the budgeted manufacturing over-head (£40,012) divided by the budgeted direct labour hours (2550 hours).
Further investigation reveals that standard toolboxes are produced in batches of200 units, whilst speciality toolboxes are produced in batches of 25 units. In conse-quence, in each month the company makes 100 set-ups for the bespoke items and 50set-ups for the standard products. Each machine set-up requires 1 hour for the standardproduct and 2 hours for the bespoke product.
particularly as the competition has not been able to touch our price. Our biggest com-petitor charges £15 for bespoke items.’
However, the finance director, Dee Rill, is not as easily convinced. She observes that,‘Since we introduced the bespoke lines, our annual net profit has fallen by £350,000. Thisbusiness has produced sales but it has also required investment and other costs.’ TheManaging Director responds, ‘Dee, that’s all very well but the unit gross profit figures telltheir own story! Your argument just seems to be suggesting that neither line makes a profit –yet the company makes a profit so we must be doing something right. As chief accoun-tant, Dee, I suggest that you sort this out as soon as possible and let me have somethingdefinitive before we move any further on this issue.’
Dee begins her investigation and first obtains a breakdown of the manufacturing costof each of the company’s product lines as follows:
OPERATIONAL DECISION MAKING 253
Per unit Standard (£) Bespoke (£)
Selling price 9.00 10.00Manufacturing cost 8.94 6.10Gross profit 0.06 3.9
Standard Specials
Units produced each month 10,000 5,500Per unit Per unit
£ £Direct materials 5.00 4.13Direct labour (at £4 per hour) 0.80 0.40Prime cost 5.80 4.53Manufacturing overhead (£15.69 per hour) 3.14 1.57Manufacturing cost 8.94 6.10
Coombs-08.qxd 3/18/2005 1:09 PM Page 253

Complete Dee Rill’s investigation and write a report to the managing director thatexamines the strengths and weaknesses of the existing costing system, examines theconsequences for the company of continuing with it and evaluates an alternative system.You should illustrate how an alternative system should work and explain its significancefor the company’s production and marketing strategies.
Questions1. Submarine Cables makes mobile telephones for underwater use. The budgeted
revenues and costs for the year ended 30 June 2004 are as follows:
Each standard toolbox requires 0.5 hours of machine time but, due to its higher levelof automation, each bespoke toolbox requires 2 hours of machine time.
At the end of the production process all toolboxes are inspected to ensure that qual-ity standards are met. The standard toolbox requires little inspection time as the workerscorrect for any quality problems as they process the units. In total the standard toolboxrequires 300 hours of inspection per month, and the speciality toolbox 500 hours ofinspection time per month.
Dee also has access to results of a consultant’s recent study of monthly overheads. Theconsultant’s report includes the following summary:
254 MANAGEMENT ACCOUNTING
Overhead activity Overhead cost Standard Speciality(cost driver) £ No. of events products products
Purchasing (no. of orders) 3,000 60 48 12Material handling (no. of receipts) 3,750 60 52 8Production orders and set-ups 5,062 150 50 100
(set-up time)Inspection (inspection hours) 4,000 800 300 500Frame assembly (assembly hours) 10,200 2,550 2,000 550Machine-related (machine hours) 14,000 7,000 2,000 5,000Total 40,012
Revenues £600,000Variable costs 420,000Fixed costs 150,000Net profit 30,000
Coombs-08.qxd 3/18/2005 1:09 PM Page 254

Capital employed will be £600,000. Budgeted output for the year ended 30 June 2004 is30,000 units, which represents 60% of output capacity.
The management of the company are concerned about the low level of budgeted profitand return on capital employed. They have asked you to analyse and evaluate the follow-ing independent options for improving performance:
(a) An enquiry has been received from a wholesaler in Kazakhstan who has indi-cated that he is prepared to take 12,000 units at a price of £16 per unit, withSubmarine Cables paying the carriage and customs charges estimated at£2000. Submarine Cables has never previously dealt with this wholesaler orthis distant market.
(b) Reduce selling price by 10%. It is thought that this will increase demand tocapacity. However, it will need to be supported by a new system of sales-men’s commissions; these will be 50 pence per unit sold in 2000/2001.
(c) The managing director believes in setting targets and has announced a profittarget of 10% of capital employed. The managing director wants to knowwhat price increase is necessary to achieve the target with the current levelof sales, and what sales increase is necessary to achieve the target with thecurrent price per unit.
(d) A machine may be leased at a cost of £15,000 per annum. The machine willcause variable costs to fall by 50% per unit; it will also increase current capa-city by 20%.
For each option (a)–(d), determine whether it is financially worthwhile and commenton its non-financial aspects.
2. Didcot is small company that specialises in producing virtual reality (VR)machines for large international entertainment companies. One of these hasoffered Didcot a contract to produce and deliver 1000 identical VR machines overa 26-week period starting on 1 June 2004.
Each machine requires the following materials:
• 2 square metres of Yalloy: Yalloy is in continuous use by the company and 500square metres are currently in stock at a book value of £80 per square metre. Futurepurchases will cost £90 per square metre.
• 1 translucent fitment: 1500 are in stock at a book value of £10 each. However, thistype of fitment will have no other use if not used on this contract, although they maybe sold for scrap at £2 each. It is possible to purchase a new version of the fitmentat £20 per fitment, although the type in stock is adequate for the contract.
• 2 yardarm controllers: there are none in stock. The current purchase price is £50 percontroller.
• 1 piezo control: these will be purchased at £25 each and are specific to VR machinesin the contract.
OPERATIONAL DECISION MAKING 255
Coombs-08.qxd 3/18/2005 1:09 PM Page 255

The following mixture of labour is required:
• Skilled: each VR machine will require 3 hours of skilled labour. Skilled labour iscurrently paid £4.80 per hour and will be fully employed on other work during thenext 26 weeks. In order to fulfil the contract a skilled worker will be taken off otherwork which will be undertaken by a temporary replacement provided by a localagency at £6 per hour.
• Semi-skilled: each machine will require 4 hours of semi-skilled labour. The currentrate for semi-skilled labour is £3.50 per hour and sufficient temporary workers canbe recuited for this work.
In the case of both skilled and semi-skilled employees, national insurance adds a further12% to the cost of employment. This is not payable by Didcot in the case of agencyworkers.
Supervision of the work will be carried out by a senior manager who is currently paid£25,000 per year (with superannuation and national insurance adding a further 20% to thecosts of employment). In order to free her time to undertake this work, an agency willprovide cover at a cost of £500 per week.
Didcot absorbs production overhead by a machine rate that is currently £40 per hour.Of this, £15 is variable and £25 is fixed. Each VR machine will require 2 machine hours.Additionally, fixed overheads directly attributable to the production of VRs are likely toincrease by £15,000 over the period of the contract.
The costs of negotiating and drawing up the contract to supply 1000 VR machines haveamounted to £800.
A price of £520 per machine has been agreed with the entertainment company. Theentertainment company has stipulated within the contract that it will pay only £250 permachine for any that are delivered up to four weeks late. Machines delivered more thanfour weeks late will be delivered free of charge.
(a) Prepare a statement of the relevant costs of the contract and state whether ornot the contract should be undertaken by Didcot. Provide notes to indicatewhy you have selected some costs and rejected others.
(b) Comment on three significant factors that management needs to considerbefore finally agreeing to take the contract.
3. Traffick PLC has been forced to close for two weeks because of supply problems.During that time the company produced no count meters. The company issued apress statement that the supply failure had cost the company £1 million. This figurewas based on the loss of turnover over the two-week period.
The company’s financial accountant has subsequently made a more detailed assessmentof the cost, as follows:
256 MANAGEMENT ACCOUNTING
Coombs-08.qxd 3/18/2005 1:09 PM Page 256

£000 £000
Lost revenue (40,000 units @£25 each) 1000
Standard cost
Costs saved per unit (£)
Materials 1.0 40Direct labour 2.5 100Depreciation 4.0 160Variable overhead 3.0 120Sub-contracting work 1.0 40Fixed overhead 5.0 200 660
Cost of the supply failure 340
The following information is available:
(i) The direct labour was paid 75% of the normal wage during the two-week period,and this amounted to £75,000.
(ii) Depreciation is based on the straight-line method. However, there is a variablecomponent of depreciation amounting to 50 pence per unit produced.
(iii) Fixed overhead is absorbed at the rate of 200% on direct wages.(iv) The maintenance team was able to carry out a major overhaul of one of the
machines during the period of closure. They had to purchase materials costing£5000, but a contractor would normally have performed the overhaul at a cost of£25,000 (including materials). The cost of the maintenance team is includedwithin fixed overheads. The cost of the materials has not yet been recorded.
(v) The sales manager has estimated that because of the closure, there will be unsat-isfied demand amounting to half the production lost. This can be made up by theproduction workforce working overtime during the next month. Overtime is paidat an enhanced rate of 50% above the normal hourly rate.
(a) Examine points (i)–(v) and discuss the relevance of each of these costs tothe identification of the cost of closure.
(b) Produce a statement indicating the net cost of the closure. You will need toexplain the inclusion (or exclusion) of any items that you have not dis-cussed in part (a) of the question.
(c) Outline two potential problems with the use of relevant costing in decisionmaking.
4. Emily Wye is currently working on the production schedules for next month. Herfirm manufactures two types of ceramic grids:
OPERATIONAL DECISION MAKING 257
Coombs-08.qxd 3/18/2005 1:09 PM Page 257

(ii) Both products involve machine work, type A requiring 1 hour and B half an hour.The machine is available for 400 hours per month.
(iii) Next month the company will have available 900 kg of X1. The firm can buy asmuch X2 as it wishes.
(iv) Fixed overheads in the coming month will amount to £1950.
(a) The company wishes to maximise contribution. Set out the objective func-tion and the constraints.
(b) Determine the optimum output of each product next month using the graph-ical approach to linear programming. Calculate the optimum profit for themonth.
(c) Calculate the amount of spare capacity available next month. (d) Discuss three limitations of linear programming.
Jane Lane is the management accountant of a small manufacturing company. Jane normallygets involved in the production scheduling of the firm. She is currently working on thisfor the last three months of 2004, making use of her management accounting and linearprogramming skills.
The company manufactures components for rock climbing, including two types of iceaxe, the X1 and the X2. During the last quarter of 2004, each X1 will have a selling priceof £67 and each X2 a selling price of £78.
Notes:
(i) Labour rates and maximum labour hours available in the next month are:
258 MANAGEMENT ACCOUNTING
Type A Type B£ £
Selling price 60 70Material X1 (at £2 per kg) 3 6Material X2 (at £5 per kg) 10 10Direct labour (grade 1) 12 9Direct labour (grade 2) 10 15Variable overhead 5 7
Grade Hourly rate Max. monthly hours
1 £6 6402 £5 Unlimited
Coombs-08.qxd 3/18/2005 1:09 PM Page 258

In addition, monthly fixed manufacturing overheads are budgeted to be £2000 permonth and fixed non-manufacturing overheads are budgeted to be £5000 for the three-month period.
The company will have the following resources available to it for the last quarter of theyear: 800 metres of STX2, 2000 hours of labour and 1800 machine hours. The firm wishesto supply its retailers with no less than 150 of each type of axe during the final quarter.
(a) The company wishes to maximise contribution. Set out the objective function andthe constraints.
(b) Determine the optimum production of each product over the final quarter using thegraphical approach to linear programming and calculate the optimum net profit forthe final quarter of 2004.
(c) Calculate the shadow price of STX2 and explain how Jane may use it.
The cost of each axe is made up as follows:
OPERATIONAL DECISION MAKING 259
X1 (£) X2 (£)
Materials: STX2 at £12 per metre 15 18Labour: at £4.50 per hour 9 18Variable overhead: at £5 per mc/hr 10 15
Coombs-08.qxd 3/18/2005 1:09 PM Page 259

Chapter 9STRATEGIC DECISION MAKING
By the time you have finished studying this chapter, you should be able to:• understand the concept of discounting;• calculate net present value and internal rate of return;• apply non-discounting methods;• understand the importance of taxation and inflation to strategic decision making;• apply sensitivity analysis.
The Nature of Strategic Decision Making Strategic planning and strategic decision making look ahead to several years into thefuture. They are concerned with the organisation’s major products and services and relatedaspects of marketing, manufacturing, service delivery, and research and development.Strategic decisions almost invariably result in long-term financial costs and benefits andmay require significant investment.
Examples of strategic decision making from a range of organisations are as follows:
• A university is located in an area with a declining and ageing population, with the resultthat its potential student base is declining. It is looking at several ways of dealing withthis problem, one of which involves building on-campus student accommodation inorder to attract students from more distant locations. This would require significantinvestment by the university in constructing the accommodation, but it is expected thatthis would result in future rental income and an increase in its student population.
• An airline has a long and profitable history of flying long-haul routes. Due to thegrowth in world terrorism, it is considering moving into the European short-haulmarket by leasing a fleet of aeroplanes. This market has grown significantly in thelast decade, and looks as if it will continue to grow. However, the airline is awarethat this sector is highly competitive, highly efficient and operating in a low-costway that is alien to it.
Key Learning Objectives
Coombs-09.qxd 3/18/2005 1:09 PM Page 260

• An engineering company is assessing the profitability of producing a new product.This will involve acquiring a new machine. The company will need to take accountof the cost of the machine, the projected operating costs, the projected revenuesfrom the sale of the product, and the expected lives of the machine and the marketfor the product.
• A company currently pays mileage travel allowances to its staff. It is evaluatingleasing a fleet of cars and requiring its employees to use these cars for companybusiness. In this case, the company will need to collect the costs of mileageallowances, estimate the annual leasing and operating costs of a fleet of vehicles,and estimate the additional costs or savings of the venture.
As can be seen, strategic decisions are long-term in nature and usually involve investment,costs and revenues. This chapter will focus on the appraisal of these investment decisions.
Steps in Project AppraisalThe first step is to specify the scope and objectives of the project. Scope relates to thebreadth and coverage of the project. Its objectives should be directly related to the strate-gic decisions taken within the company. Each of the examples of strategic decision makinglisted above directly leads to a clearer definition of a project’s scope and objectives.
The second is to identify the relevant cash flows for project appraisal. Chapter 2 intro-duced the concept of relevant cost (see also Chapter 8). Recall that relevant costs may bedistinguished by the following three characteristics:
• They are decision-specific in that if the decision changes the costs change.• They are future costs. From a decision perspective, past costs are sunk costs and
they should have no influence on the current decision. Sunk costs include past expen-diture on machinery, the book cost of materials held in stock and the depreciationof past capital expenditure.
• They are differential costs. Common costs, that is, costs that would be incurred inany event, should have no influence on the decision. Examples of common costsinclude fixed overheads, fixed overhead apportionments and labour costs whenthere is spare capacity.
Relevant cash flows include the following:
• Incremental costs and revenues that are attributable to the decision that has been made.• Financing costs: in order to undertake capital expenditure such as the construction
of student accommodation, the organisation will need to obtain finance. The costsof finance, in the form of interest costs, represent a relevant cost. Alternatively, ifthe organisation finances the project from its own resources, the interest forgone dueto the financing activity represents an opportunity cost and is relevant.
STRATEGIC DECISION MAKING 261
Coombs-09.qxd 3/18/2005 1:09 PM Page 261

• The timing of returns that arise from the project is also relevant. Returns that ariseat an early date are worth more than the same returns received at a later date.
• Working capital changes should be brought into the appraisal if these change as aresult of the project. For example, the project may require an increase in debtors ora build-up in stocks of raw materials, and these represent relevant cash flows.
• Taxation effects: the investment may attract tax allowances that have the effect ofreducing the taxation paid by the company. Any additional profits generated by theproject will be subject to taxation.
• Future inflation is likely to affect costs and revenues in different ways and will needto be taken into account.
The third stage is to select and apply at least one method of appraisal. We will considerthe following four methods: net present value; internal rate of return; pay back; andaccounting rate of return. The first two are discounted cash flow methods; the second twoare non-discounting methods.
In order to help explain and demonstrate these four methods, we will use the data con-tained in Table 9.1. As may be seen, there are three projects, A, B and C. The first columnindicates the number of years hence. Year 0 always represents now and this is often whenthe initial investment in the project occurs, year 1 is 1 year after, year 2 is 2 years afterand so on.
For each project there are two columns. The first column represents the project’s cashflows. The second represents the annual net profits, which differ from the cash flowsbecause they allow for depreciation on the original investment. The table indicates thatthere is no residual value in the case of project A and B and the annual depreciation is£250, with the result that the annual profits are £250 less than the cash flows. Project C
262 MANAGEMENT ACCOUNTING
Project Project A Project B Project C
Cash Net Cash Net Cash Netflows profits flows profits flows profits
Years hence £ £ £ £ £ £
0 −1000 −1000 −20001 600 350 500 250 600 3502 400 150 400 150 600 3503 300 50 600 350 600 3504 300 50 700 450 1600 350
Other information
Residual values 0 0 1000
Annual = investment/4 = investment/4 = net investment/4depreciation = £1000/4 = £1000/4 = £(2000 − 1000)/4over 4 year’s = £250 per year = £250 per year = £250 per yearlife of each project
Table 9.1 Data for projects A, B and C
Coombs-09.qxd 3/18/2005 1:09 PM Page 262

has a residual value of £1000 so its annual depreciation is also £250. In year 4, projectC’s cash flows include the £1000 residual value.
After applying one or more of the investment appraisal techniques, the fourth step is tomake sense of the results. In order to do this, one needs to understand the basis, thestrengths and limitations of each technique and any limitations in the underlying data.
Finally, the decision maker needs to make a decision based on the above information.At this point, qualitative issues will also be considered and possibly tactical and strategicissues relating to the organisation’s planning processes.
Project Appraisal Using DiscountedCash-Flow Methods
Compounding, Discounting and Present Value
Both compounding and discounting involve the use of an appropriate rate of interest orrate of return. Generally, keeping the rate of interest constant, the longer you invest, thegreater the total accumulated interest will be. We will now look in more detail at the useof the rate of interest, first dealing with compounding and then with discounting.
Compound interest occurs when the interest is applied to the principal (the suminvested) plus the accrued interest. At the end of the first period, the interest is calculatedon the principal only. At the end of the second period, interest is calculated on the princi-pal plus interest earned in the first period. Thus, if £100 is invested at 10% compound, atthe end of the first year the interest earned is £10, and the principal becomes £110. At theend of the second year, the interest earned is 10% × £110, and the principal is now £121.This can be generalised so that one can calculate the future value, if there is a constantinterest rate, by the following formula:
FV = P(1 + r)n
where FV is future value, P is the principal, r is the rate of interest per period, and n thenumber of periods. So, if we invest £100 at 10% for 5 years, it will be worth
FV = 100(1 + 0.1)5 = 100 × 1.6105 = £161.05.
Discounting is the opposite of compounding. Discounting involves finding the presentvalues of future cash flows. We have just seen that, when invested at 10% compoundinterest, £100 at year 0 produces £110 in one year’s time. We can say that an investor isindifferent between receiving £100 now (year 0) or £110 in one year’s time or £121 in twoyears’ time and so on, because he can invest £100 at 10% to produce each of theseamounts. The person who invests £100 at year 0 will require more than £100 in future,the exact amount depending on the time period and the rate of interest. The concept that£1 in the future is worth less than £1 today is termed the time value of money. In project
STRATEGIC DECISION MAKING 263
Coombs-09.qxd 3/18/2005 1:09 PM Page 263

appraisal, this is an important concept as, typically, projects will have cash flows thatcontinue well into the future. In these situations, future cash flows cannot simply be addedtogether. They must first all be discounted to present values.
In order to discount future cash flows to present values, we first rearrange the futurevalue formula to obtain the present value (PV):
Here 1/(1+r)n is termed the discount factor and r is termed the discount rate. In Table 9.2we demonstrate the use of the formula to find the present value of future cash flows whenthe discount rate is 10%.
As can be seen, discounting is the inverse of compounding. To save calculating the dis-count factor every time, they are precalculated and appear in Table 9A.1 in the Appendixat the end of this chapter. An extract from Table 9A.1 is presented in Table 9.3
Looking at Table 9.3, we can read off the appropriate discount factor once we know theperiods hence and the discount rate. So, the discount factor for 5 years hence when thediscount rate is 7% is 0.713. The present value of the sum of £4500 to be paid or receivedin 5 years’ time with a discount rate of 7% is 0.713 × £4,500 = £3208.
Net Present Value
Net present value (NPV) is a discounted cash-flow method of investment appraisal. Itinvolves discounting future cash flows to present values. The sum of the present value of
264 MANAGEMENT ACCOUNTING
Year 0 Year 1 Year 2 Year 3
Discount factor Present values Future values1/(1 + r)n FV × 1/(1+r)n
1/(1 + 0.1)1 = 0.909 110 × 0.909 = 100 1101/(1 + 0.1)2 = 0.826 121 × 0.826 = 100 1211/(1 + 0.1)3 = 0.751 133.1 × 0.751 =100 133.1
Table 9.2 Present value calculations for a discount rate of 10%
Periods 1% 2% 3% 4% 5% 6% 7% 8% 9% 10%
1 0.990 0.980 0.971 0.962 0.952 0.943 0.935 0.926 0.917 0.9092 0.980 0.961 0.943 0.925 0.907 0.890 0.873 0.857 0.842 0.8263 0.971 0.942 0.916 0.889 0.864 0.840 0.816 0.794 0.772 0.7514 0.961 0.924 0.888 0.855 0.823 0.792 0.763 0.735 0.708 0.6835 0.951 0.906 0.863 0.822 0.784 0.747 0.713 0.681 0.650 0.621
Table 9.3 Discount factors for one to five periods and discount rates up to 10%
.PV = FV × 1(1 + r)n
Coombs-09.qxd 3/18/2005 1:09 PM Page 264

future cash flows less the initial investment gives the NPV of the project. If the discountrate represents the company’s cost of finance, then the NPV represents the returns to thecompany’s shareholders over and above the costs of finance; in consequence, we may saythat a positive NPV contributes to the wealth of the shareholders.
The decision rule in the case of NPV is to accept only those projects providing a posi-tive NPV. (A negative NPV indicates that the project is not even covering the costs offinance.) If a number of competing projects have positive NPVs, and only one can beselected, these are termed mutually exclusive projects. For example, there may be an areaof land and one can build either a school or a sewage farm on the site! In the case of mutu-ally exclusive projects, the rule is to select the project with the highest positive NPV.
Table 9.4 shows the calculation of the NPVs of projects A, B and C using the data fromTable 9.1. NCF stands for the net cash flow in each year. This is the cash receipts for theyear less the cash payments. PV stands for present value. The discount rate is 10% andthe discount factors have all been obtained from Table 9.3.
All cash flows have been discounted to year 0 by multiplying the annual NCF by the dis-count factor in the second column. For example, for project A, 2 years hence, the annualNCF of £400 has been discounted by multiplying it by the year 2 discount factor 0.826.
As can be seen, the NPV for project A is £305. The investment at year 0 represents anegative cash flow and the figure of £305 is the net total allowing for the negative cashflow of £1000. All projects have positive NPVs and should therefore be accepted. If onlyone project can be chosen, this would be project B as it has the highest NPV.
Annuities
An annuity is a series of equal and consecutive cash flows. They may be flows of paymentsor flows of receipts. In Table 9.4, Project C’s net cash flows in years 1, 2 and 3 representan annuity of £600. There exist discount tables for annuities and these are contained inTable 9A.2 in the Appendix at the end of this chapter. An extract is provided in Table 9.5.
STRATEGIC DECISION MAKING 265
Project
A B C
Years Discounthence factor NCF PV NCF PV NCF PV
0 1.0000 −1000 −1000 −1000 −1000 −2000 −20001 0.909 600 545 500 455 600 5452 0.826 400 330 400 330 600 4963 0.751 300 225 600 451 600 4514 0.683 300 205 700 478 1600 1093
NPV 305 714 585Select B
Table 9.4 Project net present values
Coombs-09.qxd 3/18/2005 1:09 PM Page 265

Annuity tables enable us to take a short cut when calculating NPVs. The PV of an annu-ity is the amount of the annual net cash flow × the annuity factor. For example, a projectis expected to produce net cash flows of £2000 per year for each of the next five years.The discount rate is 6%. The present value of this annuity will be: 4.212 × £2000 = £8424.(where 4.212 is the PV annuity factor for 5 years at 6%).
The Advantages of NPV
• It explicitly takes into account the time value of money because it is based ondiscounted cash flows, recognising that £1 in the future is worth less than £1 today.
• By considering cash flows, NPV is not affected by the company’s accounting poli-cies, unlike net profit. For example, net profit is influenced by the company’s poli-cies on stock valuation, depreciation and overhead apportionment. Regardless ofchanges in any of these, the cash flows will remain unchanged.
• NPV takes explicit account of the costs of raising finance via its discountingprocess. A positive NPV therefore reflects the increase in shareholder wealth thatshould occur if the project is undertaken.
The Disadvantages of NPV
• In practice it may be difficult to determine the discount rate. This should relate tothe cost of finance (or cost of capital, as it is usually known), but calculating thecosts of the different elements of finance (e.g. share capital and loans) is difficult.
• The NPV is an absolute figure and it does not allow for the size of the project. Forexample, in the case of two mutually exclusive projects, NPV would recommendacceptance of a £1 million project with a NPV of £1250 over a £1000 project witha NPV of £500.
Our concern here is very much with the financial bottom line (the net present value), butLumijarvi (1991) indicates that as long as projects meet the financial criteria, they thenhave to be sold to senior management based upon their strategic value and use of moderntechnology. A summary of this article appears at the end of the chapter.
266 MANAGEMENT ACCOUNTING
Periods 1% 2% 3% 4% 5% 6% 7% 8% 9% 10%
1 0.990 0.980 0.971 0.962 0.952 0.943 0.935 0.926 0.917 0.9092 1.970 1.942 1.913 1.886 1.859 1.833 1.808 1.783 1.759 1.7363 2.941 2.884 2.829 2.775 2.723 2.673 2.624 2.577 2.531 2.4874 3.902 3.808 3.717 3.630 3.546 3.465 3.387 3.312 3.240 3.1705 4.853 4.713 4.580 4.452 4.329 4.212 4.100 3.993 3.890 3.791
Table 9.5 Present value of annuity
Coombs-09.qxd 3/18/2005 1:09 PM Page 266

The Internal Rate of Return
The internal rate of return (IRR) is the discount rate that gives a zero NPV. The primarydecision rule with IRR is to accept only projects with an IRR greater than the discountrate. If there are mutually exclusive projects each with IRR greater than the discount rate,the rule is to select the project with the highest IRR.
The underlying reason for the primary decision rule is that if the IRR exceeds the dis-count rate (or cost of capital), the project must be generating a higher return than thediscount rate. From a different perspective, the IRR can be regarded as the highest cost ofcapital that the project could afford to have and still yield benefit to the shareholders.
The IRR can be calculated easily using a computer spreadsheet that will normallyinclude an IRR function. Without a computer spreadsheet, the IRR must be estimated bycalculating two NPVs at different discount rates. One of the NPVs should be negative,and this will require discounting at a higher discount rate in order to produce a negative
The Impact of the Discount Rate on NPV
Figure 9.1 below shows the NPV for a project with an investment in year 0 followed bynet cash inflows in future years. As may be seen, the NPV falls as the discount rateincreases. This is because the increasing discount rate results in a decrease in the presentvalue of future cash flows because the discount factor gets smaller as the discount factorincreases; the factors in Table 9.3 demonstrate this. When the discount rate is 0, the NPVis simply the net result of subtracting the total cash outflows from the total cash inflows.The figure indicates the importance of using the correct discount rate. If it is too low, NPVwill be overstated and possibly the wrong projects will be accepted. If the discount rate istoo high, then projects of value to the company will be rejected.
STRATEGIC DECISION MAKING 267
Figure 9.1 The impact of changes in discount rate on NPV
NPV
Discount Rate
NPV
0
+
−
Coombs-09.qxd 3/18/2005 1:09 PM Page 267

NPV. Once we have two NPVs, one positive and one negative, we then apply the followingformula to estimate the IRR:
IRR = DRA + (DRA − DRB) NPVANPVA − NPVB
Here DRA is the first discount rate used to appraise the project, producing a positive NPV;DRB is the second discount rate used to appraise the project, producing a negativeNPV; NPVA is the positive NPV obtained when using DRA; and NPVB is the negativeNPV obtained when using DRB.
Let us estimate the IRR for project A. Let DRA = 10%, so that NPVA = +305, and letDRB = 30%, so that NPVB = − 60. Then
IRR = 10% + (30% − 10%) 305305 + 60
= 10% + 16.71% = 26.71%.
Similarly, the IRR for project B is 38% and for project C is 21%. Calculation of IRR is anestimate and the narrower the gap between DRA and DRB, the more accurate the estimate.A computer spreadsheet for example will give a value of 25.81% for A. Each project isacceptable as each IRR exceeds the discount rate of 10% used in Table 9.4. If the projects aremutually exclusive, project B should be selected as its IRR is the highest of the three projects.
The Advantages of IRR
• Like NPV, it deals with discounted cash flows and is based upon the time value ofmoney.
• Although the manual calculation of the IRR is more time-consuming than the NPV,the percentage nature of the IRR may make it more acceptable.
• The cost of capital is required for use as the discount rate with NPV but, as has beenindicated, its calculation is difficult. Calculation of the IRR does not require a pre-cise cost of capital discount rate and a project’s IRR can be compared with anapproximation of the cost of capital, avoiding dispute about the precise discount rateto use. The board can decide whether the IRR is sufficiently above the approximatecost of capital for the project to be acceptable.
• The difference between the IRR and the cost of capital indicates the additionalreturn for risk that the project provides.
The Disadvantages of IRR
• If there are negative annual net cash flows later than year 0, this may lead to morethan one possible IRR. In this situation IRR must be used with great care.
• If a company has to rank mutually exclusive projects, choosing the project with thehighest IRR may result in a suboptimal outcome. (Lumby and Jones, 2003, Chapter 6).
268 MANAGEMENT ACCOUNTING
.
Coombs-09.qxd 3/18/2005 1:09 PM Page 268

Non-Discounting Methods ofProject Appraisal
Payback
Payback is a cash-based technique. The payback period is defined as the number ofyears required for the annual net cash flows to equal the initial investment in a project.Alternatively, we can look for a cumulative net cash flow of 0. The cumulative net cashflows for projects A, B and C are shown in Table 9.6. By the end of year 2, projectA’s initial investment is recovered by its net cash flows. In the case of project B, pay-back occurs between the end of year 2 and the end of year 3. At the end of year 2 weneed an additional £100 to payback If we assume that the year 3 cash flows of £600accrue evenly through the year, then to payback we need 100/600 of year 3 cash flows,which we may assume to take (100/600 × 12 months = 2 months) For project C, pay-back occurs between the end of year 3 and the end of year 4. The £1600 in year 4includes £1000 that accrues at the end of the project and £600 that we assume accruesevenly through the year. Therefore, payback in year 4 is at (200/600 × 12 months =4 months).
Some companies use a ‘target payback’ approach in which they specify a maximumpayback period that projects must meet if they are to be accepted.
The Advantages of Payback
• The underlying concept and the results of applying the technique are very easy tounderstand.
• It is quick and simple to use.• It implicitly takes account of uncertainty that characterises the future. The further in
the future that a company has to forecast, the more uncertain its forecasts will be.A project with a shorter payback will involve less uncertainty in relation to the fore-casting of future cash flows.
STRATEGIC DECISION MAKING 269
Table 9.6 Cumulative NCFs for projects A, B and C (from Table 9.1)
Project A Project B Project C
Annual Cumulative Annual Cumulative Annual Cumulative Year NCF NCF NCF NCF NCF NCF
0 −1000 −1000 −1000 −1000 −2000 −20001 600 −400 500 −500 600 −14002 400 0 400 −100 600 −8003 300 600 +500 600 −2004 300 700 1600 +1400
Coombs-09.qxd 3/18/2005 1:09 PM Page 269

The Disadvantages of Payback
• The payback method ignores the cash flows that occur after the end of the paybackperiod. From our earlier calculations, project A will be selected as it has the short-est payback period, but project B has higher total net cash flows than project A.Project B’s total net cash flows amount to £1200 whilst project A’s amount to £600.This weakness of payback is in stark contrast to both NPV and IRR that considerall cash flows generated by projects.
• It ignores the time value of money. This can be overcome by the use of discounted pay-back in which the cash flows are discounted prior to calculating the payback period.
The discounted payback period for project A is calculated as shown in Table 9.7, givingan estimate of 2 years plus 125/225 × 12 months = 6.7 months.
Discounting is particularly useful when cash flows are distant, whereas paybackemphasises the early years of the project, so there is an inherent conflict in the technique.Also, discounting assumes that the cash flows occur at the end of the year whereaspayback assumes that they flow evenly through the year.
Accounting Rate of Return
The three investment appraisal techniques considered so far, NPV, IRR and payback, areall based on the cash flows generated by the project. Unlike these, the accounting rate ofreturn (ARR) is based on accounting profits.
Accounting profits are based upon a range of concepts, and one effect of these is toconvert cash into profits. Examples of accounting concepts at work are as follows:
• At the start of the project, fixed assets are acquired which will result in a cash out-flow. However, the cost of such assets is not immediately charged to the profit andloss account of the business. Instead the fixed assets are disclosed on the balancesheet and an annual depreciation charge is made to the profit and loss account overthe life of the fixed asset. In the case of land, no depreciation charge is made.
• Payments for raw materials result in a cash outflow for the business, However, thecost of purchases is not charged as an expense to the profit and loss account of thebusiness until the stock is sold. Sales are recognised when the sale is made and notwhen cash changes hands.
270 MANAGEMENT ACCOUNTING
Year Cash flow PV at 10% Cumulative PV
0 −1000 −1000 −10001 600 545 −4552 400 330 −1253 300 225 +1004 300 205 +305
Table 9.7 Discounted payback
Coombs-09.qxd 3/18/2005 1:09 PM Page 270

The ARR may be defined as
ARR = Average annual profit from an investment × 100Average investment
Where
Average investment = Initial investment + Scrap value2
The average investment represents the average value of the asset in the accounts of thecompany. At the commencement of the project, the accounts will include the original costand at the end of the project the they will include the scrap value. To obtain the averageof two figures we add them together and divide by 2.
The decision rule with ARR is to accept a project if the ARR equals or exceeds thecompany’s target ARR. If projects are mutually exclusive, the rule is to select the projectwith the highest ARR, as long as the ARR equals or exceeds the company’s target ARR.
We can use the profit data in Table 9.1 to calculate the average profits and averageinvestment for each project as follows. For project A,
Average profits = 350 + 150 + 50 + 50 = £150,4
Average investment = 1000 + 0 = £500,2
ARR = 150 × 100 = 30%.500
For project B,
Average profits = 250 + 150 + 350 + 450 = £300,4
Average investment = 1000 + 0 = £1500,2
ARR = 300 × 100 = 60%.500
For project C,
Average profits = 350 + 350 + 350 + 350 = £3504
Average investment = 2000 + 1000 = £1,5002
ARR = 350 × 100 = 23%.1,500
STRATEGIC DECISION MAKING 271
Coombs-09.qxd 3/18/2005 1:09 PM Page 271

In this case, project B will be selected as it has the highest ARR. Both NPV and IRRselected project B.
The Advantages of ARR
• The main advantage is that by using profit figures, projects are appraised by a tech-nique that is closely related to the return on capital employed (or return on invest-ment) by which companies are frequently evaluated.
• It results in a percentage figure that is familiar to business people.
The Disadvantages of ARR
• The main weakness is that the technique, by averaging, ignores the time valueof money. Profits in year 4 are treated as having the same value as profits inyear 1.
• It makes use of accounting profits rather than cash flows. Accounting profits havebeen subjected to the application of accounting concepts, whereas cash flowsrepresent power over resources.
The Impact of Taxation onProject Appraisal
In the real world taxation affects project appraisal in several ways. First, companies in theUK are required to pay corporation tax on their profits. So a project that generates prof-its will incur corporation tax. The amount of taxation must be estimated in the appraisaland then built into the cash flows or profits in the project appraisal.
Secondly, a company pays corporation tax approximately 9 months after the company’saccounting year-end. Because of this, it is usual to assume that the taxation is payable incash one year in arrears.
Thirdly, at the end of the project’s life and the disposal of the asset there may be anadditional taxation implication. During the project’s life a company will claim capitalallowances on the assets. These allowances are a legitimate expense in calculating taxableprofit and they have the effect of reducing taxable profit and, therefore, the amount of tax-ation that the company will pay. There are different rates of allowance and they give reliefon the difference between the cost and the estimated sales proceeds of the asset on dis-posal. When the asset is disposed of and the actual sale proceeds are known, the companywill calculate whether it has claimed too much or too little in capital allowances. If toomuch, it will need to make an additional tax payment (termed a balancing charge). Ifit has claimed too little, it will be entitled to claim further CA (termed a balancingallowance).
272 MANAGEMENT ACCOUNTING
Coombs-09.qxd 3/18/2005 1:09 PM Page 272

Inflation and Project AppraisalInflation occurs when there is a general increase in prices; it is measured by an index such asthe Retail Price Index (RPI). At the time of writing, inflation is low, between 2% and 3%.Inflation impacts on project appraisal in two ways. First, inflation affects interest rates byincreasing rates by the amount of expected inflation. Therefore, higher inflation will meanhigher costs of finance and these will have to be incorporated into the discount rate. Secondly,it makes forecasting future cash flows more difficult because they will be affected by infla-tion. Revenues and costs may well be influenced by inflation in different ways, and it is highlyunlikely that inflation will impact on a project precisely in line with changes in the RPI.
There are two main approaches to dealing with inflation in project appraisal.
• Method 1 uses a real discount rate and projects future cash flows at base year priceswith no inflation. A real discount rate is one from which the inflationary effect hasbeen removed. With this approach, inflation is removed from the discount rateand from future cash flows by projecting all cash flows at current prices. In thisapproach we are using ‘real’ cash flows and a ‘real’ interest rate, the term ‘real’ indi-cating that inflation has been removed. Inflation is removed from interest rates bythe following formula:
1 + Interest rate − 11 + Inflation
• Method 2 uses the current costs of finance and then projects cash flows at expectedmoney prices in future years. This approach starts from the premise that currentcosts of finance contain an allowance for future inflation. Therefore discounts ratesare related to the current costs of capital. This approach allows for forecasts offuture costs and revenues to be inflated at different rates.
The following example illustrates these two approaches. A company operates a repairsand maintenance division that is served by a series of diversified local depots. These haveexperienced difficulty in meeting the demands of the repairs and maintenance division inrecent months. A consultant has been approached to investigate the situation and to makerecommendations.
The consultant has come up with the following way of effecting improvements. Thecompany is recommended to purchase stores handling equipment. This would require animmediate payment of £220,000 and annual maintenance and operating charges of£40,000 at year 0, subsequently subject to inflation of 5% per year. The equipment isexpected to have a four-year life.
The company would like to carry out an appraisal of the option over a four-yearperiod. Its current cost of capital is 16% and the RPI is expected to increase at 5% for theforeseeable future.
STRATEGIC DECISION MAKING 273
Coombs-09.qxd 3/18/2005 1:09 PM Page 273

First calculate the real discount rate = 1.16 − 1 = .105 = 10.5%1.05
Then discount at current prices using a rate of 10.5%
Method 2Forecast future costs including inflationary increasesDiscount at the current cost of capital.
Method 1Yr NCF Factor 0.105
£000s 0.105 PV0 220 1 2201 40 0.904977 36.19912 40 0.818984 32.759363 40 0.741162 29.646484 40 0.670735 26.82939
345.4343
Method 2Yr NCF Factor 0.16
£000s 0.16 PV0 220 1 2201 42 0.862069 36.20692 44.1 0.743163 32.773483 46.305 0.640658 29.665654 48.62025 0.552291 26.85253
345.4986
As may be seen from the illustration, the two methods produce virtually identicalresults in terms of the projects net present values. Method 2 has a slightly higher cost by£64, but this difference is due to rounding. Drury and Tayles (1997) found that a high pro-portion of companies in a UK study failed to deal with inflation correctly. A summary ofthat article follows at the end of this chapter.
Sensitivity Analysis(or ‘what if?’ analysis)
Sensitivity analysis represents a non-probabilistic approach to allowing for risk anduncertainty in project appraisal. In consequence, it can be used in situations where infor-mation about probabilities is absent. It can also be used in parallel with techniques usingprobabilities. Sensitivity analysis examines how sensitive the net present value is tochanges in key variables, such as increases in capital costs at the commencement of the
274 MANAGEMENT ACCOUNTING
Coombs-09.qxd 3/18/2005 1:09 PM Page 274

project, increases and decreases in projected sales volumes, and increases and decreasesin variable costs. The methodology of sensitivity analysis is as follows:
1. Specify a base case or most expected situation. This is the most likely scenarioand acts as a core against which the net present values arising from changes in keyvariables can be compared.
2. Ask a series of ‘what if’ questions that explore the effect of changes in the keyvariables. For example, what if sales fall 5% or 10% below base case or rise 5% or10% above? The NPV is recalculated for each of these ‘what if’ questions. For thisstage of sensitivity analysis a computer spreadsheet is essential.
3. Up to this point, one variable has been changed at a time. This next stage involveschanging several variables, for example, what if output increases, selling price fallsand fixed costs increase?
4. At this point we evaluate the sensitivity of the project’s NPV to changes in the keyvariables.
5. Make a decision.
Let us examine an example. Suppose that base-case cash-flow projections (in millionsof pounds) are as follows:
Investment (year 0) 800Annual revenue items (years 1−10)Sales 400Variable costs 200Fixed costs 40
The cost of capital is 10%.In Table 9.8, each variable is changed in isolation. In each case the change is 10%
above or below the expected outcomes. From this table it is straightforward to see whathappens over a range of values of a single variable. For example, as annual revenuechanges from £360 million to £400 million and £440 million, net present value goes from −£63 million to £183 million and £429 million, respectively.
STRATEGIC DECISION MAKING 275
Outcomes (£m) NPVs (£m)
Pessimistic Expected Optimistic Pessimistic Expected Optimistic
Annualrevenues 360 400 440 −63 +183 +429
Annualvariable costs 220 200 180 +60 +183 +306
Annualfixed costs 44 40 36 +158 +183 +208
Table 9.8 Sensitivity analysis
Coombs-09.qxd 3/18/2005 1:09 PM Page 275

To see what happens when we vary two variables, we need to draw up a two-way table.For example, Table 9.9 shows how NPV changes when both annual revenue and variablecosts vary.
The Pivot Approach to Sensitivity Analysis
A complementary approach, termed the pivot approach, is to ask by how much a variablemust change before the NPV becomes zero. In other words, what level of change can aproject sustain and still break even, or what level of change is necessary to turn an accept-able project into an unacceptable project?
The procedure for undertaking this approach is:
1. Find the NPV of the project with the original estimates.2. For each variable in the NPV calculation (capital cost, revenues, operating costs,
discount rate and so on) calculate by how much the variable must change beforethe NPV becomes zero. This is done independently for each variable.
Table 9.10 illustrates the procedure for capital costs and annual sales for our example.Such a table indicates the variables that the project is most sensitive to. The pivot approachprovides more information for the decision maker about an important area of risk in a pro-ject. From an operational perspective, it may indicate those variables on which more man-agement time may be worth spending. For example, Table 9.10 shows that the project’sNPV is particularly sensitive to annual sales, so that more resources may need to be putinto marketing the product, year after year. The table shows that if capital costs increase by23% over budget this will result in a zero NPV. Recognition of this will highlight to man-agement of the construction phase the importance of completion within budget.
The Value of Sensitivity Analysis
The technique is transparent and readily understood by all. The output of sensitivityanalysis may have operational value in allowing managers to resource those variables thatare seen to be most critical in terms of their impact on NPV. A range of organisations usethe technique; for example, the National Health Service requires it for all projectappraisals. We have seen with pivot analysis how it can alert managers to the critical vari-ables in the management of a project. Finally, in the all-pervasive computer environment,it is ideally suited to a spreadsheet package, which takes the cost and drudgery out of the
276 MANAGEMENT ACCOUNTING
Annual revenue Variable costs (£m) 220 £(m) 200 180
360 −186 −63 +60400 +60 +183 +306440 +306 +429 +552
Table 9.9 Two-way analysis of net present value (£ millions)
Coombs-09.qxd 3/18/2005 1:09 PM Page 276

constant recalculations, and which has facilities to display the information in ways thatbring out its significant features; for example, with the use of charts.
On the downside, it increases the amount of information available to the decisionmaker but does not give a single figure signal as to whether the project is acceptable ornot. The basic variant changes one variable at a time, which may limit its usefulness, butwe have seen that changes in a number of variables can also be built in.
Non-Financial Appraisal
Desiderata Analysis
The above approaches are purely financial and may need to be supplemented with othertechniques in non-profit organisations. One way of dealing with non-financial issues isthrough the use of desiderata analysis, which was introduced in Chapter 8.
With reference to project appraisal, desiderata analysis has the following methodology:
1. A multi-disciplinary team establishes the desirable features (desiderata) requiredfrom a project.
2. The team also assigns weights of importance to the desiderata, with the more desir-able outcomes receiving greatest weight.
3. Each option is scored (e.g. from –4 to +4) in terms of meeting the various desiderata.4. The resultant weighted scores are summed in a table to establish the best option.
An illustration is provided in the following table:
STRATEGIC DECISION MAKING 277
Maximum change Maximum %Expected value Expected in variable to give change in
Variable (£m) NPV (£m) a zero NPV (£m) variable
Capital cost 800 183 +183 +22.875Sales 400 per year 183 −29.8 per year −7.45
Table 9.10 The pivot approach
Option 1 Option 2
Score ×× Score ××Desiderata Weights Score weight Score weight
D1 0.4 −2 −0.8 +2 0.8D2 0.3 +2 0.6 +2 0.6D3 0.2 +4 0.8 −4 −0.8D4 0.1 +4 0.4 +2 0.2Totals 1.0 1.0 0.8
Coombs-09.qxd 3/18/2005 1:09 PM Page 277

In the table, Option 1 scores a total of 1 and is therefore preferred to Option 2 with aweighted score of 0.8.
The advantages of the desiderata approach are as follows:
• Provided that the staff involved are located in relatively close proximity to eachother, it is quick to implement.
• It has low costs, the most significant of which is that of staff time in meeting todetermine desiderata and the scoring of options.
• It fosters co-operation as the scoring teams are usually multi-discipliniary, crossingdepartmental boundaries.
• It produces an auditable trail of the non-financial issues that have been consideredin the analysis.
The approach also has some disadvantages:
• The process is, of course, subjective.• It does provide a recommendation of the ‘best’ project but this cannot be integrated
into the financial analysis. It must be considered by decision makers alongside theresults of the financial appraisal.
• Total scores may conceal significant differences between options, so it is important thata full summary of discussions and scoring accompanies the results of the exercise.
There is an opportunity to undertake desiderata analysis in the second case study at theend of this chapter.
Cost–Benefit Analysis
Cost-benefit analysis (CBA) not only looks at the direct costs of an option but also explic-itly values indirect costs and social factors. It adds together these costs and benefits andapplies discounted cash-flow methods to them.
It was first used in the UK to appraise construction of the M1 motorway and London’sVictoria underground line. Later it was used in analysing the costs and benefits of a thirdLondon airport. It is used in a day-to-day fashion in appraising schemes for motorwayextensions and widening, river crossings, etc.
To provide an illustration, if CBA were used to appraise a proposal for adding an extralane to a motorway, then it would consider the following costs and benefits:
• The direct costs, which would consist of the costs of the land, the construction costsand the annual maintenance costs resulting from the extra lane.
• The benefits to road users in terms of fuel savings and time savings. These benefitsdo not have market prices and so ways of valuing them have been created. Fuelsavings would occur because traffic might move at a more fuel-efficient rate orbecause the motorway could carry more cars and reduce total journey time. Time
278 MANAGEMENT ACCOUNTING
Coombs-09.qxd 3/18/2005 1:09 PM Page 278

savings would be estimated based upon the estimated speed of the traffic; they couldbe valued at different rates depending on whether they are work time or leisure timeactivities. A new motorway lane will itself generate traffic, and such generated traffictime savings are also input but may be weighted less than existing traffic. Thesebenefits are valued in money terms. They are regarded as benefits of the project asthey owe their existence to the project.
• Finally, the costs and benefits would be projected over a lengthy time period anddiscounted back to the present day.
The advantages of CBA are as follows:
• It estimates the market prices of non-traded costs and benefits and adds these todirect costs to produce a ‘bottom line’ figure. Desiderata analysis is unable to do this.
• It takes account of the time value of money by discounting to these value flows toobtain an overall NPV for each option.
• CBA attempts to take a global perspective and visualise the whole problem.• It has developed innovative approaches to the valuation of intangibles such as time
savings and the costs of noise pollution.
The disadvantages of CBA are:
• It can take a very long time to complete and it can be very expensive – especiallyfor one-off projects. In this respect it is unlike desiderata analysis. Where the typeof analysis can be repeated many times, as with major road schemes, then itbecomes a much more manageable and cost-effective technique.
• It is argued that the measurable drives out the immeasurable. Because things suchas amenity cannot be valued, they are relegated to footnotes and the focus of atten-tion is located firmly on the value flows and the NPV.
ConclusionsThis chapter has shown that:
• The scale of many projects gives them strategic significance.• In project appraisal the duration of the project is a significant factor, and because of
this the idea of the time value of money and discounting is very important.• There are two discounted cash-flow techniques, net present value and internal rate
of return. Both make use of cash flows and of discounting.• There are two other techniques. Payback is cash-based and emphasises the short-
term payback of the project. Accounting rate of return is based upon accountingprofits rather than cash flows.
• Taxation impinges on project appraisal because a project will produce profits thatwill be taxed. The taxes need to be included as cash outflows.
STRATEGIC DECISION MAKING 279
Coombs-09.qxd 3/18/2005 1:09 PM Page 279

• Inflation is also significant because of the duration of projects, and there are twoapproaches for dealing with this: the real interest approach and the money interestapproach.
• Sensitivity analysis is a valuable tool for dealing with project risk. It does not useprobabilities. It may be used contemporaneously with probabilistic approaches.
• Desiderata analysis and cost–benefit analysis represent ways of dealing systemati-cally with non-financial issues.
SummaryThere are many examples of projects of a strategic nature. These projects are long-term,extending over several years, and usually involve investments, costs and revenues. Afteridentifying the scope and objectives of the project, the next step is to identify the relevantcash flows for project appraisal. Great care must be taken at this stage to include all rele-vant cash flows and to exclude those that are not relevant. Following this, the chapter con-sidered different methods of project appraisal and concluded that the best methods werethose based upon discounted cash flow – net present value and internal rate of return.Discounted cash flow is considered to be the best technique because it emphasises cashflows rather than profits (which can be manipulated), it considers all cash flows, it allowsfor the timing of those cash flows and uses the appropriate discount rate. The chapter alsoconsidered payback, a very simple cash-based technique that emphasises the short term,and the accounting rate of return that bases its appraisal on accounting profits.
Taxation can have an important influence on the net present value of a project becausea company will have to pay corporation tax on its profits and will gain capital allowanceson its investment. Because projects may last many years, it is important to take accountof inflation, and the chapter discussed two ways of doing so. Finally, the chapter consid-ered the usefulness of sensitivity analysis, a method of looking at a range of outcomesfrom a project with the objective of better informing the decision maker.
Recommended Further ReadingDrury C. and Tayles M. (1997) ‘The misapplication of capital investmentappraisal techniques’, Management Decision, 35(2): 86–93.This study is based upon a questionnaire mailed to qualified management accountants in866 UK manufacturing companies with average annual sales in excess of £10 million. Theauthors achieved a questionnaire response of 35% (305 usable replies).
The questionnaire responses indicate that payback is the most popular technique in smallorganisations and discounted cash-flow techniques the most popular in large organisations.The vast majority of organisations used a combination of methods. Small organisations rankpayback as the most important technique and large organisations the internal rate of return.
280 MANAGEMENT ACCOUNTING
Coombs-09.qxd 3/18/2005 1:09 PM Page 280

Small firms rate ‘intuitive management judgement’ highly in project appraisal, whereasthis is not the case in large organisations where formal management committees may con-sider projects for approval. The staff of small firms are more likely to base their individualjudgements on knowledge of the business.
A significant percentage of firms use the accounting rate of return, and the authors indi-cate that the only justification for this is the project’s impact on reported profits. Top man-agement may consider these to be significant to the capital markets, whilst the remunerationof top managers may be tied to annual net profit.
The authors stress the importance of the correct treatment of inflation in projectappraisal. They indicate that there are two approaches to dealing with inflation: using areal discount rate with cash flows expressed in real terms; and using a money discountrate with cash flows adjusted for future inflation. The latter approach is preferablebecause expenses and revenues inflate at different rates. The survey discovered that only53 out of 195 companies (27%) treated inflation correctly in appraisal.
The article also considers the discount rates used by firms. It confirms earlier studiesthat have found firms to be using excessively high discount rates, thereby leading tounderinvestment. A possible explanation for this is that senior managers wish to counter-act the tendency to inflate systematically the forecast returns from projects. Additionally,a company is exposed to greater risk than a well-diversified portfolio and the discountfactor may reflect this. Finally, it is also suggested that, managers may wrongly use returnon investment as a guide to a appropriate discount rate.
The authors consider the appraisal of investments in advanced manufacturing tech-nologies and find no evidence to support claims that for such projects companies setshorter payback periods and/or apply higher discount rates. It is proposed that anyunderinvestment in such technology may be primarily because of the difficulty of valuingthe benefits of such investments.
The authors conclude that managers should take care to ensure that they use appraisaltechniques correctly. They recommend that discount rates for appraisal should be estab-lished in corporate headquarters. They also conclude that corporate management shouldprovide clear guidelines on how inflation should be allowed for in appraisal.
Lumijarvi, O.P. (1991) ‘Selling of capital investments to top management’,Management Accounting Research, 2: 171–188.This article indicates a weakness with survey techniques based on questionnaire comple-tion relating to the capital appraisal techniques employed by companies. In environmentswhere investment funds are scarce, questionnaires tell us little about the ways in whichlower levels of management influence more senior managers to approve their projects.This study is based upon a field study in one organisation of how subordinates attempt toinfluence senior managers who are decision makers with respect to acceptance or rejec-tion of projects. The company is Scandinavia Corp., one of the largest companies inFinland. It has five divisions and the field study concentrates on three of them: Pulp andPaper, Metal and Packing, and Service. The company appraises projects using internalrate of return and payback.
STRATEGIC DECISION MAKING 281
Coombs-09.qxd 3/18/2005 1:09 PM Page 281

The results of the study indicate that lower levels of management attempt to ‘sell’ theirinvestments to senior decision makers in order to obtain approval for their projects. Nineinterviewees out of ten said that their investments have to be sold to senior managers suchas the heads of divisions. The interviews emphasised that projects were unlikely to beaccepted unless the support of the division head was obtained, often well in advance ofputting a proposal forward.
The arguments made by managers in their lobbying of senior staff can be categorisedas follows:
• Economic arguments: the basic argument is that the project is profitable. Profitabilitywas particularly important if the division’s profitability was poor. However, severalsenior managers indicated that profitability was rarely the most important factor,although it was emphasised that a minimum level of profitability had to be achieved –an internal rate of return of 15%.
• Strategic arguments: within Scandinavia Corp. it is essential that a project fits intoan agreed strategy or will permit a planned strategy to be implemented. Strategicarguments have more influence than economic arguments.
• Non-financial reasons, such as employment, may also be used to sell strategiesalthough it is observed that these are rarely used in Scandinavia Corp.
• Production technology arguments such as that the project represents new technol-ogy. These arguments were employed frequently and were rated as ‘very effective’by the decision maker.
Selling projects took place in formal selling occasions such as (a series of) meetingsand also on informal occasions such as trips and phone calls. Where a manager madea personal visit to a decision maker, this could have considerable influence. Once thedecision-maker is committed, both the proposer and the decision maker sell and promotethe project. The field study finds that submitted proposals are likely to be approved. Thisis because the proposer will have already sold the idea to the division head, and togetherthey will have sold the idea to other senior executives. Only after the decision makers givetheir commitment to the project are projects submitted formally for approval.
Case Study: Branchester United
Branchester United is a professional rugby club in the Kingdom of Karibya. The seasonhas recently ended and the club has finished in eighth position in the Kingdom’s 20-clubPremier Division.
The club was formed into a PLC three years ago when the game first became pro-fessional in Karibya. Prior to this the players were semi-professionals and playedrugby football on a part-time basis. The last three years have been a period ofupheaval, with two of the newly professionalised clubs going into liquidation. Indeed,
282 MANAGEMENT ACCOUNTING
Coombs-09.qxd 3/18/2005 1:09 PM Page 282

some commentators consider that the impact of professionalism has been disastrousfor the game.
The club’s city centre ground has a capacity of only 20,000, which is considered toosmall for a Premiership club. The ground is easy to access by public transport, althoughcar parking can be difficult on Saturdays when the team are playing at home. The siterepresents prime building land and is owned by the local authority and leased to theclub. The lease has 11 years to run after the end of the current season.
The club has recently been awarded a Heritage grant of £20 million towards the costof building a new stadium on the outskirts of the city at the Old Grove. One condition ofthe grant is that the club must leave the current ground at the end of the 2004/2005 sea-son and move to the new ground. Assurances have been received that the new groundcould be constructed by the start of the 2005/2006 season (1 July 2005) if a start is madein the next month. The lease agreement with the local authority would then cease at theend of the 2004/2005 season. As soon as the club vacates the current ground, construc-tion of a Heritage Mall will commence. The new stadium would cost £40 million. A slid-ing roof would be constructed for an extra £10 million.
The new location has several advantages for the club. There would be ample carparking and there would be reserved spaces for the club’s directors and key sponsors.The pitch would be surrounded by a running track and the seats would be rolled for-ward when rugby is being played. Its capacity would be 30,000 for athletics and 40,000for rugby. The sliding roof would allow rugby to be played in the depths of winter – inthe past games have had to be cancelled due to snow and freezing conditions. Finally,the sliding roof would permit pop concerts and other types of entertainment to beput on.
The club has two star players, Andy Mixon and Ryan Donaldson. Leeds Castle hasoffered £10 million for Mixon and Crystal Glass Corinthians have offered £12 million forDonaldson. The directors have issued a press statement indicating that they propose tosell both players in order to part finance the new stadium, with a further £8 million beingborrowed over 20 years at 8%. They are convinced of the benefits of the sliding roof.However, the supporters club is incensed by news of the decision to sell players and aletter from its Chairman is attached as Annex 1 at the end of this case study.
The directors include Charles Proshare, an expert in financial theory. He has advocatedin a recent TV interview keeping Donaldson, borrowing £10 million and financing £10million from reserves. He strongly advises against the issue of shares. An article in theKaribyan Financial Daily has claimed that the lack of player sales during 2003/2004 hasheld back Branchester United’s planned stadium development (Annex 2). Proshare dis-misses this assertion and has indicated that the company has £8 million cash on short-term deposit. He is supported by the head coach, who has stated that Branchester’scoaching policy has provided from its own environment world-class players such asMixon and Donaldson. He has indicated that he has three very able youngsters withworld-class potential currently playing in the reserves. All three will be promoted to thefirst team squad when Mixon and Donaldson are sold.
STRATEGIC DECISION MAKING 283
Coombs-09.qxd 3/18/2005 1:09 PM Page 283

The detailed profit and loss statement for the year ended 30 June 2004 is as follows:
£000 £000Revenues
Stadium (attendances plus net concessions) 5250TV revenues 1800Sponsorship 110Sales of players 50
7210
ExpensesStadium expenses 180Stadium rent 50Club management and coaching staff 450Playing staff (30 players) 2,750Advertising 385
Travel and hotels 170Vehicle costs 25Interest 2,400
6410---------
Net profit before tax 800Corporation tax (25%) 200
---------Net profit after tax 600Dividends: 10 million ordinary shares at 4 pence per share 400
----------
The club plays on average 24 home days per year and is entitled to a valuable shareof Premiership television proceeds as a Premiership club. Its recent performances andaverage ticket prices are as follows:
284 MANAGEMENT ACCOUNTING
Net profit
Stadium TV before Dividends Share AverageAttendances revenues revenues League tax per share price ticket price
Year (000s) (£m) (£m) position (£m) (p) (£) (£)
2000/01 450 4.5 0.56 2 1.2 102001/02 450 5.4 1.2 3 1.5 7 3 122002/03 419 5.45 1.4 7 7.3 5 2.8 132003/04 404 5.25 1.8 8 0.8 4 2 13
Coombs-09.qxd 3/18/2005 1:09 PM Page 284

Transfers to reserves 200====
The company’s current financial structure is as follows:Book value Market value
£ £10 million £1 ordinary shares, fully paid 10,000,000 20,000,000Share premium account 10,000,000Reserves 1,024,000Loans (8%) 30,000,000 30,000,000
The company’s cost of capital for project appraisal is 20%.Tenders to build the stadium before the start of the 2005/2006 season have been
received from three specialist construction companies; the cheapest of these is StadiumAll Stars, which has quoted capital costs as follows:
£000Land 5,000Building 20,000Fixtures and furnishings 13,000
-------------38,000
Sliding roof 10,000-------------48,000-------------
Branchester RFC will also have to pay planning fees of £2 million; of this, £1.2 millionhas already been spent. Construction costs and all fees will be fully capitalised.
The company will be able to claim capital allowances at the rate of 4% on a straight-line basis over a 25-year period on the whole of the capital costs (including fees). Thecompany pays corporation tax at the rate of 25%. All tax payments are made one yearin arrears. It is estimated that the stadium will be completed on 1 July 2005, the first dayof the 2005/06 financial year.
Estimates of revenues and costs relating to the new stadium are contained in Annex 3.After completion of the building and fitting-out of the stadium there will have to be a
fortnight of safety testing so that the stadium will be awarded a Health and SafetyCertificate for the start of the 2005/2006 season. The certificate will cost £5,000 anddoes not attract capital allowances.
A specialist stadium surveyor has just been contacted with reference to the detailedappraisal of the stadium. The surveyor has reported that the proposed stadium should be
STRATEGIC DECISION MAKING 285
Coombs-09.qxd 3/18/2005 1:09 PM Page 285

appraised over a 10-year period, commencing 1 July 2005, in order that it may becompared with the existing stadium.Additionally, the report states that it is usual in stadiumappraisals to consider the capital costs, the net revenues of the proposed stadium, and thenet revenues of the existing stadium.
1. Using Branchester’s cost of capital of 20%, calculate the net present value of thenew stadium. State and explain any assumptions that you need to make.
2. Making use of the results of your net present value analysis and the other infor-mation (both financial and non-financial), examine whether Branchester Unitedshould go ahead and move to the new stadium.
ANNEX 1
BRANCHESTER UNITED RFC SUPPORTERS CLUB (BUSC)
10 May 2004
The Board of Directors
Branchester United RFC
Dear Sir,
I am writing on behalf of the BUSC about the disclosure that Andy Mixon and RyanDonaldson are to be sold for a total of £20 million. Mixon is probably the best andmost dynamic forward we have, and his presence in the team will be essential if weare to avoid relegation next year. Donaldson is a superb attacking full back, firstchoice in that position for Karibya, and his transfer would cost enormously inattack, defence and goal kicking. Rather than sell the two of them we should belooking to purchase other players to strengthen our squad and progress back up thetable to where we were four years ago.
I understand that the sale is to finance the new stadium. This is another thing thatconcerns the supporters. The existing stadium is well suited for public transport, andmany supporters can walk to the ground. What does the club propose to do aboutthese supporters, many of whom have season tickets?
Since the game went professional, prices have increased. The price of a seasonticket has increased from £100 to £250 in just three years. Yet the quality of the rugbyfootball has not improved. Please bear in mind that there is lots of other entertain-ment available on a Saturday afternoon and next season, Leeds Castle, thePremiership champions, will offer a box-office television service on cable and satellitefor all their Saturday and midweek home games. The new stadium will have increasedcapacity – but what is the percentage occupancy of the existing ground, as I noticedlots of empty seats last season?
286 MANAGEMENT ACCOUNTING
Coombs-09.qxd 3/18/2005 1:09 PM Page 286

FROM THE KARIBYAN FINANCIAL DAILY, 11 MAY 2004
Branchester United yesterday announced reduced estimated post-tax profits becauseof reduced revenues from player sales. Profits were estimated at £800,000, comparedwith £7.3 millions last year.
There were no high-profile player sales in the period while the figures for 1998/99included a significant profit on the sale of Brian Davies to Blackburn Bulldogs. Profitsfrom player sales shrank from £6.34 million to £50,000.
Gate receipts have fallen but media revenues from satellite and cable have increasedas more of Branchester’s games were broadcast. Next season the picture is likely to beless rosy because of the box office viewing capability to be offered by Leeds Castle.
Branchester United has announced that it is to build a 40,000 seat stadium on a 12.5acre site at the Old Grove starting in June 2004, with completion in June 2005. It has beenoffered a Heritage Commission grant of £20 million towards the construction.
Planning permission for the new stadium has been received but the company saidit was waiting for an archaeological team to finish work on the proposed site, whichis close to an ancient Saxon settlement.
Pre-tax profits per share are estimated at 8 pence, compared with 73 pence lastyear. Dividends are cut to 4 pence and the share price has fallen by 28% in the pastyear, closing yesterday at £2.
ANNEX 3
DETAILED ESTIMATES FOR THE NEW STADIUM
Annual running costs
Office staff £45,000Security £45,000Stadium management £97,000
In conclusion, we request the directors to consider the views of the supporters, thegame’s true fans.
James McAtteeChairman
ANNEX 2
STRATEGIC DECISION MAKING 287
Coombs-09.qxd 3/18/2005 1:09 PM Page 287

Business rates £15,000Equipment depreciation £2,300Maintenance £32,000Electricity £12,500Heating £6,500Motoring expenses £8,500Marketing £25,000
It will also cost a total of £5,000 each time the sliding roof is closed and thenreopened. This is expected to occur on 20 days per year.
Annual gate receipts
Season-ticket holders: 5,500 @ £275Other paying spectators (19 home Premiership games plus 8a home Cup games plus4 Europeanb league games)
Per home match:
Notes:a Assumes that the club will get through to the quarter finals of the competition.b Assumes that the club will finish in the top four of the Premier Division in 2004/2005.
Other annual receipts
Concerts: 12 × £5,000Bars and cafeterias concessions
Sales: Drinks 100,000 × £4.50Snacks: 50,000 × £2.60
Running costs £375,500
Athletics meetings: 10 meetings per year are projected with an average expectedaudience of 27,500 and an average ticket price of £15.
288 MANAGEMENT ACCOUNTING
Probability spectators Ave. ticket price
0.3 25,000 £15.000.5 20,000 £15.000.2 15,000 £15.00
Coombs-09.qxd 3/18/2005 1:09 PM Page 288

Case Study: Social Services Agency
The Social Services Agency in Toptown is a branch of the Department of HomelandAffairs. The Agency is currently investigating the possibility of moving from its currentoffice accommodation to larger premises. The number of staff has grown significantly inthe last five years from 56 to 103, and the Agency has had to rent two small houses inthe near vicinity to provide working space for the extra staff. Many of the additional staffare peripatetic as they are responsible for visiting clients and monitoring projects beingundertaken by the local authority on behalf of the Agency.
The current building was acquired several years ago for £560,000, but it is now worth£1.2 million. It is situated in the centre of town near other civic buildings. However, thecommercial market is oversupplied in the area and it is not considered a good time tosell the property. The property provides 3500 square feet and, if vacated, would be let for£12 per square foot per year payable annually in advance. The other two houses are bothon short three-month tenancies and are let to the Agency for £3600 and £5400 per year,respectively. In total, they provide an additional 900 square feet. The current building hasa number of small fixed rooms and lacks flexibility. Both new buildings will offer openplan accommodation and be much more flexible.
There are two options for the new accommodation. One option is to rent 8000 squarefeet of office space in a new development at Baytown, comprising a large building about4 miles towards the coast. There are several offices to choose from in the complex andall have plentiful parking, but the location is inconvenient for public transport. The newoffice would be rented at £9.50 per square foot per year, payable annually in advance.This block is suitable for accommodation immediately and if this option is chosen, theAgency will move to the new accommodation immediately.
The other alternative is to purchase a block in an older part of town,Trafford.The block com-prises the ground floor and three upper floors.The ground floor and the top floor are both occu-pied at present and will continue to be so. The middle two floors are very spacious and offer9000 square feet of office space.The total rents payable by the tenants amount to £70,000 peryear payable annually in advance. The building is expected to cost £900,000, plus a further£650,000 on refurbishment and £110,000 on fees. The refurbishment would take a year, with£900,000 acquisition cost spent at the start of the project and refurbishment and fees payablein one year’s time when the building would be occupied. There is an option to incorporate airconditioning which will add £120,000 to the refurbishment costs, and it has been agreed toproceed with this option. The older part of town is well served with public transport and HighStreet is very busy. Many of the Agency’s clients live in this part of town. There is parking for40 cars incorporated into the area at the rear of the office block. The current tenants will con-tinue to use five of those spaces. The agency would move into the block in one year’s time.
Removal costs will amount to £25,000 for either option. Annual building running costsfor all buildings included within this appraisal are estimated at £9.04 per square metreper year payable annually in arrears.
STRATEGIC DECISION MAKING 289
Coombs-09.qxd 3/18/2005 1:09 PM Page 289

Two appraisal guidelines are in force:
• The Agency appraises schemes using a 6% real discount rate.• The office accommodation scheme is to be appraised over 20 years. The Trafford
scheme may be assumed to have a residual value of £1.7million in 20 years’time (in current monetary values).
The Agency’s scoring methodology is as follows:
It has been estimated that annual car expense payments to staff will be as follows:current, £18,000; Baytown, £27,000; Trafford, £13,500. These may be assumed to be paidannually in arrears.
British Council of Offices has found in recent years that the average gross floor areaper person is 8 square metres and this is considered acceptable. Gross floor area includesnon-productive space such as corridors, stairwells and meeting rooms.
A meeting of a multi-disciplinary stakeholder group (consisting of three managers andthree case officers) identified five qualitative factors for consideration in the appraisal,and weighted them to reflect this:
290 MANAGEMENT ACCOUNTING
Basis Score
Meets desiderata exactly 4Meets desiderata well 2Meets desiderata adequately 0Satisfies desiderata inadequately −2Does not satisfy desiderata at all −4
Factor Weighting Reasoning
Public transport service 3 To facilitate access by clients and staff who do not have carsAdequate car parking 3 Notwithstanding the desire to promote public
transport, it is recognised that all peripateticstaff bring a car to work
Efficient working 3 The current office set-up involves the staff beingsplit in three offices and this weakens theservice provided. It also leads to a loss in timein travelling between offices
Minimal environmental 2 In accordance with central government’s objectivesimpact to reduce vehicle emissions
A modern office 2 To allow ready communication, flexible organisation,environment air conditioning and internet-ready accommodation
Coombs-09.qxd 3/18/2005 1:09 PM Page 290

1. Calculate the net present values of both options.2. Complete the desiderata table for both options, explaining your reasons for
project scoring.3. Prepare a short briefing note (500 words) for the Agency’s chief executive in
which you bring together your conclusions about both schemes and make aclear recommendation.
Questions1. A company is considering the following investment projects. Both would involve
purchasing machinery with a life of 5 years.
• Project 1 would generate annual cash flows of £150,000; the machinery wouldcost £350,000 and have a scrap value of £45,000.
• Project 2 would generate annual cash flows of £250,000; the machinery wouldcosts £800,000 and have a scrap value of £350,000.
The company’s discount rate is 12%. Assume that the annual cash flows arise on theanniversaries of the initial outlay.
Calculate the net present value and payback for each project and state which project thecompany should accept and why.
2. A firm can buy a new printer for £2,000 payable immediately. The new printerwould make cash savings for the firm of £2,000 in the first year of operation,£4,000 in the second year and £2,000 in the fifth year.
The firm makes no savings from the printer in the third and fourth year of its life, andwill need to spend £4,000 on it in year 3 because of expensive repairs. The machine isscrapped at the end of 5 years, but there is no scrap value.
As an alternative to outright purchase, the firm could hire a printer, paying £1000 perannum, in advance, for the 5 years. The firm would still expect to make the same costs andsavings as in outright purchase, but the hire company would meet the repair cost of year 3.
If the going rate of interest is 10%, using net present value, advise the firm as to whichof the two methods (buy or hire) should be used to obtain the printer.
3. Trigger PLC is a manufacturer of computer components and a decision is requiredon a proposal to invest £1,800,000 on a new machine in order to move into a newmarket for components. The financial details are as follows:
Initial investment: £1,800,000Life of project: 10 yearsNet cash flows:
years 1–6 £500,000 per yearyears 7–10 £300,000 per year
Residual value £500,000
STRATEGIC DECISION MAKING 291
Coombs-09.qxd 3/18/2005 1:09 PM Page 291

The company has a target rate of return of 11% and a payback criterion of 4 years.
(a) Calculate the payback period.(b) Calculate the project’s net present value.(c) Advise the company on whether it should proceed with the project. Provide
reasons for your advice.
4. A company is considering an investment of £1.4 million in a project that has aseven-year life. The company has estimated its discount rate at 12%. Details of thesales and costs arising from this project are as follows:
Sales volume: 250,000 units per annumSales price: £4 per unit
CostsDirect materials (4 kg at £0.40 per kg) £1.60 per unitDirect labour (0.1 hour at £8 per hour) £0.80 per unitOverhead £330,000 per annum
Note that the annual overhead includes £200,000 per year depreciation on the asset. It alsoincludes apportioned fixed overheads of a further £50,000 per year.
(a) Calculate the net present value of the project. Provide a commentary on the dis-counting process and on the net present value that you have calculated.
(b) Carry out a sensitivity anlaysis on five variables of this project, including the lifeof the project and the discount rate. Identify what you consider to be the most crit-ical variable and advise management what they should do, if anything, beforeadopting this project.
292 MANAGEMENT ACCOUNTING
Coombs-09.qxd 3/18/2005 1:09 PM Page 292

Discount rate
No. ofperiods 1% 2% 3% 4% 5% 6% 7% 8% 9% 10% 11% 12% 13% 14% 15% 16% 17% 18% 19% 20%
1 0.990 0.980 0.971 0.962 0.952 0.943 0.935 0.926 0.917 0.909 0.901 0.893 0.885 0.877 0.870 0.862 0.855 0.847 0.840 0.8332 0.980 0.961 0.943 0.925 0.907 0.890 0.873 0.857 0.842 0.826 0.812 0.797 0.783 0.769 0.756 0.743 0.731 0.718 0.706 0.6943 0.971 0.942 0.915 0.889 0.864 0.840 0.816 0.794 0.772 0.751 0.731 0.712 0.693 0.675 0.658 0.641 0.624 0.609 0.593 0.5794 0.961 0.924 0.888 0.855 0.823 0.792 0.763 0.735 0.708 0.683 0.659 0.636 0.613 0.592 0.572 0.552 0.534 0.516 0.499 0.4825 0.951 0.906 0.863 0.822 0.784 0.747 0.713 0.681 0.650 0.621 0.593 0.567 0.543 0.519 0.497 0.476 0.456 0.437 0.419 0.4026 0.942 0.888 0.837 0.790 0.746 0.705 0.666 0.630 0.596 0.564 0.535 0.507 0.480 0.456 0.432 0.410 0.390 0.370 0.352 0.3357 0.933 0.871 0.813 0.760 0.711 0.665 0.623 0.583 0.547 0.513 0.482 0.452 0.425 0.400 0.376 0.354 0.333 0.314 0.296 0.2798 0.923 0.853 0.789 0.731 0.677 0.627 0.582 0.540 0.502 0.467 0.434 0.404 0.376 0.351 0.327 0.305 0.285 0.266 0.249 0.2339 0.914 0.837 0.766 0.703 0.645 0.592 0.544 0.500 0.460 0.424 0.391 0.361 0.333 0.308 0.284 0.263 0.243 0.225 0.209 0.194
10 0.905 0.820 0.744 0.676 0.614 0.558 0.508 0.463 0.422 0.386 0.352 0.322 0.295 0.270 0.247 0.227 0.208 0.191 0.176 0.16211 0.896 0.804 0.722 0.650 0.585 0.527 0.475 0.429 0.388 0.350 0.317 0.287 0.261 0.237 0.215 0.195 0.178 0.162 0.148 0.13512 0.887 0.788 0.701 0.625 0.557 0.497 0.444 0.397 0.356 0.319 0.286 0.257 0.231 0.208 0.187 0.168 0.152 0.137 0.124 0.11213 0.879 0.773 0.681 0.601 0.530 0.469 0.415 0.368 0.326 0.290 0.258 0.229 0.204 0.182 0.163 0.145 0.130 0.116 0.104 0.09314 0.870 0.758 0.661 0.577 0.505 0.442 0.388 0.340 0.299 0.263 0.232 0.205 0.181 0.160 0.141 0.125 0.111 0.099 0.088 0.07815 0.861 0.743 0.642 0.555 0.481 0.417 0.362 0.315 0.275 0.239 0.209 0.183 0.160 0.140 0.123 0.108 0.095 0.084 0.074 0.06516 0.853 0.728 0.623 0.534 0.458 0.394 0.339 0.292 0.252 0.218 0.188 0.163 0.141 0.123 0.107 0.093 0.081 0.071 0.062 0.05417 0.844 0.714 0.605 0.513 0.436 0.371 0.317 0.270 0.231 0.198 0.170 0.146 0.125 0.108 0.093 0.080 0.069 0.060 0.052 0.04518 0.836 0.700 0.587 0.494 0.416 0.350 0.296 0.250 0.212 0.180 0.153 0.130 0.111 0.095 0.081 0.069 0.059 0.051 0.044 0.03819 0.828 0.686 0.570 0.475 0.396 0.331 0.277 0.232 0.194 0.164 0.138 0.116 0.098 0.083 0.070 0.060 0.051 0.043 0.037 0.03120 0.820 0.673 0.554 0.456 0.377 0.312 0.258 0.215 0.178 0.149 0.124 0.104 0.087 0.073 0.061 0.051 0.043 0.037 0.031 0.026
Table 9A.1 Present value of future cash flows
Coombs-09.qxd 3/18/2005 1:09 PM Page 293

Discount rate
No. ofPeriods 1% 2% 3% 4% 5% 6% 7% 8% 9% 10% 11% 12% 13% 14% 15% 16% 17% 18% 19% 20%
1 0.990 0.980 0.971 0.962 0.952 0.943 0.935 0.926 0.917 0.909 0.901 0.893 0.885 0.877 0.870 0.862 0.855 0.847 0.840 0.8332 1.970 1.942 1.913 1.886 1.859 1.833 1.808 1.783 1.759 1.736 1.713 1.690 1.668 1.647 1.626 1.605 1.585 1.566 1.547 1.5283 2.941 2.884 2.829 2.775 2.723 2.673 2.624 2.577 2.531 2.487 2.444 2.402 2.361 2.322 2.283 2.246 2.210 2.174 2.140 2.1064 3.902 3.808 3.717 3.630 3.546 3.465 3.387 3.312 3.240 3.170 3.102 3.037 2.974 2.914 2.855 2.798 2.743 2.690 2.639 2.5895 4.853 4.713 4.580 4.452 4.329 4.212 4.100 3.993 3.890 3.791 3.696 3.605 3.517 3.433 3.352 3.274 3.199 3.127 3.058 2.9916 5.795 5.601 5.417 5.242 5.076 4.917 4.767 4.623 4.486 4.355 4.231 4.111 3.998 3.889 3.784 3.685 3.589 3.498 3.410 3.3267 6.728 6.472 6.230 6.002 5.786 5.582 5.389 5.206 5.033 4.868 4.712 4.564 4.423 4.288 4.160 4.039 3.922 3.812 3.706 3.6058 7.652 7.325 7.020 6.733 6.463 6.210 5.971 5.747 5.535 5.335 5.146 4.968 4.799 4.639 4.487 4.344 4.207 4.078 3.954 3.8379 8.566 8.162 7.786 7.435 7.108 6.802 6.515 6.247 5.995 5.759 5.537 5.328 5.132 4.946 4.772 4.607 4.451 4.303 4.163 4.031
10 9.471 8.983 8.530 8.111 7.722 7.360 7.024 6.710 6.418 6.145 5.889 5.650 5.426 5.216 5.019 4.833 4.659 4.494 4.339 4.19211 10.37 9.787 9.253 8.760 8.306 7.887 7.499 7.139 6.805 6.495 6.207 5.938 5.687 5.453 5.234 5.029 4.836 4.656 4.486 4.32712 11.26 10.58 9.954 9.385 8.863 8.384 7.943 7.536 7.161 6.814 6.492 6.194 5.918 5.660 5.421 5.197 4.988 4.793 4.611 4.43913 12.13 11.35 10.63 9.986 9.394 8.853 8.358 7.904 7.487 7.103 6.750 6.424 6.122 5.842 5.583 5.342 5.118 4.910 4.715 4.53314 13.00 12.11 11.30 10.56 9.899 9.295 8.745 8.244 7.786 7.367 6.982 6.628 6.302 6.002 5.724 5.468 5.229 5.008 4.802 4.61115 13.87 12.85 11.94 11.12 10.38 9.712 9.108 8.559 8.061 7.606 7.191 6.811 6.462 6.142 5.847 5.575 5.324 5.092 4.876 4.67516 14.72 13.58 12.56 11.65 10.84 10.11 9.447 8.851 8.313 7.824 7.379 6.974 6.604 6.265 5.954 5.668 5.405 5.162 4.938 4.73017 15.56 14.29 13.17 12.17 11.27 10.48 9.763 9.122 8.544 8.022 7.549 7.120 6.729 6.373 6.047 5.749 5.475 5.222 4.990 4.77518 16.40 14.99 13.75 12.66 11.69 10.83 10.06 9.372 8.756 8.201 7.702 7.250 6.840 6.467 6.128 5.818 5.534 5.273 5.033 4.81219 17.23 15.68 14.32 13.13 12.09 11.16 10.34 9.604 8.950 8.365 7.839 7.366 6.938 6.550 6.198 5.877 5.584 5.316 5.070 4.84320 18.05 16.35 14.88 13.59 12.46 11.47 10.59 9.818 9.129 8.514 7.963 7.469 7.025 6.623 6.259 5.929 5.628 5.353 5.101 4.870
Table 9A.2 Present value of annuities
Coombs-09.qxd 3/18/2005 1:09 PM Page 294

Chapter 10MANAGEMENT ACCOUNTING ANDPERFORMANCE MEASUREMENTSYSTEMS
By the time you have finished studying this chapter, you should be able to:• explain the need for effective performance measurement in all organisations;• discuss the influence that the organisation’s structure and culture have on its performance
measurement systems;• calculate and interpret commonly used performance measures;• describe the influence of particular contemporary environments on performance
measurement;• outline the effects of interdivisional transfers on performance measurements;• describe and apply strategically focused performance measurement techniques.
The Need for Effective PerformanceMeasurement Systems
In earlier chapters we have explored the basic need for accounting control systems andconsidered and applied some common management accounting techniques. As we saw,management accounting activity is composed of two closely intertwined components,planning and control, each of which can take place at the detailed, short-term level or atthe more strategic, longer-term level. One element of management accounting activitythat links these two components is that of performance measurement.
Without targets, deadlines and specified levels of acceptable performance, it is unlikelythat organisational players will achieve objectives. Thus it is important to consider care-fully a number of aspects of performance and performance measurement, such as thosein Table 10.1. We will realise (if we take on board the principles of contingency theory)that there is no single way of measuring performance that will suit all organisations’ needs
Key Learning Objectives
Coombs-10.qxd 3/18/2005 1:09 PM Page 295

and circumstances. Thus there is a need to frequently monitor the continuing appropri-ateness of the performance measurement solution in place.
The area of performance measurement is a huge one with implications for all organisations.Entire texts are devoted to aspects of it, so constraints of space prevent more that a relativelylimited coverage of it here. The reader would benefit from reference to more specialised textsfor a deeper understanding. An excellent coverage of many aspects of performance measure-ment is given by Simons (2000), and a robust consideration of the human aspects of perfor-mance is presented by Emmanuel et al. (1990). Many of the academic accounting journals(such as Accounting, Organizations and Society) have devoted much space to this topic.
The Influence of the Organisational Environmenton Performance Measurement Systems
We noted in earlier chapters that this area of research activity has been a very active one.The basic maxim of the contingency theory of management accounting could be expressed
296 MANAGEMENT ACCOUNTING
• What do we want to achieve?• When do we want it to be achieved?• Which performance measures are most closely related to achieving it?• What resources do we wish to commit to achieving it?• What are measuring?
• The performance of the organisation, or part of it?• The performance of an individual, or group of individuals?
• How will we measure performance?
• In terms of time?• In terms of cost incurred?• In terms of value created (however measured)?• In terms of quality?• In terms of quantity of inputs and/or outputs?• In terms of outcomes?
• For whom are we measuring performance?
• Management?• Employees?• Owners?• Other stakeholders?
• At what level of detail do we wish to measure performance?• How often should performance be measured?• What effects on organisational behaviour might performance measurement have?
Table 10.1 Issues to consider in performance measurement
Coombs-10.qxd 3/18/2005 1:09 PM Page 296

as ‘one size does not fit all’. Hence the organisational and environmental settings withinwhich the performance measurement system is to be applied must be considered care-fully. Table 10.2 lists some of the key factors to be considered within such a decision(based on Emmanuel et al., 1995).
An excellent model for consideration of the suitability of performance measures for agiven environment is given in Simons (2000). Simons’ model outlines the importance ofthe nature of the performance measure (objectivity, completeness, responsiveness) andidentifies some dysfunctional effects that may occur.
Public Sector Aspects
The issues within performance measurement exist whatever the organisational setting, butthere are, of course, variations of problems and practice across the various sectors. Withinthe public sector, the cultures that exist (service-focused, rather than profit-focused), thetendency toward bureaucracy, and the inertia that may derive from years of traditionand ‘doing things in a certain way’ may all mitigate against the successful application ofbusiness-based performance techniques and practices. Conversely, one should guard againstautomatically making the assumption that the public sector is somehow less efficientand/or less professionally managed than the private sector. Every case is different.
Lapsley (1996), in reflecting upon performance measurement in the public sector,identifies environmental factors that may influence the effectiveness of performance
PERFORMANCE MANAGEMENT SYSTEMS 297
The environment
• Predictability• Competition• Number of products• Market hostility
Organisational structure
• Size• Interdependence• Decentralisation• Resource availability
Technology
• Nature of the production process• Degree of routine• Understanding of means–ends relationships• Task variety
Table 10.2 Some contingent factors for consideration
Coombs-10.qxd 3/18/2005 1:09 PM Page 297

measurement systems and considers some of the implications. In particular (see theRecommended Further Reading section at the end of this chapter), he focuses on fiveaspects of the interface between performance measurement systems and the organisation:
• reasons for increased focus on performance measures in the public sector (political,social and economic);
• problems of transferring ‘business’ performance measurement approaches to appli-cations within the public sector;
• characteristics of performance measurement problems within the public sector;• consideration of the optimal ‘package’ of performance measures within a given
setting and the dangers of ‘creeping bureaucratisation’ and ‘spin’;• reflections on the lessons learned to date (in the UK) and possible issues for the future.
People Aspects
An organisation may be defined as the sum of its parts, or as the combined effects of itsfeatures (e.g. its structure, its locations, its products or outputs and its people). The peopleinvolved in the work of an organisation will have a big effect on how that organisationoperates, it effectiveness, it ability to respond to change and its relationships with the out-side world. Coad (1999) draws attention to how the individual personal characteristics ofmanagement accountants may impact on the performance measurement activities oforganisations. He suggests that such individuals may have either an orientation towardlearning or toward performance, and that such leanings may impact upon how the perfor-mance measurement system is used, or its outputs acted upon or interpreted. He concludesthat a learning orientation should be promoted and supported by managers as this is morelikely to increase openness to new ideas for performance measurement that may increaseits usefulness.
Divisionalisation and Decentralisation: Degrees ofResponsibility and Power
Organisations may expand and/or grow more complex in a number of ways, for examplein terms of:
• geographical expansion – to new regions, either at home or abroad;• product range – adding new products/services, and/or though increasing the varia-
tions available of each product service;• organisational structure – more complex structures, through specialisation of division
by nature or function;• diversity of customer range.
298 MANAGEMENT ACCOUNTING
Coombs-10.qxd 3/18/2005 1:09 PM Page 298

As organisations expand or become more complex, the practical difficulties of managingthe organisation as a coherent whole, maintaining focus on the key organisational objec-tives, increase. The argument over whether organisations are most effective when man-aged as individual autonomous units or as large integrated networks continues and thereappears to be a cyclical popularity of ‘big (or small) is beautiful’.
Decentralisation and Divisionalisation
One of the key decisions to be made within any large organisation is the degree of auton-omy to be allowed to individual organisational units. Where organisational units areallowed a high degree of autonomy, the organisation is said to be highly decentralised.Note here the difference between decentralisation (relating to the allocation of power/authority) and divisionalisation (relating to the fragmentation of an organisation withoutany necessary allocation of power). Hence, an organisation may consist of many divisionsbut none of these division may be able to take any important decisions for themselves –such an organisation would not be said to be decentralised.
Table 10.3 identifies some of the performance measurement issues that may arise as anorganisation becomes increasingly decentralised. In addition to such issues, there isanother major area for attention where there is a degree of trading/service provisionbetween the divisions comprising the organisational whole. Where such interdivisionaltrading or service provision (or ‘intragroup’) exists, decisions must be made about theprices, known as transfer prices, that the ‘selling’ division should charge to the ‘buying’division. Given that, in many large international organisations, the divisions will be sub-sidiary companies of a corporate group located in overseas countries and subject to dif-ferent tax laws, these decisions on interdivisional transfer prices may have taxation, legaland other political and social implications.
Transfer Pricing Considerations
When determining transfer prices, a number of questions need to be asked:
• On what basis should the transfer price be set?• Who should set the transfer price?• What are the likely behavioural effects of the transfer prices determined?• How often should the transfer prices be reviewed?
A number of transfer pricing bases have been suggested and/or applied over the yearsby organisations. Some of these are illustrated and some of their advantages/disadvan-tages described in Table 10.4.
Much of the seminal work on transfer pricing considerations was carried out in the1980s, and the work of Emmanuel and Gee and of Spicer is particularly respected in this
PERFORMANCE MANAGEMENT SYSTEMS 299
Coombs-10.qxd 3/18/2005 1:09 PM Page 299

• How to maintain focus on the organisations’ central objectives• How to maintain adequate communications among divisions and between division and centre• How to decide on the most appropriate performance measures• How to avoid over-proliferation of performance measures• How to ensure that performance measures are used properly, followed up and
action taken• What mix to use of financial and non-financial performance measures• How to obtain the right mix of long-term and short-term focused performance measures• How to measure the effectiveness of the performance measures used• How often to measure performance• Who should administer the performance measurement system and from where• How to ensure fairness and consistency of approach across the organisation• How to minimise the dangers of players’ using the performance measurement system to their
advantage• How to counter the effects (in geographically-spread organisations) of cultural differences• Whether to use the same performance measures across the organisation, or to ‘customise’
according to local conditions• How to maintain/increase the level of motivation of the workforce via the performance measure-
ment system• How to and whether to create and maintain a system of rewards (and/or penalties) related to
the performance measurement system• How to ensure that targets and benchmarks remain appropriate and at the right level
area. Emmanuel and Gee (1982) argue for the use of a market-based transfer pricingapproach on the grounds of its being the fairest approach and being verifiable by man-agers. They construct a model of a ‘fair transfer price’ based on a two-instalment transfercharge (i.e. a two-part tariff approach) but recognise and discuss a range of shortcomingsof their model. Spicer (1988) investigates the various approaches to the transfer pricingissue. He analyses the work of Watson and Baumler, among others, and, using a contin-gency theory based approach, attempts to place transfer pricing within a wider organisa-tional context and prepares the ground for further empirical research (see also Chapter 8above).
What appears to be true, as in many other areas of management accounting control, isthat there is no single transfer pricing approach that will be optimal under all circum-stances. Although some methods are easy to use, they may not yield results that are optimalfor the organisation. Other methods may be theoretically sound but may be impractical touse in real life, or the theoretical models on which they are based may be founded on unre-alistic assumptions. Other models, based on the existence of markets, may falter where thereexist imperfect or sparse markets, or where the data collection and analysis requirementsare resource-intensive. All in all, the best method to apply will depend on circumstancesand may change over time.
300 MANAGEMENT ACCOUNTING
Table 10.3 Issues that may arise as an organisation becomes increasinglydecentralised
Coombs-10.qxd 3/18/2005 1:09 PM Page 300

Table 10.4 Some possible transfer pricing bases and some advantages/disadvantages
Transferpricingbasis Basis of calculation Advantages Disadvantages/issues
Cost-based The transfer price is set • Easy to calculate and • Does not reflect the(i.e. ‘cost-plus’) at the cost of producing administer economic reality
the intermediate product, • Easy to understand • Difficulty in deciding toor a relatively arbitrary which ‘cost’ (i.e. marginal,percentage ‘mark-up’ is variable, full, opportunity)added to the cost the mark-up should be
applied• Arbitrariness of the mark-up• Difficulty in deciding by
whom and how the mark-up should be established
• May lead to unintendedbehavioural consequences
Market-based Transfer prices are set • Transfer prices should • More than one market mayby direct reference to be seen to be relevant exist, or the marketsequivalent prices within by users identified may be imperfectthe external markets • Easier for proponents • Data collection and analysis
to justify the use of the may be resource–intensivetransfer prices as as markets may be volatile‘based on fact’ and complex
• Differences will existbetween external and internal markets and so users may complain that the transfer prices do not reflect the internal organisationrealities
Mathematically Transfer prices are set • Theoretically sound • Requires refinedbased via a process of: • The process of mathematical and analytical
• identifying the variables mathematical skilland constraints within formulation helps to • Is dependent upon a fullthe decision package clarify the factors identification of the relevant
• formulating these as a within the decision factorsmathematical model • A clear, prescriptive • Difficult for non-technical
• performing solution is derived users to understandmathematical iterations upon which to take • May give a theoreticalin order to produce a action solution that ignores sometheoretically optimal aspects and thus leads tosolution unexpected consequences
(Continued)
PERFORMANCE MANAGEMENT SYSTEMS 301
Coombs-10.qxd 3/18/2005 1:09 PM Page 301

Table 10.4 Continued
Transferpricingbasis Basis of calculation Advantages Disadvantages/issues
Negotiated • The transfer price is • Should, by definition, • May lead to protracted andsettled by agreement lead to a transfer price bitter arguments over whatbetween the buying that is acceptable to is an acceptable priceand selling division both buying and selling • The negotiated price, while
divisions acceptable to both parties,may not be the best pricefor the company as a whole
• Time-consuming andadministratively expensive
Two-part The transfer pricing • Greater agreement • May be time-consumingtariff mechanism involves between the divisions and costly to administer
two components: involved • The subsequent negotiations• a ‘lump sum’ amount, • Allows divisions to get may be difficult
paid over after the on with the business of • May not lead to the mostperiod end, to cover transfer pricing while economically sound transferan appropriate amount allowing some price for the company as aof the fixed costs of negotiation before final wholethe supplying division; settling of prices
• a ‘per unit’ amount to • Should be seen as faircover the supplying as specific aspects ofdivision’s variable costs cost are identified andand a profit margin covered by the transfer
priceBoth components of thepricing mechanism aresubject to negotiation andmay be adjusted to takeaccount of extra informationafter the period
Dual pricing A system whereby, • Keeps both divisions • Unlikely to result in thebecause of difficulties happy, assuming that optimal transfer price for within the negotiation the ‘buying’ and ‘selling’ the company as a whole process, two separate pries are accepted as • May still require extensivetransfer prices are set: fair by the respective negotiation with eacha ‘buying price’ used for divisions division (or the impositionthe buying division, and of a transfer price, witha different ‘selling price’ adverse behaviouralfor the selling division consequences)
• Will require reconciliationexercise at the period endfor accounting purposes
302 MANAGEMENT ACCOUNTING
Coombs-10.qxd 3/18/2005 1:09 PM Page 302

Transfer Pricing Example
An organisation has two main divisions, S and B. Division S makes an intermediate productthat it could sell in the external market, but also sells this intermediate product to B. DivisionB buys this intermediate product from S and processes it further, producing a final productthat it sells to the external market. Relevant data are as follows:
Division S sells 1000 units per period to Division BDivision S: £
Variable cost per unit of intermediate product 10Fixed costs per period 15,000Market price per unit if intermediate product is sold
in the external market 40Division B:
Divisional B variable costs per unit processed 5Fixed costs per period 10,000Final market price for final product 60
The head office of the company has decided that the divisional managers’ remunerationwill be based upon the profit performance of their divisions.
Using the data above, let us consider some possible scenarios. In scenario 1, the head officedecides to set the transfer price for the intermediate product at a level which represents theexternal intermediate product market price, adjusted for internal conditions, giving a transferprice of £37 per unit (i.e. the external market price of £40 reduced by £3 per unit to reflectsavings in advertising, etc.). The divisional results under these conditions are:
Division S:£/unit
Divisional variable costs 10Selling price = transfer price 37Contribution per unit 27No. of units transferred per period 1,000Total contribution per period £27,000Divisional fixed costs £15,000
Divisional profit £12,000
PERFORMANCE MANAGEMENT SYSTEMS 303
EXHIBIT10.1
Coombs-10.qxd 3/18/2005 1:09 PM Page 303

Division B:£/unit
Divisional variable costs 5+ Transfer price inwards 37Total variable cost per unit 42Selling price (final product) 60Contribution per unit 18No. of units transferred per period 1,000Total contribution per period £18,000Divisional fixed costs £10,000
Divisional profit £8,000
Total company profits = £12,000 + £8,000 = £20,000
The imposition of the transfer price will result in a number of effects:
• Division S’s manager may be demotivated as the transfer price is below that which it canachieve in the market. If Division S has a large potential external market for the interme-diate product, then every unit it transfers to Division B loses it a potential £3 contribution.This £3 is effectively transferred to Division B, to the advantage of Division B’s manager.
• Division B’s manager may feel that, although Division S sells it the intermediate productat £37, Division B could buy externally a perfectly adequate substitute for less than£37. Division B’s manager therefore feels that its production costs are unnecessarilyhigh and thus its profit (and its manager’s remuneration) depressed.
• The managers of each division are demotivated because they feel that they have no realcontrol over their profits (as, although the transfer price has been based on an economi-cally sound market price, it has been dictated from above, by head office staff).
In scenario 2, the head office decides that an arbitrary transfer price £35 per unit should beused. The divisional results under these conditions are:
Division S:£/unit
Divisional variable costs 10Selling price = transfer price 35Contribution per unit 25No of units transferred per period 1,000Total contribution per period £25,000Divisional fixed costs £15,000
Divisional profit £10,000
304 MANAGEMENT ACCOUNTING
Coombs-10.qxd 3/18/2005 1:09 PM Page 304

Division B:£/unit
Divisional variable costs 5+ Transfer price inwards 35total variable cost per unit 40Selling price (final product) 60Contribution per unit 20No of units transferred per period 1,000Total contribution per period £20,000Divisional fixed costs £10,000
Divisional profit £10,000
∴ Total company profits = £10,000 + £10,000 = £20,000
As under scenario 1, the total company profit remains at £20,000. All that has changed is theallocation of the divisional profits. Under scenario 2, as compared with scenario 1, Division Sends up with £2,000 profit less and Division B is allocated an extra £2,000 profit.
Evidently, this reallocation of profits will be seen as more unfair (given its arbitrariness)than scenario 1. Division S’s manager will feel particularly aggrieved as her/his profit has beendecreased at a stroke by an arbitrary decision by head office.
Under scenario 3, the managers of divisions S and B have negotiated a transfer pricingagreement between themselves. The agreement is that each unit transferred will be charged toDivision B at Division S’s variable cost plus a mark-up of 80%. Additionally a lump-sum transferof 80% of Division S’s actual fixed costs will be made at the end of the period. The variablecost-plus charge will be revisited and renegotiated retroactively at the end of each period totake account of unexpected circumstances. The divisional results under these conditions are:
Division S:£/unit
Divisional variable costs 10Selling price = transfer price [ = £10 + 80%] 18Contribution per unit 8No. of units transferred per period 1,000Total contribution per period £8,000Divisional fixed costs £15,000Less fixed cost transfer to Division B £12,000
£(3,000)Divisional profit £5,000
Division B:£/unit
Divisional variable costs 5+ Transfer price inwards 18
PERFORMANCE MANAGEMENT SYSTEMS 305
Coombs-10.qxd 3/18/2005 1:09 PM Page 305

Total variable cost per unit 23Selling price (final product) 60Contribution per unit 37No. of units transferred per period 1,000Total contribution per period £37,000Divisional fixed costs £10,000Plus lump sum transfer inwards £12,000
£(22,000)Divisional profit £15,000∴ Total company profits = £5,000 + £15,000 = £20,000
Here, again, we see the same overall company profits of £20,000 but now Division S hasonly £5,000 of these.
This reallocation of profits between divisions may have a number of effects dependingupon a number of factors:
• the extent to which the negotiation was undertaken without the interference of head office;• the extent to which the pricing structure represents, overall, the external market;• the basis on which the managers’ remuneration is related to the absolute size of the
divisional profits earned.
All of the transfer pricing approaches taken within these scenarios have a degree of artificial-ity and bias. Additionally, the assumption has been made that the total production of Division Swill be taken up (and must be taken up) by Division B. In reality, the degree of authority that thedivisional managers have to decide whether to transfer internally or to buy/sell externally willbring into play a range of opportunity costs to be taken into account.
We have seen that interference by head office in the transfer price setting will be seen bydivisional managers as removing some of their independence and as reducing their ability toinfluence their remuneration. One possible solution might be to remove the link between per-formance, as measured by divisional profits, and remuneration. Maybe an increased focus onoverall, more strategic and qualitative objectives, rather than on short-term profitability mightenhance organisational coherence.
Practical Realities and Theoretical IdealsAny of the transfer pricing approaches outlined in Table 10.4 may be found in practicalsituations. Additionally, there are some further practical considerations that affect all ofthe approaches:
• Where the selling of the intermediate product, or service, has implications for taxation,cross-border regulations, political or social aspects, then the transfer prices should beset in such a way as to comply with the rules in place in the external environment.
• There is always a balancing act to be achieved when setting a transfer price:
� The economically optimal (ideal theoretical) transfer price is unlikely to be thatachieved through practical means.
� Theoretical perfection may lead to the transfer mechanism’s being difficult tounderstand for many organisational players.
306 MANAGEMENT ACCOUNTING
Coombs-10.qxd 3/18/2005 1:09 PM Page 306

� There is a payoff between accuracy and administrative cost.� Inappropriate transfer prices (or transfer prices that are seen to be inappropriate)
are likely to lead to dysfunctional actions by those affected.
Accounting Measures of Performance andFinancial Ratio Analysis
A large range of individuals and organisations might be interested in the performance ofan organisation. Table10.5 suggests some of the most significant interested parties. These
PERFORMANCE MANAGEMENT SYSTEMS 307
Table 10.5 Some of the parties interested in performance information
Type of organisation Interested parties
Small/medium company ShareholdersManagementEmployeesSuppliersCustomers
Large listed company As small/medium companies plusor multinational/global Government agenciesgroup Central government
AnalystsCredit rating agenciesInternational organisations
Central government Managersorganisation Voters (the public)
PoliticiansEmployeesCentral government of other countries/statesInternational organisations
Local government Managersorganisation Employees
Central governmentOther local government organisationsLocal taxpayersService usersProviders of services to local government
Charity ManagersDonors and benefactorsEmployeesBeneficiaries and representative bodiesRegulatorsCentral government
Coombs-10.qxd 3/18/2005 1:09 PM Page 307

would in most cases be interested in both financial performance measures (e.g. profitmargins, stock turnover rates, return on capital) and non-financial performance measures(e.g. productivity, market share, staff turnover). Each user will, of course, have his/her ownareas of interest and so you might wish to give some thought to the types of measures thateach would apply.
So what are the actual performance measures that organisations might use?Exhibit 10.2 illustrates some of the ‘standard’ financial performance measures that
might be used.
Illustration of the Use of Financial Performance Measures
Holby plc has obtained the following data from its management accounting system, relatingto the previous period:
Profit and loss account data£000 £000 £000
Sales 1,000Cost of sales:
Opening raw materials stocks 50Purchases 100Closing raw materials stocks (70)Materials cost of production 80Direct labour 100Production overheads 250
350
Opening work in progress (WIP) stock 80Closing WIP stock (100)Cost of goods produced (20) 410Opening stock of finished goods 120Closing stock of finished goods (90)
30Cost of sales 440
Gross profit 560Administration overhead (250)Selling and distribution overhead (180)Net profit 130
Balance sheet data:£000 £000 £000
Fixed assets 1,000
308 MANAGEMENT ACCOUNTING
EXHIBIT10.2
Coombs-10.qxd 3/18/2005 1:09 PM Page 308

Current assets:Stocks (as above) 260Trade debtors 200Cash and bank 100
560Current liabilities:
Creditors 50Net current assets 510Total assets less current liabilities 1,510Long-term loan 500Net worth 1,010
When addressing the matter of financial performance measures, we need to ask who wantsthe information. The shareholders of the company will primarily want to know how theirinvestment in the company is performing. Such information is not available directly from thetype of management accounting data given above. To answer the shareholders’ questions wewould need to have data on the company’s share price, its price–earnings ratio, earning pershare, and so on. Such analysis is possible only where the company has a market price for itsshares. This ‘higher level’ analysis is covered in texts on financial management. We can, how-ever, address the question of the company’s performance indirectly by analysing its apparentperformance based on its accounting data from its internal management accounting system.
A number of measures are available concerning return on investment, depending upon howwe define ‘return’ and how we define the investment base. ‘Return’, for instance, might bedefined as gross profit, net profit, or sales income. ‘Investment’ might be defined as totalassets, current assets, net assets etc.
The most probable ‘overall’ measure of return on investment, given the above data,would be
Net profit = 130 = 19.7%.Net worth 660
We could then ask what caused the return on investment to be 19.7%.One approach here is to apply what is sometimes called the ‘pyramid’ or ‘hierarchy’ of ratios:
PERFORMANCE MANAGEMENT SYSTEMS 309
Return on investment[i.e. net profit/net worth]
=
Return on sales × Total asset turnover
[i.e. net profit/sales] [i.e. sales/net worth]
Coombs-10.qxd 3/18/2005 1:09 PM Page 309

Note that all of these ratios are only of use in a comparative sense. The figurescalculated have no intrinsic information value but, to become useful, must be compared withsimilarly calculated figures for previous periods or other divisions, subsidiaries, and so on.
Material cost of sales =
80× 100 = 8%,
Sales 1000
Production overhead =
250× 100 = 25%,
Sales 1000
Gross profit =
560× 100 = 56%,
Sales 1000
Administration overhead =
250 × 100 = 25%,
Sales 1000
Selling and distribution overhead =
180 × 100 = 18%.
Sales 1000
We could now ask further questions such as: What caused the ‘return on sales’ to be13%? What caused the ‘sales/net worth’ to be 151.5%? ‘How do these performancefigures compare with other time periods’ performance and comparable companies’results? The last two questions are very useful and important in practice, although inmany cases the necessary comparative data may not be available. Let us concentrate onthe first two questions.
We begin with the return on sales. The ‘return’ is composed of two elements – sales andcost of sales. Focusing on the cost aspects as a proportion of sales income, a number of sub-sidiary ratios can be calculated:
So, for this example, the calculations are:
310 MANAGEMENT ACCOUNTING
Return on investment[19.7%]
= Return on sales Sales/net worth
= 130 = 13% × = 1,000 = 151.5%1,000 660
Coombs-10.qxd 3/18/2005 1:09 PM Page 310

Concentrating on the make-up of the costs, a number of further ratios may be calculated, forexample:
Materials cost=
80× 100 = 20%
Total production cost 410
A number of similar ratios could be calculated concentrating on other cost aspects such aslabour and overhead costs. Note that some of these costs will be the periodic costs (e.g. thematerials cost of the goods produced in the period), whereas the total costs figure will beadjusted for the changes in work in progress stocks. Thus, for accuracy, care would need tobe taken that costs are compared on a like-with-like basis.
Using a similar approach, the overall ‘total asset turnover’ ratio can be analysed into anumber of subsidiary indicators:
Sales (the ‘fixed asset utilisation ratio’)=
1000× 100 = 100%,
Fixed assets 1000
Sales=
1000× 100 = 3.85 time per year, or 365/3.85 = a turnover of 96 days.
Stocks 260
Stock ‘turnover rates’ could be calculated for the different aspects of stocks:
Raw materials stock turnover =
Raw materials stock (average)=
60× 365 = 219 days,
Raw materials purchases 100
WIP stock (average)=
90× 365 = 80 days,
Cost of production 410
Finished goods stocks (average)=
105× 365 = 87 days.
Cost of sales 440
Of course, with all the ratios above, we are comparing static, balance sheet figures, at aspecific date, with profit and loss based figures that cover a period of time. Thus, the figuresbeing compared are not on a strictly comparable basis and so the resultant ratios must beused with care. Also, naturally, various ideas will exist about the ‘best’ ways to calculate suchperformance indicators.
PERFORMANCE MANAGEMENT SYSTEMS 311
Coombs-10.qxd 3/18/2005 1:09 PM Page 311

The figures calculated seem, however, to indicate that the company is taking a long time topass its stocks through the system. All such stock is effectively ‘money tied up’ within thecompany and efforts to speed up the process of converting stocks into saleable goods and,eventually, cash must be beneficial.
One of the important aspects of a business that can be the ‘make or break’ of itssuccess is the way in which it manages working capital and financing. For example, it willneed to monitor cash flows to and from its debtors and creditors. Two credit managementindicators are the following:
‘Debtors’ turnover’ =Average debtors
=200
× 365 = 73 days,Credit sales 1000
‘Creditors’ turnover’ =Average creditors
=50
× 365 = 183 days.Credit purchases 100
Holby is taking around 2 months to collect from its debtors. Any improvementspossible here will be rewarded by an earlier reinvestment of the cash received, thus givingfurther opportunities for making profits. (Note that, due to lack of data we have had touse year-end debtors and to assume that all sales were on credit.) Furthermore, Holby istaking 6 months to pay its creditors. This is, of course, a very poor state of affairs and, ifthe data are reliable, Holby is likely to be experiencing great problems with its supplierrelationships. It could be, however, that the ‘snapshot’ figures used are untypical.
Two important Working capital indicators are:
‘Working capital ratio’ =Current assets
=560
= 11.2 timesCurrent liabilities 50
‘Acid test’ =Current assets − Stock
=560 − 260
= 6 timesCurrent liabilities 50
For safety reasons, we would hope that the level of current assets would cover the level ofcurrent liabilities (i.e. a ratio of 1). What is ‘normal’, however, depends on the industry sector’spractices and economic conditions, therefore contextualisation is necessary. The ‘acid test’attempts to be a more testing indicator by removing the ‘cover’ provided by stocks, a rela-tively illiquid asset. Finally, in this category, we have the
‘Cash operating cycle’ = Total debtors’ days + Total stock days − Total creditors’ days
= 73 + 219 + 80 + 87 − 183 = 276 days
The company is taking around 276 days to convert its initial investments in stocks into cash!
312 MANAGEMENT ACCOUNTING
Coombs-10.qxd 3/18/2005 1:09 PM Page 312

The main financing ratio in use is the gearing ratio which may be calculated as:
Fixed interest debt=
500× 100 = 50%.
Shareholders’ funds 1010
A number of other versions of the calculation of this indicator will be found in other texts.As we have noted above, the analysis must be used carefully and comparisons made to
contextualise the data. Although the indicators calculated will have to be used carefully, theydo at least provide a basis for further investigation and clarification. In the context of specificorganisations, other quantitative indicators may additionally prove useful. They also providedata that may be useful in ‘benchmarking’ the organisation’s performance against other simi-lar organisations.
Non-Financial Aspects of Performance Measurement
All of the analysis above is quantitative in nature. But organisations are much morecomplex than the numerical data that may be utilised to describe them.
There has been an increasing tendency in recent years to turn attention towards thenon-quantitative, qualitative side of performance measurement. There are various facetsto this:
• the aspects of productivity, absenteeism, staff turnover, morale, public image, cus-tomer satisfaction, environmental responsibility, etc. Many of these aspects are, ofcourse, people-focused in nature. Few, if any, of these areas are quantified easily infinancial terms.
• the issue of separating the performance of people from the performance of depart-ments, divisions, etc. A good manager, who makes a great effort and acts strategi-cally, may have her/his true performance ‘masked’ by being situated within adivision that performs poorly overall, when assessed according to the ‘usual’ finan-cial performance indicators. It is thus important to attempt to isolate the actual per-formance of that manager and to reward it. Such an approach will be likely toinvolve the use of non-financial indicators.
• the issue of input measures as compared with output measures. The efforts of indi-viduals form inputs into the organisational production processes. Most performancemeasures, however, tend to focus on outputs. There is thus the risk that the effortsthat an individual makes will be hidden behind the multitude of complex events thattake place in converting inputs into organisational outputs.
• the issue of outputs versus outcomes. In much of the literature discussing performancemeasurement in the public sector – (see, for instance, Lapsley (1996) – attention is
PERFORMANCE MANAGEMENT SYSTEMS 313
Coombs-10.qxd 3/18/2005 1:09 PM Page 313

paid to the differences between outputs (the immediate products of an organisation,e.g. products made or services sold) and the outcomes of the organisation’s activities(i.e. the longer-term effects, such as local levels of health as the result of a hospi-tal’s strategies). It is thus important that sufficient attention is paid to all aspectsof performance and to recognise individuals’ contributions to the organisation’ssuccess, both immediate and eventual.
Performance Measurement and ContemporaryOrganisational Environments
A wide range of organisational types exists. We looked earlier, in Exhibit 10.2, at typicalfinancially based performance indicators that might be applied within a manufacturingorganisation. What about service and public sector organisations?
The public sector operates in a rather different way from manufacturing organisations.Although a small number of public sector organisations act as semi-commercial organi-sations (e.g. nationalised industries), most public sector organisations have the provisionof services as their prime objective, with cost and quality criteria acting as constraints.Naturally, then, performance measures used in such settings should focus upon theseorganisations’ objectives and constraints.
Lapsley (1996) considered the ‘state of play’ of performance measurement in the UKpublic sector (see the recommended further reading section at the end of this chapter).Lapsley focused on five main areas:
• The rationale of performance measurement in the public sector – i.e. what was thedriving force for performance measurement?
• Performance measurement in action – here Lapsley looked at some of the issues thatarose when trying to apply business-based performance measures within a publicsector setting and identified some suitable models, including the ‘three Es’ (seebelow).
• Performance measurement as a management process – including the use of ‘check-lists’ and the problems of performance measurement systems’ stifling innovation.
• Performance measurement in specific (nationalised) industries.• Performance measurement in the future.
In his analysis, Lapsley draws attention to the problems of over-bureaucratisation,stifling of creativity, establishing valid and appropriate performance measures as well asconsidering others’ ideas on what constitute ‘ideal’ models for performance measurementin this setting. Many of the issues that Lapsley discusses, however, are not peculiar to thepublic sector. The problems of performance measurement, although contingent upon organ-isational setting, technology and culture, are relatively consistent across organisationaltypes.
314 MANAGEMENT ACCOUNTING
Coombs-10.qxd 3/18/2005 1:09 PM Page 314

One of the useful ideas that emerged from early developments in public sectorperformance management was a relatively simple one, which said that performance con-sisted of three main components:
• Economy – in simple terms, obtaining resources at the lowest possible price (obvi-ously when pursuing this goal, the constraints of quality and timeliness will need tobe considered).
• Efficiency – in simple terms, undertaking processes in ways that make the best useof available resources. Efficiency is thus a matter of maximising the outputs fromthe available inputs. Here, also, the constraints of required quality, timeliness, etc.must be taken into account.
• Effectiveness – in simple terms, the degree to which the organisation’s objectives areachieved.
The ‘three Es’ are hierarchical in that efficiency will not be achieved without economy,and effectiveness will not be achieved without efficiency. However, being economical andefficient will not necessarily result in effectiveness. Why not?
As mentioned above, effectiveness is the degree to which the organisation’s objectivesare achieved. How we define effectiveness therefore depends upon how we define ourobjectives – broadly or narrowly, short-term or long-term, financial or non-financial,quantitatively or non-quantitatively.
How might a hospital apply the ‘three Es’?
• Economy – an example might be that supplies (of pharmaceuticals, laundryservices, staff costs, etc.) would be obtained at the lowest cost commensurate withrequired quality levels. Obviously, falling below the required quality could be dis-astrous within any of these criteria, and this failing would have a direct impact uponthe hospital’s overall effectiveness.
• Efficiency – the hospital will want to make best use of its resources. It will thereforemake efforts to ensure that surgical procedures are carried out on time and quickly,to reduce the time that patients wait in hospital beds until their operations are car-ried out, to reduce the amount of time that patients spend in recovery wards beforebeing discharged. Again, however, any overenthusiasm in these respects will lead topoorer health care and an increase in re-referrals, with consequent effects on over-all effectiveness.
• Effectiveness – a big question for a hospital is ‘how should effectiveness be defined.Simple measures such as ‘number of operations carried out’ or ‘percentage reduc-tion in waiting lists’ are readily distorted by creative accounting and may not bedirectly linked to longer-term objectives such as improving the general level ofhealth of the community served by the hospital. There is in this context, the need todistinguish between outputs (e.g. number of operations performed) and outcomes(improvements in health levels). One approach to this issue was found within UKhealth authorities that made, in the 1990s, an attempt to follow two linked objectives:
PERFORMANCE MANAGEMENT SYSTEMS 315
Coombs-10.qxd 3/18/2005 1:09 PM Page 315

‘adding years to life’ (i.e. making people live longer via preventative and correctivemedicine) and ‘adding life to years’ (i.e. improving the quality of people’s lives viaimproving their general health and well-being). What was not done quite so suc-cessfully, however, was identifying appropriate performance measures that linked tothese composite objectives.
Strategic Aspects of PerformanceMeasurement – Taking a Broader Viewand Avoiding Short-Termism
Much has been written in recent years on the shortcomings of financially based and short-termfocused performance measurement systems. Such systems, it is argued, increase the risks oftaking a short-sighted view of the objectives and strategy of the organisation and thus increasethe risk of a divergence between the actions of organisational players and those actions that aremore likely to increase the overall longer-term effectiveness of the organisation.
Additionally, the organisational environment has changed markedly in recent years,and will continue to change, owing to changes in areas such as technology, communica-tions and globalisation.
Kaplan (1983) – see the recommended further reading section at the end of this chapter –drew attention to the non-financial aspects of performance control, particularly the issuesof quality and stock levels. He argues that the contemporary short production runs, flexi-bility, reductions in stock levels, technical innovation, supplier and customer relations,and efficiency must all be taken into account by the performance measurement system.He criticises the ‘automatic’ use of discounted cashflow narrowly (taking a narrow viewof financial effects) without consideration of the broader issues involved in an investmentdecision which are, of course, more difficult to measure. He suggests that financial‘experts’ have a tendency toward myopia and that reward systems should be tied toachieving strategic, rather than only financial goals – though this has the problem thatshareholders tend to think in financial terms.
Otley (2001) argues that, by the mid-1980s, management accounting had becomelargely outdated and risked obsolescence. He indicates the importance of the strategicmanagement accounting ideas of authors such as Johnson and Kaplan (1987) with theirmore forward-looking and market-focused emphasis, including the balanced scorecard(BSC). He also discusses the merits of the economic value analysis (EVA) technique,designed to increase ‘shareholder value’, and argues that such techniques as the BSC andEVA are most likely to be effective when used together. He identifies the need to recog-nise the increased application of strategic management accounting within the publicsector (see Chapters 7 and 8 for more on Otley’s work).
Cooper et al. (2002) note the popularity of shareholder value analysis (SVA) amongstblue chip companies (see also Chapter 3). They argue that SVA focuses on value drivers
316 MANAGEMENT ACCOUNTING
Coombs-10.qxd 3/18/2005 1:09 PM Page 316

but that SVA’s potential benefits are not always realised in practice, as companies fail toput their faith in the use of the measure. Research by Cooper et al. established that anumber of shareholder value based techniques, including EVA and SVA, were in use,although shareholder value was not always treated as the most critical issue. Interestingly,the use of SVA and similar techniques did not seem to have improved the profit perfor-mance of its users, although the researchers suggest that this may be the result of the rel-ative infancy of such applications.
In Chapter 5 we discussed techniques such as activity-based cost management (ABCM),benchmarking, value chain analysis, the balanced scorecard, business process re-engineeringand economic value analysis. It is not intended here to undertake further in-depth analysisof some of these strategic management accounting approaches.
ConclusionsThis chapter has shown that:
• effective performance measurement is required in all organisations;• an organisation’s structure, culture and environment will have a direct effect on
which performance measurement systems will prove most effective;• performance measurement and transfer pricing are closely interrelated – the objec-
tives of transfer pricing may have a distorting effect on performance measures;• a range of strategically focused performance measurement approaches have been
developed and promoted in recent years – these should be analysed carefully fortheir applicability in any given situation.
SummaryIn this chapter we have considered some of the fundamental aspects of performance mea-surement in modern organisations. We have seen that the process of performance mea-surement requires careful consideration of a range of behavioural, organisational,environmental and strategic factors. As with all techniques that are dependent for theirsuccess upon a range of contingent factors, there is no ‘right answer’. Thus, performancemeasurement is a process of learning and being flexible to change. This need for flexi-bility and learning has been a common theme throughout this book and it is particularlypertinent to the area of performance measurement. We have also given some attention tothe more strategic approaches to performance measurement. As these new approaches arerelatively untested, and because new approaches appear continuously in the accountingpress, this is an area upon which you should keep a regular watch. Nevertheless, there isoften a degree of ‘the emperor’s new clothes’ about these new developments and thereis always uncertainty as to which of such techniques will stand the test of time. You shouldtherefore maintain a critical stance when considering such developments.
PERFORMANCE MANAGEMENT SYSTEMS 317
Coombs-10.qxd 3/18/2005 1:09 PM Page 317

Recommended Further Reading Lapsley, I. (1996) ‘Reflections on performance measurement in the publicsector’, in L. Lapsley and F. Mitchell, Accounting and PerformanceMeasurement: Issues in the Private and Public Sectors. London: Paul ChapmanPublishing, pp. 109–128.
Lapsley addresses five main areas:
1. Rationale of performance measurement in the public sector:Lapsley asks why accountants and managers should focus on performance mea-sures. He identifies forces such as fiscal pressures, perceived inefficiency, lack ofclear ‘commercial’ objectives and the ‘dependency culture’. He also expresses theopinion that Thatcherite views on the need for devolved management and account-ability may have led to the proliferation of performance measurement activity inthe public sector since the early 1980s.
2. Performance measurement in action:Lapsley explains the relevance of the public sector focus on the ‘three Es’ (effec-tiveness, efficiency and economy) as a market surrogate toward value-for-moneyin the public sector. He draws attention to the problems of complexity and defini-tion that may occur in attempting to implement such performance measurementmodels. He comments on the questionable validity of transferring private sectormodels to the public sector, pointing to factors such as the problems of variationin practice (accounting ‘noise’) and the various possible models/frameworks, e.g.‘three Es’, FEE and Mayston that may be put forward as ‘optimal’.
3. Performance measurement as a management process:Lapsley gives examples of checklists, such as Likierman’s ‘20 lessons’, when con-sidering the effectiveness and/or relevance of public sector performance measure-ment systems. He points to the problems of clarity, consistency, contingency,measurability, controllability and reductionism that may occur, and to the stiflingof innovation, ambiguity, displacement, omission and conflict that may result fromthe enforcement of such systems.
4. Performance measurement in specific (nationalised) industries:Lapsley considers issues such as:
• which mix of key performance indicators is optimal,• the tendency to concentrate on inputs,• the danger/natural tendency towards budget ‘padding’,• the problem of ‘general’objectives – tenuous links to key performance indicators,• the problem of over-bureaucracy, data overload, ‘death by 1000 initiatives’,• the effects of patients, citizens, and customer charters in massaging of informa-
tion and compartmentalization, and • the tendency for concentration on measures of efficiency rather than effective-
ness and equity.
318 MANAGEMENT ACCOUNTING
Coombs-10.qxd 3/18/2005 1:09 PM Page 318

5. Performance measurement in the future:Lapsley comments that, in the future, we will probably see ‘more of the same’, butmany issues need to be resolved. (Note that the current UK administration, theLabour Party, has slowed the ‘privatisation’ process a little.)
Coad, A.F. (1999) ‘Some survey evidence on the learning and performanceorientations of management accountants’, Management AccountingResearch, 10: 109–135.Coad suggests that management accountants are not the proactive business consultants(skilled in design/implementation of systems, involved in business decision processesand innovation) that the literature suggests they should be. Maybe this is because theyhave a performance rather than a learning goal orientation:
• A performance goal orientation is a concern with achieving positive evaluationfrom others – this leads them to fear poor outcomes and thus they tend to avoidchallenges. They may suffer from anxiety, defensiveness etc when difficulties areencountered.
• A learning goal orientation is a concern with increasing their real competence –they are interested in work, curious, and not too bothered by mistakes.
He also suggests that this (suboptimal, undesirable) goal orientation may be due to man-agement accountants’ perception of their leaders’ behaviour. These conclusions werebased upon a postal questionnaire based survey, which is in the process of beingsupported by a case study based investigation.
Coad comments, based on the literature, that goal orientation may be contingent uponenvironmental conditions and personal attitudes to or interpretations (social construc-tions) of events.
Coad proposes that management accountants who are involved are less likely to have aperformance goal orientation, and those management accountants who see themselves asindependent are more likely to have a performance goal orientation. He argues that manyof the ‘new’ ideas relating to management accounting (ABCM, theory of constraints,value chain analysis, balanced scorecard, kaizen, etc.) have not been taken up by man-agement accountants. He argues that this failure to embrace change may partially beexplained by the goal orientation of management accountants. (i.e. predominantly aperformance goal orientation).
He argues that it is leaders who should, by example, inculcate a learning goalorientation in management accountants and managers. Leaders, he argues, should bemore transformational and less transactional, thereby stimulating innovation andquestioning of assumptions via inspirational motivation. He comments that, in recruit-ing and retaining management accountants, attention needs to be given to which typeof goal orientation is required for the work area intended. He indicates that leadersmay exhibit both transactional and transformational leadership, depending uponcircumstances.
PERFORMANCE MANAGEMENT SYSTEMS 319
Coombs-10.qxd 3/18/2005 1:09 PM Page 319

He also argues that there are important implications for the training of managementaccountants. Existing training emphasis technical and domain-specific skills, with a scarcityof broader, intellectually creative aspects. Both sides, he exhorts, need to be developed.
Emmanuel, C.R. and Gee, K.P. (1982), ‘Transfer pricing: a fair and neutralprocedure’, Accounting and Business Research, Autumn: 273–278.Emmanuel and Gee argue for the use of a market-based transfer pricing approach on thegrounds of its being the fairest approach and being verifiable by managers. They recog-nise, however, that fairness/neutrality might be compromised as:
• internal markets may be (are most likely to be?) imperfect;• transfer prices tend to be agreed for time period, whereas external market prices are
changing constantly;• if the selling division is working below capacity, problems (or deadlock) might be
encountered relating to what represents a reasonable transfer price between theexternal price and the in-house costs.
They construct a model of a ‘fair transfer price’ based on a two-instalment transfer chargewhich would consist of a charge based upon the selling division’s variable cost per unit, anda period cost (charged ex post, at the period’s end) which is based on the quantity transferredand which takes account of errors in the discount (below market price) allowed in the trans-fer price because of erroneous assumptions made (about quantities, etc.) at the year’s com-mencement. Emmanuel and Gee argue that such a model does not require accurate marketprice inspection in advance (as the period cost is calculated ex post), and avoids the need fornegotiation (as all errors are put right ex post) – although the ‘discount’ still needs to benegotiated in advance. Under such a regime, they explain, the selling division, if it has sparecapacity, will resist setting a transfer price below market price – this should be allowed forin the model’s period cost calculation that includes a ‘lost contribution’ charge.
They identify some shortcomings of their model:
• The period (including the various adjustments) may be distorted by significantdifferences (e.g. in size) between internal and external markets.
• The price which the buying division’s manager would charge to external and inter-nal markets would differ because of the different respective risk premia, and thismight lead to distortion of the transfer price.
• How should the true production capacity of the selling division be defined? Thiswould cause obvious problems for the calculation of the period cost.
• The model may lead to inefficient marketing by the final division if transfer pricesare high and the final product seems to make a loss (although it might generate somecontribution).
• Distortion will be caused by the different cash-flow implications of internal andexternal markets.
• The buying division may require more than one source of the intermediate product,for safety’s sake – hence distortion of the transfer price.
320 MANAGEMENT ACCOUNTING
Coombs-10.qxd 3/18/2005 1:09 PM Page 320

Kaplan, R.S (1983) ‘Measuring manufacturing performance – a new challengefor MA research’, Accounting Review, LVIII: 686–705.Kaplan draws attention to the non-financial aspects of performance control, particularlyemphasising the issues of quality and stock levels. He argues that management account-ing techniques (in the 1980s) were based on mass production rather than the more flexi-ble, diverse methods used in many industries today – for example, the USA learning fromJapanese production practices and philosophies. Short production runs, flexibility, andreducing stock levels must all, he argues, be taken into account by the managementaccountant in future, as must measures indicating technical innovation, supplier andcustomer relations, and efficiency.
Kaplan refers to the inadequacy of economic order quantity models (see below) forcapturing the true costs of excessive stocks and refers to the ideas inherent in just-in-time.He focuses on ‘missing measurement’, for example with regard to:
• quality – zero defects (as in just-in-time, total quality management, etc.);• stock (inventory) – degree to which uncertainty can be reduced (and therefore the
need for stock);• productivity (i.e. not costs).
Kaplan says that management accountants must focus on the new product technologies,(e.g. CAD/CAM, flexible manufacturing systems, robotics, etc.) and that the focus of per-formance measurement differs over a product’s life cycle (e.g. the need for flexibility inthe early stages of a product’s life). He criticises the ‘automatic’ use of discounted cash-flow narrowly (taking a narrow view of financial effects) without consideration of thebroader issues involved in an investment decision which are, of course, more difficult tomeasure. He suggests that financial ‘experts’ have a tendency toward myopia.
Kaplan also suggests that reward systems should be tied to achieving strategic, ratherthan only financial goals – though this has the problem that shareholders tend to think infinancial terms.
He goes on to suggest a range of research objectives based on his above observations,for example:
• new management accounting procedures designed to replace the old standard cost-ing approach;
• new management accounting procedures to deal with shorter production runs,increased flexibility and the greater percentage of fixed costs found in modernproduction environments;
• new measures of productivity (probably non-financial);• new measures related to achieving higher quality;• new measures designed to promote optimal stockholding;• improved capital budgeting procedures to incorporate wider effects, uncertainty, the
costs of reducing uncertainty, etc.;• the need for management accountants to gain a good understanding of the evolving
production environment.
PERFORMANCE MANAGEMENT SYSTEMS 321
Coombs-10.qxd 3/18/2005 1:09 PM Page 321

Gould, S. (2002) ‘Rough guide’, Financial Management, April: 30–31.Gould notes the growing popularity of the EBITDA (earnings before interest, taxation,depreciation and amortisation) but cautions against using it carelessly, drawing attentionto some of its flaws.
The increasing use of EBITDA is partially due to use by investors and analysts as theresult of an increasing ‘cash is king’ attitude amongst such parties. Increasingly, EBITDAis being included within the published annual report of companies (around 16% at thetime of Gould’s article, including such large companies as Cable and Wireless, BT,Vodafone, BT, and Reuters).
Gould notes that EBITDA has the tendency to flatter performance and may thereforebe used for this end. He points to the particular popularity of the measure within start-upand telecoms companies disguising the fact that such companies may in their early yearsbe making no profit. He argues that the use of EBITDA may have given an early warningof the problems at Enron, since its reported profit figures disguised the fact that they werenot backed up by any cash generation.
Conversely, Gould identifies that EBITDA is not a direct measure of cash generation(and thus not a direct indicator of a company’s ability to service its debt). Additionally,the fact that EBITDA is an unofficial measure of performance allows it to be calculatedin a number of ways, to the particular firm’s advantage. Gould gives examples of suchvariations in calculation.
Keef, S. and Roush, M. (2002) ‘Does MVA measure up?’, FinancialManagement, January: 20–21.In discussing the use of the market value-added (MVA) approach, Keef and Roush suggestthat a main reason for its use is that it focuses upon the maximisation of shareholders’ wel-fare. He notes that MVA’s acceptance as a performance measurement technique is evi-denced by Fortune magazine’s having reported the rankings of companies, based on theirMVA performance, since the early 1990s.
Keef and Roush refer to a seminal definition of MVA given by Stewart (1991) as ‘thedifference between a company’s fair market value, as reflected primarily in its stock price,and the economic book value of capital employed.’ Keef and Roush define economic bookvalue, in this context, as ‘the best estimate of the monies shareholders have invested in thecompany. It consists of the sum of the monies subscribed for new shares, together withretained earnings, which are profits that could have been paid out as dividends, but havebeen reinvested for shareholders’.
Keef and Roush suggest that part of MVA’s popularity may be due to its apparentability to convert accounting numbers into measures of economic value, that is, to be ameasure of ‘true’ economic performance.
Keef and Roush criticise MVA in several respects:
• MVA is a ‘hybrid’ performance measure in that it is partly ex post and partly ex ante,and thus may give unclear signals regarding what it is actually measuring.
322 MANAGEMENT ACCOUNTING
Coombs-10.qxd 3/18/2005 1:09 PM Page 322

• MVA is essentially the present value of future EVA. They argue that there is nosystematic link between the cost of an investment and the NPV that it creates (smallinvestments can create large NPVs and vice versa). They argue that the value createdby an investment is no more or less important than its cost. It is the net effect that isimportant. Secondly, they criticise MVA for incorporating economic book valuewhich they argue includes past sunk cost aspects.
• The evidence suggests that MVA is of limited value in predicting the financial futureof a firm, Keef and Roush arguing that strategic decisions, rather than the assetsemployed, by a firm are more important in determining share prices.
• MVA is distorted by the size of the company, therefore a size-adjusted MVA calcu-lation would be more appropriate.
• The MVA of the firm represents the MVA of the shareholders who bought theirshares when the company was set up. What, ask Keef and Roush, is the MVA ofshareholders who have acquired their shares since then? They answer that there willbe almost as many MVAs as there are shareholders, each shareholder having adifferent MVA.
They conclude that, rather than attempting to maximise MVA, an imperfect measure,one should concentrate on the matter that really interests shareholders: maximising theorthodox risk-adjusted abnormal return.
Azofra, V., Prieto, B. and Santidrian, A. (2003) ‘The usefulness of a performancemeasurement system in the daily life of an organisation: a note on a casestudy’, British Accounting Review, 35: 367–384.This paper takes a case study approach to the use of performance indicators by aSpanish subsidiary of a North American multinational. The plant had turnover of $87million and employed 340 people. Its sphere of operations was car production for suchcompanies as Volkswagen, General Motors and Renault. Managers saw the plant asoperating in a ‘war economy’ (p. 370) where error led to loss of profits and potentialimpact on the level of employment. Initial stimulus for change came from a majorcustomer.
The indicators were designed in the Spanish plant and were the result of negotiationand consensus in the plant. The primary objective of such changes was to motivate behav-iour. The paper points out the substantial competitive pressures that companies are underand that these have led to substantial modifications of productive processes. Suchapproaches include TQM and JIT, which seek rationalisation of the production cycle aswell as continuous improvements in quality, time and cost. It is also seen as important torecognise that such practices cannot be introduced in an isolated and unconnected way butmust also be accompanied by innovations in other areas of the organisation. Such changesare seen as including a need to develop both qualitative and quantitative measures, as the
PERFORMANCE MANAGEMENT SYSTEMS 323
Coombs-10.qxd 3/18/2005 1:09 PM Page 323

use of financial indicators alone to assess performance is seen as inadequate. The systemin the paper is known as Performance Indictors System for Continuous Improvement(PISCI) and is divided into five areas – Finance, Materials, Human Resources, Production,and Quality.
The principal characteristics of the system introduced were:
• A combination of financial and non-financial indicators (164) which are revisedannually.
• Workers are seen as owners of at least one indicator and have to answer for both itsevolution and the actions needed to correct deviation.
• Each indicator has a comprehensive definition including name, area to whichit is linked, code, unit of measurement, how calculated and key individualaccountable.
• Data exchange between areas through computerised systems to improve informa-tion flow and to detect potential manipulation.
The paper concludes with the view that the inclusion of non-financial performanceindicators is a valuable means of disaggregating strategy and communicating to workersthe objectives of the company. Despite the large number of indicators, there seems no con-fusion or tension and they are seen as a valuable tool to mark responsibilities and involveworkers, thus increasing the potential motivation of the workforce. Head office strategiccontrol is limited to 12 indicators as internal management at plant level influences inter-nal behaviour through both monetary (bonus incentives) and non-monetary rewards (giftsand congratulatory letters).
Case Study: Callas plc
Callas plc is a large company that manufactures and sells a wide range of goods to theclothing and personal accessory markets. It has a range of retail outlets across the UKand has recently expanded its retailing and manufacturing activities into mainlandEurope. Callas plc’s current product range is aimed primarily at the under-20, high streetfashion market. Its products have been losing their appeal to this sector in recent yearsand a new marketing team has recently been appointed in an attempt to revitalise sales.The new team has spent a significant amount of time and money on a new televisedpromotion/marketing campaign although, it argues, it is too early yet to see the resultsof the campaign.
Callas plc’s main administrative, accounting/finance and marketing activities are dealtwith by its head office in London. A certain amount of authority for local advertising,
324 MANAGEMENT ACCOUNTING
Coombs-10.qxd 3/18/2005 1:09 PM Page 324

manufacturing management, product distribution and human resource management(HRM) matters is, however, given to regional headquarters based in Cardiff (Wales),Glasgow (Scotland), Lille (France) and Borlange (Sweden). Callas plc’s head office man-agement insist that, wherever possible, administrative, financial, reporting and HRM pro-cedures are standardised across all regions.
Managers in the retail outlets are paid bonuses based upon their outlets’ quarterlyoperating profits and, additionally, a regional managers’ profit-sharing scheme is in placewhich is related to the company’s after-tax profits for the past year. Retail operative staffand other administrative staff are not entitled to participate in the bonus scheme,although they are able to earn overtime pay. Additionally they may receive awards forgood performance, following an annual individual performance appraisal carried out bytheir direct supervisors. The profit margins in Callas plc’s line of business are not greatand this is the justification given by the company for its paying relatively low amountsto its retailing and administrative staff.
A management control system was put into place by Callas plc’s central manage-ment accounting staff in 1990. The control system is based on an annual budget,calculated at headquarters level, for which regional and outlet managers haveresponsibility. Monthly management accounting control reports are produced byCallas plc’s headquarters which indicate actual and budgeted results for thepast month. Managers are required to explain the differences (variances) betweenactual and budgeted figures to Callas plc’s management team, within one week fol-lowing the month’s end. Comparisons are made between the performances of thevarious outlets and regions of the company, the results of these comparisons beingmade available to all company personnel via the Callas intranet. An award is made,each quarter, to the manager of the region that has performed best, althoughthe basis of comparison has changed from time to time. The budgeted figures forthe month are calculated from the actual budget upon a time-based, pro-rata basis.A pro-forma for the monthly performance report forwarded to outlets is shownbelow:
PERFORMANCE MANAGEMENT SYSTEMS 325
Monthly Performance Report – Pro Forma Date produced:…………….Region:………………………….Outlet: ………………………….Outlet Manager: …………………….
You are required to explain all variances to Headquarters Management AccountingDivision by one week following the date of production of this report.
Coombs-10.qxd 3/18/2005 1:09 PM Page 325

Product Line Fashion Clothing Personal Accessories
Actual Budget Variance Actual Budget Variance
£ £ £ £ £ £
Sales
Cost of Sales:
Bought-in materials:
Consumables:
Direct Labour:
Supervision:
Factory overheads:
Non-factory overheads:
Net stock adjustment:
.......................................................... ................................................
GROSS PROFIT
Marketing and distribution:
Product development:
.......................................................... ................................................
NET PROFIT
Net profit margin %
Sales per person
Sales per m2
326 MANAGEMENT ACCOUNTING
Coombs-10.qxd 3/18/2005 1:09 PM Page 326

Perspective Meaning
Financial ‘To succeed financially, how should we appear to our shareholders?’Customer ‘To achieve our vision, how should we appear to our customers?’Internal business ‘To satisfy our shareholders and customers, what business
process processes must we excel at?’Learning and ‘To achieve our vision, how will we sustain our ability
growth to change and improve?’
Callas’s top management has recently made moves into marketing the business viathe Internet, with the intention of an eventual full e-commerce capability.
Additionally, it has been undergoing negotiations with a UK government organisationregarding the supply of large amounts of uniforms for use by government employees. Ifobtained, this large contract would form a significant part of Callas’s UK business and, if suc-cessful, this type of business would increasingly be sought in Callas’s other geographicallocations. Such new business would, however, stretch Callas’s UK production and distribu-tion capacities to the limit. It would therefore need to consider other means of servicing thebusiness, such as outsourcing. All government contracts would need to be gained by ten-dering for contracts against competitors, an unfamiliar aspect of business for Callas.
Management at Callas’s headquarters has found it increasingly difficult to make deci-sions about the company’s product and customer mix. Despite the company having madeand sold more in recent years, its profitability has declined. The management team feelthat the company’s new customer-focused strategy will have a positive effect but areunsure of how to gauge the effectiveness of its efforts in the short to medium term.
Managers at both regional and outlet level have complained about the validity of thebudgets and variance calculations sent to them by headquarters, but Callas’s accoun-tants have responded that, each year, budgets are updated for known trends, inflation,and so on. Additionally, the head office management accountants select outlets, on acyclical basis, for cost-cutting exercises, in an effort to optimise cost efficiency.
The company announced earlier this year that its strategy is moving towards customersatisfaction as a key issue and that managers at all levels need to ensure that customersatisfaction and product/service quality show a clear improvement year-on-year. Thehead office accountants made an attempt in 1997 to put into place a set of non-financialperformance indicators. This was fiercely resisted by managers at the regional and out-let level who complained that they did not understand what these measures were forand that the mode of calculation was unclear and subjective. A new initiative has nowbeen put in place, by the managing director, who has forwarded a memorandum to allmanagers instructing them to implement a new set of non-financial measures within thenext month. Additionally he has instructed all managers to inform him as to how theycould implement the principles of the ‘balanced scorecard’ within their divisions. The fourbalanced scorecard perspectives, which the managers are to consider within their divi-sions, have been identified as follows (based on Kaplan and Norton, 1996: 9):
PERFORMANCE MANAGEMENT SYSTEMS 327
Coombs-10.qxd 3/18/2005 1:09 PM Page 327

Regional managers have been complaining recently that they are under constantpressure from their production staff who argue that the cost targets within which theyare required to operate are impossibly tight. The regional managers have stressed that acomplete review of the cost targets should be undertaken in order to establish whichproducts are worth manufacturing. Callas’s financial director has recently become awareof the concept of target costing and has instructed the head office management account-ing team to investigate the potential of this approach.
Based upon the above information:
(i) Discuss the possible behavioural, motivational and ethical issues that mightarise out of Callas plc’s use of its management accounting control systems.
(ii) Given the company’s new strategic focus upon customer satisfaction, analyse the typeof information which managers at regional and outlet levels might require in order tomonitor their performance and to control operations. Give examples of specific per-formance indicators that might be usefully applied, within each of the balanced score-card perspectives, and discuss the advantages/disadvantages of such indicators.
(iii) Critically analyse the potential implications for Callas plc’s management accountingsystems of the possible changes in the nature of the company’s business.
(iv) Outline the possible value of applying a target costing approach within Callas plc.
Information related to Callas Plc – Period since May 2003Several developments regarding Callas Plc have taken place since May 2003.
Firstly, sales in the personal accessories aspect of the business have decreased, althoughprofits seem to have been relatively unaffected (as far as can be ascertained from theaccounting system). In the fashion clothing side of the business, the opposite effect seemsto have occurred, i.e. sales have increased but profitability seems to have decreased.
At the manufacturing level, the monthly performance reports have indicated a con-tinuing trend of increasingly adverse cost variances, but production managers have beenunable to ascertain the reasons underlying this. This has led to an escalating amount ofpressure upon production managers from the head office staff. A member of the headoffice management accounting staff has suggested that a system of activity based costmanagement (ABCM) might assist in the resolution of this issue.
Callas Plc has been successful in obtaining its first government contract for the supplyof uniforms and has already tendered for a further four major government contracts, twoof which are in the UK, one in Sweden and one in France. Having obtained the first con-tract and now preparing for success in the other tenders, the company is reviewing itsoperations to maximise the chances that the new contracts will be profitable. The pro-duction managers within the manufacturing plants have warned that, if all tenders aresuccessful (and this seems likely), the company’s production capacity will be exceeded greatly. The head office management team has been considering, therefore, strategies toovercome this problem. Their favoured option, at present, is to outsource at least 50% ofthe government contracts and to cut costs, wherever possible, by launching a further
328 MANAGEMENT ACCOUNTING
Coombs-10.qxd 3/18/2005 1:09 PM Page 328

efficiency drive aimed at the manufacturing plants. The government sector business isvery price competitive and it has been suggested, by an external consultant, that the intro-duction of target costing systems is now an urgent requirement.
The e-commerce side of the business has taken off and is growing quickly. Initially,head office staff manned the Internet-based business, but the head office has nowpassed this responsibility to the retail outlets, on the basis that the outlets are moreskilled in selling. The Callas plc website’s popularity and competitive strategy was basedupon promising delivery times that were faster than those of competitors. While this hasbeen maintained to date, increasing pressure has been mounting upon the company’swarehousing and distribution capabilities and some custom has been lost.
Retailing staff turnover has increased markedly during the past few months and thehead office management team suspects that this may be caused partly by the relativelylow pay levels. Outlet managers, however, feel that a more likely cause is decreased jobsatisfaction.
Little progress has yet been made on the implementation of Balanced Scorecard (BSC)approaches. Operational managers have argued that they are too busy, under conditionsof increased pressure of work, to devote time to a new system that is seen to be inade-quately defined, and arbitrary. They have also demanded that, should a performancesystem based on the BSC be introduced, they would expect to be rewarded adequately.Relationships between the head office, regional offices and outlets have worsenedrecently, probably due to the increased pressures felt by most staff. An air of conflictbetween the management accountants and other managers is noticeable and theFinancial Director is pondering how matters can be improved.Based upon the additional information provided post May 2003:
(1) Analyse Callas plc’s recent history and discuss the extent to which it demon-strates the use of effective feedback systems.
(2) Discuss the extent to which the application of systems of activity-based costmanagement (ABCM) and Target Costing might be able to assist in dealing withCallas plc’s problems.
(3) Given Callas’ plc’s plans for the future, and the problems which it is experienc-ing currently, analyse how improvements to its management accounting infor-mation system (MAIS) might assist in the management of the company. Giveexamples of specific information that the improved MAIS might produce.
Case Study: Fantasy Planet University
Fantasy Planet University is a former polytechnic which became a new universityin 1992. One of its major departments is the Business School, which comprises 90academic staff and 20 administrators. The School is led by a head of school and splitinto five divisions – Strategy, Enterprise, Accounting and Finance, Human Resource
PERFORMANCE MANAGEMENT SYSTEMS 329
Coombs-10.qxd 3/18/2005 1:09 PM Page 329

Management and Professional Courses; the latter teaches the courses provided bythe School. Research is carried out in the School but has to be covered by the teach-ing and consultancy income the School earns, as the research assessment exercisefound the quality of research did not reach a sufficient standard to attract governmentfunding.
The budget for the School is approximately £9 million in 2003/04. There are over5000 full-time equivalent students who are taught on undergraduate, postgraduateand professional courses. In 2003/04, 45% of the income for the School is payableinto the centre to support non-teaching departments such as the library, computingand the directorate of the University. Approximately two-thirds of the sum payableto the centre is used to fund support departments such as Finance, while the remain-ing third is used to provide a Strategic Adjustment Fund and capital projects. TheStrategic Adjustment Fund is used to help fund schools where student incomeis insufficient to meet the schools’ costs. Such funding is only provided for a maxi-mum of three years to allow the School to develop plans to turn itself around. Afterthat date the School must be self-financing through whatever means. This includespotentially closure and certainly staff redundancies to bring cost and income intobalance.
Up until 2000/01 the Business School was a ‘cash cow’ for the University but there hasnow been a downturn in demand for business courses since that date. Due to a fearedshortfall in funding across the University in 2000/01, targets for the School were increasedby the University’s central directorate. In 1999/2000 actual income was £8 million, but thetarget for 2000/01 was set at £10 million based on increased student numbers. Actualincome was £9.5 million. Target income was again increased in 2001/02 to £10.5 million.Actual income was again below target at £9.6 million. The deduction in 1999/2000 forsupport costs was 40% of target income, but this was increased in 2001/02 to 45%. Thetarget income was reduced in 2002/03 to £9.5 million but actual income fell to £9 million.In 2003/04 target income remained at £9.5 million and in April 2004 it was anticipatedthat a small surplus would be made in 2003/04. Prior to 2002/03 income was paid by thefunding body to the University for teaching purposes on the basis of enrolments. From2002/03 income is only paid if students complete the assessments set. This means that nofunding is available for students who fail to submit any assessment and drop out. Thefunding body has also reduced the amount payable to try to ensure the University makesefficiency gains. The centre still takes 45% of target income as the contribution to centralcosts.
The bulk of the costs of the School are staff costs. Supplies and services costs(photocopying, transport, etc.) have been as high as 20% of the expenditure budget.Limited monitoring information is provided during the course of the year and theSchool has developed its own internal monitoring systems. This has resulted in sup-plies and service costs being reduced to 12% of the expenditure budget by 2003/04.Additional staff were recruited (5) in 2001/02 and there is a need to find increased
330 MANAGEMENT ACCOUNTING
Coombs-10.qxd 3/18/2005 1:09 PM Page 330

pension costs and national insurance taxes. Staff levels have remained consistentsince 2001/02.
The Business School also undertakes consultancy activity. This is commercial workcharged at commercial rates and is outside the government grant. The Universitysystem is that 20% of the income from consultancy is paid to the University’s consul-tancy company for undertaking the relevant administration associated with the activ-ity, 20% is payable to the Business School, and the balance is payable to the staffmember who undertakes the activity. The Business School also employs outside con-sultants to undertake these activities. The payment system is the same as for internalstaff. At the end of the year the Business School’s share of the income is transferred tothe School from the consultancy company but there is no knowing what this transferis until the end of the year, although again the University provides a target for theSchool to achieve.
It is now half way through 2004/04 and the Business School has a cumulative deficitof £2.5 million and has approached the centre for support from the Strategic AdjustmentFund. The University’s directorate is currently considering this request.
Finally, the Business School is also to reorganise into four new departments which willact as profit centres in the next academic year.
(i) Identify the main features of the budgetary system outlined above.(ii) Comment on any advantages and disadvantages that may exist in respect of the
features you have identified.(iii) What would you advise the Business School to do about the situation?(iv) What would you advise the University’s directorate to do and why?(v) How would you reconcile your advice to the School and the directorate where it
differs?(vi) What issues would you need to consider in establishing the new profit centres?
Case Study: Sioca PLC
Sioca PLC started life as a regional electricity generating company in Ampland, aEuropean country. Such regional companies were nationalised by the Ampland govern-ment in 1945 in order to safeguard the reliability of service provision. There was, how-ever, concern that the nationalised electricity service was being operated inefficiently andthat costs to the consumer had spiralled upwards. There was a governmental decision in1990 to reprivatise such service providers in order to motivate them to produce bettervalue for money through the mechanisms of customer choice and competition betweenproviders.
PERFORMANCE MANAGEMENT SYSTEMS 331
Coombs-10.qxd 3/18/2005 1:09 PM Page 331

Sioca PLC has been the licensed provider of electricity in the South East Ampland areasince 1991 and, during the intervening period, it has responded to relaxations in gov-ernment regulations such that it now supplies water and gas services to the same geo-graphical area. The nature of Sioca PLC’s business activities has thus evolved significantlysince the early 1990s. While Sioca PLC still provides electricity to its consumers, it doesso via a network of smaller, privately owned generating companies. These companies areentirely separate from Sioca PLC and are dealt with by Sioca PLC on an ‘arm’s length’basis. In order to supply its customers, Sioca PLC uses the electricity cable networkowned by K-Bel PLC, for which it pays a two-part fee which comprises a fixed annualcharge and a variable charge based on usage.
Sioca PLC supplies water and domestic gas to its consumers by similar mechanisms.Sioca PLC effectively acts as a licensed ‘wholesaler’ whereby separate water and gascompanies sell their output to Sioca PLC which then sells it to the end-users. In doing so,Sioca PLC must pay the owners of the water and gas supply networks for the use of theirdistribution networks.
Competition exists within Sioca PLC’s operating environment in that, while it is essen-tially an electricity company which also trades in water and gas, other companies existwhich operate in the same markets within the local area. Hydra PLC, the company orig-inally licensed to supply water in the South East Ampland area, now offers electricity andgas supplies, amongst other products, in competition with Sioca PLC.
In addition to the competitive activity which exists for the supply of power and water,several of Sioca PLC’s competitors have now widened their product portfolios to includethe financial services area, offering personal loans, mortgages, insurance, and so on.While Sioca PLC has not moved into these activities as yet, it is giving serious consider-ation to including such operations in the near future.
The increasing level, and increasingly diverse range, of competition has had many sideeffects within Sioca PLC. The advent of competition led to the need for intense market-ing activities in order to maintain Sioca PLC’s market share. Legislation has made it easyfor consumers to change suppliers whenever they decide. There has been a need toattempt to differentiate products and to convince consumers of the quality of theservices provided. Pressure to maintain the reliability of the services provided has alsoincreased. Continuous downward pressure on prices to consumers has resulted from twosources: competitors’ tactics and government watchdogs’ moves to limit excessive prof-iteering and large price rises.
The cost pressure on Sioca PLC has led to a need for rationalisation, and the com-pany has recently completed the first stage of its ‘re-engineering’ project, which hasresulted in the redundancy or forced retirement of approximately 300 staff. Many of theredundancies, however, were carried out on a last-in, first-out basis, with the result thata large proportion of the remaining staff have worked within the industry for quitesome time and originate from the period when the company’s main line of business wasthe generating of electricity. Significant staff retraining has been necessary and SiocaPLC has been enlisting the help of several local educational institutions to run training
332 MANAGEMENT ACCOUNTING
Coombs-10.qxd 3/18/2005 1:09 PM Page 332

courses on an ad hoc basis as skills shortfalls have become evident. Such training courseshave proven to be very expensive and Sioca PLC’s board is not yet convinced of theireffectiveness.
There has been a considerable amount of movement of senior staff between Sioca PLCand its competitors as the market for capable senior managers has heated up.
Sioca PLC’s profits have fallen considerably, year-on-year, during the past five yearsalthough it has managed to maintain its dividend yield to date. Its share price has fallengradually over the same period. It is estimated that, if current trends were to continue,Sioca PLC would have difficulty in stabilising profitability. Given the need for sustainedinvestment in technology in its business environment, the directors of Sioca PLC arebecoming concerned about the company’s ability to obtain financial backing in futureyears. Additionally, the government is maintaining a programme of monitoring the qual-ity of services to customers with which Sioca PLC will need to comply. The board has notyet been able to obtain a clear answer from its management team as to whether aservice quality shortfall exists in this respect.
Since privatisation, Sioca PLC has developed a large range of sophisticated andcomplex tariff systems for the purposes of charging its customers in the domestic andcommercial sectors. Sioca PLC has developed a far wider choice of tariffs than its com-petitors in an effort to become more attractive to consumers. Sioca PLC also offers a24-hour telephone helpline service to all its customers and the majority of its work-force have been equipped with pagers or mobile phones in order to ensure their‘around the clock’ availability. Last year, Sioca PLC’s board decided to make a oneoff payment to employees to reward them for their increased commitment to thecompany.
All managers within Sioca PLC have been given delegated budgets, and managers areexpected to control the costs within these budgets strictly. Middle managers receive anannual bonus based on the total savings made during the control year, while senior man-agers receive bonuses in the form of Sioca PLC ordinary shares. The senior managers’bonuses are calculated in relation to Sioca PLC’s after-tax profit levels for the previousyear.
Sioca PLC has recently experienced some trouble in dealing with customer complaintsbecause of higher than previous levels of absenteeism and sick leave. It has also sufferedsome poor publicity recently related to its responses to customer queries and complaints.Complaints from customers have covered a range of matters including slow responses tocall-outs, failure to complete repairs satisfactorily first time, unprofessional or abrupttelephone manner of helpline staff as well as matters such as frequent power cuts orsurges, water shortages and gas pressure falls.
Sioca PLC’s managing director, Joules Van Den Graaf, has spearheaded a number ofinvestigations in recent months in an effort to sort out some of the company’s problems.In investigating the problem of the poor publicity mentioned above, he was informed bythe company’s senior managers that the appearance of adverse articles in the local presswas the first that these managers had known about the customer complaints problem.
PERFORMANCE MANAGEMENT SYSTEMS 333
Coombs-10.qxd 3/18/2005 1:09 PM Page 333

They were, they argued, too busy managing the physical provision of electricity, gas andwater services to be able to allocate time to such problems.
The company’s middle managers complained that they had more than enough workwith which to fill their time, given the complex nature of their day-to-day tasks and theneed to control their budgets. Several such managers commented that much of theirtime was spent poring over their weekly budget reports, arguing with Sioca PLC’saccountants about the amount of overheads with which they had been charged andlooking for ways to reduce their overhead costs. Most middle managers seemed to havelittle idea about how the overhead costing system really worked. There was a commonattitude amongst middle managers that there was little to be gained from questioningthe validity or reliability of the costing system as the Sioca PLC accountants (the‘budget police’ as they were called by these managers) made it very clear that a clearunderstanding of the company’s complex costing system required an accountant’smind. Many of these managers seemed to have reached the point whereby they hadgiven up attempting to discuss such matters.
In the course of his investigations, managers at all levels within Sioca PLC had com-plained to Mr Van Den Graaf that they had insufficient information to manage effec-tively. This Mr Van Den Graaf found puzzling. He had been made aware of thecomprehensive budget reports received by managers each week. Indeed, it had takenhim more than two hours to make sense of one such report, although he had put thisdown to his lack of experience of the detailed complexities to which the report hadrelated. Van Den Graaf had queried why this weekly report contained so many esti-mated figures. The accountant responsible for producing the report had replied that thefault lay with the manager of the cost centre to which the report related. There was ageneral problem, the accountant explained, that managers did not seem to be able tounderstand or take an interest in the company’s accounting systems. Many of thesesystems were well proven, he argued, having been established in the company’s earlydays and having been expanded and further sophisticated as time had passed.Although many detailed forms were sent out to managers every month, so that theycould enter the details required to allow the calculation of accurate apportionmentsand so on, managers seemed to have little commitment to the system. This lack ofcommitment had, the accountant explained, been the main reason why no attempthad been made to computerise the data entry process.
In an attempt to air these problem, and possibly move towards alleviating some ofthem, Mr Van Den Graaf had called several joint meetings of accountants and man-agers. On each occasion it had been difficult to stick to the agenda, as the meetingstended to degenerate into unproductive slanging matches. Neither the managementnor accounting parties seemed to be able or willing to see the other’s viewpoint.Managers complained that accountants used the costing systems to ‘confuse anddemoralise the managers and to increase the power of accountants’, while accoun-tants argued that such systems were ‘in existence to protect the investors, not to sup-port the managers’ ailing departments’.
334 MANAGEMENT ACCOUNTING
Coombs-10.qxd 3/18/2005 1:09 PM Page 334

Mr Van Den Graaf had done his best to discharge the atmosphere at the meetings butwas left feeling that he needed to generate some powerful new ideas in order to movethe company forward and to give it the potential to succeed.
1. Analyse the implications of recent changes in Sioca PLC’s operating environmentwhich are likely to affect the effectiveness of its management accounting infor-mation systems (MAIS).
2. Identify the principal MAIS components which Sioca PLC would require inorder to achieve its immediate and longer-term control and decision-makingobjectives.
3. Discuss the behavioural, motivational and ethical aspects of Sioca PLC’s activities,and of the MAIS which you have specified in your answer to question 2.
Additional Information for the Period from February 2003 to August 2003.The board of Sioca PLC made a decision in March 2002 to move into the financial servicesmarkets in order to compete effectively. Among its initial developments in the financialservices markets were:
• the provision of personal loans to private individuals.• home buildings and contents insurance.• consumer goods repairs insurance (on such goods such as personal computer
systems, ‘white goods’ etc).
Additionally, the company has commenced acting as a management consultancyorganisation although, in this respect, it acts as a middle-man whereby it sub-contractseducational organisations and small firms of accountants and other professionals tocarry out consultancy and training activities for it, under the Sioca Consultancy name.Apart from initiating the contracts with, and paying fees to, the sub-contracting bodies,Sioca PLC has little direct involvement in these activities.
Similarly, Sioca PLC’s new activities in the loan finance and insurance markets are, inreality, largely delegated to banks and insurance companies already operating withinthese fields. The fees paid to the banks and insurance companies consist of a fixed man-agement fee, fixed in advance and based on estimated business volume, plus a variablecommission based on amounts of loan/insurance raised.
Staff morale problems have intensified within Sioca PLC over the past 6 months.The company has been taken to court by several employees on the grounds of itsallegedly having placed employees under excessive stress. Many of its longest servingemployees have sought early retirement recently and a considerable number of intelli-gent but inexperienced young staff have been recruited to replace those staff who haveleft.
To a large extent, the majority of Sioca PLC’s staff are involved in administrative,marketing and public relations activities and the already heavily criticised weekly budget
PERFORMANCE MANAGEMENT SYSTEMS 335
Coombs-10.qxd 3/18/2005 1:09 PM Page 335

reports are seen, by most staff, to have become even less useful than before. A numberof managers have created their own unofficial management accounting systems andtherefore tend to ignore the official system. Indeed, several managers have arguedstrongly that they should no longer be charged with the costs of the official system andthis has resulted in a higher charge being levied upon the remaining system users,halfway through the budgeting year. The remaining system users have been criticisedheavily for their failure to control overhead costs.
The training of the new young managers has concentrated on the use of the exist-ing reporting systems although some of these managers have commented that theyneed to be involved in the design of a new management information system Theaccounting department has argued that the new managers lack sufficient experienceto enable them to make a meaningful input and that thus the management infor-mation system should remain the province of the accounting department for the timebeing.
Given the wide range of Sioca PLC’s activities, an Assistant Director position hasbeen created to head up each of the company’s main activities, e.g. electricity services,water services, insurance services etc., and each of these activities is to be treated asan investment centre (even though all major investments must be authorised by HeadOffice). Each assistant director is responsible for the return-on-capital of his/heractivity and for developing new markets and products. Several of the new assistantdirectors have already complained that the existing budgeting system does not help inthe latter respects.
The accounting department has warned that the degree of uncertainty experienced inmany of the company’s newer markets will lead to less frequent reports being available,if reporting accuracy is to be maintained.
A bonus system for both assistant directors and key staff within their activities hasbeen introduced whereby bonuses are based upon the overall turnover generated by theactivities. This seems to have had some positive effects in increasing turnover.
At a recent meeting of the board of Sioca PLC, concern was expressed that, despiteSioca PLC’s having expanded its range of activities greatly, its profitability had continuedto decrease.
In relation to the additional information provided subsequent to January 2003:
1. Critically analyse the events which have occurred within Sioca PLC since January2003 and the management accounting information systems related problems thathave resulted.
2. Discuss the extent to which Sioca PLC’s new products and markets might affectthe nature of the management accounting information it will require in future.
3. Write a brief report to Sioca PLC’s managing director which provides an actionplan designed to overcome the problems which exist, or may exist in future.
Be specific about what needs to be done and who will be involved.
336 MANAGEMENT ACCOUNTING
Coombs-10.qxd 3/18/2005 1:09 PM Page 336

Questions1. Discuss the extent to which ‘strategic management accounting’ represents a new
dimension of management accounting. 2. Critically examine the interrelationships between motivation and performance
appraisal and discuss the implications of such interrelationships for managementcontrol systems.
3. Examine the extent to which it is possible for a multinational organisation to spec-ify an optimal transfer pricing system.
4. For a university library that provides services to other university departments:
(i) explain, and evaluate the suitability of, the transfer pricing mechanisms thatmight be used to charge library services to other departments;
(ii) outline the effects that the resultant library charges might have on the levelsof innovation and creativity within the client departments.
5. As the management accountant of an international distribution company, youhave been asked to make a brief presentation to the company’s senior manage-ment on the nature and coverage of strategic management accounting (SMA).Prepare some notes on the content of the proposed presentation which should:
(i) discuss the coverage of SMA;(ii) analyse the claimed advantages of SMA;
(iii) discuss the possible problems of implementing SMA within the company.
6. Assess the relevance to today’s management accountant of the economics-basedanalysis of the transfer pricing problem. Assess critically the alternative practicalapproaches to the establishment of transfer prices.
7. Discuss the extent to which activity-based cost management and business processre-engineering fall within the domain of management accountants. What do youconsider to be the main limitations of these approaches?
8. It has been suggested that the nature of management accounting is changing suchthat management accounting may cease to exist as a separate discipline in futureyears. Give, and justify, your opinion on whether management accounting isdoomed to extinction.
9. Examine the management accounting related difficulties encountered within aninternationally divisionalised organisation.
10. ‘Strategic management accounting is merely good management accounting’.Critically assess this statement.
11. Emmanuel and Gee (1982) discuss the strengths and weaknesses of a two-part,fairer approach to setting transfer prices. Discuss the validity of such a transferpricing approach for the recharging of the computer services department of ahealth authority to other departments within that authority. Your discussion shouldinclude an evaluation of the suitability of other transfer pricing approaches thatmight be used in this context.
PERFORMANCE MANAGEMENT SYSTEMS 337
Coombs-10.qxd 3/18/2005 1:09 PM Page 337

12. (i) Discuss the extent to which practical methods of setting intracompany trans-fer prices represent a compromise.
(ii) Critically analyse the extent to which transfer pricing is relevant within apublic sector organisation of your choice.
13. Outline and discuss the economic, practical and ethical aspects of multinationaltransfer pricing.
14. Wilson (1995) proposes that ‘The emergence of strategic management accounting …is a recent phenomenon and there is, as yet, no unified view of what it is or howit might develop’. Discuss.
338 MANAGEMENT ACCOUNTING
Coombs-10.qxd 3/18/2005 1:09 PM Page 338

BIBLIOGRAPHY AND RECOMMENDEDFURTHER READING
Amigoni, F. (1978) ‘Planning management control systems’, Journal of Business Finance andAccounting, 5(3): 279–92.
Argyris, C. (1953) ‘Human problems with budgets’, Harvard Business Review, 31(1): 97–110.Ashton, D., Hopper, T. and Scapens, R. (1995) Issues in Management Accounting (2nd edition).
Hemel Hempstead: Prentice Hall.Azofra, V., Prieto, B. and Santidrian, A. (2003) ‘The usefulness of a performance measurement
system in the daily life of an organisation: a note on a case study’, British Accounting Review,35: 367–84.
Bannock, G. and Manser, W. (1999) International Dictionary of Finance. London: Penguin Books.Baring Asset Management (1997) Lamont’s Glossary, (8th edition). London: Advanced Media Group.Bhimani, A. and Piggott, D. (1992) ‘Implementing ABC: a case study of organisational and
behavioural consequences’, Management Accounting Research, 3: 119–32.Brealey, R.A. and Myers, S.C. (2002) Principles of Corporate Finance, 7th edn. New York: McGraw-Hill.Briers, M. and Hirst, M. (1990) ‘The role of budgetary information in performance evaluation’,
Accounting, Organisations and Society, 15(4): 373–98.Bromwich, M. and Bhimani, A. (1989) Management Accounting: Evolution not Revolution.
London: CIMA.Burns, J. (2000) ‘The dynamics of accounting change – Interplay between new practices, routines,
institutions, power and politics’, Accounting, Auditing and Accountability, 13(5): 566–96.Chandler, A.D. (1962) Strategy and Structure: Chapters in the History of the Industrial Enterprise.
Cambridge, MA: MIT Press.Chwastiak, M. (1999) ‘Deconstructing the principal–agent model: a view from the bottom’, Critical
Perspectives on Accounting, 10: 425–41.Coad, A.F. (1999) ‘Some survey evidence on the learning and performance orientations of
management accountants’, Management Accounting Research, 10: 109–35.Collin, P.H., Collin, F. and Collin, S.M.H. (2001) Dictionary of Business. Peter Collin Publishing.Collins (2000) Collins English Dictionary. Retrieved from xreferplus, http:/www.xreferplus.
com/entry/2669715.Coombs, H.M. and Evans, A. (2000) ‘Managing central support services through service level
agreements’, Government Accountants Journal, 49(1): 54–9.Coombs, H.M. and Jenkins, D.E. (2002) Public Sector Financial Management (3rd edition).
London: Thomson Learning.Coombs, H.M., Hobbs, D. and Jenkins, D.E. (2000) ‘Management accounting for the new millen-
nium and beyond’, in S. Saunders and N. Smalley (eds), Simulation and Gaming ResearchYearbook, Vol. 8. London: Kogan Page.
Cooper, R. (1990) ‘Cost classification in unit-based and activity-based manufacturing cost systems’,Journal of Cost Management, Fall: 4–14.
Coombs-Bibliography.qxd 3/18/2005 1:10 PM Page 339

Cooper, R. and Kaplan, R.S. (1987) ‘Measure costs right: make the right decisions’, HarvardBusiness Review, September/October: pp. 96–103.
Cooper, S., Davies, M. and Davis, T. (2002) ‘Value judgement’, Financial Management, February: 31.Drucker, P.F. (1994) Managing the Future. New York: Penguin.Drury, C. (2004) Management and Cost Accounting (5th edition). London: Thomson. Drury, C. and Tayles, M. (1997) ‘The misapplication of capital investment appraisal techniques’,
Management Decision, 35(2): 86–93.Drury, C. and Tayles, M. (2000) Cost system design and profitability analysis in UK companies.
Chartered Institute of Management Accountants.Eccles, R.R. (1985) ‘Control and fairness in transfer pricing’, Harvard Business Review, November –
December, 149–61.Emmanuel, C.R. and Gee, K.P. (1982) ‘Transfer pricing: a fair and neutral procedure’, Accounting
and Business Research, Autumn: 273–8.Emmanuel, C., Otley, D. and Merchant, K. (1990) Accounting for Management Control (2nd edition).
London: International Thomson.Ezzamel, M., Morris, J. and Smith, J.A. (2004) Accounting for New Organisational Forms.
Research Update, 8–9 September, CIMA.Foucault, M. (1977) Discipline and Punish: The Birth of the Prison. London: Allen Lane.Garcke, E. and Fells, J.M. (1887) Factory Accounts, Their Principles and Practice. London:
Crosby, Lockwood & Co. Garrison, R.H. and Noreen, E.W. (2000) Managerial Accounting (9th edition). Boston:
Irwin/McGraw-Hill.Gietzmann, M. (1995) ‘Introduction to agency theory in management accounting’, in D. Ashton,
T. Hopper and R. Scapens, Issues in Management Accounting (2nd edition). Hemel Hempstead:Prentice Hall, pp. 259–72.
Goldratt, E.M. (1990a) The Haystack Syndrome: Sifting Information out of the Data Ocean. Croton-on-Hudson, NY: North River Press.
Goldratt, E.M. (1990b) What Is This Thing Called Theory of Constraints and How Should It BeImplemented? Croton-on-Hudson, NY: North River Press.
Goldratt, E.M. and Cox, J. (1984) The Goal: A Process of Ongoing Improvement. Croton-on-Hudson,NY: North River Press.
Gould, S. (2002) ‘Rough guide’, Financial Management, April: 30–1.H.M. Government (1994) Better Accounting for Taxpayers’ Money: The Government’s Proposals,
Cm 2626. London, HMSO.Hofstede, G.H. (1968) The Game of Budget Control. London: Tavistock.Hopwood, A.G. (1972) ‘An empirical study of the role of accounting data in performance evaula-
tion’, Journal of Accounting Research, 10: 156–82.Hopper, T. and Armstrong, P. (1991) ‘Cost accounting, controlling labour and the rise of conglome
rates’, Accounting, Organizations and Society, 16(5/6): 405–38.Hopper, T., Tsamenyi, M., Uddin, S. and Wickramasinghe, D. (2003) ‘The state they’re in’,
Financial Management, June: 14–19.Hopwood, A. (1974) Accounting and Human Behaviour. Englewood Cliffs, N.J.: Prentice Hall.Hussey, R. (1999) Oxford Dictionary of Accounting. Oxford: Oxford University Press.Innes, J. and Mitchell, F. (1995) ‘A survey of activity-based costing in the UK’s largest companies’,
Management Accounting Research, June: 137–54.Johnson, H.T. and Kaplan, R.S. (1987) Relevance Lost: The Rise and Fall of Management
Accounting. Cambridge, MA: Harvard Business School Press.
340 BIBLIOGRAPHY AND RECOMMENDED FURTHER READING
Coombs-Bibliography.qxd 3/18/2005 1:10 PM Page 340

Kaplan, R.S. (1982) Advanced Management Accounting. Prentice Hall.Kaplan, R.S. (1983) ‘Measuring manufacturing performance – a new challenge for MA research’,
Accounting Review, LVIII: 686–705.Kaplan, R.S. (1994) ‘Flexible budgeting in an activity-based costing framework’, Accounting
Horizons, June: 104–9.Kaplan, R.S. and Norton, D.P. (1996) The Balanced Scorecard: Translating Strategy into Action.
Boston: Harvard Business School Press.Keef, S. and Roush, M. (2002) ‘Does MVA measure up?’, Financial Management, January: 20–1.Kennis, J. (1979) ‘Effects of budgetary goal characteristics on managerial aspects of performance’,
Accounting Review, 4: 707–21.Lapsley, I. (1996) ‘Reflections on performance measurement in the public sector’, in L. Lapsley and
F. Mitchell, Accounting and Performance Measurement: Issues in the Private and Public Sectors.London: Paul Chapman, 109–28.
Locke, E.A. (1968) ‘Towards a theory of risk motivation and incentives’, Organisational Behaviourand Human Performance, 3: 157–89.
Loft, A. (1995) ‘The history of management accounting’, in D. Ashton, T. Hopper and R. Scapens(eds), Issues in Management Accounting (2nd edition). Hemel Hempstead: Prentice Hall.
Lumby, S. and Jones, C. (2003) Corporate Finance Theory and Practice (7th edition). London:Thomson.
Lumijarvi, O.P. (1991) ‘Selling of capital investments to top management’, Management AccountingResearch, 2: 171–88.
Lyne, S. (1995) ‘Accounting measures, motivation and performance appraisal’, in D. Ashton,T. Hopper and R. Scapens (eds), Issues in Management Accounting (2nd edition). HemelHempstead: Prentice Hall, pp. 237–58.
Mak, Y.T. and Roush, M.L. (1994) ‘Flexible budgeting and variance analysis in an activity-basedcosting environment’, Accounting Horizons, June: 93–104.
March, J.G. (1976) ‘The technology of foolishness’, in J.G. March and J.P. Olsen (eds), Ambiguityand Choice in Organizations. Bergen: Universitetsforlaget.
Merchant, K.A. (1998) ‘Management control-related ethical issues and analyses’, in ModernManagement Control Systems, Hemel-Hempstead: Prentice Hall, pp. 697–712.
Mintzberg, H. (1975) Impediments to the Use of Management Information. New York: NationalAssociation of Accountants.
Otley, D.T. (2001) ‘Extending the boundaries of management accounting research: developingsystems for performance management’, British Accounting Review, 33(3): 243–61.
Otley, D.T. (1980) ‘The contingency theory of management accounting: achievement and progno-sis’, Accounting, Organisations and Society, 5(4): 413–28.
Otley, D.T. and Berry, A.J. (1980) Control, organisations and accounting, Accounting, Organisationsand Society, 5(2): 231–44.
Otley, D.T. (1978) ‘Budget use and managerial performance’, Journal of Accounting Research,16: 122–49.
Ouchi, W.G. (1979) ‘A conceptual framework for the design of organisational control mechanisms’,Management Science, 25(9): 833–48.
Pass, C., Lowes, B. and Pendleton, A. (1995) Collins Dictionary of Business. London: Peter CollinPublishing.
Pass, C., Lowes, B. and Davies, L. (2000) Collins Dictionary of Economics. London: Peter CollinPublishing.
Penguin (2000) The Penguin English Dictionary. London: Penguin.
BIBLIOGRAPHY AND RECOMMENDED FURTHER READING 341
Coombs-Bibliography.qxd 3/18/2005 1:10 PM Page 341

Porter, M.E. (1985) Competitive Advantage: Creating and Sustaining Superior Performance.New York: Free Press.
Preston, A. (1995) ‘Budgeting, creativity and culture’, in D. Ashton, T. Hopper and R. Scapens (eds),Issues in Management Accounting (2nd edition). Hemel Hempstead: Prentice Hall, pp. 273–98.
Proctor, R. (2002) Managerial Accounting for Business Decisions. Harlow: Pearson Education.Robson, K. and Cooper, D. (1989) ‘Power and management control’, in W.F. Chua, E.A. Lowe and
A.G. Puxty (eds), Critical Perspectives in Management Control. MacMillan, pp. 79–114. Roget (1995) Roget’s II: The New Thesaurus (3rd edition). Boston: Houghton Mifflin. Retrieved
from xreferplus, http://www.xreferplus.com/entry/746368.Ronen, J. and Livingstone, J.L. (1975) ‘An expectancy theory approach to the motivational impact
of budgets’, Accountancy Review, 50: 671–85.Roslender, R. (1995) ‘Critical management accounting’, in D. Ashton, T. Hopper and R. Scapens
(eds), Issues in Management Accounting (2nd edition). Hemel Hempstead: Prentice Hall, pp. 65–86.Samuels, J.M., Wilkes, F.M. and Brayshaw, R.E. (1999) Financial Management and Decision
Making. London: International Thomson Business Press.Shim, J.K. and Siegel J.G. (1995) Dictionary of Economics. New York: Wiley. Retrieved from
xreferplus, http://www.xreferplus.com/entry/2764220.Simon, H.A. (1953) ‘Theories and decision making in economics and behavioural science’,
American Economic Review, XLIX: 253–83. Simons, R. (2000) Performance Measurement and Control Systems for Implementing Strategy. New
Jersey: Prentice Hall.Spicer, B.H. (1988) ‘Towards an organisation theory of the transfer pricing process’, Accounting,
Organizations and Society, 13(3): 303–22.Stedry, R.C. (1960) Budget Control and Cost Behaviour. Hemel Hempstead: Prentice Hall.Stewart, G. (1991) The Quest for Value. New York: Harper Business.Swieringa, R.J. and Waterhouse J.H. (1982) ‘Organizational views of transfer pricing’, Accounting
Organizations and Society, 7(2): 149–65.Upchurch, A. (1998) Management Accounting Principles and Practice. London: Financial
Times/Prentice Hall.Walker, M. and Choudhury, N. (1987) ‘Agency theory and management accounting’, in J.A. Arnold,
R. Scapens and D. Cooper (eds), Management Accounting: Expanding the Horizons. London:Chartered Institute of Management Accountants, pp. 61–112.
Watson, D.J. and Baumler, J.V. (1975) ‘Transfer pricing: a behavioural context’, AccountingReview, July: 466–74.
Wilson, R.M.S. and Wai, F.C. (1993) Managerial Accounting: Method and Meaning (2nd edition).Singapore: Chapman & Hall.
Zimmerman, J.L. (1979) ‘The costs and benefits of cost allocations’, Accounting Review, July:504–21.
342 BIBLIOGRAPHY AND RECOMMENDED FURTHER READING
Coombs-Bibliography.qxd 3/18/2005 1:10 PM Page 342

INDEX
ABC see activity-based costingABCM, 133accounting measures of performance, 308–13accounting profit, 22accounting rate of return (ARR), 270–1
advantages, 272disadvantages, 272
Accounting, Organisations and Society, 296acid test ratio, 312activity-based cost management, 133activity-based costing (ABC), 60–7
activity cost pools, 63benefits, 66cost drivers, 63overview, 62problems, 67
administration overheads, 26agency theory, 202, 210aims, 86, 88allocation of overheads, 53Amigoni, F., 109–10annuity, 264t, 265apportionment
bases, 54criticisms of, 59–60of overheads, 53reasons for, 58–9
Argyris, C., 26, 157ARR see accounting rate of return Ashton, D. et al., 169–70, 210asset turnover ratio, 310average investment, 271average profits, 271avoidable costs, 30, 240–1Azofra, V. et al., 323
balanced scorecard, 134balancing allowance, 272balancing charge, 272Bannock, G. and Manser, W., 87baring asset management, 23basic knowing, 21
behavioural consequences of budgeting, 109benefits of activity-based costing, 66beyond budgeting, 137Bhimani, A. and Piggott, D., 73break-even, 68
assumptions, 229–30chart 70, 225–6
Brealey, R.A. and Myers, S.C., 90Briers, M. and Hirst, M., 109, 113budget
complications, 106defined, 90preparation, 92–105process, 95users, 91uses, 91variances, 155
budgeted profit and loss account, 102Burns, J., 140, 204business process re-engineering, 136business strategy, 85
capacity usage ratio, 167cash budget, 103cash operating cycle, 31CBA see cost-benefit analysischarities and performance information, 308Chwastiak, M., 203, 211CIMA (Chartered Institute of Management
Accounting), 3Coad, A., 218, 298, 319–20Collin, P.H. et al., 85, 86Collins English Dictionary, 85compound interest, 263compounding, 263constraints (linear programming), 232constraints, theory of, 204context of management accounting, 5, 10contingency factors, 297
environmental, 297structural, 297technological, 297
Note: page numbers followed by t refer to tables
Coombs-Index.qxd 3/18/2005 1:10 PM Page 343

contingency theory, 206, 297continuous improvement – performance
indicators, 324contract manufacturing, 105contribution, 68, 221
analysis and decision making, 222–7chart, 71, 226
control information – qualities, 151control process, 147control systems and organisational
design, 202controllable cost, 27Coombs, H.M. and Evans, A., 35Coombs, H.M. and Jenkins, D.E., 35, 133Coombs, H.M. et al., 21Cooper, R., 316Cooper, R. and Kaplan, R.S., 230corporation tax and project appraisal, 272cost analysis, 25cost behaviour, 27cost behaviour graphs, 29cost-benefit analysis (CBA), 278
advantages, 279disadvantages, 279
cost centres, 53cost classification, 26cost drivers, 63cost estimation, 125cost management process, 22cost minimisation (linear programming), 236cost pools, 63cost sub-variances, 161–4cost unit, 22cost variances, 161–6cost-based transfer pricing, 302cost-plus pricing, 247creditors’ turnover, 312
Daily Telegraph, 158DCF (discounted cash flows), 264debtors’ turnover, 312decentralisation, 298–300desiderata analysis, 246t, 277t
advantages, 278disadvantages, 278
direct costs, 25direct expenses, 25direct labour, 25direct labour budget, 100direct labour efficiency variance, 162direct materials, 25direct materials price variance, 162direct materials usage variance, 162direct materials variances, 162
direct wage variances, 162discount factor, 264, 293discount rate, 264, 267discounted cash flows (DCF), 264discounted payback, 270discounting, 263divisionalisation and decentralisation, 298–300Drucker, P.F., 3Drury, C. and Tayles, M., 274, 280–1dual transfer pricing, 302
EBITDA, 322Eccles, R.R., 251economic value, 322economic value-added (EVA), 136, 316economy, 315effectiveness, 315efficiency, 315
ratio, 166variance, 162
Emmanuel, C. et al., 297Emmanuel, C.R. and Gee, K.P., 300, 320engineering methods and cost estimation, 125environmental (contingent) factors, 297EVA (economic value-added), 136, 316Ezzamel, M. et al., 44
fair transfer price, 300, 320feedback concepts, 148feedback control loop, 149feed-forward control, 148financial accounting, 4financial accounting policies, 23financial performance measures, 308–13financial ratio analysis, 308–13financing ratio, 312fixed asset utilisation ratio, 311fixed budgets, 152fixed costs, 28fixed overhead
expenditure variance, 162variances, 162volume variance, 162
flexible budgets, 152–5formula budgets, 133Foucault, M., 19, 208–9full cost, 57future value, 263
Garrison, R.H. and Noreen, E.W., 3gearing ratio, 312Gietzmann, M., 203, 210–11goal, 86–8Goldratt, E.M., 204, 205
344 INDEX
Coombs-Index.qxd 3/18/2005 1:10 PM Page 344

Goldratt, E.M. and Cox, J., 204Gould, S., 322graphical solution (linear programming), 233
hierarchy of ratios, 309–13high-low method, 126history of management accounting, 5, 10Hofstedte, G.H., 170Hopper T. and Armstrong, P., 19Hopper, T. et al., 74Hopwood, A. 169–70Hussey, R., 4
inflation and project appraisal, 273–4information requirements for MA, 15input–output relationship, 313inspection of accounts, 126internal rate of return (IRR), 267–8
advantages, 268disadvantages, 268
JIT see just-in-timeJohnson, H.T. and Kaplan, R.S., 6, 18, 61just-in-time (JIT), 321, 323
systems, 138
Kaplan, R.S., 130, 316, 321Keef, S. and Roush, M., 322Kennis, J., 170
labour process approach, 11labour process school, 11Lapsley, I., 34, 297, 313–14large firms and performance
information, 308learning goals, 319linear programming, 231–7local government and performance
information, 308Locke, E.A., 170Loft, A., 6, 12, 17, 209Lumby, S. and Jones, C., 268Lumijarvi, O.P., 266, 281–2Lyne, S., 149, 169–70
make or buy decisions, 240management accounting, definition of, 2March, J.G., 172margin of safety, 68marginal cost, 220marginal cost collection system, 71marginal costing, 68–71marginal costing assumptions, 221marginal costs, 30
marginal revenue, 220market-based transfer pricing, 300–1, 320market value-added (MVA), 322–3master budget, 101material usage budget, 99material usage variance, 186materials cost budget, 99materials purchase budget, 100mathematical methods of cost estimation, 127mathematically-based transfer prices, 302McGlade, D., 158Merchant, K.A., 7, 204, 209Minzberg, H., 171mission statement, 85missions, 85, 87, 88mix variances, 187–94mmO2, 158MVA (market value-added), 322–3
negotiated transfer prices, 302net present value (NPV), 264–6
advantages, 266disadvantages, 266discount rate, 267
new product technologies, 321non-discounting methods, 269non-financial project appraisal, 277non-manufacturing standard costing, 194–7normal profit, 23not-for-profit, 25NPV see net present value
objective function (linear programming), 232objectives, 85, 87, 88operational variances, 194opportunity costs, 30option budgets, 132organisational contexts of budgeting, 107Otley, D., 316, 230, 250Otley, D.T., 170, 171, 203, 206–7Otley, D. and Berry, A.J., 109, 112, 169, 207Ouchi, W.G., 157, 168–71outcomes, 313output/outcome issues, 313over absorption of overheads, 57over-costing, 63overhead, 26
absorption rates, 57allocation, 53analysis, 56apportionment, 53–9
criticisms of, 59–60reasons for, 58–8
budget, 101
INDEX 345
Coombs-Index.qxd 3/18/2005 1:10 PM Page 345

overhead, cont.over- and under-absorption, 57and production, 25, 53
Pass C.L. et al., 85payback period, 269
advantages, 269disadvantages, 269
Penguin English Dictionary, 85, 86performance goals, 319performance indicators for
continuous improvement, 324performance information, 308performance measurement, 296–314
general issues, 296non-financial aspects, 313people aspects, 298public sector, 314qualitative, 313
performance measures, 166PI for continuous improvement, 234pivot approach – sensitivity analysis, 276plans, 86–7planned programme budget
systems, 132planning and operational variances, 194planning process 89planning variances, 194Porter, M., 61power, 298–300
and ethics, 203and management control, 207
PPBS (planned programme budgetsystems), 132
present value, 293–4t, 264of annuity, 266
Preston, A., 157, 170–2price variance, 162pricing decisions, 247–9principal–agent theory, 202–3principal–agent model, 211 Proctor, R., 3, 4production
overhead, 25, 53volume ratio, 166
profit, 22–3profit–volume graph, 227project appraisal, 261–94
accounting rate of return, 270–2cash flows, 261–2 compounding, 263cost-benefit analysis, 278–9desiderata analysis, 277–8discounted cash flow, 254
project appraisal, cont.and inflation, 273–4internal rate of return, 267–8methods, 262net present value, 264–6non-financial aspects, 277sensitivity analysis, 274–6and taxation, 272
public sectorissues, 9performance measurement, 297–8, 314
pyramid of ratios, 309–13acid test ratio, 312asset turnover ratios, 310creditors’ turnover, 312debtors’ turnover, 312financing (gearing) ratio, 312fixed asset utilisation ratio, 311return on sales, 310stock turnover, 311working capital ratio, 312
qualitative performance measurement, 313
radical school, 11radicalism, 19rate variance, 162ratios, pyramid of, 309–13raw material stock turnover rate, 311real discount rate, 273reasons for apportionment, 58–9regression line, 129relevance lost school, 11, 18relevant costing, 30, 238–45
defined, 242and depreciation 244of materials, 243of salaries and wages, 243
relevant range, 28responsibility accounting, 26responsibility and power, 298–300return on investment, 309–10return on sales, 310Robson, J. and Cooper, D.J., 207–9Roget’s New Thesaurus, 85role, power and responsibility, 13Ronen, J. and Livingstone, J.L., 170Roslender, R., 6
sales budget, 98Samuels, J.M. et al., 90scope of management accounting, 7selling and distribution overhead, 26semi-fixed (stepped) costs, 28
346 INDEX
Coombs-Index.qxd 3/18/2005 1:10 PM Page 346

semi-variable costs, 28sensitivity analysis, 274–6
pivot approach, 276two-way analysis, 276tvalue of, 276
service costing, 35shadow prices, 235shareholder value analysis (SVA), 316–17shareholders, 309Shim, J.K. and Siegel, J.G., 87short-termism, avoidance of, 316Simons, R., 296, 297small firms and performance
information, 308Spicer, B.H., 251, 300standard costing, 156–60standard time, 158Stedry, R.C., 170stepped (semi-fixed) costs, 28Stern Stewart Corporation, 250stock turnover rates, 311strategy, 85, 88structural (contingent factors), 297summarising information, 150sunk costs, 29SVA (shareholder value analysis), 316–17Swieringa, R.J. and Waterhouse, J.H., 251
tactics, 86–8targets, 86–8target costing, 248target payback, 269taxable profit, 23taxation and project
appraisal, 272technological (contingent) factors, 297theory of constraints, 204time dimension of MA, 12time value of money, 263toll processing, 105total absorption costing, 52total asset turnover, 310total quality management (TQM), 139traditional school, 11transfer prices, 248transfer pricing, 299–308
bases, 301–2example, 303–6issues, 299–302in practice, 306–8
transfer pricing, cont.two-part tariff, 302two-way analysis, 276t
under-absorption of overheads, 57under-costing, 63unit cost statement, 31unit costs, 30–5Upchurch, A., 22usage variance, 162users of MA information, 9
variable costing, 68–71costs, 28overhead efficiency variance, 162, 163overhead expenditure variance, 162, 163overhead variances, 162, 163
variance analysis, 156, 160–6
direct material price variance, 161–2direct material usage variance, 162, 186direct material mix variance, 187–94direct material yield variance, 187–94direct labour wage rate variance, 162, 163direct labour efficiency variance, 162, 163fixed overhead expenditure variance, 162, 164fixed overhead volume variance, 162, 164planning and operational variances, 194variable overhead expenditure variance,
162, 163variable overhead efficiency variance, 162, 163
interpretation, 165–6investigation
statistics, 197–202tree, 198
probability tree, 199reconciliation statement, 165
wage rate variance, 162Walker, M. and Choudury, N., 170Watson, D.J. and Baumler, J.V., 251, 300what-if analysis, 274–6Wilson, R.M.S. and Wai, F.C., 4working capital ratio, 312
yield variances, 187–94
zero-based budgets, 131Zimmerman, J., 61
INDEX 347
Coombs-Index.qxd 3/18/2005 1:10 PM Page 347