managed futures / cta -...
TRANSCRIPT

Published March 2015
MANAGED FUTURES / CTAWhat a Difference a Year makes! - A Case Paper
Here we go again! CTAs have been declared dead before. This time, resurrection took a little longer than usual
The value of diversifying CTA portfoliosWhy picking a few household names may just not be enough to do the trick
The Lynx StorySvante Bergström, Lynx CEO and Co-founder talks about the early days
10 Fallacies to avoid when selecting CTAsDon´t be fooled by soft factors when selecting CTAs!
Kamran GhalitschiCEO / Publisher
Nordic Business Media ABBOX 7285SE-103 89 Stockholm, SwedenCorporate Number: 556838-6170VAT Number: SE-556838617001
Direct: +46 (0) 8 5333 8688Mobile: +46 (0) 706566688email: [email protected]
www.hedgenordic.com
Contact
“your single access point to the Nordic hedge fund industry”
H e d g e N o rd i c C TA I n d u s t r y R e p o r t | 3
Let us recap: From 2000 until 2008, Barclay Hedge CTA Index showed positive returns every single year, and in 2008 amidst the turbulence of the financial crisis registered the highest annual return since 1990. Since then however, the index had four negative years; three of which came back-to-back 2011 – 2013. To put this into perspective, in the entire 28 year period from 1980 until 2008 only three individual years showed negative returns. And never before were there even two back-to-back negative years. The largest yearly drawdown in these (nearly) three decades was -1,19% in 1999. What was most remarkable in this period however was not the depth of the drawdowns Managed Futures indices and / or individual trading programs suffered. It was the time off peak, the time the index needed to recover from the drawdown to achieve new highs that was unprecedented.
And then came 2014, and seemingly out of the blue with no apparent good reason, no equity market sell off and no Black Swan event, CTA´s were back like a knight in shining armor cutting through the darkness with the drawn sword, setting new all time highs.
At HedgeNordic we took this as a trigger to take a closer look at the Managed
Futures space, why the segment lagged performance for so long, what brought it back and what the lookout for systematic traders can be.
The approach we took was to ask those who should know the best, the managers, service providers, analyst and allocators to CTAs. Rather than through a journalistic filter we invited the contributors to this paper to share their views in their own words.
We are pleased and humbled so many actors in the space, from small Nordic
local managers to the oldest and largest in our region and some of the most recognized names in the industry. We believe to have a nice mix all across the CTA spectrum, from specialized, niche managers, broadly diversified trend followers, CTAs with a multi-strategy approach, single and multi managers, managers with a long bias or a system-atic macro approach represented in this paper.
Now granted, the end result of this paper is not an unbiased, deeply critical and analytical discussion about Managed Futures and related strategies, their possible merits and faults. Much rather our aim was to carry together some of the key arguments CTAs have always used to make their case, along with some food for thought in a comprehensive yet compact paper.
Enough said, enjoy the HedgeNordic CTA Report!
“Seemingly out of the blue with
no apparent good reason CTA´s
were back like a knight in shining
armor.”
Editor´s Note: Guess who´s back?Managed Futures for many investors only had some cameo appearances on the big screens until they had their first lead role in 2008, arriving to the rescue of financial-crisis struck portfolios like superheros. Ever since though, CTAs have struggled to find an environment to match historical returns. It seemed like the industry had met its Kryptonite in markets influenced and „manipulated“ by government and central bank interventions and politically influenced monetary and fiscal policies where volatility disappeared.
Kamran G. Ghalitschi CEO / Publisher HedgeNordic

4 | H e d g e N o rd i c C TA I n d u s t r y R e p o r t
Facts & Figures on Nordic CTAs
8,1%Performance for NHX CTA in 2014
33,5% Best performing Nordic CTA 2014
(SEB Asset Selection Opportunistic)
6 Billion USDLargest Nordic CTA by AuM (Lynx)
© 2015 Northern Trust Corporation. Head Office: 50 South La Salle Street, Chicago, Illinois 60603 U.S.A. Incorporated with limited liability in the U.S. Products and services provided by subsidiaries of Northern Trust Corporation may vary in different markets and are offered in accordance with local regulation. For legal and regulatory information about individual market offices, visit northerntrust.com/disclosures. Directed to professional clients only. Not intended for retail clients.
Alternative Fund Administration | Operations Outsourcing | Investor Services | Custody
Mäster Samuelsgatan 60, 8th Floor, 111 21 Stockholm, Sweden
Alpha. Operations can play that game, too.To compete in today’s market, you need to get operations in the game. Northern Trust Hedge Fund Services brings you Operational Alpha®: the competitive edge that comes from increased efficiency, transparency and control. Access, configure and manage data in real time, for faster and better decisions. Enhance performance through data consistency and seamless integration. And improve your advantage with constant support, insight and ideas from people as innovative as our leading-edge technology. Contact Madeleine Senior (EMEA) +44 (0)20 7982 2239 or Struan Malcolm (Stockholm) +46 8 5051 6492 or visit northerntrust.com/compete.
H e d g e N o rd i c C TA I n d u s t r y R e p o r t | 5
Editor´s Note: Guess who´s back? 3
Content 5
An overview of CTA industry benchmarks 6
Nordic CTAs stage massive comeback in 2014 8
Man AHL on the Nordics 11
Nominations: Best Nordic CTA 2014 12
Global CTA Asset Growth – Strong but Clustered 13
Turning Silver into Gold – the LYNX Story 14
Here we go again! 16
2015 is unlikely to be another 2009 19
Does CTA portfolio diversification provide value? 20
The Decade of CTAs 24
Navigating Risk Cycles 28
10 Fallacies to Avoid when Selecting CTAs 32
Managed Futures in an institutional investor’s portfolio 40
Trend followers in for the long run 42
A consistent approach to macro investing 44
Another Rough Year for Commodities 48
Are CTAs “Long Volatility”? 50
What I learnt from the Top Traders in the World 52
Content
© 2015 Northern Trust Corporation. Head Office: 50 South La Salle Street, Chicago, Illinois 60603 U.S.A. Incorporated with limited liability in the U.S. Products and services provided by subsidiaries of Northern Trust Corporation may vary in different markets and are offered in accordance with local regulation. For legal and regulatory information about individual market offices, visit northerntrust.com/disclosures. Directed to professional clients only. Not intended for retail clients.
Alternative Fund Administration | Operations Outsourcing | Investor Services | Custody
Mäster Samuelsgatan 60, 8th Floor, 111 21 Stockholm, Sweden
Alpha. Operations can play that game, too.To compete in today’s market, you need to get operations in the game. Northern Trust Hedge Fund Services brings you Operational Alpha®: the competitive edge that comes from increased efficiency, transparency and control. Access, configure and manage data in real time, for faster and better decisions. Enhance performance through data consistency and seamless integration. And improve your advantage with constant support, insight and ideas from people as innovative as our leading-edge technology. Contact Madeleine Senior (EMEA) +44 (0)20 7982 2239 or Struan Malcolm (Stockholm) +46 8 5051 6492 or visit northerntrust.com/compete.
6 | H e d g e N o rd i c C TA I n d u s t r y R e p o r t
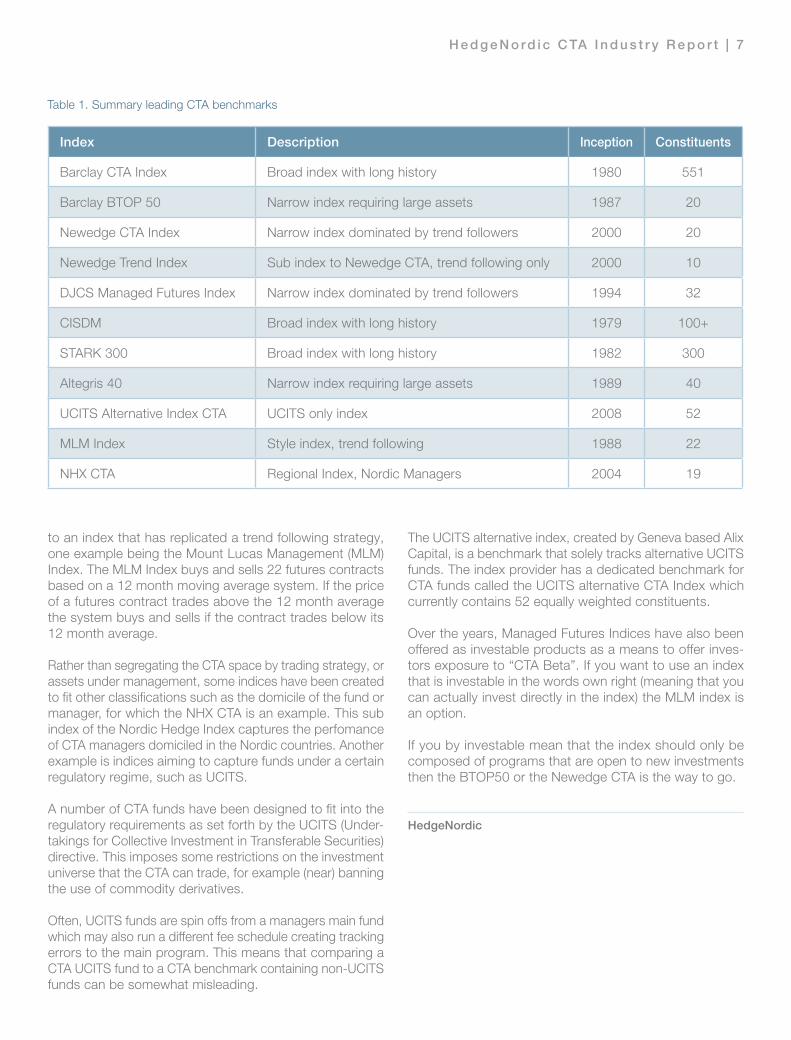
The indices most commonly referred to are the Barclay CTA Index, the Newedge CTA Index and the Dow Jones Credit Suisse DJCS Managed Futures Index (formerly known as the CS/Tremont Managed Futures Index). These indicies have different characteristics and depending on what you are comparing some are more representative than others.
The Barclay CTA Index is a broad index composed of more than 500 constituents. The index is not only broad in terms of the number of managers but also in terms of the amount of strategies included. This makes the index highly diversified and limits the performance impact of an individual manager.
A more concentrated version of the Barclay CTA Index is the Barclay BTOP50 Index which currently includes 20 names. This index represents those managers that hold the largest AuM and together account for at least 50% of the total capital invested in the Barclayhedge CTA universe. Among the Nordic Managers, Brummer & Partners Lynx and IPM Systematric Macro are included in the BTOP50 index.
The Newedge CTA Index is a narrow index composed of 20 trading programs. The index is primarily composed of larger names with a clear focus on trend following strate-gies. Brummer & Partners Lynx and SEB Asset Selection are both included in the index.
The DJCS Managed Futures Index is a narrow index currently composed of 31 constituents. The index is asset wieghted meaning that the larger trend following programs have a greater impact on the total performance. Brummer & Partners Lynx is one of the constituents.
The question if a leading benchmark index can give a fair and representative picture of your individual CTA invest-ment depends largely on how your CTA investment looks like. Typically a CTA investor has expsoure to only a limited number of the big trend following names in the industry, very often no more than one to three funds. In this case, the most suitable comparison would be to use some of the narrower indices focusing on trend following strategies, in other words the DJCS Managed Futures or the Newedge CTA.
In the case where the investor is running a portfolio with a larger set of strategies, the Barclay CTA or the Barclay BTOP50 is likely to be the better choice. Should you want to compare your investment to an index covering specific strategy groups, a “style index” might be the place to look.
When it comes to style indices, these come in different flavours. On the one hand you have sub-indices entirely composed of programs trading a specific strategy, one example being the Newedge Trend Index (trend following strategies only). Another option is make the comparison
Following the increased interest for CTA/Managed Futures strategies the supply of benchmark indices has grown rapidly. As an investor or potential investor in Managed Futures it is important to understand which index to use in order to give a fair comparison of your particular investment.
An overview of CTA industry benchmarks
H e d g e N o rd i c C TA I n d u s t r y R e p o r t | 7
to an index that has replicated a trend following strategy, one example being the Mount Lucas Management (MLM) Index. The MLM Index buys and sells 22 futures contracts based on a 12 month moving average system. If the price of a futures contract trades above the 12 month average the system buys and sells if the contract trades below its 12 month average.
Rather than segregating the CTA space by trading strategy, or assets under management, some indices have been created to fit other classifications such as the domicile of the fund or manager, for which the NHX CTA is an example. This sub index of the Nordic Hedge Index captures the perfomance of CTA managers domiciled in the Nordic countries. Another example is indices aiming to capture funds under a certain regulatory regime, such as UCITS. A number of CTA funds have been designed to fit into the regulatory requirements as set forth by the UCITS (Under-takings for Collective Investment in Transferable Securities) directive. This imposes some restrictions on the investment universe that the CTA can trade, for example (near) banning the use of commodity derivatives.
Often, UCITS funds are spin offs from a managers main fund which may also run a different fee schedule creating tracking errors to the main program. This means that comparing a CTA UCITS fund to a CTA benchmark containing non-UCITS funds can be somewhat misleading.
The UCITS alternative index, created by Geneva based Alix Capital, is a benchmark that solely tracks alternative UCITS funds. The index provider has a dedicated benchmark for CTA funds called the UCITS alternative CTA Index which currently contains 52 equally weighted constituents. Over the years, Managed Futures Indices have also been offered as investable products as a means to offer inves-tors exposure to “CTA Beta”. If you want to use an index that is investable in the words own right (meaning that you can actually invest directly in the index) the MLM index is an option.
If you by investable mean that the index should only be composed of programs that are open to new investments then the BTOP50 or the Newedge CTA is the way to go.
HedgeNordic
Table 1. Summary leading CTA benchmarks
Index Description Inception Constituents
Barclay CTA Index Broad index with long history 1980 551
Barclay BTOP 50 Narrow index requiring large assets 1987 20
Newedge CTA Index Narrow index dominated by trend followers 2000 20
Newedge Trend Index Sub index to Newedge CTA, trend following only 2000 10
DJCS Managed Futures Index Narrow index dominated by trend followers 1994 32
CISDM Broad index with long history 1979 100+
STARK 300 Broad index with long history 1982 300
Altegris 40 Narrow index requiring large assets 1989 40
UCITS Alternative Index CTA UCITS only index 2008 52
MLM Index Style index, trend following 1988 22
NHX CTA Regional Index, Nordic Managers 2004 19
8 | H e d g e N o rd i c C TA I n d u s t r y R e p o r t
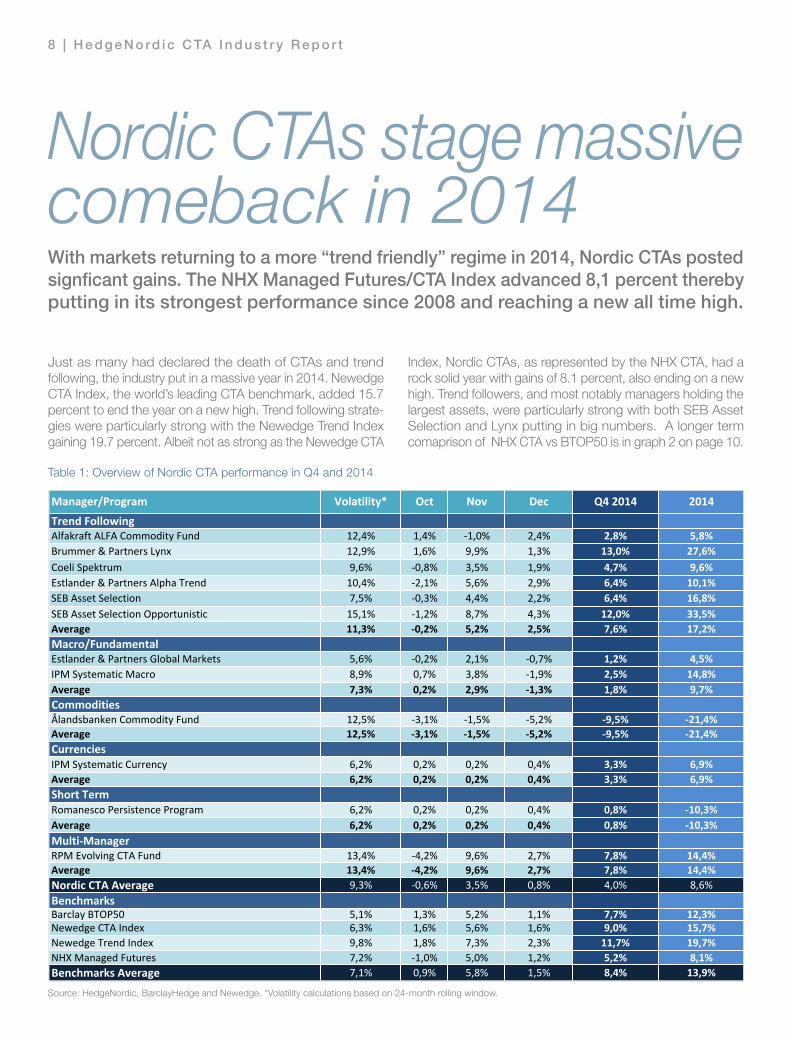
Just as many had declared the death of CTAs and trend following, the industry put in a massive year in 2014. Newedge CTA Index, the world’s leading CTA benchmark, added 15.7 percent to end the year on a new high. Trend following strate-gies were particularly strong with the Newedge Trend Index gaining 19.7 percent. Albeit not as strong as the Newedge CTA
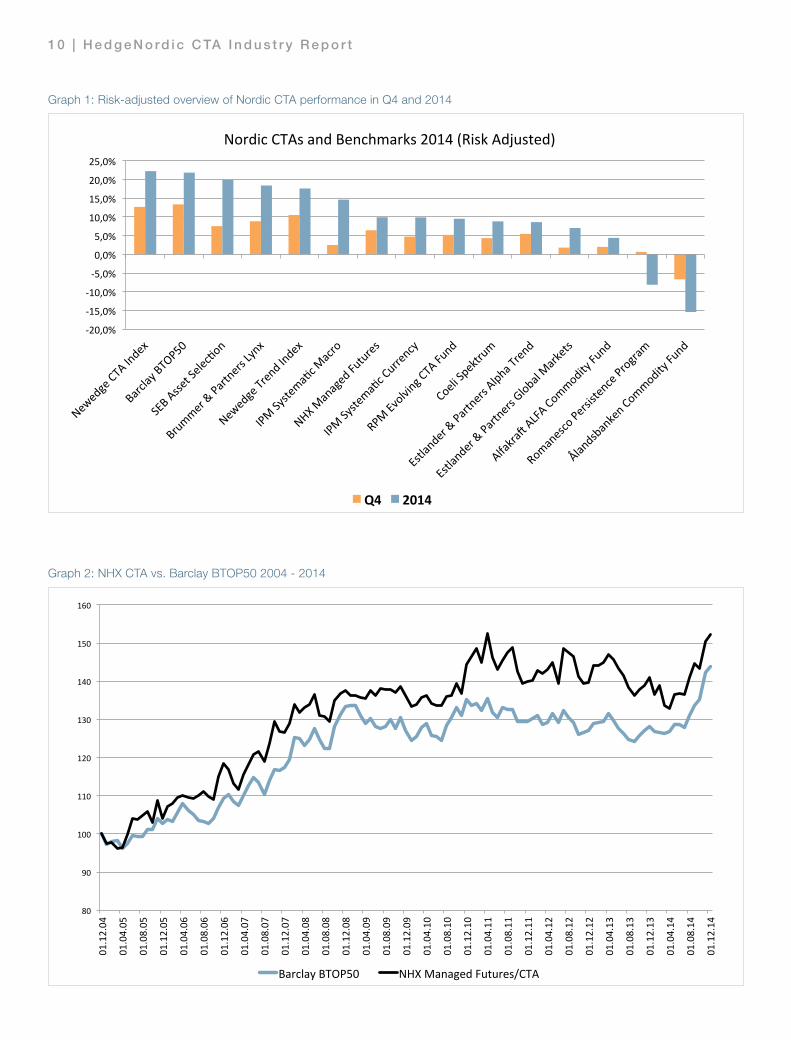
Index, Nordic CTAs, as represented by the NHX CTA, had a rock solid year with gains of 8.1 percent, also ending on a new high. Trend followers, and most notably managers holding the largest assets, were particularly strong with both SEB Asset Selection and Lynx putting in big numbers. A longer term comaprison of NHX CTA vs BTOP50 is in graph 2 on page 10.
Nordic CTAs stage massive comeback in 2014With markets returning to a more “trend friendly” regime in 2014, Nordic CTAs posted signficant gains. The NHX Managed Futures/CTA Index advanced 8,1 percent thereby putting in its strongest performance since 2008 and reaching a new all time high.
Manager/Program Volatility* Oct Nov Dec Q4 2014 2014Trend FollowingAlfakraft ALFA Commodity Fund 12,4% 1,4% -‐1,0% 2,4% 2,8% 5,8%Brummer & Partners Lynx 12,9% 1,6% 9,9% 1,3% 13,0% 27,6%Coeli Spektrum 9,6% -‐0,8% 3,5% 1,9% 4,7% 9,6%Estlander & Partners Alpha Trend 10,4% -‐2,1% 5,6% 2,9% 6,4% 10,1%SEB Asset Selection 7,5% -‐0,3% 4,4% 2,2% 6,4% 16,8%SEB Asset Selection Opportunistic 15,1% -‐1,2% 8,7% 4,3% 12,0% 33,5%Average 11,3% -‐0,2% 5,2% 2,5% 7,6% 17,2%Macro/FundamentalEstlander & Partners Global Markets 5,6% -‐0,2% 2,1% -‐0,7% 1,2% 4,5%IPM Systematic Macro 8,9% 0,7% 3,8% -‐1,9% 2,5% 14,8%Average 7,3% 0,2% 2,9% -‐1,3% 1,8% 9,7%CommoditiesÅlandsbanken Commodity Fund 12,5% -‐3,1% -‐1,5% -‐5,2% -‐9,5% -‐21,4%Average 12,5% -‐3,1% -‐1,5% -‐5,2% -‐9,5% -‐21,4%CurrenciesIPM Systematic Currency 6,2% 0,2% 0,2% 0,4% 3,3% 6,9%Average 6,2% 0,2% 0,2% 0,4% 3,3% 6,9%Short TermRomanesco Persistence Program 6,2% 0,2% 0,2% 0,4% 0,8% -‐10,3%Average 6,2% 0,2% 0,2% 0,4% 0,8% -‐10,3%Multi-‐ManagerRPM Evolving CTA Fund 13,4% -‐4,2% 9,6% 2,7% 7,8% 14,4%Average 13,4% -‐4,2% 9,6% 2,7% 7,8% 14,4%Nordic CTA Average 9,3% -‐0,6% 3,5% 0,8% 4,0% 8,6%BenchmarksBarclay BTOP50 5,1% 1,3% 5,2% 1,1% 7,7% 12,3%Newedge CTA Index 6,3% 1,6% 5,6% 1,6% 9,0% 15,7%Newedge Trend Index 9,8% 1,8% 7,3% 2,3% 11,7% 19,7%NHX Managed Futures 7,2% -‐1,0% 5,0% 1,2% 5,2% 8,1%Benchmarks Average 7,1% 0,9% 5,8% 1,5% 8,4% 13,9%
Table 1: Overview of Nordic CTA performance in Q4 and 2014
Source: HedgeNordic, BarclayHedge and Newedge. *Volatility calculations based on 24-month rolling window.

H e d g e N o rd i c C TA I n d u s t r y R e p o r t | 9
Manager/Program Volatility* Oct Nov Dec Q4 2014 2014Trend FollowingAlfakraft ALFA Commodity Fund 9,3% 1,0% -‐0,7% 1,8% 2,1% 4,6%Brummer & Partners Lynx 9,3% 1,1% 7,1% 0,9% 9,3% 19,5%Coeli Spektrum 9,3% -‐0,7% 3,4% 1,9% 4,6% 9,3%Estlander & Partners Alpha Trend 9,3% -‐1,8% 5,0% 2,6% 5,8% 9,1%SEB Asset Selection 9,3% -‐0,4% 5,5% 2,7% 7,9% 21,1%SEB Asset Selection Opportunistic 9,3% -‐0,8% 5,4% 2,6% 7,3% 19,8%Average 9,3% -‐0,3% 4,3% 2,1% 6,2% 13,9%Macro/FundamentalEstlander & Partners Global Markets 9,3% -‐0,4% 3,4% -‐1,1% 1,9% 7,4%IPM Systematic Macro 9,3% 0,7% 4,0% -‐2,0% 2,6% 15,4%Average 9,3% 0,2% 3,7% -‐1,5% 2,2% 11,4%CommoditiesÅlandsbanken Commodity Fund 9,3% -‐2,3% -‐1,1% -‐3,8% -‐7,0% -‐16,2%Average 9,3% -‐2,3% -‐1,1% -‐3,8% -‐7,0% -‐16,2%CurrenciesIPM Systematic Currency 9,3% 1,6% 3,3% 0,1% 5,0% 10,4%Average 9,3% 1,6% 3,3% 0,1% 5,0% 10,4%Short TermRomanesco Persistence Program 9,3% 0,2% 0,1% 0,4% 0,7% -‐8,6%Average 9,3% 0,2% 0,1% 0,4% 0,7% -‐8,6%Multi-‐ManagerRPM Evolving CTA Fund 9,3% -‐2,9% 6,6% 1,9% 5,5% 10,0%Average 9,3% -‐2,9% 6,6% 1,9% 5,5% 10,0%Nordic CTA Average 9,3% -‐0,4% 3,5% 0,7% 3,8% 8,5%BenchmarksBarclay BTOP50 9,3% 2,3% 9,4% 1,9% 14,1% 23,1%Newedge CTA Index 9,3% 2,4% 8,2% 2,3% 13,4% 23,5%Newedge Trend Index 9,3% 1,7% 6,9% 2,2% 11,1% 18,6%NHX Managed Futures 9,3% -‐1,3% 6,5% 1,5% 6,8% 10,4%Benchmarks Average 9,3% 1,3% 7,8% 1,1% 11,3% 18,9%
Table 2: Risk-adjusted overview of Nordic CTA performance in Q4 and 2014
Looking at an overview of the Nordic CTA universe (table 1) reveals that the year was very much dominated by trend following strategies, while commodity and short-term strate-gies faced more difficult trading conditions.
In the case of commodities, the massive drop in crude oil was perhaps the best trading theme for many trend followers in 2014 while Ålandsbanken Commodity, being long biased, naturally faced a very challenging environment. In the short-term space, Romanesco suffered a blow as their Persistence Program lost over 10 percent on the year following a bad start as volatility during the first half of the year continued to be highly suppressed offering few breakout opportunities.
A risk-adjusted ranking (all programs set to 8.8 percent annualised volatility) for the Nordic CTA managers (table 2) reveals that both SEB Asset Selection and Brummer Lynx performed very well against their peers as represented by the Newedge Trend Index, the Newedge CTA Index and the Barclay BTOP50 Index. Even the trend following subset of the Nordic CTA space had a solid year with an average gain
of 12 percent. However, the NHX Managed Futures Index was lagging the Newedge CTA and Barclay BTOP50 indices, mainly due to the impact of the negative performance of a few selected names.
The complete ranking of Nordic CTA managers risk-adjusted returns in 2014 against benchmarks is to be found in graph 1.
Looking forward, CTAs now appear more interesting than they have been for the last five years, the reason being that market conditions have improved. Increased market trendiness and a pick-up in volatility are both factors that is likely to weigh positively into the opportunity set for CTAs going forward.
With a potential rebound in equity markets lurking around the corner, a strategic allocation to Managed Futures is likely to be one of the best places to hide when things get rough.
HedgeNordic
Source: Own calculation based on data from HedgeNordic, BarclayHedge and Newedge. *All trading programs adjusted to same volatility as the average for Nordic CTAs during the last 24 months (8.8%).
1 0 | H e d g e N o rd i c C TA I n d u s t r y R e p o r t
-‐20,0%
-‐15,0%
-‐10,0%
-‐5,0%
0,0%
5,0%
10,0%
15,0%
20,0%
25,0%
Nordic CTAs and Benchmarks 2014 (Risk Adjusted)
Q4 2014
Graph 1: Risk-adjusted overview of Nordic CTA performance in Q4 and 2014
80
90
100
110
120
130
140
150
160
01.12.04
01.04.05
01.08.05
01.12.05
01.04.06
01.08.06
01.12.06
01.04.07
01.08.07
01.12.07
01.04.08
01.08.08
01.12.08
01.04.09
01.08.09
01.12.09
01.04.10
01.08.10
01.12.10
01.04.11
01.08.11
01.12.11
01.04.12
01.08.12
01.12.12
01.04.13
01.08.13
01.12.13
01.04.14
01.08.14
01.12.14
Barclay BTOP50 NHX Managed Futures/CTA
Graph 2: NHX CTA vs. Barclay BTOP50 2004 - 2014
H e d g e N o rd i c C TA I n d u s t r y R e p o r t | 1 1
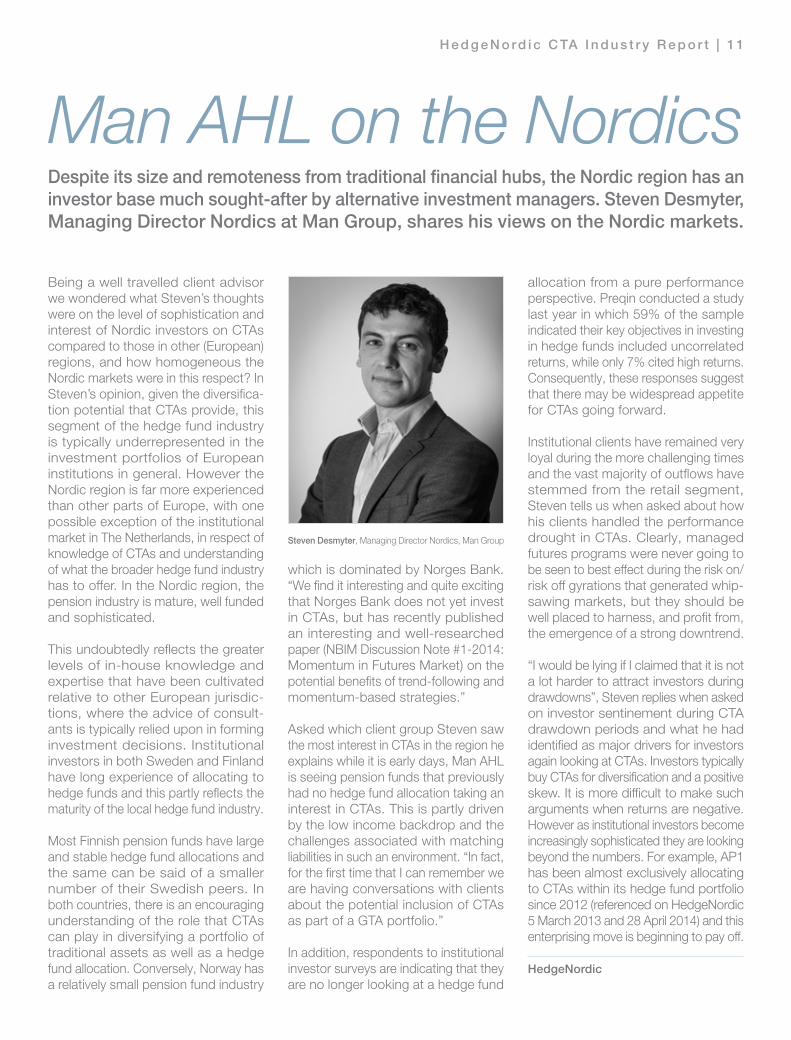
Man AHL on the NordicsDespite its size and remoteness from traditional financial hubs, the Nordic region has an investor base much sought-after by alternative investment managers. Steven Desmyter, Managing Director Nordics at Man Group, shares his views on the Nordic markets.
Being a well travelled client advisor we wondered what Steven’s thoughts were on the level of sophistication and interest of Nordic investors on CTAs compared to those in other (European) regions, and how homogeneous the Nordic markets were in this respect? In Steven’s opinion, given the diversifica-tion potential that CTAs provide, this segment of the hedge fund industry is typically underrepresented in the investment portfolios of European institutions in general. However the Nordic region is far more experienced than other parts of Europe, with one possible exception of the institutional market in The Netherlands, in respect of knowledge of CTAs and understanding of what the broader hedge fund industry has to offer. In the Nordic region, the pension industry is mature, well funded and sophisticated.
This undoubtedly reflects the greater levels of in-house knowledge and expertise that have been cultivated relative to other European jurisdic-tions, where the advice of consult-ants is typically relied upon in forming investment decisions. Institutional investors in both Sweden and Finland have long experience of allocating to hedge funds and this partly reflects the maturity of the local hedge fund industry.
Most Finnish pension funds have large and stable hedge fund allocations and the same can be said of a smaller number of their Swedish peers. In both countries, there is an encouraging understanding of the role that CTAs can play in diversifying a portfolio of traditional assets as well as a hedge fund allocation. Conversely, Norway has a relatively small pension fund industry
which is dominated by Norges Bank. “We find it interesting and quite exciting that Norges Bank does not yet invest in CTAs, but has recently published an interesting and well-researched paper (NBIM Discussion Note #1-2014: Momentum in Futures Market) on the potential benefits of trend-following and momentum-based strategies.”
Asked which client group Steven saw the most interest in CTAs in the region he explains while it is early days, Man AHL is seeing pension funds that previously had no hedge fund allocation taking an interest in CTAs. This is partly driven by the low income backdrop and the challenges associated with matching liabilities in such an environment. “In fact, for the first time that I can remember we are having conversations with clients about the potential inclusion of CTAs as part of a GTA portfolio.”
In addition, respondents to institutional investor surveys are indicating that they are no longer looking at a hedge fund
allocation from a pure performance perspective. Preqin conducted a study last year in which 59% of the sample indicated their key objectives in investing in hedge funds included uncorrelated returns, while only 7% cited high returns. Consequently, these responses suggest that there may be widespread appetite for CTAs going forward.
Institutional clients have remained very loyal during the more challenging times and the vast majority of outflows have stemmed from the retail segment, Steven tells us when asked about how his clients handled the performance drought in CTAs. Clearly, managed futures programs were never going to be seen to best effect during the risk on/risk off gyrations that generated whip-sawing markets, but they should be well placed to harness, and profit from, the emergence of a strong downtrend.
“I would be lying if I claimed that it is not a lot harder to attract investors during drawdowns”, Steven replies when asked on investor sentinement during CTA drawdown periods and what he had identified as major drivers for investors again looking at CTAs. Investors typically buy CTAs for diversification and a positive skew. It is more difficult to make such arguments when returns are negative. However as institutional investors become increasingly sophisticated they are looking beyond the numbers. For example, AP1 has been almost exclusively allocating to CTAs within its hedge fund portfolio since 2012 (referenced on HedgeNordic 5 March 2013 and 28 April 2014) and this enterprising move is beginning to pay off.
HedgeNordic
Steven Desmyter, Managing Director Nordics, Man Group

1 2 | H e d g e N o rd i c C TA I n d u s t r y R e p o r t
Nominations to the Nordic Hedge Award are a result of normalized, weighted data drawn from the HedgeNordic database and are based on absolute and relative performance, Sharpe Ratio, consistency of returns and long and short term annualized performance, expressed in a point scoring model. The model for determining short listed funds was co-developed by Nordic Business Media AB as organizer of the Nordic Hedge Award and a PhD student assigned to the project by Stockholm School of Economics. The model was fine tuned and coded by three students of Royal Institute of Technology, Stockholm (KTH) for the 2014 Nordic Hedge Award. Following the quantitative shortlisting of the five nominated funds, a jury of industry professionals will assign points to the individual funds. The quantative and qualitative scores will be added up to determine the winners and runners up. Winning managers will be distinguished at the final event oft he Nordic Hedge Award on April 22 in Stockholm.
Nominated in the category „Best Nordic CTA 2014“ are the following funds. (listed in random order)
Lynx (Sweden) Lynx Asset Management (SWE)
SEB Asset Selection Opportunistic SEB (SWE)
IPM Systematic Macro Informed Portfolio Management (SWE)
Spektrum Coeli Asset Management (SWE)
RPM Evolving CTA Fund Risk & Portfolio Management (SWE)
Nominations: Best Nordic CTA 2014
supported by:
HedgeNordic congratulates the nominated funds and managers!

H e d g e N o rd i c C TA I n d u s t r y R e p o r t | 1 3
Following an increased interest from institutional investors searching for tail risk protection, CTAs have seen a steady asset growth over the last 10 years. Managing a combined 132 billion USD in 2004, this number today stands at 313 billion USD according to data from BarclayHedge. This means that CTAs /Managed Futures is the second largest Hedge Fund strategy in the world (only fixed income strategies hold more money), managing over 10 percent of total industry assets.
However, when taking a closer look at this number, the asset growth is clearly inflated by inflows to a select number of high profile names, most notably US based Bridgewater (the world’s largest hedge fund by many seen as a non managed futures program) and UK based Winton Capital.
Out of the 180 billion USD thrown at CTAs since 2004, 72 billion USD can be explained by inflows to Bridgewater and Winton alone. Bridgewater and Winton today represent more than 50 percent of the Managed Futures AuM with Bridgewater standing at 125 billion USD and Winton at 25 billion USD.
The Nordic CTA industry is by comparison relatively small, the exception being Brummer & Partners Lynx qualifying as one of the 20 largest indvidual programs with approximately 6 billion USD in assets. According to the HedgeNordic database, the combined assets of Nordic CTAs is 8,5 billion USD which translates into 2 percent of total industry assets.
There is a dispute among industry practitioners and inves-tors whether the concentration of asset is having a negative impact on the return profile of those attracting the lions share of the assets. So far there is no clear evidence to suggest that large names systematically underperform smaller ones. As an investor in CTA strategies it is however of great importance to keep an eye on tracking errors of the bigger names as large assets tend to drive them into more liquid markets and make them tweak the system to trade less frequently, thereby potentially miss out on short term opportunities.
HedgeNordic
Global CTA Asset Growth – Strong but ClusteredUndeterred by a 5 percent drop in AuM in 2014, CTAs have seen assets under management increase by a whopping 137 percent over the last 10 years. Today, CTAs/Managed Futures is the second largest hedge fund sub-strategy. However most of the growth is explained by the surging assets of a few selected names.
0
50.000.000.000
100.000.000.000
150.000.000.000
200.000.000.000
250.000.000.000
300.000.000.000
350.000.000.000
2004 2005 2006 2007 2008 2009 2010 2011 2012 2013 2014
CTA AuM
BW & Winton
Global CTA AuM vs Bridgewater and Winton AuM
1 4 | H e d g e N o rd i c C TA I n d u s t r y R e p o r t
Svante Bergström, Martin Sandquist and Jonas Bengtsson met while working for the proprietary trading unit at Nordbanken in the 1990s. What brought them together was a joint interest in analysing financial data in a structured, systematic manner in order to find trading strategies that generated consistent returns over time. Svante had a stock broker background having spent his career doing arbitrage trading between invest-ment companies and their underlying holdings. Jonas and Martin were analysts, both with a highly quantitative skill-set.
“We started to number crunch data and to look for patterns in financial data and build models around different phenomenon that we saw. Quite quickly we found that trend following models were superior to other strategies. But we also found that all trend following models were highly correlated so we wanted to find models that could supply a different return stream. Models using inter market relationships was something we discovered worked well and also contrarian models, making money when markets were not trending, also added a lot of value from a portfolio construction perspecive” Svante says.
Being part of a proprietary trading group that was evaluated on short-term profits rather than longer term goals was somewhat problematic for the kind of strategy the team had built. According to Svante this was what started the discussion to spin out the model framework to a separate business.
“As a systematic trend follower you need to have room for difficult periods over 6 to 12 months so we found that this concept was probably better in a hedge fund setup. Luckily enough, when we talked to the bank about setting up a hedge fund internally they said it was too early for them. There were no hedge fund teams in Swedish banks back then. We were free to leave and set up our own business instead.” The transition took place in 1999 when Silver Kapitalförvaltning,
a fund management company later renamed Lynx Asset Management, was set up. Svante remembers the time to be challenging with long working hours and no paychecks. Gathering assets also proved much harder than anticipated.
“In the beginning it was just the three of us doing everything ourselves. We took a big risk because we could not take any salaries. We had small costs but the fund was tiny,maybe half a million dollars at the time. We had to make sure that we did not spend money on things we didn’t need”.
“Our view on asset raising was quite naïve back then. The business plan was all set up around delivering performance and developing stable systems. We believed if we could deliver that investors would find us, come knocking at our door wanting to invest in this fabulous fund. Well, that was not the case”, Svante says with a smile. “Over time we learned that institutions do not invest in funds only for the sake of the track record, they need the infrastructure as well”.
In 2001-2002 after having turned down other offers to join forces with larger, more traditional asset managers, Lynx was approached by Brummer & Partners. At Brummer they had just started broadening their offering and needed more strategies in order to create a multi-strategy fund. Lynx was believed to be an interesting building block. Brummer & Partners then was probably stryk “at“ the 1 billion Dollar AuM mark and by no means the well-recognized, global player it is today. The manager, though, seemed to have similar visions, and made the right offer.
“The Brummer set-up was much more attractive to us than previous offers. They presented a solution where we would keep the majority of the shares in the company, rather than being employees of a larger organization.” Svante remembers. “Brummer let us build Lynx Asset Management in our own way, but with the support of their infrastructure. Lynx today is
Turning Silver into Gold – the LYNX StoryIn 1999, three guys from Sweden left their prop trading desk at Nordbanken to set up a hedge fund management company; Silver Kapitalförvaltning AB. The ambition was to raise 100 million SEK for a systematic trend following strategy. Little did they know, that they had laid the foundation for what is today one of the world´s most successful and respected CTAs, managing more than six billion USD.
H e d g e N o rd i c C TA I n d u s t r y R e p o r t | 1 5
very different from other Brummer funds in a number of ways (more international clients, managed accounts and multiple funds, high transparency for our clients etc).” After having joined forces with Brummer, Lynx grew the team and assets under management quickly. In order to continue building the strategy and to make sure execution was handled in the most efficient way possible, the company hired new research people and additional programmers.
“The investment process has developed over time but we have stayed close to our roots in terms of what we want to deliver; a multi-strategy CTA type of return with trend following at the core complemented with contrarian and inter market models. I think that is the reason why we have outperformed over the years. The three models combined make a diversified portfolio in a smart way. It has allowed us to reduce drawdowns in difficult periods compared to the average CTA while keeping the upside in more opportune markets”, Svante says.
When Lynx first started they were actually unaware of the fact that there was a whole industry out there offering CTA strategies as fund vehicles. It was only later that the team became aware of this fact and started benchmarking themselves more actively.
“One way we discovered there were others out there doing what we did was that we found ready made models for sale where you could buy the code. We bought quite a number of these, simply for benchmarking, not for implementation purposes. Later we realised that there were companies offering fund vehicles around CTA strategies. Graham was one of the companies we admired back then but we also tracked other big names like Aspect, AHL, Transtrend and Winton.”
“When we realized there was a whole industry doing what we did it was comforting not to be the only beast of our species. When talking to institutions in Sweden, who were generally a bit sceptical about the concept of systematic, automated trading, we were able to refer to other guys out there doing similar things, showcasing the concept. Lynx was not inventing the wheel.”
With the benefit of hindsight, Svante sees some major milestones explaining the success of Lynx Asset Management, at the same time he recognizes that it has become harder to set up an institutional asset management company today.
“Leaving the bank and setting up the fund on our own was the first milestone of course. A difficult and very risky decision at the time! An obvious milestone was teaming up with Brummer & Partners and to joining the group in 2002. Starting the offshore fund in 2004 was another critical success factor which made us start talking to international clients. The opening of our office last year in New York that services our large US investor base is another stepstone that falls in line with this.”.
To do the same transition as Lynx did 15 years ago is more difficult today according to Svante.
“It is much tougher nowadays for different reasons. One is that the CTA industry is very competitive; emerging managers have to fight for investments against others like Lynx that have big research teams and organizations behind them that can supply what institutions need. Secondly you have all the regulations which have increased the costs to start a company and become a huge hurdle to entry.”
Svante continues, “The shift in the investor base is another factor playing into the difficulties of setting up a small hedge fund shop today. When we started there were more private investors, some high net worth and a few smaller institutions. If you look at the investor base today, the large pension plans are a major investor in hedge funds and CTAs. When they write tickets they write big ones, but they want a lot that a small hedge fund shop simply can’t offer. It took us 2-3 years to build our company. Today I would say the same thing requires 5-7 years.
Currently Lynx has over 50 people employed and manages over six billion Dollars. The crucial factor to remain in the forefront of the CTA universe according to Svante is to keep developing the system and to hold onto and add more smart people to the team.
“Since 2004, we have continuously expanded the research team which has added tremendously to overperformance over time. One of the most crucial milestones since we set up the company was in 2011, when we started making senior employees partners. That has helped us to hold onto smart people, create stability and insure Lynx will live on after Svante Bergström.”
HedgeNordic
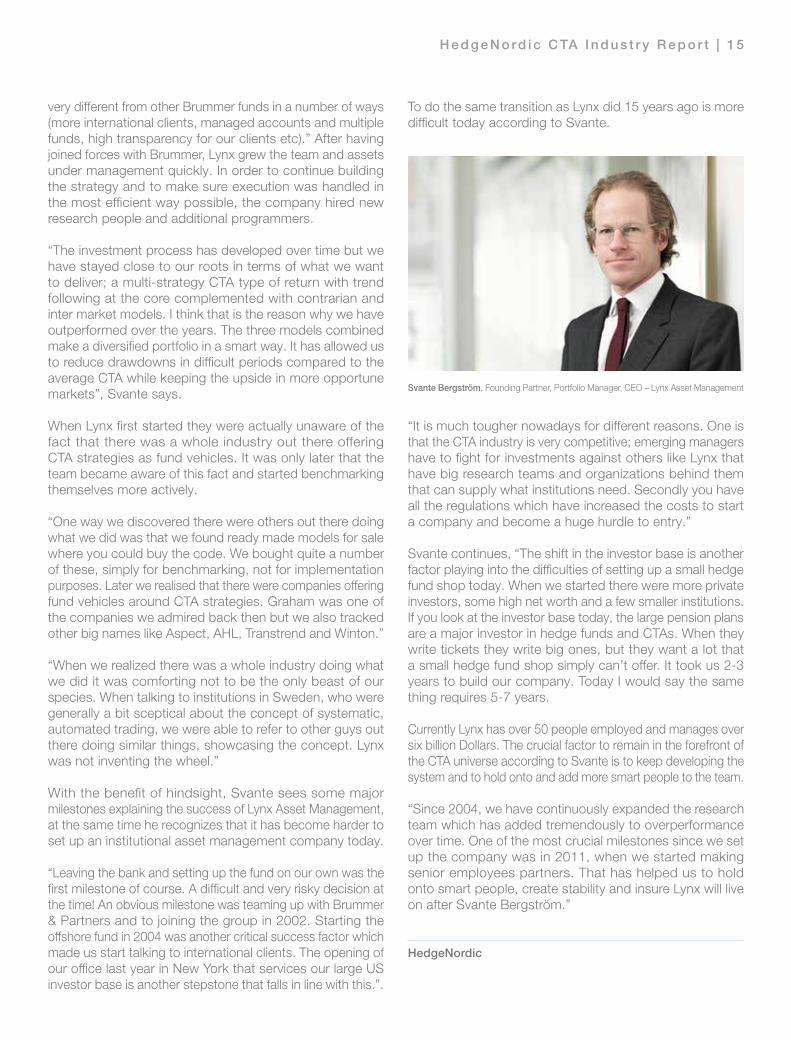
Svante Bergström, Founding Partner, Portfolio Manager, CEO – Lynx Asset Management
1 6 | H e d g e N o rd i c C TA I n d u s t r y R e p o r t
price goes up, CTAs buy. If it goes down, CTAs sells short. If the price goes against a CTA’s position, it is reduced, closed or reversed. Obviously, the divergent investor would profit when the coin toss gives several tails in a row. This is, on average and figuratively speaking, what happened in 2014 and what didn’t happen in 2011-2013. Another word for this is auto-correlation. High is good, low is bad.
Implications of systematic,
technical trading
Most CTAs are systematic. They develop and run computer algorithms for generating investment decisions. Most of them are also technical, using prices as the primary input. Industry performance may therefore – at least in the short to medium term - be viewed as a reflection of market behavior. This implies that – at any given point in time – it is meaningless to think of the CTA industry in terms of “good” or “bad”. A more meaningful attitude would be to gain an understanding of why markets sometimes seem to behave in ways that are beneficial to CTAs and sometimes not.
Here we go again!Industry old-timers are resilient. Managed Futures have been declared dead before. But this time around, resurrection took a little longer than usual. QE, market inter-ventions and zero-interest rates didn’t exactly help.
The narrative is classic: Looking good – really good (2008); doing alright, everything is under control (2009-2010); oops, a negative year, some negative media reports, investors are still cool (2011), another negative one, not good, net outflows, more negative media (2012); at last a weakly positive year, nobody notices, redemptions grow, CTAs declared dead (late 2013) and then, suddenly, CTAs on new highs (2014).
We have seen and lived through it before.Fittingly, perfor-mance picked up speed around Ascension Day in May. A setback in late July, early August reversed quickly. Hedge funds, equities, bonds were left behind. Late January 2015, Newedge CTA Index was up 20+% over 12 months. Best excess return year in this millennium. Some people seem surprised. Others seem confused. CTAs do not fit in the usual investment heuristics. Sometimes they correlate, sometimes they do not. This feature seem to polarize people – some love CTAs, others certainly do not. In terms of attitudes, CTAs seem to generate what they thrive on: fat tails. So here is a perspective on CTAs that may shed some light on the issue.
Convergent vs. divergent investing
Here is litmus test for you. A coin is tossed: tails. You are asked to bet on the next toss, heads or tails? Chances are you bet on heads. Most people do. Chances are also that you are not particularly fond of CTAs as an investment and that you are a conver-gent investor – like most people.The convergent investor has an explicit or implicit idea of whether an asset is cheap or expensive. If it is considered as cheap, we buy and vice versa. We relate the price to a perceived “correct” value. So, you bet on heads because you know that over the long run, heads and tails will even out.
The archetypical, trend-following CTA is divergent. The CTA would bet on tails, hoping for a trend. Prices are not related to what they “should” be. If a
0,8
0,9
1
1,1
1,2
1,3
12 month autocorrela4on, LHS
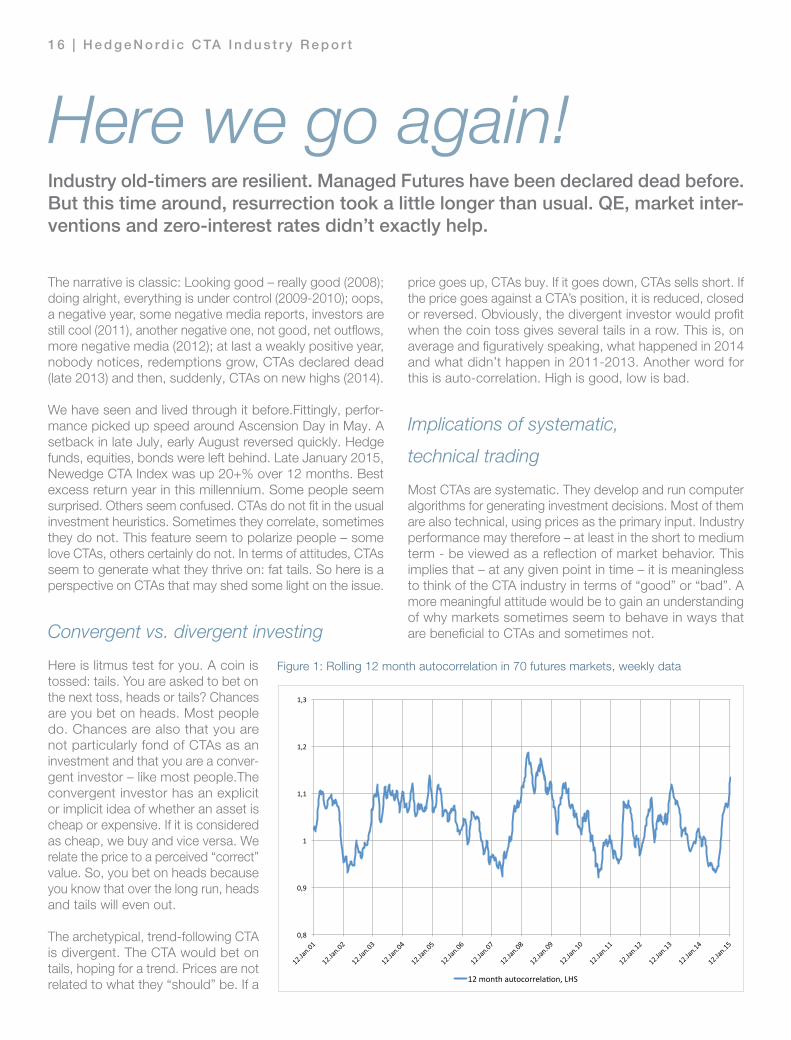
Figure 1: Rolling 12 month autocorrelation in 70 futures markets, weekly data
H e d g e N o rd i c C TA I n d u s t r y R e p o r t | 1 7
is noticeable, as is the choppiness in the preceding years.
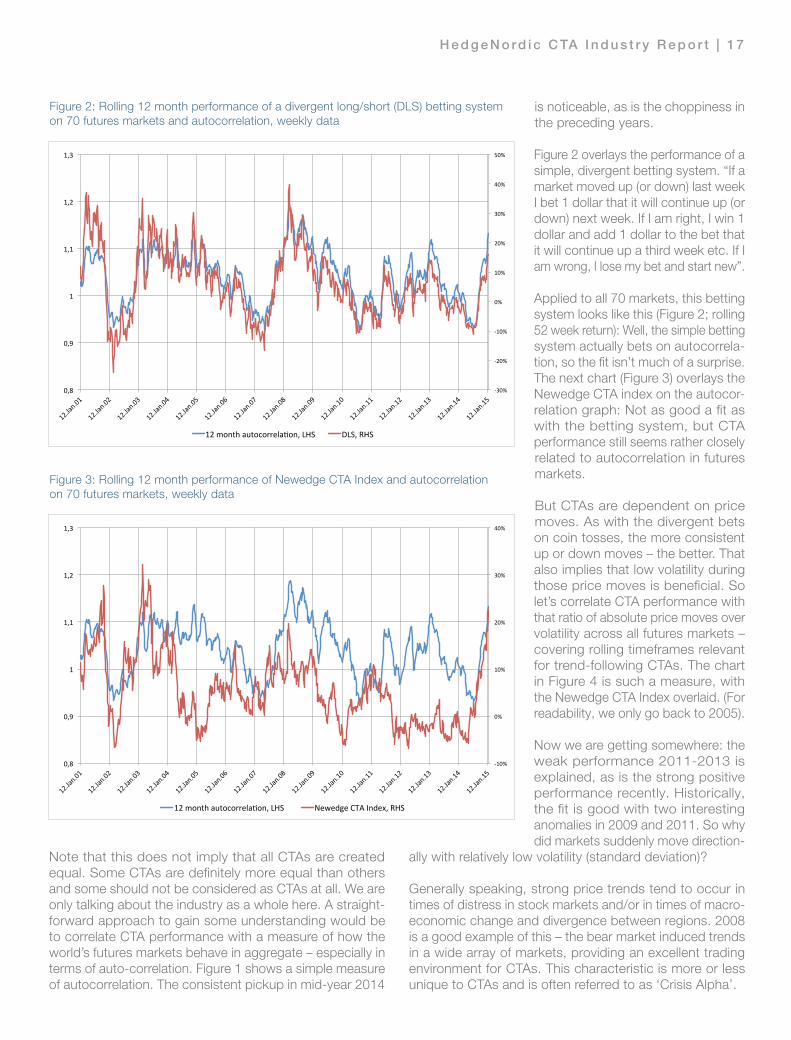
Figure 2 overlays the performance of a simple, divergent betting system. “If a market moved up (or down) last week I bet 1 dollar that it will continue up (or down) next week. If I am right, I win 1 dollar and add 1 dollar to the bet that it will continue up a third week etc. If I am wrong, I lose my bet and start new”.
Applied to all 70 markets, this betting system looks like this (Figure 2; rolling 52 week return): Well, the simple betting system actually bets on autocorrela-tion, so the fit isn’t much of a surprise. The next chart (Figure 3) overlays the Newedge CTA index on the autocor-relation graph: Not as good a fit as with the betting system, but CTA performance still seems rather closely related to autocorrelation in futures markets.
But CTAs are dependent on price moves. As with the divergent bets on coin tosses, the more consistent up or down moves – the better. That also implies that low volatility during those price moves is beneficial. So let’s correlate CTA performance with that ratio of absolute price moves over volatility across all futures markets – covering rolling timeframes relevant for trend-following CTAs. The chart in Figure 4 is such a measure, with the Newedge CTA Index overlaid. (For readability, we only go back to 2005).
Now we are getting somewhere: the weak performance 2011-2013 is explained, as is the strong positive performance recently. Historically, the fit is good with two interesting anomalies in 2009 and 2011. So why did markets suddenly move direction-
ally with relatively low volatility (standard deviation)?
Generally speaking, strong price trends tend to occur in times of distress in stock markets and/or in times of macro-economic change and divergence between regions. 2008 is a good example of this – the bear market induced trends in a wide array of markets, providing an excellent trading environment for CTAs. This characteristic is more or less unique to CTAs and is often referred to as ‘Crisis Alpha’.
Note that this does not imply that all CTAs are created equal. Some CTAs are definitely more equal than others and some should not be considered as CTAs at all. We are only talking about the industry as a whole here. A straight-forward approach to gain some understanding would be to correlate CTA performance with a measure of how the world’s futures markets behave in aggregate – especially in terms of auto-correlation. Figure 1 shows a simple measure of autocorrelation. The consistent pickup in mid-year 2014
-‐30%
-‐20%
-‐10%
0%
10%
20%
30%
40%
50%
0,8
0,9
1
1,1
1,2
1,3
12 month autocorrela8on, LHS DLS, RHS
Figure 2: Rolling 12 month performance of a divergent long/short (DLS) betting system on 70 futures markets and autocorrelation, weekly data
-‐10%
0%
10%
20%
30%
40%
0,8
0,9
1
1,1
1,2
1,3
12 month autocorrela7on, LHS Newedge CTA Index, RHS
Figure 3: Rolling 12 month performance of Newedge CTA Index and autocorrelation on 70 futures markets, weekly data
1 8 | H e d g e N o rd i c C TA I n d u s t r y R e p o r t
Managed Futures and Systematic Strategies
CTAs and the value of portfolio diversification
To receive a copy of the report please contact Adam Van de Velde: email: [email protected]
HedgeFund Intelligence has published a major special report looking at the dramatic recovery in CTA performance and the
outlook for quantitative trading strategies in a challenging and increasingly volatile macro and market environment.
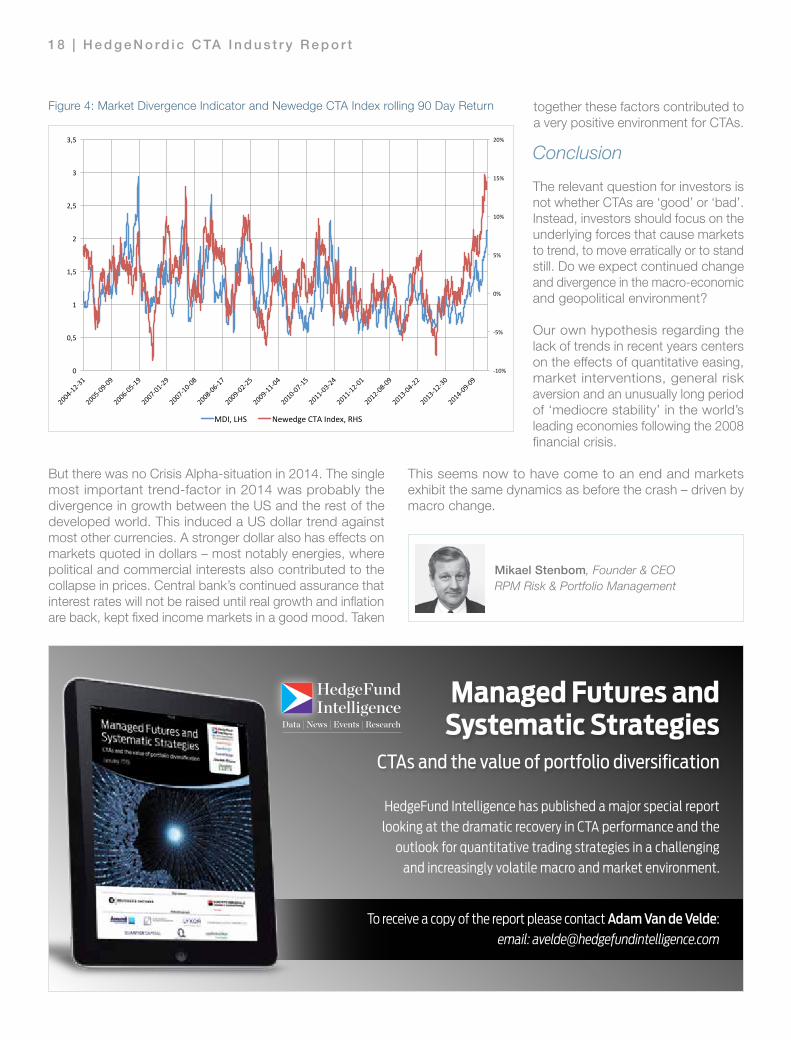
But there was no Crisis Alpha-situation in 2014. The single most important trend-factor in 2014 was probably the divergence in growth between the US and the rest of the developed world. This induced a US dollar trend against most other currencies. A stronger dollar also has effects on markets quoted in dollars – most notably energies, where political and commercial interests also contributed to the collapse in prices. Central bank’s continued assurance that interest rates will not be raised until real growth and inflation are back, kept fixed income markets in a good mood. Taken
-‐10%
-‐5%
0%
5%
10%
15%
20%
0
0,5
1
1,5
2
2,5
3
3,5
MDI, LHS Newedge CTA Index, RHS
Figure 4: Market Divergence Indicator and Newedge CTA Index rolling 90 Day Return together these factors contributed to a very positive environment for CTAs.
Conclusion
The relevant question for investors is not whether CTAs are ‘good’ or ‘bad’. Instead, investors should focus on the underlying forces that cause markets to trend, to move erratically or to stand still. Do we expect continued change and divergence in the macro-economic and geopolitical environment?
Our own hypothesis regarding the lack of trends in recent years centers on the effects of quantitative easing, market interventions, general risk aversion and an unusually long period of ‘mediocre stability’ in the world’s leading economies following the 2008 financial crisis.
This seems now to have come to an end and markets exhibit the same dynamics as before the crash – driven by macro change.
Mikael Stenbom, Founder & CEO RPM Risk & Portfolio Management
H e d g e N o rd i c C TA I n d u s t r y R e p o r t | 1 9
-0,2
-0,1
0,0
0,1
0,2
0,3
0,4
0,5
0,6
0,7
2000 2001 2002 2003 2004 2005 2006 2007 2008 2009 2010 2011 2012 2013 2014
Aver
age
1-y
ear S
harp
e Ra
tio! Strong trends at the
instrument level increased throughout 2014
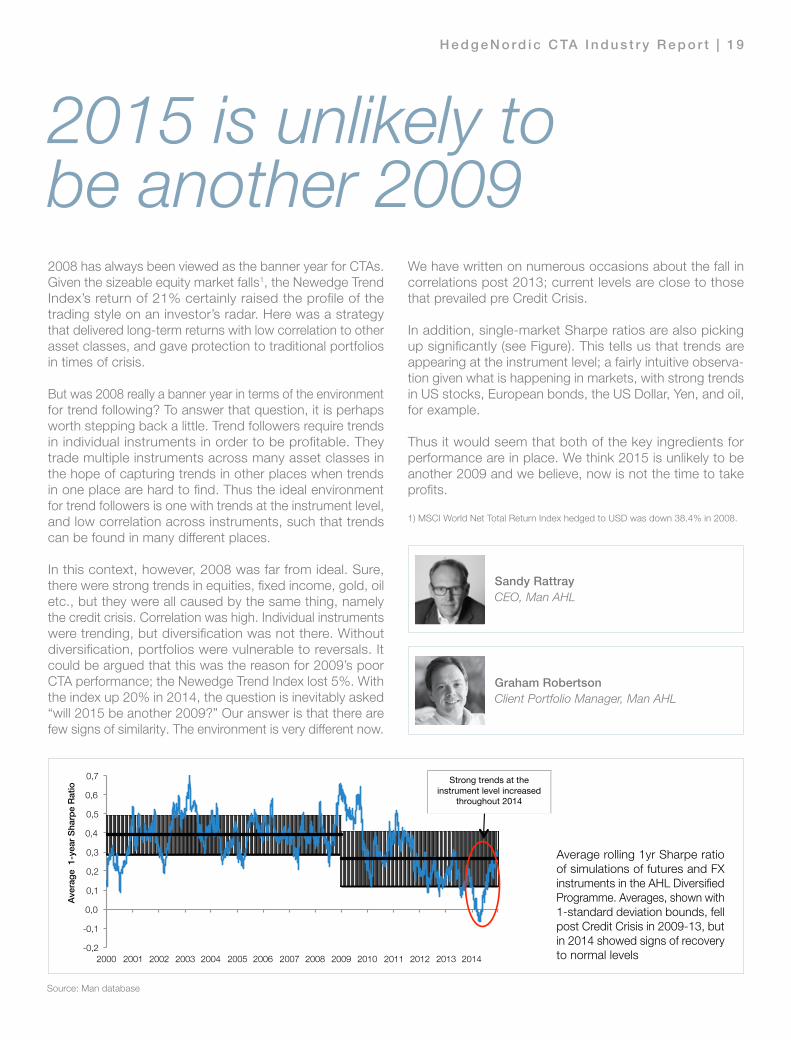
2008 has always been viewed as the banner year for CTAs. Given the sizeable equity market falls1, the Newedge Trend Index’s return of 21% certainly raised the profile of the trading style on an investor’s radar. Here was a strategy that delivered long-term returns with low correlation to other asset classes, and gave protection to traditional portfolios in times of crisis.
But was 2008 really a banner year in terms of the environment for trend following? To answer that question, it is perhaps worth stepping back a little. Trend followers require trends in individual instruments in order to be profitable. They trade multiple instruments across many asset classes in the hope of capturing trends in other places when trends in one place are hard to find. Thus the ideal environment for trend followers is one with trends at the instrument level, and low correlation across instruments, such that trends can be found in many different places.
In this context, however, 2008 was far from ideal. Sure, there were strong trends in equities, fixed income, gold, oil etc., but they were all caused by the same thing, namely the credit crisis. Correlation was high. Individual instruments were trending, but diversification was not there. Without diversification, portfolios were vulnerable to reversals. It could be argued that this was the reason for 2009’s poor CTA performance; the Newedge Trend Index lost 5%. With the index up 20% in 2014, the question is inevitably asked “will 2015 be another 2009?” Our answer is that there are few signs of similarity. The environment is very different now.
We have written on numerous occasions about the fall in correlations post 2013; current levels are close to those that prevailed pre Credit Crisis.
In addition, single-market Sharpe ratios are also picking up significantly (see Figure). This tells us that trends are appearing at the instrument level; a fairly intuitive observa-tion given what is happening in markets, with strong trends in US stocks, European bonds, the US Dollar, Yen, and oil, for example.
Thus it would seem that both of the key ingredients for performance are in place. We think 2015 is unlikely to be another 2009 and we believe, now is not the time to take profits.
1) MSCI World Net Total Return Index hedged to USD was down 38.4% in 2008.
2015 is unlikely to be another 2009
Sandy Rattray CEO, Man AHL
Source: Man database
Average rolling 1yr Sharpe ratio of simulations of futures and FX instruments in the AHL Diversified Programme. Averages, shown with 1-standard deviation bounds, fell post Credit Crisis in 2009-13, but in 2014 showed signs of recovery to normal levels
Graham Robertson Client Portfolio Manager, Man AHL
2 0 | H e d g e N o rd i c C TA I n d u s t r y R e p o r t
In this article, we consider some of the reasons for the concentrated manager approach and present our research on the value of a diversified allocation to CTAs.
This article is relevant for two kinds of CTA investors: one, which is not convinced that diversification of CTAs adds value. They may have perceptions that little diversification exists between CTAs. The second group, which sees the obstacles and hurdles that make it difficult to have a diver-sified approach.
Empirical testing for CTA diversification
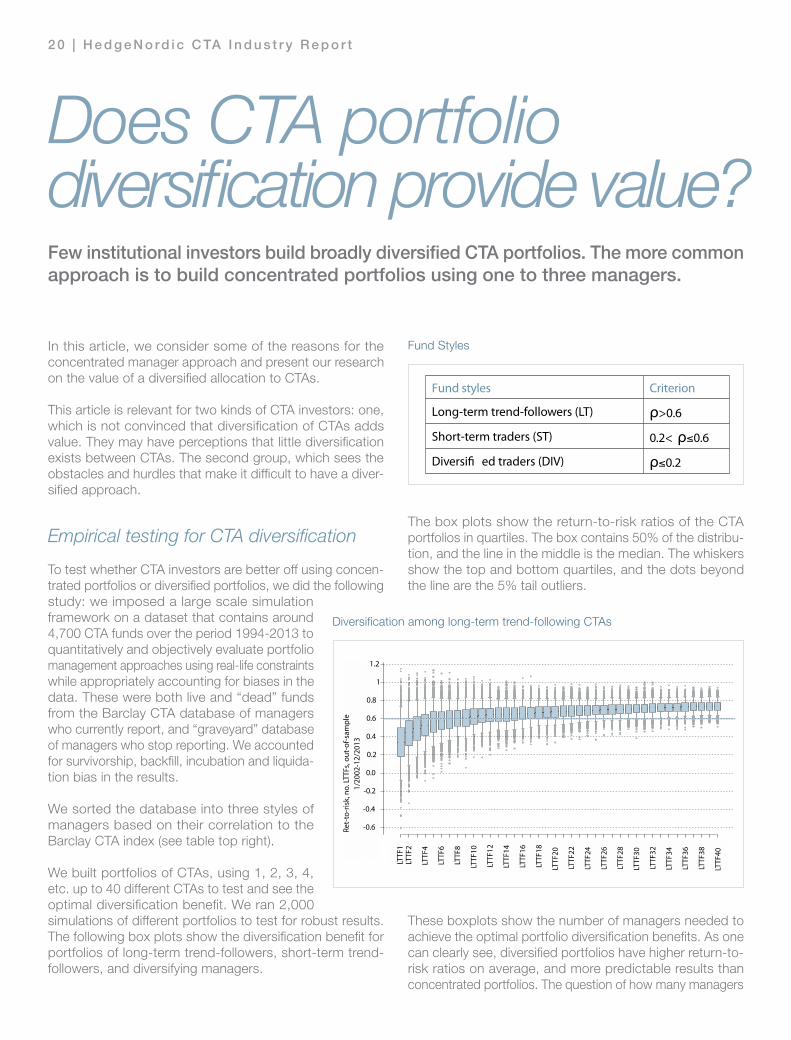
To test whether CTA investors are better off using concen-trated portfolios or diversified portfolios, we did the following study: we imposed a large scale simulation framework on a dataset that contains around 4,700 CTA funds over the period 1994-2013 to quantitatively and objectively evaluate portfolio management approaches using real-life constraints while appropriately accounting for biases in the data. These were both live and “dead” funds from the Barclay CTA database of managers who currently report, and “graveyard” database of managers who stop reporting. We accounted for survivorship, backfill, incubation and liquida-tion bias in the results.
We sorted the database into three styles of managers based on their correlation to the Barclay CTA index (see table top right).
We built portfolios of CTAs, using 1, 2, 3, 4, etc. up to 40 different CTAs to test and see the optimal diversification benefit. We ran 2,000 simulations of different portfolios to test for robust results. The following box plots show the diversification benefit for portfolios of long-term trend-followers, short-term trend-followers, and diversifying managers.
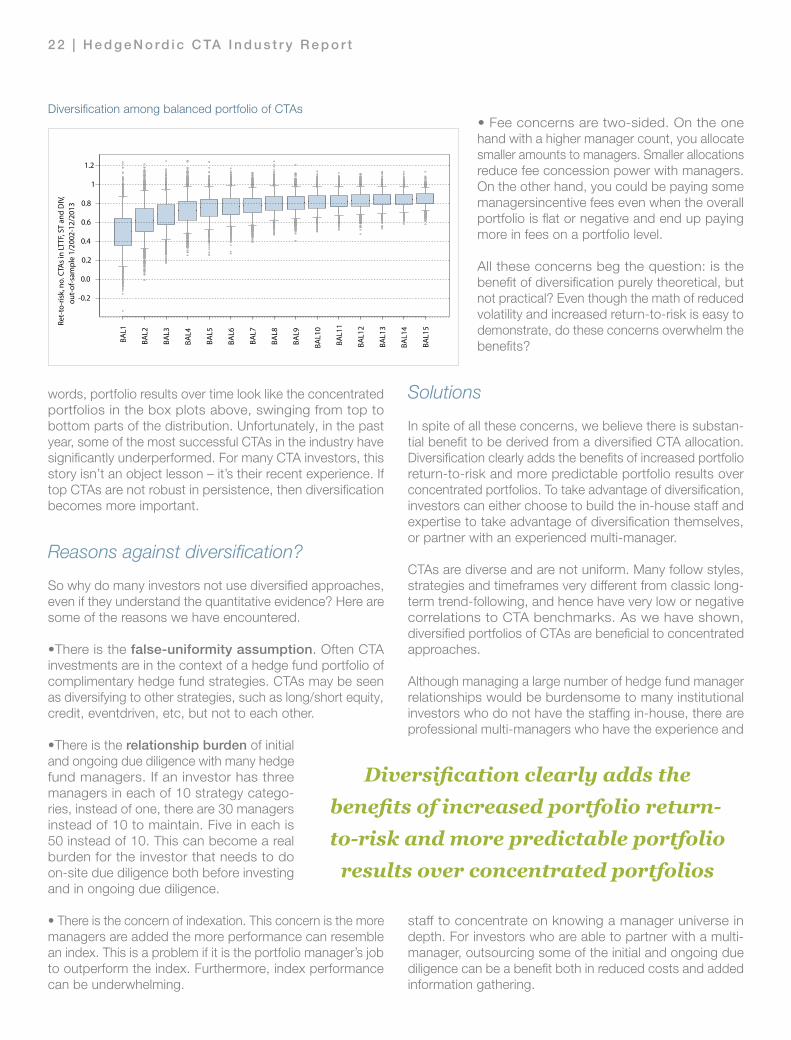
The box plots show the return-to-risk ratios of the CTA portfolios in quartiles. The box contains 50% of the distribu-tion, and the line in the middle is the median. The whiskers show the top and bottom quartiles, and the dots beyond the line are the 5% tail outliers.
These boxplots show the number of managers needed to achieve the optimal portfolio diversification benefits. As one can clearly see, diversified portfolios have higher return-to-risk ratios on average, and more predictable results than concentrated portfolios. The question of how many managers
Does CTA portfolio diversification provide value?Few institutional investors build broadly diversified CTA portfolios. The more common approach is to build concentrated portfolios using one to three managers.
Long-term trend-followers (LT) ρ>0.6
Short-term traders (ST) 0.2< ρ 0.6
Diversi� ed traders (DIV) ρ 0.2
Fund styles Criterion
LTTF
.1
LTTF
.2
LTTF
.3
LTTF
.4
LTTF
.5
LTTF
.6
LTTF
.7
LTTF
.9
LTTF
.8
LTTF
.10
LTTF
.11
LTTF
.12
LTTF
.14
LTTF
.13
LTTF
.15
LTTF
.16
LTTF
.17
LTTF
.18
LTTF
.19
LTTF
.20
LTTF
.21
LTTF
.22
LTTF
.23
LTTF
.24
LTTF
.25
LTTF
.26
LTTF
.27
LTTF
.28
LTTF
.29
LTTF
.30
LTTF
.31
LTTF
.32
LTTF
.33
LTTF
.34
LTTF
.35
LTTF
.36
LTTF
.37
LTTF
.38
LTTF
.39
LTTF
.40
0.6
0.4
0.2
0
0.2
0.4
0.6
0.8
1
1.2
Ret
toRi
sk, n
um LT
TFs,
out
ofsa
mpl
e 1/2
002
12/2
013
Ret-
to-r
isk,
no.
LTTF
s, o
ut-o
f-sam
ple
1/20
02-1
2/20
13
1.2
1
0.8
0.6
0.4
0.2
0.0
-0.2
-0.4
-0.6
LTTF
2
LTTF
4
LTTF
6
LTTF
8
LTTF
10
LTTF
12
LTTF
14
LTTF
16
LTTF
18
LTTF
20
LTTF
22
LTTF
24
LTTF
26
LTTF
28
LTTF
30
LTTF
32
LTTF
34
LTTF
36
LTTF
38
LTTF
40
LTTF
1
Diversification among long-term trend-following CTAs
Long-term trend-followers (LT) ρ>0.6
Short-term traders (ST) 0.2< ρ 0.6
Diversi� ed traders (DIV) ρ 0.2
Fund styles Criterion
LTTF
.1
LTTF
.2
LTTF
.3
LTTF
.4
LTTF
.5
LTTF
.6
LTTF
.7
LTTF
.9
LTTF
.8
LTTF
.10
LTTF
.11
LTTF
.12
LTTF
.14
LTTF
.13
LTTF
.15
LTTF
.16
LTTF
.17
LTTF
.18
LTTF
.19
LTTF
.20
LTTF
.21
LTTF
.22
LTTF
.23
LTTF
.24
LTTF
.25
LTTF
.26
LTTF
.27
LTTF
.28
LTTF
.29
LTTF
.30
LTTF
.31
LTTF
.32
LTTF
.33
LTTF
.34
LTTF
.35
LTTF
.36
LTTF
.37
LTTF
.38
LTTF
.39
LTTF
.40
0.6
0.4
0.2
0
0.2
0.4
0.6
0.8
1
1.2
Ret
toRi
sk, n
um LT
TFs,
out
ofsa
mpl
e 1/2
002
12/2
013
Ret-
to-r
isk,
no.
LTTF
s, o
ut-o
f-sam
ple
1/20
02-1
2/20
13
1.2
1
0.8
0.6
0.4
0.2
0.0
-0.2
-0.4
-0.6
LTTF
2
LTTF
4
LTTF
6
LTTF
8
LTTF
10
LTTF
12
LTTF
14
LTTF
16
LTTF
18
LTTF
20
LTTF
22
LTTF
24
LTTF
26
LTTF
28
LTTF
30
LTTF
32
LTTF
34
LTTF
36
LTTF
38
LTTF
40
LTTF
1
Fund Styles
H e d g e N o rd i c C TA I n d u s t r y R e p o r t | 2 1
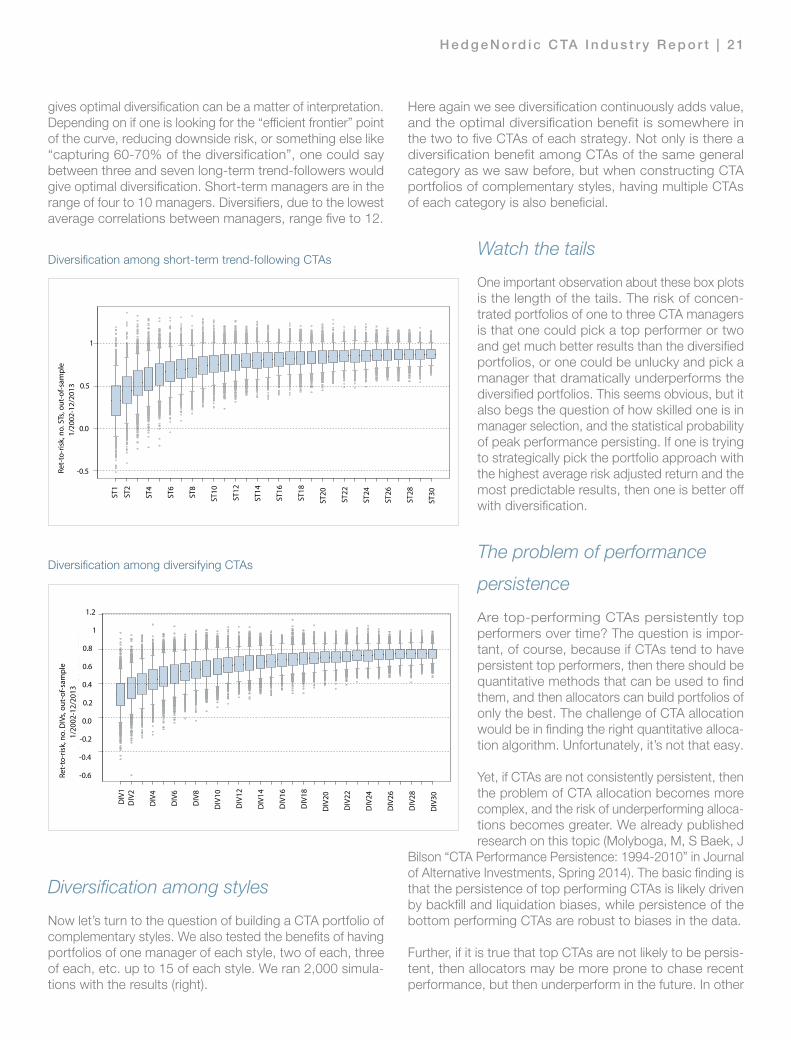
gives optimal diversification can be a matter of interpretation. Depending on if one is looking for the “efficient frontier” point of the curve, reducing downside risk, or something else like “capturing 60-70% of the diversification”, one could say between three and seven long-term trend-followers would give optimal diversification. Short-term managers are in the range of four to 10 managers. Diversifiers, due to the lowest average correlations between managers, range five to 12.
Diversification among styles
Now let’s turn to the question of building a CTA portfolio of complementary styles. We also tested the benefits of having portfolios of one manager of each style, two of each, three of each, etc. up to 15 of each style. We ran 2,000 simula-tions with the results (right).
Here again we see diversification continuously adds value, and the optimal diversification benefit is somewhere in the two to five CTAs of each strategy. Not only is there a diversification benefit among CTAs of the same general category as we saw before, but when constructing CTA portfolios of complementary styles, having multiple CTAs of each category is also beneficial.
Watch the tails
One important observation about these box plots is the length of the tails. The risk of concen-trated portfolios of one to three CTA managers is that one could pick a top performer or two and get much better results than the diversified portfolios, or one could be unlucky and pick a manager that dramatically underperforms the diversified portfolios. This seems obvious, but it also begs the question of how skilled one is in manager selection, and the statistical probability of peak performance persisting. If one is trying to strategically pick the portfolio approach with the highest average risk adjusted return and the most predictable results, then one is better off with diversification.
The problem of performance
persistence
Are top-performing CTAs persistently top performers over time? The question is impor-tant, of course, because if CTAs tend to have persistent top performers, then there should be quantitative methods that can be used to find them, and then allocators can build portfolios of only the best. The challenge of CTA allocation would be in finding the right quantitative alloca-tion algorithm. Unfortunately, it’s not that easy.
Yet, if CTAs are not consistently persistent, then the problem of CTA allocation becomes more complex, and the risk of underperforming alloca-tions becomes greater. We already published research on this topic (Molyboga, M, S Baek, J
Bilson “CTA Performance Persistence: 1994-2010” in Journal of Alternative Investments, Spring 2014). The basic finding is that the persistence of top performing CTAs is likely driven by backfill and liquidation biases, while persistence of the bottom performing CTAs are robust to biases in the data.
Further, if it is true that top CTAs are not likely to be persis-tent, then allocators may be more prone to chase recent performance, but then underperform in the future. In other
Fund Styles
Diversification among short-term trend-following CTAs
Diversification among diversifying CTAs
2 2 | H e d g e N o rd i c C TA I n d u s t r y R e p o r t
words, portfolio results over time look like the concentrated portfolios in the box plots above, swinging from top to bottom parts of the distribution. Unfortunately, in the past year, some of the most successful CTAs in the industry have significantly underperformed. For many CTA investors, this story isn’t an object lesson – it’s their recent experience. If top CTAs are not robust in persistence, then diversification becomes more important.
Reasons against diversification?
So why do many investors not use diversified approaches, even if they understand the quantitative evidence? Here are some of the reasons we have encountered.
•There is the false-uniformity assumption. Often CTA investments are in the context of a hedge fund portfolio of complimentary hedge fund strategies. CTAs may be seen as diversifying to other strategies, such as long/short equity, credit, eventdriven, etc, but not to each other.
•There is the relationship burden of initial and ongoing due diligence with many hedge fund managers. If an investor has three managers in each of 10 strategy catego-ries, instead of one, there are 30 managers instead of 10 to maintain. Five in each is 50 instead of 10. This can become a real burden for the investor that needs to do on-site due diligence both before investing and in ongoing due diligence.
• There is the concern of indexation. This concern is the more managers are added the more performance can resemble an index. This is a problem if it is the portfolio manager’s job to outperform the index. Furthermore, index performance can be underwhelming.
• Fee concerns are two-sided. On the one hand with a higher manager count, you allocate smaller amounts to managers. Smaller allocations reduce fee concession power with managers. On the other hand, you could be paying some managersincentive fees even when the overall portfolio is flat or negative and end up paying more in fees on a portfolio level.
All these concerns beg the question: is the benefit of diversification purely theoretical, but not practical? Even though the math of reduced volatility and increased return-to-risk is easy to demonstrate, do these concerns overwhelm thebenefits?
Solutions
In spite of all these concerns, we believe there is substan-tial benefit to be derived from a diversified CTA allocation. Diversification clearly adds the benefits of increased portfolio return-to-risk and more predictable portfolio results over concentrated portfolios. To take advantage of diversification, investors can either choose to build the in-house staff and expertise to take advantage of diversification themselves, or partner with an experienced multi-manager.
CTAs are diverse and are not uniform. Many follow styles, strategies and timeframes very different from classic long-term trend-following, and hence have very low or negative correlations to CTA benchmarks. As we have shown, diversified portfolios of CTAs are beneficial to concentrated approaches.
Although managing a large number of hedge fund manager relationships would be burdensome to many institutional investors who do not have the staffing in-house, there are professional multi-managers who have the experience and
staff to concentrate on knowing a manager universe in depth. For investors who are able to partner with a multi-manager, outsourcing some of the initial and ongoing due diligence can be a benefit both in reduced costs and added information gathering.
Diversification clearly adds thebenefits of increased portfolio return-to-risk and more predictable portfolio
results over concentrated portfolios
Diversification among balanced portfolio of CTAs

For those concerned about index-like returns, hiring staff or a multi-manager who has demonstrated consistent skill in manager selection and outperformance can deliver the diversification benefits without muting returns.
Finally, for all but the largest investors who may have fee concession leverage even with a diversified portfolio, partnering with a large multi-manager gives similar fee concession power. Large multi-managers are large allocators. Many multi-managers are able to negotiate very competitive fee terms with managers so that all-in portfolio costs are similar to, or less than, what a typical institutional investor would be able to achieve with a direct program. In fact, some multi-managers are creating customised fee structures for investors that are very investor friendly. It is no longer necessarily the case that using a multi-manager gives the diversification benefit but at a high cost premium.
For these and other reasons we hope that CTA investors can have their diversification free lunch, and eat it, too.
CONCLUSIONS
1. There is significant diversification in CTA/ managed futures space
2. Concentrated portfolios of one to three CTAs are sub-optimal
3. Performance of top performing CTA funds are not likely persistent
4. Diversified CTA portfolios have higher return-to- risk and more predictable results
By Joel Handy, director of client relations,and Marat Molyboga, director of research,Efficient Capital Management
H e d g e N o rd i c C TA I n d u s t r y R e p o r t | 2 3
2 4 | H e d g e N o rd i c C TA I n d u s t r y R e p o r t
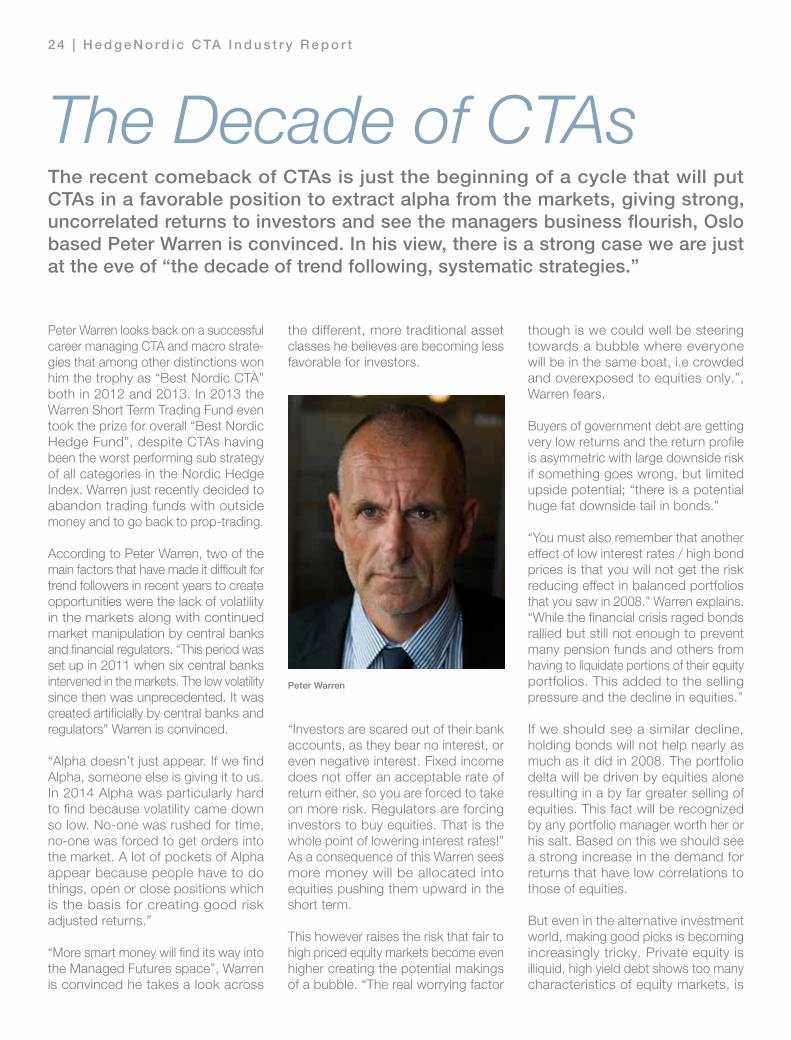
Peter Warren looks back on a successful career managing CTA and macro strate-gies that among other distinctions won him the trophy as “Best Nordic CTA” both in 2012 and 2013. In 2013 the Warren Short Term Trading Fund even took the prize for overall “Best Nordic Hedge Fund”, despite CTAs having been the worst performing sub strategy of all categories in the Nordic Hedge Index. Warren just recently decided to abandon trading funds with outside money and to go back to prop-trading.
According to Peter Warren, two of the main factors that have made it difficult for trend followers in recent years to create opportunities were the lack of volatility in the markets along with continued market manipulation by central banks and financial regulators. “This period was set up in 2011 when six central banks intervened in the markets. The low volatility since then was unprecedented. It was created artificially by central banks and regulators” Warren is convinced.
“Alpha doesn’t just appear. If we find Alpha, someone else is giving it to us. In 2014 Alpha was particularly hard to find because volatility came down so low. No-one was rushed for time, no-one was forced to get orders into the market. A lot of pockets of Alpha appear because people have to do things, open or close positions which is the basis for creating good risk adjusted returns.”
“More smart money will find its way into the Managed Futures space”, Warren is convinced he takes a look across
the different, more traditional asset classes he believes are becoming less favorable for investors.
“Investors are scared out of their bank accounts, as they bear no interest, or even negative interest. Fixed income does not offer an acceptable rate of return either, so you are forced to take on more risk. Regulators are forcing investors to buy equities. That is the whole point of lowering interest rates!” As a consequence of this Warren sees more money will be allocated into equities pushing them upward in the short term.
This however raises the risk that fair to high priced equity markets become even higher creating the potential makings of a bubble. “The real worrying factor
The Decade of CTAsThe recent comeback of CTAs is just the beginning of a cycle that will put CTAs in a favorable position to extract alpha from the markets, giving strong, uncorrelated returns to investors and see the managers business flourish, Oslo based Peter Warren is convinced. In his view, there is a strong case we are just at the eve of “the decade of trend following, systematic strategies.”
though is we could well be steering towards a bubble where everyone will be in the same boat, i.e crowded and overexposed to equities only.”, Warren fears.
Buyers of government debt are getting very low returns and the return profile is asymmetric with large downside risk if something goes wrong, but limited upside potential; “there is a potential huge fat downside tail in bonds.”
“You must also remember that another effect of low interest rates / high bond prices is that you will not get the risk reducing effect in balanced portfolios that you saw in 2008.” Warren explains. “While the financial crisis raged bonds rallied but still not enough to prevent many pension funds and others from having to liquidate portions of their equity portfolios. This added to the selling pressure and the decline in equities.”
If we should see a similar decline, holding bonds will not help nearly as much as it did in 2008. The portfolio delta will be driven by equities alone resulting in a by far greater selling of equities. This fact will be recognized by any portfolio manager worth her or his salt. Based on this we should see a strong increase in the demand for returns that have low correlations to those of equities.
But even in the alternative investment world, making good picks is becoming increasingly tricky. Private equity is illiquid, high yield debt shows too many characteristics of equity markets, is
Peter Warren
H e d g e N o rd i c C TA I n d u s t r y R e p o r t | 2 5
capacity constrained and also can become illiquid. “And as for hedge funds, many of the strategies have not proven themselves to deliver robust and predictable low correlated returns (to equities). Too many non-systematic managers display style drift and increased correlation after a period of strong performance in equities. Most of them rightfully claim that they feel pressure to do this from their investors. However, if investors wanted a leveraged bet on equities they can find that a lot cheaper than paying 2/20.”
Despite criticism towards hedge funds for performing poorly and regulators severely tightening the range of investors able to access hedge funds, and making the funds themselves less accessible, money is still pouring into hedge funds. At year end the industry topped three trillion dollars in AuM for the first time. Warren sees this as an indication investors are desperately seeking to diversify away from equities and fixed income.
One of the big questions going forward will be where to find systematic, low correlation to equity- and fixed income markets. Since the US finished up QE III, we have gone from a world that was highly synchronized to a world that is unsynchronized. A clear indication of that was the move of Swiss Central Bank SNB lifting the tie to the Euro.
“But also the Danish, Russian and Canadian central banks along with the ECB are tending to go for uncoordinated action”, Warren observes. “And, unfortunately, there are many geopolitical hotspots that may be the cause for more volatility, too. Economic growth levels around the world are widely dispersed which means that there will be a lot more volatility and opportunities for active traders, which will enable CTAs to harvest Alpha again. Investors wanting to participate in those global trends, and hedge against them too will need to have exposure to a trend following strategy.”
There is a lot going for CTAs
“Systematic Managed Futures have the advantage of providing investors with the predictability of trend following, transpar-ency and low correlation. This produces the robustness so much sought after by investors.”, Warren is convinced. “CTAs performed very well in 2008, but less so in the last few years when volatility came down providing less opportunity. Still, you can argue that was predictable given the strategy and how they operate. With model-based, systematic trading you understand what the drivers are and are able to mathematically explain what you are doing.”
Warren also points out, model-based investing has much less dependency on the principal or the star-manager that hedge funds all too often are all about. As long as models are monitored and risk-managed, statistical probabilities remove factors such as some principal’s moods, health or life style. “This lack of vulnerability in CTAs ticks a box with investors.”
“CTAs are fairly easy to understand, providing the managers are willing to explain the factors that make the systems work in certain ways and in different environments. There is no need to give away the secret sauce to help even first time CTA allocators understand where performance is coming from, and when it fades.”
Longer-term traders will be preferred, and should be too according to Warren as they are more easy to understand and more predictable to the investor. “They may well have elements of short term-trading in there, and trend reversal programs, but in general, mid- to long term systematic trend-followers will win this race due to less capacity constraints.”
An advantage that should not be underestimated is that the CTA space can take a lot of money and allocate it to
the markets, usually in the most liquid and regulated markets, which raises the comfort level especially to institutional investors.
When asked about the future of CTAs as an industry Warren believes “going forward, trend followers will continue to be doing well,
as diversifiers, performance engines but also as businesses – gathering assets and becoming more profitable businesses for the reasons discussed earlier.”
Simplified and to be more distinctive, Warren favors trend followers over non-trend following strategies, systematic over discretionary traders and mid to long-term managers over short-term traders for the coming period.
The trend we have seen industry wide, but especially among CTA managers is that the big managers get bigger and it will be difficult for emerging managers to attract assets or seed capital. This is likely to continue. “Especially for institutional investors that allocate to the Managed Futures space for the first time, it is the safer bet to go with the big, brand names – not disrespecting their merits. This falls in line with the old saying: ‘No one ever got fired for buying IBM’. Mainly though, the largest managers have the administrative setup in place along with the muscle to deal with increasing cost to be compliant with all rules and regulations.”
“Regulators are forcing investors to buy equities. That is the whole point of lowering
interest rates!”
2 6 | H e d g e N o rd i c C TA I n d u s t r y R e p o r t
What worries Warren is that regulatory costs and adminis-trative burdens have become the largest barriers to entry for new managers coming into the market – “and it is only getting worse!” The motivation to leave a cosy job at a bank
to become an independent fund manager has lost much of its appeal. An evident trend is that both young and seasoned talents starting new ventures have no interest whatsoever in taking in outside money and rather opt for a prop-shop set up, making a good living for themselves.
“If you are running a prop-shop, you do not have to explain what you are doing to anyone and justify your results or have
ETFS & INDEXING • ALTERNATIVES & MULTI-MANAGEMENT • ABSOLUTE RETURN & SOLUTIONS
Lyxor’s absolute return strategies allocate globally to highly liquid asset classes. Depending on the product, long only or long & short strategies are implemented. Such multi-asset strategies seek to deliver absolute returns within strict risk limits. In doing so, the multi-asset investment team taps Lyxor’s expertise in risk budgeting and diversification, portfolio construction modeling, trend following, cross asset and macroeconomic research, as well as volatility management.
ABSOLUTE RETURN BY LYXOR
T H E P O W E R T O P E R F O R M I N A N Y M A R K E T
The products presented on www.lyxorfunds.com and developing notably absolute return strategy may be subject to restrictions with regard to certain persons or in certain countries according to national regulations applicable to these persons or in these countries. In addition, some of these products are registered for public marketing only in some countries. It is each investor’s responsibility to ascertain that it is authorised to subscribe, or invest into these products. Lyxor AM recommends that investors read carefully the risk factors sections of these products’ documentation (prospectus and KIID) which is available free of charge on www.lyxorfunds.com or upon request sent to [email protected]. Lyxor Asset Management (Lyxor AM), Société par Actions Simplifiée, Tours Société Générale, 17 cours Valmy, 92800 Puteaux (France), 418 862 215 Nanterre, is authorized and regulated by the French Autorité des marchés financiers according to the European directives UCITS (2009/65/EC) and AIFM (2011/61/EU).
This communication is for professional clients only and is not directed at retail clients.
WHEN ACTIVE RISK MANAGEMENT MAKES PERFORMANCEto provide investors with comfort and reports.” Warren is concerned that the market will be drained of a lot of talent due to the actions of regulatory authorities. “Good ideas will no longer be shared in the public domain, meaning that neither will their financial gains. This also means that innovation no longer will be shared, which is clearly negative for society.”
Towards the end of our talk, we asked Peter Warren to play devils advocate and describe a scenario that could spoil the party and reverse this favorable environment for CTAs. “The only thing I can think of is if volatility disappears again. But that would be like trying to prevent an explosive from happening after you have already pressed the button on the detonator. You cannot!” the British Special Forces veteran explains.
“This detonator has been triggered already and the volatility set off by central banks no longer behaving synchronized is here to stay. While you should never say never, based upon the current economic environment, I cannot see which forces could come into play to reverse the favorable environment for systematic trend followers.”
HedgeNordic
“I cannot see which forces could come into play to
reverse the favorable environment for systematic
trend followers.”

H e d g e N o rd i c C TA I n d u s t r y R e p o r t | 2 7
ETFS & INDEXING • ALTERNATIVES & MULTI-MANAGEMENT • ABSOLUTE RETURN & SOLUTIONS
Lyxor’s absolute return strategies allocate globally to highly liquid asset classes. Depending on the product, long only or long & short strategies are implemented. Such multi-asset strategies seek to deliver absolute returns within strict risk limits. In doing so, the multi-asset investment team taps Lyxor’s expertise in risk budgeting and diversification, portfolio construction modeling, trend following, cross asset and macroeconomic research, as well as volatility management.
ABSOLUTE RETURN BY LYXOR
T H E P O W E R T O P E R F O R M I N A N Y M A R K E T
The products presented on www.lyxorfunds.com and developing notably absolute return strategy may be subject to restrictions with regard to certain persons or in certain countries according to national regulations applicable to these persons or in these countries. In addition, some of these products are registered for public marketing only in some countries. It is each investor’s responsibility to ascertain that it is authorised to subscribe, or invest into these products. Lyxor AM recommends that investors read carefully the risk factors sections of these products’ documentation (prospectus and KIID) which is available free of charge on www.lyxorfunds.com or upon request sent to [email protected]. Lyxor Asset Management (Lyxor AM), Société par Actions Simplifiée, Tours Société Générale, 17 cours Valmy, 92800 Puteaux (France), 418 862 215 Nanterre, is authorized and regulated by the French Autorité des marchés financiers according to the European directives UCITS (2009/65/EC) and AIFM (2011/61/EU).
This communication is for professional clients only and is not directed at retail clients.
WHEN ACTIVE RISK MANAGEMENT MAKES PERFORMANCE
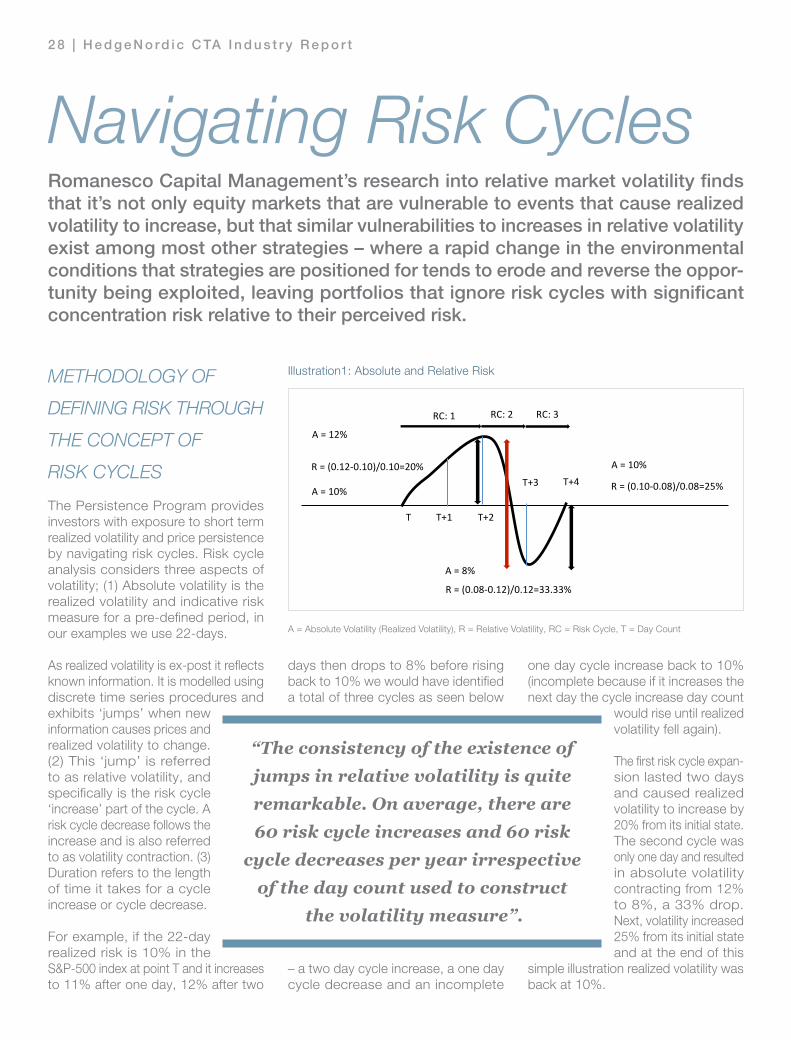
2 8 | H e d g e N o rd i c C TA I n d u s t r y R e p o r t
days then drops to 8% before rising back to 10% we would have identified a total of three cycles as seen below
– a two day cycle increase, a one day cycle decrease and an incomplete
one day cycle increase back to 10% (incomplete because if it increases the next day the cycle increase day count
would rise until realized volatility fell again).
The first risk cycle expan-sion lasted two days and caused realized volatility to increase by 20% from its initial state. The second cycle was only one day and resulted in absolute volatility contracting from 12% to 8%, a 33% drop. Next, volatility increased 25% from its initial state and at the end of this
simple illustration realized volatility was back at 10%.
Navigating Risk CyclesRomanesco Capital Management’s research into relative market volatility finds that it’s not only equity markets that are vulnerable to events that cause realized volatility to increase, but that similar vulnerabilities to increases in relative volatility exist among most other strategies – where a rapid change in the environmental conditions that strategies are positioned for tends to erode and reverse the oppor-tunity being exploited, leaving portfolios that ignore risk cycles with significant concentration risk relative to their perceived risk.
T T+1 T+2
T+3 T+4 R = (0.12-‐0.10)/0.10=20%
A = 10%
A = 12%
RC: 1 RC: 2 RC: 3
A = 8%
R = (0.08-‐0.12)/0.12=33.33%
A = 10%
R = (0.10-‐0.08)/0.08=25%
Illustration1: Absolute and Relative Risk
A = Absolute Volatility (Realized Volatility), R = Relative Volatility, RC = Risk Cycle, T = Day Count
METHODOLOGY OF
DEFINING RISK THROUGH
THE CONCEPT OF
RISK CYCLES
The Persistence Program provides investors with exposure to short term realized volatility and price persistence by navigating risk cycles. Risk cycle analysis considers three aspects of volatility; (1) Absolute volatility is the realized volatility and indicative risk measure for a pre-defined period, in our examples we use 22-days.
As realized volatility is ex-post it reflects known information. It is modelled using discrete time series procedures and exhibits ‘jumps’ when new information causes prices and realized volatility to change. (2) This ‘jump’ is referred to as relative volatility, and specifically is the risk cycle ‘increase’ part of the cycle. A risk cycle decrease follows the increase and is also referred to as volatility contraction. (3) Duration refers to the length of time it takes for a cycle increase or cycle decrease.
For example, if the 22-day realized risk is 10% in the S&P-500 index at point T and it increases to 11% after one day, 12% after two
“The consistency of the existence of jumps in relative volatility is quite remarkable. On average, there are 60 risk cycle increases and 60 risk
cycle decreases per year irrespective of the day count used to construct
the volatility measure”.

H e d g e N o rd i c C TA I n d u s t r y R e p o r t | 2 9
*Dec-2013 and Oct-2014 refers to risk cycle increases leading into mid-month
Index2013 2014
Return Jun-2013 Dec-2013* Return Jan-2014 Jul-2014 Oct-2014*
S&P-500 TR 29,60% -1,50% -1,45% 11,39% -3,56% -1,51% -6,75%
Persistence Strategy 3,29% 1,42% 2,47% -10,24% 3,98% 3,92% 1,67%
Newedge Trend Sub Index 2,67% -2,87% -3,07% 19,01% -4,51% -1,07% 0,61%
Newedge CTA Index 0,73% -1,50% -1,81% 15,20% -2,34% -0,98% 0,32%
Newedge STTI 3,55% -1,12% 0,61% 10,04% 2,39% -0,29% 3,63%
HFRX Global Hedge Fund Index 6,72% -1,33% -0,24% 0,18% -0,24% -0,88% -4,16%
Table 1
Above: The blue line shows returns during RCD while the red line shows returns during RCI. Both the S&P-500 and Newedge Trend Sub Index generate above average returns during risk cycle decreases and appear to be negatively exposed to events that cause risk cycle increases.
Above: A shorter time frame (limited history) shows the HFRX HF Index is equally vulnerable to events that cause S&P-500 risk cycle increases while the reverse is true of the Persistence Program. The Persistence Program tends to be positively positioned for risk cycle increases and price persistence following volatility jumps and produces a low to negative expectancy during risk cycle decreases.
0%
20%
40%
60%
80%
100%
120%
140%
160%
180%
200%
0
50
100
150
200
250
S&P-‐500 TR S&P-‐500 TR (RCI)
S&P-‐500 TR (RCD) S&P-‐500 Vola9lity Jumps
Fig1: S&P-500 TR During RCI and RCD
0%
20%
40%
60%
80%
100%
120%
140%
160%
180%
200%
0
50
100
150
200
250
300
350
400
450
Newedge Trend Sub Newedge Trend Sub (RCI)
Newedge Trend Sub (RCD) S&P-‐500 VolaClity Jumps
Fig2: Newedge Trend Sub During RCI and RCD
0%
20%
40%
60%
80%
100%
120%
140%
160%
180%
200%
0
20
40
60
80
100
120
140
160
180
HFRX HF Index HFRX HF Index (RCI)
HFRX HF Index (RCD) S&P-‐500 Vola?lity Jumps
Fig3: HFRX HF Index During RCI and RCD
0%
20%
40%
60%
80%
100%
120%
140%
160%
180%
200%
0
50
100
150
200
250
300
350
Persistence Program Persistence Program (RCI)
Persistence Program (RCD) S&P-‐500 VolaBlity Jumps
Fig4: The Persistence Program During RCI and RCD
3 0 | H e d g e N o rd i c C TA I n d u s t r y R e p o r t
Joakim Agerback Portfolio Manager,Romanesco Capital Management
rates, inflation, growth, monetary policy, political stability and especially changes of these. Generally speaking, in order to exploit these factors a strategy or investment absorbs more risk than tends to be realized (closed out) and the return streams therefore exhibits these consequences. Navigating risk cycles on the other hand focuses solely on the transition from relatively calm conditions and addresses the very specific conditions that most investments and strategies must ignore.
The returns produced from navigating risk cycles therefore are not only low correlation, but address a very specific condition of high relevance for most portfolios – especially diversified portfolios. All investments and strategies have their strengths and weaknesses and this may support the argument for diversification, but long term correlations are largely irrelevant if the practitioner does not address specific portfolio risk. In an attempt to diversify a portfolio across low correlation return streams it becomes very easy to accumulate a significantly larger amount of concentrated risk cycle vulnerability than the historical risk-adjusted returns may indicate and a false sense of a well-diversified portfolio emerges.
The content of this article has been taken from our Q3 paper, titled ‘Navigating Risk Cycles’ and we encourage readers to contact us with any questions or comments you may have on the topic.
(RELATIVE) VOLATILITY JUMPS
The consistency of the existence of jumps in relative volatility is quite remarkable. On average, there are 60 risk cycle increases and 60 risk cycle decreases per year irrespective of the day count used to construct the volatility measure. This leads to an average duration period for risk cycles of around two to three days and highlights the limitation of many alternative strategies adaptability and potential to hedge negative exposure to these risk cycles. Further, the risk cycles aren’t dependent on an elevated risk regime as risk cycles occur as frequently in low volatility environments as they do in high volatility environments.
Given that investors tend to temper (boost) leverage to offset (compensate) for the underlying market volatility the degree of investor urgency to volatility jumps may vary considerably. In table 1 we show the impact of some significant relative volatility jumps on recent return streams. Table 1 indicates that short term strategies (STTI & Persistence Program) offer a positive expectancy during risk cycle increases.
WHY RISK CYCLES MATTER
FOR INVESTORS
The majority, if not all, investments are exposed to and attempt to exploit a range of factors that includes interest
VINNAREÅRETS ADVOKATBYRÅ
2013
Tor Gudmundsen Sinclair Portfolio Manager,Romanesco Capital Management
“...long term correlations are largely irrelevant if the
practitioner does not address specific portfolio risk.”

H e d g e N o rd i c C TA I n d u s t r y R e p o r t | 3 1
A different kind of animal
Lynx Asset Management was founded in Stockholm in 1999. From day one we set out to build a diversified, fully-systematic investment process to identify trends and other patterns in financial markets.
Today, we are widely recognised as a top-performing CTA with over US$5 billion in assets under management and multiple awards to our name. To learn more, please visit www.lynxhedge.se.
Past performance is not necessarily indicative of future results. Systematic trading involves substantial risk of loss. Pursuant to an exemption from the U.S. Commod-ity Futures Trading Commission in connection with accounts of Qualified Eligible Persons and in connection with pools whose participants are limited to Quali-fied Eligible Persons, brochures, account documents or offering memorandums for the accounts and pools are not required to be, and have not been, filed with the U.S. Commodity Futures Trading Commission. The U.S. Commodity Futures Trading Commission has not passed upon the merits of participating in a trad-ing program or upon the adequacy or accuracy of commodity trading advisor disclosure. Nor has the U.S. Commodity Futures Trading Commission passed upon the merits of participating in a pool or upon the adequacy or accuracy of an offering memorandum. Consequently, the U.S. Commodity Futures Trading Commis-sion has not reviewed or approved the trading program, brochures, account documents, the offering or any offering memorandum for the accounts and the pools.

3 2 | H e d g e N o rd i c C TA I n d u s t r y R e p o r t
This kind of behaviour either signals a belief that soft factors can forecast the future returns of the different CTA managers, and/or that investors make their investment decisions on the basis of emotions rather than objective facts.
The research we carried out on 23 of the largest CTAs in the world resulted in the conclusion that neither team size nor experience is able to predict the risk adjusted returns of different CTAs. After detailed discussions, we also drew the conclusion that none of the other soft factors are likely to contain any predictive power either: pitch books, commu-nication skills of presenters, the number of people with PhD titles, the manager’s brand, the technological appearance, the trading setup or the degree of transparency provided. Finally, when it comes to performance figures, investors need to watch out for at least seven different pitfalls when managers present their past performance.
An objective like-for-like analysis of past performance may be the only remaining factor that potentially possesses some power to predict future performance. Investors may therefore want to spend more time analysing, understanding and adjusting track records, as well as classifying CTAs into sub-categories and running client portfolio simulations to find out which CTAs generate the largest improvement in the risk adjusted returns for the client.
How We Did the Research
We started by looking at the constituents of three major CTA indices: BarclayHedge’s BTOP50, NewEdge CTA index and Dow Jones Credit Suisse Managed Futures index. From this aggregated group of funds, we excluded funds:a) that tend to make qualitative (as opposed to quantitative) investment decisions
b) that do not offer public access to their performance data on Bloombergc) that did not exist prior to October 2006 or that had closed down by August 2013d) that are copies of other funds
We chose to use the launch date of our own fund SEB Asset Selection (3 October 2006) as the start date for the research. The end date of August 2013 was chosen as we easily could use data from another study we had done with that end date. Following this methodology, we ended up with the following 23 CTA funds: Altis, Aspect, Boronia, Brummer & Partners Lynx, Campbell, Cantab, Eckhardt, Estlander, FTC, FX Concepts, Graham, IKOS, Lyxor Epsilon, Man AHL, Millburn, Nuwave, Ortus, Rivoli, Transtrend, SEB Asset Selection, SMN Diversified, Superfund and Winton.Of course, it would have been great to have had at least 30 funds in the study, but rather than tweaking the rules or changing the methodology, we have chosen to stay with the above 23 funds.
When it comes to return data, we have derived them from each fund’s NAV per share series on Bloomberg (in USD or EUR). Sharpe ratios take the currency specific and period specific risk free rate into account. The number of years since inception and the number of relevant researchers per fund have been taken from publicly available sources in 2013. In some cases we have had to estimate these numbers. We stopped short of trying to classify each firm’s employees with regard to their respective academic titles.
As regards the qualitative factors, we have chosen to discuss those fallacies from a behaviour finance perspec-tive rather than making subjective assessments. Hopefully, those discussions can help fund selectors to avoid some of the pitfalls.
10 Fallacies to Avoid when Selecting CTAsIn this article we are taking the perspective of an institutional investor who wants to invest in one or several commodity trading advisor funds (“CTAs”). Meetings we have had with investors over the last decade indicate that they do an initial quanti-tative screening, but then – after having met with the different CTA managers – put a lower weight on the hard facts (realised track record) and a higher weight on soft factors (all other kinds of information) when they make their final investment decision.

H e d g e N o rd i c C TA I n d u s t r y R e p o r t | 3 3
1. The Pitch Book Fallacy
It is time to get going with the first fallacy, the Pitch Book Fallacy. It is widely known that corporate finance people at the major investment banks are the masters of the universe when it comes to pitch book production. However, anybody who has met a larger CTA firm would probably agree that their pitch books are pretty good looking, too.
Most people would probably agree that neither the structure, layout nor the touch and feel of a pitch book has anything to do with an invest-ment team’s ability to generate excess returns. Anybody with an aesthetic sense and some basic knowledge of a presentation program could come up with a very professionally looking presentation. Some managers believe it is worth the extra time and effort, others think that clients ignore the packaging.
The contents of presentations is, however, deemed to be relevant for judging a team’s future alpha generation capabilities – that is why presentation materials are always used in meetings between clients and managers. At this point, let us make a distinction between hard contents and soft contents and define hard contents to be numbers and graphs directly or indirectly related to the fund’s track record. In a corresponding way, we define soft contents to be the pages that describe the team’s history, organisa-tion, philosophy, processes and so on.
Let us discuss the soft contents first. Some investors believe that the soft contents give a more accurate forecast of a fund’s future performance than the historical track record does. The only problem with this hypothesis is that most of the larger CTAs have invest-ment processes and trading processes that are very similar to each other. Yet, there is a fairly substantial dispersion in the funds’ returns on a year to year basis as well as the risk adjusted returns over the longer term.
This is how we see the world: The risk adjusted returns of CTA funds
are not generated by the general and schematic investment- and trading processes pictured in the presentations or described in one-on-one meetings with investors. The risk adjusted returns of a specific fund is a direct function of the detailed specification of their alpha models. The model specifications are different between the different CTA funds and thus short term and longer term risk adjusted returns will differ. However, since none of the largest CTA-managers are willing to reveal their models in such detail to enable fund pickers to make a detailed comparison between funds, it is probably quite farfetched to believe that you will find predictive power in the soft contents of presentations. You can quite easily tell, however, who is good at producing professionally looking hand-outs.
When it comes to the hard contents of presentations (the track record), let us come back to that a bit later. In spite of the mandatory consumer warnings, it may be the only relevant straw you can hold onto in the end.
2. The Slick Presenter Fallacy
The impression you get from a meeting is not just based on the presentation material used in the meeting. It is probably fair to say that the presenter’s ability to connect with the client, to explain, to argue, to reason, to create a positive atmosphere, to establish a professional rapport and to convey energy, is at least as important as the quality of the pitch book.
What a well-versed presenter can do is to make you feel comfortable with the idea of handing over money to the asset manager. A good presenter is able to minimise any uncertainty that the investor may feel. Will the invest-ment team be able to deliver good performance in the future? Will the asset management organisation be able to fulfil its risk control-, compliance- and other duties? Is back- and middle office staffed with competent people and equipped with good, efficient and safe
systems? Is the fund valuation done by an independent and professional party? Are the assets of the fund held by a respectable custodian or not?
Of course, there are some hard facts (e.g. fund valuation being done by an independent and respected party or not, assets being held by a respected custodian or not) which the presenter cannot do too much about – i.e. typical yes-or-no questions. However, since most questions are of a more open nature, there is often enough flexibility for a good presenter to make a good impression.
3. The Big Team Fallacy
When it comes to the size of different investment teams, many fund pickers think that larger research teams should generate higher risk adjusted returns than smaller teams. To most people, it seems like an obvious fact. The reasoning goes like this: “100 researchers must be able to beat a team of 10 researchers...” and the reasoning may continue like this: “...of course, in a single year, randomness may disturb the picture, but over time, it must be true.”
Because it is such an obvious ‘truth’ and because it takes a bit of time to gather the relevant data to check the hypothesis, most people would not even bother to do the work. As opposed to the above mentioned pitch book fallacy and slick presenter fallacy, it is substantially easier to test whether team-size has an effect on future returns or not.
In Figure 1 we have pictured the number of researchers per CTA manager in 2013 against the Sharpe-ratio of each CTA fund over the period Oct 2006 – Aug 2013. We have chosen to use risk adjusted returns, but of course there are other performance measures that could be used as well.
For the full sample of 23 CTA managers, the correlation between the number of researchers and the risk adjusted returns amounted to a mere 0.09. If

3 4 | H e d g e N o rd i c C TA I n d u s t r y R e p o r t
you were to exclude the CTA funds with the highest and lowest Sharpe ratios, you get a negative correlation of -0.31, i.e. the more researchers you have, the lower your Sharpe ratio.
Irrespective of whether you choose to exclude some funds from the sample or not, the R-square (how well the values of the X-variable are able to explain the variation in the Y- variable) is very close to zero in both cases (only 1% if you include all observations and 10% if you eliminate the observations with the highest and lowest Sharpe ratios). From this analysis, it is not possible to conclude that larger research teams are able to generate higher risk adjustedreturns than smaller research teams. Nor can you claim the opposite.
Thus, if you are looking for risk adjusted returns, do not get fooled to believe that larger CTA teams will deliver better performance for you. In the CTA industry, team size seems totally uncorrelated to performance. This implies that larger teams (with the exception of one manager) seem to be unable to capitalise on their vast research resources.
At least two criticisms can be put forward to our analysis. First, the sample contains only 23 observations. The absolute minimum for statistical testing is generally thought to be 30 obser-vations. We would like to encourage
database companies who might have gathered this kind of data from a larger set of CTAs to publish their research on this topic.
Second, observing the number of researchers at the end of the period rather than at the beginning of the period basically implies a test with perfect hindsight. Over this seven year period, there has been a tendency that the most successful managers have been recruiting more researchers and the least successful have been making people redundant. In other words, if the number of employees had been measured ex ante, the correlation between team size and Sharpe ratio is likely to have been even lower (or more negative). We leave that for an independent researcher to study.
4. The Title Fallacy
Would it not be reasonable to assume that a person with a higher academic title has a better chance of delivering good performance than a person with a lower or no academic title? It seems like a reasonable hypothesis. Also, in the market place, a lot of investors seem to get impressed by academic titles, the PhD title in particular.
The positive thing about people who have completed a higher academic education is that they have read a
lot of academic research, learned to apply a scientific research methodology and have been equipped with fairly sophisticated theoretical models/tools for solving different kinds of problems. Also, one should not forget that their academic achievement reflects a high intellectual capacity and a willingness to work hard – very important ingredients for success in most jobs.
In a corresponding way as in the discus-sion about team size, human logic would say that a person with a higher education should have a greater chance of success than a person with a lower educational level. However, nobody seems to have bothered checking this hypothesis in reality. We refrained from calling the 23 CTA funds to ask for this kind of information as we thought they would not be willing to give us that information. However, we would encourage independent researchers to look into this. Our best guess is a corre-lation of +/-0.10 between educational level and risk adjusted returns within the CTA industry. If that was the case, titles would be another fallacy that fund pickers may want to watch out for.
5. The Long
Experience Fallacy
Another human logic is that people with a longer experience should be better at their job than people with a shorter experience. Again, implicit in this logic is the famous ceteris paribus assumption.
The hypothesis can be tested by regressing the age of the respective funds to the funds’ respective Sharpe ratio. We have done this in Figure 2.
Whether you include all observations or exclude the two observations with the highest and lowest Sharpe ratios, in both cases you get a correlation of about -0.30. In other words, the longer the fund had existed, the lower its risk adjusted return turned out to be (on average). The human logic does not
&"
SEB Asset Selection
of 10 researchers…” and the reasoning may continue like this: “…of course, in a single year, randomness may disturb the picture, but over time, it must be true.” Because it is such an obvious ‘truth’ and because it takes a bit of time to gather the relevant data to check the hypothesis, most people would not even bother to do the work. As opposed to the above mentioned pitch book fallacy and slick presenter fallacy, it is substantially easier to test whether team-size has an e�ect on future returns or not. In Figure 1 we have pictured the number of researchers per CTA manager in 2013 against the Sharpe-ratio of each CTA fund over the period Oct 2006 – Aug 2013. We have chosen to use risk adjusted returns, but of course there are other performance measures that could be used as well. For the full sample of 23 CTA managers, the correlation between the number of researchers and the risk adjusted returns amounted to a mere 0.09. If you were to exclude the CTA funds with the highest and lowest Sharpe ratios, you get a negative correlation of -0.31, i.e. the more researchers you have, the lower your Sharpe ratio. Irrespective of whether you choose to exclude some funds from the sample or not, the R-square (how well the values of the X-variable are able to explain the variation in the Y-variable) is very close to zero in both cases (only 1% if you include all observations and 10% if you eliminate the observations with the highest and lowest Sharpe ratios). From this analysis, it is not possible to conclude that larger research teams are able to generate higher risk adjusted
returns than smaller research teams. Nor can you claim the opposite. Thus, if you are looking for risk adjusted returns, do not get fooled to believe that larger CTA teams will deliver better performance for you. In the CTA industry, team size seems totally uncorrelated to performance. This implies that larger teams (with the exception of one manager) seem to be unable to capitalise on their vast research resources. At least two criticisms can be put forward to our analysis. First, the sample contains only 23 observations. The absolute minimum for statistical testing is generally thought to be 30 observations. We would like to encourage database companies who might have gathered this kind of data from a larger set of CTAs to publish their research on this topic. Second, observing the number of researchers at the end of the period rather than at the beginning of the period basically implies a test with perfect hindsight. Over this seven year period, there has been a tendency that the most successful managers have been recruiting more researchers and the least successful have been making people redundant. In other words, if the number of employees had been measured ex ante, the correlation between team size and Sharpe ratio is likely to have been even lower (or more negative). We leave that for an independent researcher to study. So, why have a lot of investors historically been inclined to invest with large research teams? There are probably two reasons for this: a) they have probably never checked the validity of the marketing pitch and b) “human logic”.
Figure 1: The Big Team Fallacy
Source: SEB Investment Management AB, Bloomberg
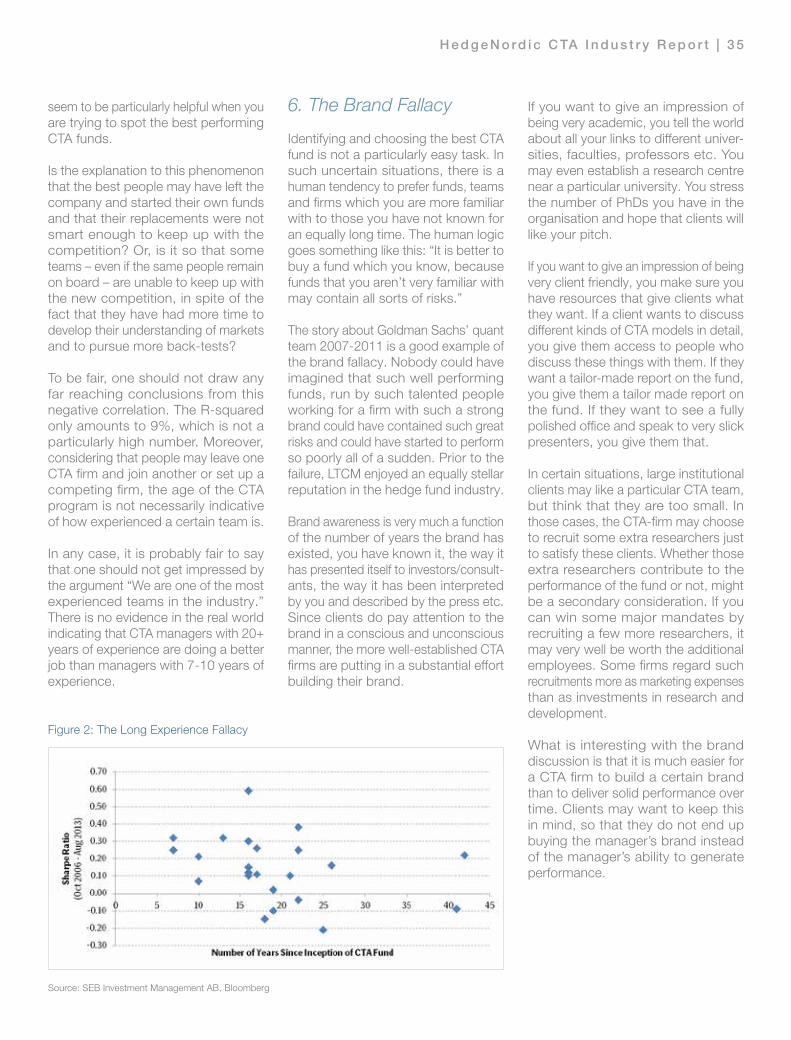
H e d g e N o rd i c C TA I n d u s t r y R e p o r t | 3 5
seem to be particularly helpful when you are trying to spot the best performing CTA funds.
Is the explanation to this phenomenon that the best people may have left the company and started their own funds and that their replacements were not smart enough to keep up with the competition? Or, is it so that some teams – even if the same people remain on board – are unable to keep up with the new competition, in spite of the fact that they have had more time to develop their understanding of markets and to pursue more back-tests?
To be fair, one should not draw any far reaching conclusions from this negative correlation. The R-squared only amounts to 9%, which is not a particularly high number. Moreover, considering that people may leave one CTA firm and join another or set up a competing firm, the age of the CTA program is not necessarily indicative of how experienced a certain team is.
In any case, it is probably fair to say that one should not get impressed by the argument “We are one of the most experienced teams in the industry.” There is no evidence in the real world indicating that CTA managers with 20+ years of experience are doing a better job than managers with 7-10 years of experience.
6. The Brand Fallacy
Identifying and choosing the best CTA fund is not a particularly easy task. In such uncertain situations, there is a human tendency to prefer funds, teams and firms which you are more familiar with to those you have not known for an equally long time. The human logic goes something like this: “It is better to buy a fund which you know, because funds that you aren’t very familiar with may contain all sorts of risks.”
The story about Goldman Sachs’ quant team 2007-2011 is a good example of the brand fallacy. Nobody could have imagined that such well performing funds, run by such talented people working for a firm with such a strong brand could have contained such great risks and could have started to perform so poorly all of a sudden. Prior to the failure, LTCM enjoyed an equally stellar reputation in the hedge fund industry.
Brand awareness is very much a function of the number of years the brand has existed, you have known it, the way it has presented itself to investors/consult-ants, the way it has been interpreted by you and described by the press etc. Since clients do pay attention to the brand in a conscious and unconscious manner, the more well-established CTA firms are putting in a substantial effort building their brand.
If you want to give an impression of being very academic, you tell the world about all your links to different univer-sities, faculties, professors etc. You may even establish a research centre near a particular university. You stress the number of PhDs you have in the organisation and hope that clients will like your pitch.
If you want to give an impression of being very client friendly, you make sure you have resources that give clients what they want. If a client wants to discuss different kinds of CTA models in detail, you give them access to people who discuss these things with them. If they want a tailor-made report on the fund, you give them a tailor made report on the fund. If they want to see a fully polished office and speak to very slick presenters, you give them that.
In certain situations, large institutional clients may like a particular CTA team, but think that they are too small. In those cases, the CTA-firm may choose to recruit some extra researchers just to satisfy these clients. Whether those extra researchers contribute to the performance of the fund or not, might be a secondary consideration. If you can win some major mandates by recruiting a few more researchers, it may very well be worth the additional employees. Some firms regard such recruitments more as marketing expenses than as investments in research and development.
What is interesting with the brand discussion is that it is much easier for a CTA firm to build a certain brand than to deliver solid performance over time. Clients may want to keep this in mind, so that they do not end up buying the manager’s brand instead of the manager’s ability to generate performance.
SEB Asset Selection
5. The Long Experience Fallacy Another human logic is that people with a longer experience should be better at their job than people with a shorter experience. Again, implicit in this logic is the famous ceteris paribus assumption. The hypothesis can be tested by regressing the age of the respective funds to the funds’ respective Sharpe ratio. We have done this in Figure 2. Whether you include all observations or exclude the two observations with the highest and lowest Sharpe ratios, in both cases you get a correlation of about -0.30. In other words, the longer the fund had existed, the lower its risk adjusted return turned out to be (on average). The human logic does not seem to be particularly helpful when you are trying to spot the best performing CTA funds. Is the explanation to this phenomenon that the best people may have left the company and started their own funds and that their replacements were not smart enough to keep up with the competition? Or, is it so that some teams – even if the same people remain on board – are unable to keep up with the new competition, in spite of the fact that they have had more time to develop their understanding of markets and to pursue more back-tests?
another or set up a competing �rm, the age of the CTA program is not necessarily indicative of how experienced a certain team is.
In any case, it is probably fair to say that one should not get impressed by the argument “We are one of the most experienced teams in the industry.” There is no evidence in the real world indicating that CTA managers with 20+ years of experience are doing a better job than managers with 7-10 years of experience. 6. The Brand Fallacy Identifying and choosing the best CTA fund is not a particularly easy task. In such uncertain situations, there is a human tendency to prefer funds, teams and �rms which you are more familiar with to those you have not known for an equally long time. The human logic goes something like this: “It is better to buy a fund which you know, because funds that you aren’t very familiar with may contain all sorts of risks.” The story about Goldman Sachs’ quant team 2007-2011 is a good example of the brand fallacy. Nobody could have imagined that such well performing funds, run by such talented people working for a �rm with such a strong brand could have contained such great risks and could have started to perform so poorly all of a sudden. Prior to the failure, LTCM enjoyed an equally stellar reputation in the hedge fund industry.
interpreted by you and described by the press etc.
Figure 2: The Long Experience Fallacy
Source: SEB Investment Management AB, Bloomberg

3 6 | H e d g e N o rd i c C TA I n d u s t r y R e p o r t
7. The Technology Fallacy
Considering that people running CTA funds belong to one of the more geeky subcultures of society, clients may be fooled to believe that the geekiest people also are the best investment professionals.
So, if a manager wants to project the image being really geeky, what would he/she do? The manager would probably have incomprehensive formulas on whiteboards, lots of monitors, flashing screens and real-time streaming of anything that may have an impact on the financial markets. The manager would talk about the terabytes of data that they have collected, the hundreds of servers they are using, the dedicated data networks they have established and so on.
Clearly, in certain areas of quantitative trading (high frequency trading, HFT) the technological sophistication is indeed a key factor for achieving success. If you were consistently a millisecond slower than the fastest HFT- manager when identifying alpha opportunities and trying to take advantage of them (for example a particular tick change in an instru-ment’s bid- or ask level), you would end up making no money at all, even if you were able to identify all kinds of lucrative alpha sources (do not forget, in the HFT field, the size of each opportunity is very small indeed).
When it comes to CTA strategies, however, it is rather a question of having a certain minimum level of technological capability. This minimum level is still regarded as fairly high by most market participants, but it is nowhere near the technological requirements for successful high frequency trading. For example, a couple of years ago some HFT- managers decided to invest in a completely new, somewhat shorter and therefore 40 milliseconds faster, transatlantic
communication cable between the US and Europe. That kind of billion dollar investment could be the difference between huge success and miserable failure for a HFT-manager. For a CTA manager, however, the project would be totally irrel-evant. CTA managers are not chasing tick opportunities in the high frequency spectrum, but rather trying to forecast market moves over 3-6 months.
Therefore, in the CTA field, investors should be very cautious about drawing conclusions between apparent technological sophistication and the manager’s ability to deliver perfor-mance. To a large degree, the technology show-off is only part of the marketing spiel.
8. The Trading Fallacy
Related to the technology fallacy is the trading fallacy, i.e. the marketing pitch that you can only deliver fantastic CTA performance if you have a state-of-the-art trading capability. This story has typically been pushed by the largest players in the industry, i.e. the ones who are struggling with huge assets under management.
You can look at trading from two different perspectives. First, you can have a situation where you have complete flexibility as to what instrument you trade and when you choose to trade it. If you have done research in the high frequency spectrum of the market and found that you are able to deliver respectable performance from such intra-day trading models, then you add these high frequency models to the group of models that you are running in your CTA fund.
Any CTA team that has gone down this path has a) already chosen to implement or not to implement such high frequency
Hans-Olov Bornemann, Portfolio Manager & Head of SEB Global Quant Team

H e d g e N o rd i c C TA I n d u s t r y R e p o r t | 3 7
models (and they are already part of the observed track record) and b) discovered that the capacity of an intraday model in any case is only a fraction of the capacity of a short term model, which in turn is a fraction of the capacity of medium term or longer term models. In other words, there is no large CTA in the world that is getting a larger portion of its excess returns from high frequency models. If there was, they would not be as highly correlated to the other CTAs as they are.
The second type of trading is directly related to the trans-actions that need to be pursued for the typical models, i.e. the medium to long term trend following models. In this case, there is no flexibility whatsoever to choose a different instrument than the one prescribed by the model. However, there is some flexibility when it comes to the exact timing of the execution. Should you execute directly or should you slice the order into smaller pieces and execute over the day? What will the market impact be in the former case and what is the risk of missing the identified trend in the latter?
Given that you have designed your models to be alpha generating over time and that you have done your homework when it comes to the best timing of your entries and exits, it is quite likely that your execution performance over time will have a negative contribution to the overall return of the fund. On average, you will be chasing the trend. The more time you give yourself for the execution, the more alpha you will miss. It should be quite clear that the market impact and slippage is substantially more negative when executing large orders than when executing small orders. Whether you choose to execute fast or slowly, large AUMs will always be a disadvantage for a manager. The question is only how big the disadvantage it is.
Returning to the state-of-the-art trading argument, one can sum up the discussion in the following way:
For the players who are trying to run their strategies with huge assets under management, slippage is a major source of concern. For them, it is extremely important to have the best trading process available in order not to lose too much of their models’ expected excess returns when pushing large volumes through the markets. For them, reducing slippage is very important.
For medium-sized and smaller CTAs, whose orders can be executed without any substantial delay and without any noticeable market impact, however, execution costs are very limited in the first place. Thus, one could argue that it does not matter whether they are using a very simple trading process or a highly sophisticated one. The market impact will be marginal in both cases.
In summary, the more money you are managing in a CTA programme, the larger the transaction costs will be. This
is true for any and all CTA firms. To the extent that a CTA firm claims that execution is incredibly important and that they are really good in that area, it should be very easy for them to prove these claims via a superior track record, i.e. that their execution costs are not eating up too much of the alpha in their models.
9. The Transparency Fallacy
Imagine a situation where a potential fund investor could get 100% access to all CTA managers’ model specifications, back-testing systems, live-trading systems, quantitative and qualitative decision making processes, IT-development procedures, databases and other IT structures, security solutions, custodian set-ups, regulatory restrictions, detailed CVs of each and every employee and information on all other resources that are used at the CTA firms.
How would the investor go about comparing the different competitors’ models, databases and systems to each other and how would he/she be able to draw any sensible conclusions from this kind of comprehensive research effort?
The investor would certainly get a much better understanding of how much or how little it takes to run a CTA fund. The client would be able to notice and record similarities and differences between IT-architectures, organisations, processes, models, programming languages etc. But how would he/she be able to draw conclusions about the expected future returns of the different funds? Would any of this information be useful at all for forecasting which fund will perform best going forward?
After having dug deeply into the programming code of each CTA manager’s model, i.e. the heart of any CTA fund, it is quite likely that the investor will eventually ask him- or herself: “So what kind of fund performance will come out of all these different models in the end?”
At this point, the investor has two alternative ways to go: a) to compare the Sharpe ratios of the back-tests that each CTA manager has pursued, or b) to compare the historically realised Sharpe ratios, i.e. that have come out of their models in the real world (as opposed to the theoretical back-tests).
As mentioned earlier, depending on how you conduct your quantitative research and if you are suffering from unhealthy internal back-test competition, you may come up with any level of Sharpe ratio in your back-tests. For this reason, you cannot compare Sharpe-ratios of different CTA teams, unless you can secure that the back-tests have been conducted with similar and hopefully very limited amounts of data mining and curve-fitting. This implies that you are back to comparing and analysing past performance. In other words, after having completed your in-depth and
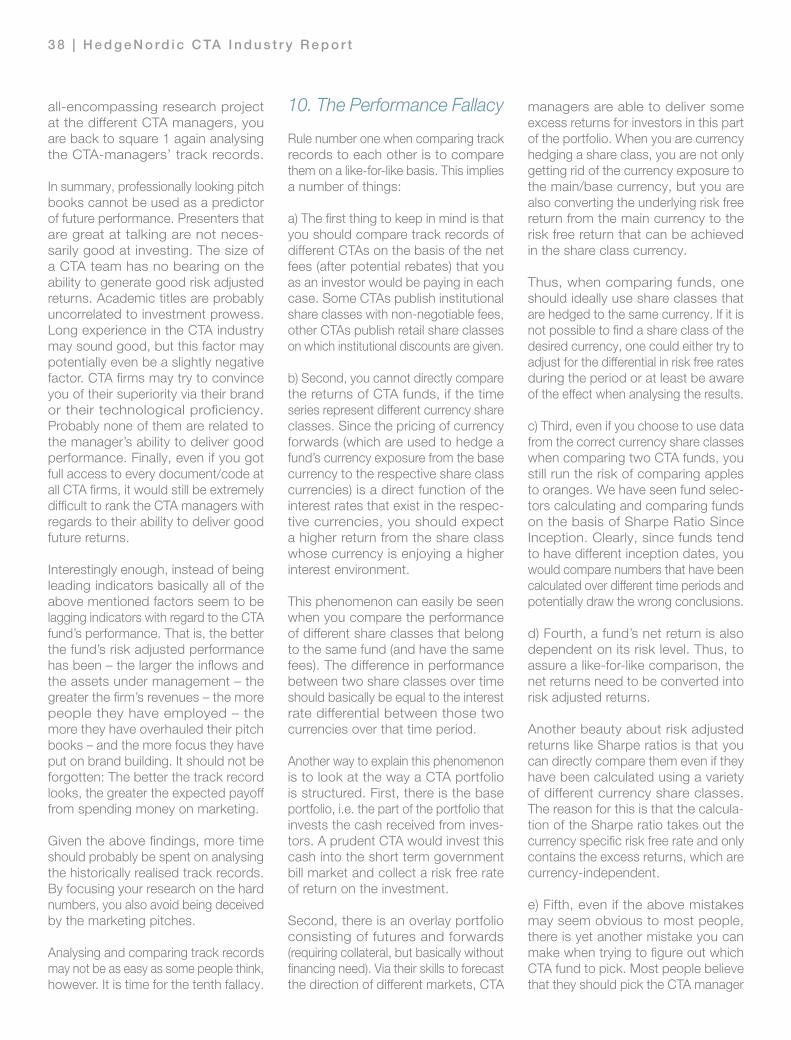
3 8 | H e d g e N o rd i c C TA I n d u s t r y R e p o r t
all-encompassing research project at the different CTA managers, you are back to square 1 again analysing the CTA-managers’ track records.
In summary, professionally looking pitch books cannot be used as a predictor of future performance. Presenters that are great at talking are not neces-sarily good at investing. The size of a CTA team has no bearing on the ability to generate good risk adjusted returns. Academic titles are probably uncorrelated to investment prowess. Long experience in the CTA industry may sound good, but this factor may potentially even be a slightly negative factor. CTA firms may try to convince you of their superiority via their brand or their technological proficiency. Probably none of them are related to the manager’s ability to deliver good performance. Finally, even if you got full access to every document/code at all CTA firms, it would still be extremely difficult to rank the CTA managers with regards to their ability to deliver good future returns.
Interestingly enough, instead of being leading indicators basically all of the above mentioned factors seem to be lagging indicators with regard to the CTA fund’s performance. That is, the better the fund’s risk adjusted performance has been – the larger the inflows and the assets under management – the greater the firm’s revenues – the more people they have employed – the more they have overhauled their pitch books – and the more focus they have put on brand building. It should not be forgotten: The better the track record looks, the greater the expected payoff from spending money on marketing.
Given the above findings, more time should probably be spent on analysing the historically realised track records. By focusing your research on the hard numbers, you also avoid being deceived by the marketing pitches.
Analysing and comparing track records may not be as easy as some people think, however. It is time for the tenth fallacy.
10. The Performance Fallacy
Rule number one when comparing track records to each other is to compare them on a like-for-like basis. This implies a number of things:
a) The first thing to keep in mind is that you should compare track records of different CTAs on the basis of the net fees (after potential rebates) that you as an investor would be paying in each case. Some CTAs publish institutional share classes with non-negotiable fees, other CTAs publish retail share classes on which institutional discounts are given.
b) Second, you cannot directly compare the returns of CTA funds, if the time series represent different currency share classes. Since the pricing of currency forwards (which are used to hedge a fund’s currency exposure from the base currency to the respective share class currencies) is a direct function of the interest rates that exist in the respec-tive currencies, you should expect a higher return from the share class whose currency is enjoying a higher interest environment.
This phenomenon can easily be seen when you compare the performance of different share classes that belong to the same fund (and have the same fees). The difference in performance between two share classes over time should basically be equal to the interest rate differential between those two currencies over that time period.
Another way to explain this phenomenon is to look at the way a CTA portfolio is structured. First, there is the base portfolio, i.e. the part of the portfolio that invests the cash received from inves-tors. A prudent CTA would invest this cash into the short term government bill market and collect a risk free rate of return on the investment.
Second, there is an overlay portfolio consisting of futures and forwards (requiring collateral, but basically without financing need). Via their skills to forecast the direction of different markets, CTA
managers are able to deliver some excess returns for investors in this part of the portfolio. When you are currency hedging a share class, you are not only getting rid of the currency exposure to the main/base currency, but you are also converting the underlying risk free return from the main currency to the risk free return that can be achieved in the share class currency.
Thus, when comparing funds, one should ideally use share classes that are hedged to the same currency. If it is not possible to find a share class of the desired currency, one could either try to adjust for the differential in risk free rates during the period or at least be aware of the effect when analysing the results.
c) Third, even if you choose to use data from the correct currency share classes when comparing two CTA funds, you still run the risk of comparing apples to oranges. We have seen fund selec-tors calculating and comparing funds on the basis of Sharpe Ratio Since Inception. Clearly, since funds tend to have different inception dates, you would compare numbers that have been calculated over different time periods and potentially draw the wrong conclusions.
d) Fourth, a fund’s net return is also dependent on its risk level. Thus, to assure a like-for-like comparison, the net returns need to be converted into risk adjusted returns.
Another beauty about risk adjusted returns like Sharpe ratios is that you can directly compare them even if they have been calculated using a variety of different currency share classes. The reason for this is that the calcula-tion of the Sharpe ratio takes out the currency specific risk free rate and only contains the excess returns, which are currency-independent.
e) Fifth, even if the above mistakes may seem obvious to most people, there is yet another mistake you can make when trying to figure out which CTA fund to pick. Most people believe that they should pick the CTA manager
H e d g e N o rd i c C TA I n d u s t r y R e p o r t | 3 9
with the highest stand-alone Sharpe ratio. When doing it in this way, you are making the assumption (probably unconsciously) that you would invest all of your money into a CTA fund. In reality, however, most clients prefer to keep some of their existing investments, e.g. equities/equity funds, bonds/bond funds, other hedge funds and so on, so that they get an overall diversified portfolio with a number of different exposures.
In such situations, investors should instead try to find the CTA fund that delivers the greatest value to the client’s total portfolio. By calculating the Sharpe ratio (and other statistics you may be interested in) of the overall client portfolio (when including the respective CTA funds one at a time), you will be able to identify which CTA fund has the best fit to your specific portfolio. When doing these portfolio simulations, it is of course important to assure a like-for-like comparison, such that the volatility of the different CTA funds is normalised (put on an equal level). Since excess return is a function of the volatility in the fund, one can scale the excess return of different funds with the relative level of volatility.
It should be noted that the goal of a CTA fund is to be a good ‘Sharpe-booster’ and ‘tail-risk-hedge’ and in the context of a client portfolio. Because of this goal, you should not expect CTA funds to have particularly high stand-alone Sharpe ratios (but you can probably expect the attractive combination of a positive skew and excess kurtosis). In fact, an abnormally high stand-alone Sharpe ratio should instead raise questions. Has the fund drifted away from the pure CTA-strategy? If that is the case, the fund may not be able to protect the client portfolio in a bear market in the same way as it might have done in the past. Notice also that funds that may have boosted the client portfolio Sharpe ratio over a period of time, during which no bear markets developed, may look like a great CTA for a while. However, in years such as 2008 (equity bear market) and 2013 (bond bear market), it becomes pretty
clear which funds actually possess the attractive tail-risk hedge and longer term Sharpe-boosting features.
‘CTA funds’ come in many different flavours today:
1. CTA funds that have stayed true to the classical medium term trend following style, i.e. the strategy that seeks to boost client portfolio Sharpe ratios and protect client portfolios during bear markets by being a statistical – not a perfect – tail-risk hedge
2. funds that are on their way to becoming multi- strategy hedge funds (probably doing so to maximise their stand-alone Sharpe ratio and to be able to handle larger assets under management)
3. the ones that have chosen to become longer term trend followers or who have complemented their CTA- strategy with long only exposures to bonds and/or equities (a style drift prompted by large AUM and/or a desire to maximise stand-alone Sharpe ratio)
4. funds that have chosen to trade the futures markets on a higher frequency, i.e. high frequency traders or short term traders (who strive to be a complement to the medium term trend followers and/or to protect client portfolios from shorter term market corrections – these funds tend to have a fairly limited capacity, though).
In other words, investors who are searching for a classical CTA invest-ment are advised to take a closer look at the different funds before making their decisions.
f) The sixth thing to keep in mind when comparing track records of CTA funds is the following: A like-for-like comparison also requires you to use the same data frequency for all funds. Theoretically, it should not matter if you calculate the annualised volatility on the basis of daily data, weekly data or monthly data. However, because CTA returns are not normally distributed and because they are not independent of each
other, your estimates of the annualised volatility may differ quite considerably depending on whether you use e.g. daily or monthly data in your calcula-tion. In other words, be sure to use the same data frequency for all CTA funds to get a fair comparison, even if some of them offer more frequent valuations than just monthly or weekly data.
g) In summary, investors who keep the 10 potential fallacies in mind when selecting CTAs are likely to make clearly better investment decisions than the ones who buy “good stories”. Great historical performance is not necessarily an indicator of great future performance. However, to the extent that the track record can be explained by alpha (uncorrelated excess returns) rather than beta (market related returns) and to the extent the longer term track record is attributable to the same team and individuals, you should be clearly better off with a fund run by an investment team with a proven long term track record, than with a story teller who is promising a lot but has delivered very little.
Hans-Olov Bornemann
To receive “10 Fallacies to Avoid when Selecting CTA Funds” or “10 Reasons to Invest in CTA Funds”, please contact [email protected].
SEB Global Quant Team
Adam Ahlström-Montille Senior Quantitative Researcher
Mikael Däckfors Senior Quantitative Researcher
Matthias Eriksson Senior Quantitative Researcher
Jan Hillerström Portfolio Manager
Hans-Olov Bornemann Team Head & Portfolio Manager

4 0 | H e d g e N o rd i c C TA I n d u s t r y R e p o r t
“We have a significant allocation to Managed Futures because we believe it complements our overall portfolio in a good way. We do not optimize the hedge fund portfolio as such but rather optimize the contribution of the hedge fund portfolio to the full AP1 mandate”, Martin explains.
According to Martin, the full AP1 mandate has historically had a signficant risk contribution from equities with an allocation of approximately 50 percent. As a consequence, the goal has been to create a hedge fund portfolio that act as a true diversifier to equities, especially in times of market distress.
“The hedge fund portfolio has a relatively high risk appetite in order to have an effect on the overall portfolio, it is also concentrated in terms of the number of managers and under-lying strategies. The idea is to make the total AP1 portfolio as robust as possible. We expect high risk adjusted returns and a significant performance contribution from the hedge fund portfolio when the total fund experiences setbacks”.
Martin highlights that the CTA allocations are made in a highly transparent, cost efficient and controlled manner. “We implement all our CTA allocations in managed account structures in order to get full transparency , control and efficent capital usage and also to make it possible to create bespoke solutions in line with our needs and limitations”.
Commodity restriction
We started by looking at the constituents of three major CTA One important limitation specific to the AP funds is
the constraint to not use commodities. The commodity limitation has not restricted Martin noticeably though last year´s performance was affected negatively as CTAs made significant profits from jumping on the short oil trade.
“We have a lower expected return in our strategies given our limitation not to trade commodities. In 2014 this had a material impact on our returns given that the energy sector offered very good opportunities for CTAs. Despite not trading commodities, the AP1 CTA portfolio managed to beat the Newedge CTA Index even in 2014”, Martin says.
Portfolio Construction
“The AP1 Managed Futures portfolio holds a core of trend following strategies that are complemented by other types
Managed Futures in an institutional investor’s portfolioAs head of alternative investments at AP1, the first Swedish pension buffer fund, Martin Källström has taken a somewhat unconventional approach to institutional hedge fund investing. By allocating a majority of AP1’s 2 billion USD hedge fund assets into Managed Futures strategies, the goal has been to create a portfolio that acts as a true diversifier to the overall portfolio. A portfolio that is heavily linked to equity market risk.
“We expect high risk adjusted returns and a significant
performance contribution from the hedge fund
portfolio when the total fund experiences setbacks”
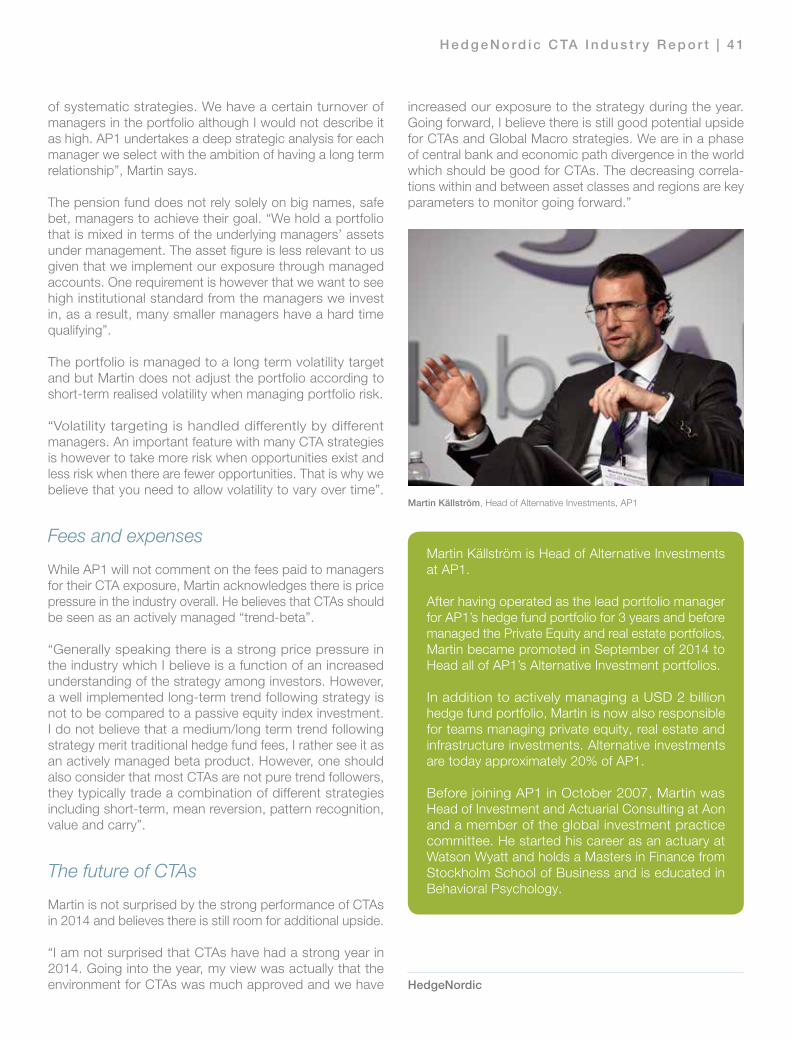
H e d g e N o rd i c C TA I n d u s t r y R e p o r t | 4 1
of systematic strategies. We have a certain turnover of managers in the portfolio although I would not describe it as high. AP1 undertakes a deep strategic analysis for each manager we select with the ambition of having a long term relationship”, Martin says.
The pension fund does not rely solely on big names, safe bet, managers to achieve their goal. “We hold a portfolio that is mixed in terms of the underlying managers’ assets under management. The asset figure is less relevant to us given that we implement our exposure through managed accounts. One requirement is however that we want to see high institutional standard from the managers we invest in, as a result, many smaller managers have a hard time qualifying”.
The portfolio is managed to a long term volatility target and but Martin does not adjust the portfolio according to short-term realised volatility when managing portfolio risk.
“Volatility targeting is handled differently by different managers. An important feature with many CTA strategies is however to take more risk when opportunities exist and less risk when there are fewer opportunities. That is why we believe that you need to allow volatility to vary over time”.
Fees and expenses
While AP1 will not comment on the fees paid to managers for their CTA exposure, Martin acknowledges there is price pressure in the industry overall. He believes that CTAs should be seen as an actively managed “trend-beta”.
“Generally speaking there is a strong price pressure in the industry which I believe is a function of an increased understanding of the strategy among investors. However, a well implemented long-term trend following strategy is not to be compared to a passive equity index investment. I do not believe that a medium/long term trend following strategy merit traditional hedge fund fees, I rather see it as an actively managed beta product. However, one should also consider that most CTAs are not pure trend followers, they typically trade a combination of different strategies including short-term, mean reversion, pattern recognition, value and carry”.
The future of CTAs
Martin is not surprised by the strong performance of CTAs in 2014 and believes there is still room for additional upside.
“I am not surprised that CTAs have had a strong year in 2014. Going into the year, my view was actually that the environment for CTAs was much approved and we have
increased our exposure to the strategy during the year. Going forward, I believe there is still good potential upside for CTAs and Global Macro strategies. We are in a phase of central bank and economic path divergence in the world which should be good for CTAs. The decreasing correla-tions within and between asset classes and regions are key parameters to monitor going forward.”
Martin Källström is Head of Alternative Investments at AP1.
After having operated as the lead portfolio manager for AP1’s hedge fund portfolio for 3 years and before managed the Private Equity and real estate portfolios, Martin became promoted in September of 2014 to Head all of AP1’s Alternative Investment portfolios.
In addition to actively managing a USD 2 billion hedge fund portfolio, Martin is now also responsible for teams managing private equity, real estate and infrastructure investments. Alternative investments are today approximately 20% of AP1.
Before joining AP1 in October 2007, Martin was Head of Investment and Actuarial Consulting at Aon and a member of the global investment practice committee. He started his career as an actuary at Watson Wyatt and holds a Masters in Finance from Stockholm School of Business and is educated in Behavioral Psychology.
HedgeNordic
Martin Källström, Head of Alternative Investments, AP1
4 2 | H e d g e N o rd i c C TA I n d u s t r y R e p o r t
UNTIL LACK OF TRENDS AND HIGH
CORRELATION DO US APART
Finding the right benchmark for a strategy that has no structural market beta (managed futures can be either long or short in all asset classes) is not straightforward. In order to push the understanding of CTA performance further, Lyxor has built two indices based on one-year rolling daily risk and return observations of over 60 futures contracts (all sectors). The two indices, which assess market correlation and trends, have to be looked at jointly in order to analyse past performance of trend-followers.
The Lyxor Epsilon Trend Index measures the average market trendiness of markets. A high value means high direction-ality, either downward or upward. A value close to zero corresponds to a regime when most markets are trading randomly. A low value means that markets are rangy on average (mean-reverting). The latter runs against the logic of a trend-follower.
The Lyxor Epsilon Correlation Index is based on a factor analysis, indicating the correlation level amongst the under-lying contracts. A low value means that markets tend to move independently. A high value means that markets tend to move in lockstep, hence undermining the law of large number on which trend followers rely to churn out returns.
Figure 1 compares the one-year rolling performance of the Newedge Trend Index (average performance of the largest trend-followers) with our two indices. One can observe that when the Correlation Index is low, trendiness fairly explains the performance of CTAs. It was the case until 2007, and again in 2014.
This simple relationship disappeared in 2007 only to reappear in 2013. In 2008, a few large trends (bonds, equities, curren-
Trend followers in for the long run 2008 was a memorable year for trend-following CTAs. While equity and credit markets crashed, leaving most hedge funds with unprecedented losses, trend-followers ended the year up 20%. While many hedge funds were forced to gate redemptions, issue side-pockets, or even liquidate, CTAs were shining with supra-liquid portfolios of futures contracts.
Not surprisingly, inflows followed. But after two years of reasonable performance, 2011 was disappointing. 2012 was not good at all. Outflows followed. Bad press culminated in 2013: “models are broken; the strategy is outdated; only brokers make money…”
2013 was a mixed year. The large dispersion of returns seemed to point to the model improvements by some CTAs, while others did not budge and stuck to their old model. Eventually, 2014 was a very good year for almost everyone. Good press came again, and inflows resumed.
A FOOLPROOF STRATEGY?
Trend-following exploits a market phenomenon that seems to fly in the face of the efficient market hypothesis: the auto-correlation of returns. This means that an asset that has gone up (down) is more likely to go up (down) afterwards. Delay by market participants such as hedgers, speculators, or long-term investors in adjusting their positions following price variations is often identified as a root cause of such phenomenon.
In seeking to derive value from trends, trend-following strat-egies do not play the same game as fundamental-driven strategies. They are agnostic about the fair value of an asset. Their challenge is to make the correct statistical and factor analysis of price dynamics (based on past returns, volatili-ties and correlations) so as to filter-out noise and spot price directions. Over / under-valuation is not a criteria.
Capturing a given statistical property involves applying the law of large numbers. For a CTA, applying the law of large numbers means trading multiple markets. It takes into account that each trade may be wrong. All in all, a trend-follower is probably one of the least arrogant investor.
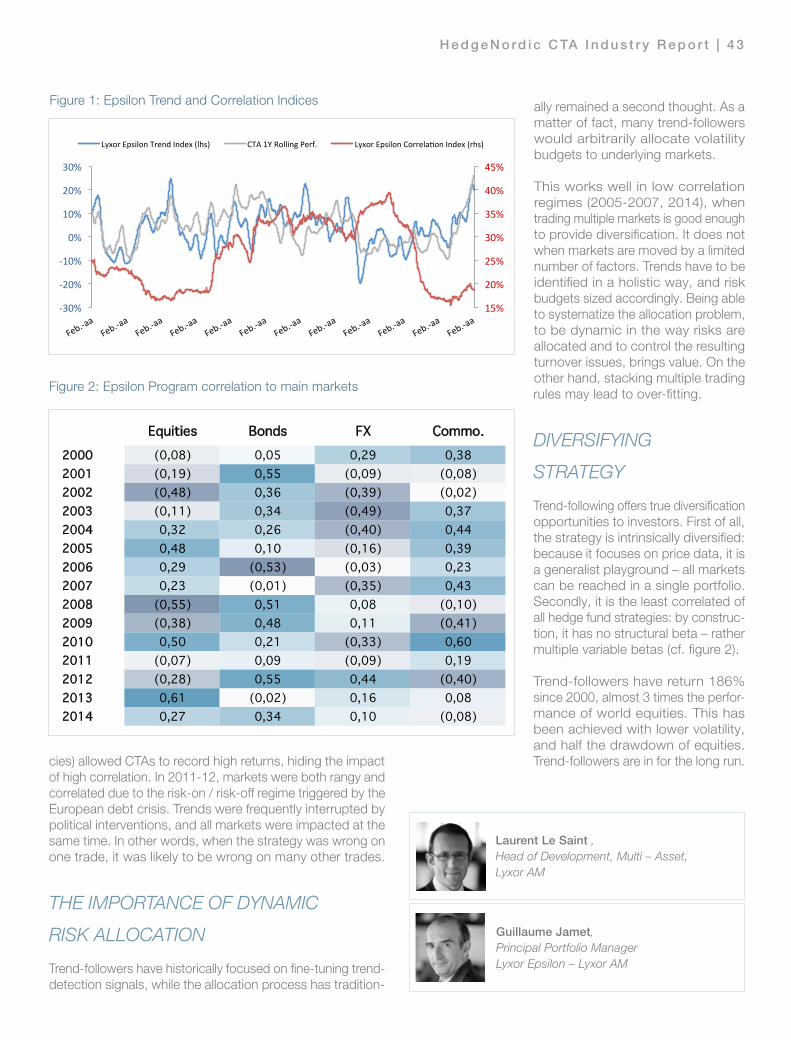
H e d g e N o rd i c C TA I n d u s t r y R e p o r t | 4 3
ally remained a second thought. As a matter of fact, many trend-followers would arbitrarily allocate volatility budgets to underlying markets.
This works well in low correlation regimes (2005-2007, 2014), when trading multiple markets is good enough to provide diversification. It does not when markets are moved by a limited number of factors. Trends have to be identified in a holistic way, and risk budgets sized accordingly. Being able to systematize the allocation problem, to be dynamic in the way risks are allocated and to control the resulting turnover issues, brings value. On the other hand, stacking multiple trading rules may lead to over-fitting.
DIVERSIFYING
STRATEGY
Trend-following offers true diversification opportunities to investors. First of all, the strategy is intrinsically diversified: because it focuses on price data, it is a generalist playground – all markets can be reached in a single portfolio. Secondly, it is the least correlated of all hedge fund strategies: by construc-tion, it has no structural beta – rather multiple variable betas (cf. figure 2).
Trend-followers have return 186% since 2000, almost 3 times the perfor-mance of world equities. This has been achieved with lower volatility, and half the drawdown of equities. Trend-followers are in for the long run.cies) allowed CTAs to record high returns, hiding the impact
of high correlation. In 2011-12, markets were both rangy and correlated due to the risk-on / risk-off regime triggered by the European debt crisis. Trends were frequently interrupted by political interventions, and all markets were impacted at the same time. In other words, when the strategy was wrong on one trade, it was likely to be wrong on many other trades.
THE IMPORTANCE OF DYNAMIC
RISK ALLOCATION
Trend-followers have historically focused on fine-tuning trend-detection signals, while the allocation process has tradition-
15%
20%
25%
30%
35%
40%
45%
-‐30%
-‐20%
-‐10%
0%
10%
20%
30%
Lyxor Epsilon Trend Index (lhs) CTA 1Y Rolling Perf. Lyxor Epsilon CorrelaEon Index (rhs)
Figure 1: Epsilon Trend and Correlation Indices
Figure 2. Epsilon Program correlation vs. main markets
Equities Bonds FX Commo.2000 (0,08) 0,05 0,29 0,382001 (0,19) 0,55 (0,09) (0,08)2002 (0,48) 0,36 (0,39) (0,02)2003 (0,11) 0,34 (0,49) 0,372004 0,32 0,26 (0,40) 0,442005 0,48 0,10 (0,16) 0,392006 0,29 (0,53) (0,03) 0,232007 0,23 (0,01) (0,35) 0,432008 (0,55) 0,51 0,08 (0,10)2009 (0,38) 0,48 0,11 (0,41)2010 0,50 0,21 (0,33) 0,602011 (0,07) 0,09 (0,09) 0,192012 (0,28) 0,55 0,44 (0,40)2013 0,61 (0,02) 0,16 0,082014 0,27 0,34 0,10 (0,08)
Figure 2: Epsilon Program correlation to main markets
Laurent Le Saint , Head of Development, Multi – Asset, Lyxor AM
Guillaume Jamet, Principal Portfolio Manager Lyxor Epsilon – Lyxor AM
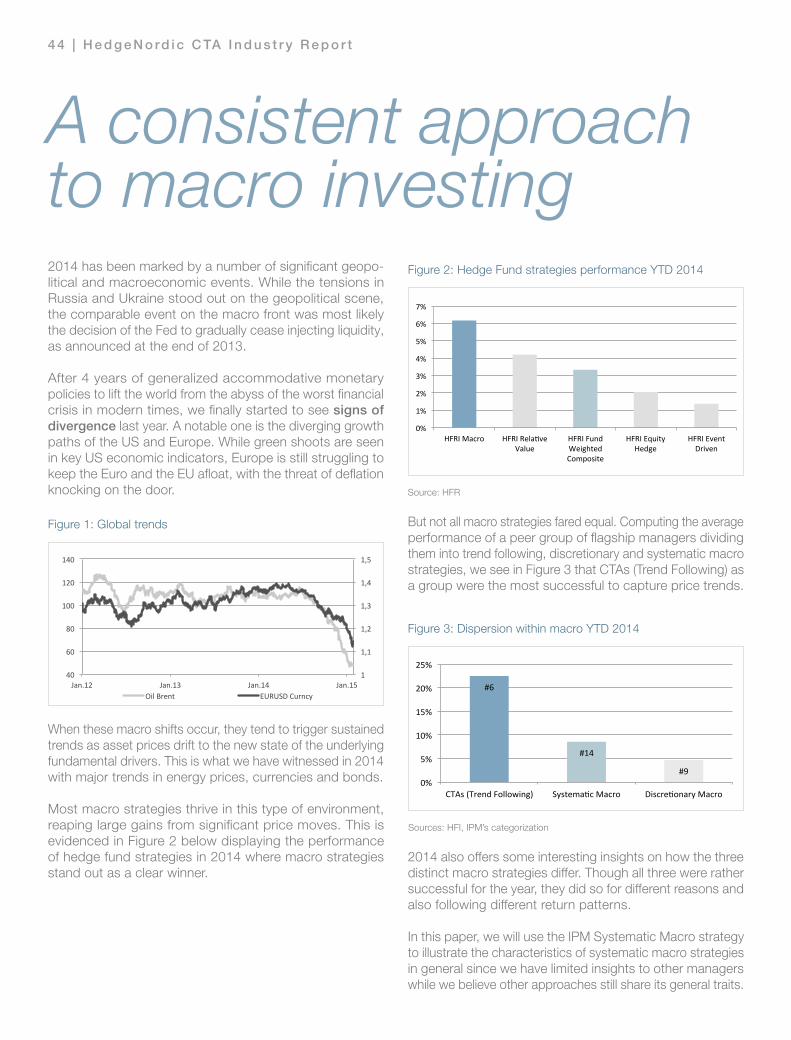
4 4 | H e d g e N o rd i c C TA I n d u s t r y R e p o r t
But not all macro strategies fared equal. Computing the average performance of a peer group of flagship managers dividing them into trend following, discretionary and systematic macro strategies, we see in Figure 3 that CTAs (Trend Following) as a group were the most successful to capture price trends.
2014 also offers some interesting insights on how the three distinct macro strategies differ. Though all three were rather successful for the year, they did so for different reasons and also following different return patterns.
In this paper, we will use the IPM Systematic Macro strategy to illustrate the characteristics of systematic macro strategies in general since we have limited insights to other managers while we believe other approaches still share its general traits.
A consistent approach to macro investing2014 has been marked by a number of significant geopo-litical and macroeconomic events. While the tensions in Russia and Ukraine stood out on the geopolitical scene, the comparable event on the macro front was most likely the decision of the Fed to gradually cease injecting liquidity, as announced at the end of 2013.
After 4 years of generalized accommodative monetary policies to lift the world from the abyss of the worst financial crisis in modern times, we finally started to see signs of divergence last year. A notable one is the diverging growth paths of the US and Europe. While green shoots are seen in key US economic indicators, Europe is still struggling to keep the Euro and the EU afloat, with the threat of deflation knocking on the door.
When these macro shifts occur, they tend to trigger sustained trends as asset prices drift to the new state of the underlying fundamental drivers. This is what we have witnessed in 2014 with major trends in energy prices, currencies and bonds. Most macro strategies thrive in this type of environment, reaping large gains from significant price moves. This is evidenced in Figure 2 below displaying the performance of hedge fund strategies in 2014 where macro strategies stand out as a clear winner.
Systematic Macro, a consistent approach to macro investing
2014 has been marked by a number of significant geopolitical and macroeconomic events. While the tensions in Russia and Ukraine stood out on the geopolitical scene, the comparable event on the macro front was most likely the decision of the Fed to gradually cease injecting liquidity, as announced at the end of 2013. After 4 years of generalized accommodative monetary policies to lift the world from the abyss of the worst financial crisis in modern times, we finally started to see signs of divergence last year. A notable one is the diverging growth paths of the US and Europe. While green shoots are seen in key US economic indicators, Europe is still struggling to keep the Euro and the EU afloat, with the threat of deflation knocking on the door.
Figure 1 Global trends
When these macro shifts occur, they tend to trigger sustained trends as asset prices drift to the new state of the underlying fundamental drivers. This is what we have witnessed in 2014 with major trends in energy prices, currencies and bonds.
Most macro strategies thrive in this type of environment, reaping large gains from significant price moves. This is evidenced in Figure 2 below displaying the performance of hedge fund strategies in 2014 where macro strategies stand out as a clear winner.
Figure 2: Hedge Fund strategy performance
But not all macro strategies fared equal. Computing the average performance of a peer group of flagship managers dividing them into trend following, discretionary and systematic macro strategies, we see in Figure 3 that CTAs (Trend Following) as a group were the most successful to capture price trends.
1
1,1
1,2
1,3
1,4
1,5
40
60
80
100
120
140
Jan.12 Jan.13 Jan.14 Jan.15 Oil Brent EURUSD Curncy
0%
1%
2%
3%
4%
5%
6%
7%
HFRI Macro HFRI RelaYve Value
HFRI Fund Weighted Composite
HFRI Equity Hedge
HFRI Event Driven
Figure 1: Global trends
0%
1%
2%
3%
4%
5%
6%
7%
HFRI Macro HFRI Rela6ve Value
HFRI Fund Weighted Composite
HFRI Equity Hedge
HFRI Event Driven
Figure 2: Hedge Fund strategies performance YTD 2014
#6
#14
#9 0%
5%
10%
15%
20%
25%
CTAs (Trend Following) Systema@c Macro Discre@onary Macro
Figure 3: Dispersion within macro YTD 2014
Source: HFR
Sources: HFI, IPM’s categorization
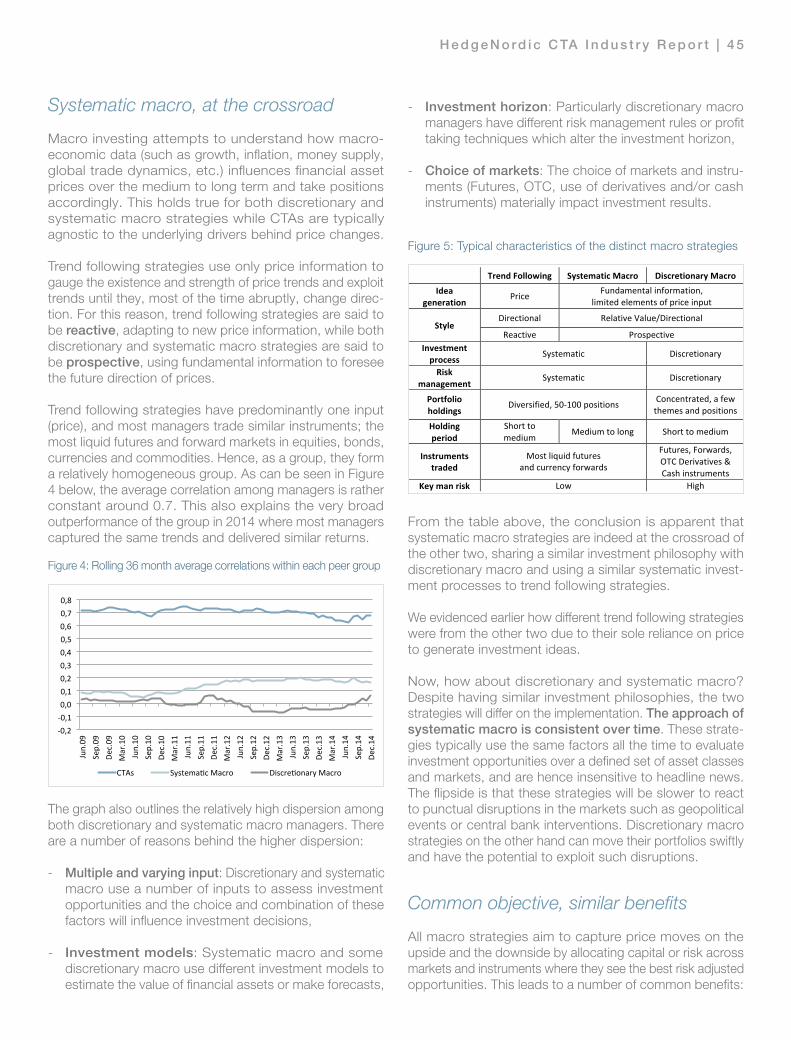
H e d g e N o rd i c C TA I n d u s t r y R e p o r t | 4 5
Systematic macro, at the crossroad
Macro investing attempts to understand how macro-economic data (such as growth, inflation, money supply, global trade dynamics, etc.) influences financial asset prices over the medium to long term and take positions accordingly. This holds true for both discretionary and systematic macro strategies while CTAs are typically agnostic to the underlying drivers behind price changes.
Trend following strategies use only price information to gauge the existence and strength of price trends and exploit trends until they, most of the time abruptly, change direc-tion. For this reason, trend following strategies are said to be reactive, adapting to new price information, while both discretionary and systematic macro strategies are said to be prospective, using fundamental information to foresee the future direction of prices.
Trend following strategies have predominantly one input (price), and most managers trade similar instruments; the most liquid futures and forward markets in equities, bonds, currencies and commodities. Hence, as a group, they form a relatively homogeneous group. As can be seen in Figure 4 below, the average correlation among managers is rather constant around 0.7. This also explains the very broad outperformance of the group in 2014 where most managers captured the same trends and delivered similar returns.
The graph also outlines the relatively high dispersion among both discretionary and systematic macro managers. There are a number of reasons behind the higher dispersion:
- Multiple and varying input: Discretionary and systematic macro use a number of inputs to assess investment opportunities and the choice and combination of these factors will influence investment decisions,
- Investment models: Systematic macro and some discretionary macro use different investment models to estimate the value of financial assets or make forecasts,
- Investment horizon: Particularly discretionary macro managers have different risk management rules or profit taking techniques which alter the investment horizon,
- Choice of markets: The choice of markets and instru- ments (Futures, OTC, use of derivatives and/or cash instruments) materially impact investment results.
From the table above, the conclusion is apparent that systematic macro strategies are indeed at the crossroad of the other two, sharing a similar investment philosophy with discretionary macro and using a similar systematic invest-ment processes to trend following strategies.
We evidenced earlier how different trend following strategies were from the other two due to their sole reliance on price to generate investment ideas.
Now, how about discretionary and systematic macro? Despite having similar investment philosophies, the two strategies will differ on the implementation. The approach of systematic macro is consistent over time. These strate-gies typically use the same factors all the time to evaluate investment opportunities over a defined set of asset classes and markets, and are hence insensitive to headline news. The flipside is that these strategies will be slower to react to punctual disruptions in the markets such as geopolitical events or central bank interventions. Discretionary macro strategies on the other hand can move their portfolios swiftly and have the potential to exploit such disruptions.
Common objective, similar benefits
All macro strategies aim to capture price moves on the upside and the downside by allocating capital or risk across markets and instruments where they see the best risk adjusted opportunities. This leads to a number of common benefits:
-‐0,2 -‐0,1 0,0 0,1 0,2 0,3 0,4 0,5 0,6 0,7 0,8
Jun.09
Sep.09
Dec.09
Mar.10
Jun.10
Sep.10
Dec.10
Mar.11
Jun.11
Sep.11
Dec.11
Mar.12
Jun.12
Sep.12
Dec.12
Mar.13
Jun.13
Sep.13
Dec.13
Mar.14
Jun.14
Sep.14
Dec.14
CTAs SystemaAc Macro DiscreAonary Macro
Figure 4: Rolling 36 month average correlations within each peer group
Trend Following Systematic Macro Discretionary Macro Idea
generation Price Fundamental information,
limited elements of price input
Style Directional Relative Value/Directional
Reactive Prospective Investment process
Systematic Discretionary
Risk management
Systematic Discretionary
Portfolio holdings
Diversified, 50-‐100 positions Concentrated, a few themes and positions
Holding period
Short to medium
Medium to long Short to medium
Instruments traded
Most liquid futures and currency forwards
Futures, Forwards, OTC Derivatives & Cash instruments
Key man risk Low High
Figure 5: Typical characteristics of the distinct macro strategies

4 6 | H e d g e N o rd i c C TA I n d u s t r y R e p o r t
- Liquidity: Macro strategies are for the best part imple- mented using the most liquid exchange-traded futures and forwards on equity indices, government bonds, currencies and commodities. In addition to providing the highest liquidity, these instruments also offer transparent pricing, minimize counterparty risk, and offer efficiency of execution at a minimum cost.
Outlook
Most macro strategies have struggled since the aftermath of the global financial crisis, exhibiting sub-par performance compared to what has been achieved historically. The lack of performance has been predominantly associated with the action of central banks, which has driven the cross asset correlations to very high levels.
Recently, this pattern has reversed, particularly since the end of 2013, where our own dispersion indicator shows that correlations have decreased to the levels prevailing before the global financial crisis. As we now see clear evidence in diverging macro-economic fundamentals, and as a result the potential for more diverging central bank policies, dispersion has rebounded to provide a further improved investment environment for many macro strategies. This has been confirmed during the past 12-18 months with renewed strong outperformance.
- Diversification: Low to no correlation to long only equities or bonds as well as other alternative investment strate- gies as a consequence of the dynamic allocation across markets and the ability to exploit prolonged bear markets. This is illustrated in Figure 6, which shows the correlation to global equities over time.
- Milder drawdowns: Rigorous risk management processes and high portfolio diversification leads to superior drawdown control as illustrated in Figure 7, especially in relation to realized risk.
- Transparency: Most macro managers fully disclose positions to investors and a number of managers, as illustrated in Figure 8 below, can also disclose the drivers behind each position.
-‐1,0
-‐0,8
-‐0,6
-‐0,4
-‐0,2
0,0
0,2
0,4
0,6
0,8
1,0
Jun.
09
Sep.
09
Dec.
09
Mar
.10
Jun.
10
Sep.
10
Dec.
10
Mar
.11
Jun.
11
Sep.
11
Dec.
11
Mar
.12
Jun.
12
Sep.
12
Dec.
12
Mar
.13
Jun.
13
Sep.
13
Dec.
13
Mar
.14
Jun.
14
Sep.
14
Dec.
14
CTAs Systema?c Macro Discre?onary Macro HFRI Fund Weighted Composite
Figure 6: Rolling 36 month correlation vs. MSCI World
0,0 0,5 1,0 1,5 2,0 2,5 3,0 3,5 4,0 4,5
HFRI Macro HFRI Fund Weighted Composite
HFRI Equity Hedge
MSCI Daily TR Net World
USD
HFRI Event-‐Driven
HFRI RelaJve Value
Figure 7: Ratio maximum drawdown to annualized volatility
Total Valua)on Risk Premium Market Dynamics Macroeconomic
Figure 8: Breakdown of positions by investment theme, source IPM.
-‐ 0,40
-‐ 0,20
0,00
0,20
0,40
0,60
0,80
1990 1991 1992 1993 1994 1995 1996 1997 1998 1999 2000 2001 2002 2003 2004 2005 2006 2007 2008 2009 2010 2011 2012 2013
Annu
alized
Gross Return
Implied Correla9ons (low correla9on = high dispersion)
Figure 9: IPM’s proprietary dispersion indicator over the past 25 years
Serge Houles, CFA, FRM, Director, Head of Investment StrategyIPM Informed Portfolio Management
Patrik Blomdahl, Director, Investment Strategy IPM Informed Portfolio Management

H e d g e N o rd i c C TA I n d u s t r y R e p o r t | 4 7
For Investment professionals only. Not for public distribution. The value of an investment and any income derived from it can go down as well as up and investors may not get back their original amount invested. Alternative investments can involve signifi cant additional risks.
This material is for information purposes only and does not constitute an offer or invitation to invest in any product for which any Man Group plc affi liate provides investment advisory or any other services. The content is not intended to constitute advice of any nature nor an investment recommendation or opinion regarding the appropriateness or suitability of any investment or strategy and does not consider the particular circumstances specifi c to any individual recipient to whom this material has been sent.
Unless otherwise stated the source of all information is Man Group and its affi liates as 31 December 2014.
This material was prepared by AHL Partners LLP (company number OC380907) which is registered in England and Wales at Riverbank House, 2 Swan Lane, London, EC4R 3AD. Authorised and regulated in the UK by the Financial Conduct Authority. This material is distributed pursuant to global distribution and advisory agreements by subsidiaries of Man Group plc. Unless indicated otherwise this material is communicated in the European Union by GLG Partners LP which is authorised and regulated in the UK by the Financial Conduct Authority.
The value of an investment and any income derived from it can go down as well as up and investors may not get back their original amount invested. Alternative investments can involve signifi cant additional risks.
This material is not suitable for US persons
This material is proprietary information and may not be reproduced or otherwise disseminated in whole or in part without prior written consent. Any data services and information available from public sources used in the creation of this material are believed to be reliable. However accuracy is not warranted or guaranteed. © Man 2015 UK/15/0178-P
Man AHL was established in 1987 and is a world-leading managed futures investment manager. It is part of Man Group Plc, one of the world’s largest publicly listed hedge fund providers, with offi ces in London, New York, Tokyo and other major cities of the world. Through the application of scientifi c research to fi nancial markets we develop proprietary models designed to exploit price trends and other persistent patterns in market behaviour. We offer investors diverse trading programmes, with access to a very broad array of instruments ranging from futures & FX, to equities, swaps and listed options. Our institutional infrastructure and the resources of Man Group allow us to offer innovative customised solutions to a wide range of professional clients.
Trading programmes
AHL Diversifi ed Programme: A highly diversifi ed portfolio of over 300 markets, focusing on momentum-based strategies on listed futures and OTC markets
AHL Evolution Programme: Applies momentum trading strategies to more than 150 non-traditional CTA markets including interest rate swaps, credit, options and cash equities
AHL Dimension Programme: A quantitative multi-strategy portfolio providing access to Man AHL’s full suite of systematic technical, fundamental and momentum strategies
RESEARCHING AND DEVELOPING MANAGED FUTURES PROGRAMMES
FOR MORE THAN A QUARTER OF A CENTURY
www.ahl.com
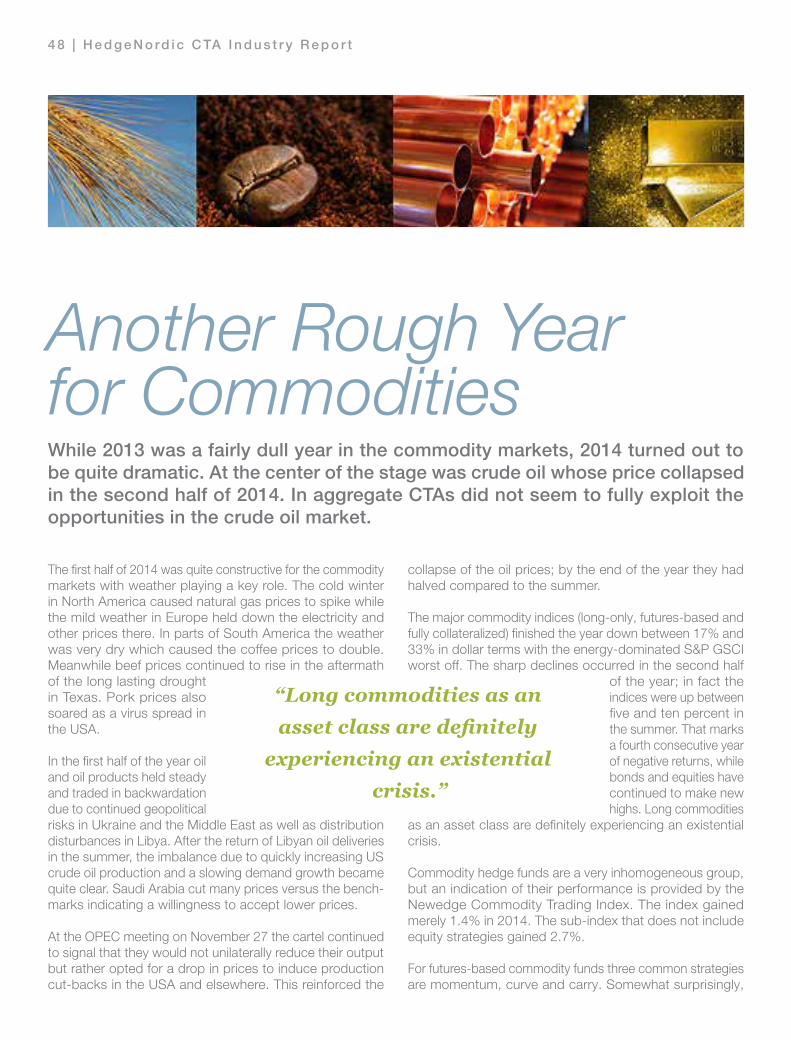
4 8 | H e d g e N o rd i c C TA I n d u s t r y R e p o r t
While 2013 was a fairly dull year in the commodity markets, 2014 turned out to be quite dramatic. At the center of the stage was crude oil whose price collapsed in the second half of 2014. In aggregate CTAs did not seem to fully exploit the opportunities in the crude oil market.
The first half of 2014 was quite constructive for the commodity markets with weather playing a key role. The cold winter in North America caused natural gas prices to spike while the mild weather in Europe held down the electricity and other prices there. In parts of South America the weather was very dry which caused the coffee prices to double. Meanwhile beef prices continued to rise in the aftermath of the long lasting drought in Texas. Pork prices also soared as a virus spread in the USA.
In the first half of the year oil and oil products held steady and traded in backwardation due to continued geopolitical risks in Ukraine and the Middle East as well as distribution disturbances in Libya. After the return of Libyan oil deliveries in the summer, the imbalance due to quickly increasing US crude oil production and a slowing demand growth became quite clear. Saudi Arabia cut many prices versus the bench-marks indicating a willingness to accept lower prices.
At the OPEC meeting on November 27 the cartel continued to signal that they would not unilaterally reduce their output but rather opted for a drop in prices to induce production cut-backs in the USA and elsewhere. This reinforced the
collapse of the oil prices; by the end of the year they had halved compared to the summer.
The major commodity indices (long-only, futures-based and fully collateralized) finished the year down between 17% and 33% in dollar terms with the energy-dominated S&P GSCI worst off. The sharp declines occurred in the second half
of the year; in fact the indices were up between five and ten percent in the summer. That marks a fourth consecutive year of negative returns, while bonds and equities have continued to make new highs. Long commodities
as an asset class are definitely experiencing an existential crisis.
Commodity hedge funds are a very inhomogeneous group, but an indication of their performance is provided by the Newedge Commodity Trading Index. The index gained merely 1.4% in 2014. The sub-index that does not include equity strategies gained 2.7%.
For futures-based commodity funds three common strategies are momentum, curve and carry. Somewhat surprisingly,
Another Rough Year for Commodities
“Long commodities as an asset class are definitely
experiencing an existential crisis.”
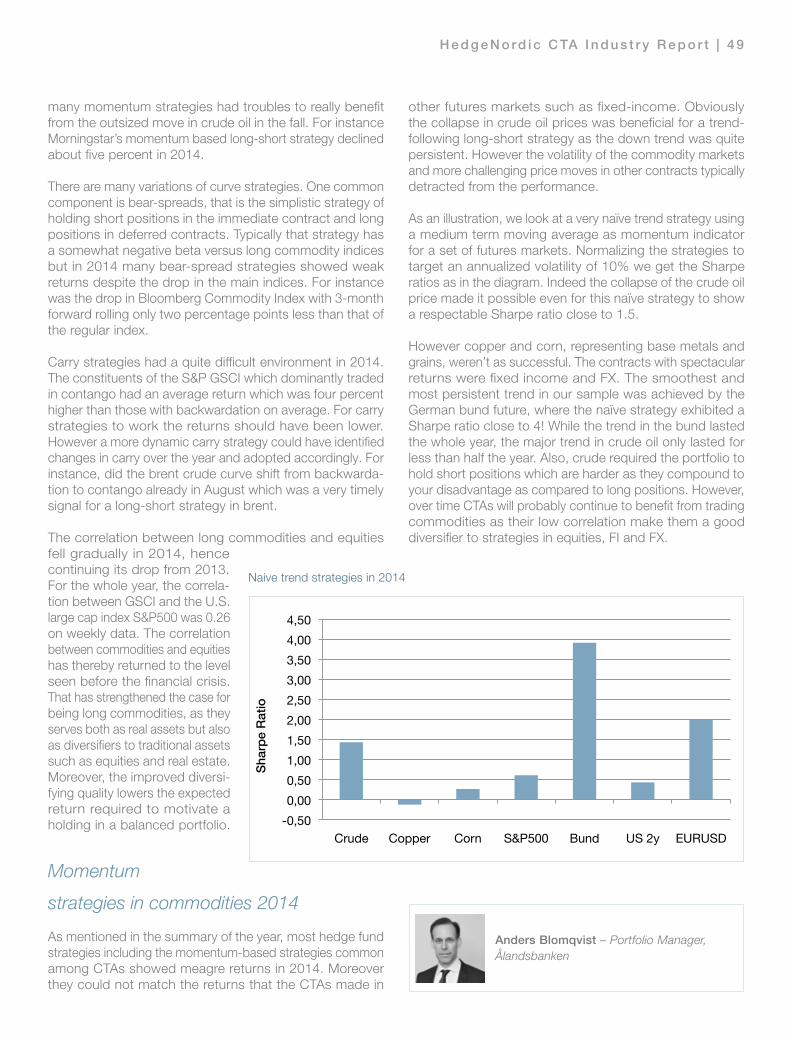
H e d g e N o rd i c C TA I n d u s t r y R e p o r t | 4 9
many momentum strategies had troubles to really benefit from the outsized move in crude oil in the fall. For instance Morningstar’s momentum based long-short strategy declined about five percent in 2014.
There are many variations of curve strategies. One common component is bear-spreads, that is the simplistic strategy of holding short positions in the immediate contract and long positions in deferred contracts. Typically that strategy has a somewhat negative beta versus long commodity indices but in 2014 many bear-spread strategies showed weak returns despite the drop in the main indices. For instance was the drop in Bloomberg Commodity Index with 3-month forward rolling only two percentage points less than that of the regular index. Carry strategies had a quite difficult environment in 2014. The constituents of the S&P GSCI which dominantly traded in contango had an average return which was four percent higher than those with backwardation on average. For carry strategies to work the returns should have been lower. However a more dynamic carry strategy could have identified changes in carry over the year and adopted accordingly. For instance, did the brent crude curve shift from backwarda-tion to contango already in August which was a very timely signal for a long-short strategy in brent.
The correlation between long commodities and equities fell gradually in 2014, hence continuing its drop from 2013. For the whole year, the correla-tion between GSCI and the U.S. large cap index S&P500 was 0.26 on weekly data. The correlation between commodities and equities has thereby returned to the level seen before the financial crisis. That has strengthened the case for being long commodities, as they serves both as real assets but also as diversifiers to traditional assets such as equities and real estate. Moreover, the improved diversi-fying quality lowers the expected return required to motivate a holding in a balanced portfolio.
Momentum
strategies in commodities 2014
As mentioned in the summary of the year, most hedge fund strategies including the momentum-based strategies common among CTAs showed meagre returns in 2014. Moreover they could not match the returns that the CTAs made in
other futures markets such as fixed-income. Obviously the collapse in crude oil prices was beneficial for a trend-following long-short strategy as the down trend was quite persistent. However the volatility of the commodity markets and more challenging price moves in other contracts typically detracted from the performance.
As an illustration, we look at a very naïve trend strategy using a medium term moving average as momentum indicator for a set of futures markets. Normalizing the strategies to target an annualized volatility of 10% we get the Sharpe ratios as in the diagram. Indeed the collapse of the crude oil price made it possible even for this naïve strategy to show a respectable Sharpe ratio close to 1.5.
However copper and corn, representing base metals and grains, weren’t as successful. The contracts with spectacular returns were fixed income and FX. The smoothest and most persistent trend in our sample was achieved by the German bund future, where the naïve strategy exhibited a Sharpe ratio close to 4! While the trend in the bund lasted the whole year, the major trend in crude oil only lasted for less than half the year. Also, crude required the portfolio to hold short positions which are harder as they compound to your disadvantage as compared to long positions. However, over time CTAs will probably continue to benefit from trading commodities as their low correlation make them a good diversifier to strategies in equities, FI and FX.
Anders Blomqvist – Portfolio Manager, Ålandsbanken
-0,50 0,00 0,50 1,00 1,50 2,00 2,50 3,00 3,50 4,00 4,50
Crude Copper Corn S&P500 Bund US 2y EURUSD
Shar
pe R
atio!
Naive trend strategies in 2014
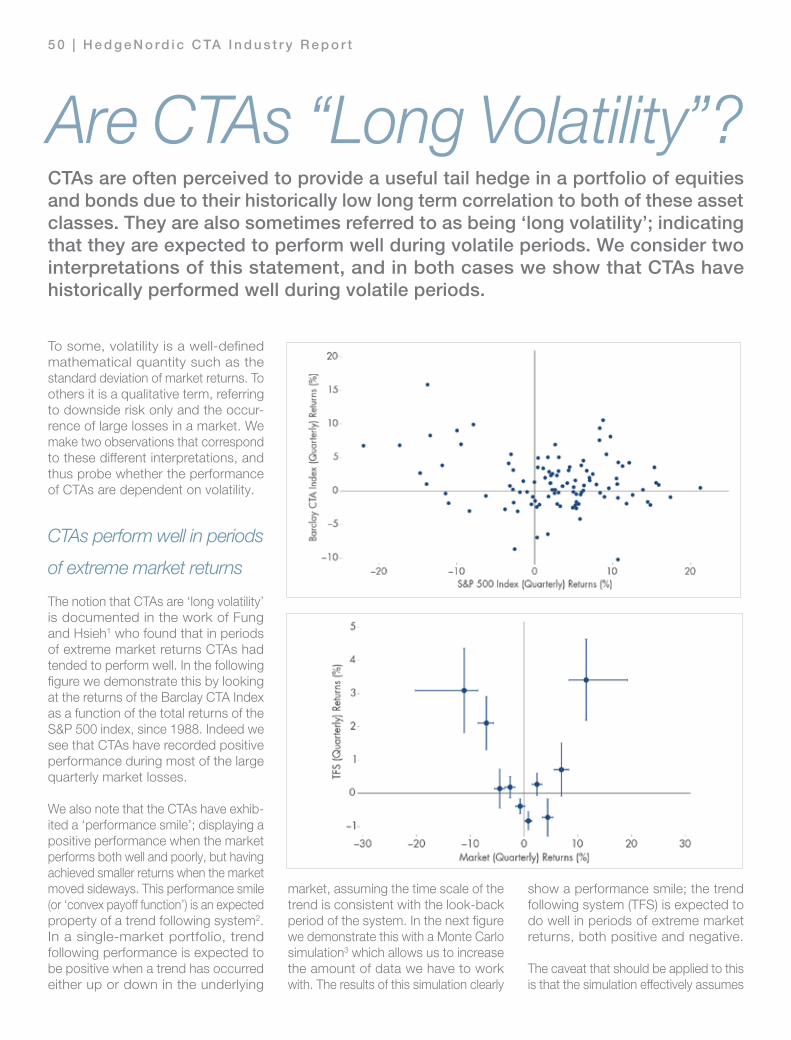
5 0 | H e d g e N o rd i c C TA I n d u s t r y R e p o r t
To some, volatility is a well-defined mathematical quantity such as the standard deviation of market returns. To others it is a qualitative term, referring to downside risk only and the occur-rence of large losses in a market. We make two observations that correspond to these different interpretations, and thus probe whether the performance of CTAs are dependent on volatility.
CTAs perform well in periods
of extreme market returns
The notion that CTAs are ‘long volatility’ is documented in the work of Fung and Hsieh1 who found that in periods of extreme market returns CTAs had tended to perform well. In the following figure we demonstrate this by looking at the returns of the Barclay CTA Index as a function of the total returns of the S&P 500 index, since 1988. Indeed we see that CTAs have recorded positive performance during most of the large quarterly market losses.
We also note that the CTAs have exhib-ited a ‘performance smile’; displaying a positive performance when the market performs both well and poorly, but having achieved smaller returns when the market moved sideways. This performance smile (or ‘convex payoff function’) is an expected property of a trend following system2. In a single-market portfolio, trend following performance is expected to be positive when a trend has occurred either up or down in the underlying
market, assuming the time scale of the trend is consistent with the look-back period of the system. In the next figure we demonstrate this with a Monte Carlo simulation3 which allows us to increase the amount of data we have to work with. The results of this simulation clearly
show a performance smile; the trend following system (TFS) is expected to do well in periods of extreme market returns, both positive and negative.
The caveat that should be applied to this is that the simulation effectively assumes
Are CTAs “Long Volatility”?CTAs are often perceived to provide a useful tail hedge in a portfolio of equities and bonds due to their historically low long term correlation to both of these asset classes. They are also sometimes referred to as being ‘long volatility’; indicating that they are expected to perform well during volatile periods. We consider two interpretations of this statement, and in both cases we show that CTAs have historically performed well during volatile periods.
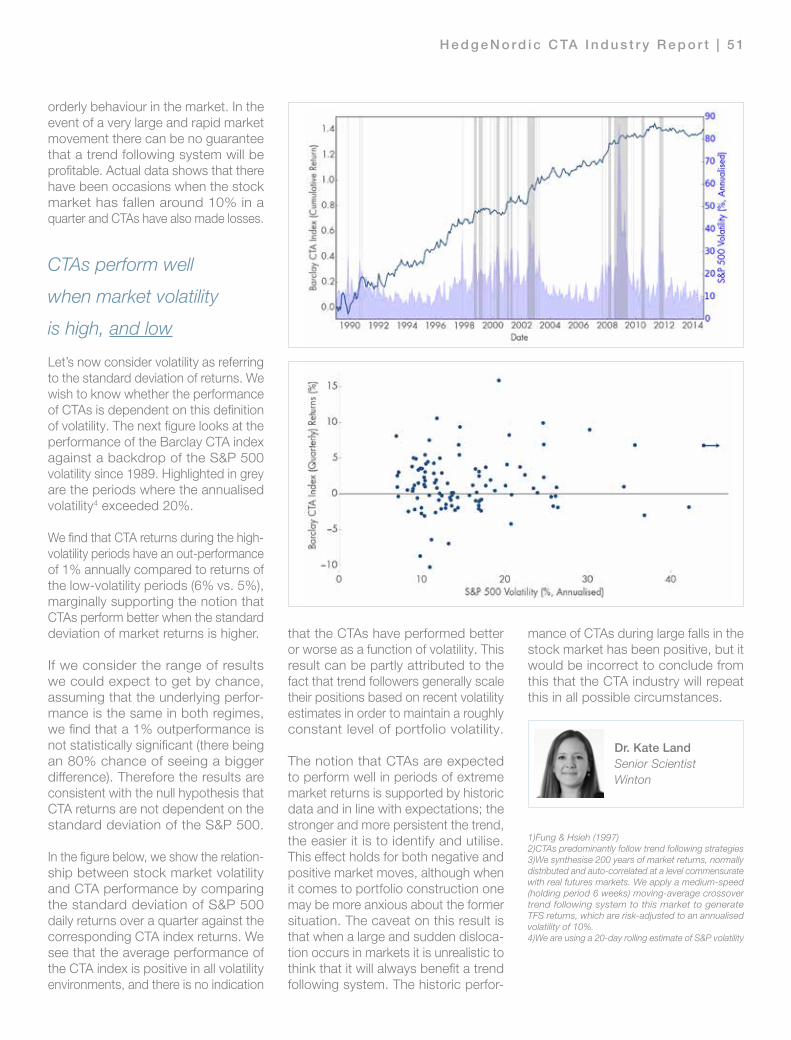
H e d g e N o rd i c C TA I n d u s t r y R e p o r t | 5 1
orderly behaviour in the market. In the event of a very large and rapid market movement there can be no guarantee that a trend following system will be profitable. Actual data shows that there have been occasions when the stock market has fallen around 10% in a quarter and CTAs have also made losses.
CTAs perform well
when market volatility
is high, and low
Let’s now consider volatility as referring to the standard deviation of returns. We wish to know whether the performance of CTAs is dependent on this definition of volatility. The next figure looks at the performance of the Barclay CTA index against a backdrop of the S&P 500 volatility since 1989. Highlighted in grey are the periods where the annualised volatility4 exceeded 20%.
We find that CTA returns during the high-volatility periods have an out-performance of 1% annually compared to returns of the low-volatility periods (6% vs. 5%), marginally supporting the notion that CTAs perform better when the standard deviation of market returns is higher.
If we consider the range of results we could expect to get by chance, assuming that the underlying perfor-mance is the same in both regimes, we find that a 1% outperformance is not statistically significant (there being an 80% chance of seeing a bigger difference). Therefore the results are consistent with the null hypothesis that CTA returns are not dependent on the standard deviation of the S&P 500.
In the figure below, we show the relation-ship between stock market volatility and CTA performance by comparing the standard deviation of S&P 500 daily returns over a quarter against the corresponding CTA index returns. We see that the average performance of the CTA index is positive in all volatility environments, and there is no indication
that the CTAs have performed better or worse as a function of volatility. This result can be partly attributed to the fact that trend followers generally scale their positions based on recent volatility estimates in order to maintain a roughly constant level of portfolio volatility.
The notion that CTAs are expected to perform well in periods of extreme market returns is supported by historic data and in line with expectations; the stronger and more persistent the trend, the easier it is to identify and utilise. This effect holds for both negative and positive market moves, although when it comes to portfolio construction one may be more anxious about the former situation. The caveat on this result is that when a large and sudden disloca-tion occurs in markets it is unrealistic to think that it will always benefit a trend following system. The historic perfor-
mance of CTAs during large falls in the stock market has been positive, but it would be incorrect to conclude from this that the CTA industry will repeat this in all possible circumstances.
1)Fung & Hsieh (1997)2)CTAs predominantly follow trend following strategies3)We synthesise 200 years of market returns, normally distributed and auto-correlated at a level commensurate with real futures markets. We apply a medium-speed (holding period 6 weeks) moving-average crossover trend following system to this market to generate TFS returns, which are risk-adjusted to an annualised volatility of 10%.4)We are using a 20-day rolling estimate of S&P volatility
Dr. Kate Land Senior Scientist Winton
5 2 | H e d g e N o rd i c C TA I n d u s t r y R e p o r t
During the past two decades, I have attended hundreds of due diligence meetings and answered numerous due diligence questionnaires. What I found was that many of the questions being asked were just not that meaningful or relevant and often asked by people with little experience, especially when it comes to some of the niche orientated investment strategies… sound familiar?
During my career, I have found that due diligence teams and analysts visiting our offices as part of a ‘tour’, where they were visiting many other managers in succession or meeting us at conferences where ‘speed dating’ has become the norm, found it challenging to reflect on our presentation and explanations in their subsequent manager reports, thus making me very concerned about the conclusion of such reports… I’m sure I’m not the only one with this concern!
Clearly the way investors allocate to managers after the financial crisis has changed. When I started in the industry, investors were genuinely looking for talent in order to build an innovative and truly diversified portfolio of managers,
considering both large and small managers. But since 2008, this has changed dramatically and today you have to be big to be heard, let alone to get an allocation.
In other words, perceived risk of allocating to a small manager has taken precedent and thus most investors prefer the comfort of a large organisation when making an investment.The change has also meant that investors today will not even allocate any time or financial resources to get to know a small manager. In reality most institutional investors end up investing with the same managers… the big ones… and their performance starts to look more like an index or the benchmark that they are trying to outperform.
Jumping back to my own beginning in the hedge fund industry in the late 1980’s, I was inspired and motivated to pursue a career in this industry after reading Jack Schwager’s Market Wizards books, which are essentially a compilation of interviews with the world’s greatest traders. A couple of years ago, I started to listen to podcasts on subjects that were related to my work and the hedge fund industry in general. Actually there aren’t that many podcasts available in this field and those that do exist are mainly produced by people who have never worked as a hedge fund manager or as a trader. They were asking good manuscript questions, but many were lacking a deeper insight and understanding into the industry and the strategies.
Clearly there is room to dig deeper into areas that would really be valuable for both investors and aspiring hedge fund managers to know and learn from. So I thought…
• Wouldn’t it be great if I could use my experience and contacts in the industry that I love and ask those questions that you just won’t find in a standard due diligence question-naire? • Wouldn’t it be great to share insightful, engaging and passionate interviews with the most successful hedge fund managers and traders in the world?
What I learnt from the Top Traders in the WorldHaving been part of the hedge fund industry for more than twenty years, working for some of the largest CTA firms in the world, as well as having co-founded, built and managed three businesses within the alternative investment space, I decided to use my experience in a new and different way.
“I realized that I could potentially democratize
the hedge fund industry, by providing easy access for all
investors to the most successful hedge fund managers and
traders while simultaneously giving small and emerging
managers a chance to be heard.”.
H e d g e N o rd i c C TA I n d u s t r y R e p o r t | 5 3
• Wouldn’t it be great to use this media platform to give both smaller and larger managers a chance to be heard by all investors, regardless of geographical location?
Instead of writing a book (which has already been done), I decided to use the latest technology to bring all of this valuable content directly to those of you who want to take your own manager research or investment career to the next level, via a free podcast that automatically (if you subscribe in iTunes) downloads to your smartphone, tablet or computer as soon as a new episode is released.
The idea of Top Traders Unplugged was born. So having spent countless hours talking to many of the world’s Top Traders, what have I learnt?
Firstly, I should say that I have concentrated my efforts within the Systematic Global Macro and CTA strategies, since I wanted to be within my own comfort zone. But even within these particular strategies, you do find very different trading styles. Despite their differences these two trading strategies can be described by 3 components; the History, the Science and the Art! I was reminded of this description by one of my guests (Kathryn Kaminski).
The History is something they all share, as it pertains to the historical data that they analyze and study in order to formulate investment strategies. The Science relates to them all applying rules via simple or complex algorithms as part of the implementation of their investment strategy and the Art relates to the individual way that they decide upon which rules, indicators or parameters to use, possibly where the difference between one manager to the next is expressed.
I will not be able to do all the managers justice in trying to summarize all of the wisdom they have shared. For this I encourage you to listen to their stories as told by them. What I have found to be true can be summarized as follows:
• They all come from very different backgrounds, which to me suggest that there is no such thing as the “right” pedigree
• They are all human beings like the rest of us and have for the most part had struggles and challenges in their lives which they had to overcome
• They clearly love what they do and can’t see themselves doing any other job
• They ask great questions of themselves and of the people around them. And as they understand things better they can make more informed decisions about how to build robust trading strategies
• They are incredible focused on their craft and pay little attention to what others do
• They are highly diligent and disciplined in the application of their work
• They almost without exception mentions Risk Manage-ment as the most important part of what they do, instead of focusing on how much return they can generate
• They truly believe in diversification as a key cornerstone in any investment approach
• They are all very humble when discussing the lessons that the markets continue to teach them, even after 2, 3 or 4 decades
• They pay little or No attention to the financial news but rather on the price of the markets which they all feel are less noisy
• They all feel the emotion of drawdowns even after many years of trading and have developed different ways of dealing with these emotions in order to stay disciplined and not stray off course but making rash decisions
• They all accept that no strategy will work all the time and just because a strategy or market have lost money for a short or long period does not mean that it should be abandoned as long as the environment in which it operates can explain the poor performance
• …and they all have a hidden talent or fun factor about themselves which very few people around them know about (that is, until they shared it on the podcast)
These are just some of my observations from my conversa-tions with some of the world’s Top Traders and I look forward to spending many more hours with them so that everyone has a chance to listen to and learn from truly passionate individuals with some amazing stories to tell.
Niels Kaastrup-LarsenFounder Top Traders Unplugged
Top Traders Unplugged is a podcast created for the investor, trader or research analyst. As in the Market Wizard books, each week in Top Traders Unplugged Niels Kaastrup-Larsen talks to a current successful hedge fund manager or commodity trading adviser who shares his or her experiences, successes, and failures. Hear their views on investing, portfolio construction, risk management, research, how to handle the emotional roller coaster and what it takes to become successful and a market wizard.
For more information, visit www.toptradersunplugged.com.
5 4 | H e d g e N o rd i c C TA I n d u s t r y R e p o r tDeutsche Asset & Wealth Management
Marketing Material. For professional clients (MiFID Directive 2004/39/EC Annex II) only. Deutsche Asset & Wealth Management represents the asset management and wealth management activities conducted by Deutsche Bank AG or any of its subsidiaries. Deutsche Bank AG is licensed to provide banking and investment services under the German Banking Act (Kreditwesengesetz) and is subject to supervision by the European Central Bank (ECB), Sonnemannstrasse 22, 60314 Frankfurt am Main, Germany and the German Federal Financial Supervisory Authority (‚Bundesanstalt für Finanzdienst-leistungsaufsicht‘ or ‚BaFin‘), Graurheindorfer Strasse 108, 53117 Bonn and Marie-Curie-Strasse 24-28, 60439 Frankfurt am Main, Germany. Deutsche Bank AG Stockholm branch („DBS“, Bolagsverket nr. 516401-9985) is authorised by BaFIN and regulated by Finansinspektionen for the conduct of licensed activities in Sweden. Details about the extent of our authorisation and regulation by BaFIN and respective Nordic Region Financial Supervisory Authority are available from us on request. This material has been provided for information purposes only. This advertisement was prepared without regard to the specific objectives, financial situation or needs of any particular person who may receive it. It does not constitute investment advice or a recommendation or an offer or solicitation and is not the basis for any contract to purchase or sell any security or other instrument, or for Deutsche Bank AG and its affiliates to enter into or arrange any type of transaction as a consequence of any information contained herein in any jurisdiction or in any circumstance that is otherwise unlawful or not authorised. Past performance is not a suitable indicator of future results. An investment in UCITS/ETF’s can rise or fall in value and there is no guarantee that the investor will get back all capital invested. Fluctuations in currency rates may cause the value of investments to either rise or fall. Investors should note that most UCITS/ETF’s are not capital protected or capital guaranteed. Investors in UCITS/ETF’s should be aware of the possibility, and financially able, to lose part or all of the invested capital. An investment in UCITS/ETF’s is associated with risks, for a presentation of the risks related to investments in these funds, please refer to respective UCITS/ETF’s Fact Sheet and/or Key Investor Information Document (“KIID”s) and/or Fund Prospectus.
DB Platinum UCITS PlatformMarket leader in single and multi-manager UCITS funds
Best-in-class Managers
Rigorous fund selection process - access to multi-billion dollar hedge fund managers with proven track record and institutional quality infrastructure
We have a very selective approach while launching UCITS funds, offering investors a concentrated list of UCITS ideas across strategies, sub-strategies and geography
Focused Approach
Market-leading daily online risk reporting using MARS, in addition to the website, factsheet and other regular reporting
Online Client Reporting
The only UCITS platform to provide independent due diligence reports on each managerDue Diligence Reports
Platforms provide additional independent regulatory and risk oversight which benefit investors. State-of-the-art risk engine used to monitor and calculate UCITS guidelines on a daily basis
Regulatory / Risk Oversight
Equity Hedge
Equity Long / Short
Equity Market Neutral /
Quant Equity
CTA / Macro
CTAGlobal Macro
Event Driven
Credit & Convertibles
Multi- Strategy
Strategies

H e d g e N o rd i c C TA I n d u s t r y R e p o r t | 5 5
GENERAL TERMS AND CONDITIONS These are the terms and conditions which govern the use of „HedgeNordic Industry Report“, an online magazine edited and distributed by electronical means and owned, operated and provided by Nordic Business Media AB (the “Editor”), Corporate Number: 556838-6170, BOX 7285, SE-103 89 Stockholm, Sweden.
DISCLAIMERS AND LIMITATIONS OF LIABILITY
1. The Content may include inaccuracies or typographical errors. Despite taking care with regard to procurement and provision, the Editor shall not accept any liability for the correctness, completeness, or accuracy of the fund-related and economic information, share prices, indices, prices, messages, general market data, and other content of „HedgeNordic Industry Report“ (“Content”). The Content is provided “as is” and the Editor does not accept any warranty for the Content.
2. The Content provided in „HedgeNordic Industry Report“ may in some cases contain elements of advertising. The editor may have received some compensation for the articles. The Editor is not in any way liable for any inaccuracies or errors. The Content can in no way be seen as any investment advice or any other kind of recommendation.
3. Any and all information provided in „HedgeNordic Industry Report“ is aimed for professional, sophisticated industry participants only and does not represent advice on investment or any other form of recommendation.
4. The Content that is provided and displayed is intended exclusively to inform any reader and does not represent advice on investment or any other form of recom- mendation.
5. The Editor is not liable for any damage, losses, or consequential damage that may arise from the use of the Content. This includes any loss in earnings (regardless of whether direct or indirect), reductions in goodwill or damage to corporate.
6. Whenever this Content contains advertisements including trademarks and logos, solely the mandator of such advertisements and not the Editor will be liable for this adver- tisements. The Editor refuses any kind of legal responsibility for such kind of Content.
YOUR USE OF CONTENT AND TRADE MARKS
1. All rights in and to the Content belong to the Editor and are protected by copyright, trademarks, and/or other intellectual property rights. The Editor may license third parties to use the Content at our sole discretion.
2. The reader may use the Content solely for his own personal use and benefit and not for resale or other transfer or disposition to any other person or entity. Any sale of
Contents is expressly forbidden, unless with the prior, explicit consent of the Editor in writing.
3. Any duplication, transmission, distribution, data transfer, reproduction and publication is only permitted by i. expressly mentioning Nordic Business Media AB as the sole copyright-holder of the Content and by ii. referring to the Website www.hedgenordic.com as the source of the information. provided that such duplication, transmission, distribution, data transfer, reproduc- tion or publication does not modify or alter the relevant Content.
4. Subject to the limitations in Clause 2 and 3 above, the reader may retrieve and display Content on a computer screen, print individual pages on paper and store such pages in electronic form on disc.
5. If it is brought to the Editor’s attention that the reader has sold, published, distrib- uted, re-transmitted or otherwise provided access to Content to anyone against this general terms and conditions without the Editor’s express prior written permission, the Editor will invoice the reader for copyright abuse damages per article/data unless the reader can show that he has not infringed any copyright, which will be payable immediately on receipt of the invoice. Such payment shall be without prejudice to any other rights and remedies which the Editor may have under these Terms or applicable laws.
MISCELLANEOUS
1. These conditions do not impair the statutory rights granted to the readers of the Content at all times as a consumer in the respective country of the reader and that cannot be altered or modified on a contractual basis.
2. All legal relations of the parties shall be subject to Swedish law, under the exclusion of the UN Convention of Contracts for the international sale of goods and the rules of conflicts of laws of international private law. Stockholm is hereby agreed as the place of performance and the exclusive court of jurisdiction, insofar as there is no compulsory court of jurisdiction.
3. Insofar as any individual provisions of these General Terms and Conditions contradict mandatory, statutory regulations or are invalid, the remaining provisions shall remain valid. Such provisions shall be replaced by valid and enforceable provisions that achieve the intended purpose as closely as possible. This shall also apply in the event of any loopholes.
“Your single access point to the Nordic hedge fund industry”
Picture Index
wongwean – shutterstock.com, alexskopje – shutterstock.com, Ammentorp Photography – shutterstock.com, corgarashu – shutterstock.com, Gemenacom – shutterstock.com,
isak55 – shutterstock.com, photogl – shutterstock.com, photogl – shutterstock.com, Pincasso – shutterstock.com, SergeBertasiusPhotography – shutterstock.com,
Rebel – Fotolia.de, Windsor – Fotolia.de, TebNad – Fotolia.de