mampec modelling of key australian ports to predict
TRANSCRIPT
MAMPEC Modelling of Key Australian Portsto predict environmental impacts of in-watercleaning discharge
Technical Report for the Department of Agriculture, Waterand the Environment
Nathaniel Bloomfield1
1Centre of Excellence for Biosecurity Risk Analysis, The Universityof Melbourne
August 3, 2020
Cen t r e o f Exce l l en ce f o rB i o se cu r i t y R i sk Ana l y s i s

Bloomfield 2020 Cen t r e o f Exce l l en ce f o rB i o se cu r i t y R i sk Ana l y s i s
ii

Contents
1 Executive summary 1
2 Introduction 42.1 Antifoulant Coatings . . . . . . . . . . . . . . . . . . . . . . . . . . . . . . 52.2 In-water cleaning . . . . . . . . . . . . . . . . . . . . . . . . . . . . . . . . 62.3 Copper as a pollutant . . . . . . . . . . . . . . . . . . . . . . . . . . . . . . 62.4 MAMPEC . . . . . . . . . . . . . . . . . . . . . . . . . . . . . . . . . . . . 8
3 Methodology 93.1 MAMPEC Software . . . . . . . . . . . . . . . . . . . . . . . . . . . . . . . 93.2 Port parameters . . . . . . . . . . . . . . . . . . . . . . . . . . . . . . . . . 93.3 Wetted surface area of vessels . . . . . . . . . . . . . . . . . . . . . . . . . 93.4 Cleaning methods and copper discharge . . . . . . . . . . . . . . . . . . . 10
4 Results 124.1 Reproducing previous studies . . . . . . . . . . . . . . . . . . . . . . . . . 124.2 Australian Ports . . . . . . . . . . . . . . . . . . . . . . . . . . . . . . . . . 15
4.2.1 Port of Brisbane . . . . . . . . . . . . . . . . . . . . . . . . . . . . . 154.2.2 Port of Port Hedland . . . . . . . . . . . . . . . . . . . . . . . . . . 184.2.3 Port of Melbourne . . . . . . . . . . . . . . . . . . . . . . . . . . . . 21
5 Discussion 24
Bibliography 26
A Appendix 29A.1 Inputs . . . . . . . . . . . . . . . . . . . . . . . . . . . . . . . . . . . . . . . 29A.2 Results . . . . . . . . . . . . . . . . . . . . . . . . . . . . . . . . . . . . . . 31
A.2.1 Reproducing Morrisey et al. (2013) results . . . . . . . . . . . . . . 31A.2.2 Applying Morrisey et al. (2013) (NZ) to all Summerson et al.
(2019) (AUS) ports . . . . . . . . . . . . . . . . . . . . . . . . . . . 32A.2.2.1 Total copper in harbour . . . . . . . . . . . . . . . . . . . 32A.2.2.2 Copper concentration in sediments after 10 years . . . . 41

List of Figures
4.1 Comparing results from Morrisey et al. (2013) for commercial vesselswith our results using their input parameters. . . . . . . . . . . . . . . . . 13
4.2 Reproducing results from Summerson et al. (2019). . . . . . . . . . . . . . 144.3 Port of Brisbane overlayed with areas considered to be the port for
constructing MAMPEC models. Reproduced from Summerson et al.(2019). . . . . . . . . . . . . . . . . . . . . . . . . . . . . . . . . . . . . . . . 16
4.4 Vessel visit statistics from 2019 for Port of Brisbane . . . . . . . . . . . . . 164.5 Modelled increase in copper concentration in the harbour and sediments
under different in-water cleaning scenarios for the Port of Brisbane. . . . 174.6 Port Hedland overlayed with dredged area, which used to inform the
dimensions of the MAMPEC model. Reproduced from Summersonet al. (2019). . . . . . . . . . . . . . . . . . . . . . . . . . . . . . . . . . . . . 19
4.7 Vessel visit statistics from 2019 for Port Hedland . . . . . . . . . . . . . . 194.8 Modelled increase in copper concentration in the harbour and sediments
under different in-water cleaning scenarios for the Port Hedland. . . . . 204.9 Port of Melbourne with docks highlighted. Reproduced from Summerson
et al. (2019). . . . . . . . . . . . . . . . . . . . . . . . . . . . . . . . . . . . . 224.10 Vessel visit statistics from 2019 for Port of Melbourne . . . . . . . . . . . 224.11 Modelled increase in copper concentration in the harbour and sediments
under different in-water cleaning scenarios for the Port of Melbourne(Swanson Dock). . . . . . . . . . . . . . . . . . . . . . . . . . . . . . . . . . 23
A.1 Comparing results from Morrisey et al. (2013) for recreational vesselswith our results using their input parameters. . . . . . . . . . . . . . . . . 31
A.2 Copper loads within harbour under a number of different in-watercleaning scenarios for Port of Brisbane. . . . . . . . . . . . . . . . . . . . . 33
A.3 Copper loads within harbour under a number of different in-watercleaning scenarios for Port of Brisbane (whole port model). . . . . . . . . 34
A.4 Copper loads within harbour under a number of different in-watercleaning scenarios for Port Hedland. . . . . . . . . . . . . . . . . . . . . . 35
A.5 Copper loads within harbour under a number of different in-watercleaning scenarios for Geelong (Corio Quay). . . . . . . . . . . . . . . . . 36
A.6 Copper loads within harbour under a number of different in-watercleaning scenarios for Port of Melbourne (Swanson dock). . . . . . . . . . 37
A.7 Copper loads within harbour under a number of different in-watercleaning scenarios for Port of Melbourne (Appleton dock). . . . . . . . . 38
A.8 Copper loads within harbour under a number of different in-watercleaning scenarios for Port of Melbourne (Webb dock). . . . . . . . . . . . 39
A.9 Copper loads within harbour under a number of different in-watercleaning scenarios for Port Phillip Bay. . . . . . . . . . . . . . . . . . . . . 40

Bloomfield 2020 Cen t r e o f Exce l l en ce f o rB i o se cu r i t y R i sk Ana l y s i s
A.10 Copper loads within harbour under a number of different in-watercleaning scenarios for Port of Brisbane (whole port model) (sediments). . 42
A.11 Copper loads within harbour under a number of different in-watercleaning scenarios for Port of Brisbane (sediments). . . . . . . . . . . . . 43
A.12 Copper loads within harbour under a number of different in-watercleaning scenarios for Port Hedland (sediments). . . . . . . . . . . . . . . 44
A.13 Copper loads within harbour under a number of different in-watercleaning scenarios for Geelong (Corio Quay) (sediments). . . . . . . . . . 45
A.14 Copper loads within harbour under a number of different in-watercleaning scenarios for Port of Melbourne (Swanson dock) (sediments). . 46
A.15 Copper loads within harbour under a number of different in-watercleaning scenarios for Port of Melbourne (Appleton dock) (sediments). . 47
A.16 Copper loads within harbour under a number of different in-watercleaning scenarios for Port of Melbourne (Webb dock) (sediments). . . . 48
A.17 Copper loads within harbour under a number of different in-watercleaning scenarios for Port Phillip Bay (sediments). . . . . . . . . . . . . . 49
v

List of Tables
2.1 Marine water quality guidelines for copper. . . . . . . . . . . . . . . . . . 7
3.1 Inputs to WSA equations. . . . . . . . . . . . . . . . . . . . . . . . . . . . 103.2 Reproduction of NZ wetted surface area numbers (in m2). . . . . . . . . . 103.3 Summary of inputs into copper release calculations, with uncertainty
estimates originally given by Morrisey et al. (2013). Reproduced fromTable 3.19 in Morrisey et al. (2013). . . . . . . . . . . . . . . . . . . . . . . 11
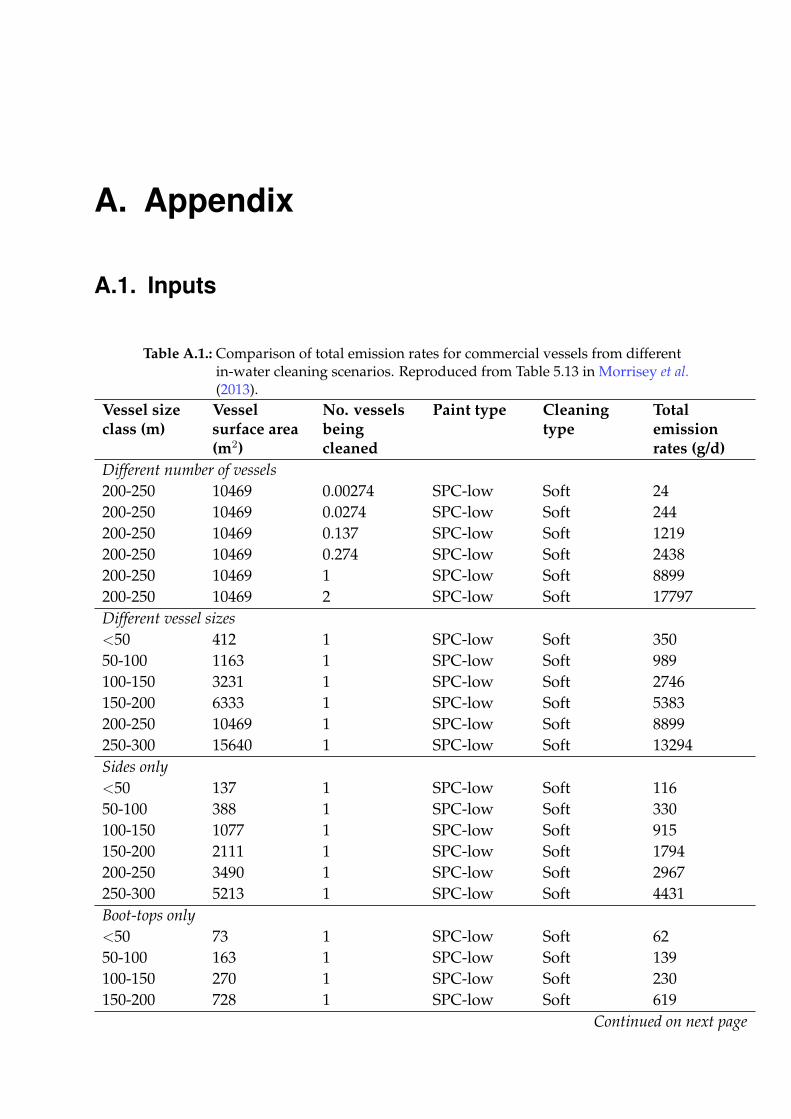
A.1 Comparison of total emission rates for commercial vessels from differentin-water cleaning scenarios. Reproduced from Table 5.13 in Morriseyet al. (2013). . . . . . . . . . . . . . . . . . . . . . . . . . . . . . . . . . . . . 29

1. Executive summary
In-water cleaning of biofouling on vessels has the potential to pose contaminant andbiosecurity risks to the marine environment. The Australian Department of Agriculture,Water and the Environment is currently revising its national policy on in-water cleaning.In early 2020, the Department engaged the Centre of Excellence for Biosecurity RiskAnalysis (CEBRA) to provide information to inform policy and risk thresholds forcontaminant risks, that could be associated with in-water cleaning of biocidal antifoulingcoatings.
This report explores the risk of copper pollution exceeding environmentally safe levelsin Australian ports due to in-water cleaning without capture, containment and treatmentof waste. The report applies the methodology of Morrisey et al. (2013) to the Australiancontext and models in-water cleaning without capture in three Australian ports representinghigh, medium and low flushing rates. The report also builds on previous work usingthe Marine Antifoulant Model to Predict Environmental Concentrations (MAMPEC)by Summerson et al. (2019) which assessed the potential for exceeding environmentallysafe levels in Australian ports due to release of disinfection by-products used in someballast water management systems.
The key outputs of this report include:
• Summarizing the inputs used by Morrisey et al. (2013) and highlighting keyassumptions in the modelling;
• Comparing these inputs to data available for Australia, to determine if the modellingassumptions are appropriate for this context;
• Running the MAMPEC model for the Australian ports used in Summerson et al.(2019), and comparing outputs to the Australian and New Zealand Environmentand Conservation Council (ANZECC) Water Quality Guidelines for levels ofdissolved copper in the water column, and the National Assessment Guidelinesfor Dredging (2009) for the concentration in sediments; and
• Providing recommendations to the Department on how many in-water cleanscould be approved each year in each of the listed ports, contingent on vesselcharacteristics and the above assumptions.
The modelling conducted by Morrisey et al. (2013) was highly sensitive to the assumptionof the remaining amount of copper in the leached layer of a ships’ antifoulant coating.Morrisey et al. (2013) assumed that only 2% of copper remained in the leached layer,

Bloomfield 2020 Cen t r e o f Exce l l en ce f o rB i o se cu r i t y R i sk Ana l y s i s
compared to the original amount in unleached paint and that this parameter washighly uncertain, and therefore also tested a higher level of 20% of copper remaining.This higher assumption would increase the resulting environmental concentrationsby ten times, and in this case very little in-water cleaning would be able to be conductedin order to maintain concentrations within ANZECC guideline values. This highlightsthat actual discharges from in-water cleaning could potentially be highly variable.
The weaknesses of the MAMPEC model were also noted. MAMPEC is a steady statemodel, and so it cannot capture the local maximum copper concentration in the harborat the time of in-water cleaning as it assumes continuous discharge (Zipperle et al.,2011). The models taken from Summerson et al. (2019) also used the sedimentationparameters from the Default Commercial harbour scenario developed by the JointGroup of Scientific Experts on the Scientific Aspects of Marine Environmental Protection(GESAMP). The sedimentation process is more important for the fate of copper thanthe compounds considered in their original report, as the binding of copper to suspendedsediments and the rate at which these sediments settle plays a large role in removingcopper from harbour waters, which adds additional uncertainty to the modelling ofMorrisey et al. (2013) undertaken in this report.
However, this modelling as well as the review of the results of Morrisey et al. (2013)highlight a number of strategies that can be used to reduce the risks of elevated coppercontamination from in-water cleaning. These included
• Restricting in-water cleaning to vessels with sound antifoulant coatings andonly allowing "soft" systems which remove minimal amounts of paint.
• Restricting in-water cleaning to vessels with sound antifoulant coatings andonly allowing "soft" systems which remove minimal amounts of paint.
• Placing restrictions on the total surface area of a vessel that is permitted to becleaned by a cleaning operator.
It is recommended that in-water cleaning is only conducted in a port if monitoringdata is collected as a requirement of the activity. This could include measuring biocideconcentrations in the water and sediment before, during or after the clean or take theform of a long-term monitoring plan. This combined with initially undertaking lowrisk cleans could allow an evidence base to be built for the practice to be expanded, ordemonstrate the risk of copper levels in water and sediments exceeding their triggervalues as a result of the activity.
The contaminant risk of cleans will vary based on the flushing rate of a particularport, amongst other factors. This variation may be highlighted by applying the followingscenario to a number of ports, whereby daily cleans are undertaken on a self polishingcopolymer antifoulant coating, with only 2% of copper remaining in the leached layerof the paint. If an increase in the copper concentration the port of 1µg/L is consideredenvironmentally acceptable, then in Port Hedland, full cleans of vessels between50-100 metres in length might be acceptable. If only a portion of the vessel is cleaned,cleaning on the sides of vessels up to 150-200 metres in length might be considered
2
Bloomfield 2020 Cen t r e o f Exce l l en ce f o rB i o se cu r i t y R i sk Ana l y s i s
acceptable, as may cleaning only boot-tops of vessels up to 250-300 metres in length.
Within the Port of Brisbane cleaning under the above scenario would be more restricted,as it is a lower flushing port compared to Port Hedland. Full cleans would still potentiallybe permissible for vessels up to 50-100 metres in length, but cleaning of sides wouldbe reduced to vessels between 100-150 metres in length and cleaning restricted toboot-tops for vessels between 250-300 metres in length. For Swanson Dock in thePort of Melbourne, no cleans would be acceptable. This dock was the ‘worst-case’ forthe Port of Melbourne, but the results for the other docks were similar as they havea much smaller tidal range and are not directly flushed by the Yarra River. Decisionmakers should consider a port’s desired level of protection under the ANZECC guidelinesand pre-existing copper concentrations in the port when identifying if a clean will below risk to the environment. In all of these cases, a higher or lower modelled copperconcentration increase might be more applicable.
3

2. Introduction
Biofouling is the accumulation of organisms on surfaces immersed in water and isa particular concern to the shipping industry as fouling can increase fuel costs andcreate biosecurity risks (Scianni & Georgiades, 2019). Biofouling can be managedby using antifoulant coatings which are paints designed to prevent biofouling, mostcommonly by releasing compounds toxic to aquatic organisms (Chambers et al., 2006).The performance of these coatings is highly variable in practice (Georgiades & Kluza,2017), and in-water cleaning is emerging as an important tool in biofouling management,particularly when vessels are seeking to maintain very low levels of biofouling (i.e.slime) on laminar surfaces.
However, there are concerns with current in-water cleaning techniques, including thebiosecurity risks of failing to capture biofouling organisms released during cleaningand pollution from antifoulant biocides, co-biocides and paint flecks (Morrisey et al.,2013). While all three components are of concern to the environment if released duringin-water cleaning, this study focusses on copper as a potential contaminant. Thisreport applies the methodology of Morrisey et al. (2013) to the Australian context,building on previous work using MAMPEC (Summerson et al., 2019) to explore therisk of copper pollution exceeding environmentally safe levels in Australian portsdue to in-water cleaning without capture, containment and treatment of waste. Technologiesfor in-water cleaning with capture are still being developed (Scianni & Georgiades,2019) and there is currently insufficient information to incorporate this aspect into themodelling. The key outputs include
• Summarizing the inputs used by Morrisey et al. (2013) and highlighting keyassumptions in the modelling.
• Comparing these inputs to data available for Australia, to determine if the modellingassumptions are appropriate for this context.
• Running the MAMPEC model for the Australian ports used in Summerson et al.(2019), and comparing outputs to the ANZECC Water Quality Guidelines forlevels of dissolved copper in the water column, and the National AssessmentGuidelines for Dredging (2009) for the concentration in sediments.
• Providing recommendations to the Department on how many in-water cleanscan be approved each year in each of the listed ports, contingent on vessel characteristicsand the above assumptions.

Bloomfield 2020 Cen t r e o f Exce l l en ce f o rB i o se cu r i t y R i sk Ana l y s i s
2.1. Antifoulant Coatings
For commercial vessels Morrisey et al. (2013) considered two types of anti-foulantcoatings — self-polishing copolymers (SPC) and ablative or soluble matrix coatings.Both types of coatings are designed to have a matrix that either slowly dissolves orhydrolyses to release the biocide, which is commonly copper. In the past, tributyltincompounds were used, but these have since been banned due to their toxicity (InternationalMaritime Organization, 1999). This is in contrast to insoluble matrix coatings, wherethe matrix is insoluble and biocide particles diffuse through to the surface of the paint(Morrisey et al., 2013; Chambers et al., 2006).
To be effective at preventing biofouling, the rate of copper release needs to be greaterthan 10 µg/cm2/day (Morrisey et al., 2013). The concentration of copper in the paint,and the thickness of application needs to be sufficient to hold biocide release at orabove this level for the planned lifetime of the coating. Morrisey et al. (2013) compileddata on a number of different coatings, and found that on average commercial SPCand ablative paints had a copper concentration of 125µg/cm2 per 1µm depth (Table8.4 in Morrisey et al. (2013)).
For SPC and ablative coatings, thicker coats provide a longer lifespan — the dry filmthickness of an antifoulant coating is generally 400µm for five years of effectiveness,and around 250µm for 2-3 years (Morrisey et al., 2013; Earley et al., 2014). Insolublematrix coatings require biocides to migrate to the surface, so there are diminishingreturns for thicker coats. This limits their lifetime to only around 12 months, and theyare now largely restricted to the recreational market (Morrisey et al., 2013). In a recentvoluntary survey by the Department of Agriculture, Water and the Environment(the department), most vessels were found to be using SPC coatings (Ramboll, 2018);though noting that this was a pilot study with less than 40 vessels surveyed.
As the surface layer of an antifoulant coating is depleted a leached layer develops,even with SPC and ablative coatings as the biocidal pigments dissolve at a fasterrate than the paint matrix retreats. This layer has a lower concentration of biocidecompared to the fresh layers beneath, and its depth varies with the coating type, age,and vessel activity, with older paints or faster moving vessels generally having deeperleached layers. Morrisey et al. (2013) was able to obtain the leached layer thickness ofa range of tin-free SPC and ablative paints. The leached layer in SPC paints rangedfrom 19-37µm on average after 12-18 months, and 41-64µm after 20-24 months (Table3.4 in Morrisey et al. (2013)). Ablative paints had a thicker leached layer, ranging from46-53µm after 15 months (Table 3.5 in Morrisey et al. (2013)).
There is significant uncertainty in the copper content of the leached layer. Morriseyet al. (2013) noted that Howell & Behrends (2006) found the copper content in theleached layer is low and close to the background level, while x-ray scans in Lewis(1998) indicate a copper content of about 5% of the underlying unleached paint. Furtherwork by Marceaux et al. (2018) also found evidence of copper being present in theleached layer, using x-ray scans coupled with scanning electron microscopy. Theydid not quantify the proportion of copper in the leached and unleached layers, but
5

Bloomfield 2020 Cen t r e o f Exce l l en ce f o rB i o se cu r i t y R i sk Ana l y s i s
it varied greatly between trials. This is a key parameter in the modelling, as a largeportion of the copper released from in-water cleaning could come from the removalof the leached layer.
Even with an antifoulant coating, vessels will always develop a slime biofilm. It isunclear how this impacts the antifouling system. Morrisey et al. (2013) notes thatslime accumulates biocides, but also can inhibit biocide release. Schottle & Brown(2007) is used by Morrisey et al. (2013) to make some assumptions about the coppercontent of biofilms. They simulated light cleaning by wiping a surface coated in antifoulingpaint with carpet, and found that insoluble matrix epoxy and vinyl coatings generatedaround 9 and 190µg/cm2/event after one month, respectively, and 13 and 240µg/cm2/eventafter three months. It was noted that the vinyl coatings had substantially more foulingcompared to the epoxy, which could have contributed to the higher copper release.This highlights the variability that can be expected when considering the copper contentof the biofilm layer. When initially painted, the release rate of a coating is significantlyhigher as a leached layer and biofilm is not present, but this decays until a constantrelease rate is reached. This also occurs when the paint is damaged or cleaned, asit exposes a fresh surface again with a higher concentration of copper (Earley et al.,2014).
2.2. In-water cleaning
In-water cleaning involves removing the biofilm and fouling from the hull of a shipusing mechanical methods, such as brushes or water jets. This can either be donepro-actively, as part of a biofouling management plan, or reactively, to remove biofoulingon vessels in which preventative management has been ineffective or inadequatelymaintained (Scianni & Georgiades, 2019). Several factors influence the amount ofpaint removed in the process, including the type of paint, the severity of fouling andthe type of cleaning method used. Morrisey et al. (2013) cite industry advice that aggressivecleaning, such as using rotating steel bristle brushes, removes around 50-100µm ofantifouling paint, while soft or light cleaning using nylon bristle brushes can removeless than 25µm or just the biofouling. In practice this is also likely to be highly variable,as cleaning a paint that is in poor condition could dislodge paint flakes and acceleratethe rate of damage (Morrisey et al., 2013), decreasing its efficacy. Capturing and filteringthe discharge from cleaning may go some way to reducing the pollution resultingfrom in-water cleaning. However, these technologies are still very much being developed(Scianni & Georgiades, 2019).
2.3. Copper as a pollutant
Copper is most toxic in its freely dissolved form, but when released into the oceanenvironment readily adsorbs to suspended particulate matter which can then settleout of the water column (Morrisey et al., 2013). Within sediments copper complexes
6

Bloomfield 2020 Cen t r e o f Exce l l en ce f o rB i o se cu r i t y R i sk Ana l y s i s
are relatively stable and copper has a low bioavailability but can still cause issues ifdredging works need to be undertaken as there is a risk of re-release into the marineenvironment. Freely dissolved copper also readily forms complexes with organic andinorganic ligands, which can also reduce its toxicity. Morrisey et al. (2013) comparesdissolved copper concentrations in their modelling to ANZECC and USEPA triggervalues, as shown in Table 2.1, and these values appear to still be current.
Copper is most toxic in its freely dissolved form, but when released into the oceanenvironment readily adsorbs to suspended particulate matter which can then settleout of the water column (Morrisey et al., 2013). Within sediments, copper complexesare relatively stable and copper has a low bioavailability but can still cause issues ifdredging works need to be undertaken as there is a risk of re-release into the marineenvironment. Freely dissolved copper also readily forms complexes with organic andinorganic ligands, which can also reduce its toxicity. Morrisey et al. (2013) comparesdissolved copper concentrations in their modelling to ANZECC and United StatesEnvironmental Protection Agency (US EPA) trigger values, as shown in Table 2.1, andthese values appear to still be current.
Table 2.1.: Marine water quality guidelines for copper.Guideline Type Guideline value (µg/L) ReferenceAcute (24 hour rolling average) 4.8 USEPA (1995)Chronic (4 day average) 3.1 USEPA (1995)ANZECC 99% protection 0.3 ANZECC (2000)ANZECC 95% protection 1.3 ANZECC (2000)ANZECC 90% protection 3 ANZECC (2000)ANZECC 80% protection 8 ANZECC (2000)
The ANZECC water quality guidelines are designed to help determine if the qualityof a water resource is adequate for its intended use. The trigger values in Table 2.1 areintended to be tailored to suit local requirements and conditions (ANZECC, 2000).For instance, in a high value conservation area a higher percentage species protectionlevel would be desirable in comparison to a highly disturbed environment, such as aport. The US EPA guidelines are less flexible, and state that unless a locally importantspecies is sensitive, saltwater organisms and their uses should not be affected unacceptablyif the four-day average concentration does not exceed the chronic value or the 24-hourrolling average does not exceed the acute value more than once every three years onaverage (USEPA, 1995).
The National Assessment Guidelines for Dredging (NAGD) provide levels for sedimenttoxicants that trigger additional requirements when obtaining dredging approvals(DEWHA, 2009). The screening trigger value is 65mg/kg, which triggers additionalrequirements for obtaining permits. A second trigger value of 270mg/kg has alsobeen used historically, but is no longer contained in the NAGD.
7
Bloomfield 2020 Cen t r e o f Exce l l en ce f o rB i o se cu r i t y R i sk Ana l y s i s
2.4. MAMPEC
Morrisey et al. (2013) uses the Marine Antifoulant Model for Predicted EnvironmentalConcentration (MAMPEC) model to explore the potential of in-water cleaning toresult in environmentally damaging concentrations of copper in the port environment.MAMPEC is a 2D steady-state hydrodynamic and chemical fate model and was initiallydesigned to predict environmental concentrations of biocides as a result of leachingfrom antifoulant paints (van Hattum et al., 2018). The model prioritizes ease of useand parameterization, and as a result the input parameters for a port are highly simplified.In validation studies, MAMPEC was found to be accurate to within an order of magnitude,and generally overestimated environmental concentrations (van Hattum et al., 2018).
Being a steady-state model, MAMPEC assumes that chemicals are continually dischargedinto the port environment. This means it cannot predict the timescale over whichthe steady state concentration will be reached and neglects dynamic effects, such asshort, irregular, and significant discharges, as is the likely case for in-water cleaning.In these scenarios, MAMPEC will under-predict the maximal concentration value(Zipperle et al., 2011). However, the model is still useful as an exploratory tool toconsider the risk continual that in-water cleaning in a port will elevate the environmentalcopper concentration above long-term environmentally damaging levels, as it hasbeen used in Morrisey et al. (2013).
8

3. Methodology
3.1. MAMPEC Software
For this study the two latest versions of MAMPEC (v3.1 and v3.0) were used, obtainedfrom Deltares (deltares.nl/en/software/mampec/). Version 3.1 has a different hydrodynamicmodel in comparison to the previous version, which was used for the Australianballast water discharge study (van Hattum et al., 2018; Summerson et al., 2019). Theolder version has been available since 2011 (van Hattum et al., 2014), so was likelyalso used by Morrisey et al. (2013). By considering both versions, the results fromthese previous studies can be reproduced and the impact of different hydrodynamicmodels on the results can be observed.
3.2. Port parameters
This study used the same ports modelled by Summerson et al. (2019), which includedthree locations representing high (Port Hedland), medium (Port of Brisbane) and low(Port of Melbourne) flushing rates. Ports with varied flushing rates were selectedas clearance of chemical inputs from in-water cleaning is influenced by the flushingenvironment in which they are released (Gadd et al., 2011). Parameters for these portswere taken from the appendix of Summerson et al. (2019) and included the dimensionsof the port, tidal range, and flushing from rivers and other sources. The results ofMorrisey et al. (2013) for New Zealand (NZ) ports was also reproduced, taking theport parameters from chapter 5.2.4.
3.3. Wetted surface area of vessels
The amount of copper discharged from a cleaning event depends on the total surfacearea cleaned. In the NZ study (Morrisey et al., 2013), the surface area of a vessel wasestimated based on formulas from Hempel (2007)
WSA = LP (2D +B) (3.1)WSAboot-top = 2H(L+ 0.5B) (3.2)
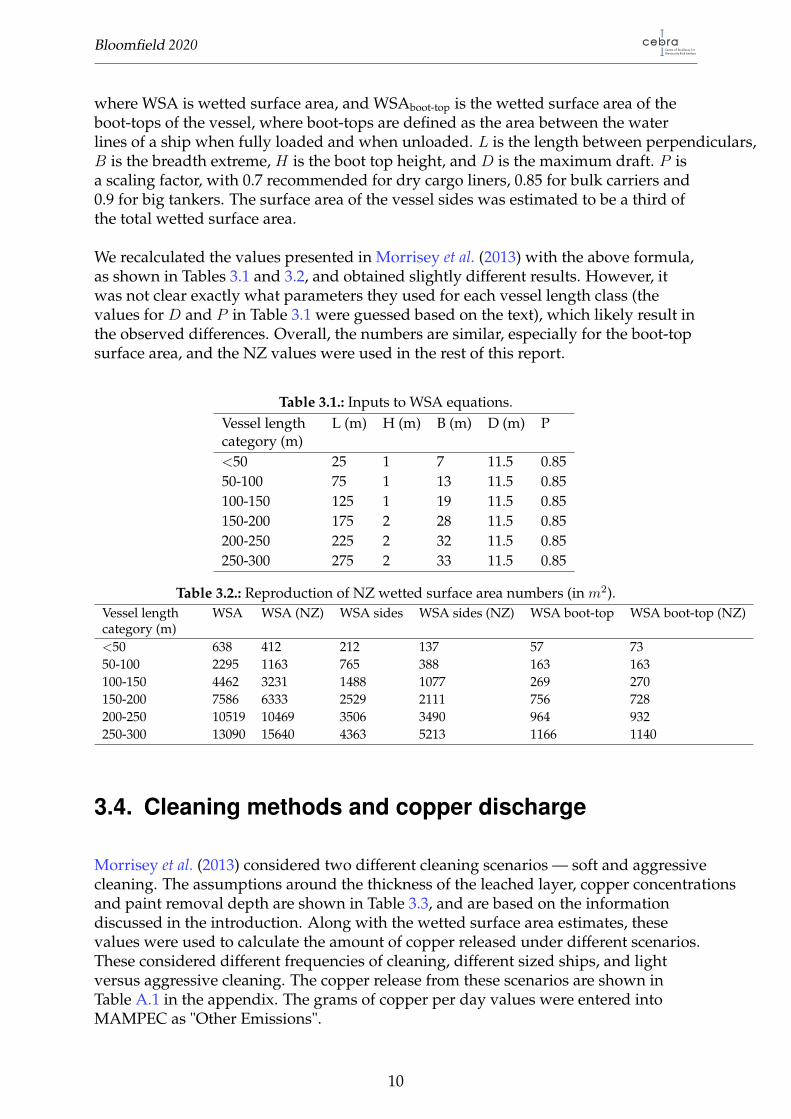
Bloomfield 2020 Cen t r e o f Exce l l en ce f o rB i o se cu r i t y R i sk Ana l y s i s
where WSA is wetted surface area, and WSAboot-top is the wetted surface area of theboot-tops of the vessel, where boot-tops are defined as the area between the waterlines of a ship when fully loaded and when unloaded. L is the length between perpendiculars,B is the breadth extreme, H is the boot top height, and D is the maximum draft. P isa scaling factor, with 0.7 recommended for dry cargo liners, 0.85 for bulk carriers and0.9 for big tankers. The surface area of the vessel sides was estimated to be a third ofthe total wetted surface area.
We recalculated the values presented in Morrisey et al. (2013) with the above formula,as shown in Tables 3.1 and 3.2, and obtained slightly different results. However, itwas not clear exactly what parameters they used for each vessel length class (thevalues for D and P in Table 3.1 were guessed based on the text), which likely result inthe observed differences. Overall, the numbers are similar, especially for the boot-topsurface area, and the NZ values were used in the rest of this report.
Table 3.1.: Inputs to WSA equations.Vessel lengthcategory (m)
L (m) H (m) B (m) D (m) P
<50 25 1 7 11.5 0.8550-100 75 1 13 11.5 0.85100-150 125 1 19 11.5 0.85150-200 175 2 28 11.5 0.85200-250 225 2 32 11.5 0.85250-300 275 2 33 11.5 0.85
Table 3.2.: Reproduction of NZ wetted surface area numbers (in m2).Vessel lengthcategory (m)
WSA WSA (NZ) WSA sides WSA sides (NZ) WSA boot-top WSA boot-top (NZ)
<50 638 412 212 137 57 7350-100 2295 1163 765 388 163 163100-150 4462 3231 1488 1077 269 270150-200 7586 6333 2529 2111 756 728200-250 10519 10469 3506 3490 964 932250-300 13090 15640 4363 5213 1166 1140
3.4. Cleaning methods and copper discharge
Morrisey et al. (2013) considered two different cleaning scenarios — soft and aggressivecleaning. The assumptions around the thickness of the leached layer, copper concentrationsand paint removal depth are shown in Table 3.3, and are based on the informationdiscussed in the introduction. Along with the wetted surface area estimates, thesevalues were used to calculate the amount of copper released under different scenarios.These considered different frequencies of cleaning, different sized ships, and lightversus aggressive cleaning. The copper release from these scenarios are shown inTable A.1 in the appendix. The grams of copper per day values were entered intoMAMPEC as "Other Emissions".
10

Bloomfield 2020 Cen t r e o f Exce l l en ce f o rB i o se cu r i t y R i sk Ana l y s i s
Table 3.3.: Summary of inputs into copper release calculations, with uncertaintyestimates originally given by Morrisey et al. (2013). Reproduced from Table3.19 in Morrisey et al. (2013).
SPC coating Ablative coating Uncertainty estimateCopper concentrations in paint µg/cm2/1µmthicknessSound paint 120 120 fairly certainLeached layer - low estimate 2.4 2.4 very uncertainLeached layer - high estimate 24 24 very uncertain
Paint removal depth (µm)Light cleaning 25 25 fairly uncertainAggressive cleaning 75 75 fairly uncertain
Thickness (µm)Leached layer 50 60 fairly uncertain
Coating Removed (µm)Light cleaningSound paint 0 0Leached layer 25 25 fairly uncertainBiofilm 100% 100% fairly uncertainAggressive cleaningSound paint 25 15 fairly uncertainLeached layer 50 60 fairly uncertainBiofilm 100% 100% fairly uncertain
Copper removed in biofilm µg/cm2/cleaningevent
25 50 very uncertain
11

4. Results
4.1. Reproducing previous studies
To ensure the methodology was consistent with the NZ approach outlined in Morriseyet al. (2013), their results for differing numbers of vessels were reproduced. Resultswere obtained that were very close, particularly using MAMPEC version 3.0, althoughversion 3.1 also provided similar predictions. The results are shown in Figure 4.1 andA.1.
The methodology from Summerson et al. (2019) was also checked using dibromoacetonitrileas a test case, as it was a compound with a relatively high concentration in comparisonto its predicted no effect concentration and reported for all ports. It was found thatin the Australian port data, results could be reproduced in MAMPEC version 3.0using the sedimentation parameters from the Default Commercial harbour scenariodeveloped by the Joint Group of Scientific Experts on the Scientific Aspects of MarineEnvironmental Protection (GESAMP). An abiotic half-life of 2 days for dibromoacetonitrile(GESAMP, 2020), and a tidal density difference of 0kg/m3 was also used. The resultsare shown in Figure 4.2 and in this case MAMPEC version 3.1 gave very differentpredictions. This highlighted the importance of considering both MAMPEC versions,as it appears the different parameterisations of the hydrodynamic model can lead tosubstantially different results.

Bloomfield 2020 Cen t r e o f Exce l l en ce f o rB i o se cu r i t y R i sk Ana l y s i s
(a) Results using the input parameters from Morrisey et al. (2013).
(b) Figure reproduced from Morrisey et al. (2013).
Figure 4.1.: Comparing results from Morrisey et al. (2013) for commercial vessels withour results using their input parameters.
13

Bloomfield 2020 Cen t r e o f Exce l l en ce f o rB i o se cu r i t y R i sk Ana l y s i s
Figure 4.2.: Reproducing results from Summerson et al. (2019).
14

Bloomfield 2020 Cen t r e o f Exce l l en ce f o rB i o se cu r i t y R i sk Ana l y s i s
4.2. Australian Ports
After reproducing predicted environmental concentrations from Morrisey et al. (2013)and Summerson et al. (2019), the NZ scenarios were then applied to the Australianports. These scenarios included conducting cleans at different frequencies, on differentsized vessels, different parts of a vessel, and for different paint types, cleaning methodsand leached layer concentration. For illustrative purposes, the most conservativemodel for each port is presented here and only the most useful results in terms ofmaking a decision on whether cleaning a vessel could pose a risk are plotted. The fullset of results for all ports and scenarios is given in Appendix A.2.2. The total copperconcentrations are compared to the ANZECC trigger values, rather than dissolvedcopper, as the sedimentation parameters used for the Australian ports were based onthe default GESAMP model port inputs (Summerson et al., 2019). In the next sectionsummary results for each port are presented, and a rate of one in-water clean per dayis focused on, given that MAMPEC is a steady state model and assumes continuousdischarge of the modelled biocide.
4.2.1. Port of Brisbane
The Port of Brisbane is a major container port situated at the mouth of the BrisbaneRiver, as shown by the high proportion of visiting container vessels (Fig 4.4). The porthas a tidal rage of 1.8 metres, which along with a 25.6m3/s flushing velocity providedby the Brisbane river (Summerson et al., 2019) allow for 17-25% of water in the port tobe exchanged with the surroundings each tidal cycle in the MAMPEC models.
In 2014 copper levels generally ranged from 1-3µg/L for the Port of Brisbane, butsome samples were found to have concentrations up to 8µg/L (BMT, 2015). This isin line with the ANZECC 90% protection guideline, apart from these exceptions. Themean sediment concentrations were around 25-30mg/kg between 2013-2018, but in anumber of years maximums reached up to 110mg/kg (Wilson, 2020).
The two different port areas considered for the MAMPEC models are shown in Figure4.3. The results for the river mouth model is presented here, as it was slightly moreconservative than the whole port model due to having a smaller volume. A summaryof the MAMPEC results is shown in figure 4.5.
If cleans that were predicted to increase the copper concentration in the port by 1µg/Lor less when conducted on a daily basis are considered to be low risk, then Figure4.5b shows full cleans of vessels up to 50-100 metres in length could be consideredunlikely to have a significant impact on water quality or marine sediment, or restrictedcleans of larger vessels up to 100-150 metres for sides and 250-300 metres for boot-tops.When making a decision as to what level of increase in copper concentration is consideredlow risk, the background copper contamination levels in the locality where cleaningis proposed and the desired ANZECC species protection level need to be consideredby the relevant authorities.
15

Bloomfield 2020 Cen t r e o f Exce l l en ce f o rB i o se cu r i t y R i sk Ana l y s i s
Figure 4.3.: Port of Brisbane overlayed with areas considered to be the port forconstructing MAMPEC models. Reproduced from Summerson et al. (2019).
Figure 4.4.: Vessel visit statistics from 2019 for Port of Brisbane.
16

Bloomfield 2020 Cen t r e o f Exce l l en ce f o rB i o se cu r i t y R i sk Ana l y s i s
(a) Area of vessel hull that may be cleaned per day under different assumptions, so that the maximumtotal copper concentration in harbour waters increases by the given amount.
(b) Increase in maximum total copper concentration in harbour waters due to daily cleans of differentsized vessels and vessel regions. This assumes that soft cleaning is used, the vessel has an SPCantifoulant coating, and that there is only 2% of the original copper amount remaining in theleached layer (i.e. the most permissive cleaning scenario).
(c) Copper concentration increase in harbour sediments after ten years as a result of the maximum totalcopper concentration in the harbour increasing by the given amount.
Figure 4.5.: Modelled increase in copper concentration in the harbour and sedimentsunder different in-water cleaning scenarios for the Port of Brisbane. Theworst-case result between MAMPEC version 3.0 and 3.1 is presented here.When using these figures keep in mind that it is not guaranteed that totalcopper concentrations will remain below the corresponding threshold andresulting sediment copper concentrations may be higher, as noted in thediscussion.
17

Bloomfield 2020 Cen t r e o f Exce l l en ce f o rB i o se cu r i t y R i sk Ana l y s i s
4.2.2. Port of Port Hedland
The Port of Port Hedland is a major bulk export port in Western Australia (Fig 4.6),with nearly all vessel visits are made by bulk carriers (Fig 4.7). The port has a largetidal range of 5.9 metres, (Summerson et al., 2019) which allows for 41% of water inthe port to be exchanged with the surroundings during each tidal cycle in the MAMPECmodel.
A survey in 2006 of Port Hedland found copper levels of 0.4µg/L(Wenziker et al.,2006), but more recent sampling from creek inlets found copper concentrations in therange of around 1-3µg/L. Concentrations of copper in sediments varied significantlydepending on the location, with values between 30-50mg/kg for two berths, but from50-130mg/kg at another (Kitchen, 2020). The variability of copper concentrationswithin the sediments at the port of Port Hedland can largely be attributed to the exportof copper concentrate through selected berths. Improved handling practices overrecent years has seen a decline in copper concentrations within these sediments atthese locations (Kitchen, 2020).
A summary of the MAMPEC results is shown in Figure 4.8. As Port Hedland hasmore hydrodynamic exchange in the MAMPEC model compared to the Port of Brisbane,Figure 4.8b is more permissive in the size of vessels that could theoretically be cleanedin the model. If cleans that were predicted to increase the copper concentration inthe port by 1µg/L or less when conducted on a daily basis were considered low risk,then it shows full cleans of vessels up to size class 50-100 metres could be consideredunlikely to have a significant impact on water quality or marine sediment, or restrictedcleans of larger vessels up to 150-200 metres for sides and 250-300 metres for boot-tops.However, again it needs to be kept in mind that these discharges would be additionalto the current copper levels present in Port Hedland.
18

Bloomfield 2020 Cen t r e o f Exce l l en ce f o rB i o se cu r i t y R i sk Ana l y s i s
Figure 4.6.: Port Hedland overlayed with dredged area, which used to inform thedimensions of the MAMPEC model. Reproduced from Summerson et al.(2019).
Figure 4.7.: Vessel visit statistics from 2019 for Port Hedland.
19

Bloomfield 2020 Cen t r e o f Exce l l en ce f o rB i o se cu r i t y R i sk Ana l y s i s
(a) Area of vessel hull that may be cleaned per day under different assumptions, so that the maximumtotal copper concentration in harbour waters increases by the given amount.
(b) Increase in maximum total copper concentration in harbour waters due to daily cleans of differentsized vessels and vessel regions. This assumes that soft cleaning is used, the vessel has an SPCantifoulant coating, and that there is only 2% of the original copper amount remaining in theleached layer (i.e. the most permissive cleaning scenario).
(c) Copper concentration increase in harbour sediments after ten years as a result of the maximum totalcopper concentration in the harbour increasing by the given amount.
Figure 4.8.: Modelled increase in copper concentration in the harbour and sedimentsunder different in-water cleaning scenarios for the Port Hedland. Theworst-case result between MAMPEC version 3.0 and 3.1 is presented here.When using these figures keep in mind that it is not guaranteed that totalcopper concentrations will remain below the corresponding threshold andresulting sediment copper concentrations may be higher, as noted in thediscussion.
20

Bloomfield 2020 Cen t r e o f Exce l l en ce f o rB i o se cu r i t y R i sk Ana l y s i s
4.2.3. Port of Melbourne
The Port of Melbourne is based along the Yarra River, with several different docks asthe river flows through the city. Container ships and tankers are the most common(Figure 4.10) and these will berth at different locations depending on their vesseltype. As the Port of Melbourne is situated in Port Phillip Bay, it only has a tidal rangeof 0.8 metres. In the MAMPEC models, it was estimated the amount of water exchangedeach tide for the docks are around 5-8%.
Sampling from the Yarra River near Melbourne’s ports and throughout Port PhillipBay found negligible copper concentrations < 1.3µg/L in 2010, although sampleswere not collected from within the primary docking areas (EPA Victoria, 2010). Sedimentsampling has found copper concentrations of 17-28 mg/kg in Swanson Dock, <1 to22.6 mg/kg in Webb Dock, and up to 40mg/kg at other locations that are part of theport (Storch, 2020).
The docks that were modelled in MAMPEC are shown in Figure 4.9. The results forjust Swanson Dock is presented here, as it was more conservative than the other docks.A summary of the MAMPEC results is shown in Figure 4.11.
As Swanson Dock, and others within the Port of Melbourne have significantly lesshydrodynamic exchange in the MAMPEC model compared the other ports, Figure4.11b is significantly more restrictive in the size of vessels that could theoretically becleaned in the model. If an acceptable increase in copper concentration was 1µg/L,then no cleans would be permissible, unlike the Port of Brisbane or Port Hedland.If this was increased to 3µg/L, then cleaning the sides of vessels less than 50 metresin length could be permissible, and the boot-tops of vessels up to 50-100 metres inlength.
It is unknown which areas in the Port of Melbourne will be used for in-water cleaning,but using the larger docks (e.g. Webb Dock) or conducting cleans at anchorage mayhelp reduce the localised impact of copper pollution from in-water cleaning and allowlarger vessels to be cleaned. However, choosing a different site within Port PhillipBay will change the background copper contamination levels and may also haveimplications for the desired ANZECC species protection level.
21

Bloomfield 2020 Cen t r e o f Exce l l en ce f o rB i o se cu r i t y R i sk Ana l y s i s
Figure 4.9.: Port of Melbourne with docks highlighted. Reproduced from Summersonet al. (2019).
Figure 4.10.: Vessel visit statistics from 2019 for Port of Melbourne.
22

Bloomfield 2020 Cen t r e o f Exce l l en ce f o rB i o se cu r i t y R i sk Ana l y s i s
(a) Area of vessel hull that may be cleaned per day under different assumptions, so that the maximumtotal copper concentration in harbour waters increases by the given amount.
(b) Increase in maximum total copper concentration in harbour waters due to daily cleans of differentsized vessels and vessel regions. This assumes that soft cleaning is used, the vessel has an SPCantifoulant coating, and that there is only 2% of the original copper amount remaining in theleached layer (i.e. the most permissive cleaning scenario).
(c) Copper concentration increase in harbour sediments after ten years as a result of the maximum totalcopper concentration in the harbour increasing by the given amount.
Figure 4.11.: Modelled increase in copper concentration in the harbour and sedimentsunder different in-water cleaning scenarios for the Port of Melbourne(Swanson Dock). The worst-case result between MAMPEC version 3.0and 3.1 is presented here. When using these figures keep in mind that itis not guaranteed that total copper concentrations will remain below thecorresponding threshold and resulting sediment copper concentrationsmay be higher, as noted in the discussion.
23

5. Discussion
The actual amount of copper released into the environment from in-water cleaningwill likely be highly variable depending on the copper load in the surface biofilmand leached layer of the paint. In the voluntary survey of ships visiting Australia, themaximum level of fouling and the age of the antifoulant coating varied considerably(Ramboll, 2018), and these are both factors which will impact the copper content of aships biofilm and leached layer. Key to this analysis was the assumption that copperlevels in the leached layer are around 2% of the levels in sound paint, and also that a50-60µm thick leached layer was present. If copper levels are higher, say 20% insteadof 2%, the results of this study show that the predicted environmental concentrationsin the soft cleaning case also increases by ten times. If cleaning is conducted improperlyand sound paint is also removed, this would also significantly increase the amount ofcopper released. Similar uncertainty is also present in the copper content of the ship’sbiofilm, with one of the few studies cited by Morrisey et al. (2013) finding dischargevalues ranging from 10-200µg/cm2 per event.
It is also noted that the key process for removal of toxic, free copper ions from thewater column is binding to suspended particulate matter and then sedimentation.This makes the build-up of copper in sediments a concern (DEWHA, 2009), but thereis high uncertainty around the predicted copper levels in sediment presented heregiven that the Australian port models use the default sedimentation parameters fromthe GESAMP model port (Summerson et al., 2019), and this is highlighted in that eachport has the exact same sediment concentration as a result of each threshold in Figure4.5c, 4.8c and 4.11c. This also adds to uncertainty to the total concentration of copperpredicted in the harbor, as other than exchange with the surroundings, sedimentationis the primary pathway copper is removed from the harbor waters.
When interpreting the results, the expected accuracy of the MAMPEC model shouldalso be kept in mind (to within an order of magnitude), and it should be noted thatthere were large differences in the results for Australian ports between the MAMPECmodel versions. The model also uses a steady state assumption, which means it assumescontinuous input of the discharged biocide. The maximum concentrations reportedhere will likely underestimate the true maximum concentration of biocide reached inlocal waters from an in-water cleaning event, particularly when modelling infrequentin-water cleans (Zipperle et al., 2011).
These uncertainties mean that great care should be taken when using these results toadvise how in-water cleans can be conducted in ports to keep biocide concentrationswithin safe levels. Given the variability expected in the copper content of the leachedlayer, the assumptions used and the accuracy of the MAMPEC model, resulting water
Bloomfield 2020 Cen t r e o f Exce l l en ce f o rB i o se cu r i t y R i sk Ana l y s i s
and sediment copper concentrations may end up being higher or lower than thesemodelled results. Nevertheless, this study does highlight the strategies that could beused to reduce the risk of copper exceeding environmentally safe levels in Australianports when cleaning is undertaken without capture and treatment of the effluent.These include
• Restricting in-water cleaning to vessels with sound antifoulant coatings andonly allowing "soft" systems which remove minimal amounts of paint.
• Only conducting in-water cleaning in areas with high flushing rates and wheresediments are unlikely to be disturbed
• Placing restrictions on the total surface area that is permitted to be cleaned by avessel.
It is recommended that in-water cleaning is only conducted in a port if monitoringdata is collected as a requirement of the activity. This could include measuring biocideconcentrations in the water and sediment before, during or after the clean, or by havinga long-term monitoring plan in place. Copper input to harbours can come from arange of sources, from passive release of ships hulls to urban or industrial run-off.Because of this, it may be difficult to measure the contribution of in-water cleaningspecifically to copper in the water and sediments, and ports should decide what themost effective strategy for monitoring changes in copper pollution levels due to in-watercleaning activity would be.
Keeping in mind the caveats, this modelling could be used to identify cleans thatwill pose a low risk of increasing copper pollution levels above the ANZECC speciesprotection level desired by a port. A highly simplified example of this would be aport with a measured copper concentration of 2µg/L and a desired ANZECC 90%protection level (3µg/L) allowing in-water cleaning for vessel-size and cleaning areacombinations that would only raise the copper concentration in the port by 1µg/Lwhen conducted on a daily basis, as shown in Figures 4.5b, 4.8b and 4.11b. Combinedwith sufficient monitoring this would allow an evidence base to be built for the practiceto be expanded or demonstrate the risk of copper levels in water and sediments exceedingtheir trigger values as a result of this activity.
25

Acknowledgements
Bianca Brooks and Timothy Carew provided oversight of the project and along withSonia Gorgula edited the report. The vessel visit data was provided by Rupert Summerson,and John Lewis provided an insightful review of the work.

Bibliography
ANZECC (2000) National water quality management strategy. Australian WaterAssociation.
BMT (2015) Port of Brisbane - Water Quality Monitoring Report 2014. Port of BrisbanePty Ltd.
Chambers LD, Stokes KR, Walsh FC, Wood RJ (2006) Modern approaches to marineantifouling coatings. Surface and Coatings Technology, 201, 3642–3652.
DEWHA (2009) National Assessment Guidelines for Dredging. Department of theEnvironment, Water, Heritage and the Arts.
Earley PJ, Swope BL, Barbeau K, Bundy R, McDonald JA, Rivera-Duarte I (2014) Lifecycle contributions of copper from vessel painting and maintenance activities.Biofouling, 30, 51–68.
EPA Victoria (2010) Baywide water quality monitoring program. EPA Victoria.Gadd J, Depree C, Hickey C (2011) Relevance to New Zealand of the OECD
Emission Scenario Document for antifouling paints: Phase 2 report. Report for theEnvironmental Protection Authority (EPA). Hamilton: National Institute of Water andAtmospheric Research Ltd.
Georgiades E, Kluza D (2017) Evidence-based decision making to underpin thethresholds in New Zealand’s craft risk management standard: biofouling onvessels arriving to new zealand. Marine Technology Society Journal, 51, 76–88.
GESAMP (2020) GESAMP-BWWG database of chemicals mostcommonly associated with treated ballast water. URL retrieved fromgisis.imo.org/Public/BWC/Chemical/ChemicalList.aspx on the 26/3/2020.
Hempel (2007) Hempel: Product data manual.Howell D, Behrends B (2006) A methodology for evaluating biocide release
rate, surface roughness and leach layer formation in a TBT-free, self-polishingantifouling coating. Biofouling, 22, 303–315.
International Maritime Organization (1999) Resolution A.895 (21).– Anti-fouling systems used on ships. URL retrieved fromhttp://www.imo.org/OurWork/Environment/Anti-foulingSystems/Pages/Default.aspxon the 3/7/2020.
Kitchen B (2020) Pilbarra ports. Private Communication.Lewis JA (1998) Marine biofouling and its prevention. In: Materials Forum, vol. 22, pp.
41–6I.Marceaux S, Martin C, Margaillan A, Bressy C (2018) Effects of accelerated ageing
conditions on the mechanism of chemically-active antifouling coatings. Progressin Organic Coatings, 125, 257–265.
Morrisey D, Gadd J, Page M, et al. (2013) In-water cleaning of vessels: biosecurity andchemical contamination risks. Ministry for Primary Industries.
Ramboll (2018) Pilot surveys to sample biofouling of international vessels arriving inAustralia. Australian Department of Agriculture and Water Resources.
Bloomfield 2020 Cen t r e o f Exce l l en ce f o rB i o se cu r i t y R i sk Ana l y s i s
Schottle R, Brown P (2007) Copper loading assessment from in-water hullcleaning following natural fouling. In: The Eleventh Triannual InternationalConference: Ports 2007, 30 Years of Sharing Ideas... 1977-2007American Society of CivilEngineersPermanent International Association of Navigation Congresses.
Scianni C, Georgiades E (2019) Vessel in-water cleaning or treatment: Identificationof environmental risks and science needs for evidence-based decision making.Frontiers in Marine Science, 6, 467.
Storch U (2020) Port of Melbourne. Private Communication.Summerson R, Bloomfield N, Arthur T (2019) Treated ballast water and its impact on port
water quality. Department of Agriculture and Water Resources.USEPA (1995) Ambient Water Quality Criteria - Saltwater Copper Addendum. USEPA.van Hattum B, van Gils J, Elzinga H, Baart A (2014) MAMPEC 3.0 handbook.van Hattum B, van Gils J, Elzinga H, Baart A (2018) MAMPEC 3.1 handbook.Wenziker K, McAlpine K, Apte S, Masini R (2006) Background quality for coastal marine
waters of the North West Shelf, Western Australia. Department of Environment.Wilson C (2020) Port of Brisbane. Private Communication.Zipperle A, van Gils J, van Hattum B, Heise S (2011) Guidance for a harmonized
emission scenario document on ballast water discharge. Report UBA-FB, 1481.
28
A. Appendix
A.1. Inputs
Table A.1.: Comparison of total emission rates for commercial vessels from differentin-water cleaning scenarios. Reproduced from Table 5.13 in Morrisey et al.(2013).
Vessel sizeclass (m)
Vesselsurface area(m2)
No. vesselsbeingcleaned
Paint type Cleaningtype
Totalemissionrates (g/d)
Different number of vessels200-250 10469 0.00274 SPC-low Soft 24200-250 10469 0.0274 SPC-low Soft 244200-250 10469 0.137 SPC-low Soft 1219200-250 10469 0.274 SPC-low Soft 2438200-250 10469 1 SPC-low Soft 8899200-250 10469 2 SPC-low Soft 17797Different vessel sizes<50 412 1 SPC-low Soft 35050-100 1163 1 SPC-low Soft 989100-150 3231 1 SPC-low Soft 2746150-200 6333 1 SPC-low Soft 5383200-250 10469 1 SPC-low Soft 8899250-300 15640 1 SPC-low Soft 13294Sides only<50 137 1 SPC-low Soft 11650-100 388 1 SPC-low Soft 330100-150 1077 1 SPC-low Soft 915150-200 2111 1 SPC-low Soft 1794200-250 3490 1 SPC-low Soft 2967250-300 5213 1 SPC-low Soft 4431Boot-tops only<50 73 1 SPC-low Soft 6250-100 163 1 SPC-low Soft 139100-150 270 1 SPC-low Soft 230150-200 728 1 SPC-low Soft 619
Continued on next page
Bloomfield 2020 Cen t r e o f Exce l l en ce f o rB i o se cu r i t y R i sk Ana l y s i s
Table A.1 – Continued from previous pageVessel sizeclass (m)
Vesselsurface area(m2)
No. vesselsbeingcleaned
Paint type Cleaningtype
Totalemissionrates (g/d)
200-250 932 1 SPC-low Soft 792250-300 1140 1 SPC-low Soft 969Different paint types200-250 10469 1 SPC-low Soft 8899200-250 10469 1 Ablative-low Soft 11516Upper release estimate200-250 10469 1 SPC-high Soft 65431200-250 10469 1 Ablative-high Soft 68049Different cleaning methods200-250 10469 1 SPC-low Aggressive 329250200-250 10469 1 SPC-high Aggressive 442315200-250 10469 1 Ablative-low Aggressive 208752200-250 10469 1 Ablative-high Aggressive 344430
30

Bloomfield 2020 Cen t r e o f Exce l l en ce f o rB i o se cu r i t y R i sk Ana l y s i s
A.2. Results
A.2.1. Reproducing Morrisey et al. (2013) results
(a) Results using the input parameters from Morrisey et al. (2013).
(b) Figure reproduced from Morrisey et al. (2013).
Figure A.1.: Comparing results from Morrisey et al. (2013) for recreational vessels withour results using their input parameters.
31

Bloomfield 2020 Cen t r e o f Exce l l en ce f o rB i o se cu r i t y R i sk Ana l y s i s
A.2.2. Applying Morrisey et al. (2013) (NZ) to all Summerson et al.(2019) (AUS) ports
A.2.2.1. Total copper in harbour
32

Bloomfield 2020 Cen t r e o f Exce l l en ce f o rB i o se cu r i t y R i sk Ana l y s i s
(a) Frequency of ship cleans. (b) Length of ship.
(c) Length of ship (cleaning sides only). (d) Length of ship (cleaning boot tops only).
(e) Paint type and level of copper in the leachedlayer, with soft cleaning.
(f) Paint type and level of copper in the leachedlayer, with aggressive cleaning.
Figure A.2.: Copper loads within harbour under a number of different in-watercleaning scenarios for Port of Brisbane. Red denotes MAMPEC version 3.0,and black is version 3.1. Circles denote average concentration, and crossesare the maximum and minimum. The horizontal lines are the ANZECC95%, 90% and 80% guideline values for dissolved copper, or the screeningand highly contaminated trigger concentrations for sediments from thedredging guidelines. Unless otherwise mentioned scenarios assume shipsare 200-250m long, have an SPC antifoulant coating, use soft cleaning, havea low level (2%) of copper remaining in the leached layer, and a ship iscleaned in the port daily.
33
Bloomfield 2020 Cen t r e o f Exce l l en ce f o rB i o se cu r i t y R i sk Ana l y s i s
(a) Frequency of ship cleans. (b) Length of ship.
(c) Length of ship (cleaning sides only). (d) Length of ship (cleaning boot tops only).
(e) Paint type and level of copper in the leachedlayer, with soft cleaning.
(f) Paint type and level of copper in the leachedlayer, with aggressive cleaning.
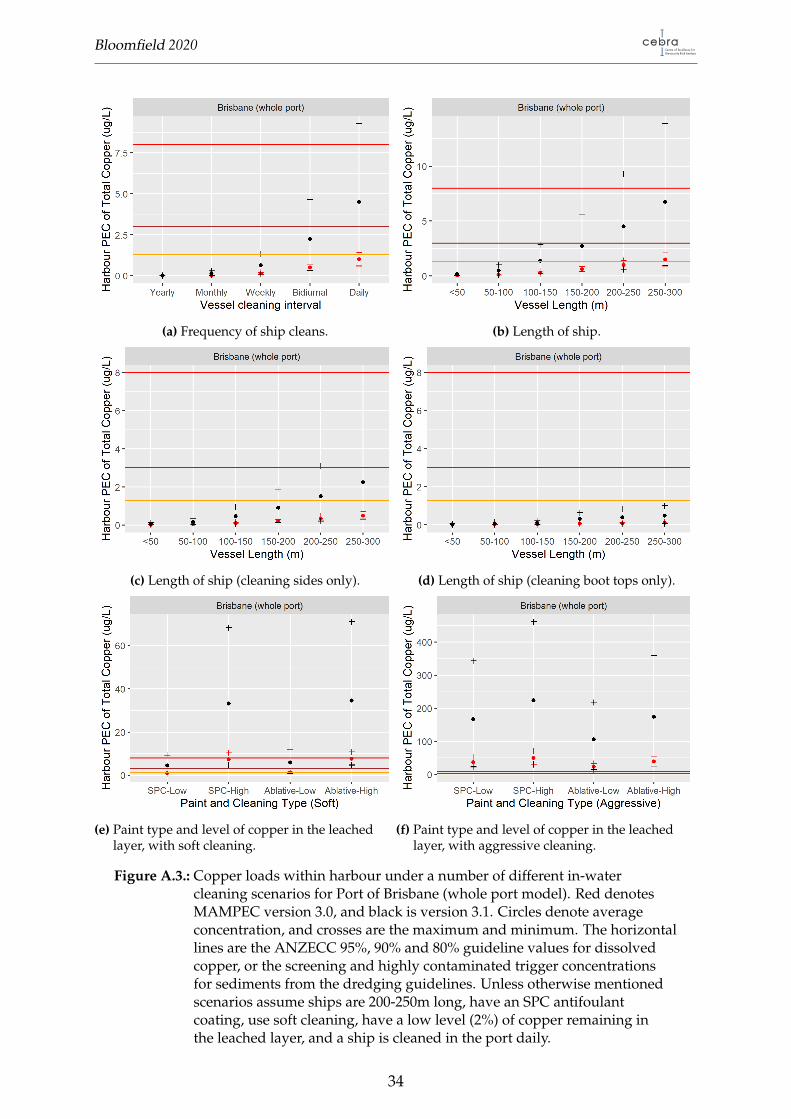
Figure A.3.: Copper loads within harbour under a number of different in-watercleaning scenarios for Port of Brisbane (whole port model). Red denotesMAMPEC version 3.0, and black is version 3.1. Circles denote averageconcentration, and crosses are the maximum and minimum. The horizontallines are the ANZECC 95%, 90% and 80% guideline values for dissolvedcopper, or the screening and highly contaminated trigger concentrationsfor sediments from the dredging guidelines. Unless otherwise mentionedscenarios assume ships are 200-250m long, have an SPC antifoulantcoating, use soft cleaning, have a low level (2%) of copper remaining inthe leached layer, and a ship is cleaned in the port daily.
34
Bloomfield 2020 Cen t r e o f Exce l l en ce f o rB i o se cu r i t y R i sk Ana l y s i s
(a) Frequency of ship cleans. (b) Length of ship.
(c) Length of ship (cleaning sides only). (d) Length of ship (cleaning boot tops only).
(e) Paint type and level of copper in the leachedlayer, with soft cleaning.
(f) Paint type and level of copper in the leachedlayer, with aggressive cleaning.
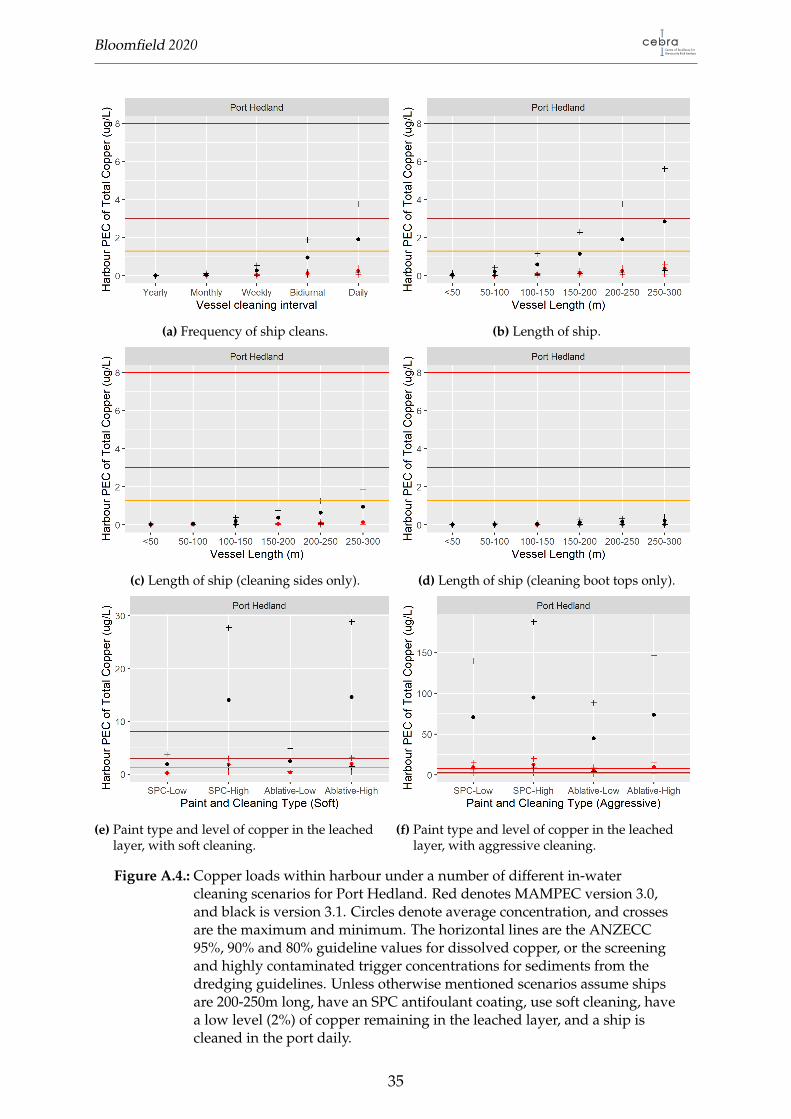
Figure A.4.: Copper loads within harbour under a number of different in-watercleaning scenarios for Port Hedland. Red denotes MAMPEC version 3.0,and black is version 3.1. Circles denote average concentration, and crossesare the maximum and minimum. The horizontal lines are the ANZECC95%, 90% and 80% guideline values for dissolved copper, or the screeningand highly contaminated trigger concentrations for sediments from thedredging guidelines. Unless otherwise mentioned scenarios assume shipsare 200-250m long, have an SPC antifoulant coating, use soft cleaning, havea low level (2%) of copper remaining in the leached layer, and a ship iscleaned in the port daily.
35

Bloomfield 2020 Cen t r e o f Exce l l en ce f o rB i o se cu r i t y R i sk Ana l y s i s
(a) Frequency of ship cleans. (b) Length of ship.
(c) Length of ship (cleaning sides only). (d) Length of ship (cleaning boot tops only).
(e) Paint type and level of copper in the leachedlayer, with soft cleaning.
(f) Paint type and level of copper in the leachedlayer, with aggressive cleaning.
Figure A.5.: Copper loads within harbour under a number of different in-watercleaning scenarios for Geelong (Corio Quay). Red denotes MAMPECversion 3.0, and black is version 3.1. Circles denote average concentration,and crosses are the maximum and minimum. The horizontal lines are theANZECC 95%, 90% and 80% guideline values for dissolved copper, or thescreening and highly contaminated trigger concentrations for sedimentsfrom the dredging guidelines. Unless otherwise mentioned scenariosassume ships are 200-250m long, have an SPC antifoulant coating, use softcleaning, have a low level (2%) of copper remaining in the leached layer,and a ship is cleaned in the port daily.
36

Bloomfield 2020 Cen t r e o f Exce l l en ce f o rB i o se cu r i t y R i sk Ana l y s i s
(a) Frequency of ship cleans. (b) Length of ship.
(c) Length of ship (cleaning sides only). (d) Length of ship (cleaning boot tops only).
(e) Paint type and level of copper in the leachedlayer, with soft cleaning.
(f) Paint type and level of copper in the leachedlayer, with aggressive cleaning.
Figure A.6.: Copper loads within harbour under a number of different in-watercleaning scenarios for Port of Melbourne (Swanson dock). Red denotesMAMPEC version 3.0, and black is version 3.1. Circles denote averageconcentration, and crosses are the maximum and minimum. The horizontallines are the ANZECC 95%, 90% and 80% guideline values for dissolvedcopper, or the screening and highly contaminated trigger concentrationsfor sediments from the dredging guidelines. Unless otherwise mentionedscenarios assume ships are 200-250m long, have an SPC antifoulantcoating, use soft cleaning, have a low level (2%) of copper remaining inthe leached layer, and a ship is cleaned in the port daily.
37

Bloomfield 2020 Cen t r e o f Exce l l en ce f o rB i o se cu r i t y R i sk Ana l y s i s
(a) Frequency of ship cleans. (b) Length of ship.
(c) Length of ship (cleaning sides only). (d) Length of ship (cleaning boot tops only).
(e) Paint type and level of copper in the leachedlayer, with soft cleaning.
(f) Paint type and level of copper in the leachedlayer, with aggressive cleaning.
Figure A.7.: Copper loads within harbour under a number of different in-watercleaning scenarios for Port of Melbourne (Appleton dock). Red denotesMAMPEC version 3.0, and black is version 3.1. Circles denote averageconcentration, and crosses are the maximum and minimum. The horizontallines are the ANZECC 95%, 90% and 80% guideline values for dissolvedcopper, or the screening and highly contaminated trigger concentrationsfor sediments from the dredging guidelines. Unless otherwise mentionedscenarios assume ships are 200-250m long, have an SPC antifoulantcoating, use soft cleaning, have a low level (2%) of copper remaining inthe leached layer, and a ship is cleaned in the port daily.
38

Bloomfield 2020 Cen t r e o f Exce l l en ce f o rB i o se cu r i t y R i sk Ana l y s i s
(a) Frequency of ship cleans. (b) Length of ship.
(c) Length of ship (cleaning sides only). (d) Length of ship (cleaning boot tops only).
(e) Paint type and level of copper in the leachedlayer, with soft cleaning.
(f) Paint type and level of copper in the leachedlayer, with aggressive cleaning.
Figure A.8.: Copper loads within harbour under a number of different in-watercleaning scenarios for Port of Melbourne (Webb dock). Red denotesMAMPEC version 3.0, and black is version 3.1. Circles denote averageconcentration, and crosses are the maximum and minimum. The horizontallines are the ANZECC 95%, 90% and 80% guideline values for dissolvedcopper, or the screening and highly contaminated trigger concentrationsfor sediments from the dredging guidelines. Unless otherwise mentionedscenarios assume ships are 200-250m long, have an SPC antifoulantcoating, use soft cleaning, have a low level (2%) of copper remaining inthe leached layer, and a ship is cleaned in the port daily.
39

Bloomfield 2020 Cen t r e o f Exce l l en ce f o rB i o se cu r i t y R i sk Ana l y s i s
(a) Frequency of ship cleans. (b) Length of ship.
(c) Length of ship (cleaning sides only). (d) Length of ship (cleaning boot tops only).
(e) Paint type and level of copper in the leachedlayer, with soft cleaning.
(f) Paint type and level of copper in the leachedlayer, with aggressive cleaning.
Figure A.9.: Copper loads within harbour under a number of different in-watercleaning scenarios for Port Phillip Bay. Red denotes MAMPEC version 3.0,and black is version 3.1. Circles denote average concentration, and crossesare the maximum and minimum. The horizontal lines are the ANZECC95%, 90% and 80% guideline values for dissolved copper, or the screeningand highly contaminated trigger concentrations for sediments from thedredging guidelines. Unless otherwise mentioned scenarios assume shipsare 200-250m long, have an SPC antifoulant coating, use soft cleaning, havea low level (2%) of copper remaining in the leached layer, and a ship iscleaned in the port daily.
40

Bloomfield 2020 Cen t r e o f Exce l l en ce f o rB i o se cu r i t y R i sk Ana l y s i s
A.2.2.2. Copper concentration in sediments after 10 years
41

Bloomfield 2020 Cen t r e o f Exce l l en ce f o rB i o se cu r i t y R i sk Ana l y s i s
(a) Frequency of ship cleans. (b) Length of ship.
(c) Length of ship (cleaning sides only). (d) Length of ship (cleaning boot tops only).
(e) Paint type and level of copper in the leachedlayer, with soft cleaning.
(f) Paint type and level of copper in the leachedlayer, with aggressive cleaning.
Figure A.10.: Copper loads within harbour under a number of different in-watercleaning scenarios for Port of Brisbane (whole port model) (sediments).Red denotes MAMPEC version 3.0, and black is version 3.1. Circlesdenote average concentration, and crosses are the maximum andminimum. The horizontal lines are the ANZECC 95%, 90% and 80%guideline values for dissolved copper, or the screening and highlycontaminated trigger concentrations for sediments from the dredgingguidelines. Unless otherwise mentioned scenarios assume ships are200-250m long, have an SPC antifoulant coating, use soft cleaning, havea low level (2%) of copper remaining in the leached layer, and a ship iscleaned in the port daily.
42

Bloomfield 2020 Cen t r e o f Exce l l en ce f o rB i o se cu r i t y R i sk Ana l y s i s
(a) Frequency of ship cleans. (b) Length of ship.
(c) Length of ship (cleaning sides only). (d) Length of ship (cleaning boot tops only).
(e) Paint type and level of copper in the leachedlayer, with soft cleaning.
(f) Paint type and level of copper in the leachedlayer, with aggressive cleaning.
Figure A.11.: Copper loads within harbour under a number of different in-watercleaning scenarios for Port of Brisbane (sediments). Red denotesMAMPEC version 3.0, and black is version 3.1. Circles denote averageconcentration, and crosses are the maximum and minimum. Thehorizontal lines are the ANZECC 95%, 90% and 80% guideline valuesfor dissolved copper, or the screening and highly contaminated triggerconcentrations for sediments from the dredging guidelines. Unlessotherwise mentioned scenarios assume ships are 200-250m long, have anSPC antifoulant coating, use soft cleaning, have a low level (2%) of copperremaining in the leached layer, and a ship is cleaned in the port daily.
43

Bloomfield 2020 Cen t r e o f Exce l l en ce f o rB i o se cu r i t y R i sk Ana l y s i s
(a) Frequency of ship cleans. (b) Length of ship.
(c) Length of ship (cleaning sides only). (d) Length of ship (cleaning boot tops only).
(e) Paint type and level of copper in the leachedlayer, with soft cleaning.
(f) Paint type and level of copper in the leachedlayer, with aggressive cleaning.
Figure A.12.: Copper loads within harbour under a number of different in-watercleaning scenarios for Port Hedland (sediments). Red denotes MAMPECversion 3.0, and black is version 3.1. Circles denote average concentration,and crosses are the maximum and minimum. The horizontal lines are theANZECC 95%, 90% and 80% guideline values for dissolved copper, or thescreening and highly contaminated trigger concentrations for sedimentsfrom the dredging guidelines. Unless otherwise mentioned scenariosassume ships are 200-250m long, have an SPC antifoulant coating, use softcleaning, have a low level (2%) of copper remaining in the leached layer,and a ship is cleaned in the port daily.
44

Bloomfield 2020 Cen t r e o f Exce l l en ce f o rB i o se cu r i t y R i sk Ana l y s i s
(a) Frequency of ship cleans. (b) Length of ship.
(c) Length of ship (cleaning sides only). (d) Length of ship (cleaning boot tops only).
(e) Paint type and level of copper in the leachedlayer, with soft cleaning.
(f) Paint type and level of copper in the leachedlayer, with aggressive cleaning.
Figure A.13.: Copper loads within harbour under a number of different in-watercleaning scenarios for Geelong (Corio Quay) (sediments). Red denotesMAMPEC version 3.0, and black is version 3.1. Circles denote averageconcentration, and crosses are the maximum and minimum. Thehorizontal lines are the ANZECC 95%, 90% and 80% guideline valuesfor dissolved copper, or the screening and highly contaminated triggerconcentrations for sediments from the dredging guidelines. Unlessotherwise mentioned scenarios assume ships are 200-250m long, have anSPC antifoulant coating, use soft cleaning, have a low level (2%) of copperremaining in the leached layer, and a ship is cleaned in the port daily.
45

Bloomfield 2020 Cen t r e o f Exce l l en ce f o rB i o se cu r i t y R i sk Ana l y s i s
(a) Frequency of ship cleans. (b) Length of ship.
(c) Length of ship (cleaning sides only). (d) Length of ship (cleaning boot tops only).
(e) Paint type and level of copper in the leachedlayer, with soft cleaning.
(f) Paint type and level of copper in the leachedlayer, with aggressive cleaning.
Figure A.14.: Copper loads within harbour under a number of different in-watercleaning scenarios for Port of Melbourne (Swanson dock) (sediments).Red denotes MAMPEC version 3.0, and black is version 3.1. Circlesdenote average concentration, and crosses are the maximum andminimum. The horizontal lines are the ANZECC 95%, 90% and 80%guideline values for dissolved copper, or the screening and highlycontaminated trigger concentrations for sediments from the dredgingguidelines. Unless otherwise mentioned scenarios assume ships are200-250m long, have an SPC antifoulant coating, use soft cleaning, havea low level (2%) of copper remaining in the leached layer, and a ship iscleaned in the port daily.
46

Bloomfield 2020 Cen t r e o f Exce l l en ce f o rB i o se cu r i t y R i sk Ana l y s i s
(a) Frequency of ship cleans. (b) Length of ship.
(c) Length of ship (cleaning sides only). (d) Length of ship (cleaning boot tops only).
(e) Paint type and level of copper in the leachedlayer, with soft cleaning.
(f) Paint type and level of copper in the leachedlayer, with aggressive cleaning.
Figure A.15.: Copper loads within harbour under a number of different in-watercleaning scenarios for Port of Melbourne (Appleton dock) (sediments).Red denotes MAMPEC version 3.0, and black is version 3.1. Circlesdenote average concentration, and crosses are the maximum andminimum. The horizontal lines are the ANZECC 95%, 90% and 80%guideline values for dissolved copper, or the screening and highlycontaminated trigger concentrations for sediments from the dredgingguidelines. Unless otherwise mentioned scenarios assume ships are200-250m long, have an SPC antifoulant coating, use soft cleaning, havea low level (2%) of copper remaining in the leached layer, and a ship iscleaned in the port daily.
47
Bloomfield 2020 Cen t r e o f Exce l l en ce f o rB i o se cu r i t y R i sk Ana l y s i s
(a) Frequency of ship cleans. (b) Length of ship.
(c) Length of ship (cleaning sides only). (d) Length of ship (cleaning boot tops only).
(e) Paint type and level of copper in the leachedlayer, with soft cleaning.
(f) Paint type and level of copper in the leachedlayer, with aggressive cleaning.
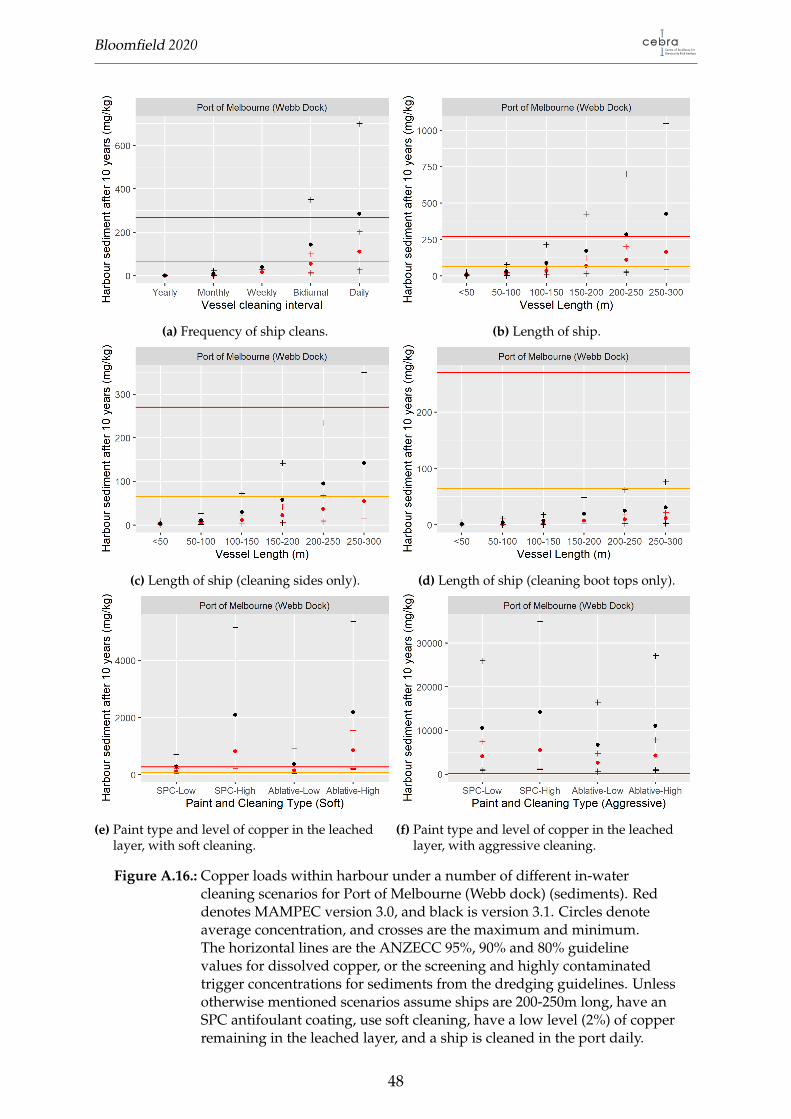
Figure A.16.: Copper loads within harbour under a number of different in-watercleaning scenarios for Port of Melbourne (Webb dock) (sediments). Reddenotes MAMPEC version 3.0, and black is version 3.1. Circles denoteaverage concentration, and crosses are the maximum and minimum.The horizontal lines are the ANZECC 95%, 90% and 80% guidelinevalues for dissolved copper, or the screening and highly contaminatedtrigger concentrations for sediments from the dredging guidelines. Unlessotherwise mentioned scenarios assume ships are 200-250m long, have anSPC antifoulant coating, use soft cleaning, have a low level (2%) of copperremaining in the leached layer, and a ship is cleaned in the port daily.
48

Bloomfield 2020 Cen t r e o f Exce l l en ce f o rB i o se cu r i t y R i sk Ana l y s i s
(a) Frequency of ship cleans. (b) Length of ship.
(c) Length of ship (cleaning sides only). (d) Length of ship (cleaning boot tops only).
(e) Paint type and level of copper in the leachedlayer, with soft cleaning.
(f) Paint type and level of copper in the leachedlayer, with aggressive cleaning.
Figure A.17.: Copper loads within harbour under a number of different in-watercleaning scenarios for Port Phillip Bay (sediments). Red denotesMAMPEC version 3.0, and black is version 3.1. Circles denote averageconcentration, and crosses are the maximum and minimum. Thehorizontal lines are the ANZECC 95%, 90% and 80% guideline valuesfor dissolved copper, or the screening and highly contaminated triggerconcentrations for sediments from the dredging guidelines. Unlessotherwise mentioned scenarios assume ships are 200-250m long, have anSPC antifoulant coating, use soft cleaning, have a low level (2%) of copperremaining in the leached layer, and a ship is cleaned in the port daily.
49