mamma mia! - public.websteronline.com · market insights 1 ——— june 2018 mamma mia! here we...
TRANSCRIPT
MARKET
Insights
1———
June 2018
Mamma Mia!
Here we go again. Recent volatility in the stock market was driven by troublesome politics in the Eurozone. The latest cause for anxiety is the newly elected, anti-Euro populist government in Italy, a nation with both the third largest economy in the Eurozone and the third largest bond market in the world. European stocks and the Euro currency declined in late May over fears about “Quitaly” – the possibility of Italy withdrawing from theEuropean currency, or even the European Union.Italians do have a reason to be upset with the Euro.They have not benefited from the single currencysystem to the same extent as Germany or evenFrance. Italian income per capita remains near thesame level as twenty years ago. Although a break-up of the Eurozone remains a remote outcome, itis not inconceivable, as the UK “Brexit” from theEU demonstrated just two years ago. In addition,the unilateral imposition of steel and aluminumtariffs by the Trump administration upon alliesin Europe and North America provoked tit-for-tatresponses against American goods. According to theUS Chamber of Commerce, this may result in theloss of up to 2.6 million jobs across various USmanufacturing industries.
What does this mean for investors? On the surface, the Eurozone turmoil and nascent trade wars seem to threaten the current bull market in stocks. However, as a sage Italian put it 505 years ago,
We point out both US and European stock markets are within 5% of their all-time highs inJanuary. Both corporate and economic growth trends still remain intact. Most global bond markets yield more than they did a year ago, indicating that investors expect these growth trends to continue. The recent decline in international stock markets and foreign currencies relative to the US, have made those assets even more attractively valued. We are comfortable keeping our clients’ current allocations to international and emerging markets in light of what the fundamental values are, rather than reacting to how dire short-term events may seem.
Market Returns in 2018 Through May 31st
US Large Cap (S&P 500) 2.0%
US Small Cap (Russell 2000) 6.9%
International (MSCI EAFE) -1.5%
Emerging Markets (MSCI EM) -2.6%
Source: FactSet indexes through May 31, 2018. Total returns in USD.
“The great majority ofmankind are...often more influenced by the things that seem, than those that are.”
Niccolo Machiavelli
MARKET Insights
Double Dutch – The Intertwined Performance of US and International Stock Markets
Like Double Dutch jump ropes turning in opposite directions, the performance differences between different regions of the world rise and fall in an almost synchronized manner. This is due to the normal divergences in growth among businesses operating in different industries and in different corners of the global economy. Corporate profits in one country may be accelerating due to population growth, improved technology, credit growth or new terms of trade. Others may get weighed down by a recession, a shrinking population, excessive debt or falling export earnings. At a global level, financial markets discount these differences. And, as the different fortunes change, markets adjust pricing, with yesterday’s dogs becoming new performers and today’s stars fading from prominence.
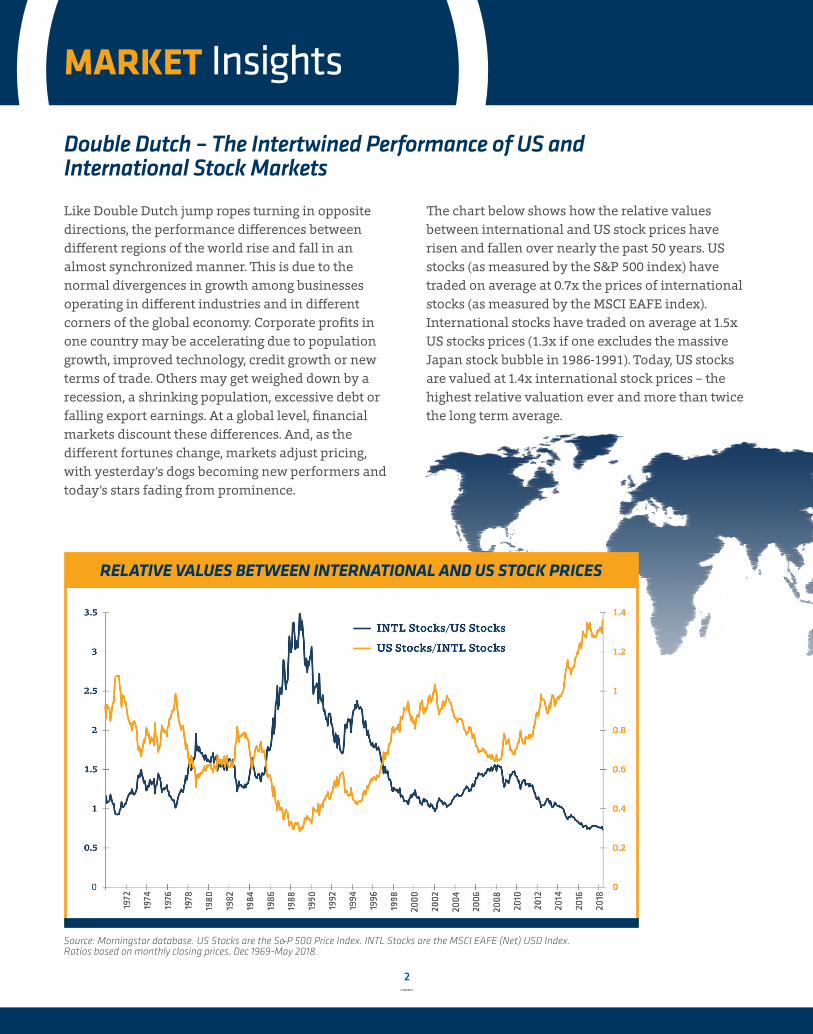
The chart below shows how the relative values between international and US stock prices have risen and fallen over nearly the past 50 years. US stocks (as measured by the S&P 500 index) have traded on average at 0.7x the prices of international stocks (as measured by the MSCI EAFE index). International stocks have traded on average at 1.5x US stocks prices (1.3x if one excludes the massive Japan stock bubble in 1986-1991). Today, US stocks are valued at 1.4x international stock prices – the highest relative valuation ever and more than twice the long term average.
Source: Morningstar database. US Stocks are the S&P 500 Price Index. INTL Stocks are the MSCI EAFE (Net) USD Index. Ratios based on monthly closing prices, Dec 1969-May 2018.
RELATIVE VALUES BETWEEN INTERNATIONAL AND US STOCK PRICES
2———

What should investors expect when one region is at an extreme valuation over another? There have been only a few occasions like today when either the US or international market massively outran the other. In those instances, the previously stronger stock market went on to significantly underperform for the next five years. For example, at the end of the dot-com and telecom bust in early 2002, US stocks traded at more than 1.1x international stock prices. Over the ensuing five years, from Jan 2002 to Jan 2007, US stock prices (excluding dividends) gained +4.9% on an
annualized basis. However, this was swamped by the +13.8% annualized return that internationalstocks delivered over the same period. As the table below demonstrates, reversing fortunes played out after other levels of extreme valuations of one region over another. Today’s apparently overvalued US stock prices may not foretell an imminent stock market crash. However, looking forward several years, portfolios that hold non-US stocks have better odds of out-performing those that hold only US companies today.
US STOCK OUTPERFORMANCE IS FOLLOWED BY INTERNATIONAL STOCK OUTPERFORMANCE, AND VICE-VERSA
Next 5 Year Annualized GainsINTL vs. US Valuation Date What Was
Happening US Stocks INTL Stocks Difference
3.5x Nov 1988 Japan Stock and Property Bubble +11.0% -0.9% +11.9%
1.6x Feb 2008Euro and Oil
Bubble, Subprime Crisis
+2.6% -4.2% +6.9%
US vs. INTL Valuation
1.1x Feb 1971 "Nifty Fifty" US Stock Craze +0.6% +6.3% -5.7%
1.0x Oct 1976End of Oil
Embargoes and Vietnam War
+3.4% +11.7% -8.3%
1.0x Jan 2002 Dot-Com and Telecom Bust +4.9% +13.8% -8.9%
1.4x May 2018 US Tech Stock Rally ? ? ?
Source: Morningstar database. US Stocks are the S&P 500 Price Index. INTL Stocks are the MSCI EAFE (Net) USD Index. Monthly closing prices, Dec 1969-May 2018. Webster Private Bank calculations.
3———
MARKET Insights
We hope you’ve found this commentary helpful. When you’re ready to put these insights into action, visit www.WebsterBank.com/pb, contact your Webster Private Bank Portfolio Manager, or email us at [email protected].
TO VIEW A MORE DETAILED DESCRIPTION AND ANALYSIS OF THESE INSIGHTS, VISIT WWW.WEBSTERBANK.COM/PB.Investment, trust, credit and banking services are offered by Webster Private Bank, a division of Webster Bank, N.A. Investment products offered by Webster Private Bank are not FDIC or government insured; are not guaranteed by Webster Bank; may involve investment risks, including loss of principal amount invested; and are not deposits or other obligations of Webster Bank.Webster Private Bank is not in the business of providing tax or legal advice. Consult with your independent attorney, tax consultant or other professional advisor for final recommendations and before changing or implementing any financial, tax or estate planning advice.SEI Investments Management Corp. (SIMC) and Webster Private Bank are independent entities. SIMC is the investment advisor to the SEI Funds and co-advisor to the Individual Managed Account Program (IMAP). SEI Funds are distributed by SEI Investment Distribution Co. (SIDCO). SIMC and SIDCO are wholly owned subsidiaries of SEI Investments Company.The Webster symbol is a registered trademark in the U.S. Webster Bank, N.A. Member FDIC. Equal Housing Lender ©2018 Webster Financial Corporation. All rights reserved.
Italian populist politics and recent trade barriers by the US have caused more gyrations in the stock market than we believe is warranted. Volatile days will probably come and go as anti-Euro politics and trade negotiations remain in the headlines. The European Union has demonstrated both motivation and capacity to defend the currency and we believe any true threat will be dealt with effectively. Any reorganization of trade terms will produce different winners and losers, yet both stock and bond markets recently have shrugged off the impact of such policies on the economy’s current growth.
While these issues have changed some investors’ thoughts on the path forward, we recommend no adjustments to our portfolio strategy at this juncture, given that economic growth trends are still intact globally. If anything, the recent weakness in markets outside the US encourages us to shift client Equity allocations towards international and emerging markets, as they represent better values of earnings, assets and dividends. The fact that some markets have fallen already means they may have even less potential downside than US stocks today.
History has shown that, when values separate as extremely as they have now between the US and international markets, investors who rebalance into cheaper global markets are compensated with higher returns in the subsequent years. The manner in which this adjustment is made is unique to each client portfolio, depending on its tax, liquidity and risk objectives. As always, we encourage you to continue your dialogue with your personal Portfolio Manager at Webster Private Bank. We remain accountable to you and want you to reach your objectives successfully.
Conclusion – The Path Forward
4———