malpensa a-smgcs v&v results -...
TRANSCRIPT

6th FP Project FP6 -503192
© 2007, EC Sponsored Project EMMA (Copyright Notice in accordance with ISO 16016) The reproduction, distribution and utilisation of this document as well as the communication of its contents to other without explicit authorisation is prohibited. This document and the information contained herein is the property of Deutsches Zentrum für Luft- und Raumfahrt and the EMMA project partners. Offenders will be held liable for the payment of damages. All rights reserved in the event of the grant of a patent, utility model or design. The results and findings described in this document have been elaborated under a contract awarded by the European Commission, under contract FP6 -503192.
Malpensa A-SMGCS V&V Results
S. Carotenuto, J. Teutsch
SICTA, NLR
Project Funded by European Commission, DG TREN The Sixth Framework Programme Strengthening the competitiveness
Contract FP6 -503192
Project Manager Michael Roeder
Deutsches Zentrum für Luft und Raumfahrt Lilienthalplatz 7, D-38108 Braunschweig, Germany
Phone: +49 (0) 531 295 3026, Fax: +49 (0) 531 295 2180 e-mail: [email protected]
Web page: http://www.dlr.de/emma
Document No: D6.5.1 Version No. 1.00
Classification: Public Number of pages: 127

1.4 Aeronautics and Space
Project FP6-503192 “EMMA1” EMMA SP6 - Malpensa A-SMGCS V&V Results
Page 2
Save Date: 2007-05-24 Public 2 File Name: D651_Results_MXP_V1.0.doc Version 1.00
Distribution List
Member Type No. Name POC Distributed
Internet http://www.dlr.de/emma 2007-05-18 Web Intranet https://extsites.dlr.de/fl/emma 2007-05-18 1 DLR Jörn Jakobi 2 AENA Mario Parra 3 AIF Patrick Lelievre 4 AMS Giuliano D'Auria 5 ANS CR Miroslav Tykal 6 BAES Stephen Broatch 7 STAR Jens Olthoff 8 DSNA Nicolas Marcou 9 ENAV Antonio Nuzzo 10 NLR Jürgen Teutsch 11 PAS Alan Gilbert 12 TATM Stephane Paul 13 THAV Alain Tabard 14 AHA David Gleave 15 AUEB Konstantinos G.Zografos 16 CSL Libor Kurzweil 17 DAV Rolf Schroeder 18 DFS Klaus-Rüdiger Täglich 19 EEC Stephane Dubuisson 20 ERA Jan Hrabanek 21 ETG Thomas Wittig 22 MD Julia Payne 23 SICTA Salvatore Carotenuto
Contractor
24 TUD Christoph Vernaleken CSA Karel Muendel Sub-Contractor N.N.
Customer EC Morten Jensen
Additional EUROCONTROL Paul Adamson

1.4 Aeronautics and Space
Project FP6-503192 “EMMA1” EMMA SP6 - Malpensa A-SMGCS V&V Results
Page 3
Save Date: 2007-05-24 Public 3 File Name: D651_Results_MXP_V1.0.doc Version 1.00
Document Control Sheet Project Manager: M. Roeder Responsible Author: Salvatore Carotenuto, Jürgen Teutsch SICTA, NLR
Daniele Teotino ENAV Antonio Nuzzo ENAV Massimo Capuano SICTA Tanja Bos NLR
Additional Authors:
Subject / Title of Document: Malpensa A-SMGCS V&V Results Related Task(s): WP6.5 Deliverable No.: D6.5.1 Save Date of File: 2007-05-16 Document Version: 1.00 Reference / File Name: D651_Results_MXP_V1.0.doc Number of Pages: 127 Dissemination Level: Public Target Date: 2007-05-18
Change Control List (Change Log) Date Issue Changed Chapters Comment 2006-04-03 0.01 All First draft 0.02 Sec. 2 and 4 Integration of results collected both from
technical verification and shadow-mode trial activities (ENAV/SELEX/SICTA)
2006-05-24 0.03 Sec. 3 Integration of RTS results for capacity and efficiency (NLR)
2006-09-29 0.04 All Integration of RTS results (Safety) and final consolidation (SICTA)
2006-10-03 0.05 All Final consolidation (SICTA/NLR) 2006-10-05 0.06 All Final layout changes (NLR) 2007-04-01 1.00 European Commission Comments 2007-05-21 approved

1.4 Aeronautics and Space
Project FP6-503192 “EMMA1” EMMA SP6 - Malpensa A-SMGCS V&V Results
Page 4
Save Date: 2007-05-24 Public 4 File Name: D651_Results_MXP_V1.0.doc Version 1.00
Table of Contents Distribution List ...................................................................................................................................... 2 Document Control Sheet ......................................................................................................................... 3 Change Control List (Change Log) ......................................................................................................... 3 1 Introduction .......................................................................................................................................... 6
1.1 Document Context......................................................................................................................... 6 1.1.1 EMMA Phase 1 Project Background ..................................................................................... 6 1.1.2 EMMA SP6 Background........................................................................................................ 7 1.1.3 EMMA WP6.5 Context .......................................................................................................... 8 1.1.4 Scope of the Verification and Validation Exercises ............................................................... 9
1.2 Document Purpose ........................................................................................................................ 9 1.3 Document Scope............................................................................................................................ 9
2 Verification Trials .............................................................................................................................. 10 2.1 Introduction ................................................................................................................................. 10 2.2 Data Description and Data Collection Methods.......................................................................... 11
2.2.1 Raw Data .............................................................................................................................. 11 2.2.2 Additional Data .................................................................................................................... 14
2.3 Data Analysis .............................................................................................................................. 14 2.3.1 Short-term Data Analysis ..................................................................................................... 14 2.3.2 Long-term Data Analysis ..................................................................................................... 18
2.4 Results ......................................................................................................................................... 19 2.4.1 Short-term and Long-term Results ....................................................................................... 19
3 Malpensa Real-time Simulations at NARSIM-Tower ....................................................................... 25 3.1 Introduction ................................................................................................................................. 25 3.2 Data Description and Data Collection Methods.......................................................................... 26
3.2.1 Verification Exercises .......................................................................................................... 26 3.2.2 Validation Exercises............................................................................................................. 29
3.3 Data Analysis and Results ........................................................................................................... 38 3.3.1 MA-SCA Tool Verification.................................................................................................. 38 3.3.2 Real-time Validation of A-SMGCS ..................................................................................... 42
4 Shadow-mode Trials........................................................................................................................... 84 4.1 Introduction ................................................................................................................................. 84 4.2 Data Description and Data Collection Methods.......................................................................... 85 4.3 Data Analysis .............................................................................................................................. 87
4.3.1 Safety and Human Factors Indicators: ................................................................................. 87 4.3.2 Capacity and Efficiency Indicators ...................................................................................... 87
4.4 Results ......................................................................................................................................... 88 4.4.1 Safety.................................................................................................................................... 88 4.4.2 Capacity................................................................................................................................ 89 4.4.3 Efficiency ............................................................................................................................. 91 4.4.4 Human Factors ..................................................................................................................... 93
5 Conclusions ........................................................................................................................................ 96 5.1 Verification.................................................................................................................................. 96 5.2 Real-time Simulations ................................................................................................................. 96
5.2.1 Safety.................................................................................................................................... 96 5.2.2 Capacity and Efficiency ....................................................................................................... 96 5.2.3 Human Factors ..................................................................................................................... 97
5.3 Shadow-mode Trials.................................................................................................................... 97 Appendix A - Shadow-mode Debriefing Questionnaires...................................................................... 99
A.1 Safety Questionnaire .................................................................................................................. 99 A.2 Capacity Questionnaire ............................................................................................................ 100

1.4 Aeronautics and Space
Project FP6-503192 “EMMA1” EMMA SP6 - Malpensa A-SMGCS V&V Results
Page 5
Save Date: 2007-05-24 Public 5 File Name: D651_Results_MXP_V1.0.doc Version 1.00
A.3 Efficiency Questionnaire .......................................................................................................... 104 A.4 Human Factors Questionnaires................................................................................................. 111
A.4.1 System Usability Scale (SUS) ........................................................................................... 111 A.4.2 Acceptance ........................................................................................................................ 112
Appendix B – MXP Mode S Transponder Op. Procedure .................................................................. 122 References ........................................................................................................................................... 123 Abbreviations ...................................................................................................................................... 125 Figures and Tables .............................................................................................................................. 126
List of Figures ................................................................................................................................. 126 List of Tables................................................................................................................................... 126

1.4 Aeronautics and Space
Project FP6-503192 “EMMA1” EMMA SP6 - Malpensa A-SMGCS V&V Results
Page 6
Save Date: 2007-05-24 Public 6 File Name: D651_Results_MXP_V1.0.doc Version 1.00
1 Introduction The first section of this document contains a description of the project context. The document thereby is positioned within the framework of activities for the ‘European Airport Movement Management by A-SMGCS’ (EMMA) project.
1.1 Document Context
1.1.1 EMMA Phase 1 Project Background Air transport in Europe - even in the wake of the events of September 11, the situation in Iraq and SARS - is experiencing growth and is expected to maintain and even increase growth rates over the following decades. Although the industry seems to remain mired in recession and still has to deal with security concerns, the sudden emergence of low-cost carriers applying new business models resulted in moderate traffic growth in 2003. In the Eurocontrol Statistical Reference Area (ESRA) traffic levels just about reached the level of the 2000 traffic total again (cf. Ref. [2]). Clearly, today there still is a need to respond to these public demands while maintaining a high level of safety in air traffic opera-tions.
In order to answer to the demands and cope with the consequences of growing air traffic in the future, which is boosted by globalisation of the world economy, the ATM 2000+ Strategy [3], defined a num-ber of major strategic objectives and named directions for change. Among the new concepts for a structural revision of the ATM processes are ‘Advanced Surface Movement Guidance and Control Systems’ (A-SMGCS). A-SMGCS is described as one of the most promising elements for achieving the necessary paradigm shift towards the year 2012 and beyond as airports are seen as the future bot-tlenecks of air transport.
The ‘European Airport Movement Management by A-SMGCS’ (EMMA) integrated project is set within the Sixth Framework Program of the European Commission (Directorate General for Energy and Transport) and looks at A-SMGCS as a holistic approach for changes in airport operations. It builds on the experiences of earlier projects such as ‘Operational Benefit Evaluation by Testing A-SMGCS’ (BETA) [4]. With BETA new technologies for data extraction, digitising, data fusion, data link and multilateration became available. Although A-SMGCS progressed from a demonstration status to a full operational system, the complete proof of benefit of A-SMGCS was missing. Therefore, EMMA is supposed to set the standards for A-SMGCS systems and their operational usage, safety and interoperability while also focussing at the benefit expectation in Europe.
In order to achieve this ambitious goal, EMMA is subdivided into two project phases. In the first phase an implementation of A-SMGCS Level I and II will be looked at as an initial step. While the Level I implementation merely seeks to enhance safety and efficiency on the ground by means of addi-tional surveillance services, the Level II implementation already looks at an automated control service which helps controllers to detect potentially dangerous conflicts on runways and restricted areas. In the second phase of the EMMA project the focus will be extended to a full-level A-SMGCS [8]. This means that Level III and Level IV functionality will be implemented. Level III allows for the sharing of traffic situation awareness among pilots and drivers on the airport and the introduction of an auto-mated routing function. Level IV will improve the Level III functions with conflict resolution adviso-ries for controllers and the up-link of a validated route planning to pilots and drivers.
The project is structured in six different sub-projects (SP). There are three ground-related sub-projects and one on-board-related sub-project representing the three different test sites and the on-board site. These four sub-projects are autonomous and independent, thereby representing the vertical columns of the project structure. The four columns are linked horizontally by two additional activities or sub-projects, namely the definition of the concept and the establishing of a consolidated methodology for

1.4 Aeronautics and Space
Project FP6-503192 “EMMA1” EMMA SP6 - Malpensa A-SMGCS V&V Results
Page 7
Save Date: 2007-05-24 Public 7 File Name: D651_Results_MXP_V1.0.doc Version 1.00
validation and verification of technical sub-systems. The present document will focus on the EMMA Phase 1 aspects of the latter activity.
1.1.2 EMMA SP6 Background In the near future, the demand for air transport in Europe is expected to increase considerably. Current airport capacity is expected to become one of the bottlenecks for further growth. This caused the European Union to support research on A-SMCGS in subsequent framework programs. These projects resulted in new A-SMGCS concepts, new systems, and new procedures. A common finding of these studies (like ATHOS, DEFAMM and BETA) is that validation practices are often insufficiently stan-dardised to cover the complexity of advanced technology implementation. At the same time, coherent and consistent validation is important for choosing the optimal concepts, systems and procedures.
Validation in the EMMA Phase 1 framework refers to all activities during the development of A-SMGCS concepts, systems and procedures aiming at implementing the right concept, procedure or system. The concept development itself is carried out in EMMA SP1 and thus is not a part of the work in this sub-project. Developing and implementing the right concepts, procedures and systems (in terms of safety, efficiency, usability etc.) is of utmost importance at a time where advances in ATM are ur-gently required.
Before successful validation takes place, verification, i.e. testing against system specifications should take place. This Sub-project (SP6) also covers the description of the verification phase. Only if verifi-cation results in an A-SMGCS performing at the required level, successful validation of the concept can be started. Therefore, the verification and validation effort (called V&V) also includes the defini-tion of minimum required performance criteria for verification, to allow for successful validation. The actual carrying out of verification and validation tasks takes place in other sub-projects of EMMA Phase 1.
In summary (see also Ref. [7]):
Verification is testing against predefined technical specifications, technical functional testing (‘did we build the system right?’).
Validation is testing against operational requirements (as defined by stakeholders and written down in the OSED document of EMMA SP1), man-in-the-loop, ATM procedure testing, case studies (‘did we build the right system?’).
The EMMA project proposal consists of six sub-projects, the last one being the verification and vali-dation sub-project described in more detail in the present document. The EMMA project was offered to the European Commission in two phases. The present specification deals with validation and verifi-cation in the first phase covering two years. The second phase will be carried out later and will con-centrate on even more advanced functions of A-SMGCS.
During the proposal phase of EMMA Phase 1, it was decided to use the ‘Master European Validation Plan (MAEVA)’ project approach to validation as the basis for EMMA Validation and Verification (V&V). The MAEVA approach is well accepted throughout the European ATM community and has been described in abundant detail in the MAEVA Validation Guideline Handbook, or VGH for short (see Ref. [5]). Nevertheless, several adaptations of MAEVA were proposed in Europe concentrating on the initial approach to validation activities and the related life cycle of the concept or technology to be validated. Eurocontrol summarised this proposal in their Operational Concept Validation Strategy Document, OCVSD for short (see Ref. [6]).
In order to account for the generally accepted MAEVA approach, the sub-project leader liaised closely with both the MAEVA and Co-operative Approach to Air Traffic Services (CAATS) project teams. The European Commission installed the CAATS project with the objective to co-ordinate safety, Hu-man Factors and validation processes and methodologies across ATM projects in the Sixth Frame-

1.4 Aeronautics and Space
Project FP6-503192 “EMMA1” EMMA SP6 - Malpensa A-SMGCS V&V Results
Page 8
Save Date: 2007-05-24 Public 8 File Name: D651_Results_MXP_V1.0.doc Version 1.00
work. CAATS identified best practices from these areas and brought the implied knowledge to all pro-jects of the framework. The sub-project leader stayed in close contact with EUROCONTROL, in order to account for possible new developments in the area of validation in other projects.
1.1.3 EMMA WP6.5 Context Work Package 6.5 of EMMA Phase 1 Project focuses on Verification & Validation exercises for the A-SMGCS Level I and II technologies and functions implemented at Milan-Malpensa Airport, in the context of the previous Sub-Project (SP5). The objective of Verification tests carried out at Malpensa airport was to check if the performance of the EMMA A-SMGCS levels I & II was compliant with technical requirements. In particular, verification tests for Malpensa airport were designed to prove that the advanced system is compliant with operational and performance requirements, as defined inside the ICAO manual on A-SMGCS. In this context, the verification tests involve the assessment of a set of technical indicators through either of the following two alternative ways: i) Providing the system with actual (live) data produced by performing specific test scenarios within
each site of the project, or ii) Feeding the system with simulated data. The emerging test scenarios involve the use of test vehicles and human actors performing a set of pre-planned operations under several weather conditions. It should be pointed out that no involvement of controllers or pilots is needed. The metrics for each test scenario (e.g. position of test vehicle) are recorded and stored by a specified recording system along with the corresponding performance of the system. The Technical Requirements are outlined in EUROCAE MASPS and in the EMMA Technical Re-quirement Document “Technical Requirement Document Part A – Ground, TRD”. The Performance Parameter will be tested in the field test during the Verification Tests at Malpensa airport. Verification tests were performed considering the analysis of both real-time and short sampling of data and long term recorded data of traffic. The validation of the EMMA A-SMGCS (Levels I & II) at Milan-Malpensa Airport was carried out through the comparison between the advanced operational scenario and the baseline system (i.e. MLAT contribution integrated in the MSF plus integrated E-SCA vs. current surveillance data as output of MSF system and no control functionality added). The final objective of the whole validation process is to identify the most appropriate procedural updating required to take the maximum advantage of the new available data and functions, in terms of high-level objectives as defined in the EMMA V&V Masterplan. The evaluation is conducted under a set of specified experimental factors involving the level of visibility, the traffic conditions, and the system version. These aforementioned activities will take advantages of different methods of validation. The assessment will be performed within three testing environments: • Real-time simulations, to reproduce safety-critical events and validate A-SMGCS provided
functions, in a realistic environment under different operational conditions. • Shadow-mode trials, to verify the system, to test the general acceptance of new equipments/
provided information and procedures by operational controllers, and to support the definition of new standards and procedures for A-SMGCS.
• Operational trials, to validate in the real operational environment some of the standards and procedures that have been defined.

1.4 Aeronautics and Space
Project FP6-503192 “EMMA1” EMMA SP6 - Malpensa A-SMGCS V&V Results
Page 9
Save Date: 2007-05-24 Public 9 File Name: D651_Results_MXP_V1.0.doc Version 1.00
The series of tests starts with real-time simulations at NLR’s NARSIM-Tower Simulator located in Amsterdam. The main objective of RTS is to prove that the advanced system (including the MA-SCA tool) is preferred over the baseline system by comparing key performance indicators (KPI). Among others the RTS exercise aims at tuning main functional parameters of the Malpensa Advanced Surface Conflict Alerting System (MA-SCA) in order to guarantee the best operational performance of the sys-tem. A list of non-nominal events to be reproduced during specific simulation sessions has been pro-duced.
Nominal as well as non-nominal traffic situations under different visibility conditions were considered for the Operational Scenarios definition.
These real-time simulations exercise was a preparatory step for the shadow-mode trials exercise at Mi-lan-Malpensa Airport, which aimed at validating the performances of the implemented A-SMGCS in the real environment. Shadow-mode trials were carried out as described in Section 4 of this document. It is important to consider that operational trials, which are the only type of testing exercise that really allow studying and evaluating the operational performance and the real impact of the advanced system against the baseline, have not been carried out due to the fact that, at the time of test execution, the A-SMGCS system was not mature enough to be integrated inside the operational platform and used by controllers to manage traffic.
1.1.4 Scope of the Verification and Validation Exercises Verification and validation activities at Malpensa airport, in the context of the EMMA (Phase1) project, were designed and carried out to prove that new technologies, functions and procedures implemented at the airport are compliant with operational and performance requirements as defined by ICAO and EUROCAE references.
1.2 Document Purpose The present deliverable collects both: • Results obtained performing verification tests to verify that new implemented tools and
technologies are compliant with Performance Requirements as described within ICAO and EUROCAE references.
• Results obtained performing validation exercises (RTS and Shadow-mode trials) to prove that new functionalities provided to end users are compliant with operational requirements as described in the ORD (D1.6.5 Operational Requirements Document).
1.3 Document Scope The present report is a summary of outputs obtained performing some of the activities belonging to Step 3 of the MAEVA Validation Guidelines Handbook as mentioned in EMMA deliverable D6.1.1 (Generic Verification and Validation Masterplan) at the Malpensa test site. In particular, deliverable D6.5.1 contains results obtained as results of the following activities:
• Collect data during the measured exercise. This comprises among others digital data recording on the experimental platform, video-recordings, and data gathered through observation.
• Collect data after the measured exercise. This comprises handing out questionnaires and carrying out de-briefings.

1.4 Aeronautics and Space
Project FP6-503192 “EMMA1” EMMA SP6 - Malpensa A-SMGCS V&V Results
Page 10
Save Date: 2007-05-24 Public 10 File Name: D651_Results_MXP_V1.0.doc Version 1.00
2 Verification Trials
2.1 Introduction In accordance with document D6.2.2 (see Ref. [10]) all trials are organised in such a way that as many indicators as possible can be evaluated. All data are acquired using 2 laptop computers connected to the ENAV LAN. Acquired data can be divided in two big categories: • Short-term data: all data are acquired in a short period (less than a day) • Long-term data: all data are acquired in a long period (5 days)
Figure 2-1: Test Vehicle Equipment
All short-term data are generated using ad hoc vehicle movement. For this test 3 different targets are used: • Fiat Punto equipped with the following experimental structure: DGPS, Mode-S 1090 Transponder;
AVMS-WLAN equipment.
DGPS
11009900 SSqquuiitttteerr
AAVVMMSS//WWLLAANN aanntteennnnaass

1.4 Aeronautics and Space
Project FP6-503192 “EMMA1” EMMA SP6 - Malpensa A-SMGCS V&V Results
Page 11
Save Date: 2007-05-24 Public 11 File Name: D651_Results_MXP_V1.0.doc Version 1.00
• A Fiat Panda equipped with a 1090 squitter: this vehicle was used for discrimination tests only as a second vehicle near the Fiat Punto. It is equipped with 1090 squitter and a GPS with WiFi communication system.
• A BUS COBUS: it is used to have a large target. It is equipped with GPS and a WiFi communication system.
All long term data were acquired using traffic of opportunity.
2.2 Data Description and Data Collection Methods
2.2.1 Raw Data All data are acquired using LAN sniffer software (ETHEREAL to acquire ASTERIX 62 data and SNIFFER PRO to acquire SELEX-SI radar data format).
2.2.1.1 Short-term Data The tool used to acquire short-term data is ARTES-RTD. ARTES-RTD software is a SELEX-SI tool to show and record all surveillance data. This tool is able to record data while an operator sees them, so that a preliminary analysis can be performed on whether the right data was acquired. Short-term acquiring sessions in the following sub paragraph are described not by session but by indicator in order to mark visibility, operators and equipment involved in the test.
Figure 2-2: ARTES - RTD Screen Shot

1.4 Aeronautics and Space
Project FP6-503192 “EMMA1” EMMA SP6 - Malpensa A-SMGCS V&V Results
Page 12
Save Date: 2007-05-24 Public 12 File Name: D651_Results_MXP_V1.0.doc Version 1.00
2.2.1.1.1 VE-1, VE-2.1, VE-3.1, VE-8, VE-9.1, VE-10.1 Vehicle test: Fiat Punto. Tool used: ARTES-RTD Operators: test co-ordinator, system operator, ARTES operator, vehicle driver, vehicle coordinator. Weather: good at night. Description: test car covered all airport areas covering areas at an approximate speed of 20 km/h. All areas were covered as follows: • APRON: test car walked on all links one time. • Taxiways and runways: the test car was driven on all links 3 times (on the centre line and the two
perimetric lines). Test vehicle was driven on the centre line.
2.2.1.1.2 VE-4 Vehicle test: COBUS. Tool used: ARTES-RTD Operators: test co-ordinator, system operator, ARTES operator, vehicle driver, vehicle co-ordinator. Weather: good. Description: COBUS stopped on 3 geo-referenced points and turned on its longitudinal axis. In each position, data were acquired positioning the COBUS in a frontal, parallel and 45° direction with respect to the SMR.
2.2.1.1.3 VE-5.1, VE-11 Vehicle test: Fiat Punto. Tool used: ARTES-RTD. Operators: test co-ordinator, system operator, ARTES operator, vehicle driver, vehicle co-ordinator. Weather: good at night. Description: test car was stopped on 9 points to acquire 1000 reports for each of them.
2.2.1.1.4 VE-5.2, VE-8 Vehicle test: Fiat Punto. Tool used: ARTES-RTD. Operators: test co-ordinator, system operator, ARTES operator, vehicle driver, vehicle co-ordinator. Weather: good at night. Description: test vehicle was driven on taxiways and runways keeping the speed value as constant as possible (40 km/h on taxiways and 60 km/h on runways). The test vehicle was driven along the centre

1.4 Aeronautics and Space
Project FP6-503192 “EMMA1” EMMA SP6 - Malpensa A-SMGCS V&V Results
Page 13
Save Date: 2007-05-24 Public 13 File Name: D651_Results_MXP_V1.0.doc Version 1.00
lines. The test vehicle was stopped on the runway threshold and the speed was increased from 0 km/h to 80 km/h.
2.2.1.1.5 VE-6 Vehicle test: Fiat Punto. Tool used: ARTES-RTD. Operators: test co-ordinator, system operator, ARTES operator, vehicle driver, vehicle co-ordinator. Weather: good at night. Description: the test vehicle was stopped on 3 positions. The vehicle co-ordinator pushed the car until a change of position was estimated by the ARTES-RTD operator.
2.2.1.1.6 VE-7 Vehicle test: Fiat Punto, Fiat Panda. Tool used: ARTES-RTD. Operators: test co-ordinator, system operator, ARTES operator, 2 vehicle drivers, and 2 vehicle co-ordinators. Weather: good. Description: Test vehicles were positioned in two different positions. They moved until ARTES operator observed two different targets. This operation was repeated in two different areas of the airport and with 4 different transponder statuses: 1. Moving car transponder ON, stopped car transponder ON. 2. Moving car transponder ON, stopped car transponder OFF. 3. Moving car transponder OFF, stopped car transponder ON. 4. Moving car transponder OFF, stopped car transponder OFF.
2.2.1.1.7 VE-12, VE-13 Vehicle test: none. Tool used: ARTES-RTD. Operators: test co-ordinator, system operator, ARTES operator. Weather: good. Description: The SCA system was configured for visibility CAT II while the airport was operating in visibility CAT I (this solution was applied in order to force runway incursions using traffic of opportunity). The following conditions were set in order to reproduce other SCA alarms: • Runway closed in one direction • Runway closed • A part of the airport closed

1.4 Aeronautics and Space
Project FP6-503192 “EMMA1” EMMA SP6 - Malpensa A-SMGCS V&V Results
Page 14
Save Date: 2007-05-24 Public 14 File Name: D651_Results_MXP_V1.0.doc Version 1.00
2.2.1.2 Long-term Data Long-term data were acquired using traffic of opportunity at the airport. It was not possible to acquire 3 days long recordings due to tuning and upgrading activities performed during the same days that were causing system operation discontinuities. Weather during the complete data acquisition period was clear. The only visibility degradation was at night.
2.2.2 Additional Data Additional data used for analysis were: • DGPS recorded data to be used as reference values for position and speed • Milan Malpensa map • DGPS antenna time • Flight controller information about a SCA alarm
2.3 Data Analysis Data analysis was done in accordance with D6.2.2 EMMA document.
2.3.1 Short-term Data Analysis Short-term results were obtained using ARTES-AES tool as possible or using Microsoft Excel if ARTES-AES cannot calculate results or it uses different algorithms. ARTES-AES is a SELEX-SI tool to analyse all surveillance data.
Figure 2-3: ARTES - AES Screen Shot

1.4 Aeronautics and Space
Project FP6-503192 “EMMA1” EMMA SP6 - Malpensa A-SMGCS V&V Results
Page 15
Save Date: 2007-05-24 Public 15 File Name: D651_Results_MXP_V1.0.doc Version 1.00
2.3.1.1 VE-1 Coverage Volume Tool used: ARTES-AES. Result: Coverage Map (see Figure 2-4). Description: ARTES-AES provides a coverage map collecting all position data and selecting test car identifications. We shall observe that the whole airport surface is covered except the north Apron (Terminal 2).
Figure 2-4: Coverage Map
2.3.1.2 VE-2.1 Probability of Detection (Short-term) Tool used: ARTES-AES. Result: 99.92% Description: result is obtained adding all plots received from test car (9716). Expected plots were obtained calculating system number of scans (9794). Result is obtained ignoring Terminal 2 data (it was not covered at the time of the test).
2.3.1.3 VE-3.1 Probability of False Detection (Short-term) Tool used: ARTES-AES. Result: 0

1.4 Aeronautics and Space
Project FP6-503192 “EMMA1” EMMA SP6 - Malpensa A-SMGCS V&V Results
Page 16
Save Date: 2007-05-24 Public 16 File Name: D651_Results_MXP_V1.0.doc Version 1.00
Description: result is 0. There was no false detection. Otherwise, this result is to be considered non-exhaustive because the number of reports is too low to estimate some false detection. Result is obtained ignoring Terminal 2 data (it was not covered at the time of the test).
2.3.1.4 VE-4 Reference Point Tool used: ARTES-AES. Result: 109 cm Description: values were estimated on 3 different points and positioning the COBUS in a frontal, parallel and 45° direction with respect to the SMR. The provided result is the worst case.
2.3.1.5 VE-5.1 Reported Position Accuracy (Static) Tool used: Microsoft Excel. Result: 720 cm Description: values were estimated in 3 different points and the result was valuated considering a confidence level of 95%.
2.3.1.6 VE-5.2 Reported Position Accuracy (Dynamic) Tool used: Microsoft Excel. Result: 720 cm Description: Positioning data were compared with DGPS. The result is the average value among all these calculated differences. Values were estimated in 3 different points and to evaluate the result, a confidence level of 95% was considered. The result was evaluated using the test vehicle in the manoeuvring area only. Result was obtained ignoring Terminal 2 data (it was not properly covered at the time of test execution).
2.3.1.7 VE-6 Reported Position Resolution Tool used: ARTES-AES. Result: 95 cm Description: positioning data were compared with DGPS. The result is the average value among all these calculated differences. 3 positions were considered. 1) 85 cm 2) 95 cm 3) 88 cm Worst case: 95 cm
2.3.1.8 VE-7 Reported Position Discrimination Tool used: Microsoft Excel. Result: 165 cm

1.4 Aeronautics and Space
Project FP6-503192 “EMMA1” EMMA SP6 - Malpensa A-SMGCS V&V Results
Page 17
Save Date: 2007-05-24 Public 17 File Name: D651_Results_MXP_V1.0.doc Version 1.00
Description: distances between 2 nearest different plots. All measurements were estimated in 2 positions. Scenarios considered: • C-C: 2 co-operative vehicles • C-NC: a co-operative moving vehicle and a not co-operative stopped vehicle • NC-C: a not cooperative moving vehicle and a co-operative stopped vehicle • NC-NC: 2 not co-operative vehicles Results are: • C-C: 158 cm, 154 cm • C-NC: 157 cm, 153 cm • NC-C: 165 cm, 165 cm • NC-NC: 186 cm, no data This result is provided ignoring NC-NC and considering the worst case: 165 cm.
2.3.1.9 VE-8 Reported Speed Accuracy Tool used: Microsoft Excel. Result: 3.1 m/s Description: speed values received were compared with DGPS data (reference value). The result is the average value among all the calculated differences. 2 speed values were analysed: • 40 km/h 1814 reports 2.8 m/s • 60 km/h 1631 reports 3.1 m/s
2.3.1.10 VE-9.1 Probability of Identification (Short-term) Tool used: ARTES-AES. Result: 99.9% Description: all data were sent by an identifiable target (test vehicle). Results were obtained ignoring Terminal 2 data (it was not properly covered at the time of test execution).
2.3.1.11 VE-10.1 Probability of False Identification (short term) Tool used: ARTES-AES Result: 0 Description: result is 0. There were no false identifications. This result was obtained ignoring Terminal 2 data (It was not properly covered at the time of test execution)
2.3.1.12 VE-11 Target Report Update Rate Tool used: ARTES, Microsoft Excel. Result: 1s

1.4 Aeronautics and Space
Project FP6-503192 “EMMA1” EMMA SP6 - Malpensa A-SMGCS V&V Results
Page 18
Save Date: 2007-05-24 Public 18 File Name: D651_Results_MXP_V1.0.doc Version 1.00
Description: this value was calculated making a subtraction between time provided by DGPS and time provided by ARTES (the time at which the message is obtained). This value is the worst case. All analysis is based on a correct synchronisation between DGPS and the ‘machine time’ of ARTES-AES.
2.3.1.13 VE-12 Probability of Detection of an Alert Situation Tool used: ARTES-AES. Result: 99.9% Description: this value was obtained considering all alerts detected and all alerts estimated. Partial values were as follows: • Runway incursion (alerts + alarms): 2912 expected, and 2913 detected. • Opposite direction: 823 expected, and 823 detected. • Closed Runway: 935 expected, and 935 detected. • Closed area: 57 expected, and 57 detected.
Total expected: 4727 Total detected: 4728
2.3.1.14 VE-13 Probability of False Alert Tool used: ARTES-AES. Result: 0.0002 (for the total amount of reports used, see VE-12) Description: there was only one false alert. Result was provided but it is to be verified acquiring longer recordings.
2.3.1.15 VE-14 Alert Response Time Tool used: ARTES-AES. Result: Not estimated. Description: Not estimated because it was not possible to appreciate time less than 1 s. Expected value is less than 1s.
2.3.2 Long-term Data Analysis Short-term results are obtained using MOGADOR.
2.3.2.1 VE-2.2 Probability of Detection (Long-term) Tool used: MOGADOR. Result: 99.96% Description: MOGADOR gave partial results. Final result was obtained having a weight medium value. The same result is obtained even valuating expected data (1513852) and detected data (1512483). The result was obtained ignoring Terminal 2 data (it was not properly covered at the time of the test).

1.4 Aeronautics and Space
Project FP6-503192 “EMMA1” EMMA SP6 - Malpensa A-SMGCS V&V Results
Page 19
Save Date: 2007-05-24 Public 19 File Name: D651_Results_MXP_V1.0.doc Version 1.00
2.3.2.2 VE-3.2 Probability of False Detection (Long-term) Tool used: MOGADOR. Result: not estimated. Description: result is 0. It is not a correct value; it is possible that not continuous data shall provide this result.
2.3.2.3 VE-9.2 Probability of Identification (Long-term) Tool used: MOGADOR. Result: 99.9% Description: MOGADOR gave partial results. Final result was obtained having a weight medium value. The same result is obtained even valuating expected data (1513852) and detected data (1512483). Result is obtained ignoring Terminal 2 data (it is not covered).
2.3.2.4 VE-10.2 Probability of False Identification (Long-term) Tool used: MOGADOR. Result: not estimated. Description: this indicator was calculated and the obtained result was equal to 0. This value is not reliable enough due to the inadequate duration of recorded data.
2.3.2.5 VE-15, VE-16, VE-17 Tool used: MOGADOR. Result: not estimated Description: Not estimated due to inadequacy of data recordings duration induced by frequent tuning and upgrading activities of the system.
2.4 Results
2.4.1 Short-term and Long-term Results The following table summarises all the verification results provided within previous paragraphs of this section. For each indicator, the table contains the ID, the acronym, the Requirement to which the obtained has to be compliant with and additional information used to produce the final result.
ID Indicator Acronym Requirement Measured Value
Additional Information
VE-1 Coverage Volume CV
Approaches
Manoeuvring Area
see paragraph 2.3.1.1
Information indicating the size of the whole ex-tension of the Move-ment Area was not available at the moment

1.4 Aeronautics and Space
Project FP6-503192 “EMMA1” EMMA SP6 - Malpensa A-SMGCS V&V Results
Page 20
Save Date: 2007-05-24 Public 20 File Name: D651_Results_MXP_V1.0.doc Version 1.00
ID Indicator Acronym Requirement Measured Value
Additional Information
Apron taxi lines
of this result production (under investigation). The amount (in percent-age) of the ‘covered’ area could be added as soon as this data will be available.
VE-2.1 Probability of Detection PD ≥ 99.9%
99.92% (this value
does not in-clude Termi-nal 2 area)
Received targets: 9786 Expected targets: 9794
VE-2.2 Probability
of Detection (Long-term)
PD ≥ 99.91%
99.96% (this value
does not in-clude Termi-nal 2 area)
Total reports: 1512483 Identified: 1513852
VE-3.1 Probability of False De-
tection PFD < 10-3
per report
0 (this value
does not in-clude Termi-nal 2 area)
Position recordings: 9794 Unsuccessful re-cordings: 0
VE-3.2
Probability of False De-
tection (Long-term)
PFD < 10-3 per report not estimated
The amount of recorded data was not adequate to calculate this indicator.
VE-4 Reference Point RP not defined 109 cm
For this test only a bus was used (COBUS). Values were measured in 3 different positions.
VE-5.1
Reported Position
Accuracy (Static)
RPA ≤ 750 cm
at a confidence level of 95%
720 cm
Position reports in 3 points. • Point 1: 1206 re-
ports 718 cm • Point 2: 1194 re-
ports 707 cm • Point 3: 1198 re-
ports 720 cm Total reports: 3598

1.4 Aeronautics and Space
Project FP6-503192 “EMMA1” EMMA SP6 - Malpensa A-SMGCS V&V Results
Page 21
Save Date: 2007-05-24 Public 21 File Name: D651_Results_MXP_V1.0.doc Version 1.00
ID Indicator Acronym Requirement Measured Value
Additional Information
Worst case: 720 cm A confidence level of 95% was considered
VE-5.2
Reported Position
Accuracy (Dynamic)
RPA ≤ 750 cm
at a confidence level of 95%
720 cm (only for test
car in ma-noeuvring
area)
Reports were acquired moving the test car on the runways. Values are estimated in 2 different conditions: • constant speed (20
km/h) on the run-ways and taxiways
• increasing and de-creasing speed on the runways (from 0 km/h to 80 km/h and braking to 0 km/h)
Results are: • constant speed:
5621 reports 718 cm
• acceleration and deceleration: 2348 reports 720 cm
Total reports: 7969 Worst case: 720 cm A confidence level of 95% was considered.
VE-6 Reported Position
Resolution RPS ≤ 100 cm 95 cm
3 positions were consid-ered : 1) 85 cm 2) 95 cm 3) 88 cm Worst case: 95 cm
VE-7
Reported Position
Discrimina-tion
RPD not defined 165 cm
All measurements were estimated on 2 positions. Considered scenarios:

1.4 Aeronautics and Space
Project FP6-503192 “EMMA1” EMMA SP6 - Malpensa A-SMGCS V&V Results
Page 22
Save Date: 2007-05-24 Public 22 File Name: D651_Results_MXP_V1.0.doc Version 1.00
ID Indicator Acronym Requirement Measured Value
Additional Information
• C-C: 2 co-operative vehicles
• C-NC: a co-operative moving vehicle and a not co-operative stopped vehicle
• NC-C: a not co-operative moving vehicle and a co-operative stopped vehicle
• NC-NC: 2 not co-operative vehicles
Results are: • C-C: 158 cm, 154
cm • C-NC: 157 cm, 153
cm • NC-C: 165 cm, 165
cm • NC-NC: 186cm, no
data This result is provided ignoring NC-NC and considering the worst case: 165 cm.
VE-8 Reported
Speed Accuracy
RSA < 5 m/s
at a confidence level of 95%
3.1 m/s
2 speed values were analysed: • 40 km/h 1814 re-
ports 2.8 m/s • 60 km/h 1631 re-
ports 3.1 m/s Confidence level con-sidered is 95%. Worst case: 3.1 m/s
VE-9.1 Probability of Identifi-
cation PID
≥ 99.9 % for identifiable tar-
gets 99.9%
Total reports: 9794 Identified: 9785

1.4 Aeronautics and Space
Project FP6-503192 “EMMA1” EMMA SP6 - Malpensa A-SMGCS V&V Results
Page 23
Save Date: 2007-05-24 Public 23 File Name: D651_Results_MXP_V1.0.doc Version 1.00
ID Indicator Acronym Requirement Measured Value
Additional Information
VE-9.2
Probability of Identifi-
cation (long-term)
PID ≥ 99.9 % for
identifiable tar-gets
99.9% Total reports: 1512261 Identified: 1513852
VE-10.1
Probability of False
Identifica-tion
PFID ≤ 10-3 per re-port 0.0003%
Identified: 9785 Incorrect identifications: 3
VE-10.2
Probability of False
Identifica-tion
PFID ≤ 10-3 per re-port not estimated
Results are too correct to report them. I prefer to re-calculate.
VE-11 Target Re-port Update
Rate TRUR ≤ 1 s 1 s
VE-12
Probability of Detection
of an Alert
Situation
PDAS ≥ 99.9% 99.9%
Runway incursion (alerts + alarms) Expected: 2913 Detected: 2912 Opposite direction Expected: 823 Detected: 823 Closed Runway Expected: 935 Detected: 935 Closed area Expected: 57 Detected: 57 Total Expected: 4728 Total Detected: 4727

1.4 Aeronautics and Space
Project FP6-503192 “EMMA1” EMMA SP6 - Malpensa A-SMGCS V&V Results
Page 24
Save Date: 2007-05-24 Public 24 File Name: D651_Results_MXP_V1.0.doc Version 1.00
ID Indicator Acronym Requirement Measured Value
Additional Information
VE-13 Probability
of False Alert
PFA < 10-3 per Alert 0.0002 see VE-12
VE-14 Alert
Response Time
ART < 0.5 s not estimated
Not estimated because it was not possible to ap-preciate time less than 1 s. ART is less than 1s but it is not a right estima-tion
VE-15 VE-16 VE-17
not estimated
Not estimated due to in-adequacy of data re-cordings duration in-duced by frequent tun-ing and upgrading ac-tivities of the system
Table 2-1: Verification Results

1.4 Aeronautics and Space
Project FP6-503192 “EMMA1” EMMA SP6 - Malpensa A-SMGCS V&V Results
Page 25
Save Date: 2007-05-24 Public 25 File Name: D651_Results_MXP_V1.0.doc Version 1.00
3 Malpensa Real-time Simulations at NARSIM-Tower
3.1 Introduction Work package 6.5 of EMMA Phase 1 focused on verification and validation activities for the envisaged A-SMGCS functionality at Milan-Malpensa Airport. To this end, the validation team prepared a specific real-time simulation environment and designed an appropriate experiment schedule. All simulation experiments were executed at the NARSIM-Tower simulation facilities of NLR (Dutch National Aerospace Laboratory) in Amsterdam (Figure 3-1).
Figure 3-1 Controllers during NARSIM-Tower Simulation of Milan Malpensa Airport
The experiments focused on verifying technical performance and evaluating operational improvements related to the integration of a Runway Incursion Alerting (RIA) system into the current operational environment (baseline scenario). The ad hoc validation plan describes both nominal and non-nominal validation sessions. The experiment scenarios discerned three major conditions: • Medium or high-level traffic volumes • Different visibility conditions (VIS-1 and VIS-2) • Availability of A-SMGCS Level I & II functionality (MA-SCA and multilateration).

1.4 Aeronautics and Space
Project FP6-503192 “EMMA1” EMMA SP6 - Malpensa A-SMGCS V&V Results
Page 26
Save Date: 2007-05-24 Public 26 File Name: D651_Results_MXP_V1.0.doc Version 1.00
The real-time simulations were designed as a preparatory step for the shadow-mode trials that were performed on-site at Milan Malpensa Airport and aimed at estimating the performance of the system under real operational conditions (cf. Ref. [9]). This chapter describes the different types of data obtained by performing both a technical verification of RIA system for tuning of system parameters, and the validation activities under nominal and non-nominal conditions. Data collection methods as well as analysis approaches and results are presented.
3.2 Data Description and Data Collection Methods
3.2.1 Verification Exercises In order to tune the Runway Incursion Alerting (RIA) functionality, which is part of the system supplied by SELEX (former AMS) for operational use at Milan Malpensa Airport, verification exercises were performed before the actual validation trials. Verification was considered successful when the tuning parameters of the Malpensa Advanced Surface Conflict Alerting tool (MA-SCA) were set in such a way that controllers found them acceptable and appropriate for use during the Malpensa shadow-mode trials The non-nominal events considered for verification tests of the systems were the same events that were considered for non-nominal validation experiments carried out at the end of each regular simulation day. They are listed in Table 3-1. ID* Description
AA-A Arrival aircraft is on very short final with a preceding arrival aircraft that has not cleared the protection area.
AA-I Arrival aircraft is on short final with a preceding arrival aircraft that has not cleared the protection area.
AC-A Arrival aircraft is on very short final and an aircraft or vehicle is crossing the runway.
AC-I Arrival aircraft is on short final and an aircraft or vehicle is crossing the runway.
AD-A Arriving aircraft is on very short final with a slower preceding departure aircraft, which has not crossed the end of the runway-in-use or has not started a turn.
AD-I Arriving aircraft on short final with a slower preceding departure aircraft, which has not crossed the end of the runway-in-use or has not started a turn.
AL-A Arrival aircraft on very short final and an aircraft is lining up on the runway protection area surface.
AL-I Arrival aircraft is on short final and an aircraft is lining up on the runway protection area surface.
AV-A Arrival aircraft is on very short final with a vehicle driving along the runway.
AV-I Arrival aircraft is on short final with a vehicle driving along the runway.
DC-A Departure aircraft is taking off and an aircraft or vehicle is crossing the runway.
DC-I Departure aircraft is not yet taking off and an aircraft or vehicle is crossing the runway.

1.4 Aeronautics and Space
Project FP6-503192 “EMMA1” EMMA SP6 - Malpensa A-SMGCS V&V Results
Page 27
Save Date: 2007-05-24 Public 27 File Name: D651_Results_MXP_V1.0.doc Version 1.00
DD-A Departure aircraft is taking off and an aircraft is on the runway protection area surface and not behind the departure aircraft.
DD-I Departure aircraft is not yet taking off and an aircraft is on the runway protection area surface and not behind the departure aircraft.
DL-A Departure aircraft is taking off and an aircraft is lining up in front of the departure aircraft.
DL-I Departure aircraft is not yet taking off and an aircraft is lining up in front of the departing aircraft.
DV-A Departure aircraft is taking-off and a vehicle driving along the runway.
DV-I Departure aircraft is not yet taking off and a vehicle driving along the runway.
*D = Departure, A = Arrival, V = Vehicle, C = Crossing, L = Line-up, A = Alarm, I = Information Alert
Table 3-1: Non-nominal Conflict and Infringement Events
These events are rather specific as they already look at different severity levels. A more generic view (also including cases which were purely tested during verification) is given in Table 3-2 together with an explanatory picture. The project team identified these events as being the most relevant non-nominal events for Malpensa Airport. These events were tested during the verification exercises.
ID Description Explanatory Picture Related Event ID*
TST-3 Aircraft intends to land and the safety bubble of another aircraft intercepts the approach runway or the Obstacle Free Zone (OFZ).
Predefined Threshold
v = 0
35L
17R
AA AD AV
TST-4 Aircraft intends to land and another aircraft has stopped so close to the approach runway that the aircraft safety bubble intercepts the taxi-holding position.
Predefined Thresholdv = 0
35L
17R
Taxi Holding Position
Causes:Line-upCrossingHold too shortVehicle
AC AL
TST-5 Aircraft intends to take off and the safety bubble of another aircraft intercepts the same runway or the OFZ.
35L
17R
Causes:Line-upCrossingHold too shortVehicle
DL
TST-6 Aircraft takes off and another aircraft has stopped so close to the runway (in front of the aircraft taking off) that the aircraft safety bubble intercepts the taxi-holding position.
35L
17R
v = 0
DC DD DL

1.4 Aeronautics and Space
Project FP6-503192 “EMMA1” EMMA SP6 - Malpensa A-SMGCS V&V Results
Page 28
Save Date: 2007-05-24 Public 28 File Name: D651_Results_MXP_V1.0.doc Version 1.00
TST-7 Aircraft takes off and a vehicle safety bubble is within the Obstacle Free Zone of the take-off runway, in front of the aircraft taking off.
OFZ
35L17R
DV
TST-1 Aircraft intends to land and another aircraft is taking off in the opposite direction on the approach runway. Predefined Threshold
Take-off
35L
17R
VER
TST-2 Aircraft intends to land and another aircraft is taking off in the opposite direction on a parallel runway.
Predefined Threshold
35R17L
Take-off
35L17R
VER
TST-9 Aircraft intends to land and the runway is closed.
Predefined Threshold
35R
17L CLOSED
VER
TST-10 Aircraft intends to take-off on a closed runway.
35R
17L CLOSED
Take-off
VER
TST-12 Two aircraft are taxiing on the same runway in opposite directions and a superposition of the relevant safety bubbles is verified.
Taxiing
35L
17R
Taxiing
Minimum Separation VER
TST-13 Aircraft is taxiing on a taxiway and an aircraft is on the same taxiway or on an adjacent taxiway in front of the aircraft and a superposition of the relevant safety bubbles is verified.
Taxiing Taxiing
Minimum Separation
VER
TST-16 Aircraft is taxiing on a taxiway exceeding the speed limit of the taxiway.
Taxiing
v > vmax
VER

1.4 Aeronautics and Space
Project FP6-503192 “EMMA1” EMMA SP6 - Malpensa A-SMGCS V&V Results
Page 29
Save Date: 2007-05-24 Public 29 File Name: D651_Results_MXP_V1.0.doc Version 1.00
TST-18 An aircraft safety bubble is within a restricted area.
RESTRICTED AREA
VER
*VER = Verification only
Table 3-2: Verification Scenarios as defined for the MA-SCA Tool
For verification of the MA-SCA tool the pre-configured SELEX system was integrated into the NARSIM-Tower platform of NLR. Pre-configuration of parameters took place prior to the verification activities and was based on tests with ENAV controllers. Verification activities with ENAV controllers at NLR had to confirm the pre-configured system parameters and indicate unexpected behaviour of the tool or malfunctions in order to ensure that the installed system was fit for more performance-oriented validation activities. Data was gathered by noting down controller comments as well as any unexpected behaviour. In case such behaviour was detected, system and software engineers were available to detect the cause and start mitigating actions. Furthermore, data regarding system settings and tool usability was obtained from interviewing controllers and having them fill in questionnaires. The first week of simulation experiments took place at NLR in Amsterdam from 11-15 April 2005. Initially, it was planned to confine validation activities to the second day of the first week, right after simulation platform familiarisation of pseudo-pilots and ENAV controllers. Due to unforeseen results in tool behaviour regarding interpretation of the radar data obtained from the simulation environment, however, it was necessary to extend verification activities for at least one day. Eventually, on the fourth day some training validation exercises were carried out, yet, the tool behaviour did not improve, so that it was decided to stop any further validation activities and concentrate on the tool changes necessary to come to a stable validation environment. This decision led to a new and reduced schedule for validation activities which were completely shifted to the second week. Prior to this second week, verification activities had to be repeated in order to ensure fitness for validation trials. The second week of simulation experiments took place at NLR from 6-10 June 2005. The data analysis of verification results in the upcoming parts of this document must therefore be looked at from two different perspectives. While the data of the first week already led to results that had an immediate impact on both the simulation environment and the validation schedule, the verification results of the second week can be seen as the actual data that considers tuning parameters and system settings.
3.2.2 Validation Exercises Real-time validation exercises were carried out at the NARSIM-Tower simulator of NLR after verification of the MA-SCA tool in June 2005 (see also Figure 3-1). Basically, two types of simulations were performed: nominal runs for performance-related simulations investigating capacity and efficiency related effects and non-nominal runs in which safety critical situations were triggered by pseudo-pilots about four times per simulation hour. The non-nominal runs therefore focused on an analysis of safety metrics. Additionally, at the end of each nominal run, a

1.4 Aeronautics and Space
Project FP6-503192 “EMMA1” EMMA SP6 - Malpensa A-SMGCS V&V Results
Page 30
Save Date: 2007-05-24 Public 30 File Name: D651_Results_MXP_V1.0.doc Version 1.00
safety critical situation was triggered in order to compare the results of the non-nominal runs with possibly more realistic situations in which non-nominal situations are not expected from thee beginning. Human Factors measurements were mainly accomplished through presenting controllers with questionnaires after each simulation run concerning situation awareness and workload. Furthermore, questionnaires and interviews helped to assess software and system usability. The following sections thus deal with both presented measurements and results from three different perspectives: safety, capacity/efficiency, and Human Factors. This chapter further elaborates on the measurements made. The following tables are consolidated tables from the Experiment Plan for Malpensa simulations (cf. Ref. [9]). They are meant to show the relationship between indicators, metrics and measurements. In addition, activities to capture and process the measurement data are described.
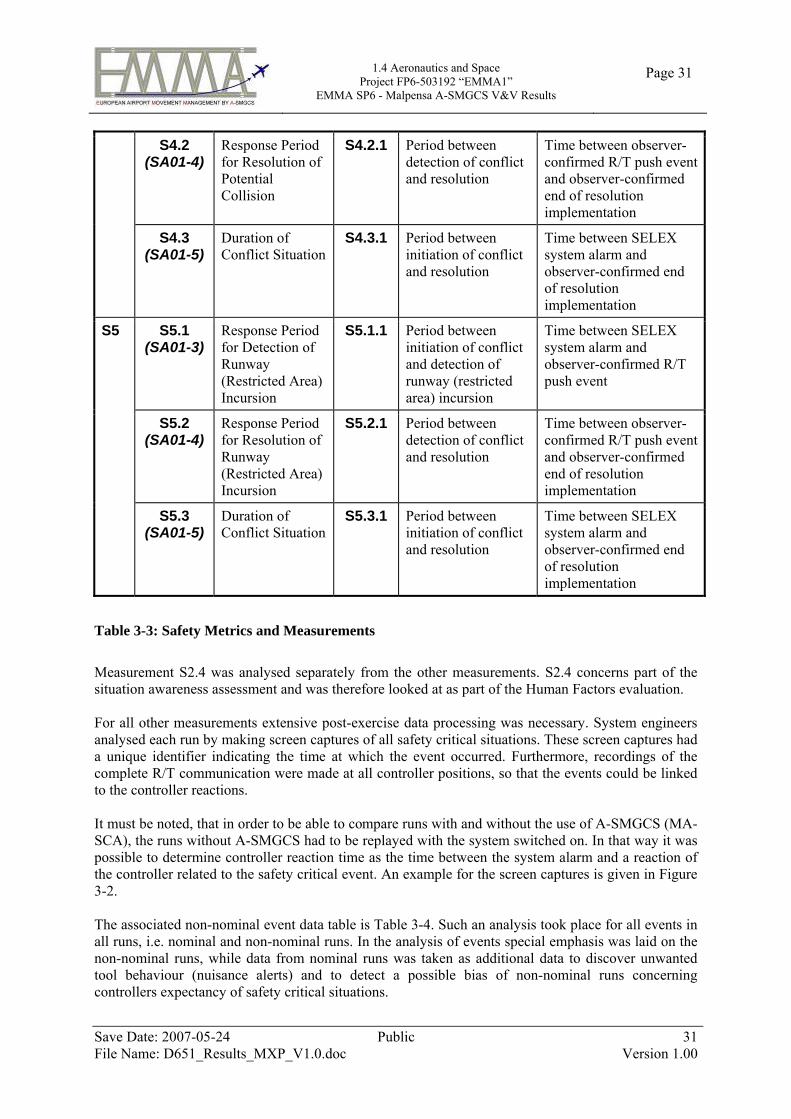
3.2.2.1 Safety Measurements The following table (Table 3-3) shows identified safety metrics and the measurements made during simulations. The mentioned events (e.g. resolution implementation) are based on definitions described in the Malpensa real-time simulation experiment plan (cf. Ref. [9]). ID Indicator Metrics Measurements
S1 S1.1 (SA01-1)
Safety Critical Situation Occurrence
S1.1.1 SME or HF Engineer notes situation and controller actions
SME or Human Factors Engineer observation
S2.1 (SA01-3)
Response Period for Detection of Pilot and Driver Error
S2.1.1 Period between initiation of conflict and detection of pilot or driver error
Time between SELEX system alarm and observer-confirmed R/T push event
S2.2 (SA01-4)
Response Period for Resolution of Pilot and Driver Error
S2.2.1 Period between detection of conflict and resolution
Time between observer-confirmed R/T push event and observer-confirmed end of resolution implementation
S2.3 (SA01-5)
Duration of Conflict Situation
S2.3.1 Period between initiation of conflict and resolution
Time between SELEX system alarm and observer-confirmed end of resolution implementation
S2
S2.4 Clearness Own Responsibilities
S2.4.1 Post-exercise questionnaire
Post-exercise questionnaire
S4 S4.1 (SA01-3)
Response Period for Detection of Potential Collision
S4.1.1
Period between initiation of conflict and detection of potential collision
Time between SELEX system alarm and observer-confirmed R/T push event
1.4 Aeronautics and Space
Project FP6-503192 “EMMA1” EMMA SP6 - Malpensa A-SMGCS V&V Results
Page 31
Save Date: 2007-05-24 Public 31 File Name: D651_Results_MXP_V1.0.doc Version 1.00
S4.2 (SA01-4)
Response Period for Resolution of Potential Collision
S4.2.1 Period between detection of conflict and resolution
Time between observer-confirmed R/T push event and observer-confirmed end of resolution implementation
S4.3 (SA01-5)
Duration of Conflict Situation
S4.3.1 Period between initiation of conflict and resolution
Time between SELEX system alarm and observer-confirmed end of resolution implementation
S5.1 (SA01-3)
Response Period for Detection of Runway (Restricted Area) Incursion
S5.1.1
Period between initiation of conflict and detection of runway (restricted area) incursion
Time between SELEX system alarm and observer-confirmed R/T push event
S5.2 (SA01-4)
Response Period for Resolution of Runway (Restricted Area) Incursion
S5.2.1 Period between detection of conflict and resolution
Time between observer-confirmed R/T push event and observer-confirmed end of resolution implementation
S5
S5.3 (SA01-5)
Duration of Conflict Situation
S5.3.1 Period between initiation of conflict and resolution
Time between SELEX system alarm and observer-confirmed end of resolution implementation
Table 3-3: Safety Metrics and Measurements
Measurement S2.4 was analysed separately from the other measurements. S2.4 concerns part of the situation awareness assessment and was therefore looked at as part of the Human Factors evaluation. For all other measurements extensive post-exercise data processing was necessary. System engineers analysed each run by making screen captures of all safety critical situations. These screen captures had a unique identifier indicating the time at which the event occurred. Furthermore, recordings of the complete R/T communication were made at all controller positions, so that the events could be linked to the controller reactions. It must be noted, that in order to be able to compare runs with and without the use of A-SMGCS (MA-SCA), the runs without A-SMGCS had to be replayed with the system switched on. In that way it was possible to determine controller reaction time as the time between the system alarm and a reaction of the controller related to the safety critical event. An example for the screen captures is given in Figure 3-2. The associated non-nominal event data table is Table 3-4. Such an analysis took place for all events in all runs, i.e. nominal and non-nominal runs. In the analysis of events special emphasis was laid on the non-nominal runs, while data from nominal runs was taken as additional data to discover unwanted tool behaviour (nuisance alerts) and to detect a possible bias of non-nominal runs concerning controllers expectancy of safety critical situations.

1.4 Aeronautics and Space
Project FP6-503192 “EMMA1” EMMA SP6 - Malpensa A-SMGCS V&V Results
Page 32
Save Date: 2007-05-24 Public 32 File Name: D651_Results_MXP_V1.0.doc Version 1.00
Figure 3-2 Non-nominal Event Screen Capture Example
ID Description
36-006 KLM6AJ vacate 35L at L, while AZA30U is on approach. DLH477 stops beyond stop bar GW. Double event.
Event Start W A ID C/S 1 C/S 2 POS
1 POS
2 TST ID
R/T Start
R/T End
Event End
0:22:55 32
RINC 4/9/ 14/2
AZA30U
DLH 477
35L ILS
Stop bar GW
4 0.23.23 0.23.29 0:23:55
Table 3-4: Non-nominal Event Data Table Example
3.2.2.2 Capacity and Efficiency Measurements The following table (Table 3-5) shows identified capacity metrics and the measurements made during simulations (see also Ref. [9]). In this table the measurement results are described in more detail.

1.4 Aeronautics and Space
Project FP6-503192 “EMMA1” EMMA SP6 - Malpensa A-SMGCS V&V Results
Page 33
Save Date: 2007-05-24 Public 33 File Name: D651_Results_MXP_V1.0.doc Version 1.00
ID Indicator Metrics Measurement
C1.1 (CA01*)
Runway Departure Throughput
C1.1.1 Number of take-offs in a period of time
NARSIM-Tower event logging: list of take-off times.
C1.2 (CA02*)
Runway Arrival Throughput
C1.2.1 Number of landings in a period of time (scenario-fixed)
NARSIM-Tower event logging: list of landing times.
C1.3 Runway Crossing Throughput
C1.3.1 Number of crossings in a period of time
NARSIM-Tower event logging: list of average times of entering and exiting runway 35L.
C1.4.1 (CA05)
Number of pushbacks in a period of time
NARSIM-Tower event logging: list of times of pushback initiation.
C1.4 Hand-over Throughput
C1.4.2 Number of hand-overs from GND to TWR1 in a period of time
NARSIM-Tower event logging: list of times of frequency hand-over.
C1.5.1 Number of aircraft under control of GND
NARSIM-Tower event logging: list of number of aircraft under control every 20 seconds after simulation start.
C1.5.2 Number of aircraft under control of TWR1
NARSIM-Tower event logging: list of number of aircraft under control every 20 seconds after simulation start.
C1
C1.5 (CA07, CA08)
Number of Aircraft under Control
C1.5.3 Number of aircraft and vehicles under control of TWR2
NARSIM-Tower event logging: list of number of aircraft under control every 20 seconds after simulation start.
*These are references to D6.1.4b and D6.2.3 that do not reflect changes in D6.2.2 after the simulations.
Table 3-5: Capacity Metrics and Measurements
When looking at the capacity measurement results of the Malpensa real-time simulations, assumptions made in the experiment plan for the simulations should not be overlooked. Simulations had to be carried out with sufficient realism. Thus, chosen traffic samples were based on real traffic. This traffic was accommodated at the airport with a runway configuration that might have been different from the one used in simulation. Generally, two runway configurations were used in simulation (cf. Ref. [9]), namely S6 with departures on 35R and dependent parallel approaches for good visibility (VIS-1), and S1 with departures on 35R and arrivals on 35L for bad visibility (VIS-2). For dependent parallel approaches it was decided that traffic had to be separated by at least 110 seconds.

1.4 Aeronautics and Space
Project FP6-503192 “EMMA1” EMMA SP6 - Malpensa A-SMGCS V&V Results
Page 34
Save Date: 2007-05-24 Public 34 File Name: D651_Results_MXP_V1.0.doc Version 1.00
Sample Date Start Length Configuration Inbounds Outbounds
A 05-Jul-2004 05:00 75 min. S6 44 21
B 12-Jul-2004 16:30 75 min. S6 40 23
C 05-Jul-2004 16:30 75 min. S6 42 20
D 16-Jul-2004 06:20 75 min. S1 17 24
E 09-Jul-2004 16:30 75 min. S1 21 21
F 12-Jul-2004 09:30 75 min. S1 17 19
K 19-Jul-2004 05:00 60 min. S6 35 14
L 05-Jul-2004 16:30 60 min. S1 19 14
T 05-Jul-2004 10:30 60 min. S5 28 16
Table 3-6: Traffic Sample Characteristics
Since it was not known from the real traffic data on which runway the aircraft landed, violations of separation in the sample were possible. Therefore, aircraft were programmed to land on 35R and on violation of separation were scheduled to 35L. In the rare event that it was not possible to accommodate an aircraft within the separation limits, the data of that aircraft was removed from the traffic sample. The characteristics of all used traffic samples can be found in Table 3-6. Traffic samples A-C were used for nominal VIS-1 simulations with an inbound peak, and samples D-F were used for used for nominal VIS-2 simulations with a balanced number of arrivals and departures. Traffic sample K was used for non-nominal runs with VIS-1 and sample L was used for non-nominal runs with VIS-2. Traffic sample T was used for training purposes, a non-nominal run in VIS-1 with an inbound peak and departures from 35L. Looking at the definitions for the different kinds of measurements concerning capacity, it becomes clear that the choice of traffic sample largely determines all values looking at throughput (C1.1-1.4) and that it can also have an influence on the number of aircraft under control (C1.5). All results should be compared with the boundary conditions set by the traffic sample characteristics in Table 3-6. Nevertheless, it was considered necessary to look at the capacity results to find out about particular phases during a simulation run, in which capacity could be an issue, especially when comparing runs with and without the use of the A-SMGCS. Results are shown in Chapter 3.3. The following table (Table 3-7) shows identified efficiency metrics and the measurements made during simulations (see also Ref. [9]). ID Indicator Metrics Measurement
E1 E1.1 (EF01)
Taxiing Delay E1.1.1 Difference between nominal taxi period and taxi period (positive value indicating that taxi period was longer
Nominal taxi period is determined by dividing nominal taxi distance by nominal taxi speed (15 knots).Taxi period starts with first movement

1.4 Aeronautics and Space
Project FP6-503192 “EMMA1” EMMA SP6 - Malpensa A-SMGCS V&V Results
Page 35
Save Date: 2007-05-24 Public 35 File Name: D651_Results_MXP_V1.0.doc Version 1.00
than nominal) after pushback and ends when the aircraft reaches 40 knots on the runway.
E1.2 (EF05)
Line-up Queue Delay
E1.2.1 Difference between exiting time of queue and entering time of queue
Exiting time of queue is when aircraft enters the runway. Entering time of queue is when aircraft reduces speed to 0 knots for the first time after having been handed over from ground control to runway control (GND to TWR1 or TWR2).
E1.3 (EF07)
Departure Delay E1.3.1 Difference between scheduled time of departure and actual
Scheduled departure times not available. Difference between actual take-off time and expected off-blocks time is considered instead as a measure for planning efficiency.
E1.4 Crossing Delay E1.4.1 Difference between time of crossing the runway and arrival time at runway crossing
Arrival time at runway crossing is when the aircraft enters an area around the stop bar before the runway and the crossing time is when the aircraft enters an area around the centreline of the crossed runway.
E1.5 (EF03)
Pushback Delay E1.5.1 Difference between pushback time and ready-for-pushback time
Ready-for-pushback time is the time when the pseudo-pilot switches to the ground frequency for the first time. Pushback time is when the aircraft first has a positive or negative speed.
E2 E2.1 (EF11)
Taxi Period of Arrival
E2.1.1 Taxi period from touchdown until engine shut-down
Touchdown is when the aircraft is less than 1 metre above the ground. Engine shut-down is when the aircraft stops for the last time in the simulation.

1.4 Aeronautics and Space
Project FP6-503192 “EMMA1” EMMA SP6 - Malpensa A-SMGCS V&V Results
Page 36
Save Date: 2007-05-24 Public 36 File Name: D651_Results_MXP_V1.0.doc Version 1.00
E2.2 (EF 10, EF12)
Taxi Period of Departure
E2.2.1 Taxi period from pushback until take-off
Pushback time is when the aircraft first has a positive or negative speed. Take-off time is when the aircraft is more than 1 metre above the ground.
Table 3-7: Efficiency Metrics and Measurements
Efficiency measurements mainly concern taxi times, queuing times, runway crossing times, and pushback times. A special measurement is punctuality of departure. This measurement was described in the experiment plan as the difference between actual and scheduled times of departure. When looking at the simulation set-up, however, it was noticed that scheduled departure times were not available, simply because flights at Malpensa airport were planned according to expected off-blocks times (EOBT). Above that, the Malpensa ground controller worked with the EOBT as a planning constraint, while the runway controllers had no such constraint at all, but simply had to get the aircraft to the runway as quickly as possible. This means that, even if the scheduled times had been available, comparing scheduled and actual departure times would not have been a measure for planning efficiency. Therefore, it was decided to look at the only planning time available instead, and determine the difference between actual time of departure and expected off-blocks time (ATD-EOBT). Although this value alone is not a straightforward measure for planning efficiency, the difference between two such measures in different runs definitely is. Another issue when looking at the efficiency measurements was the definition of a minimum taxi period. Since aircraft moved with different speeds at different parts of the airport, finding a minimum taxi time was also not a straightforward activity. Thus, it was decided to define a nominal taxi period, which would be the nominal taxi distance, i.e. the point of the first forward movement of an aircraft until the point when the aircraft first reaches 40 knots, divided by a nominal taxi speed of 15 knots. This nominal taxi period was then compared with the time the aircraft actually needed to get from the first to the last point of the nominal taxi distance. For computing the crossing delay special areas close to the runway stop bar were defined. Crossing delay was then determined by calculating the difference between entering an area around the runway centreline and entering the special areas close to the runway stop, i.e. shortly before stopping at the stop bar. All other efficiency values could be computed more or less exactly by using the measurements from Table 3-7.
3.2.2.3 Human Factors Measurements The following table (Table 3-8) shows identified Human Factors metrics and the measurements made during simulations (see also Ref. [9]). ID Indicator Metrics Measurement
H1 H1.1 (HF02)
Situation Awareness using A-SMGCS Level
H1.1.1 SASHA Questionnaire
See appendix Ref. [9].

1.4 Aeronautics and Space
Project FP6-503192 “EMMA1” EMMA SP6 - Malpensa A-SMGCS V&V Results
Page 37
Save Date: 2007-05-24 Public 37 File Name: D651_Results_MXP_V1.0.doc Version 1.00
I
H2 H2.1 (HF02)
Situation Awareness using A-SMGCS Level II
H2.1.1 SASHA Questionnaire
See appendix Ref. [9].
H3.1 (HF04)
Mental Workload using A-SMGCS Level I
H3.1.1 NASA TLX See appendix Ref. [9].
H3.2 (EF20, EF21)
R/T Load using A-SMGCS Level I
H3.2.1 Difference between R/T-button up and R/T-button down
NARSIM-Tower Event Logging.
H3
H3.3 Flight Strip Annotations using A-SMGCS Level I
H3.3.1 Number of flight strip annotations
HF expert observation.
H4 H4.1 (HF04)
Mental Workload using A-SMGCS Level II
H4.1.1 NASA TLX See appendix Ref. [9].
H5.1.1
Comfort and Satisfaction Index
See appendix Ref. [9].
H5.1.2 Ease-of-Task Performance Index
See appendix Ref. [9].
H5.1 (HF03)
Controller Attitudes using A-MSGCS Level I
H5.1.3 Acceptability Index See appendix Ref. [9].
H5
H5.2 (HF05)
Usability of A-SMGCS Level I
H5.2.1 HMI Usability Index See appendix Ref. [9].
H6.1.1 Comfort and Satisfaction Index
See appendix Ref. [9].
H6.1.2 Ease-of-Task Performance Index
See appendix Ref. [9].
H6.1 Controller Attitudes using A-MSGCS Level II
H6.1.3 Acceptability Index See appendix Ref. [9].
H6
H6.2 Usability of A-SMGCS Level II
H6.2.1 HMI Usability Index See appendix Ref. [9].
Table 3-8: Human Factors Metrics and Measurements
As can be seen from Table 3-8 most measurements of Human Factors aspects of the EMMA experimental runs were conducted using questionnaires (see appendix of Ref. [9]). Questionnaires were to be completed at several moments throughout the validation: • Before the validation experiments: pre-experiment questionnaire, • After each experimental run: after-each-run questionnaires (A-SMGCS ON/OFF), • At the end of the validation experiments: post-experiment questionnaire.

1.4 Aeronautics and Space
Project FP6-503192 “EMMA1” EMMA SP6 - Malpensa A-SMGCS V&V Results
Page 38
Save Date: 2007-05-24 Public 38 File Name: D651_Results_MXP_V1.0.doc Version 1.00
After a briefing session on the validation environment and the purpose of the experiments the three controllers had to complete the pre-experimental questionnaire. The pre-experimental questionnaire concerned the controllers’ experience (regarding ATC in general and A-SMGCS in particular), and their expectations regarding the experiment and the validated system. The questionnaires after each run were to be completed by the controllers taking the role of runway controller (TWR1 and TWR2) in an experimental run. There were two different kinds of questionnaires, namely questionnaires for runs with the A-SMGCS switched on and questionnaires for experimental runs with the A-SMGCS switched off. The questionnaires consisted of questions regarding the Human Machine Interface (HMI), Situation Awareness and Workload. Questions regarding the HMI consisted of the so called System Usability Scale (SUS), situation awareness was measured using SASHA-type questionnaires (see Ref. [12]) and workload using the NASA Task Load Sheets (NASA-TLX). For the runs with the A-SMGCS switched on, SASHA questions were adapted in such a way that the influence of both the labels (A-SMGCS Level I) and the runway incursion alerts (A-SMGCS Level II) could be measured. The questionnaires were available only electronically. The controllers were instructed that their first reaction was considered most reliable, especially for the closed questions. In the briefing session it was explained that results would be reported anonymously and the NASA-TLX definitions were explained to the controllers. The questionnaire at the end of each experimental run concerned the ease of use of A-SMGCS Level I, and A-SMGCS Level II, and any improvements regarding the system. Furthermore, it consisted of questions about training requirements and the simulations. After the post-experiment questionnaire, which had to be completed by each controller individually, a debriefing session was held during which the controllers were given the opportunity to give general comments and to discuss issues. A list of issues was used to structure the discussion. This session was held with the three controllers, the experiment leader and two HF experts. The comments were noted by the HF experts during the discussion and compiled after the sessions.
3.3 Data Analysis and Results
3.3.1 MA-SCA Tool Verification Verification activities started with configuring the integrated SELEX SCA tool for Malpensa (MA-SCA) according to controller needs, i.e. SELEX system engineers had to adjust the portrayed airport layout and colours (see HMI description in Ref. [9]) in such a way that they corresponded with an agreed set of layout and colour requirements. This set of requirements was agreed between SELEX and ENAV controllers prior to the experiment. Since initial tests indicated that the airport layout as implemented in the MA-SCA tool did not entirely correspond with the layout of ENAV that was implemented in the NARSIM-Tower simulator of NLR, a further verification step was to determine the position of both CAT I and CAT III stop bars. This tuning of the tool would prevent unnecessary warnings or alerts triggered by stop bar violations. Furthermore, the CAT I and CAT III stop bars were part of the obstacle free zones boundaries defined within the SCA tool, so that any unnecessary violation of this zone due to inaccuracies of implemented airport layout would have been very much undesirable during the more performance related validation activities.

1.4 Aeronautics and Space
Project FP6-503192 “EMMA1” EMMA SP6 - Malpensa A-SMGCS V&V Results
Page 39
Save Date: 2007-05-24 Public 39 File Name: D651_Results_MXP_V1.0.doc Version 1.00
Figure 3-3: Malpensa Airport Map (cf. AIP AGA 2-27 in Ref. [11])

1.4 Aeronautics and Space
Project FP6-503192 “EMMA1” EMMA SP6 - Malpensa A-SMGCS V&V Results
Page 40
Save Date: 2007-05-24 Public 40 File Name: D651_Results_MXP_V1.0.doc Version 1.00
After these activities the main focus of the verification was running the test cases as defined in Table 3-2 in order to test the basic functionality of the MA-SCA tool and tune the pre-configured parameters associated with the warnings and alerts. In the first week of testing in April 2005 tool behaviour was judged rather unpredictable by the controllers when assessing cases TST-4 and TST-5 on runway 35L (see Figure 3-3). Warnings and alerts were not issued as could have been expected, in some cases they were missing. Possible problem sources identified were synchronisation issues between the MA-SCA tool and the obtained ASTERIX radar data and the fact that the MA-SCA tool was relying heavily on the history data of aircraft tracks, so that the spontaneously generated aircraft in the test cases could not be analysed properly by the tool. Due to this behaviour it was impossible to start meaningful validation activities in the first week, as was already mentioned in Section 3.2.1. It was decided to stop any further validation activities and concentrate on the tool changes necessary to come to a stable validation environment. This decision led to a new experiment schedule for both verification and validation activities in the second week (June 2005). Prior to the validation activities in the second week, verification activities were repeated. Basic functionality was tested again by placing aircraft at several stop bar positions within or outside the considered obstacle free zone of both runway 35R and 35L. This time warnings and alerts were triggered as expected, so that the special test cases could be looked at again. The results of this verification activity are presented in the following table: ID Description Test Tuned Parameters*
TST-3 Aircraft intends to land and the safety bubble of another aircraft intercepts the approach runway or the Obstacle Free Zone (OFZ).
Aircraft positioned on 35L.
Warning and alert trigger concerns distance of approaching aircraft from runway threshold: W = 2 NM A = 1 NM
TST-4 Aircraft intends to land and another aircraft has stopped so close to the approach runway that the aircraft safety bubble intercepts the taxi-holding position.
Aircraft at holding position of F for crossing 35L West to East.
Warning and alert trigger concerns distance of approaching aircraft from runway threshold: W = 2 NM A = 1 NM
TST-5 Aircraft intends to take off and the safety bubble of another aircraft intercepts the same runway or the OFZ.
Aircraft slowly taxiing on DE for crossing 35L East to West.
Warning and alert trigger concerns speed of departing aircraft: W = 20 knots A = 50 knots
TST-6 Aircraft takes off and another aircraft has stopped so close to the runway (in front of the aircraft taking off) that the aircraft safety bubble intercepts the taxi-holding position.
Aircraft at holding position of DE for crossing 35L East to West.
Warning and alert trigger concerns speed of departing aircraft: W = 20 knots A = 50 knots

1.4 Aeronautics and Space
Project FP6-503192 “EMMA1” EMMA SP6 - Malpensa A-SMGCS V&V Results
Page 41
Save Date: 2007-05-24 Public 41 File Name: D651_Results_MXP_V1.0.doc Version 1.00
TST-7 Aircraft takes off and a vehicle safety bubble is within the Obstacle Free Zone of the take-off runway, in front of the aircraft taking off.
Car positioned close to OFZ of 35L.
Warning and alert trigger concerns speed of departing aircraft: W = 20 knots A = 50 knots
TST-1 Aircraft intends to land and another aircraft is taking off in the opposite direction on the approach runway.
Inbound aircraft at 17L while outbound (taxiing down runway with speed faster than 20 knots) at 35R.
Warning and alert trigger concerns distance of approaching aircraft from runway threshold: W = 2 NM A = 1 NM
TST-2 Aircraft intends to land and another aircraft is taking off in the opposite direction on a parallel runway.
Inbound aircraft at 17L while outbound (taxiing down runway with speed faster than 20 knots) at 35L.
Warning and alert trigger concerns distance of approaching aircraft from runway threshold: W = 2 NM A = 1 NM
TST-9 Aircraft intends to land and the runway is closed.
Runway 35L closed.
Warning and alert trigger concerns distance of approaching aircraft from runway threshold: W = 2 NM A = 1 NM
TST-10 Aircraft intends to take-off on a closed runway.
Runway 35R closed.
Warning and alert trigger concerns speed of departing aircraft: W = 20 knots A = 50 knots
TST-12 Two aircraft are taxiing on the same runway in opposite directions and a superposition of the relevant safety bubbles is verified.
Two aircraft taxiing in opposite directions on 35R.
Warning/alert trigger depends on safety bubbles of both aircraft: W/A = (v 2 / 3) + 12 · v + 10 (safety bubble length in front of aircraft [m] with v being aircraft speed [m/s]) Note: aircraft in taxiing status, meaning v < 9 m/s (18 knots).
TST-13 Aircraft is taxiing on a taxiway and an aircraft is on the same taxiway or on an adjacent taxiway in front of the aircraft and a superposition of the relevant safety bubbles is verified.
Two aircraft taxiing in opposite directions on C.
Warning/alert trigger depends on safety bubbles of both aircraft: W/A = (v 2 / 3) + 12 · v + 10 (safety bubble length in front of aircraft [m] with v being aircraft speed [m/s]) Note: aircraft in taxiing status, meaning v < 9 m/s (18 knots).

1.4 Aeronautics and Space
Project FP6-503192 “EMMA1” EMMA SP6 - Malpensa A-SMGCS V&V Results
Page 42
Save Date: 2007-05-24 Public 42 File Name: D651_Results_MXP_V1.0.doc Version 1.00
TST-16 Aircraft is taxiing on a taxiway exceeding the speed limit of the taxiway.
Aircraft exceeding taxiway speed on C.
Warning/alert trigger depends on speed of aircraft: W/A = 45 knots (only enabled on taxiways W, C, and K)
TST-18 An aircraft safety bubble is within a restricted area.
Aircraft on W between Link 2 and Link 3.
Warning and alert trigger depend on position of aircraft: W = aircraft safety bubble (see TST-12 and TST-13) is within restricted area A = aircraft is within restricted area
*W = Warning Parameter; A = Alert Parameter
Table 3-9: MA-SCA Parameter Tuning
It should be noted that test cases TST-13 and TST-16 for taxiing in opposite directions and exceeding taxiway speeds failed. In TST-13 safety bubbles were too small for the taxiing aircraft and in TST-16 taxiway speed limits were not configured correctly. Controllers accepted above-mentioned parameters for performing validation exercises with a runway incursion alerting tool.
3.3.2 Real-time Validation of A-SMGCS
3.3.2.1 Initial Data Preparation Before presenting safety, capacity, efficiency and human factors measurements and analysing the data it is necessary to have a look at the simulation runs conducted and their validity for performing an analysis. The actual experiments carried out were runs 23 through 38 of the experiment plan (Ref. [9]). Due to the shortage of the unplanned events amount induced during the only four non-nominal sessions (i.e. 24, 28, 32 and 36), both non-nominal and nominal sessions were observed for collecting safety related results according to safety indicators list. On the other hand, of these runs only the nominal runs are of value for capacity and efficiency investigations, due to the fact that the non-nominal runs contained an unrealistically high number of incidents or non-nominal situations that would distort any outcome assessing capacity and efficiency under normal operating conditions. Thus, the runs looked at for capacity and efficiency, sorted by traffic sample, were the following:
Run ID Baseline (B) or Advanced (A)
Visibility Condition
(1, 2)
High (H) or Medium (M)
Traffic Volume Traffic Sample
Maximum Simulation
Time (s)
27 B 1 H A 3540
37 A 1 H A 3660
34 B 1 H B 3840
26 A 1 H B 3900

1.4 Aeronautics and Space
Project FP6-503192 “EMMA1” EMMA SP6 - Malpensa A-SMGCS V&V Results
Page 43
Save Date: 2007-05-24 Public 43 File Name: D651_Results_MXP_V1.0.doc Version 1.00
31 B 1 H C 3840
35 A 1 H C 3180
29 B 2 M D 3780
25 A 2 M D 3600
33 B 2 M E 3240
30 A 2 M E 4140
38 B 2 M F 3900
23 A 2 M F 3240
Table 3-10: Nominal Experiment Runs for the Milan Malpensa Real-time Simulations
Table 3-10 shows that in order to compare baseline and advanced runs, i.e. runs with and without the use of the A-SMGCS system (Level I = multilateration and Level II = runway incursion alerting), it will be possible to have a look at the same traffic sample first and then compare results within one visibility category. Generally, results for different visibility conditions cannot directly be compared due to the use of different runway configurations and traffic samples, having an influence on both capacity and efficiency. However, it should be possible to compare results regarding possible trends. Another aspect that should be considered when comparing results is the duration of a run. Since non-nominal events took place at the end of each nominal run, there is a maximum time per run that can be used for analysis without having to consider distorting effects. This maximum simulation time is also presented in Table 3-10. It is based on the raw dataset obtained from NARSIM-Tower data logging. In order to compare the results of two runs with the same traffic sample, it will thus be necessary to only compare results within a simulation time that does not exceed the smaller of the two time values.
Traffic Sample Filtered Callsigns per Traffic Sample
A AZA291, AZA557, AZA727, AZA1015, AZA1302, AZA14V, DLH571, DLH1222, SAS518V
B AZA033, AZA197, AZA320, AZA819, AZA8138, DLH451, DLH529, DLH805, DLH3643, DLH3906, DLH5583, KLM100, N811D, SAS4741, SWR1JF, SWR6TU, SAS688
C AZA033, AZA197, AZA517, AZA1041, AZA3290, DLH5583, KLM246, KLM100, N255GA, SAS4741, SAS675
D AZA026, AZA114, AZA140, AZA294, AZA334, AZA724, AZA448, AZA1027, AZA8819, AZA9024, AZA14Z, AZA33N, AZA84G, AZA292M, DLH222, DLH825, DLH201B, KLM1261, KLM7KT, SWR6RL
E AZA248, AZA320, BAW567, DLH805, DLH4JK, DLH796T, KLM246, KLM43V, SAS688, SAS1212
F AZA263, AZA569, AZA8081, AZA9062, BAW382, BAW573, DAL85, DLH236, DLH3641, DLH57Y, KLM629, KLM66E

1.4 Aeronautics and Space
Project FP6-503192 “EMMA1” EMMA SP6 - Malpensa A-SMGCS V&V Results
Page 44
Save Date: 2007-05-24 Public 44 File Name: D651_Results_MXP_V1.0.doc Version 1.00
Table 3-11: Filtered Callsigns per Traffic Sample
From the NARSIM-Tower logging, it was also possible to identify the last inbound and outbound flights in a simulation not influenced by the non-nominal event, and to filter out the respective callsign from the results. A list of the callsigns filtered out can be found in Table 3-11. The large number of aircraft labels in traffic sample D can be explained by an increasing number of outbounds at the end of the simulation time that never took-off.
3.3.2.2 Safety Measurement Results According to what is reported in the Validation Plan for RTS of Malpensa (Ref. [9]) the following Low-level Validation Objectives and their Hypotheses were defined for safety measurements and results. ID Low-level Objective Hypothesis S1 Reduce controller errors when
using A-SMGCS Level II functionality.
With the use of EMMA A-SMGCS Level II controller errors (e.g. incorrect clearances and aircraft misidentification) are less likely to occur than without A-SMGCS Level II.
S2 Controllers detect pilot and driver errors faster when using A-SMGCS Level II functionality.
With the use of EMMA A-SMGCS Level II pilot and driver errors (i.e. deviations from clearances, failure to stop at stop-bar) are detected faster and more reliably than without A-SMGCS Level II.
S3 Controllers effectively mitigate A-SMGCS Level II related hazards.
Will not be measured in RTS as the system will be implemented and tuned in such a way that there are no false or missed alerts in the simulation.
S4 Controllers detect potential collisions faster when using A-SMGCS Level II functionality.
With the use of EMMA A-SMGCS Level II potential collisions are detected faster and more reliably than without A-SMGCS Level II.
S5 Controllers detect runway and restricted area incursions faster when using A-SMGCS Level II functionality.
With the use of EMMA A-SMGCS Level II runway and restricted area incursions will be detected faster and more reliably than without A-SMGCS Level II.
S6 Controllers detect deviations from assigned routes faster with A-SMGCS Level II functionality.
Will not be measured in RTS as EMMA Phase 1 functionality does not comprehend route deviation detection.
Table 3-12: Low-level Safety Objectives and Hypotheses
Actually S1, S3 and S6 low-level objectives were contained in the list of safety related low-level objectives as well. S1 was not taken into account, in the context of the EMMA real-time simulation exercises for Malpensa, because a relevant number of ATC errors (e.g. incorrect clearances and aircraft misidentification) during the simulation sessions were not noticed. Thus, it could not be proved

1.4 Aeronautics and Space
Project FP6-503192 “EMMA1” EMMA SP6 - Malpensa A-SMGCS V&V Results
Page 45
Save Date: 2007-05-24 Public 45 File Name: D651_Results_MXP_V1.0.doc Version 1.00
statistically and by quantitative assessment that this kind of events are less likely to occur with the use of EMMA A-SMGCS Level II than without A-SMGCS Level II. A comparison between baseline and advanced scenarios was not feasible S3 and S6 were not measured in RTS as the simulation platform was implemented and tuned in such a way that false or missed alerts could not occur during any simulation session. An estimation of the Detection (S2.1/S4.1/S5.1), Resolution (S2.2/4.2/5.2) and Duration (S2.3/4.3/5.3) periods (cf. Table 3-3) was extrapolated by an accurate post elaboration of each complete recording of R/T communication between controllers and pseudo-pilots involved in the simulation sessions. Results were produced according to what is described in the RTS V&V Test Plan (Ref. [9]). A complete example for a non-nominal session as well as main results (HH:MM:SS) provided by the whole simulation exercise - grouped by visibility conditions and baseline or advanced platform con-figurations - are listed in the following tables.
Session 32 (Non-Nominal)
B A
Event ID
V I S
W A Event Start
R/T Start
R/T End
Event End ATC Resolution S2.1/
4.1/5.1 S2.2/
4.2/5.2 S2.3/
4.3/5.3
32-01 X 0.10.52 0.10.57 No ATC Resolution / Communication
32-02 X X 0.12.44 0.13.22 No ATC Resolution / Communication
32-03 X 0.14.34 0.14.50 No ATC Resolution / Communication
32-04 X 0.15.48 0.16.12 No ATC Resolution / Communication
32-05 X X 0.24.46 0.25.42 0.25.46 0.25.58 Stop taxiing im-mediately 0.00.56 0.00.04 0.01.00
32-06 X 0.25.15 0.25.23 No ATC Resolution / Communication
32-07 X 0.27.08 0.27.20 No ATC Resolution / Communication
32-08 X 0.28.19 0.29.07 No ATC Resolution / Communication
32-09 X 0.29.24 0.29.55 No ATC Resolution / Communication
32-10 X 0.30.26 0.30.58 No ATC Resolution / Communication
A 32-11 1 X X 0.37.11 0.38.34 0.38.42 0.39.01 Go around 0.01.23 0.00.08 0.01.31
32-12 X 0.40.06 0.40.16 No ATC Resolution / Communication
32-13 X 0.41.27 0.42.24 No ATC Resolution / Communication
ME
AS
UR
EM
ENTS
32-14 X 0.44.10 0.44.34 No ATC Resolution / Communication
32-15 X 0.44.39 0.45.28 No ATC Resolution / Communication
32-16 X 0.46.03 0.46.24 No ATC Resolution / Communication
32-17 X 0.47.26 0.47.39 No ATC Resolution / Communication
32-18 X 0.53.29 0.54.22 0.54.30 0.54.50 Expedite taxiing 0.00.53 0.00.08 0.01.01
32-19 X 0.56.23 0.57.06 No ATC Resolution / Communication

1.4 Aeronautics and Space
Project FP6-503192 “EMMA1” EMMA SP6 - Malpensa A-SMGCS V&V Results
Page 46
Save Date: 2007-05-24 Public 46 File Name: D651_Results_MXP_V1.0.doc Version 1.00
32-20 X X 0.56.37 0.57.23 0.57.27 0.58.06 Expedite taxiing 0.00.46 0.00.04 0.00.50
32-21 X X 1.00.23 1.00.44 No ATC Resolution / Communication
Table 3-13: Complete Example for a Non-nominal RTS Session
S2.1/4.1/5.1 (DETECTION PERIOD)
S2.2/4.2/5.2 (RESOLUTION PERIOD)
S2.3/4.3/5.3 (DURATION PERIOD)
VIS-1/B VIS-1/A VIS-1/B VIS-1/A VIS-1/B VIS-1/A
0.00.12 0.00.56 0.00.02 0.00.04 0.00.14 0.01.00
0.00.21 0.01.23 0.00.08 0.00.08 0.00.29 0.01.31
0.00.07 0.00.53 0.00.03 0.00.08 0.00.10 0.01.01
0.00.31 0.00.46 0.00.08 0.00.04 0.00.35 0.00.50
0.00.01 0.00.56 0.00.04 0.00.04 0.00.08 0.01.00
0.00.57 0.00.36 0.00.04 0.00.03 0.01.01 0.00.39
0.00.12 0.00.26 0.00.08 0.00.04 0.00.20 0.00.30
0.00.08 0.01.07 0.00.04 0.00.05 0.00.12 0.01.12
0.00.23 0.00.21 0.00.03 0.00.05 0.00.26 0.00.26
0.01.04 0.00.11 0.00.06 0.00.03 0.01.10 0.00.14
- 0.00.55 - 0.00.04 - 0.00.59
0.00.07 - 0.00.02 - 0.00.09
MEAN Values 0.00.24 0.00.43 0.00.05 0.00.05 0.00.29 0.00.48
Table 3-14: Safety Results under VIS-1 Conditions
S2.1/4.1/5.1 (DETECTION PERIOD)
S2.2/4.2/5.2 (RESOLUTION PERIOD)
S2.3/4.3/5.3 (DURATION PERIOD)
VIS-2/B VIS-2/A VIS-2/B VIS-2/A VIS-2/B VIS-2/A
0.01.14 0.00.24 0.00.05 0.00.07 0.00.19 0.00.31
0.01.08 0.00.28 0.00.05 0.00.06 0.01.13 0.00.34
0.00.38 0.00.36 0.00.02 0.00.03 0.00.40 0.00.39
0.00.59 0.00.53 0.00.06 0.00.15 0.01.05 0.01.08
0.00.07 0.00.08 0.00.05 0.00.12
MEAN Values
0.01.00 0.00.30 0.00.05 0.00.07 0.00.49 0.00.37 Table 3-15: Safety Results under VIS-2 Conditions

1.4 Aeronautics and Space
Project FP6-503192 “EMMA1” EMMA SP6 - Malpensa A-SMGCS V&V Results
Page 47
Save Date: 2007-05-24 Public 47 File Name: D651_Results_MXP_V1.0.doc Version 1.00
3.3.2.3 Capacity and Efficiency Measurement Results
3.3.2.3.1 Capacity Results Regarding capacity there was only one objective with an associated hypothesis, namely to find out whether capacity at the runways and on the airport will be increased using A-SMGCS Level I: ID Low-level Objective Hypothesis
C1 Capacity shall increase when A-SMGCS Level I functionality is in use.
With the use of EMMA A-SMGCS Level I capacity at the runways and on the airport will be increased as compared to a situation without A-SMGCS Level I.
Table 3-16 Capacity Low-level Objective and Hypothesis Indicators C1.1-1.4 were analysed in the same manner. Results were looked at for different traffic samples so that a comparison between use of A-SMGCS and no use of A-SMGCS could be made for the same traffic sample. The combined output of three different traffic samples could then be compared for two different visibilities. As was mentioned earlier in this document, a direct comparison between VIS-1 and VIS-2 simulations was not possible due to different working procedures and runway configurations. However, it was interesting to find out whether there were comparable trends in the data.
Number of Take-offs per Hour
0
1
2
3
4
5
6
7
8
9
10
0 4 8 12 16 20 24 28 32 36 40 44 48 52 56 60 64 68 72 76 80 84 88 92 96 100 104 108 112 116 120
Time [min]
Num
ber o
f Tak
e-of
fs p
er H
our
Run 23Run 38
Figure 3-4: Example for Throughput Build-up and Decrease in Traffic Sample F
In general, throughput was determined by looking at traffic development within a certain period of time. For example, the number of aircraft per hour at 30 minutes into the simulation consists of the number of aircraft from the start of the simulation until one hour into the simulation. Accordingly, the number of aircraft at simulation start is from -30 minutes until +30 minutes into the simulation.

1.4 Aeronautics and Space
Project FP6-503192 “EMMA1” EMMA SP6 - Malpensa A-SMGCS V&V Results
Page 48
Save Date: 2007-05-24 Public 48 File Name: D651_Results_MXP_V1.0.doc Version 1.00
Although this seems to be a very artificial way to determine throughput, the associated graphs could show the development of traffic within a simulation run and also give the maximum achieved throughput. They could also show shifts in the simulation run, i.e. they indicate whether aircraft were handled earlier or later. In particular, the development of the throughput curve was considered a measure for such a shift. A quicker build up to maximum throughput and a quicker decrease from maximum throughput, means that aircraft were handled quicker (cf. Figure 3-4). The first indicator, to be looked at, was Runway Departure Throughput. It was measured as a list of take-off times of aircraft. Indicator Metrics Measurement
C1.1 (CA01)
Runway Departure Throughput
C1.1.1 Number of take-offs in a period of time
NARSIM-Tower event logging: list of take-off times.
The simulation runs showed the following maximum values, which were all reached at 30 minutes into the simulation:
Run ID
Baseline (B) or Advanced (A)
Visibility Condition
(1, 2) Traffic Sample
Maximum Runway
Departure Throughput
Runway Departure
Throughput Indicator
27 B 15
37 A A
15 -0.10
34 B 10
26 A B
10 -0.28
31 B 10
35 A
1
C 10
-0.33
29 B 7
25 A D
7 0
33 B 12
30 A E
12 -0.16
38 B 9
23 A
2
F 9
-0.47
Table 3-17: C1.1.1 – Runway Departure Throughput Results

1.4 Aeronautics and Space
Project FP6-503192 “EMMA1” EMMA SP6 - Malpensa A-SMGCS V&V Results
Page 49
Save Date: 2007-05-24 Public 49 File Name: D651_Results_MXP_V1.0.doc Version 1.00
As can be seen from Table 3-17, a difference in maximum departure throughput could not be detected. It seems though, that there is a trend that traffic was handled faster in the baseline condition. Since there was no distinction made between A-SMGCS Level I and II, it is difficult to say whether this trend is caused by the ground controller, who is releasing the flights earlier in the baseline condition, or whether it is caused by one of the runway controllers reacting on possible warnings given by the RIA system at the runway threshold. Thus, the results must be compared with other measurements made in the following. The next indicator to be looked at was Runway Arrival Throughput. It was measured as a list of touch-down times of aircraft. Indicator Metrics Measurement
C1.2 (CA02)
Runway Arrival Throughput
C1.2.1 Number of landings in a period of time (scenario-fixed)
NARSIM-Tower event logging: list of landing times.
The simulation runs showed the following maximum values, which were all reached at 30 minutes into the simulation:
Run ID
Baseline (B) or Advanced (A)
Visibility Condition
(1, 2) Traffic Sample
Maximum Runway Arrival
Throughput
Runway Arrival Throughput
Indicator
27 B 23
37 A A
23 0
34 B 33
26 A B
33 0.06
31 B 28
35 A
1
C 28
0
29 B 13
25 A D
13 -0.03
33 B 16
30 A E
16 -0.07
38 B 7
23 A
2
F 7
0
Table 3-18: C1.2.1 – Runway Arrival Throughput Results

1.4 Aeronautics and Space
Project FP6-503192 “EMMA1” EMMA SP6 - Malpensa A-SMGCS V&V Results
Page 50
Save Date: 2007-05-24 Public 50 File Name: D651_Results_MXP_V1.0.doc Version 1.00
As can be seen from Table 3-18, a difference in maximum arrival throughput could not be detected. There is also no trend that flights were handled faster or slower (see also Figure 3-5), which can be explained by the fact that flights landed more or less automatically at pre-defined points in time and could only be influenced marginally by pseudo-pilots, who might have changed the arrival speed on final.
Number of Landings per Hour
0
5
10
15
20
25
0 4 8 12 16 20 24 28 32 36 40 44 48 52 56 60 64 68 72 76 80 84 88 92 96 100 104 108 112 116 120
Time [min]
Num
ber o
f Lan
ding
s pe
r Hou
r
Run 27Run 37
Figure 3-5: Example for Identical Runway Arrival Throughput in Traffic Sample A
The next indicator to be looked at was Runway Crossing Throughput. It was measured by defining a very small area around the centreline of runway 35L (see Figure 3-3) and marking all aircraft that entered the area and left it again within 15 seconds. For these aircraft a list of times for entering the defined centreline area was given. Indicator Metrics Measurement
C1.3 Runway Crossing Throughput
C1.3.1 Number of crossings in a period of time
NARSIM-Tower event logging: list of average times of entering and exiting runway 35L.

1.4 Aeronautics and Space
Project FP6-503192 “EMMA1” EMMA SP6 - Malpensa A-SMGCS V&V Results
Page 51
Save Date: 2007-05-24 Public 51 File Name: D651_Results_MXP_V1.0.doc Version 1.00
Number of RWY Crossings per Hour
0
5
10
15
20
25
0 4 8 12 16 20 24 28 32 36 40 44 48 52 56 60 64 68 72 76 80 84 88 92 96 100 104 108 112 116 120
Time [min]
Num
ber o
f RW
Y C
ross
ings
per
Hou
r
Run 26Run 34
Figure 3-6: Example for Runway Crossing Throughput in Traffic Sample B
Run ID
Baseline (B) or Advanced (A)
Visibility Condition
(1, 2) Traffic Sample
Maximum Runway Crossing
Throughput
Runway Crossing
Throughput Indicator
27 B 18
37 A A
18 -0.1
34 B 23
26 A B
23 0.46
31 B 23
35 A
1
C 23
0.06
29 B 4
25 A D
4 -0.03
33 B 11
30 A E
11 0.04
38 B
2
F 7 -0.3

1.4 Aeronautics and Space
Project FP6-503192 “EMMA1” EMMA SP6 - Malpensa A-SMGCS V&V Results
Page 52
Save Date: 2007-05-24 Public 52 File Name: D651_Results_MXP_V1.0.doc Version 1.00
23 A 7
Table 3-19: C1.3.1 – Runway Crossing Throughput Results
As can be seen from Table 3-19, a difference in maximum runway crossing throughput could not be detected. There is no trend that flights were crossing earlier or later, and there is also no correlation with the possible trend described for runway departure throughput. An example for early crossing in the advanced condition is shown in Figure 3-6. The next indicators to be looked at were the Hand-over Throughput indicators. Indicator Metrics Measurement
C1.4.1 (CA05)
Number of pushbacks in a period of time
NARSIM-Tower event logging: list of times of pushback initiation.
C1.4 Hand-over Throughput
C1.4.2 Number of hand-overs from GND to TWR in a period of time
NARSIM-Tower event logging: list of times of frequency hand-over.
First of all, the number of pushbacks was analysed. It was measured as a list of times when pushback was initiated. A pushback was defined as the first time an aircraft moved backwards. It should be noted that aircraft leaving a stand on the airport in forward direction were not counted.
Number of Pushbacks per Hour
0
1
2
3
4
5
6
7
8
0 4 8 12 16 20 24 28 32 36 40 44 48 52 56 60 64 68 72 76 80 84 88 92 96 100 104 108 112 116 120
Time [min]
Num
ber o
f Pus
hbac
ks p
er H
our
Run 23Run 38
Figure 3-7: Example for Identical Pushback Throughput in Traffic Sample F

1.4 Aeronautics and Space
Project FP6-503192 “EMMA1” EMMA SP6 - Malpensa A-SMGCS V&V Results
Page 53
Save Date: 2007-05-24 Public 53 File Name: D651_Results_MXP_V1.0.doc Version 1.00
The second hand-over throughput indicator concerns the number of handovers from ground to tower controller positions. It was measured as a list of times when a frequency hand-over from ground to tower occurred. Since the ground controller had the possibility to switch to two different tower frequencies (TWR1 and TWR2), there were actually two such indicators. Except for traffic sample A, where there were direct hand-overs from ground to TWR1 due to aircraft coming from the northern gates, most hand-overs were from ground to TWR2, though. As can be seen from Table 3-20, a difference in maximum pushback throughput could not be detected. There is no trend that flights were pushed back earlier or later, which means that the ground controller complied with the off-blocks planning. An example for pushback throughput is shown in Figure 3-7.
Run ID
Baseline (B) or Advanced (A)
Visibility Condition
(1, 2) Traffic Sample
Maximum Pushback
Throughput
Pushback Throughput
Indicator
27 B 6
37 A A
6 0.03
34 B 4
26 A B
4 0.03
31 B 6
35 A
1
C 6
-0.08
29 B 1
25 A D
1 0
33 B 6
30 A E
6 0.12
38 B 7
23 A
2
F 7
-0.01
Table 3-20: C1.4.1 – Pushback Throughput Results
As can also be seen from Table 3-20, most aircraft in traffic sample D did not pushback (only one pushback) but left a stand. Although it might have been possible to also look at the off-blocks throughput considering stands, it cannot be expected that this will be essentially different from the pushback throughput as the runway departure throughput showed no differences at all.

1.4 Aeronautics and Space
Project FP6-503192 “EMMA1” EMMA SP6 - Malpensa A-SMGCS V&V Results
Page 54
Save Date: 2007-05-24 Public 54 File Name: D651_Results_MXP_V1.0.doc Version 1.00
Number of Handovers GND-TWR per Hour
0
2
4
6
8
10
12
14
16
0 4 8 12 16 20 24 28 32 36 40 44 48 52 56 60 64 68 72 76 80 84 88 92 96 100 104 108 112 116 120
Time [min]
Num
ber o
f Han
dove
rs G
ND
-TW
R p
er H
our
Run 30Run 33
Figure 3-8: Hand-over Problems in Traffic Sample E
Comparably, the figures for hand-overs from ground to tower positions show no surprise (Table 3-21), with the only exception being the hand-overs from ground to TWR1 in traffic sample E (see also Figure 3-8).
Run ID
Baseline (B) or Advanced (A)
Visibility Condition
(1, 2) Traffic Sample
Maximum Hand-over
Throughput
Hand-over Throughput
Indicator
27 B 8 + 8 = 16
37 A A
8 + 8 = 16 0.05
34 B 7 + 3 = 10
26 A B
7 + 3 = 10 -0.32
31 B 10 + 1 = 11
35 A
1
C 10 + 1 = 11
0.01
29 B 4 + 3 = 7
25 A D
4 + 3 = 7 -0.2
33 B 11 + 4 = 15
30 A
2
E 11 + 2 = 13
-0.88

1.4 Aeronautics and Space
Project FP6-503192 “EMMA1” EMMA SP6 - Malpensa A-SMGCS V&V Results
Page 55
Save Date: 2007-05-24 Public 55 File Name: D651_Results_MXP_V1.0.doc Version 1.00
38 B 7 + 2 = 9
23 A F
7 + 2 = 9 -0.27
Table 3-21: C1.4.2 – GND to TWR Hand-over Throughput Results
After a short analysis it was found that the reason for the difference in the two runs was the fact that pseudo-pilots made a wrong frequency switch when crossing behind runway 35L to get to runway 35R for take-off, which led to double counting of handovers in run 33. Furthermore, from the indicators there seems to be a trend towards faster frequency switches in the baseline runs. Frequency switches, however, are initiated by pseudo-pilots, so that it is very doubtful whether this trend is actually meaningful. The final indicator considered for capacity analysis was the number of aircraft under control of controller positions GND, TWR1 and TWR2 at any given moment in the simulation. This indicator was analysed by showing the distribution of number of aircraft under control over the simulation time. Given the earlier results, differences between the baseline and advanced runs cannot be expected. Nevertheless, this distribution should give a better indication of how the traffic developed than the results of hand-over throughput.
0 200 400 600 800 10001200 1400 1600 1800 2000 2200 2400 2600 2800 3000 3200 3400 3600 3800 4000 4200 4400Run 31
0
0,5
1
1,5
2
2,5
3
3,5
4
4,5
5
Num
ber o
f A/C
und
er C
ontr
ol G
ND
Time [sec]
Number of A/C under Control GND
Run 31Run 35
Figure 3-9: Example for Number of Aircraft under Ground Control (Traffic Sample C)

1.4 Aeronautics and Space
Project FP6-503192 “EMMA1” EMMA SP6 - Malpensa A-SMGCS V&V Results
Page 56
Save Date: 2007-05-24 Public 56 File Name: D651_Results_MXP_V1.0.doc Version 1.00
Indicator Metrics Measurement
C1.5.1 Number of aircraft under control of GND
NARSIM-Tower event logging: list of number of aircraft under control every 20 seconds after simulation start.
C1.5.2 Number of aircraft under control of TWR1
NARSIM-Tower event logging: list of number of aircraft under control every 20 seconds after simulation start.
C1.5 (CA07, CA08)
Number of Aircraft under Control
C1.5.3 Number of aircraft and vehicles under control of TWR2
NARSIM-Tower event logging: list of number of aircraft under control every 20 seconds after simulation start.
Run ID
Baseline (B) or Advanced (A)
Visibility Condition
(1, 2) Traffic Sample
Maximum Number of A/C
GND
Mean Difference Number of A/C
GND
27 B 4
37 A A
4 0.20
34 B 6
26 A B
5 -0.64
31 B 4
35 A
1
C 5
0.42
29 B 3
25 A D
3 0.3
33 B 8
30 A E
6 0.04
38 B 4
23 A
2
F 5
0.22
Table 3-22: C1.5.1 – Number of A/C GND Results

1.4 Aeronautics and Space
Project FP6-503192 “EMMA1” EMMA SP6 - Malpensa A-SMGCS V&V Results
Page 57
Save Date: 2007-05-24 Public 57 File Name: D651_Results_MXP_V1.0.doc Version 1.00
As Table 3-22 shows there is no trend in the data for the maximum number of aircraft under control of the ground position. The mean difference between advanced and baseline results (measured per 20 seconds of simulation time), however, shows a trend (the only exception is traffic sample B) that more aircraft were under control of the ground position in the advanced condition than in the baseline condition. This would indicate that the ground controller was able to handle more aircraft at a time with the help of the extra surveillance supplied by A-SMGCS Level I functionality.
Run ID
Baseline (B) or Advanced (A)
Visibility Condition
(1, 2) Traffic Sample
Maximum Number of A/C
TWR1
Mean Difference Number of A/C
TWR1
27 B 7
37 A A
7 -0.15
34 B 7
26 A B
6 0.19
31 B 6
35 A
1
C 6
0.24
29 B 1
25 A D
1 -0.08
33 B 3
30 A E
3 0.22
38 B 3
23 A
2
F 2
-0.10
Table 3-23: C1.5.2 – Number of A/C TWR1 Results
Regarding the aircraft under control of TWR1, results are less conclusive. Again there is not much difference between the maximum values reached, but this time also the mean difference does not show a real trend (see Table 3-23), although positive values (meaning that more aircraft are under control in the advanced situation) seem to be slightly higher.
Run ID
Baseline (B) or Advanced (A)
Visibility Condition
(1, 2) Traffic Sample
Maximum Number of A/C
TWR2
Mean Difference Number of A/C
TWR2
27 B 5
37 A A
6 0.14
34 B
1
B 7 -0.11

1.4 Aeronautics and Space
Project FP6-503192 “EMMA1” EMMA SP6 - Malpensa A-SMGCS V&V Results
Page 58
Save Date: 2007-05-24 Public 58 File Name: D651_Results_MXP_V1.0.doc Version 1.00
26 A 6
31 B 6
35 A C
6 -0.18
29 B 4
25 A D
4 0.01
33 B 5
30 A E
5 -0.08
38 B 3
23 A
2
F 3
-0.08
Table 3-24: C1.5.3 – Number of A/C TWR2 Results
Finally, Table 3-24 shows the results for TWR2. Again there is not much difference in the maximum values, but this time the trend in the mean differences between aircraft under control in the advanced and baseline situations shows a more negative trend, meaning that in the advanced condition, the TWR2 controller was handling less traffic at the same time than in the baseline situation. It should also be noted that the overall number of aircraft under control of any position at any given time in the simulation shows a positive trend as well. Considering that pushback throughput is comparable in both baseline and advanced situations (in time off-blocks), this means that aircraft stay at the airport a bit longer in the advanced situation. Thus, given the previous results of indicator C1.5, it seems that aircraft were under control of the ground controller a bit longer in the advanced situation than in the baseline situation. This is also supported by the fact that throughput from GND to TWR control positions shows a negative trend, meaning that throughput from ground to runway controllers is higher for the baseline situation.
3.3.2.3.2 Efficiency Results Efficiency of operations was looked at from two different points of view, namely punctuality in terms of taxi and departure delay and efficient use of resources, i.e. runways and taxiways. First, the results considering delays are looked at. ID Low-level Objective Hypothesis E1 Punctuality of flights shall be
improved when A-SMGCS Level I functionality is in use.
With the use of EMMA A-SMGCS Level I the punctuality of flights (in terms of taxi delays and departure delays) will improve as compared to a situation without A-SMGCS Level I.
An important indicator for delays at the airport is taxiing delay. In this simulation taxiing delay was determined by comparing nominal and actual taxi periods. In the Malpensa test plan (Ref. [9]) the term

1.4 Aeronautics and Space
Project FP6-503192 “EMMA1” EMMA SP6 - Malpensa A-SMGCS V&V Results
Page 59
Save Date: 2007-05-24 Public 59 File Name: D651_Results_MXP_V1.0.doc Version 1.00
minimum taxi time was used. However, during deeper analysis of the results it was found that it was not quite clear what a minimum taxi time is. It could be the time needed by an aircraft with constant speed on the shortest route to RWY 35L. However, it might not be feasible to use this runway due to other operational circumstances (e.g. all aircraft in the scenario need to go to RWY 35L because it is the closest runway), which would severely distort the picture. Therefore, the minimum taxi time was defined to be a more conservative value, called nominal taxi period. The nominal taxi period was determined by dividing the nominal taxi distance by a nominal taxi speed of 15 knots. The nominal taxi distance was defined as the distance moved in forward direction when the speed does not exceed 40 knots. This means that taxiing delay includes all queuing delays. Indicator Metrics Measurement
E1.1 (EF01)
Taxiing Delay E1.1.1 Difference between nominal taxi period and taxi period (positive value indicating that taxi period was longer than nominal)
Nominal taxi period is determined by dividing nominal taxi distance by nominal taxi speed (15 knots).Taxi period starts with first movement after pushback and ends when the aircraft reaches 40 knots on the runway.
The results were presented as a list of delay values which were defined as the difference between actual and nominal taxi periods, meaning that positive values indicate a delay as compared to the nominal taxi time. This resulted in distributions of delay values for each simulation, with a certain mean value and standard deviation. The final value in Table 3-25 represents a significance value as regards the difference between the means of the two distributions for baseline and advanced conditions. For all efficiency measurements, this value was determined by performing a t-test for the two samples with either assuming equal or unequal variances depending on the outcome of an F-test. Variances were assumed to be equal when the outcome of the F-test reached the first level of significance (0.68). The t-test was not considered a paired test, because variances in pseudo-pilot behaviour could be expected. Considering the null hypothesis for efficiency values in the test plan (see Ref. [9]) the t-test was performed as a one-tailed test. This means that the null hypothesis could be rejected, if it was shown that there is a significant difference between sample-means and the mean in the baseline condition is larger than the mean in the advanced condition. In more simple words, this means that the difference between the two sample-means was considered significant if the significance value determined in the t-test is less than 0.05.
Run ID
Baseline (B) or Advanced (A)
Visibility Condition
(1, 2) Traffic Sample
Mean [s]
SD [s] Significance
27 B 79.92 133.19
37 A A
86.53 132.52 0.38
34 B 40.58 94.96
26 A
1
B 62.98 96.25
0.06

1.4 Aeronautics and Space
Project FP6-503192 “EMMA1” EMMA SP6 - Malpensa A-SMGCS V&V Results
Page 60
Save Date: 2007-05-24 Public 60 File Name: D651_Results_MXP_V1.0.doc Version 1.00
31 B 26.34 64.60
35 A C
30.43 79.64 0.37
29 B 11.25 45.04
25 A D
19.75 68.92 0.26
33 B 54.18 103.79
30 A E
54.21 74.85 0.50
38 B -10.75 59.15
23 A
2
F 34.75 53.79
0.00
Table 3-25: E1.1.1 – Taxiing Delay Results
In Table 3-25 only traffic sample F shows a significant result and the null hypothesis must be rejected. Traffic sample B is close to significance, however, the null hypothesis cannot be rejected. The result is supported by the earlier results on throughput for both samples. It seems that all aircraft were handled a bit faster (trends in runway and runway crossing throughput) in the baseline condition. However, none of the other traffic scenarios shows this behaviour, so that for the overall results the null hypothesis cannot be rejected. Line-up queue delay was one of the more difficult measurements to define. Since this value is not related to a nominal value the actual measurement represents the period of time each aircraft remains in a line-up queue before take-off., i.e. the time difference between exiting and entering a line-up queue. The queue was exited as soon as the departure runway area was entered. The aircraft entered a queue when it reduced its speed to 0 knots for the first time after having been handed over to the departure runway controller. Indicator Metrics Measurement
E1.2 (EF05)
Line-up Queue Delay
E1.2.1 Difference between exiting time of queue and entering time of queue
Exiting time of queue is when aircraft enters the departure runway. Entering time of queue is when aircraft reduces speed to 0 knots for the first time after having been handed over to the departure runway controller.
Again results were presented as a list of time values, which resulted in distributions of line-up queue times for each simulation, with a certain mean value and standard deviation. The final value in Table 3-26 again represents a significance value for the difference between the means of the two distributions for baseline and advanced conditions.

1.4 Aeronautics and Space
Project FP6-503192 “EMMA1” EMMA SP6 - Malpensa A-SMGCS V&V Results
Page 61
Save Date: 2007-05-24 Public 61 File Name: D651_Results_MXP_V1.0.doc Version 1.00
Run ID
Baseline (B) or Advanced (A)
Visibility Condition
(1, 2) Traffic Sample
Mean [s]
SD [s] Significance
27 B 195.33 215.01
37 A A
279.60 229.57 0.15
34 B 124.80 156.13
26 A B
164.80 90.90 0.25
31 B 52.30 79.38
35 A
1
C 149.40 175.68
0.07
29 B 135.43 207.47
25 A D
61.57 162.90 0.24
33 B 0.00 0.00
30 A E
66.75 124.03 0.04
38 B 69.56 121.48
23 A
2
F 48.22 126.67
0.36
Table 3-26: E1.2.1 – Line-up Queue Delay Results
In Table 3-26 only traffic sample E shows a significant result and the null hypothesis must be rejected. Traffic sample C is close to significance, however, the null hypothesis cannot be rejected. The result is supported by earlier results regarding departure throughput. Aircraft seemed to have been handled faster in the baseline condition. However, the result of sample E in the baseline condition must certainly be seen as an exceptional result since there was no line-up queue delay at all. Furthermore, none of the other traffic scenarios shows this behaviour, so that for the overall results the null hypothesis cannot be rejected. Departure delay was impossible to define giving the working procedures of Malpensa ground control. Since ground control only worked with planning times for going off-blocks no scheduled departure times were available. In order to find a meaningful measurement the difference between the actual departure time (ATD) and the expected off-blocks time (EOBT) was determined. Obviously, the difference between this measurement and the measurement suggested in the experiment plan (Ref. [9]) is the missing of information on planned taxi periods. Since results are compared between the same traffic samples, though, these periods are expected to be the same in both cases, so that it will be possible to make a comparison between baseline and advanced conditions, albeit with a somewhat artificial measurement. Indicator Metrics Measurement
E1.3 (EF07)
Departure Delay E1.3.1 Difference between scheduled time of
Scheduled departure times not available. Difference

1.4 Aeronautics and Space
Project FP6-503192 “EMMA1” EMMA SP6 - Malpensa A-SMGCS V&V Results
Page 62
Save Date: 2007-05-24 Public 62 File Name: D651_Results_MXP_V1.0.doc Version 1.00
departure and actual between actual take-off time and expected off-blocks time is considered instead as a measure for planning efficiency.
Again results were presented as a list of measurements, representing distributions of time differences (ATD - EOBT) for each simulation, with a certain mean value and standard deviation. The final value in Table 3-27 represents a significance value as regards the difference between the two distributions for baseline and advanced conditions.
Run ID
Baseline (B) or Advanced (A)
Visibility Condition
(1, 2) Traffic Sample
Mean [s]
SD [s] Significance
27 B 593.27 172.99
37 A A
605.80 145.83 0.42
34 B 566.30 136.72
26 A B
635.70 206.01 0.19
31 B 463.30 124.52
35 A
1
C 524.10 151.81
0.17
29 B 461.14 91.49
25 A D
433.86 104.60 0.31
33 B 628.08 113.55
30 A E
659.08 171.44 0.30
38 B 481.67 116.47
23 A
2
F 568.00 131.23
0.09
Table 3-27: E1.3.1 – Departure Delay Results
In Table 3-27 only sample F is close to significance, which is again supported by the earlier mentioned throughput results for that sample, however, the null hypothesis cannot be rejected. None of the other traffic scenarios show this behaviour, so that for the overall results the null hypothesis cannot be rejected. The next measurement to be looked at was runway crossing delay (only RWY 35L). Even though this measurement was also a bit more complex, it could easily be extracted from the NARSIM-Tower simulator loggings. Arrival time at runway crossings was defined as the time at which an aircraft entered a pre-defined area just before the stop bar and crossing time was defined as the time at which the aircraft entered a very small area around the runway centre line. The difference between these time

1.4 Aeronautics and Space
Project FP6-503192 “EMMA1” EMMA SP6 - Malpensa A-SMGCS V&V Results
Page 63
Save Date: 2007-05-24 Public 63 File Name: D651_Results_MXP_V1.0.doc Version 1.00
values was defined to be the crossing delay, which again was compared for identical traffic samples in baseline and advanced condition. Indicator Metrics Measurement
E1.4 Crossing Delay E1.4.1 Difference between time of crossing the runway and arrival time at runway crossing
Arrival time at runway crossing is when the aircraft enters an area around the stop bar before the runway and the crossing time is when the aircraft enters an area around the centreline of the crossed runway.
Results were presented as a list of measurements, representing distributions of crossing delay for each simulation, with a certain mean value and standard deviation. The final value in Table 3-28 represents a significance value as regards the difference between the two distributions for baseline and advanced conditions.
Run ID
Baseline (B) or Advanced (A)
Visibility Condition
(1, 2) Traffic Sample Mean SD Significance
27 B 85.65 51.42
37 A A
97.35 62.98 0.28
34 B 104.74 63.26
26 A B
83.96 22.20 0.07
31 B 69.09 20.95
35 A
1
C 81.78 42.58
0.10
29 B 163.75 63.63
25 A D
145.25 73.54 0.36
33 B 219.36 101.01
30 A E
178.36 53.44 0.13
38 B 100.00 33.85
23 A
2
F 142.71 43.42
0.03
Table 3-28: E1.4.1 – Runway Crossing Delay Results
In Table 3-28 only the result for sample F is indeed significant. Sample B is close to significance, however, both results are contradictory. While all earlier results already indicated a slightly better handling of traffic in the baseline condition for sample F, the result for sample B is supported by the

1.4 Aeronautics and Space
Project FP6-503192 “EMMA1” EMMA SP6 - Malpensa A-SMGCS V&V Results
Page 64
Save Date: 2007-05-24 Public 64 File Name: D651_Results_MXP_V1.0.doc Version 1.00
trend in better runway crossing throughput in the advanced condition. None of the other traffic scenarios shows either the one or the other behaviour, so that for the overall results the null hypothesis cannot be rejected. Pushback delay could be determined very straightforward. It was defined as the difference between pushback time and ready-for-pushback time. Pushback time was the time at which the aircraft first had a positive or negative speed and ready-for-pushback time was the time at which the pseudo-pilot switched to the ground control frequency for the first time. This always happened shortly before EOBT. Indicator Metrics Measurement
E1.5 (EF03)
Pushback Delay E1.5.1 Difference between pushback time and ready-for-pushback time
Ready-for-pushback time is the time when the pseudo-pilot switches to the ground frequency for the first time. Pushback time is when the aircraft first has a positive or negative speed.
Results were presented as a list of measurements, representing distributions of pushback delay for each simulation, with a certain mean value and standard deviation. The final value in Table 3-29 represents a significance value as regards the difference between the two distributions for baseline and advanced conditions.
Run ID
Baseline (B) or Advanced (A)
Visibility Condition
(1, 2) Traffic Sample Mean SD Significance
27 B 47.93 26.83
37 A A
40.93 23.72 0.23
34 B 63.60 61.42
26 A B
63.70 43.99 0.50
31 B 40.45 27.17
35 A
1
C 59.36 44.30
0.12
29 B 26.43 9.78
25 A D
35.00 21.25 0.18
33 B 60.25 37.75
30 A E
114.58 125.08 0.09
38 B
2
F 49.11 39.88 0.39

1.4 Aeronautics and Space
Project FP6-503192 “EMMA1” EMMA SP6 - Malpensa A-SMGCS V&V Results
Page 65
Save Date: 2007-05-24 Public 65 File Name: D651_Results_MXP_V1.0.doc Version 1.00
23 A 55.44 54.82
Table 3-29: E1.5.1 – Pushback Delay Results
None of the results in Table 3-29 can be considered significant, so that for the overall results the null hypothesis cannot be rejected. This essentially means that there was no exceptional pushback delay in the simulations. Finally, two measurements looked at efficient use of airport resources, i.e. runways and taxiways, namely the total arrival and total departure periods. ID Low-level Objective Hypothesis
E2 Available resources shall be used more efficiently when A-SMGCS Level I functionality is in use.
With the use of EMMA A-SMGCS Level I resources (in terms of runway occupancy time) will be used more efficiently than without A-SMGCS Level I.
The arrival taxi period was defined as the difference between engine shutdown, when the aircraft stops for the last time in the simulation (only completed arrivals were counted), and touchdown which is when the aircraft is less than one metre above the ground. Indicator Metrics Measurement
E2.1 (EF11)
Taxi Period of Arrival
E2.1.1 Taxi period from touchdown until engine shut-down
Touchdown is when the aircraft is less than 1 metre above the ground. Engine shut-down is when the aircraft stops for the last time in the simulation.
Results were presented as a list of measurements, representing distributions of arrival periods for each simulation, with a certain mean value and standard deviation. The final value in Table 3-30 represents a significance value as regards the difference between the two distributions for baseline and advanced conditions.
Run ID
Baseline (B) or Advanced (A)
Visibility Condition
(1, 2) Traffic Sample Mean SD Significance
27 B 264.91 91.01
37 A A
266.91 97.24 0.47
34 B 267.58 94.35
26 A B
289.73 108.13 0.19
31 B
1
C 254.50 91.66 0.24

1.4 Aeronautics and Space
Project FP6-503192 “EMMA1” EMMA SP6 - Malpensa A-SMGCS V&V Results
Page 66
Save Date: 2007-05-24 Public 66 File Name: D651_Results_MXP_V1.0.doc Version 1.00
35 A 237.85 81.28
29 B 224.85 78.41
25 A D
249.54 118.89 0.27
33 B 249.75 75.05
30 A E
266.56 106.64 0.31
38 B 185.14 42.91
23 A
2
F 194.57 57.18
0.37
Table 3-30: E2.1.1 – Arrival Period Results
The result in Table 3-30 shows that none of the simulations had significant differences in the total arrival period. For the overall results the null hypothesis cannot be rejected. This means that differences in efficiency mainly had to do with departure operations. The departure taxi period was defined as the difference between take-off time, when the aircraft is more than one metre above the ground and pushback time, which is the first time at which the aircraft has a positive or negative speed value. Indicator Metrics Measurement
E2.2 (EF 10, EF12)
Taxi Period of Departure
E2.2.1 Taxi period from pushback until take-off
Pushback time is when the aircraft first has a positive or negative speed. Take-off time is when the aircraft is more than 1 metre above the ground.
Results were presented as a list of measurements, representing distributions of departure periods for each simulation, with a certain mean value and standard deviation. The final value in Table 3-31 represents a significance value as regards the difference between the two distributions for baseline and advanced conditions.
Run ID
Baseline (B) or Advanced (A)
Visibility Condition
(1, 2) Traffic Sample Mean SD Significance
27 B 644.20 172.36
37 A A
663.67 154.70 0.37
34 B 601.00 125.41
26 A B
670.30 171.47 0.16
31 B
1
C 521.30 112.03 0.19

1.4 Aeronautics and Space
Project FP6-503192 “EMMA1” EMMA SP6 - Malpensa A-SMGCS V&V Results
Page 67
Save Date: 2007-05-24 Public 67 File Name: D651_Results_MXP_V1.0.doc Version 1.00
35 A 567.40 120.10
29 B 531.43 89.48
25 A D
495.43 116.94 0.27
33 B 666.92 113.97
30 A E
643.50 90.06 0.29
38 B 532.11 112.34
23 A
2
F 608.00 78.53
0.06
Table 3-31: E2.2.1 – Departure Period Results
Keeping in mind the previous result, this final measurement combines all important efficiency measurements. As can be seen in Table 3-31 none of the results is significant, so that the null hypothesis cannot be rejected. Sample F is close to significance. This shows that in this sample there seems to have been an exceptionally good baseline run with a mean gain of about one minute per aircraft. However, this trend is not reflected in any other of the results and there are even contradictory trends for the same visibility condition, so that no further conclusions should be drawn.
3.3.2.3.3 Conclusions for Capacity and Efficiency Values The results showing reduced throughput in the advanced situation with the active A-SMGCS Level I and II system should not be overrated, since overall throughput values remained constant, meaning that throughput per hour effectively did not change. The fact, however, remains that it took the ground controller some more time to control aircraft in his sector in the advanced condition. Increased inbound throughput or problems with pushback throughput can be excluded as reasons for this fact. The numbers show that aircraft left the gates in time and that inbound traffic was pre-programmed and remained the same. Thus, an explanation could be that the controller took more time to study the additional information he was provided with through A-SMGCS Level I, simply because there was no time constraint (departure time planning) that had to be met after pushback. Obviously, the result cannot be considered structural, as traffic sample B shows exactly the opposite. Although hand-over throughput from ground to tower was less efficient under the advanced condition, a slight improvement in hand-over throughput to TWR2 and also a better runway crossing throughput coincide with a tendency of less aircraft under control for the ground position. Generally, it must be noted that capacity values did not improve for the advanced situation but they also showed no definite trend of deterioration. Causes lie in the set up of the traffic scenarios (constant supply of inbound and outbound traffic) and in the fact that no punctuality targets were set for runway departure times. Regarding efficiency values the same trends are detected, however, no significant results are obtained with the exception of traffic sample F, which continually shows better and even significantly better efficiency values for the baseline condition. However, this fact must be considered as being exceptional, due to the fact that there were no other traffic samples showing that behaviour. Above

1.4 Aeronautics and Space
Project FP6-503192 “EMMA1” EMMA SP6 - Malpensa A-SMGCS V&V Results
Page 68
Save Date: 2007-05-24 Public 68 File Name: D651_Results_MXP_V1.0.doc Version 1.00
that, there were also trends that favoured the advanced condition (see crossing efficiency in traffic sample B). Thus, the null hypothesis, which states that controllers are working just as efficiently or even better with A-SMGCS than without A-SMGCS, cannot be rejected. Considering the set-up of the simulations and the chosen procedures, points of improvement would be to carry out simulations with clear departure targets, such as the expected time of departure (ETD), and with a continuous stream of inbound and outbound flights at the very upper capacity level of the airport. In order to compare the improvements under bad visibility conditions, procedures between good and bad visibility conditions should not differ.
3.3.2.4 Human Factors Results In the real-time simulations, validation experiments consisted of two types of runs: nominal runs with normal operations and non-nominal runs in which the controllers were faced with a high number of events. In the nominal runs the influence of multilateration (i.e. presence of labels in the apron area) could be investigated and in the non-nominal runs the influence of incursion alerts could be elaborated. In total, 12 nominal and 4 non-nominal runs were conducted. The nominal runs lasted between 60 and 80 minutes whereas the non-nominal runs lasted about 45 to 60 minutes. Half of the runs were conducted with A-SMGCS (Level I and II) and the other half under baseline conditions. Three Italian Air Traffic Controllers (ATCo) participated in the experiments. All of them were active controllers at Milan Malpensa Tower and also worked as an instructor. They were between the age of 31 and 34 and their native language was Italian. Their experience as ATCo varied from 7 to 15 years. One of them had experience on two other airports apart from Malpensa. Before the start of the experimental runs the participants had to answer questions about their familiarity with A-SMGCS and their expectations regarding the technology and the experiment. All of them had been working with a system providing Runway Incursion Alerting, but not with an A-SMGCS. Their expectation regarding A-SMGCS was that it would increase safety and capacity. Two of them mentioned that, in addition to that, it would aid their surveillance task or increase situation awareness for both pilots and controllers. Concerning potential risks of the system, two of them responded not to know of any. One controller mentioned that in case of a technical system failure there would be too much information to process for the controllers. Furthermore, he was concerned about the efficiency of the system. The controllers’ expectations regarding their participation in the experiment were: to test the system’s capacity, to make sure that the system is safe and usable, to gain experience with the system, to become more involved in the project and to share opinions. Results for Situation Awareness (SA), workload and usability are reported in the following sections.
3.3.2.4.1 Situation Awareness SASHA, the Situation Awareness (SA) rating method that was used, recommends assessing SA by using an expert observer and a self rating scale (see Ref. [12]). For the current experiment introducing an expert observer was not considered feasible. Therefore, only the self rating form, the so-called

1.4 Aeronautics and Space
Project FP6-503192 “EMMA1” EMMA SP6 - Malpensa A-SMGCS V&V Results
Page 69
Save Date: 2007-05-24 Public 69 File Name: D651_Results_MXP_V1.0.doc Version 1.00
SASHA-Q, was used. After each experimental run both tower controllers (TWR1 and TWR2) rated their perceived SA on the form. In reporting SA, first the influence of A-SMGCS is discussed considering data from nominal and non-nominal runs together. A comparison of the SA responses between runs with A-SMGCS and without A-SMGCS is made. Secondly, the results within nominal runs and within non-nominal runs will be discussed to represent the influence of A-SMGCS Level I and Level II separately.
3.3.2.4.1.1 Impact of A-SMGCS on SA (All Runs) Considering the SASHA data of both the nominal and non-nominal runs and comparing the overall SA scores for the A-SMGCS configuration against the baseline, no significant differences were found for the individual questions.
SASHA_Q (Situation Awareness)
1
2
3
4
5
6
Ahead
of / p
redict
traffic
Plan an
d orga
nise
Surpris
ed
Too fo
cuse
d
Forget
to tra
nsfer
Diff icu
lt find
ing in
fo
Labe
ls us
eful
Alerts
usefu
l
Attenti
on to
labe
ls
Attenti
on to
alert
s
Labe
ls he
lp und
erstan
d
Alerts
help
unde
rstan
d
Overal
l SA
Question
Rat
ing
(1 n
ever
- 5
alw
ays)
A-SMGCS On
A-SMGCS Off
Error bars indicate 95% confidence interval (α = 0,05).
Figure 3-10: SASHA-Q Comparison with and without A-SMGCS
3.3.2.4.1.2 SA between Visibility Conditions (All Runs) Half of the runs were conducted with good visibility (VIS-1) and the other half were conducted in simulated night time (VIS-2). The scenarios in the VIS-1 condition were with high traffic density and the VIS-2 with medium traffic density. SASHA scores for the two visibility conditions were compared. Comparing visibility conditions 1 and 2, no significant differences were found except for one question. Question 4: “Did you have the feeling of starting to focus too much on a single problem and/or area of the sector?” was rated significantly higher (F (1, 22) = 5.466, p = 0.029) in VIS-1 condition compared to the VIS-2 condition, though in both visibility conditions values were quite low.

1.4 Aeronautics and Space
Project FP6-503192 “EMMA1” EMMA SP6 - Malpensa A-SMGCS V&V Results
Page 70
Save Date: 2007-05-24 Public 70 File Name: D651_Results_MXP_V1.0.doc Version 1.00
SASHA_Q (Situation Awareness)
1
2
3
4
5
6
Ahead
of / p
redict
traffic
Plan an
d orga
nise
Surpris
ed
Too fo
cuse
d
Forget
to tra
nsfer
Diff icu
lt find
ing in
fo
Labe
ls us
eful
Alerts
usefu
l
Attenti
on to
labe
ls
Attenti
on to
alert
s
Labe
ls he
lp und
erstan
d
Alerts
help
unde
rstan
d
Overal
l SA
Question
Rat
ing
(1 n
ever
- 5
alw
ays)
VIS1
VIS2
Error bars indicate 95% confidence interval (α = 0,05).
Figure 3-11: SASHA-Q Comparison for VIS-1 and VIS-2
3.3.2.4.1.3 SA between Controller Positions (All Runs) Comparison between the SASHA ratings of the two controller positions yielded no difference in the overall SASHA rating. Question 6: “Did you have any difficulty finding an item of (static) information?” was rated significantly higher (F (1, 22) = 16.036, p= 0.001) by tower controller 2 (TWR2).
SASHA_Q (Situation Awareness)
1
2
3
4
5
6
Ahead
of / p
redict
traffic
Plan an
d orga
nise
Surpris
ed
Too fo
cuse
d
Forget
to tra
nsfer
Diff icu
lt find
ing in
fo
Labe
ls us
eful
Alerts
usefu
l
Attenti
on to
labe
ls
Attenti
on to
alert
s
Labe
ls he
lp und
erstan
d
Alerts
help
unde
rstan
d
Overal
l SA
Question
Rat
ing
(1 n
ever
- 5
alw
ays)
TWR1
TWR2
Error bars indicate 95% confidence interval (α = 0,05).
Figure 3-12: SASHA-Q Comparison for TWR1 and TWR2

1.4 Aeronautics and Space
Project FP6-503192 “EMMA1” EMMA SP6 - Malpensa A-SMGCS V&V Results
Page 71
Save Date: 2007-05-24 Public 71 File Name: D651_Results_MXP_V1.0.doc Version 1.00
ID Low-level Objective Hypothesis
H1 Situation Awareness of controllers shall increase when A-SMGCS Level I functionality is in use.
With the use of EMMA A-SMGCS Level I the controllers’ situation awareness will increase as compared to a situation without A-SMGCS Level I.
H1 H1.1
(HF02) Situation Awareness using A-SMGCS Level I
H1.1.1 SASHA Questionnaire
See appendix Ref. [9].
3.3.2.4.1.4 Impact of A-SMGCS on SA between Visibility Conditions (Nominal Runs) In order to analyse whether use of A-SMGCS was of significant influence on SA in one of the visibility conditions a comparison of the two was made. Considering data from the nominal runs only, the overall measure for SA was derived from the last question of the SASHA_Q questionnaire “Finally, how would you rate your overall situation awareness during this exercise?” This overall SA rating is compared over visibility and with and without A-SMGCS. Even though no significant differences were found, the trend suggests that under both VIS-1 and VIS-2 the A-SMGCS increases the reported SA of the controllers.
SASHA_Q Situation Awareness (nominal conditions)
1
2
3
4
5
6
Visibility 1 Visibility 2
Visibility condition
Rat
ing
(1 -
5)
A-SMGCS On
A-SMGCS Off
Figure 3-13: A-SMGCS Impact on SA between Visibility Conditions (Nominal Runs)
During the debriefing, after conducting all experimental runs, the controllers were asked to elaborate on the answers that they had given in the questionnaires. The controllers considered the additional labels and information about aircraft positions in the apron very helpful and confirmed this type of information may add to their SA. A potential risk that was mentioned is that the system may distract the controller and that the controller therefore spends less time looking outside, thereby possibly reducing his SA.

1.4 Aeronautics and Space
Project FP6-503192 “EMMA1” EMMA SP6 - Malpensa A-SMGCS V&V Results
Page 72
Save Date: 2007-05-24 Public 72 File Name: D651_Results_MXP_V1.0.doc Version 1.00
ID Low-level Objective Hypothesis
H2 Situation Awareness of controllers shall increase when A-SMGCS Level II functionality is in use.
With the use of EMMA A-SMGCS Level II the controllers’ situation awareness will increase as compared to a situation without A-SMGCS Level II.
H2 H2.1
(HF02) Situation Awareness using A-SMGCS Level II
H2.1.1 SASHA Questionnaire
See appendix Ref. [9].
3.3.2.4.1.5 Impact of A-SMGCS on SA between Visibility Conditions (Non-nominal Runs) The number of non-nominal runs was limited to two runs with A-SMGCS and two without. These situations were studied at a qualitative rather than a quantitative level. However, two significant differences were found. Question 1: “Did you have the feeling that you were ahead of the traffic, able to predict the evolution of the traffic?” was rated significantly higher (F (1, 6) = 9.000, p = 0.024) in the condition with A-SMGCS. Question 6 “Did you have any difficulty finding an item of (static) information?” was rated significantly higher (F (1, 6) = 8.000, p=0.030) in the runs without A-SMGCS. No further significant differences were found.
SASHA_Q (Situation Awareness)
1
2
3
4
5
6
Ahead
of / p
redict
traffic
Plan an
d orga
nise
Surpris
ed
Too fo
cuse
d
Forget
to tra
nsfer
Diff icu
lt find
ing in
fo
Labe
ls us
eful
Alerts
usefu
l
Attenti
on to
labe
ls
Attenti
on to
alert
s
Labe
ls he
lp und
erstan
d
Alerts
help
unde
rstan
d
Overal
l SA
Question
Rat
ing
(1 n
ever
- 5
alw
ays)
A-SMGCS On
A-SMGCS Off
Error bars indicate 95% confidence interval (α = 0,05).
Figure 3-14: SASHA-Q Comparison of A-SMGCS Impact
For the non nominal runs the last question of the SASHA-Q questionnaire (“Finally, how would you rate your overall situation awareness during this exercise?”) yielded that under both visibility conditions A-SMGCS has no significant impact on the reported SA. The trend is that, contrary to the nominal conditions, reported SA is higher under the VIS-2 conditions. During the debriefing, at the end of the session of experimental runs, the controllers were asked to elaborate on the answers that they had given in the questionnaires. Due to the settings (sensitivity) of

1.4 Aeronautics and Space
Project FP6-503192 “EMMA1” EMMA SP6 - Malpensa A-SMGCS V&V Results
Page 73
Save Date: 2007-05-24 Public 73 File Name: D651_Results_MXP_V1.0.doc Version 1.00
the system sometimes warnings appeared when that was not really necessary. An example is when one aircraft is lining up for the runway while another aircraft that landed just exits the runway. This resulted in a warning which the controllers called “something that you don’t need” but that was no serious problem either. They simply considered it a matter of adjusting the system parameters.
SASHA_Q Situation Awareness (not nominal conditions)
1
2
3
4
5
6
Visibility 1 Visibility 2
Visibility condition
Rat
ing
(1 -
5)
A-SMGCS On
A-SMGCS Off
Figure 3-15: A-SMGCS Impact on SA between Visibility Conditions (Non-nominal Runs)
3.3.2.4.2 Workload Workload was rated in two different ways. At the end of each run controllers filled in the NASA TLX rating scale in which they indicated how they had perceived their workload during the past run. The other way was the Instantaneous Self Assessment (ISA). ISA comprises an electronic unit that was attached to the right hand side of the two controller working positions. Every three minutes a red light on the box illuminated as a sign for the controllers to select one of five buttons to indicate the perceived workload, 1 indicating a low workload and 5 a high workload. The averages of the ISA ratings per run were processed and described in this report as workload indicators next to the NASA TLX. Furthermore, flight strip annotations were counted as a potential additional measure of workload. R/T load was also logged during the experiment and a hypothesis was included in the validation plan that presupposed that it would be measure for workload. There was, however, no substantiation how the use of A-SMGCS would reduce or increase the R/T load. It seems that R/T load could be a measure for task load but would be a poor indicator of workload. The data was therefore not analysed.
3.3.2.4.2.1 Impact of A-SMGCS on NASA TLX Ratings (All Runs) In the NASA-TLX data retrieved from the nominal and non nominal runs, no significant differences between the conditions with and without were found.
3.3.2.4.2.2 NASA TLX Rating between Visibility Conditions (All Runs) Workload between the two visibility conditions was compared. The total mental workload was rated significantly higher (F (1, 22) = 7.557, p = 0.12) in the visibility 1 condition compared to visibility 2. In particular the mental demand was rated significantly higher ((F (1, 22) = 15.059, p = 0.001) in the

1.4 Aeronautics and Space
Project FP6-503192 “EMMA1” EMMA SP6 - Malpensa A-SMGCS V&V Results
Page 74
Save Date: 2007-05-24 Public 74 File Name: D651_Results_MXP_V1.0.doc Version 1.00
visibility 1 condition, as well as the temporal demand (F (1, 22) = 7.580, p = 0.012) and the effort (F (1, 22) = 8.079, p = 0.009). As the traffic density in VIS-1 was higher than in VIS-2, the task load in VIS-1 was higher. Therefore, the outcome of higher workload ratings under VIS-1 is not surprising.
NASA TLX (Task Load Index)
0102030405060708090
100
Total
Mental
Dem
and
Physic
al Dem
and
Tempo
ral D
eman
d
Perform
ance
Effort
Frustrati
on Lev
el
(Sub)scale
Rat
ing VIS1
VIS2
Error bars indicate 95% confidence interval (α = 0,05).
Figure 3-16: NASA-TLX Ratings for Different Visibility Conditions
3.3.2.4.2.3 NASA TLX Rating between Controller Positions (All Runs) The total mental workload was rated significantly higher (F (1, 22) = 4.376, p = 0.048) by the tower two controller than by TWR1. Especially the temporal demand was significantly higher (F (1, 22) = 4.480, p = 0.046) for the TWR2 controller.
NASA TLX (Task Load Index)
0102030405060708090
100
Total
Mental
Dem
and
Physic
al Dem
and
Tempo
ral D
eman
d
Perform
ance
Effort
Frustrati
on Lev
el
(Sub)scale
Rat
ing TWR1
TWR2
Error bars indicate 95% confidence interval (α = 0,05).

1.4 Aeronautics and Space
Project FP6-503192 “EMMA1” EMMA SP6 - Malpensa A-SMGCS V&V Results
Page 75
Save Date: 2007-05-24 Public 75 File Name: D651_Results_MXP_V1.0.doc Version 1.00
Figure 3-17: NASA-TLX Ratings for Different Controller Positions
ID Low-level Objective Hypothesis
H3 Controller workload shall decrease when A-SMGCS Level I functionality is in use.
With the use of EMMA A-SMGCS Level I the controller workload will decrease as compared to a situation without A-SMGCS Level I.
H3.1 (HF04)
Mental Workload using A-SMGCS Level I
H3.1.1 NASA TLX See appendix Ref. [9].
H3.2 (EF20, EF21)
R/T Load using A-SMGCS Level I
H3.2.1 Difference between R/T-button up and R/T-button down
NARSIM-Tower Event Logging.
H3
H3.3 Flight Strip Annotations using A-SMGCS Level I
H3.3.1 Number of flight strip annotations
HF expert observation.
3.3.2.4.2.4 A-SMGCS Impact on TLX Ratings between Visibilities (Nominal Runs) The total workload rating is compared over visibility and with and without A-SMGCS, under nominal traffic conditions. The workload is significantly higher (F (1, 20) = 6.901, p = 0.016) under VIS-1 than under VIS-2 but A-SMGCS does not seem to make a difference here.
NASA Task Load Index (nominal conditions)
0
10
2030
40
50
60
7080
90
100
Visibility 1 Visibility 2
Visibility condition
Rat
ing A-SMGCS On
A-SMGCS Off
Figure 3-18: TLX Ratings for A-SMGCS Impact between Visibility Conditions (Nominal Runs)

1.4 Aeronautics and Space
Project FP6-503192 “EMMA1” EMMA SP6 - Malpensa A-SMGCS V&V Results
Page 76
Save Date: 2007-05-24 Public 76 File Name: D651_Results_MXP_V1.0.doc Version 1.00
3.3.2.4.2.5 A-SMGCS Impact on ISA Results between Visibility Conditions (Nominal Runs) The ISA ratings showed no significant differences with and without A-SMGCS. However, similar to the NASA TLX ratings, under nominal conditions the workload under VIS-1 is rated significantly higher (F (1, 20) = 27.661, p = < 0.0005) than under VIS-2.
ISA (nominal conditions)
1
2
3
4
5
6
Visibility 1 Visibility 2
ISA
Rat
ing
(1 (l
ow w
orkl
oad)
- 5
(hig
h w
orkl
oad)
)
A-SMGCS On
A-SMGCS Off
Error bars indicate 95% confidence interval (α = 0,05).
Figure 3-19: ISA Ratings for A-SMGCS Impact between Visibility Conditions (Nominal Runs)
3.3.2.4.2.6 Flight Strip Annotations (All Runs) The paper flight strips the controllers used in the runs were analysed as to provide an additional measure for workload. It was believed that if the workload is increased the controllers will make more annotations per flight strip in order to relieve the demand on their mental resources. The fields on the flight strip that were filled in were counted. If two annotations were made in the same field, e.g. separated through a dash, these annotations were counted as two. Annotations that were (later) crossed were also counted as one annotation. Other signs, such as circles around information that was already printed on the strip were also counted as annotations. Flight strips with no annotations at all were not included. The numbers of annotations on the outbound strips were counted to provide a large enough, representative dataset for the total number of annotations. For the nominal runs a total of 243 outbound strips were produced, of which the annotations were counted. No significant difference between the runs with A-SMGCS and without A-SMGCS was found. It appeared that within nominal runs under VIS-1 the influence of A-SMGCS was significant (F (1, 120) = 3.92, p = 0.05). Using the assumption of more annotations mean higher workload, this means that the workload is higher with A-SMGCS than without, which would mean a negative effect of A-SMGCS.

1.4 Aeronautics and Space
Project FP6-503192 “EMMA1” EMMA SP6 - Malpensa A-SMGCS V&V Results
Page 77
Save Date: 2007-05-24 Public 77 File Name: D651_Results_MXP_V1.0.doc Version 1.00
Flight strip annotations
0
1
2
3
4
5
6
7
8
9
10
1 2
visibility
Num
ber
of fl
ight
str
ips
A-SMGCS onA-SMGCS off
Figure 3-20: Outbound Flight Strip Annotations for A-SMGCS Impact between Visibilities
3.3.2.4.2.7 Workload Debriefing for A-SMGCS Level I During the debriefing, after all experimental runs were finished, the controllers elaborated on the answers that they had given in the questionnaires. They reported that the accurate labels with detailed information, also on the apron definitely saved them a great deal of effort (retrieving that kind of information in another way), and as such the A-SMGCS Level I contributes to a workload decrease. ID Low-level Objective Hypothesis
H4 Controller workload shall decrease when A-SMGCS Level II functionality is in use.
With the use of EMMA A-SMGCS Level II the controller workload will decrease as compared to a situation without A-SMGCS Level II.
H4 H4.1
(HF04) Mental Workload using A-SMGCS Level II
H4.1.1 NASA TLX See appendix Ref. [9].
Considering the NASA-TLX data from non nominal runs, no significant differences were found between conditions with and without A-SMGCS, between VIS-1 or VIS-2, or between TWR1 and

1.4 Aeronautics and Space
Project FP6-503192 “EMMA1” EMMA SP6 - Malpensa A-SMGCS V&V Results
Page 78
Save Date: 2007-05-24 Public 78 File Name: D651_Results_MXP_V1.0.doc Version 1.00
TWR2. The number of non-nominal runs was limited to four, which reduced the probabilities of actually identifying significant differences.
3.3.2.4.2.8 A-SMGCS Impact on TLX Ratings between Visibilities (Non-nominal Runs) Under non-nominal traffic conditions, the total workload rating in the NASA-TLX was compared over visibility and with and without A-SMGCS. The trend is, exactly as under the nominal traffic conditions, that the workload is slightly higher under VIS-1 than under VIS-2, but that the A-SMGCS system does not make a difference here.
3.3.2.4.2.9 A-SMGCS Impact on ISA Results between Visibilities (Non-nominal Runs) The ISA ratings showed no significant differences. Of course, the small number of runs reduced the chances of identifying existing significant differences tremendously.
3.3.2.4.2.10 Workload Debriefing for A-SMGCS Level II During the debriefing, after all experimental runs were finished, the controllers were asked to elaborate on the answers that they had given in the questionnaires. The warnings confirm that a (potential) conflict is there, this should confirm a situation that the controller has noticed as well. However, the fact that the system confirms what the controller already knows, makes that he can afford to take less time understanding the situation with as result a decrease of mental workload. In this context the tool is also reported to reduce stress a bit. ID Low-level Objective Hypothesis
H5 Controller acceptability of A-SMGCS Level I related tools.
The controller will accept the A-SMGCS Level I related tools and procedures.
H5.1.1
Comfort and Satisfaction Index
See appendix Ref. [9].
H5.1.2 Ease-of-Task Performance Index
See appendix Ref. [9].
H5 H5.1 (HF03)
Controller Attitudes using A-MSGCS Level I
H5.1.3 Acceptability Index See appendix Ref. [9]. ID Low-level Objective Hypothesis
H6 Controller acceptability of A-SMGCS Level II related tools.
The controller will accept the A-SMGCS Level II related tools and procedures.
H6.1.1 Comfort and
Satisfaction Index See appendix Ref. [9].
H6.1.2 Ease-of-Task Performance Index
See appendix Ref. [9].
H6 H6.1 Controller Attitudes using A-MSGCS Level II
H6.1.3 Acceptability Index See appendix Ref. [9].

1.4 Aeronautics and Space
Project FP6-503192 “EMMA1” EMMA SP6 - Malpensa A-SMGCS V&V Results
Page 79
Save Date: 2007-05-24 Public 79 File Name: D651_Results_MXP_V1.0.doc Version 1.00
3.3.2.4.3 Acceptability It was expected that comfort, satisfaction and ease of use of the system would increase using A-SMGCS Level I and II. In the post-experimental questionnaire the controllers were to rate these aspects as well as others on a 6-point scale. Concerning the comfort, satisfaction, ease of use and performance improvement, the controllers rated the system 5 or higher (on 6-point scale). A-SMGCS Level I (the labels) was perceived as more comfortable and easier to use than A-SMGCS Level II (the alerts). The statement “I want A-SMGCS at Malpensa” was rated slightly higher for Level I than for Level II. Controllers mentioned that before introduction of Level II the parameters needed better setting.
Acceptability
0,00
1,00
2,00
3,00
4,00
5,00
6,00
comfortable satisfaction easy improvesperformance
I want A-SMGCS
A-SMGCS 1A-SMGCS 2
Figure 3-21: Acceptability Ratings for the Use of A-SMGCS
3.3.2.4.4 HMI Usability For the HMI evaluation the System Usability Scale (SUS) was used and questions concerning participant attitude. The SU scale consists of 10 statements concerning the usability1. The participants should indicate their level of agreement with these statements on a Likert scale. An overall score for usability can be derived per completed SUS. This score is a number between 0 and 100. This score in itself is not meaningful but it allows for comparison of the baseline HMI and HMI with A-SMGCS. Scores per question can be compared for the different conditions as well as the overall score.
1 The SU scale originally was constructed form an original pool of 50 items, of which 10 questions were selected as most evoking and providing a most consist and polarised responses.

1.4 Aeronautics and Space
Project FP6-503192 “EMMA1” EMMA SP6 - Malpensa A-SMGCS V&V Results
Page 80
Save Date: 2007-05-24 Public 80 File Name: D651_Results_MXP_V1.0.doc Version 1.00
3.3.2.4.4.1 Impact of A-SMGCS on SU between Visibility Conditions Considering all runs (nominal and non-nominal) the HMI usability with A-SMGCS and without, the differences for the visibility conditions were analysed. Under visibility condition 1 (bright daylight) the difference with and without A-SMGCS was not significant. Average SU scores were 69.3 without the system and 74.9 with. Using a T-test, the difference is not significant. The outcome under visibility condition 2 (darkness) is very similar: with averages of 70.6 for baseline and 74.6 with A-SMGCS the results did not yield significant differences. However, some individual statements did reveal significant differences (like to use system, would need support, too much inconsistency, learn to use very quickly) in favour of the A-SMGCS system.
SU (System Usability)
62
64
66
68
70
72
74
76
78
80
1 2
visibility
SU
scor
e
A-SMGCS offA-SMGCS on
Figure 3-22: A-SMGCS Impact on System Usability between Visibility Conditions (All Runs)
H5 H5.2
(HF05) Usability of A-SMGCS Level I
H5.2.1 HMI Usability Index See appendix Ref. [9].
Considering the SU overall scores in nominal runs without A-SMGCS was 69 compared to 76 with A-SMGCS. This difference is significant (T-Test t = -3.165, df = 22, p = 0.004). In particular the statements “I think that I would like to use this system frequently” and “I found the various functions in this system were well integrated” were significantly higher with A-SMGCS as compared to the baseline condition.
3.3.2.4.4.2 Impact of A-SMGCS on SU between Visibility Conditions (Nominal Runs) Significant differences in SU score were measured within visibility conditions for nominal runs. Under VIS-1 (bright daylight), with A-SMGCS, the average was 76 and for runs without the system it was 69 (t = -3.841, df = 7.527, p = 0.006). Under dark conditions the differences were very similar but non-

1.4 Aeronautics and Space
Project FP6-503192 “EMMA1” EMMA SP6 - Malpensa A-SMGCS V&V Results
Page 81
Save Date: 2007-05-24 Public 81 File Name: D651_Results_MXP_V1.0.doc Version 1.00
significant (averages 69.5 and 75.7). It was expected that the Level I system is especially useful under low visibility conditions, which can not be concluded from this study.
SU (system usability), nominal conditions
60
62
64
66
68
70
72
74
76
78
80
82
1 2
visibility
SU s
core
A-SMGCS offA-SMGCS on
Figure 3-23: A-SMGCS Impact on SU between Visibility Conditions (Nominal Runs)
Individual SUS statements that yielded significant differences between the baseline and the labels under visibility 2 conditions were 4, 6, 7, 8, 10 (“would need support”, “too much inconsistency”, “learn to use very quickly”, “cumbersome to use”, “needed to learn a lot”). ‘Cumbersome to use’ was rated higher for A-SMGCS Level I compared to the baseline whereas all other statements yielding significant differences were rated in favour of the A-SMGCS Level I.
3.3.2.4.4.3 Impact of A-SMGCS on SU between Controller Positions (Nominal Runs) No significant differences in SU scores between controller positions were found for the system with aircraft labels (A-SMGCS Level I). H6 H6.2 Usability of A-
SMGCS Level II H6.2.1 HMI Usability Index See appendix Ref. [9].
For non-nominal runs the difference in overall SU score was negative (with 72 with A-SMGCS off and 71 for A-SMGCS on). Although it is not a significant difference it is remarkable as in nominal runs the overall SU score was rated significantly higher with the A-SMGCS system than without. In post-experimental questionnaires it was indicated that the parameter setting of the alerting system was not considered appropriate, which may explain the negative influence of the runway incursion alert on the rating.

1.4 Aeronautics and Space
Project FP6-503192 “EMMA1” EMMA SP6 - Malpensa A-SMGCS V&V Results
Page 82
Save Date: 2007-05-24 Public 82 File Name: D651_Results_MXP_V1.0.doc Version 1.00
3.3.2.4.4.4 Impact of A-SMGCS on SU between Visibility Conditions (Non-nominal Runs) No significant differences in SU score were measured between visibility conditions for non-nominal runs. For visibility condition VIS-1 (normal daylight) the difference between A-SMGCS on and off is almost zero (averages of 70 for A-SMGCS off and 70.5 for A-SMGCS on). Under visibility condition VIS-2 the SU scores for both the baseline and the advanced system were rated higher, which can be explained by the necessity of a system in low visibility. The differences between the experimental runs with the alerting system on or off were higher and negative for the alerting system. The SU score for A-SMGCS on was on average 71.5 and 74 for A-SMGCS off. This difference is not significant considering the limited number of non-nominal runs.
SUS (system usability), non-nominal conditions
64
66
68
70
72
74
76
1 2
visibility
SU
sco
re
A-SMGCS offA-SMGCS on
Figure 3-24: A-SMGCS Impact on SU between Visibility Conditions (Non-nominal Runs)
3.3.2.4.4.5 Impact of A-SMGCS on SU between Controller Positions (Non-nominal Runs) No significant differences in SU scores between controller positions were found considering the non-nominal runs only.
3.3.2.4.4.6 A-SMGCS Usability Issues The controllers stressed that they would also want to see labels of aircraft that are on the apron and just departing. The labels of aircraft that have just arrived at a gate should automatically disappear, to avoid the display to get cluttered. On the approach display the labels should not be visible because of clutter. Controllers believed that the A-SMGCS Level I would increase their capacity under low visibility conditions. The controllers mentioned that they needed to take care not to be head-down too much.
3.3.2.4.5 Training Concerning the training the controllers responded to have learned from the experiment. The questions whether training was desirable or necessary were on average scored around 3 (on a pix point scale).

1.4 Aeronautics and Space
Project FP6-503192 “EMMA1” EMMA SP6 - Malpensa A-SMGCS V&V Results
Page 83
Save Date: 2007-05-24 Public 83 File Name: D651_Results_MXP_V1.0.doc Version 1.00
3.3.2.4.6 Simulation Realism All three controllers rated the simulation a realistic environment with a score of 5. A difference between the simulation and the real world, which was reported by all three controllers, was the performance of the aircraft. In addition to that one of the controllers mentioned the response of the pilots in the experiment as being different from reality.
3.3.2.4.7 Division of Responsibilities The controllers did not mention any uncertainty about division of responsibilities with the introduction of the runway incursion alerting system. In the debriefing, controllers mentioned that the alerts allow the controller not to constantly monitor a potential conflict. From this it can be concluded that they trust the system to alert in time. Furthermore, the controllers mentioned that when the system gave an alert they would have to tell the flight crew of the aircraft on final approach to make a go-around or ask the flight crew what they wanted to do. But as a general rule they said that when there is an alert then a go-around would be initiated, applying in the current situation and in the situation with A-SMGCS Levels I and II. From both comments it can be concluded that the controllers trust the system in warning them in time for potential conflicts and that they consider this a system responsibility.
3.3.2.4.8 Conclusion Regarding hypotheses H1 and H2 it can be concluded that the current study does not indicate any negative impact of A-SMGCS Level I or II on the tower controllers’ situational awareness. There is even a trend that indicates that for both visibility levels it is so that A-SMGCS improves situational awareness under nominal traffic conditions. Therefore, from this perspective the A-SMGCS system can be installed when there are other benefits. Regarding hypotheses H3 and H4 it can be concluded that the current study does not indicate any negative impact of A-SMGCS Level I or II on the tower controllers’ mental workload. So from this perspective the A-SMGCS system can be installed when there are other benefits. The fact that there were clear differences in mental workload between visibility conditions and controller positions (TWR 1 or 2) when A-SMGCS Level I was used indicates that the experiment was designed in such a way that the differences in mental workload that one may expect were indeed present in the experiment. As such the experiment was designed correctly, and still there was no difference in mental workload between using A-SMGCS Level I and II or not using this technology. Regarding hypothesis H5 and H6 it can be concluded that the study showed that the system usability increases with the introduction of A-SMGCS Level I. For Level II it can not be concluded from this study that the system usability increases compared to the baseline condition. The number of runs in the A-SMGCS Level II experiments was relatively small. The aim of these runs was to study A-SMGCS at a qualitative, rather than a quantitative level. Therefore, it is not surprising that there were few significant differences found under these conditions. The remarks and comments made by the controllers are the true human factors results of these runs, and may be used to further improve the system.

1.4 Aeronautics and Space
Project FP6-503192 “EMMA1” EMMA SP6 - Malpensa A-SMGCS V&V Results
Page 84
Save Date: 2007-05-24 Public 84 File Name: D651_Results_MXP_V1.0.doc Version 1.00
4 Shadow-mode Trials
4.1 Introduction Shadow-mode trials were carried out on February and March 2006 for a total of eight days of observations. Two CWPs were available in the MXP test bed for shadow-mode trials. The first one was located in the PSA room at the supervisor position and reproduced the TWR 35L working position, while the second one was located at TWR operational room near GND position and reproduced the GND working position.
Figure 4-1: Layout of the MXP Test-bed CWPs
Two sessions per day were conducted: one in the morning with high level of traffic density and one in the afternoon with medium level of traffic density. The two tested scenarios in every observation day are summarised in the table below:

1.4 Aeronautics and Space
Project FP6-503192 “EMMA1” EMMA SP6 - Malpensa A-SMGCS V&V Results
Page 85
Save Date: 2007-05-24 Public 85 File Name: D651_Results_MXP_V1.0.doc Version 1.00
Day
Ope
ratio
nal
Scen
ario
ID
Syst
em F
acto
r:
Bas
elin
e (B
) or
Adv
ance
d (A
)
Visi
bilit
y C
ondi
tion
(1, 2
)
Hig
h (H
) or
Med
ium
(M) T
raffi
c D
ensi
ty
ATC
o 35
L
ATC
o G
ND
Obs
erve
rs
Valid
atio
n Su
perv
isor
Test
-bed
Tec
hnic
al
Expe
rt
Morning SM - 01 A 1 H √ √ 2 1 1
Afternoon SM - 02 A 1 M √ √ 2 1 1
Table 4-1: Scenarios Tested during Shadow-mode Trials
These two scenarios were repeated for all the observations days. The personnel involved in each session were composed of: • 1 Validation supervisor; • 2 ATCos: 1 ATCO at GND position, 1 ATCO at TWR 35L position; • 2 Observers: one for each working position; • 1 Test-bed Technical expert. Each session was organised as follows: 1. one hour and a half (90’) of observation; 2. half an hour (30’) for debriefing, filling in questionnaires and evaluating observer notes; 3. 20-minute break.
90 minutes 30 20 Observation Debriefing Break
Figure 4-2: Organisation of the MXP Shadow Mode Session
4.2 Data Description and Data Collection Methods During shadow-mode trials only qualitative measurements were performed by submitting five ad-hoc debriefing questionnaires to the ATCos involved in the sessions, one for each measured indicator. Specifically, the indicators measured were the following: • Safety,

1.4 Aeronautics and Space
Project FP6-503192 “EMMA1” EMMA SP6 - Malpensa A-SMGCS V&V Results
Page 86
Save Date: 2007-05-24 Public 86 File Name: D651_Results_MXP_V1.0.doc Version 1.00
• Capacity, • Efficiency, and • Human Factors:
- Acceptance, and - Usability.
The 5 different typologies of questionnaires, used for evaluating on a quality level the previous indicators, are presented in Appendix A. Specifically, in the table below is provided a high-level description of the proposed questionnaires:
Indicator Type Number of Questions Answers
Safety Paper 4 From 1 (Strongly disagree) to 6 (Strongly agree)
Capacity Paper
6
Note that every question is divided in 3 parts: x.1
x.2(a) and x.2(b)
x.1: 3 possible answers: Pos., Neg. and No impact
x.2(a): 3 possible answers: 0÷5%, 5÷10%, and more
x.2(b): free text (only if “negative” or “no impact” answer to question x.1)
Efficiency Paper
11
Note that every question is divided in 3 parts: x.1
x.2(a) and x.2(b)
x.1: 3 possible answers: Pos., Neg. and No impact
x.2(a): 3 possible answers: 0÷5%, 5÷10%, and more
x.2(b): free text (only if “negative” or “no impact” answer to question x.1)
HF -Acceptance Paper 65 From 1 (Strongly disagree) to 6 (Strongly agree)
HF- Usability Paper 10 From 1 (Strongly disagree) to 5 (Strongly agree)
Table 4-2: High-level Description the Proposed Questionnaires for MXP SM Trials
Considering 8 days of observations, 2 sessions per day and 2 ATCos per session, a total of N=32 questionnaires were gathered. A total of 10 different ATCos took part to SM trials. It should be noted that some of them, in different SM sessions, observed the system from both positions (GND and TWR35L) available, giving then the opportunity to a same ATCo to observe the system from two different points of view. This allows those ATCos to find out all A-SMGCS implemented potentialities and therefore to provide a more complete opinion on the system. In addition, during SM sessions, advanced interoperability functionalities with Linate PSA (TOC and AOC procedures) were also tested. This required the presence of an additional ATCo at Linate PSA with the aim of co-operating and interacting with the test-bed ATCos. No questionnaires were submitted to the Linate ATCo since it is considered out of the context of the EMMA project.

1.4 Aeronautics and Space
Project FP6-503192 “EMMA1” EMMA SP6 - Malpensa A-SMGCS V&V Results
Page 87
Save Date: 2007-05-24 Public 87 File Name: D651_Results_MXP_V1.0.doc Version 1.00
4.3 Data Analysis
4.3.1 Safety and Human Factors Indicators: Answers provided by ATCos on Safety and Human Factors indicators, are shown in Sections 4.4.1 and 4.4.4, respectively. In addition, the Mean (M) and Standard Deviation (SD) of the answers to every question are provided.
Specifically Mj and SDj for the j-th question have been calculated according to the following equa-tions:
( )
N
MxSD
N
xM
N
ii
j
N
ii
j
∑
∑
=
=
−=
=
1
2
1
where xi denotes the value (from 1 to 6 for Safety and Acceptance questionnaires, and from 1 to 5 for Usability questionnaire) of the i-th answer to the j-th question, while N is the total number of answers to the j-th question (in the analysis N is equal to 32).
4.3.2 Capacity and Efficiency Indicators In Sections 4.4.2 and 4.4.3 the answers provided by ATCos on Capacity and Efficiency indicators are presented. In addition, the related percentages of the answer distribution are also shown. Specifically:
• For question x.1 the percentage refers to the total number of answers available (N=32).
• For question x.2(a) the percentage refers to the total number of “positive” answers to question x.1.

1.4 Aeronautics and Space
Project FP6-503192 “EMMA1” EMMA SP6 - Malpensa A-SMGCS V&V Results
Page 88
Save Date: 2007-05-24 Public 88 File Name: D651_Results_MXP_V1.0.doc Version 1.00
4.4 Results
4.4.1 Safety
ANSWERS
Strongly Disagree Disagree Slightly
DisagreeSlightlyAgree Agree Strongly
Agree QUESTION NUMBER
1 2 3 4 5 6 M SD
1 10 22 4,6875 0,463512405
2 4 14 14 4,3125 0,681794507
3 22 10 5,3125 0,463512405
4 4 10 18 4,4375 0,704339229
Table 4-3: Answer Distribution for Safety Questionnaire
SAFETY
0
1
2
3
4
5
6
1 2 3 4
Question Number
Agr
eem
ent S
cale
(Mea
n va
lue)
Figure 4-3: Answer Trend for the Safety Questionnaire

1.4 Aeronautics and Space
Project FP6-503192 “EMMA1” EMMA SP6 - Malpensa A-SMGCS V&V Results
Page 89
Save Date: 2007-05-24 Public 89 File Name: D651_Results_MXP_V1.0.doc Version 1.00
4.4.2 Capacity
VISIBILITY CONDITION 1
QUESTIONS x.1 - How do you assess impact of A-SMGCS on the…? x.2 - If positive, how do you estimate
the benefits compared with the existing base-line?
Topic Number Positive % Pos. Negative % Neg. No Impact % No Imp. 0÷5% % 5÷10% % more %
1.1 1 3,125 0 31 96,875 Departure Throughput
1.2(a) 1 100 0 0 2.1 0 0 32 100
Arrival Throughput 2.2(a) N/A N/A N/A 3.1 8 25 0 24 75 Mean Nr. of
Push-back Clearances 3.2(a) 8 100 0 0 4.1 8 25 0 24 75 Max Nr. of
Push-back Clearances 4.2(a) 8 100 0 0 5.1 4 12,5 0 28 87,5 Mean Nr. of
Simultaneous Taxiing 5.2(a) 4 100 0 0 6.1 4 12,5 0 28 87,5 Max Nr. of
Simultaneous Taxiing 6.2(a) 4 100 0 0
Table 4-4: Answer Distribution for Capacity Questionnaire in Visibility Condition 1

1.4 Aeronautics and Space
Project FP6-503192 “EMMA1” EMMA SP6 - Malpensa A-SMGCS V&V Results
Page 90
Save Date: 2007-05-24 Public 90 File Name: D651_Results_MXP_V1.0.doc Version 1.00
VISIBILITY CONDITION 2
QUESTIONS x.1 - How do you assess impact of A-SMGCS on the…? x.2 - If positive, how do you estimate the benefits compared with the existing baseline?
Topic Number Positive % Pos. Negative % Neg. No Impact % No Imp. 0÷5% % 5÷10% % more %
1.1 20 62,5 0 12 37,5 Departure Throughput
1.2(a) 18 90 2 10 0 2.1 0 0 32 100
Arrival Throughput 2.2(a) N/A N/A N/A 3.1 20 62,5 0 12 37,5 Mean Nr. of
Push-back Clearances 3.2(a) 20 100 0 0 4.1 20 62,5 0 12 37,5 Max Nr. of
Push-back Clearances 4.2(a) 20 100 0 0 5.1 20 62,5 0 12 37,5 Mean Nr. of
Simultaneous Taxiing 5.2(a) 20 100 0 0 6.1 20 62,5 0 12 37,5 Max Nr. of
Simultaneous Taxiing 6.2(a) 20 100 0 0
Table 4-5: Answer Distribution for Capacity Questionnaire in Visibility Condition 2
Concerning answers to question x.2(b) (In case of negative or no impact, explain the reason), the main reasons for which some ATCOs do not consider A-SMGCS able to provide an added value with respect to baseline situation (i.e. ATCOs did not give a positive answer to question x.1) are summarised in the following: • Visibility Condition 1: ATCO is able to manage traffic manly by outside view and then he retains that efficiency and capacity will not increase with A-
SMGCS; • Visibility Condition 2: in order to really benefit from A-SMGCS introduction, it is necessary to introduce new rules and procedures that will allow to fully
exploit the new potentialities and functionalities of the system; • Concerning arrival indicators (e.g. arrival throughput), since TWR ATCO has a very low influence on arrival sequence, benefits are not expected in this case.

1.4 Aeronautics and Space
Project FP6-503192 “EMMA1” EMMA SP6 - Malpensa A-SMGCS V&V Results
Page 91
Save Date: 2007-05-24 Public 91 File Name: D651_Results_MXP_V1.0.doc Version 1.00
4.4.3 Efficiency VISIBILITY CONDITION 1
QUESTIONS x.1 - How do you assess impact of A-SMGCS on the…? x.2 - If positive, how do you estimate the benefits compared with the existing baseline?
Topic Number Positive % Pos. Negative % Neg. No Impact % No Imp. 0÷5% % 5÷10% % more % 1.1 4 12,5 0 28 87,5
Taxi-in Delay 1.2(a) 4 100 0 0 2.1 6 20 0 24 80
Taxi-out Delay 2.2(a) 6 100 0 0 3.1 0 0 32 100 Departure Queuing
Delays 3.2(a) N/A N/A N/A 4.1 4 12,5 0 28 87,5 Mean Departure
Delays 4.2(a) 4 100 0 0 5.1 4 12,5 0 28 87,5 Mean Departure
Taxi Time 5.2(a) 4 100 0 0 6.1 0 0 32 100
Mean Arrival Taxi Time 6.2(a) N/A N/A N/A 7.1 4 12,5 0 28 87,5
Minimum Taxi Time 7.2(a) 4 100 0 0 8.1 4 12,5 0 28 87,5
Maximum Taxi Time 8.2(a) 4 100 0 0 9.1 0 0 32 100 Mean Nr. of Aircraft in
the Departure Queue 9.2(a) N/A N/A N/A 10.1 0 0 32 100 Maximum Nr. of Aircraft
in the Departure Queue 10.2(a) N/A N/A N/A 11.1 20 62,5 0 12 37,5 Number of
Communications 11.2(a) 8 40 12 60 0
Table 4-6: Answer Distribution for Efficiency Questionnaire in Visibility Condition 1

1.4 Aeronautics and Space
Project FP6-503192 “EMMA1” EMMA SP6 - Malpensa A-SMGCS V&V Results
Page 92
Save Date: 2007-05-24 Public 92 File Name: D651_Results_MXP_V1.0.doc Version 1.00
VISIBILITY CONDITION 2
QUESTIONS x.1- How do you assess impact of A-SMGCS on the…? x.2 - If positive, how do you estimate the benefits compared with the existing baseline?
Topic Number Positive % Pos. Negative % Neg. No Impact % No Imp. 0÷5% % 5÷10% % more % 1.1 23 71,875 0 9 28,125
Taxi-in Delay 1.2(a) 21 91,30435 2 8,695652 0 2.1 20 62,5 0 12 37,5
Taxi-out Delay 2.2(a) 18 90 2 10 0 3.1 14 43,75 0 18 56,25 Departure Queuing De-
lays 3.2(a) 14 100 0 0 4.1 10 31,25 0 22 68,75
Mean Departure Delays 4.2(a) 10 100 0 0 5.1 22 68,75 0 10 31,25 Mean Departure Taxi
Time 5.2(a) 22 100 0 0 6.1 26 81,25 0 6 18,75
Mean Arrival Taxi Time 6.2(a) 24 92,30769 2 7,692308 0 7.1 22 68,75 0 10 31,25
Minimum Taxi Time 7.2(a) 22 100 0 0 8.1 22 68,75 0 10 31,25
Maximum Taxi Time 8.2(a) 22 100 0 0 9.1 8 25 0 24 75 Mean Nr. of Aircraft in
the Departure Queue 9.2(a) 8 100 0 0 10.1 8 25 0 24 75 Maximum Nr. of Aircraft
in the Departure Queue 10.2(a) 8 100 0 0 11.1 28 87,5 0 4 12,5 Number of
Communications 11.2(a) 22 78,57143 6 21,42857 0
Table 4-7: Answer Distribution for Efficiency Questionnaire in Visibility Condition 2
For what concerns answers to question x.2(b) (In case of negative or no impact, explain the reason), the same considerations previously said for Capacity can be applied also for Efficiency.

1.4 Aeronautics and Space
Project FP6-503192 “EMMA1” EMMA SP6 - Malpensa A-SMGCS V&V Results
Page 93
Save Date: 2007-05-24 Public 93 File Name: D651_Results_MXP_V1.0.doc Version 1.00
4.4.4 Human Factors
4.4.4.1 Acceptance
ANSWERS
Strongly Disagree Disagree Slightly
DisagreeSlightlyAgree Agree Strongly
Agree QUESTION NUMBER
1 2 3 4 5 6 M SD
1 4 14 14 3,3125 0,681794512 10 13 9 1,96875 0,769917813 5 18 9 3,125 0,649519054 10 13 9 2,96875 0,769917815 4 23 5 2,03125 0,529408576 4 22 4 2 3,125 0,695970557 1 12 14 5 3,71875 0,759702868 4 15 13 4,28125 0,672419849 3 21 8 3,15625 0,56509817
10 18 14 2,4375 0,4960783711 12 10 10 2,9375 0,8267972812 4 18 10 4,1875 0,6343057213 11 12 9 3,9375 0,7880950114 11 11 10 1,96875 0,8094896215 28 4 4,125 0,3307189116 10 22 2,6875 0,4635124117 12 20 1,625 0,4841229218 17 15 3,46875 0,4990224819 11 21 1,65625 0,4749588820 9 23 4,71875 0,4496092121 14 18 4,5625 0,4960783722 6 14 12 4,1875 0,7261843823 9 10 13 4,125 0,8196798224 10 22 4,6875 0,4635124125 8 24 4,75 0,433012726 18 14 3,4375 0,4960783727 13 19 4,59375 0,491132328 17 15 5,46875 0,4990224829 8 24 4,75 0,433012730 22 10 4,3125 0,4635124131 24 8 2,25 0,433012732 16 8 8 2,75 0,829156233 14 18 4,5625 0,4960783734 8 10 14 3,1875 0,80767835 17 15 5,46875 0,4990224836 14 16 2 1,625 0,5994789437 5 13 14 4,28125 0,7173900238 12 20 4,625 0,48412292

1.4 Aeronautics and Space
Project FP6-503192 “EMMA1” EMMA SP6 - Malpensa A-SMGCS V&V Results
Page 94
Save Date: 2007-05-24 Public 94 File Name: D651_Results_MXP_V1.0.doc Version 1.00
39 15 8 9 3,8125 0,8454843340 13 19 4,59375 0,491132341 13 19 4,59375 0,491132342 21 11 4,34375 0,4749588843 22 10 2,3125 0,4635124144 12 12 8 3,875 0,7806247545 5 20 7 2,0625 0,6091746546 16 8 8 3,75 0,829156247 14 12 6 3,75 0,7548 12 20 3,625 0,4841229249 14 16 2 3,625 0,5994789450 2 20 10 4,25 0,5590169951 8 20 4 3,875 0,5994789452 18 14 4,4375 0,4960783753 21 11 2,34375 0,4749588854 9 15 8 1,96875 0,7281987655 12 20 3,625 0,4841229256 18 14 2,4375 0,4960783757 8 24 3,75 0,433012758 8 12 12 4,125 0,7806247559 5 8 19 4,4375 0,747391360 11 12 9 3,9375 0,7880950161 1 22 9 2,25 0,562 14 18 4,5625 0,4960783763 6 18 8 5,0625 0,6584783664 10 14 8 1,9375 0,747391365 7 7 18 4,34375 0,81430089
Table 4-8: Answer Distribution for Acceptance Questionnaire
ACCEPTANCE
0
1
2
3
4
5
6
1 3 5 7 9 11 13 15 17 19 21 23 25 27 29 31 33 35 37 39 41 43 45 47 49 51 53 55 57 59 61 63 65Question Number
Agr
eem
ent S
cale
(Mea
n va
lue)
Figure 4-4: Answer Trend for the Acceptance Questionnaire

1.4 Aeronautics and Space
Project FP6-503192 “EMMA1” EMMA SP6 - Malpensa A-SMGCS V&V Results
Page 95
Save Date: 2007-05-24 Public 95 File Name: D651_Results_MXP_V1.0.doc Version 1.00
4.4.4.2 Usability
ANSWERS
Strongly Disagree Strongly
Agree QUESTION NUMBER
1 2 3 4 5 MN SD
1 4 25 3 3,96875 0,4666620162 8 20 4 1,875 0,599478943 7 25 3,78125 0,4133986424 24 8 1,25 0,4330127025 3 19 10 4,21875 0,5986638776 2 22 8 2,1875 0,5266343617 4 26 2 3,9375 0,4284784138 3 25 4 2,03125 0,4666620169 8 20 4 2,875 0,5994789410 2 16 14 2,375 0,59947894
Table 4-9: Answer Distribution for Acceptance Questionnaire
USABILITY
00,5
11,5
22,5
33,5
44,5
1 2 3 4 5 6 7 8 9 10Question Number
Agr
eem
ent S
cale
(Mea
n va
lue)
Figure 4-5: Answer Trend for the Usability Questionnaire

1.4 Aeronautics and Space
Project FP6-503192 “EMMA1” EMMA SP6 - Malpensa A-SMGCS V&V Results
Page 96
Save Date: 2007-05-24 Public 96 File Name: D651_Results_MXP_V1.0.doc Version 1.00
5 Conclusions
5.1 Verification Most of the system performances were estimated, and obtained results were compliant with Performance Requirements, as described inside ICAO and EUROCAE references. It was not possible to calculate properly few Verification Indicators (Long term mainly) cause to the inadequacy of recorded data duration. The amount of total number of reports was not adequately big in order to obtain a significant number of “wrong” reports (false detection reports, false identification reports and false alert reports). More detailed information about the main inconveniences occurred during V&V activities performed at Malpensa test site are highlighted in the Shadow Mode conclusions subsection reported below.
5.2 Real-time Simulations This section summarises the conclusions for the EMMA Phase 1 real-time simulations carried out at the NLR NARSIM-Tower simulator for Milan Malpensa Airport.
5.2.1 Safety The main conclusions concerning the safety-related results provided by the RTS exercises carried out in the context of EMMA Phase 1 for the Milan Malpensa Airport test site are as follows: • Detection period results as well as duration period results show that the expected benefits related
to the A-SMGCS Level II implementation are reached only under VIS-2 conditions. • The implementation of the A-SMGCS has no significant impact on resolution period results both
under VIS-1 and VIS-2 conditions.
5.2.2 Capacity and Efficiency The main conclusions concerning the capacity-related results provided by the RTS exercises carried out in the context of EMMA Phase 1 for the Milan Malpensa airport test site are as follows: • Overall throughput values remained constant, i.e. throughput per hour effectively did not change.
However, it took the ground controller some more time to control aircraft in his sector in the advanced condition. Increased inbound throughput or problems with pushback throughput can be excluded as reasons for this fact. The numbers show that aircraft left the gates in time and that inbound traffic was pre-programmed and remained the same. An explanation could be that the controller took more time to study the additional information he was provided with through A-SMGCS Level I, simply because there was no time constraint (departure time planning) that had to be met after pushback.
• Generally, capacity values did not improve for the advanced situation but they also showed no
definite trend of deterioration. Causes lie in the set up of the traffic scenarios (constant supply of inbound and outbound traffic) and in the fact that no punctuality targets were set for runway departure times.

1.4 Aeronautics and Space
Project FP6-503192 “EMMA1” EMMA SP6 - Malpensa A-SMGCS V&V Results
Page 97
Save Date: 2007-05-24 Public 97 File Name: D651_Results_MXP_V1.0.doc Version 1.00
The main conclusions concerning the efficiency-related results provided by the RTS exercises carried out in the context of EMMA Phase 1 for the Milan Malpensa airport test site are as follows: • Efficiency values generally show the same trends as capacity values, yet again, no significant
results were obtained. • The null hypothesis, which states that controllers are working just as efficiently or even better with
A-SMGCS than without A-SMGCS, cannot be rejected. Generally, the following recommendations can be given to improve the conclusiveness of capacity and efficiency results: • Considering the set-up of the simulations and the chosen procedures, points of improvement
would be to carry out simulations with clear departure targets, such as the expected time of departure (ETD), and with a continuous stream of inbound and outbound flights at the very upper capacity level of the airport. In order to compare the improvements under bad visibility conditions, procedures between good and bad visibility conditions should not differ.
5.2.3 Human Factors The main conclusions concerning the human-factors-related results provided by the RTS exercises carried out in the context of EMMA Phase 1 for the Milan Malpensa airport test site are as follows: • The current study does not indicate any negative impact of A-SMGCS Level I or II on the
situational awareness of tower controllers. There is even a trend that indicates that for both visibility levels A-SMGCS improves situational awareness under nominal traffic conditions. From this perspective, the A-SMGCS system can be installed and used when there are other benefits.
• The study does not indicate any negative impact of A-SMGCS Level I or II on the mental
workload of tower controllers. From this perspective, the A-SMGCS system can be installed and used when there are other benefits. The fact that there were clear differences in mental workload between visibility conditions and controller positions (TWR 1 or 2) when A-SMGCS Level I was used indicates that the experiment was designed in such a way that the differences in mental workload that one may expect were indeed present in the experiment. As such the experiment was designed correctly, and still there was no difference in mental workload between using A-SMGCS Level I and II or not.
• The study showed that the system usability increases with the introduction of A-SMGCS Level I.
For Level II it can not be concluded from this study that the system usability increases compared to the baseline condition.
The number of runs in the A-SMGCS Level II experiments was relatively small. The aim of these runs was to study A-SMGCS at a qualitative, rather than a quantitative level. Therefore it is not surprising that there were few significant differences found under these conditions. The remarks and comments made by the controllers are the true human factors results of these runs, and may be used to further improve the system.
5.3 Shadow-mode Trials Before starting drawing the main conclusions of the Malpensa On Site Validation activities it is impor-

1.4 Aeronautics and Space
Project FP6-503192 “EMMA1” EMMA SP6 - Malpensa A-SMGCS V&V Results
Page 98
Save Date: 2007-05-24 Public 98 File Name: D651_Results_MXP_V1.0.doc Version 1.00
tant to consider that operational trials, which are the only ones that really allow studying and evaluat-ing the operational impact of the advanced system against the baseline one, have not been carried out due to the fact that, at the time of test execution, the A-SMGCS system was not mature enough to per-form significant operational tests. This led to focus the validation on site analysis on qualitative meas-urements performed through debriefing questionnaires rather than quantitative ones. Therefore it was not possible to effectively compare the baseline-scenario to the advanced one in terms of quantitative measurements, such as throughput, delays, etc.
In the following are briefly summarised the main conclusions for the SM trials:
• Positive feedback on system functionalities from ATCos involved, even if it is strongly believed
that to fully benefit from the advanced A-SMGCS functionalities (particularly under VIS-2) new operational procedures are required;
• Positive feedback from ATCos on the capability to see the aircraft on the Apron. This can be translated in a fairly good functioning of the surveillance element in the Apron area (MLAT and AVMS system), even if during SM sessions an instability has been sometimes detected;
• The main benefits in terms of efficiency and capacity are foreseen especially in visibility condition 2 and are expected to be no larger than 5% with respect to the baseline scenario;
• Good behaviour of SCA: in general the alerts/warnings were timely and correct; • Positive feedback on interoperability capabilities both from TWR and ACC controllers; • In order to fully benefit from the advanced A-SMGCS functionalities the pilots are required to
follow the transponder operating procedure as published in AIP on 27-Oct-2005 (see Appendix B for more details).
For completeness of the analysis it is important to highlight also the major inconveniences occurred during SM sessions. These are summarised here below:
• Sometimes instability of surveillance (in particular in Apron Area) due to ongoing MLAT tuning (7/10 sensors working at the time of session executions);
• Sometimes callsign duplication;
• Problems with Linate Interoperability link due to sudden loss of connection and database synchro-nization problems;
• Some pilots do not follow the right transponder operating procedure published in AIP on 27 Oct. 2005.

1.4 Aeronautics and Space
Project FP6-503192 “EMMA1” EMMA SP6 - Malpensa A-SMGCS V&V Results
Page 99
Save Date: 2007-05-24 Public 99 File Name: D651_Results_MXP_V1.0.doc Version 1.00
Appendix A - Shadow-mode Debriefing Questionnaires
A.1 Safety Questionnaire
Test Run Number: Safety Questionnaire
Stro
ngly
di D
isag
ree
Slig
htly
dis
agre
e
Slig
htly
agr
ee
Agr
ee
Stro
ngly
agr
ee
01 When I will use A-SMGCS it will help me to operate safer. 1 2 3 4 5 6
02 A-SMGCS is helpful for better monitoring the traffic from the gate till the take-off. 1 2 3 4 5 6
03 I think A-SMGCS can help me to detect in advance or prevent runway incursions.
1 2 3 4 5 6
04 I think A-SMGCS can help me to detect or prevent aircraft conflicts on the manoeuvring area. 1 2 3 4 5 6
Interviewer: Date: Time:
ATCo-ID: Role:
Runways in use:
Baseline/Experimental Condition:
Visibility & Traffic Conditions:

1.4 Aeronautics and Space
Project FP6-503192 “EMMA1” EMMA SP6 - Malpensa A-SMGCS V&V Results
Page 100
Save Date: 2007-05-24 Public 100 File Name: D651_Results_MXP_V1.0.doc Version 1.00
A.2 Capacity Questionnaire
Observer: Date: Time:
ATCo-ID: Role:
Runways in use:
Condition: Baseline/Experimental
Visibility Condition: Traffic Conditions:
1. CA01-Runway Departure Throughput (Hourly Number of Take-Offs) 1.1 Question: How do you assess impact of A–SMGCS on the Runway Departure Throughput (Hourly Number of Take-Offs)?
- Visibility Condition 1:
- Visibility Condition 2: 1.2 (a) Question: If positive, how do you estimate the benefits compared with the existing baseline?
- Visibility Condition 1:
- Visibility Condition 2: 1.2 (b) Question: In case of no impact or negative, explain the reason: __________________________________________________________________________________________ __________________________________________________________________________________________ __________________________________________________________________________________________ __________________________________________________________________________________________ 2. CA02-Runway Arrival Throughput (Hourly Number of Landings) 2.1 Question: How do you assess impact of A–SMGCS on the Runway Arrival Throughput (Hourly Number of Landings)?
- Visibility Condition 1:
- Visibility Condition 2:
Positive Negative No impact
Positive Negative No impact
0÷5% 5÷10% more
0÷5% 5÷10% more
Positive Negative No impact
Positive Negative No impact

1.4 Aeronautics and Space
Project FP6-503192 “EMMA1” EMMA SP6 - Malpensa A-SMGCS V&V Results
Page 101
Save Date: 2007-05-24 Public 101 File Name: D651_Results_MXP_V1.0.doc Version 1.00
2.2 (a) Question: If positive, how do you estimate the benefits compared with the existing baseline?
- Visibility Condition 1:
- Visibility Condition 2: 2.2 (b) Question: In case of no impact or negative, explain the reason: __________________________________________________________________________________________ __________________________________________________________________________________________ __________________________________________________________________________________________ __________________________________________________________________________________________ 3. CA07-Mean Number of Push-back Clearances 3.1 Question: How do you assess impact of A–SMGCS on the Mean Number of Push-back Clearances?
- Visibility Condition 1:
- Visibility Condition 2: 3.2 (a) Question: If positive, how do you estimate the benefits compared with the existing baseline?
- Visibility Condition 1:
- Visibility Condition 2:
3.2 (b) Question: In case of no impact or negative, explain the reason: __________________________________________________________________________________________ __________________________________________________________________________________________ __________________________________________________________________________________________ __________________________________________________________________________________________ 4. CA08-Maximun Number of Push-back Clearances
0÷5% 5÷10% more
0÷5% 5÷10% more
Positive Negative No impact
Positive Negative No impact
0÷5% 5÷10% more
0÷5% 5÷10% more

1.4 Aeronautics and Space
Project FP6-503192 “EMMA1” EMMA SP6 - Malpensa A-SMGCS V&V Results
Page 102
Save Date: 2007-05-24 Public 102 File Name: D651_Results_MXP_V1.0.doc Version 1.00
4.1 Question: How do you assess impact of A–SMGCS on the Maximum Number of Push-back Clearances?
- Visibility Condition 1:
- Visibility Condition 2: 4.2 (a) Question: If positive, how do you estimate the benefits compared with the existing baseline?
- Visibility Condition 1:
- Visibility Condition 2: 4.2 (b) Question: In case of no impact or negative, explain the reason: __________________________________________________________________________________________ __________________________________________________________________________________________ __________________________________________________________________________________________ __________________________________________________________________________________________ 5. CA09-Mean Number of Simultaneous Taxing 5.1 Question: How do you assess impact of A–SMGCS on the Mean Number of Simultaneous Taxiing?
- Visibility Condition 1:
- Visibility Condition 2: 5.2 (a) Question: If positive, how do you estimate the benefits compared with the existing baseline?
- Visibility Condition 1:
- Visibility Condition 2: 5.2 (b) Question: In case of no impact or negative, explain the reason: __________________________________________________________________________________________
Positive Negative No impact
Positive Negative No impact
0÷5% 5÷10% more
0÷5% 5÷10% more
Positive Negative No impact
Positive Negative No impact
0÷5% 5÷10% more
0÷5% 5÷10% more

1.4 Aeronautics and Space
Project FP6-503192 “EMMA1” EMMA SP6 - Malpensa A-SMGCS V&V Results
Page 103
Save Date: 2007-05-24 Public 103 File Name: D651_Results_MXP_V1.0.doc Version 1.00
__________________________________________________________________________________________ __________________________________________________________________________________________ __________________________________________________________________________________________ 6. CA10-Maximum Number of Simultaneous Taxiing 6.1 Question: How do you assess impact of A–SMGCS on the Maximum Number of Simultaneous Taxiing?
- Visibility Condition 1:
- Visibility Condition 2:
6.2 (a) Question: If positive, how do you estimate the benefits compared with the existing baseline?
- Visibility Condition 1:
- Visibility Condition 2:
6.2 (b) Question: In case of no impact or negative, explain the reason: __________________________________________________________________________________ __________________________________________________________________________________ __________________________________________________________________________________ __________________________________________________________________________________
Positive Negative No impact
Positive Negative No impact
0÷5% 5÷10% more
0÷5% 5÷10% more

1.4 Aeronautics and Space
Project FP6-503192 “EMMA1” EMMA SP6 - Malpensa A-SMGCS V&V Results
Page 104
Save Date: 2007-05-24 Public 104 File Name: D651_Results_MXP_V1.0.doc Version 1.00
A.3 Efficiency Questionnaire
Observer: Date: Time:
ATCo-ID: Role:
Runways in use:
System Factor: Baseline/Experimental
Visibility Condition: Traffic Condition:
1. EF01-Taxi-in Delays 1.1 Question: How do you assess impact of A–SMGCS on the Taxi-in Delays?
- Visibility Condition 1:
- Visibility Condition 2: 1.2 (a) Question: If positive, how do you estimate the benefits compared with the existing baseline?
- Visibility Condition 1:
- Visibility Condition 2: 1.2 (b) Question: In case of negative or no impact, explain the reason: __________________________________________________________________________________ __________________________________________________________________________________ __________________________________________________________________________________ __________________________________________________________________________________ 2 EF01-Taxi-out Delays 2.1 Question: How do you assess impact of A–SMGCS on the Taxi-out Delays?
- Visibility Condition 1:
- Visibility Condition 2:
Positive Negative No impact
Positive Negative No impact
0÷5% 5÷10% more
0÷5% 5÷10% more
Positive Negative No impact

1.4 Aeronautics and Space
Project FP6-503192 “EMMA1” EMMA SP6 - Malpensa A-SMGCS V&V Results
Page 105
Save Date: 2007-05-24 Public 105 File Name: D651_Results_MXP_V1.0.doc Version 1.00
2.2 (a) Question: If positive, how do you estimate the benefits compared with the existing baseline?
- Visibility Condition 1:
- Visibility Condition 2: 2.2 (b) Question: In case of negative or no impact, explain the reason: __________________________________________________________________________________ __________________________________________________________________________________ __________________________________________________________________________________ __________________________________________________________________________________ 3. EF05-Departure Queuing Delays 3.1 Question: How do you assess impact of A–SMGCS on the Departure Queuing Delays?
- Visibility Condition 1:
- Visibility Condition 2: 3.2 (a) Question: If positive, how do you estimate the benefits compared with the existing baseline?
- Visibility Condition 1:
- Visibility Condition 2: 3.2 (b) Question: In case of negative or no impact, explain the reason: __________________________________________________________________________________ __________________________________________________________________________________ __________________________________________________________________________________ __________________________________________________________________________________ 4. EF07-Mean Departure Delays
Positive Negative No impact
0÷5% 5÷10% more
0÷5% 5÷10% more
Positive Negative No impact
Positive Negative No impact
0÷5% 5÷10% more
0÷5% 5÷10% more

1.4 Aeronautics and Space
Project FP6-503192 “EMMA1” EMMA SP6 - Malpensa A-SMGCS V&V Results
Page 106
Save Date: 2007-05-24 Public 106 File Name: D651_Results_MXP_V1.0.doc Version 1.00
4.1 Question: How do you assess impact of A–SMGCS on the Mean Departure Delays?
- Visibility Condition 1:
- Visibility Condition 2: 4.2 (a) Question: If positive, how do you estimate the benefits compared with the existing baseline?
- Visibility Condition 1:
- Visibility Condition 2: 4.2 (b) Question: In case of negative or no impact, explain the reason: __________________________________________________________________________________ __________________________________________________________________________________ __________________________________________________________________________________ __________________________________________________________________________________ 5. EF10-Mean Departure Taxi Time 5.1 Question: How do you assess impact of A–SMGCS on the Mean Departure Taxi Time?
- Visibility Condition 1:
- Visibility Condition 2: 5.2 (a) Question: If positive, how do you estimate the benefits compared with the existing baseline?
- Visibility Condition 1:
- Visibility Condition 2: 5.2 (b) Question: In case of negative or no impact, explain the reason:
Positive Negative No impact
Positive Negative No impact
0÷5% 5÷10% more
0÷5% 5÷10% more
Positive Negative No impact
Positive Negative No impact
0÷5% 5÷10% more
0÷5% 5÷10% more

1.4 Aeronautics and Space
Project FP6-503192 “EMMA1” EMMA SP6 - Malpensa A-SMGCS V&V Results
Page 107
Save Date: 2007-05-24 Public 107 File Name: D651_Results_MXP_V1.0.doc Version 1.00
__________________________________________________________________________________ __________________________________________________________________________________ __________________________________________________________________________________ __________________________________________________________________________________ 6. EF11-Mean Arrival Taxi Time 6.1 Question: How do you assess impact of A–SMGCS on the Mean Arrival Taxi Time?
- Visibility Condition 1:
- Visibility Condition 2: 6.2 (a) Question: If positive, how do you estimate the benefits compared with the existing baseline?
- Visibility Condition 1:
- Visibility Condition 2: 6.2 (b) Question: In case of negative or no impact, explain the reason: __________________________________________________________________________________ __________________________________________________________________________________ __________________________________________________________________________________ __________________________________________________________________________________ 7. EF12-Minimum Taxi Time 7.1 Question: How do you assess impact of A–SMGCS on the Minimum Taxi Time?
- Visibility Condition 1:
- Visibility Condition 2: 7.2 (a) Question: If positive, how do you estimate the benefits compared with the existing baseline?
Positive Negative No impact
Positive Negative No impact
0÷5% 5÷10% more
0÷5% 5÷10% more
Positive Negative No impact
Positive Negative No impact

1.4 Aeronautics and Space
Project FP6-503192 “EMMA1” EMMA SP6 - Malpensa A-SMGCS V&V Results
Page 108
Save Date: 2007-05-24 Public 108 File Name: D651_Results_MXP_V1.0.doc Version 1.00
- Visibility Condition 1:
- Visibility Condition 2: 7.2 (b) Question: In case of negative or no impact, explain the reason: __________________________________________________________________________________ __________________________________________________________________________________ __________________________________________________________________________________ __________________________________________________________________________________ 8. EF12-Maximum Taxi Time 8.1 Question: How do you assess impact of A–SMGCS on the Maximum Taxi Time?
- Visibility Condition 1:
- Visibility Condition 2: 8.2 (a) Question: If positive, how do you estimate the benefits compared with the existing baseline?
- Visibility Condition 1:
- Visibility Condition 2: 8.2 (b) Question: In case of negative or no impact, explain the reason: __________________________________________________________________________________ __________________________________________________________________________________ __________________________________________________________________________________ __________________________________________________________________________________ 9. EF13-Mean Number of Aircraft in the Departure Queue? 9.1 Question: How do you assess impact of A–SMGCS on the Mean Number of Aircraft in the Departure Queue?
- Visibility Condition 1:
0÷5% 5÷10% more
0÷5% 5÷10% more
Positive Negative No impact
Positive Negative No impact
0÷5% 5÷10% more
0÷5% 5÷10% more
Positive Negative No impact

1.4 Aeronautics and Space
Project FP6-503192 “EMMA1” EMMA SP6 - Malpensa A-SMGCS V&V Results
Page 109
Save Date: 2007-05-24 Public 109 File Name: D651_Results_MXP_V1.0.doc Version 1.00
- Visibility Condition 2:
9.2 (a) Question: If positive, how do you estimate the benefits compared with the existing baseline?
- Visibility Condition 1:
- Visibility Condition 2: 9.2 (b) Question: In case of no impact or negative, explain the reason: __________________________________________________________________________________ __________________________________________________________________________________ __________________________________________________________________________________ __________________________________________________________________________________ 10. EF14-Maximum Number of Aircraft in the Departure Queue 10.1 Question: How do you assess impact of A–SMGCS on the Maximum Number of Aircraft in the Departure Queue?
- Visibility Condition 1:
- Visibility Condition 2: 10.2 (a) Question: If positive, how do you estimate the benefits compared with the existing baseline?
- Visibility Condition 1:
- Visibility Condition 2: 10.2 (b)Question: In case of no impact or negative, explain the reason: __________________________________________________________________________________ __________________________________________________________________________________ __________________________________________________________________________________ __________________________________________________________________________________ 11. EF21-Number of Communications
Positive Negative No impact
0÷5% 5÷10% more
0÷5% 5÷10% more
Positive Negative No impact
Positive Negative No impact
0÷5% 5÷10% more
0÷5% 5÷10% more

1.4 Aeronautics and Space
Project FP6-503192 “EMMA1” EMMA SP6 - Malpensa A-SMGCS V&V Results
Page 110
Save Date: 2007-05-24 Public 110 File Name: D651_Results_MXP_V1.0.doc Version 1.00
11.1 Question: How do you assess impact of A–SMGCS on the Number of Communications?
- Visibility Condition 1:
- Visibility Condition 2: 11.2 (a) Question: If positive, how do you estimate the benefits compared with the existing baseline?
- Visibility Condition 1:
- Visibility Condition 2: 11.2 (b)Question: In case of no impact or negative, explain the reason: __________________________________________________________________________________ __________________________________________________________________________________ __________________________________________________________________________________ __________________________________________________________________________________
Positive Negative No impact
Positive Negative No impact
0÷5% 5÷10% more
0÷5% 5÷10% more

1.4 Aeronautics and Space
Project FP6-503192 “EMMA1” EMMA SP6 - Malpensa A-SMGCS V&V Results
Page 111
Save Date: 2007-05-24 Public 111 File Name: D651_Results_MXP_V1.0.doc Version 1.00
A.4 Human Factors Questionnaires
A.4.1 System Usability Scale (SUS)
Observer: Date: Time:
ATCo-ID: Role:
Runways in use:
Condition: Baseline/Experimental
Visibility & Traffic Conditions:
Please read carefully through the below list of statements on the current A-SMGCS. Indicate to which extent you agree with this statement by putting a cross on a scale from 1 (strongly disagree) to 5 (strongly agree).
Strongly disagree
Strongly agree
1. I think that I would like to use
this system frequently.
1 2 3 4 5
2. I found the system unnecessarily complex.
1 2 3 4 5
3. I found the system easy to use.
1 2 3 4 5
1 2 3 4 5
4. I think that I would need the support of a technical person to be able to use this system.
5. I found the various functions in this system were well integrated.
1 2 3 4 5
6. I found too much inconsistency
in this system.
1 2 3 4 5
1 2 3 4 5
7. I would imagine that most people would learn to use this system very quickly.
8. I found the system very cumbersome to use.
1 2 3 4 5
9. I felt very confident observing
the system.
1 2 3 4 5
1 2 3 4 5
10. I needed to learn a lot of things before I could get going with the system.

1.4 Aeronautics and Space
Project FP6-503192 “EMMA1” EMMA SP6 - Malpensa A-SMGCS V&V Results
Page 112
Save Date: 2007-05-24 Public 112 File Name: D651_Results_MXP_V1.0.doc Version 1.00
A.4.2 Acceptance
Test Run Number:
Acceptance Questionnaire
Stro
ngly
di D
isag
ree
Slig
htly
di Sl
ight
ly
Agr
ee
Stro
ngly
01 The control of aircraft with the A-SMGCS is very efficient.
1 2 3 4 5 6
02 The use of A-SMGCS makes the controller’s job more difficult.
1 2 3 4 5 6
03 A-SMGCS reduces waiting times for aircraft at the airport.
1 2 3 4 5 6
04 The A-SMGCS provides the right information at the right time.
1 2 3 4 5 6
05 The use of A-SMGCS has a negative effect on job satisfaction.
1 2 3 4 5 6
06 Issuing clearances to aircraft is supported well by the A-SMGCS.
1 2 3 4 5 6
07 I think to use the A-SMGCS frequently.
1 2 3 4 5 6

1.4 Aeronautics and Space
Project FP6-503192 “EMMA1” EMMA SP6 - Malpensa A-SMGCS V&V Results
Page 113
Save Date: 2007-05-24 Public 113 File Name: D651_Results_MXP_V1.0.doc Version 1.00
Test Run Number:
Acceptance Questionnaire
Stro
ngly
di D
isag
ree
Slig
htly
di Sl
ight
ly
Agr
ee
Stro
ngly
08 The information displayed in the A-SMGCS is helpful for avoiding conflicts.
1 2 3 4 5 6
09 I think the A-SMGCS is highly relevant for my work.
1 2 3 4 5 6
10 Improvements in the A-SMGCS display would be desirable.
1 2 3 4 5 6
11 The display enables to recognize a degrading accuracy of surveillance.
1 2 3 4 5 6
12 The display layout is easy to customize to my own preferences.
1 2 3 4 5 6
13 It is helpful to use A-SMGCS when visual reference is impaired.
1 2 3 4 5 6
14 I find the A-SMGCS unnecessarily complex.
1 2 3 4 5 6
15 I think the A-SMGCS is easy to use.
1 2 3 4 5 6

1.4 Aeronautics and Space
Project FP6-503192 “EMMA1” EMMA SP6 - Malpensa A-SMGCS V&V Results
Page 114
Save Date: 2007-05-24 Public 114 File Name: D651_Results_MXP_V1.0.doc Version 1.00
Test Run Number:
Acceptance Questionnaire
Stro
ngly
di D
isag
ree
Slig
htly
di Sl
ight
ly
Agr
ee
Stro
ngly
16 I think there is too much inconsistency between A-SMGCS and real traffic.
1 2 3 4 5 6
17 I find the A-SMGCS very difficult to use.
1 2 3 4 5 6
18 The use of the different windows on the A-SMGCS display is clear to me.
1 2 3 4 5 6
19 Too much interaction with the A-SMGCS is needed.
1 2 3 4 5 6
20 The A-SMGCS display is easy to understand.
1 2 3 4 5 6
21 The A-SMGCS display provides an active, involved role for me.
1 2 3 4 5 6
22 The A-SMGCS display gives me information which I missed before.
1 2 3 4 5 6
23 Information is conveniently arranged in the A-SMGCS display.
1 2 3 4 5 6

1.4 Aeronautics and Space
Project FP6-503192 “EMMA1” EMMA SP6 - Malpensa A-SMGCS V&V Results
Page 115
Save Date: 2007-05-24 Public 115 File Name: D651_Results_MXP_V1.0.doc Version 1.00
Test Run Number:
Acceptance Questionnaire
Stro
ngly
di D
isag
ree
Slig
htly
di Sl
ight
ly
Agr
ee
Stro
ngly
24 The amount of information in the A-SMGCS display is appropriate.
1 2 3 4 5 6
25 Symbols can easily be read under different angles of view in the A-SMGCS display.
1 2 3 4 5 6
26 Labels, signs and symbols in the A-SMGCS display are easy to interpret.
1 2 3 4 5 6
27 The height and width of characters in the A-SMGCS display is sufficient.
1 2 3 4 5 6
28 The A-SMGCS display layout in general should not be changed.
1 2 3 4 5 6
29 The A-SMGCS display size is appropriate for daily work.
1 2 3 4 5 6
30 All text in the A-SMGCS display is easy to read.
1 2 3 4 5 6

1.4 Aeronautics and Space
Project FP6-503192 “EMMA1” EMMA SP6 - Malpensa A-SMGCS V&V Results
Page 116
Save Date: 2007-05-24 Public 116 File Name: D651_Results_MXP_V1.0.doc Version 1.00
Test Run Number:
Acceptance Questionnaire
Stro
ngly
di D
isag
ree
Slig
htly
di Sl
ight
ly
Agr
ee
Stro
ngly
31 There is too much information in the A-SMGCS display which is not needed.
1 2 3 4 5 6
32 Some relevant information is frequently missing in the A-SMGCS display. If yes, what…?
1 2 3 4 5 6
33 The display colours chosen in the A-SMGCS display are appropriate.
1 2 3 4 5 6
34 Pop-up windows appear at the expected place and size.
1 2 3 4 5 6
35 The windows on the A-SMGCS display are conveniently arranged.
1 2 3 4 5 6
36 Aircraft that should have been visible are sometimes obscured by pop-up windows.
1 2 3 4 5 6
37 The contrast between the windows and their background is sufficient.
1 2 3 4 5 6

1.4 Aeronautics and Space
Project FP6-503192 “EMMA1” EMMA SP6 - Malpensa A-SMGCS V&V Results
Page 117
Save Date: 2007-05-24 Public 117 File Name: D651_Results_MXP_V1.0.doc Version 1.00
Test Run Number:
Acceptance Questionnaire
Stro
ngly
di D
isag
ree
Slig
htly
di Sl
ight
ly
Agr
ee
Stro
ngly
38 The A-SMGCS display gives me sufficient information about airborne traffic in the vicinity of the airport.
1 2 3 4 5 6
39 I think that with A-SMGCS it is easier to separate aircraft safely.
1 2 3 4 5 6
40 I think that with A-SMGCS it is easier to detect runway incursions.
1 2 3 4 5 6
41 With A-SMGCS, it is easier to detect incursions into protected areas.
1 2 3 4 5 6
42 With A-SMGCS, it is easier to detect aircraft on the apron.
1 2 3 4 5 6
43 The introduction of the A-SMGCS increases the potential of human error.
1 2 3 4 5 6
44 The introduction of the A-SMGCS is associated with new types of human error.
1 2 3 4 5 6

1.4 Aeronautics and Space
Project FP6-503192 “EMMA1” EMMA SP6 - Malpensa A-SMGCS V&V Results
Page 118
Save Date: 2007-05-24 Public 118 File Name: D651_Results_MXP_V1.0.doc Version 1.00
Test Run Number:
Acceptance Questionnaire
Stro
ngly
di D
isag
ree
Slig
htly
di Sl
ight
ly
Agr
ee
Stro
ngly
45 I think the use of A-SMGCS endangers safety at the airport.
1 2 3 4 5 6
46 I think that the A-SMGCS increases traffic throughput at the airport.
1 2 3 4 5 6
47 The A-SMGCS enables me to handle more traffic when visual reference is not possible.
1 2 3 4 5 6
48 The A-SMGCS enables me to provide the pilots a better level of service.
1 2 3 4 5 6
49 The A-SMGCS enables me to execute my tasks more efficiently.
1 2 3 4 5 6
50 The A-SMGCS helps me to maintain good situation awareness.
1 2 3 4 5 6
51 I feel that A-SMGCS enables me to predict better the evolution of the traffic (to be ahead of the traffic).
1 2 3 4 5 6

1.4 Aeronautics and Space
Project FP6-503192 “EMMA1” EMMA SP6 - Malpensa A-SMGCS V&V Results
Page 119
Save Date: 2007-05-24 Public 119 File Name: D651_Results_MXP_V1.0.doc Version 1.00
Test Run Number:
Acceptance Questionnaire
Stro
ngly
di D
isag
ree
Slig
htly
di Sl
ight
ly
Agr
ee
Stro
ngly
52 There are less frequent unexpected calls of A/C and vehicles with A-SMGCS.
1 2 3 4 5 6
53 There is a risk of focusing too much on a single problem when using A-SMGCS.
1 2 3 4 5 6
54 The A-SMGCS display is detracting too much attention.
1 2 3 4 5 6
55 The A-SMGCS display helps to have a better understanding of the situation.
1 2 3 4 5 6
56 Important events on the A-SMGCS were difficult to recognize.
1 2 3 4 5 6
57 Sometimes information is displayed, which I do not need.
1 2 3 4 5 6
58 Different colour codes on the A-SMGCS display are easy to interpret.
1 2 3 4 5 6
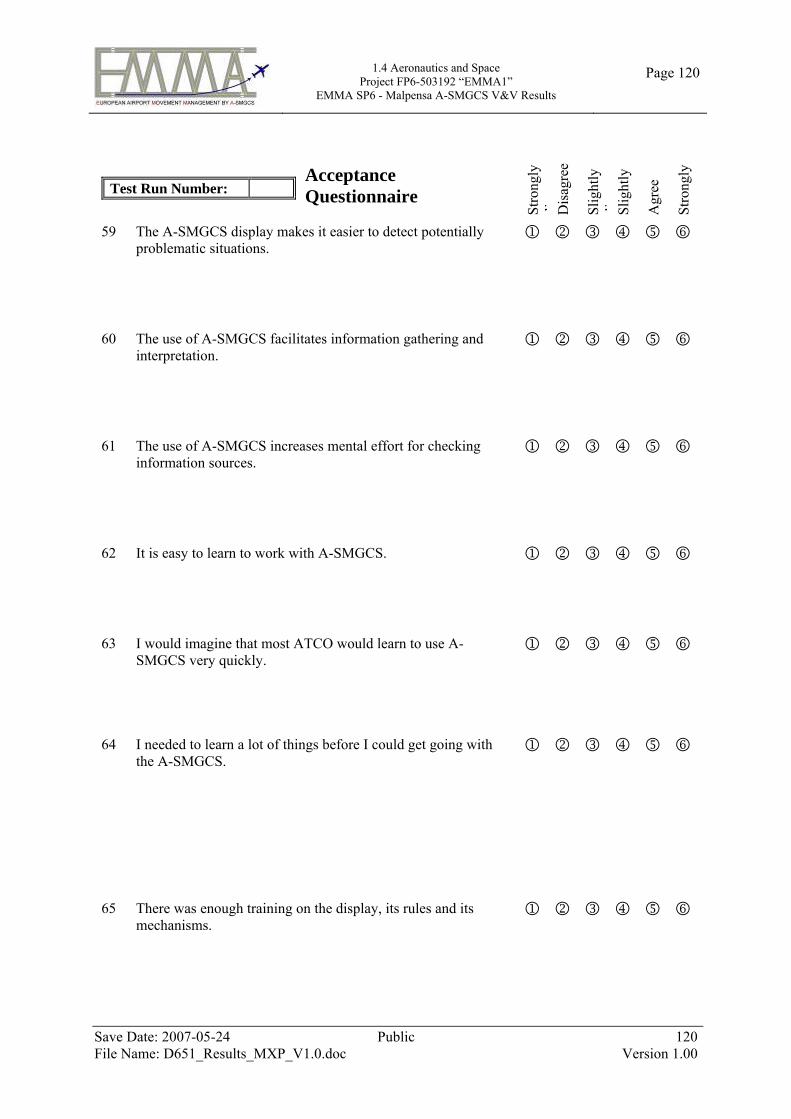
1.4 Aeronautics and Space
Project FP6-503192 “EMMA1” EMMA SP6 - Malpensa A-SMGCS V&V Results
Page 120
Save Date: 2007-05-24 Public 120 File Name: D651_Results_MXP_V1.0.doc Version 1.00
Test Run Number:
Acceptance Questionnaire
Stro
ngly
di D
isag
ree
Slig
htly
di Sl
ight
ly
Agr
ee
Stro
ngly
59 The A-SMGCS display makes it easier to detect potentially problematic situations.
1 2 3 4 5 6
60 The use of A-SMGCS facilitates information gathering and interpretation.
1 2 3 4 5 6
61 The use of A-SMGCS increases mental effort for checking information sources.
1 2 3 4 5 6
62 It is easy to learn to work with A-SMGCS.
1 2 3 4 5 6
63 I would imagine that most ATCO would learn to use A-SMGCS very quickly.
1 2 3 4 5 6
64 I needed to learn a lot of things before I could get going with the A-SMGCS.
1 2 3 4 5 6
65 There was enough training on the display, its rules and its mechanisms.
1 2 3 4 5 6

1.4 Aeronautics and Space
Project FP6-503192 “EMMA1” EMMA SP6 - Malpensa A-SMGCS V&V Results
Page 121
Save Date: 2007-05-24 Public 121 File Name: D651_Results_MXP_V1.0.doc Version 1.00
Test Run Number:
Acceptance Questionnaire
Stro
ngly
di D
isag
ree
Slig
htly
di Sl
ight
ly
Agr
ee
Stro
ngly
Interviewer: Date: Time:
ATCo-ID: Role:
Runways in use:
Baseline/Experimental Condition:
Visibility & Traffic Conditions:

1.4 Aeronautics and Space
Project FP6-503192 “EMMA1” EMMA SP6 - Malpensa A-SMGCS V&V Results
Page 122
Save Date: 2007-05-24 Public 122 File Name: D651_Results_MXP_V1.0.doc Version 1.00
Appendix B – MXP Mode S Transponder Op. Procedure

1.4 Aeronautics and Space
Project FP6-503192 “EMMA1” EMMA SP6 - Malpensa A-SMGCS V&V Results
Page 123
Save Date: 2007-05-24 Public 123 File Name: D651_Results_MXP_V1.0.doc Version 1.00
References [1] European Airport Movement Management by A-SMGCS (EMMA),
EMMA Proposal Description Part B, Version 3.0, EMMA Consortium, 20-Mar-2003
[2] Air Traffic Statistics and Forecast Service (STATFOR), Forecast of Annual Number of IFR Flights (2004 - 2010) Vol. 1, EATMP Information Centre, Brussels, February 2004, pp. 4-6
[3] Eurocontrol ATM 2000+, Eurocontrol Air Traffic Management Strategy for the Years 2000+ Vol. 2, 2003 Edition, EATMP Information Centre, Brussels, July 2003
[4] Operational Benefit Evaluation by Testing an A-SMGCS (BETA), BETA Recommendations Report, Issue 1.0, DLR, Braunschweig, July 2003
[5] A Master ATM European Validation Plan (MAEVA), Validation Guideline Handbook (VGH), Issue 3.0, Isdefe, Madrid, April 2004
[6] FAA/Eurocontrol Co-operative R&D: Action Plan 5, Operational Concept Validation Strategy Document (OCVSD), Edition 1.3, EUROCONTROL, Brussels, December 2003
[7] Boehm, B.W., Verifying and Validating Software Requirements and Design Specifications, IEEE Software, January 1984, pp. 75-88
[8] Eurocontrol DAP/APT, Definition of A-SMGCS Implementation Levels, Edition 1.0, EATMP Information Centre, September 2003
[9] European Airport Movement Management by A-SMGCS (EMMA), Validation Plan for RTS of Malpensa Airport (D6.1.4b), Version 1.0, NLR, Amsterdam, March 2006
[10] European Airport Movement Management by A-SMGCS (EMMA), Verification and Validation Indicators and Metrics for A-SMGCS (D6.2.2), Version 1.0, EMMA Consortium, Athens, 12-Dec-2005

1.4 Aeronautics and Space
Project FP6-503192 “EMMA1” EMMA SP6 - Malpensa A-SMGCS V&V Results
Page 124
Save Date: 2007-05-24 Public 124 File Name: D651_Results_MXP_V1.0.doc Version 1.00
[11] Società Nazionale per l’Assistenza al Volo (ENAV),
Aeronautical Information Publication (AIP) Italy, Release A.O.D., ENAV, Rome
[12] Solutions for Human-Automation Partnerships in European ATM (SHAPE), The Development of Situational Awareness Measures in ATM Systems, Document HRS/HSP-005-REP-01, Issue 1.0, EUROCONTROL Headquarters, Brussels, June 2003

1.4 Aeronautics and Space
Project FP6-503192 “EMMA1” EMMA SP6 - Malpensa A-SMGCS V&V Results
Page 125
Save Date: 2007-05-24 Public 125 File Name: D651_Results_MXP_V1.0.doc Version 1.00
Abbreviations Abbreviation Description A/C Aircraft
ARTES-AES A SELEX-SI tool to analyses all Surveillance data
ARTES – RTD A SELEX-SI software tool to show and record all surveillance data
A-SMGCS Advanced Surface Movements Guidance and Control System
ATM Air Traffic Management
AVMS Automated Vehicles Management System
BETA Operational Benefit Evaluation by Testing A-SMGCS
CV Coverage Volume
CWP Controller Working Position
E-SCA Enhanced Surface Conflict Alerting
MA-SCA Malpensa Advanced Surface Conflict Alerting
MSF Multi Sensor Fusion
MXP Malpensa
NARSIM NLR Tower Simulator
PD Probability of Detection
PDAS Probability of Detection of an Alert Situation
PFD Probability of False Detection
PFID Probability of False Identification
PID Probability of Identification
PSA Prova Simulazione e Addestramento (Test Simulation and Training)
RIA Runway Incursion Alerting
RP Reference Point
RPA Reported Position Accuracy
RPD Reported Position Discrimination
RPS Reported Position Resolution
TRUR Target Report Update Rate
WLAN Wireless Local Area Network
WP Work-Package

1.4 Aeronautics and Space
Project FP6-503192 “EMMA1” EMMA SP6 - Malpensa A-SMGCS V&V Results
Page 126
Save Date: 2007-05-24 Public 126 File Name: D651_Results_MXP_V1.0.doc Version 1.00
Figures and Tables
List of Figures Figure 2-1: Test Vehicle Equipment ..................................................................................................... 10 Figure 2-2: ARTES - RTD Screen Shot ................................................................................................ 11 Figure 2-3: ARTES - AES Screen Shot ................................................................................................ 14 Figure 2-4: Coverage Map .................................................................................................................... 15 Figure 3-1 Controllers during NARSIM-Tower Simulation of Milan Malpensa Airport ..................... 25 Figure 3-2 Non-nominal Event Screen Capture Example ..................................................................... 32 Figure 3-3: Malpensa Airport Map (cf. AIP AGA 2-27 in Ref. [11]) ................................................... 39 Figure 3-4: Example for Throughput Build-up and Decrease in Traffic Sample F............................... 47 Figure 3-5: Example for Identical Runway Arrival Throughput in Traffic Sample A.......................... 50 Figure 3-6: Example for Runway Crossing Throughput in Traffic Sample B ...................................... 51 Figure 3-7: Example for Identical Pushback Throughput in Traffic Sample F..................................... 52 Figure 3-8: Hand-over Problems in Traffic Sample E .......................................................................... 54 Figure 3-9: Example for Number of Aircraft under Ground Control (Traffic Sample C) .................... 55 Figure 3-10: SASHA-Q Comparison with and without A-SMGCS...................................................... 69 Figure 3-11: SASHA-Q Comparison for VIS-1 and VIS-2 .................................................................. 70 Figure 3-12: SASHA-Q Comparison for TWR1 and TWR2 ................................................................ 70 Figure 3-13: A-SMGCS Impact on SA between Visibility Conditions (Nominal Runs)...................... 71 Figure 3-14: SASHA-Q Comparison of A-SMGCS Impact ................................................................. 72 Figure 3-15: A-SMGCS Impact on SA between Visibility Conditions (Non-nominal Runs) .............. 73 Figure 3-16: NASA-TLX Ratings for Different Visibility Conditions ................................................. 74 Figure 3-17: NASA-TLX Ratings for Different Controller Positions................................................... 75 Figure 3-18: TLX Ratings for A-SMGCS Impact between Visibility Conditions (Nominal Runs) ..... 75 Figure 3-19: ISA Ratings for A-SMGCS Impact between Visibility Conditions (Nominal Runs) ...... 76 Figure 3-20: Outbound Flight Strip Annotations for A-SMGCS Impact between Visibilities ............. 77 Figure 3-21: Acceptability Ratings for the Use of A-SMGCS.............................................................. 79 Figure 3-22: A-SMGCS Impact on System Usability between Visibility Conditions (All Runs) ........ 80 Figure 3-23: A-SMGCS Impact on SU between Visibility Conditions (Nominal Runs)...................... 81 Figure 3-24: A-SMGCS Impact on SU between Visibility Conditions (Non-nominal Runs) .............. 82 Figure 4-1: Layout of the MXP Test-bed CWPs................................................................................... 84 Figure 4-2: Organisation of the MXP Shadow Mode Session .............................................................. 85 Figure 4-3: Answer Trend for the Safety Questionnaire ....................................................................... 88 Figure 4-4: Answer Trend for the Acceptance Questionnaire............................................................... 94 Figure 4-5: Answer Trend for the Usability Questionnaire................................................................... 95
List of Tables Table 2-1: Verification Results ............................................................................................................. 24 Table 3-1: Non-nominal Conflict and Infringement Events.................................................................. 27 Table 3-2: Verification Scenarios as defined for the MA-SCA Tool.................................................... 29 Table 3-3: Safety Metrics and Measurements ....................................................................................... 31 Table 3-4: Non-nominal Event Data Table Example ............................................................................ 32 Table 3-5: Capacity Metrics and Measurements ................................................................................... 33 Table 3-6: Traffic Sample Characteristics............................................................................................. 34 Table 3-7: Efficiency Metrics and Measurements................................................................................. 36 Table 3-8: Human Factors Metrics and Measurements......................................................................... 37 Table 3-9: MA-SCA Parameter Tuning ................................................................................................ 42

1.4 Aeronautics and Space
Project FP6-503192 “EMMA1” EMMA SP6 - Malpensa A-SMGCS V&V Results
Page 127
Save Date: 2007-05-24 Public 127 File Name: D651_Results_MXP_V1.0.doc Version 1.00
Table 3-10: Nominal Experiment Runs for the Milan Malpensa Real-time Simulations ..................... 43 Table 3-11: Filtered Callsigns per Traffic Sample ................................................................................ 44 Table 3-12: Low-level Safety Objectives and Hypotheses ................................................................... 44 Table 3-13: Complete Example for a Non-nominal RTS Session......................................................... 46 Table 3-14: Safety Results under VIS-1 Conditions ............................................................................. 46 Table 3-15: Safety Results under VIS-2 Conditions ............................................................................. 46 Table 3-16 Capacity Low-level Objective and Hypothesis................................................................... 47 Table 3-17: C1.1.1 – Runway Departure Throughput Results .............................................................. 48 Table 3-18: C1.2.1 – Runway Arrival Throughput Results .................................................................. 49 Table 3-19: C1.3.1 – Runway Crossing Throughput Results................................................................ 52 Table 3-20: C1.4.1 – Pushback Throughput Results ............................................................................. 53 Table 3-21: C1.4.2 – GND to TWR Hand-over Throughput Results.................................................... 55 Table 3-22: C1.5.1 – Number of A/C GND Results ............................................................................. 56 Table 3-23: C1.5.2 – Number of A/C TWR1 Results ........................................................................... 57 Table 3-24: C1.5.3 – Number of A/C TWR2 Results ........................................................................... 58 Table 3-25: E1.1.1 – Taxiing Delay Results ......................................................................................... 60 Table 3-26: E1.2.1 – Line-up Queue Delay Results.............................................................................. 61 Table 3-27: E1.3.1 – Departure Delay Results...................................................................................... 62 Table 3-28: E1.4.1 – Runway Crossing Delay Results ......................................................................... 63 Table 3-29: E1.5.1 – Pushback Delay Results ...................................................................................... 65 Table 3-30: E2.1.1 – Arrival Period Results ......................................................................................... 66 Table 3-31: E2.2.1 – Departure Period Results ..................................................................................... 67 Table 4-1: Scenarios Tested during Shadow-mode Trials .................................................................... 85 Table 4-2: High-level Description the Proposed Questionnaires for MXP SM Trials.......................... 86 Table 4-3: Answer Distribution for Safety Questionnaire..................................................................... 88 Table 4-4: Answer Distribution for Capacity Questionnaire in Visibility Condition 1 ........................ 89 Table 4-5: Answer Distribution for Capacity Questionnaire in Visibility Condition 2 ........................ 90 Table 4-6: Answer Distribution for Efficiency Questionnaire in Visibility Condition 1 ...................... 91 Table 4-7: Answer Distribution for Efficiency Questionnaire in Visibility Condition 2 ...................... 92 Table 4-8: Answer Distribution for Acceptance Questionnaire ............................................................ 94 Table 4-9: Answer Distribution for Acceptance Questionnaire ............................................................ 95