maldives - national bureau of...
TRANSCRIPT


MALDIVESPoPulation and Housing Census
statistiCal Release ii: MigRation
2014
National Bureau of StatisticsMinistry of Finance and Treasury
Male’, Maldives
4Migration: CENSUS 2014
National Bureau of Statistics
© National Bureau of Statistics, 2015
Maldives - Population and Housing Census 2014
All rights of this work are reserved. No part may be printed or published without prior written permission from
the publisher. Short excerpts from the publication may be reproduced for the purpose of research or review
provided due acknowledgment is made.
Published by: National Bureau of Statistics
Ministry of Finance and Treasury
Male’ 20379
Republic of Maldives
Tel: 334 9 200 / 33 9 473 / 334 9 474
Fax: 332 7 351
e-mail: [email protected]
www.statisticsmaldives.gov.mv
Cover and Layout design by: Aminath Mushfiqa Ibrahim
Cover Photo Credits: UNFPA MALDIVES
Printed by: National Bureau of Statistics
Male’, Republic of Maldives
5
National Bureau of Statistics
The Population and Housing Census of Maldives is the largest national statistical exercise and provide the
most comprehensive source of information on population and households. Maldives has been conducting
censuses since 1911 with the first modern census conducted in 1977. Censuses were conducted every five
years since between 1985 and 2000. The 2005 census was delayed to 2006 due to tsunami of 2004,
leaving a gap of 8 years between the last two censuses. The 2014 marks the 29th census conducted in
the Maldives.
Census provides a benchmark data for all demographic, economic and social statistics in the country to
the smallest geographic level. Such information is vital for planning and evidence based decision-making.
Census also provides a rich source of data for monitoring national and international development goals
and initiatives.
Data from various censuses serve as a comparable basis reflecting the achievements of past policies car-
ried out by the government for the benefit of the people. The results of the census will provide essential
data for decision makers, policy planners, international agencies and the business community in assessing
the progress of the last few decades and in planning the future spectrum of development.
I am greatly indebted to the general public for their support and cooperation to the census. I thank each
and every individual, who responded to the census and made possible this valuable data set. I hope that
the experienced data users, as well as students and the wider public, will find it useful.
My acknowledgement and appreciation goes to the hard work of each and every individual who were
involved and contributed to the census data collection management, processing and dissemination.
I am grateful to development partners for their generous financial support and the consultants for their
technical support.
Finally, the success of this census is attributed to the concerted effort and dedication of the management
and staff of the National Bureau of Statistics and I would like to take this opportunity to thank them whole-
heartedly.
Abdulla Jihad
MInister of Finance & Treasury
FOREWORD
6Migration: CENSUS 2014
National Bureau of Statistics
INTRODUCTION
The preliminary results of the population and housing census 2014 were released on 5 November 2014. This
included the population by sex at island level, based on the daily records used during census operation.
This publication presents the final results of the 2014 Population and Housing Census. It contains the informa-
tion on the population by age and sex and households by type, at atoll and island levels.
Data collected in the census include a wealth of information: population size, age, sex, citizenship, religion,
migration, education, economic activity, marital status, and housing. Information on the living arrangement of
children and elderly population was also collected. The detailed reports by various themes will be disseminat-
ed subsequently.
The 2014 census is making a substantial change in the population that is included in the census, thereby
moving closer to the international recommendations for census taking. According to the international recom-
mendations, only the population residing in the country should be included in the census. In our past censuses,
foreigners residing in the Maldives were not included in the census while we include Maldivians residing
abroad. The Maldivians residing abroad were also included in the 2014 census to enable comparison with
previous censuses.
Census 2014 data introduces the concept of ‘Resident Population’ consisting of Resident Maldivians and
Resident Foreigners, which will form the coverage of future censuses. Due to the numerous difficulties and
challenges posed in enumerating the foreign population, there is an under coverage of this population, when
compared with administrative records.
However, in order to allow comparisons with previous censuses the concept of Maldivian population is also
used. This includes Maldivians residing in Maldives as well as those residing abroad. It is our intention to ex-
clude the non-resident Maldivians from the future censuses. The coverage of Maldivians living abroad is not
complete, due to the many challenges posed in their enumeration.
The Maldives Population and Housing Census were carried out from 20 to 30 September 2014 and a total
of 3,588 personnel were involved in the census operation throughout the country. Census covered 188 ad-
ministrative islands, 109 resorts and 128 industrial and other islands of the country.
Data Processing of 2014 Census was carried using Intelligent Character Recognition (ICR) and Optical Mark
Recognition (OMR) method. Data consistency checking and editing has been done using scientific methods
available, with support from international experts in this field.

7
National Bureau of Statistics
ACKNOWLEDGEMENTS
This publication has been made possible by the dedicated support of everyone involved in the organi-
zation and conducting of the census, from government staff in various ministries and offices to volunteers
from public and private sector organizations. Through their dedication and hard work in their respective
roles as Officials, Atoll Coordinators, Atoll Technical Advisors, Supervisors, Enumerators, and Data pro-
cessing staff, this exercise was executed as planned.
We thank each and every Maldivian and foreigner, who responded to the census and provided their
valuable information to our census enumerators.
In accomplishing this task, the National Bureau of Statistics owes a debt of gratitude to all those who
contributed their time and effort in making this census a success.
We would like to express our gratitude to the United Nations Population Fund (UNFPA), United Nations
Children Fund (UNICEF) and World Bank for their generous Technical support. We would like to the inter-
national consultants who provided their technical support.
The National Bureau of Statistics acknowledges the support of the Government, for providing necessary
funding and support for the execution of this nationwide operation.
National Bureau of Statistics
20 October 2015

8Migration: CENSUS 2014
National Bureau of Statistics
TABLE OF CONTENTS
FOREWORD -------------------------------------------------------------------------------------------------------------------------- 5
INTRODUCTION --------------------------------------------------------------------------------------------------------------------- 6
ACKNOWLEDGEMENTS --------------------------------------------------------------------------------------------------------- 7
TABLE OF CONTENTS ------------------------------------------------------------------------------------------------------------- 8
GLOSSARY OF TERMS AND DEFINITIONS --------------------------------------------------------------------------------- 9
MIGRATION ------------------------------------------------------------------------------------------------------------------------- 10
INTRODUCTION TO MIGRATION ------------------------------------------------------------------------------------------ 10
DISTRIBUTION OF RESIDENT POPULATION --------------------------------------------------------------------- 11
DISTRIBUTION OF RESIDENT MALDIVIAN POPULATION -------------------------------------------------- 12
RESIDENT MALDIVIAN POPULATION BY PLACE OF BIRTH ------------------------------------------------13
RESIDENT MALDIVIAN POPULATION BY PLACE OF REGISTRATION ---------------------------------- 13
POPULATION BY PLACE OF USUAL RESIDENCE AND PLACE OF REGISTRATION ----------------- 15
RESIDENT MALDIVIAN POPULATION IN MALE’ BY ASPECTS USED TO VIEW INTERNAL MIGRATION 17
POPULATION BY PLACE OF USUAL RESIDENCE AND PLACE OF REGISTRATION ----------------- 15
USUAL RESIDENT MALDIVIAN POPULATION WITH A CHANGE ---------------------------------------- 18
DISTRIBUTION OF RESIDENT FOREIGN POPULATION ------------------------------------------------------ 24
LIFETIME MIGRATION ------------------------------------------------------------------------------------------------- 27
NON-RESIDENT MALDIVIAN POPULATION ------------------------------------------------------------------- 30
MIGRATION TABLES -------------------------------------------------------------------------------------------------------------- 32
9
National Bureau of Statistics
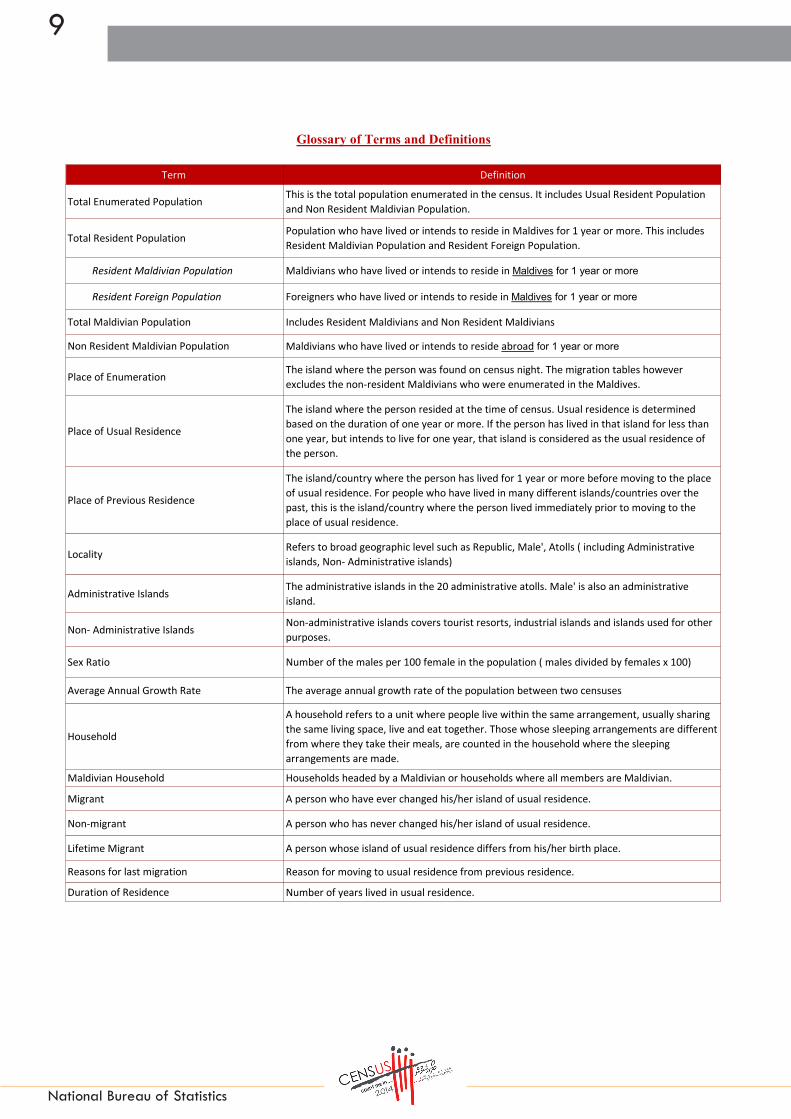
Term Definition
Total Enumerated Population This is the total population enumerated in the census. It includes Usual Resident Population and Non Resident Maldivian Population.
Total Resident Population Population who have lived or intends to reside in Maldives for 1 year or more. This includes Resident Maldivian Population and Resident Foreign Population.
Resident Maldivian Population Maldivians who have lived or intends to reside in Maldives for 1 year or more
Resident Foreign Population Foreigners who have lived or intends to reside in Maldives for 1 year or more
Total Maldivian Population Includes Resident Maldivians and Non Resident Maldivians
Non Resident Maldivian Population Maldivians who have lived or intends to reside abroad for 1 year or more
Place of Enumeration The island where the person was found on census night. The migration tables however excludes the non-resident Maldivians who were enumerated in the Maldives.
Place of Usual Residence
The island where the person resided at the time of census. Usual residence is determined based on the duration of one year or more. If the person has lived in that island for less than one year, but intends to live for one year, that island is considered as the usual residence of the person.
Place of Previous Residence
The island/country where the person has lived for 1 year or more before moving to the place of usual residence. For people who have lived in many different islands/countries over the past, this is the island/country where the person lived immediately prior to moving to the place of usual residence.
Locality Refers to broad geographic level such as Republic, Male', Atolls ( including Administrative islands, Non- Administrative islands)
Administrative Islands The administrative islands in the 20 administrative atolls. Male' is also an administrative island.
Non- Administrative Islands Non-administrative islands covers tourist resorts, industrial islands and islands used for other purposes.
Sex Ratio Number of the males per 100 female in the population ( males divided by females x 100)
Average Annual Growth Rate The average annual growth rate of the population between two censuses
Household
A household refers to a unit where people live within the same arrangement, usually sharing the same living space, live and eat together. Those whose sleeping arrangements are different from where they take their meals, are counted in the household where the sleeping arrangements are made.
Maldivian Household Households headed by a Maldivian or households where all members are Maldivian.
Migrant A person who have ever changed his/her island of usual residence.
Non-migrant A person who has never changed his/her island of usual residence.
Lifetime Migrant A person whose island of usual residence differs from his/her birth place.
Reasons for last migration Reason for moving to usual residence from previous residence.
Duration of Residence Number of years lived in usual residence.
Glossary of Terms and Definitions
10Migration: CENSUS 2014
National Bureau of Statistics
MIGRATION INTRODUCTION
The process of distribution and redistribution of population occurs through natural growth and migration. The
redistribution through migration is shaped by a variety of demographic, geographic and socio-economic fac-
tors. These include the distribution and utilization of natural resources and infrastructural development, which
results from local factors as well as policies, and programs of government agencies.
This release presents the patterns of international migration to and from the Maldives as well as internal mi-
gration within the Atolls and islands of the country. Census 2014 broadly measured internal migration through
place of birth, place of registration, place of usual residence, reasons for migration and place of previous
residence. International in-migration of foreigners to the Maldives cover the place of birth, duration of stay in
the Maldives and reasons for migration.
As for international out-migration of Maldivians, the place of birth, place of registration, country of usual
residence was covered in the census. As this segment of the population do not form a part of the resident
population, this data is presented briefly in a separate section at the end.
During the census, persons were enumerated in the household where they were located during census night.
Usual residence however, is the place where the person usually resides. Usual residence is determined based
on the duration of one year or more. If the person has lived in that island for less than one year, but intends
to live for one year, that place is considered as usual residence of the person. Hence the island of enumera-
tion and island of usual residence will be different for persons who were temporarily away from their island
of usual residence during the census night.
The measure of the migratory movement of the population is based on the comparison of data on the place
of previous residence with the place of usual residence at the time of Census. A person who have ever
changed their island of usual residence are classified as a migrant according to this definition.

11
National Bureau of Statistics
This release will also look into lifetime migrants. For the purpose of this analysis, a life-time migrant is defined
as one who was born outside their island of usual residence. However, one needs to be aware of the limita-
tions in interpreting lifetime migrants using place of birth.
This release will focus on the analysis of the resident Maldivian Population and Resident Foreign population
separately. This is the population who have lived or intends to reside in Maldives for 1 year or more. The
definition used in this chapter is given in the glossary.
Distribution of Resident Population
The resident population is distributed within the country among administrative and non- administrative islands.
The resident population of Maldives in Census 2014 is 402,071. Out of this, the resident Maldivian popu-
lation accounts to 338,434 and resident foreigners account for 63,637. Over a third of the population (38
percent) is enumerated in the capital Male’, 53% in 187 administrative islands, 7 % in 109 resort islands and
2% in industrial and other non-administrative islands.
Population size of the 187 inhabited islands vary substantially ranging from 106 residents in V.Rakeedhoo to
11,129 in S.Hithadhoo. Highest number of islands (35 % of islands) have a resident population between the
ranges of 500 to 999. These 65 islands have 22 percent of the resident population (figure 1). This is followed
by the size categories of islands with less than 500 population and 1,000 to 1,999, each with 51 islands
(27 % of islands). However the percentage share of population is highest (33%) in islands with 1,000 to 1,999
size category compared to 8% of population in islands below 500 category. There are 20 islands with a
population above 2,000 inhabitants in the administrative islands of the 20 Atolls. These islands have 36 per-
cent of the resident population. It is important to note that apart from the capital Male’ with a population of
153,904, only 4 administrative islands have a population size greater than 5,000. These 4 islands are GDh.
Thinadhoo, HDh. Kulhudhuffushi, Gn.Fuvahmulah and S.Hithadhoo.
12Migration: CENSUS 2014
National Bureau of Statistics
Distribution of Resident Maldivian Population
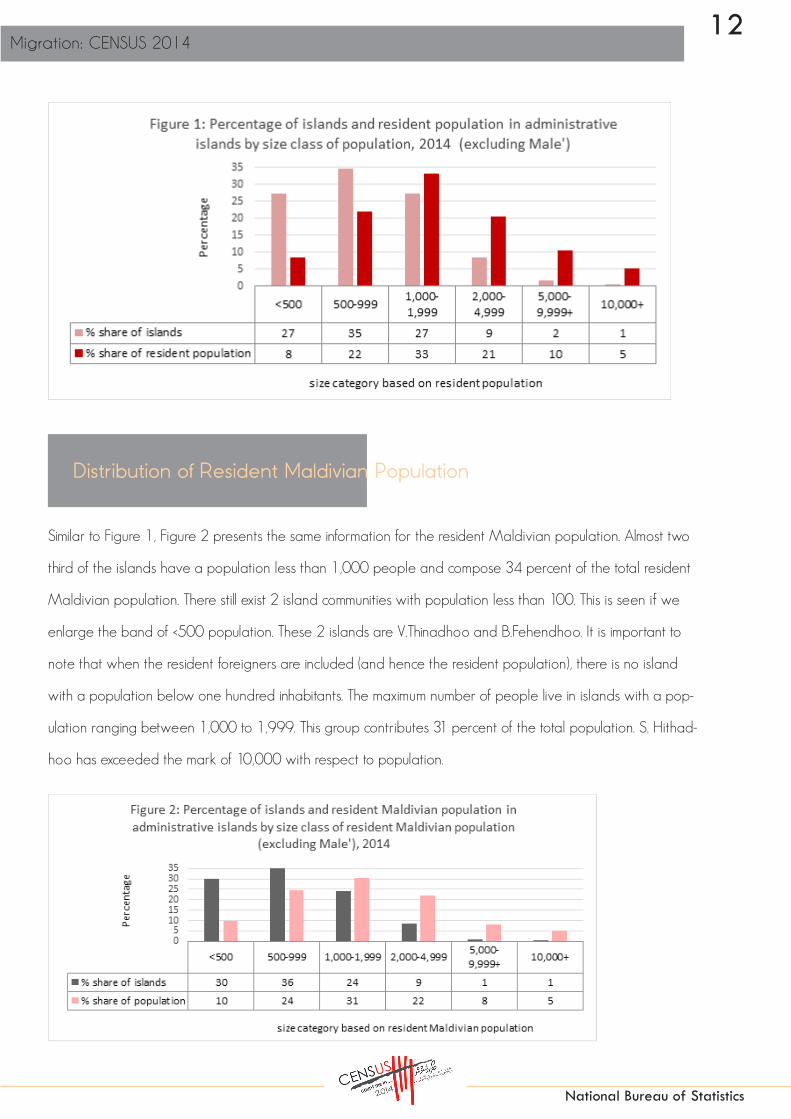
Similar to Figure 1, Figure 2 presents the same information for the resident Maldivian population. Almost two
third of the islands have a population less than 1,000 people and compose 34 percent of the total resident
Maldivian population. There still exist 2 island communities with population less than 100. This is seen if we
enlarge the band of <500 population. These 2 islands are V.Thinadhoo and B.Fehendhoo. It is important to
note that when the resident foreigners are included (and hence the resident population), there is no island
with a population below one hundred inhabitants. The maximum number of people live in islands with a pop-
ulation ranging between 1,000 to 1,999. This group contributes 31 percent of the total population. S. Hithad-
hoo has exceeded the mark of 10,000 with respect to population.

13
National Bureau of Statistics
Resident Maldivian Population by Place of Birth
Of the resident Maldivian population, 99 percent of the Maldivians are born in Maldives while 1 percent of
the population (3,844 persons) are born abroad.
Figure 3 shows the distribution of the resident Maldivian population by place of birth. Out of the total Mal-
divian population, 79,641 persons (almost one fourth or 24% of population) were born in Male’. This is likely
to be due to better health facilities in the capital, as it is a common practice for mothers to come to Male’ for
delivery. Eight percent of the population was born in both Addu (S) and South Thilandhumathi (HDh).
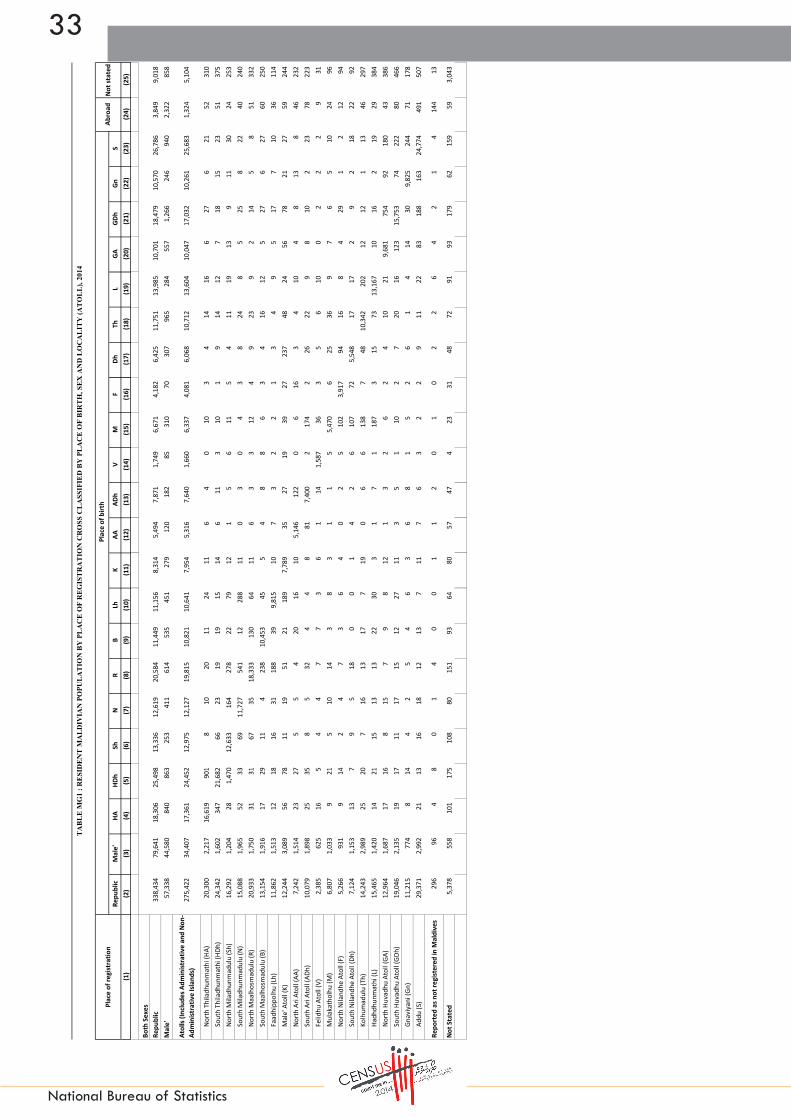
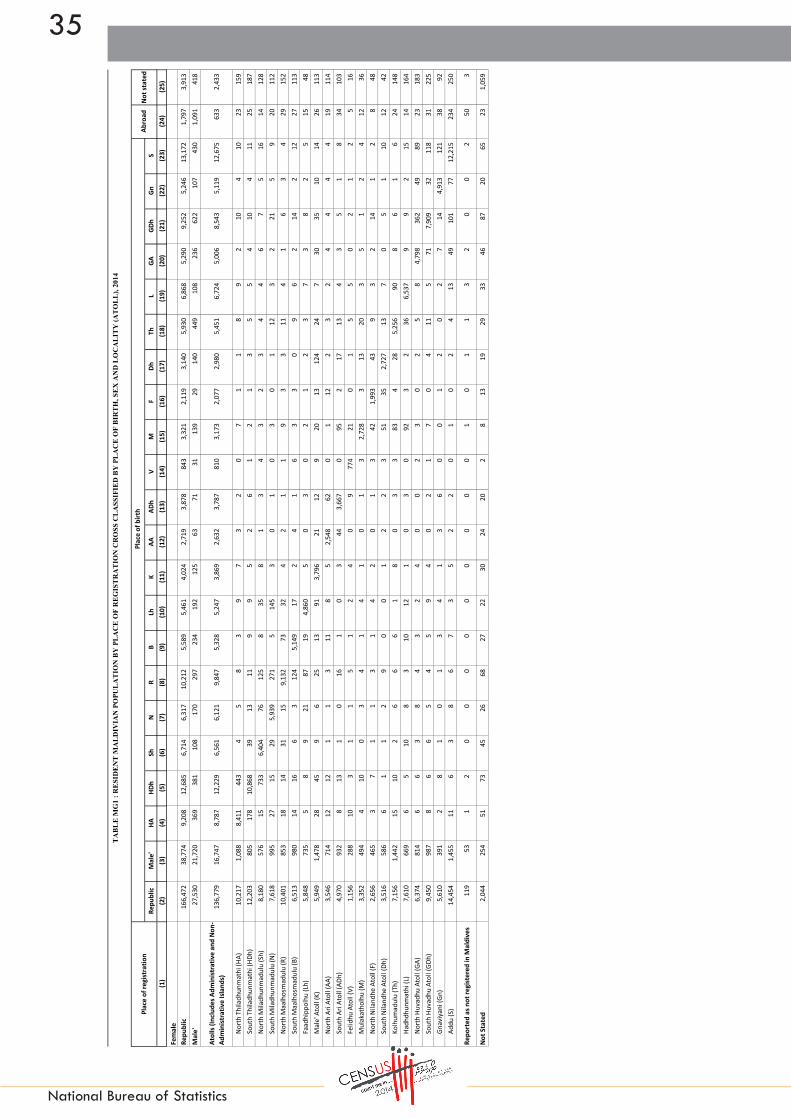
Resident Maldivian Population by Place of Registration
As per the legislation in Maldives, Maldivians have to be registered in the country. The place of registration
may or may not be different from place of birth and place of usual residence. As expected, (Annex Table
MG1), population size according to place of registration as well as place of birth is highest in highly populat-
ed Atolls. Out of the total Maldivian population 57,338 persons (17 percent) is registered in the capital city
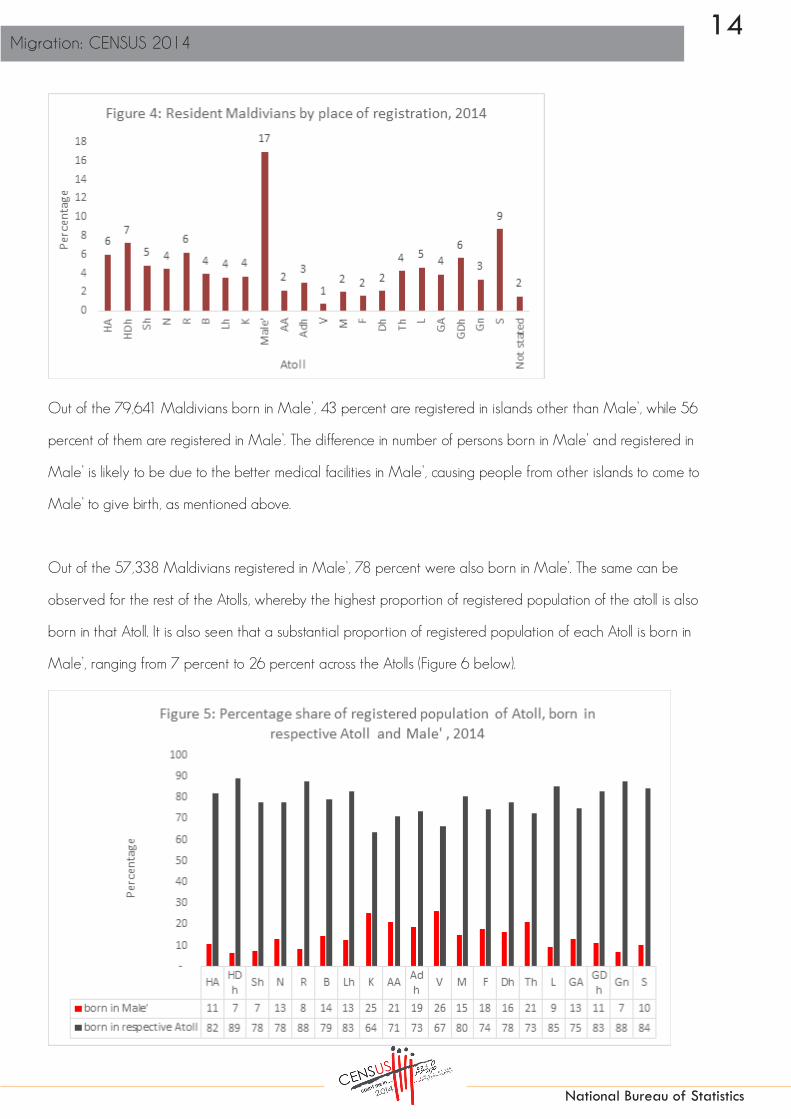
Male’ (Figure 4). Similar to the percentage distribution by birth, highest proportion of the registered popu-
lation in the Atolls are also found in Addu (S) and South Thilandhumathi (HDh), at 9 percent and 7 percent
respectively.
14Migration: CENSUS 2014
National Bureau of Statistics
Out of the 79,641 Maldivians born in Male’, 43 percent are registered in islands other than Male’, while 56
percent of them are registered in Male’. The difference in number of persons born in Male’ and registered in
Male’ is likely to be due to the better medical facilities in Male’, causing people from other islands to come to
Male’ to give birth, as mentioned above.
Out of the 57,338 Maldivians registered in Male’, 78 percent were also born in Male’. The same can be
observed for the rest of the Atolls, whereby the highest proportion of registered population of the atoll is also
born in that Atoll. It is also seen that a substantial proportion of registered population of each Atoll is born in
Male’, ranging from 7 percent to 26 percent across the Atolls (Figure 6 below).
15
National Bureau of Statistics
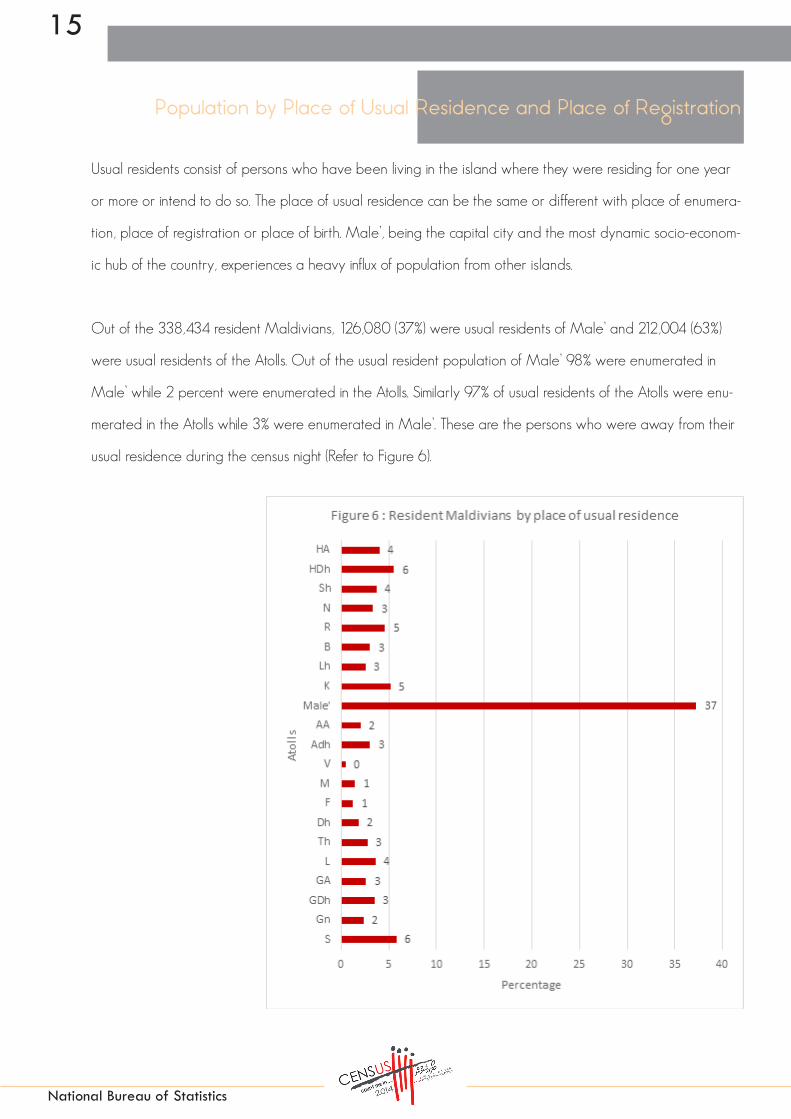
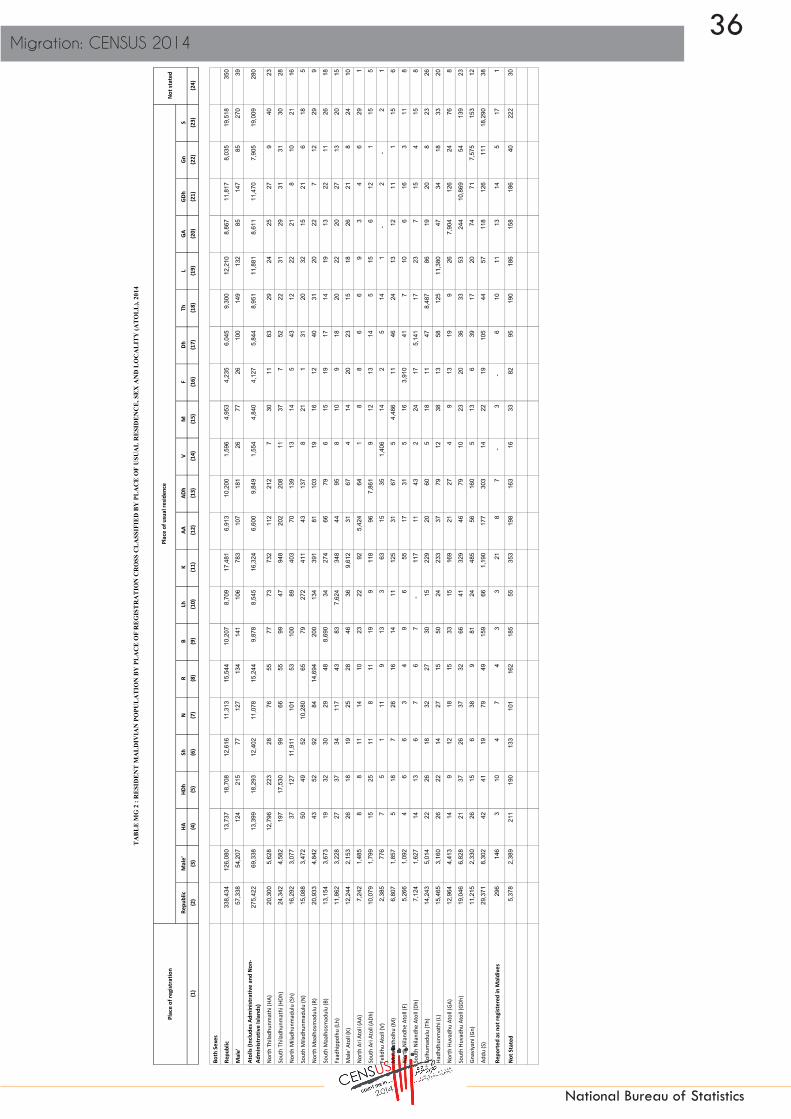
Population by Place of Usual Residence and Place of Registration
Usual residents consist of persons who have been living in the island where they were residing for one year
or more or intend to do so. The place of usual residence can be the same or different with place of enumera-
tion, place of registration or place of birth. Male’, being the capital city and the most dynamic socio-econom-
ic hub of the country, experiences a heavy influx of population from other islands.
Out of the 338,434 resident Maldivians, 126,080 (37%) were usual residents of Male’ and 212,004 (63%)
were usual residents of the Atolls. Out of the usual resident population of Male’ 98% were enumerated in
Male’ while 2 percent were enumerated in the Atolls. Similarly 97% of usual residents of the Atolls were enu-
merated in the Atolls while 3% were enumerated in Male’. These are the persons who were away from their
usual residence during the census night (Refer to Figure 6).

16Migration: CENSUS 2014
National Bureau of Statistics
Out of the 126,080 usual residents of Male’, 43 percent are registered in Male’ (figure 7), while the majority
(55%) are registered in other islands.
Among the population residing in Male’ who are registered in other islands, highest number of people are
those registered in Addu (S) at 7 percent. This is followed by those registered in South Huvadhu Atoll (GDh) at
5% and North Thiladhunmathi (HA), South Thiladhunmathi (HDh), North Huvadhu Atoll (GA), Kolhumadulu (Th)
and North Maalhosmadulu (R) each at 4 percent.
Majority of the usual residents of the Atolls (95 percent) are registered in the islands in the respective Atolls.
Apart from Male’, the percentage share of usual residents of the Atoll registered in that particular Atoll, var-
ies from 55 percent in Male’ Atoll (K) to 95% in North Maalhosmadulu (R) Atoll. (Figure 8 below)

17
National Bureau of Statistics
While Male’ hosts 38 percent of the total population, the population residing in Resorts and Industrial islands
has also increased. Majority of the residents living in Resorts and industrial islands are registered in Addu (S),
followed by those registered in South Thiladhunmathi (HDh). Only 3.9 percent of the usual resident are regis-
tered in Male’.
Figure 9 shows the population of the capital Male’ by different variables used to study internal migration. Cen-
sus enumerated the population by place where they were present on Census night. As such a total of 133,412
Maldivians were enumerated in Male’. After excluding the 4,031 Maldivians that usually reside abroad, a total
of 129,381 Maldivians were amongst those enumerated in Male’.
A total of 126,080 Maldivians stated their usual place of residence as Male’ at the time of census. As per
the definition of usual residents, these are people who have lived or intends to live in Male’ for a period of
one year or more. Those Maldivians who reported Male’ as their place of birth accounts for 79,641 persons,
while 57,338 reported Male’ as their place of registration. (Excludes the non-resident Maldivians). It can be
observed from figure 9 that more than double the number of those who are registered in Male’ usually reside
there.
When the foreigners residing in Male’ are included, the enumerated population in the capital increases to
153,904.
Resident Maldivian Population in Male’ by Aspects Used to View Internal Migration

18Migration: CENSUS 2014
National Bureau of Statistics
Table 1 shows the population with a different usual and previous residence (considered as migrants) as well
as population without a change in their usual residence (considered as non-migrants). The table shows that
the majority of the population has never changed their place of usual residence. Out of the 338,434 resident
Maldivians 44 percent of the population (147,927) had shifted their residence.
Usual Resident Maldivian Population with a Change in Residence
In contrast to the pattern that has been characteristic in Republic and Atolls, Male’ population consists of high
percent of migrants than non-migrants in comparison to their place of previous residence. This is expected as
Male’ being the hub of development, attracts residents from across the country. Non- administrative islands
comprise mainly of resorts and industrial islands with migrants from administrative islands living there due to
employment.
19
National Bureau of Statistics
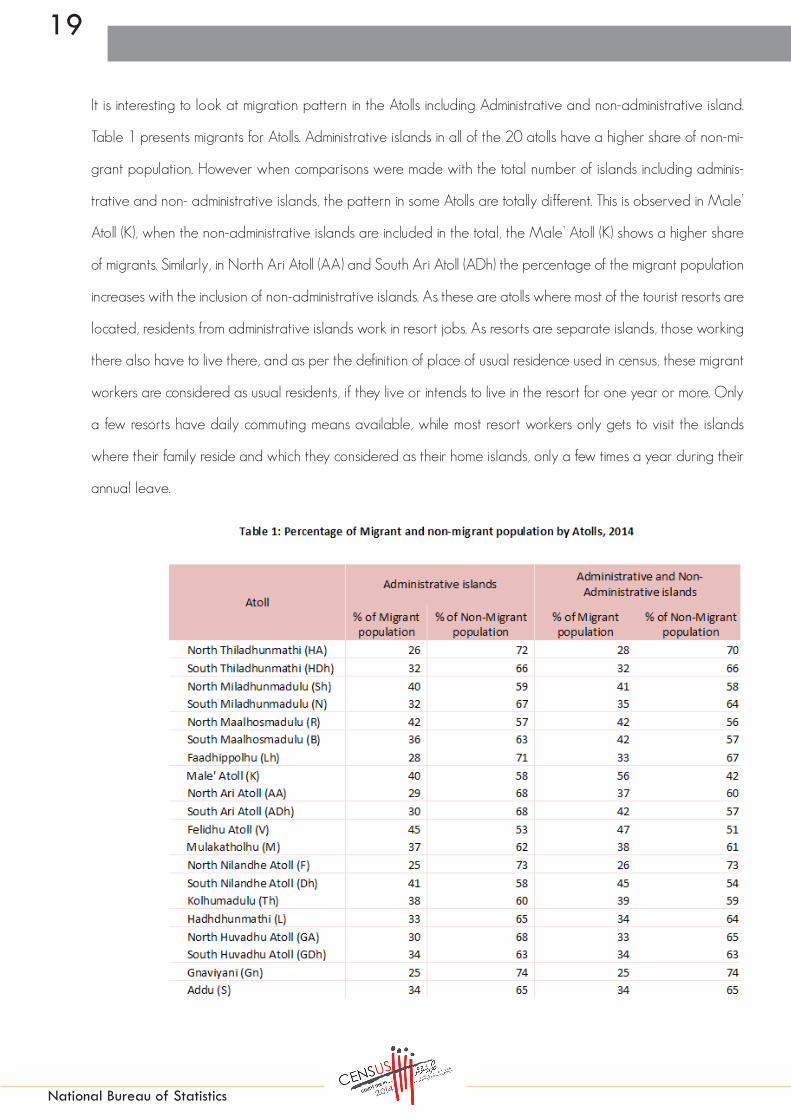
It is interesting to look at migration pattern in the Atolls including Administrative and non-administrative island.
Table 1 presents migrants for Atolls. Administrative islands in all of the 20 atolls have a higher share of non-mi-
grant population. However when comparisons were made with the total number of islands including adminis-
trative and non- administrative islands, the pattern in some Atolls are totally different. This is observed in Male’
Atoll (K), when the non-administrative islands are included in the total, the Male’ Atoll (K) shows a higher share
of migrants. Similarly, in North Ari Atoll (AA) and South Ari Atoll (ADh) the percentage of the migrant population
increases with the inclusion of non-administrative islands. As these are atolls where most of the tourist resorts are
located, residents from administrative islands work in resort jobs. As resorts are separate islands, those working
there also have to live there, and as per the definition of place of usual residence used in census, these migrant
workers are considered as usual residents, if they live or intends to live in the resort for one year or more. Only
a few resorts have daily commuting means available, while most resort workers only gets to visit the islands
where their family reside and which they considered as their home islands, only a few times a year during their
annual leave.

20Migration: CENSUS 2014
National Bureau of Statistics
Migration varies on the basis of sex, age and other social and economic characteristics. Figure 11 examines
sex differentials in the migratory process of the resident Maldivian population. As seen by Figure 11, migration
in the country is dominated by males. 54 percent of the migratory population is male while 46 percent of the
women had a change in residency. The same trend is observed across the Atolls. However in Male’, female
migrants are more than male migrants.
Similar to Table 1, Table 2 also looks at the migrant population by sex for administrative islands and the atoll
total including non-administrative islands. Among the administrative atolls, Male’ Atoll (K) has the highest num-
ber of male migrants compared to the rest of the atolls. This percentage of male increases with the inclusion of
non-administrative islands.
21
National Bureau of Statistics
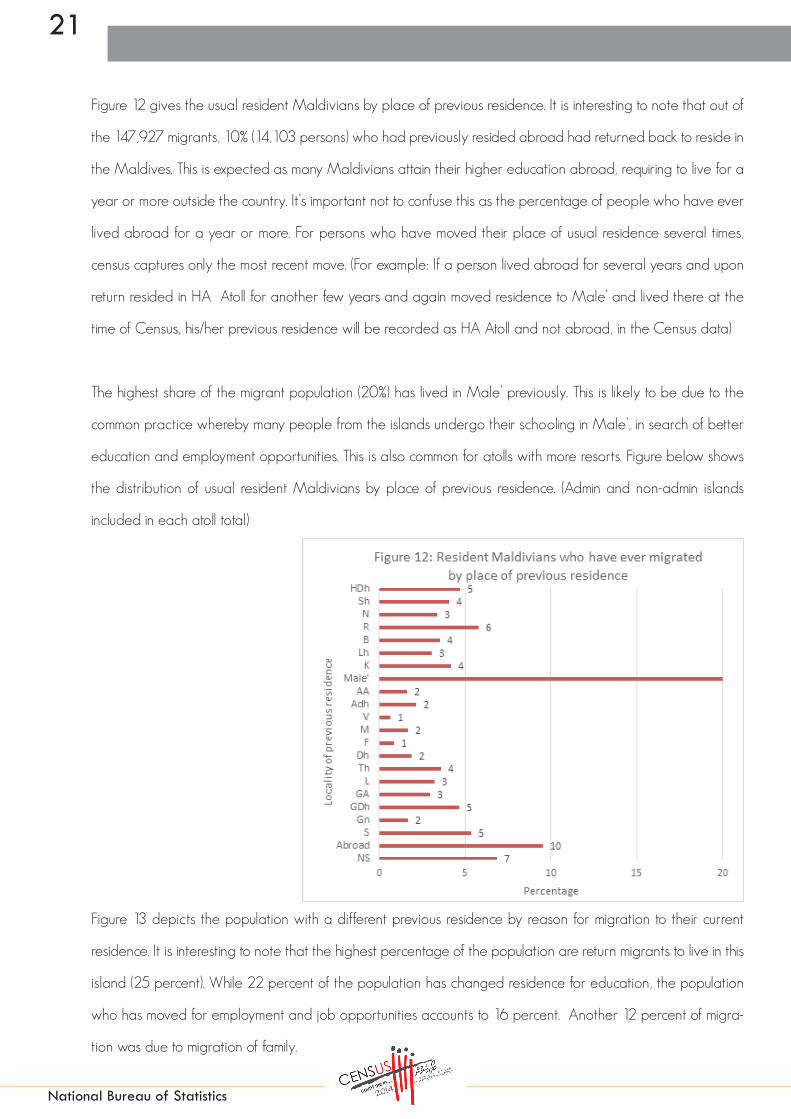
Figure 12 gives the usual resident Maldivians by place of previous residence. It is interesting to note that out of
the 147,927 migrants, 10% (14,103 persons) who had previously resided abroad had returned back to reside in
the Maldives. This is expected as many Maldivians attain their higher education abroad, requiring to live for a
year or more outside the country. It’s important not to confuse this as the percentage of people who have ever
lived abroad for a year or more. For persons who have moved their place of usual residence several times,
census captures only the most recent move. (For example: If a person lived abroad for several years and upon
return resided in HA Atoll for another few years and again moved residence to Male’ and lived there at the
time of Census, his/her previous residence will be recorded as HA Atoll and not abroad, in the Census data)
The highest share of the migrant population (20%) has lived in Male’ previously. This is likely to be due to the
common practice whereby many people from the islands undergo their schooling in Male’, in search of better
education and employment opportunities. This is also common for atolls with more resorts. Figure below shows
the distribution of usual resident Maldivians by place of previous residence. (Admin and non-admin islands
included in each atoll total)
Figure 13 depicts the population with a different previous residence by reason for migration to their current
residence. It is interesting to note that the highest percentage of the population are return migrants to live in this
island (25 percent). While 22 percent of the population has changed residence for education, the population
who has moved for employment and job opportunities accounts to 16 percent. Another 12 percent of migra-
tion was due to migration of family.

22Migration: CENSUS 2014
National Bureau of Statistics
While this represent the picture for the Republic, the reason for migration differs at different localities. Figure 14
summarizes this by the four main reasons for which the resident Maldivian population has migrated. For Male’,
education is the main reason why the population has moved to current residence. This is followed by the popu-
lation returning to live in their usual residence. In the atolls (including Administrative and Non- administrative), the
change in residence is characterized by the population returning to live in their island. The second highest flow
of movement of the population is for employment opportunities, while in administrative islands a proportionate
population has changed their residence due to marriage and to live with their family due to family migration. In
non- administrative islands, migration for employment is the main reason.

23
National Bureau of Statistics
It is important to look at the distribution of migrant population by reason for male and female. As shown in
figure 15, male migratory movement is mostly for employment. Males returning to live in their residence is the
second highest reason.
In contrast, the migratory pattern is quite different among the female population. Many of them have report-
ed to have been return migrants to their place of usual residence. This is followed by migration for education.
Several women have migrated due to family migration and as a result of marriage. Females who migrated as
parent/ guardian is more than the male migration for this reason. Migration for employment is a lesser priority
for the female population.
The reason for migration differs among different age groups. Among the younger cohort, majority of the
population less than 10 years have migrated as a result of family migration to live in this island. Migration for
education is highest among children and young adults. Migration for employment is highest at the age of 25-
29 years and gradually decline over the years. At the same time, the pattern of return migrant is seen from 15
years and increases as they age.

24Migration: CENSUS 2014
National Bureau of Statistics
Census 2014 enumerated 63,637 foreigners as residing in Maldives. The foreign population accounts for 16
percent of the resident population and 88 percent of the foreign population comprises males. The foreign pop-
ulation is distributed across the country, majority of them living in Male’ (40 percent) and in non-administrative
islands (36 percent). As shown in Figure 17, the highest percentage of foreign population was enumerated in
Male’ Atoll (K) followed by South Maalhosmadulu (B) and South Ari Atoll (ADh).
Distribution of Resident Foreign Population

25
National Bureau of Statistics
The foreign population consists of many different nationalities with Bangladeshis succeeding with 58 percent
and Indians contributing to 21 percent. Figure 18 shows the foreign population residing in Maldives by their
place of birth. In all administrative divisions, the Bangladeshis are highest. Indian born population is more in
Male’ while foreign births of other nationalities in second highest in non- administrative islands. Sri Lankans
mostly reside in Male’ and Non- administrative islands. Around 569 foreigners were reported as being born
in Maldives.

26Migration: CENSUS 2014
National Bureau of Statistics
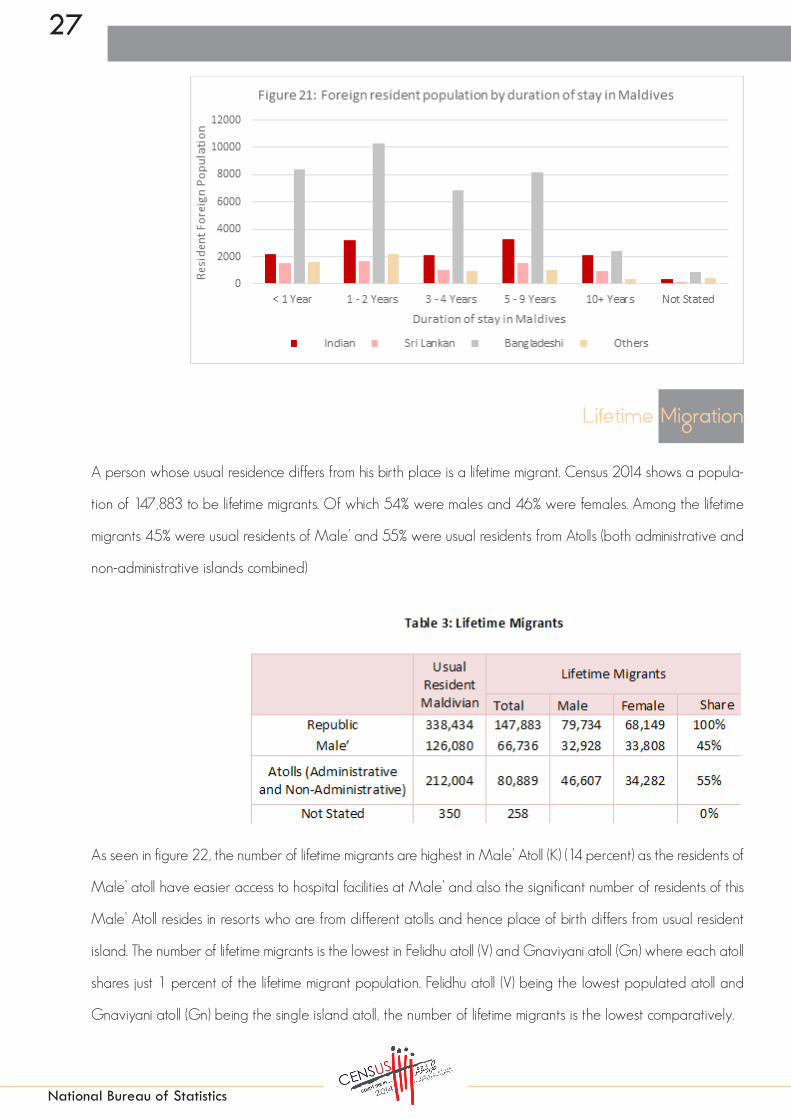
Census 2014 also captured the duration of stay in Maldives for the foreigners. Most of the foreign population
has lived in the country for 1 to 2 years. The duration tends to get more as foreigners live in the country for
between 5 to 9 years. The population living for more than 10 years gets reduced, showing signs of return mi-
gration to home countries. Only 9 percent of the foreign population lives in Maldives for more than 10 years.
Figure 21 presents the duration of stay in Maldives by different nationalities. As Bangladeshi’s are majority in
number in the country, their duration of stay in Maldives is higher than other nationalities. Majority of the Indi-
ans stay in the country for 5-9 years while Sri Lankans tend to stay in the country for less than 3 years. Foreign
populations of other nationalities have a similar pattern as Sri Lankans and majority of them stay for a duration
of 1-2 years.
27
National Bureau of Statistics
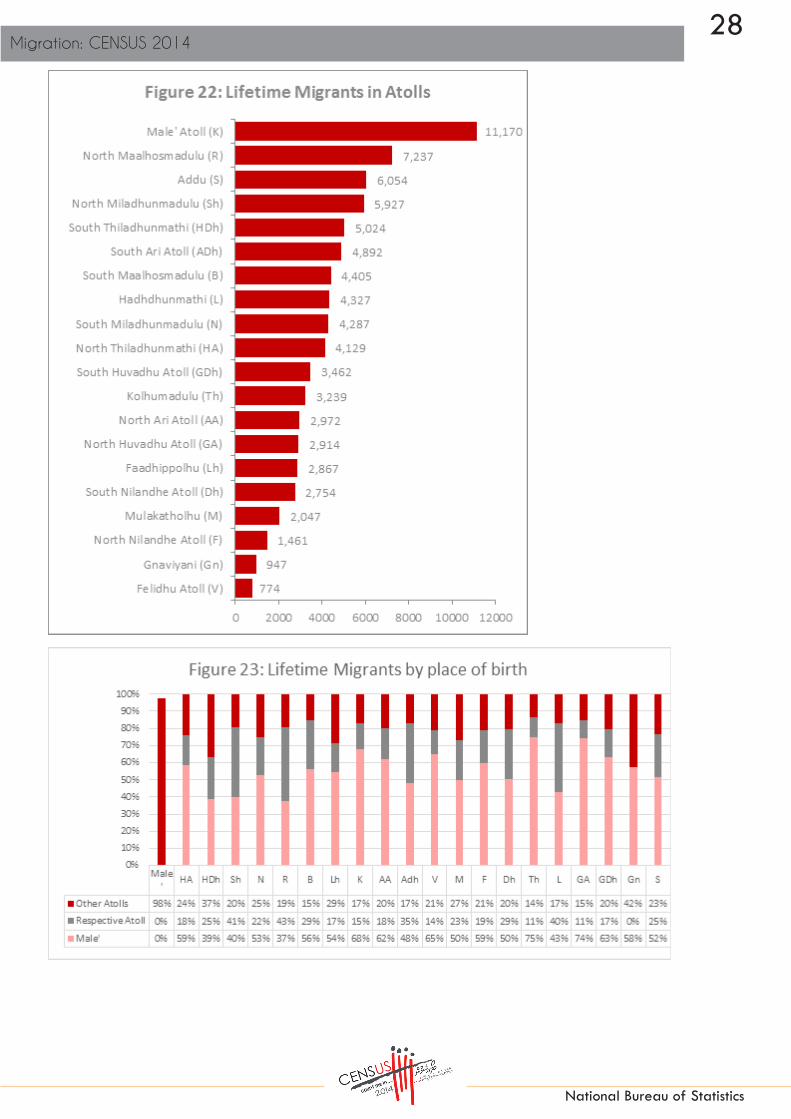
Lifetime Migration
A person whose usual residence differs from his birth place is a lifetime migrant. Census 2014 shows a popula-
tion of 147,883 to be lifetime migrants. Of which 54% were males and 46% were females. Among the lifetime
migrants 45% were usual residents of Male’ and 55% were usual residents from Atolls (both administrative and
non-administrative islands combined)
As seen in figure 22, the number of lifetime migrants are highest in Male’ Atoll (K) (14 percent) as the residents of
Male’ atoll have easier access to hospital facilities at Male’ and also the significant number of residents of this
Male’ Atoll resides in resorts who are from different atolls and hence place of birth differs from usual resident
island. The number of lifetime migrants is the lowest in Felidhu atoll (V) and Gnaviyani atoll (Gn) where each atoll
shares just 1 percent of the lifetime migrant population. Felidhu atoll (V) being the lowest populated atoll and
Gnaviyani atoll (Gn) being the single island atoll, the number of lifetime migrants is the lowest comparatively.
28Migration: CENSUS 2014
National Bureau of Statistics
29
National Bureau of Statistics
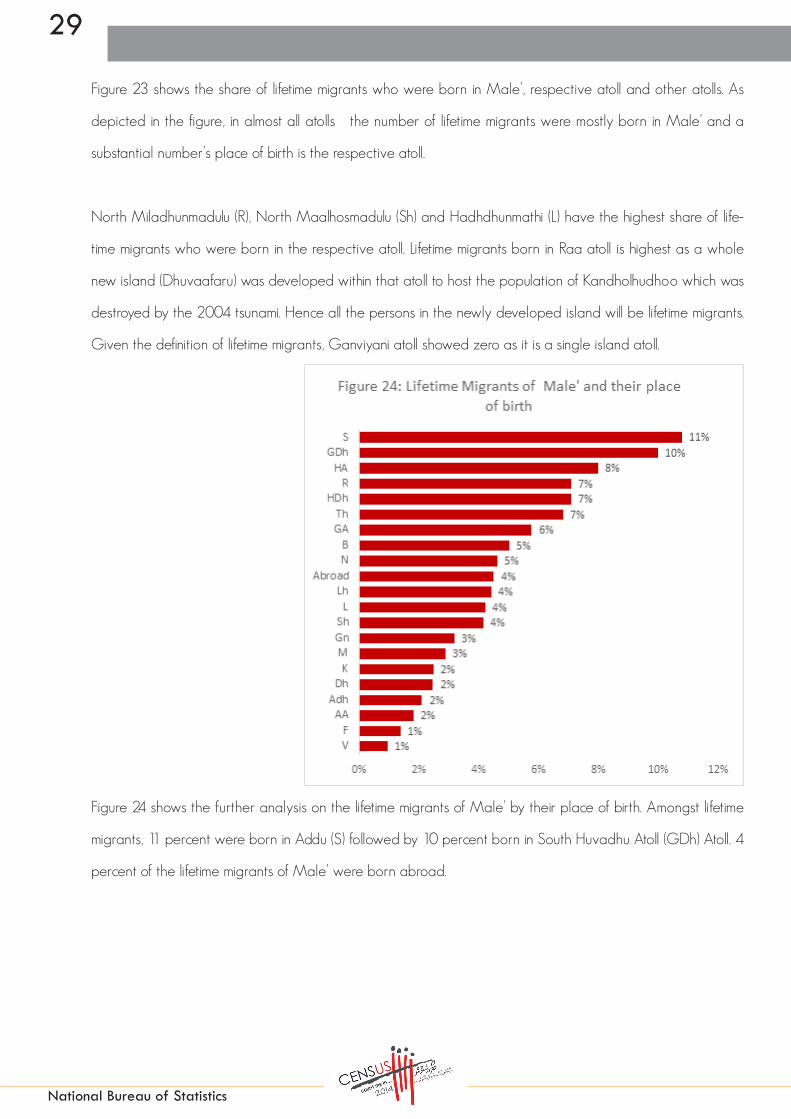
Figure 23 shows the share of lifetime migrants who were born in Male’, respective atoll and other atolls. As
depicted in the figure, in almost all atolls the number of lifetime migrants were mostly born in Male’ and a
substantial number’s place of birth is the respective atoll.
North Miladhunmadulu (R), North Maalhosmadulu (Sh) and Hadhdhunmathi (L) have the highest share of life-
time migrants who were born in the respective atoll. Lifetime migrants born in Raa atoll is highest as a whole
new island (Dhuvaafaru) was developed within that atoll to host the population of Kandholhudhoo which was
destroyed by the 2004 tsunami. Hence all the persons in the newly developed island will be lifetime migrants.
Given the definition of lifetime migrants, Ganviyani atoll showed zero as it is a single island atoll.
Figure 24 shows the further analysis on the lifetime migrants of Male’ by their place of birth. Amongst lifetime
migrants, 11 percent were born in Addu (S) followed by 10 percent born in South Huvadhu Atoll (GDh) Atoll. 4
percent of the lifetime migrants of Male’ were born abroad.
30Migration: CENSUS 2014
National Bureau of Statistics
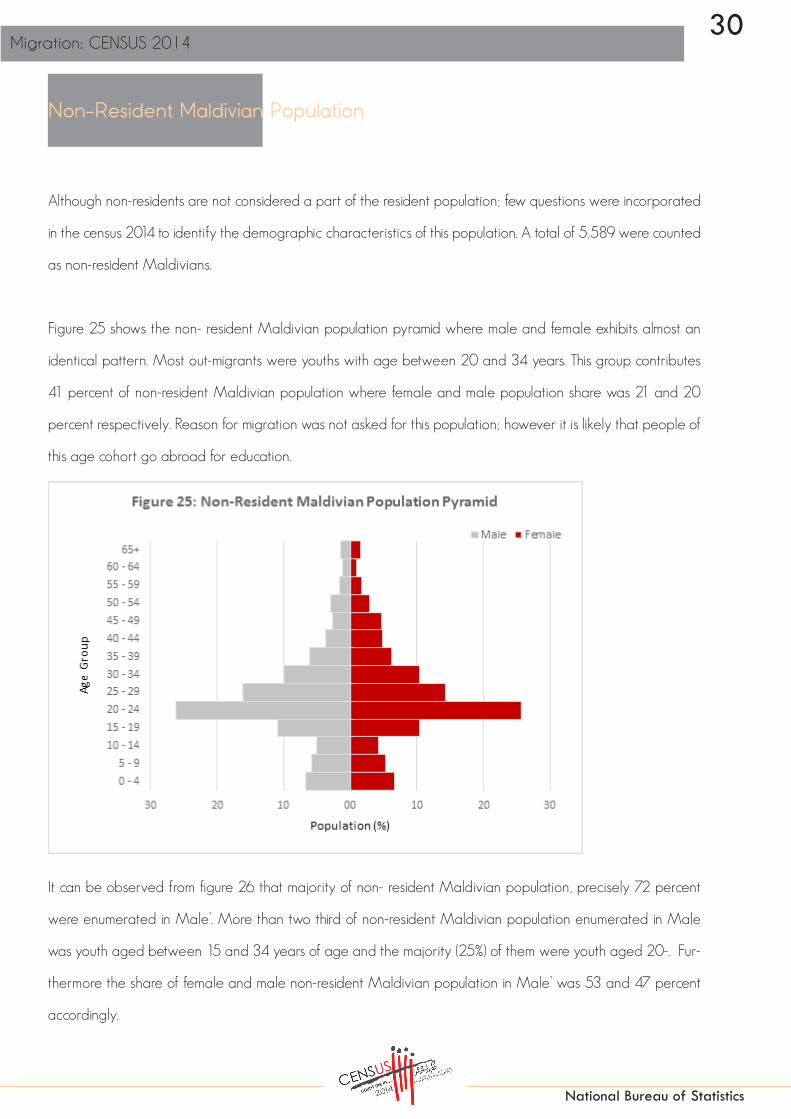
Although non-residents are not considered a part of the resident population; few questions were incorporated
in the census 2014 to identify the demographic characteristics of this population. A total of 5,589 were counted
as non-resident Maldivians.
Figure 25 shows the non- resident Maldivian population pyramid where male and female exhibits almost an
identical pattern. Most out-migrants were youths with age between 20 and 34 years. This group contributes
41 percent of non-resident Maldivian population where female and male population share was 21 and 20
percent respectively. Reason for migration was not asked for this population; however it is likely that people of
this age cohort go abroad for education.
Non-Resident Maldivian Population
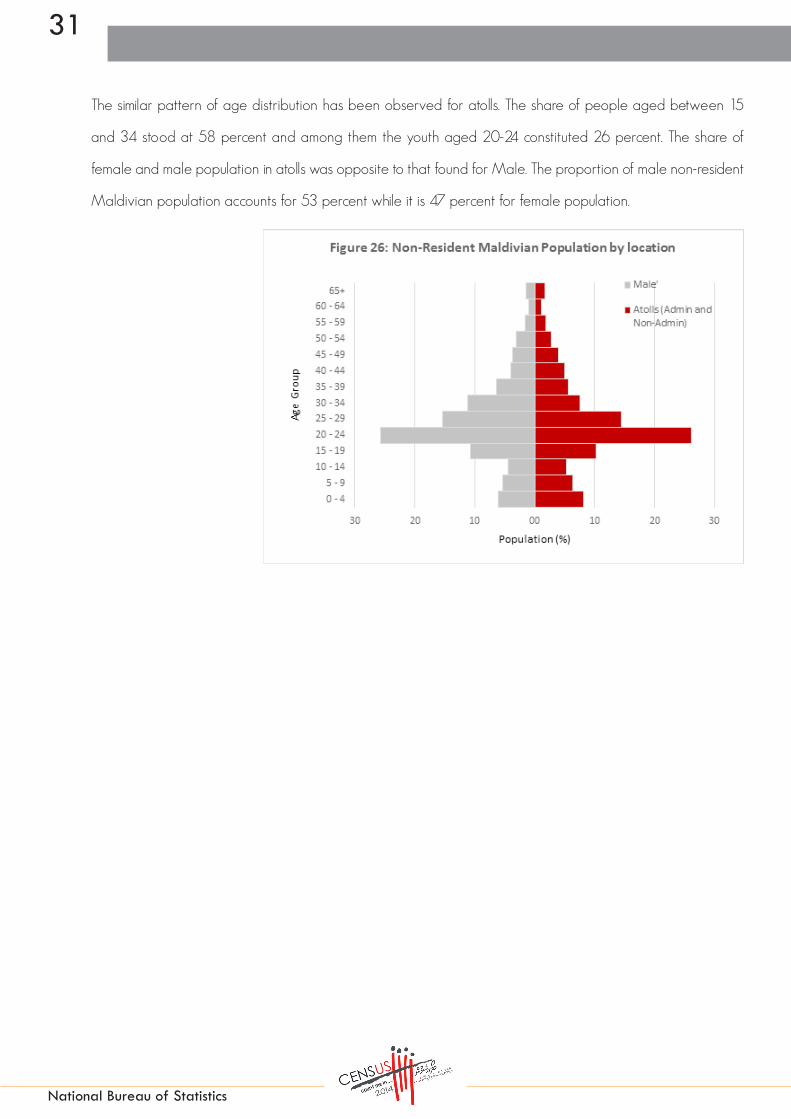
It can be observed from figure 26 that majority of non- resident Maldivian population, precisely 72 percent
were enumerated in Male’. More than two third of non-resident Maldivian population enumerated in Male
was youth aged between 15 and 34 years of age and the majority (25%) of them were youth aged 20-. Fur-
thermore the share of female and male non-resident Maldivian population in Male’ was 53 and 47 percent
accordingly.
31
National Bureau of Statistics
The similar pattern of age distribution has been observed for atolls. The share of people aged between 15
and 34 stood at 58 percent and among them the youth aged 20-24 constituted 26 percent. The share of
female and male population in atolls was opposite to that found for Male. The proportion of male non-resident
Maldivian population accounts for 53 percent while it is 47 percent for female population.

32Migration: CENSUS 2014
National Bureau of Statistics
MIGRATIONTables
33
National Bureau of Statistics
Repu
blic
Mal
e'HA
HDh
ShN
RB
LhK
AAAD
hV
MF
DhTh
LGA
GDh
GnS
(1)
(2)
(3)
(4)
(5)
(6)
(7)
(8)
(9)
(10)
(11)
(12)
(13)
(14)
(15)
(16)
(17)
(18)
(19)
(20)
(21)
(22)
(23)
(24)
(25)
Both
Sex
esRe
publ
ic33
8,43
479
,641
18,3
0625
,498
13,3
3612
,619
20,5
8411
,449
11,1
568,
314
5,49
47,
871
1,74
96,
671
4,18
26,
425
11,7
5113
,985
10,7
0118
,479
10,5
7026
,786
3,84
99,
018
Mal
e'
57,3
3844
,580
840
863
253
411
614
535
451
279
120
182
8531
070
307
965
284
557
1,26
624
694
02,
322
858
Atol
ls (In
clude
s Adm
inist
rativ
e an
d No
n-
Adm
inist
rativ
e Isl
ands
)27
5,42
234
,407
17,3
6124
,452
12,9
7512
,127
19,8
1510
,821
10,6
417,
954
5,31
67,
640
1,66
06,
337
4,08
16,
068
10,7
1213
,604
10,0
4717
,032
10,2
6125
,683
1,32
45,
104
Nort
h Th
iladh
unm
athi
(HA)
20,3
002,
217
16,6
1990
18
1020
1124
116
40
103
414
166
276
2152
310
Sout
h Th
iladh
unm
athi
(HDh
)24
,342
1,60
234
721
,682
6623
1919
1514
611
310
19
1412
718
1523
5137
5No
rth
Mila
dhun
mad
ulu
(Sh)
16,2
921,
204
281,
470
12,6
3316
427
822
7912
15
611
54
1119
139
1130
2425
3So
uth
Mila
dhun
mad
ulu
(N)
15,0
881,
965
5233
6911
,727
541
1228
811
03
04
38
248
525
822
4024
0No
rth
Maa
lhos
mad
ulu
(R)
20,9
331,
750
3131
6735
18,3
3313
064
116
33
124
923
92
145
851
332
Sout
h M
aalh
osm
adul
u (B
)13
,154
1,91
617
2911
423
810
,453
455
48
86
34
1612
527
627
6025
0Fa
adhi
ppol
hu (L
h)11
,862
1,51
312
1816
3118
839
9,81
510
73
22
13
49
517
710
3611
4M
ale'
Ato
ll (K
)12
,244
3,08
956
7811
1951
2118
97,
789
3527
1939
2723
748
2456
7821
2759
244
Nort
h Ar
i Ato
ll (A
A)7,
242
1,51
423
275
54
2016
105,
146
122
06
163
410
48
138
4623
2So
uth
Ari A
toll
(ADh
)10
,079
1,89
825
358
532
44
881
7,40
02
174
226
229
810
223
7822
3Fe
lidhu
Ato
ll (V
)2,
385
625
165
44
77
36
114
1,58
736
35
610
02
22
931
Mul
akat
holh
u (M
)6,
807
1,03
39
215
1014
38
31
15
5,47
06
2536
97
65
1024
96No
rth
Nila
ndhe
Ato
ll (F
)5,
266
931
914
24
73
64
02
510
23,
917
9416
84
291
212
94So
uth
Nila
ndhe
Ato
ll (D
h)7,
124
1,15
313
79
518
00
14
26
107
725,
548
1717
29
218
2292
Kolh
umad
ulu
(Th)
14,2
432,
989
2520
716
1317
719
06
613
87
4810
,342
202
1212
113
4629
7Ha
dhdh
unm
athi
(L)
15,4
651,
420
1421
1513
1322
303
17
118
73
1573
13,1
6710
162
1929
384
Nort
h Hu
vadh
u At
oll (
GA)
12,9
641,
687
1716
815
79
812
13
26
24
1021
9,68
175
492
180
4338
6So
uth
Huva
dhu
Atol
l (GD
h)19
,046
2,13
519
1711
1715
1227
113
51
102
720
1612
315
,753
7422
280
466
Gnav
iyan
i (Gn
)11
,215
774
814
42
54
63
68
15
26
14
1430
9,82
524
471
178
Addu
(S)
29,3
712,
992
2113
1618
1213
711
76
32
29
1122
8318
816
324
,774
491
507
Repo
rted
as n
ot re
gist
ered
in M
aldi
ves
296
964
80
14
00
11
20
10
22
64
21
414
413
Not S
tate
d5,
378
558
101
175
108
8015
193
6480
5747
423
3148
7291
9317
962
159
593,
043
TA
BL
E M
G1
: RE
SID
EN
T M
AL
DIV
IAN
PO
PUL
AT
ION
BY
PL
AC
E O
F R
EG
IST
RA
TIO
N C
RO
SS C
LA
SSIF
IED
BY
PL
AC
E O
F B
IRT
H, S
EX
AN
D L
OC
AL
ITY
(AT
OL
L),
2014
Plac
e of
regi
stra
tion
Pla
ce o
f birt
hAb
road
Not s
tate
d

34Migration: CENSUS 2014
National Bureau of Statistics
Repu
blic
Mal
e'HA
HDh
ShN
RB
LhK
AAAD
hV
MF
DhTh
LGA
GDh
GnS
(1)
(2)
(3)
(4)
(5)
(6)
(7)
(8)
(9)
(10)
(11)
(12)
(13)
(14)
(15)
(16)
(17)
(18)
(19)
(20)
(21)
(22)
(23)
(24)
(25)
TA
BL
E M
G1
: RE
SID
EN
T M
AL
DIV
IAN
PO
PUL
AT
ION
BY
PL
AC
E O
F R
EG
IST
RA
TIO
N C
RO
SS C
LA
SSIF
IED
BY
PL
AC
E O
F B
IRT
H, S
EX
AN
D L
OC
AL
ITY
(AT
OL
L),
2014
Plac
e of
regi
stra
tion
Pla
ce o
f birt
hAb
road
Not s
tate
d
Mal
e
Repu
blic
171,
962
40,8
679,
098
12,8
136,
622
6,30
210
,372
5,86
05,
695
4,29
02,
775
3,99
390
63,
350
2,06
33,
285
5,82
17,
117
5,41
19,
227
5,32
413
,614
2,05
25,
105
Mal
e'
29,8
0822
,860
471
482
145
241
317
301
259
154
5711
154
171
4116
751
617
632
164
413
951
01,
231
440
Atol
ls (In
clude
s Adm
inist
rativ
e an
d No
n-
Adm
inist
rativ
e Isl
ands
)13
8,64
317
,660
8,57
412
,223
6,41
46,
006
9,96
85,
493
5,39
44,
085
2,68
43,
853
850
3,16
42,
004
3,08
85,
261
6,88
05,
041
8,48
95,
142
13,0
0869
12,
671
Nort
h Th
iladh
unm
athi
(HA)
10,0
831,
129
8,20
845
84
512
815
43
20
32
36
74
172
1129
151
Sout
h Th
iladh
unm
athi
(HDh
)12
,139
797
169
10,8
1427
108
106
94
52
80
69
73
811
1226
188
Nort
h M
iladh
unm
adul
u (S
h)8,
112
628
1373
76,
229
8815
314
444
02
28
31
715
72
614
1012
5So
uth
Mila
dhun
mad
ulu
(N)
7,47
097
025
1840
5,78
827
07
143
80
20
13
712
53
43
1320
128
Nort
h M
aalh
osm
adul
u (R
)10
,532
897
1317
3620
9,20
157
327
42
23
16
125
18
24
2218
0So
uth
Maa
lhos
mad
ulu
(B)
6,64
193
63
135
111
45,
304
283
07
23
04
76
313
415
3313
7Fa
adhi
ppol
hu (L
h)6,
014
778
710
710
101
204,
955
57
02
00
11
22
95
521
66M
ale'
Ato
ll (K
)6,
295
1,61
128
332
1326
898
3,99
314
1510
1914
113
2417
2643
1113
3313
1No
rth
Ari A
toll
(AA)
3,69
680
011
154
41
98
52,
598
600
54
11
80
49
427
118
Sout
h Ar
i Ato
ll (A
Dh)
5,10
996
617
227
516
34
537
3,73
32
790
99
55
51
1544
120
Felid
hu A
toll
(V)
1,22
933
76
23
32
61
21
581
315
34
15
00
10
415
Mul
akat
holh
u (M
)3,
455
539
511
57
102
42
10
22,
742
312
166
25
36
1260
Nort
h Ni
land
he A
toll
(F)
2,61
046
66
71
34
22
20
12
601,
924
517
52
150
04
46So
uth
Nila
ndhe
Ato
ll (D
h)3,
608
567
76
83
90
00
20
356
372,
821
410
24
18
1050
Kolh
umad
ulu
(Th)
7,08
71,
547
1010
510
711
611
03
355
320
5,08
611
24
60
722
149
Hadh
dhun
mat
hi (L
)7,
855
751
816
55
1012
182
14
195
013
376,
630
17
04
1522
0No
rth
Huva
dhu
Atol
l (GA
)6,
590
873
1110
57
36
68
13
03
22
513
4,88
339
243
9120
203
Sout
h Hu
vadh
u At
oll (
GDh)
9,59
61,
148
1111
512
117
187
33
03
23
911
527,
844
4210
449
241
Gnav
iyan
i (Gn
)5,
605
383
66
32
41
22
32
15
14
12
716
4,91
212
333
86Ad
du (S
)14
,917
1,53
710
713
106
64
65
43
12
77
934
8786
12,5
5925
725
7
Repo
rted
as n
ot re
gist
ered
in M
aldi
ves
177
433
60
14
00
11
20
00
11
32
21
294
10
Not S
tate
d3,
334
304
5010
263
5483
6642
5033
272
1518
2943
5847
9242
9436
1,98
4
35
National Bureau of Statistics
Repu
blic
Mal
e'HA
HDh
ShN
RB
LhK
AAAD
hV
MF
DhTh
LGA
GDh
GnS
(1)
(2)
(3)
(4)
(5)
(6)
(7)
(8)
(9)
(10)
(11)
(12)
(13)
(14)
(15)
(16)
(17)
(18)
(19)
(20)
(21)
(22)
(23)
(24)
(25)
TA
BL
E M
G1
: RE
SID
EN
T M
AL
DIV
IAN
PO
PUL
AT
ION
BY
PL
AC
E O
F R
EG
IST
RA
TIO
N C
RO
SS C
LA
SSIF
IED
BY
PL
AC
E O
F B
IRT
H, S
EX
AN
D L
OC
AL
ITY
(AT
OL
L),
2014
Plac
e of
regi
stra
tion
Pla
ce o
f birt
hAb
road
Not s
tate
d
Fem
ale
Re
publ
ic16
6,47
238
,774
9,20
812
,685
6,71
46,
317
10,2
125,
589
5,46
14,
024
2,71
93,
878
843
3,32
12,
119
3,14
05,
930
6,86
85,
290
9,25
25,
246
13,1
721,
797
3,91
3M
ale'
27
,530
21,7
2036
938
110
817
029
723
419
212
563
7131
139
2914
044
910
823
662
210
743
01,
091
418
Atol
ls (In
clude
s Adm
inist
rativ
e an
d No
n-
Adm
inist
rativ
e Isl
ands
)13
6,77
916
,747
8,78
712
,229
6,56
16,
121
9,84
75,
328
5,24
73,
869
2,63
23,
787
810
3,17
32,
077
2,98
05,
451
6,72
45,
006
8,54
35,
119
12,6
7563
32,
433
Nort
h Th
iladh
unm
athi
(HA)
10,2
171,
088
8,41
144
34
58
39
73
20
71
18
92
104
1023
159
Sout
h Th
iladh
unm
athi
(HDh
)12
,203
805
178
10,8
6839
1311
99
52
61
21
35
54
104
1125
187
Nort
h M
iladh
unm
adul
u (S
h)8,
180
576
1573
36,
404
7612
58
358
13
43
23
44
67
516
1412
8So
uth
Mila
dhun
mad
ulu
(N)
7,61
899
527
1529
5,93
927
15
145
30
10
30
112
32
215
920
112
Nort
h M
aalh
osm
adul
u (R
)10
,401
853
1814
3115
9,13
273
324
21
19
33
114
16
34
2915
2So
uth
Maa
lhos
mad
ulu
(B)
6,51
398
014
166
312
45,
149
172
41
63
30
96
214
212
2711
3Fa
adhi
ppol
hu (L
h)5,
848
735
58
921
8719
4,86
05
03
02
12
37
38
25
1548
Mal
e' A
toll
(K)
5,94
91,
478
2845
96
2513
913,
796
2112
920
1312
424
730
3510
1426
113
Nort
h Ar
i Ato
ll (A
A)3,
546
714
1212
11
311
85
2,54
862
01
122
32
44
44
1911
4So
uth
Ari A
toll
(ADh
)4,
970
932
813
10
161
03
443,
667
095
217
134
35
18
3410
3Fe
lidhu
Ato
ll (V
)1,
156
288
103
11
51
24
09
774
210
15
50
21
25
16M
ulak
atho
lhu
(M)
3,35
249
44
100
34
14
10
13
2,72
83
1320
35
12
412
36No
rth
Nila
ndhe
Ato
ll (F
)2,
656
465
37
11
31
42
01
342
1,99
343
93
214
12
848
Sout
h Ni
land
he A
toll
(Dh)
3,51
658
66
11
29
00
12
23
5135
2,72
713
70
51
1012
42Ko
lhum
adul
u (T
h)7,
156
1,44
215
102
66
61
80
33
834
285,
256
908
61
624
148
Hadh
dhun
mat
hi (L
)7,
610
669
65
108
310
121
03
092
32
366,
537
99
215
1416
4No
rth
Huva
dhu
Atol
l (GA
)6,
374
814
66
38
43
24
00
23
02
58
4,79
836
249
8923
183
Sout
h Hu
vadh
u At
oll (
GDh)
9,45
098
78
66
54
59
40
21
70
411
571
7,90
932
118
3122
5Gn
aviy
ani (
Gn)
5,61
039
12
81
01
34
13
60
01
20
27
144,
913
121
3892
Addu
(S)
14,4
541,
455
116
38
67
35
22
01
02
413
4910
177
12,2
1523
425
0
Repo
rted
as n
ot re
gist
ered
in M
aldi
ves
119
531
20
00
00
00
00
10
11
32
00
250
3
Not S
tate
d2,
044
254
5173
4526
6827
2230
2420
28
1319
2933
4687
2065
231,
059
36Migration: CENSUS 2014
National Bureau of Statistics
Repu
blic
Mal
e'HA
HDh
ShN
RB
LhK
AAAD
hV
MF
DhTh
LGA
GDh
GnS
(1)
(2)
(3)
(4)
(5)
(6)
(7)
(8)
(9)
(10)
(11)
(12)
(13)
(14)
(15)
(16)
(17)
(18)
(19)
(20)
(21)
(22)
(23)
(24)
Both
Sex
es
Repu
blic
338,
434
12
6,08
0
13
,737
18
,708
12
,616
11
,313
15
,544
10
,207
8,
709
17
,481
6,
913
10
,200
1,
596
4,
953
4,
235
6,
045
9,
300
12
,210
8,
867
11
,817
8,
035
19
,518
35
0
Mal
e'
57,3
38
54
,207
12
4
21
5
77
12
7
13
4
14
1
10
6
78
3
10
7
18
1
26
77
26
10
0
14
9
13
2
85
14
7
85
27
0
39
Atol
ls (In
clud
es A
dmin
istra
tive
and
Non-
Ad
min
istra
tive
Islan
ds)
275,
422
69
,338
13
,399
18
,293
12
,402
11
,078
15
,244
9,
878
8,
545
16
,324
6,
600
9,
849
1,
554
4,
840
4,
127
5,
844
8,
951
11
,881
8,
611
11
,470
7,
905
19
,009
28
0
Nort
h Th
iladh
unm
athi
(HA)
20,3
00
5,
628
12
,796
22
3
28
76
55
77
73
73
2
11
2
21
2
7
30
11
63
29
24
25
27
9
40
23
Sout
h Th
iladh
unm
athi
(HDh
)24
,342
4,58
2
197
17,5
30
99
66
55
99
47
948
202
208
11
37
7
52
22
31
29
31
31
30
28
Nort
h M
iladh
unm
adul
u (S
h)16
,292
3,07
7
37
127
11,9
11
101
53
100
89
403
70
139
13
14
5
43
12
22
21
8
10
21
16
Sout
h M
iladh
unm
adul
u (N
)15
,088
3,47
2
50
49
52
10,2
80
65
79
272
411
43
137
8
21
1
31
20
32
15
21
6
18
5
Nort
h M
aalh
osm
adul
u (R
)20
,933
4,84
2
43
52
92
84
14,6
94
200
134
391
81
103
19
16
12
40
31
20
22
7
12
29
9
Sout
h M
aalh
osm
adul
u (B
)13
,154
3,67
3
19
32
30
29
48
8,69
0
34
274
66
79
6
15
19
17
14
19
13
22
11
26
18
Faad
hipp
olhu
(Lh)
11,8
62
3,
228
27
37
34
11
7
43
83
7,
624
34
8
44
95
8
10
9
18
20
22
20
27
13
20
15
Mal
e' A
toll
(K)
12,2
44
2,
153
26
18
19
25
28
46
36
9,
612
31
67
4
14
20
23
15
18
26
21
8
24
10
Nort
h Ar
i Ato
ll (A
A)7,
242
1,48
5
8
8
11
14
10
23
22
92
5,42
4
64
1
8
8
6
6
9
3
4
6
29
1
Sout
h Ar
i Ato
ll (A
Dh)
10,0
79
1,
799
15
25
11
8
11
19
9
11
8
96
7,
861
9
12
13
14
5
15
6
12
1
15
5
Felid
hu A
toll
(V)
2,38
5
77
6
7
5
1
11
9
13
3
63
15
35
1,40
6
14
2
5
14
1
-
2
-
2
1
Mul
akat
holh
u (M
)6,
807
1,85
7
5
18
7
26
16
14
11
125
31
67
5
4,
486
11
46
24
13
12
11
1
15
6
Nort
h Ni
land
he A
toll
(F)
5,26
6
1,
092
4
6
6
3
4
9
6
55
17
31
5
16
3,
910
41
7
10
6
16
3
11
8
Sout
h Ni
land
he A
toll
(Dh)
7,12
4
1,
627
14
13
6
7
6
7
-
11
7
11
43
2
24
17
5,14
1
17
23
7
15
4
15
8
Kolh
umad
ulu
(Th)
14,2
43
5,
014
22
26
18
32
27
30
15
22
9
20
60
5
18
11
47
8,48
7
86
19
20
8
23
26
Hadh
dhun
mat
hi (L
)15
,465
3,16
0
26
22
14
27
15
50
24
233
37
79
12
38
13
58
125
11,3
80
47
34
18
33
20
Nort
h Hu
vadh
u At
oll (
GA)
12,9
64
4,
413
14
9
12
18
15
33
15
169
21
27
4
9
13
19
9
26
7,
904
12
6
24
76
8
Sout
h Hu
vadh
u At
oll (
GDh)
19,0
46
6,
828
21
37
26
37
32
66
41
32
9
46
79
10
23
20
36
33
53
24
4
10
,869
54
13
9
23
Gnav
iyan
i (Gn
)11
,215
2,33
0
26
15
6
38
9
81
24
485
56
160
5
13
6
39
17
20
74
71
7,57
5
153
12
Addu
(S)
29,3
71
8,
302
42
41
19
79
49
15
9
66
1,
190
17
7
30
3
14
22
19
10
5
44
57
11
8
12
6
11
1
18
,290
38
Repo
rted
as n
ot re
gist
ered
in M
aldi
ves
296
14
6
3
10
4
7
4
3
3
21
8
7
-
3
-
6
10
11
13
14
5
17
1
Not S
tate
d5,
378
2,38
9
211
190
133
101
162
185
55
353
198
163
16
33
82
95
190
186
158
186
40
222
30
TA
BL
E M
G 2
: R
ESI
DE
NT
MA
LD
IVIA
N P
OPU
LA
TIO
N B
Y P
LA
CE
OF
RE
GIS
TR
AT
ION
CR
OSS
CL
ASS
IFIE
D B
Y P
LA
CE
OF
USU
AL
RE
SID
EN
CE
, SE
X A
ND
LO
CA
LIT
Y (A
TO
LL
), 20
14
Plac
e of
regi
stra
tion
Plac
e of
usu
al re
siden
ce N
ot st
ated

37
National Bureau of Statistics
Repu
blic
Mal
e'HA
HDh
ShN
RB
LhK
AAAD
hV
MF
DhTh
LGA
GDh
GnS
(1)
(2)
(3)
(4)
(5)
(6)
(7)
(8)
(9)
(10)
(11)
(12)
(13)
(14)
(15)
(16)
(17)
(18)
(19)
(20)
(21)
(22)
(23)
(24)
TA
BL
E M
G 2
: R
ESI
DE
NT
MA
LD
IVIA
N P
OPU
LA
TIO
N B
Y P
LA
CE
OF
RE
GIS
TR
AT
ION
CR
OSS
CL
ASS
IFIE
D B
Y P
LA
CE
OF
USU
AL
RE
SID
EN
CE
, SE
X A
ND
LO
CA
LIT
Y (A
TO
LL
), 20
14
Plac
e of
regi
stra
tion
Plac
e of
usu
al re
siden
ce N
ot st
ated
Mal
e
Repu
blic
171,
962
63
,183
6,
439
8,
550
5,
852
5,
436
7,
569
5,
448
4,
363
11
,952
3,
929
5,
986
85
9
2,
468
2,
053
3,
221
4,
562
6,
159
4,
718
5,
992
3,
621
9,
326
27
6
Mal
e'
29,8
08
27
,735
80
11
8
51
83
80
86
69
65
9
49
12
6
15
41
17
56
78
90
55
95
45
14
8
32
Atol
ls (In
clud
es A
dmin
istra
tive
and
Non-
Ad
min
istra
tive
Islan
ds)
138,
643
33
,943
6,
237
8,
333
5,
725
5,
283
7,
391
5,
205
4,
254
11
,007
3,
744
5,
736
82
9
2,
401
1,
984
3,
084
4,
373
5,
957
4,
566
5,
772
3,
550
9,
046
22
3
Nort
h Th
iladh
unm
athi
(HA)
10,0
83
2,
826
5,
875
99
13
42
23
50
42
67
9
88
19
1
4
10
3
38
16
15
12
14
5
23
15
Sout
h Th
iladh
unm
athi
(HDh
)12
,139
2,33
7
138
8,01
0
55
47
19
80
28
867
176
188
8
17
5
46
9
16
19
18
15
15
26
Nort
h M
iladh
unm
adul
u (S
h)8,
112
1,66
0
21
39
5,46
9
69
26
79
55
378
61
127
9
9
4
38
9
10
17
3
6
9
14
Sout
h M
iladh
unm
adul
u (N
)7,
470
1,70
0
33
20
29
4,78
1
30
63
171
379
36
124
3
14
-
24
11
15
12
11
3
9
2
Nort
h M
aalh
osm
adul
u (R
)10
,532
2,41
9
22
19
54
56
7,12
2
132
85
340
68
87
16
8
5
24
15
11
20
4
7
11
7
Sout
h M
aalh
osm
adul
u (B
)6,
641
1,74
6
8
14
12
16
19
4,
341
23
23
6
51
67
2
8
11
13
9
12
9
9
6
12
17
Faad
hipp
olhu
(Lh)
6,01
4
1,
587
21
17
16
56
24
61
3,
685
30
1
34
88
5
5
3
15
13
17
16
16
11
13
10
Mal
e' A
toll
(K)
6,29
5
1,
033
11
10
8
12
14
36
13
4,97
6
25
59
3
7
11
17
9
8
12
11
1
10
9
Nort
h Ar
i Ato
ll (A
A)3,
696
696
3
3
8
8
4
16
11
69
2,
787
48
1
4
5
4
3
8
2
2
2
11
1
Sout
h Ar
i Ato
ll (A
Dh)
5,10
9
84
2
9
10
5
6
8
8
6
10
0
68
3,
997
5
4
7
7
2
5
3
5
-
9
3
Felid
hu A
toll
(V)
1,22
9
37
3
1
3
1
6
3
8
3
41
12
20
738
8
1
2
5
-
-
1
-
2
1
Mul
akat
holh
u (M
)3,
455
914
1
10
4
14
6
8
9
10
7
24
59
1
2,22
7
6
24
12
7
8
4
-
7
3
Nort
h Ni
land
he A
toll
(F)
2,61
0
58
2
3
5
2
2
1
5
4
36
9
24
1
7
1,
867
24
5
6
4
9
1
6
7
Sout
h Ni
land
he A
toll
(Dh)
3,60
8
78
5
5
6
3
4
3
3
-
10
5
8
36
1
12
9
2,58
6
8
15
3
3
2
6
5
Kolh
umad
ulu
(Th)
7,08
7
2,
496
9
12
8
15
12
16
7
196
16
47
2
7
7
23
4,
114
43
11
10
1
14
21
Hadh
dhun
mat
hi (L
)7,
855
1,55
1
10
12
8
17
12
28
12
19
6
21
62
7
21
7
37
69
5,
679
38
22
11
20
15
Nort
h Hu
vadh
u At
oll (
GA)
6,59
0
2,
154
7
4
4
10
7
24
11
14
6
13
20
2
3
6
12
4
10
4,
045
56
10
37
5
Sout
h Hu
vadh
u At
oll (
GDh)
9,59
6
3,
215
14
14
14
23
15
41
19
28
3
36
70
6
14
8
26
15
22
18
7
5,
454
31
71
18
Gnav
iyan
i (Gn
)5,
605
1,15
6
18
7
3
32
6
75
17
45
8
49
14
6
4
5
4
32
12
13
62
41
3,37
9
75
11
Addu
(S)
14,9
17
3,
871
28
19
9
67
37
131
53
1,11
4
162
276
11
11
15
92
33
45
86
79
59
8,68
6
33
Repo
rted
as n
ot re
gist
ered
in M
aldi
ves
177
73
2
4
2
4
3
3
-
19
6
6
-
1
-
4
8
7
8
14
4
8
1
Not S
tate
d3,
334
1,43
2
120
95
74
66
95
154
40
267
130
118
15
25
52
77
103
105
89
111
22
124
20

38Migration: CENSUS 2014
National Bureau of Statistics
Repu
blic
Mal
e'HA
HDh
ShN
RB
LhK
AAAD
hV
MF
DhTh
LGA
GDh
GnS
(1)
(2)
(3)
(4)
(5)
(6)
(7)
(8)
(9)
(10)
(11)
(12)
(13)
(14)
(15)
(16)
(17)
(18)
(19)
(20)
(21)
(22)
(23)
(24)
TA
BL
E M
G 2
: R
ESI
DE
NT
MA
LD
IVIA
N P
OPU
LA
TIO
N B
Y P
LA
CE
OF
RE
GIS
TR
AT
ION
CR
OSS
CL
ASS
IFIE
D B
Y P
LA
CE
OF
USU
AL
RE
SID
EN
CE
, SE
X A
ND
LO
CA
LIT
Y (A
TO
LL
), 20
14
Plac
e of
regi
stra
tion
Plac
e of
usu
al re
siden
ce N
ot st
ated
Fem
ale
Repu
blic
166,
472
62
,897
7,
298
10
,158
6,
764
5,
877
7,
975
4,
759
4,
346
5,
529
2,
984
4,
214
73
7
2,
485
2,
182
2,
824
4,
738
6,
051
4,
149
5,
825
4,
414
10
,192
74
Mal
e'
27,5
30
26
,472
44
97
26
44
54
55
37
12
4
58
55
11
36
9
44
71
42
30
52
40
122
7
Atol
ls (In
clud
es A
dmin
istra
tive
and
Non-
Ad
min
istra
tive
Islan
ds)
136,
779
35
,395
7,
162
9,
960
6,
677
5,
795
7,
853
4,
673
4,
291
5,
317
2,
856
4,
113
72
5
2,
439
2,
143
2,
760
4,
578
5,
924
4,
045
5,
698
4,
355
9,
963
57
Nort
h Th
iladh
unm
athi
(HA)
10,2
17
2,
802
6,
921
12
4
15
34
32
27
31
53
24
21
3
20
8
25
13
9
13
13
4
17
8
Sout
h Th
iladh
unm
athi
(HDh
)12
,203
2,24
5
59
9,52
0
44
19
36
19
19
81
26
20
3
20
2
6
13
15
10
13
16
15
2
Nort
h M
iladh
unm
adul
u (S
h)8,
180
1,41
7
16
88
6,44
2
32
27
21
34
25
9
12
4
5
1
5
3
12
4
5
4
12
2
Sout
h M
iladh
unm
adul
u (N
)7,
618
1,77
2
17
29
23
5,49
9
35
16
101
32
7
13
5
7
1
7
9
17
3
10
3
9
3
Nort
h M
aalh
osm
adul
u (R
)10
,401
2,42
3
21
33
38
28
7,57
2
68
49
51
13
16
3
8
7
16
16
9
2
3
5
18
2
Sout
h M
aalh
osm
adul
u (B
)6,
513
1,92
7
11
18
18
13
29
4,34
9
11
38
15
12
4
7
8
4
5
7
4
13
5
14
1
Faad
hipp
olhu
(Lh)
5,84
8
1,
641
6
20
18
61
19
22
3,93
9
47
10
7
3
5
6
3
7
5
4
11
2
7
5
Mal
e' A
toll
(K)
5,94
9
1,
120
15
8
11
13
14
10
23
4,63
6
6
8
1
7
9
6
6
10
14
10
7
14
1
Nort
h Ar
i Ato
ll (A
A)3,
546
789
5
5
3
6
6
7
11
23
2,63
7
16
-
4
3
2
3
1
1
2
4
18
0
Sout
h Ar
i Ato
ll (A
Dh)
4,97
0
95
7
6
15
6
2
3
11
3
18
28
3,86
4
4
8
6
7
3
10
3
7
1
6
2
Felid
hu A
toll
(V)
1,15
6
40
3
6
2
-
5
6
5
-
22
3
15
66
8
6
1
3
9
1
-
1
-
-
0
Mul
akat
holh
u (M
)3,
352
943
4
8
3
12
10
6
2
18
7
8
4
2,25
9
5
22
12
6
4
7
1
8
3
Nort
h Ni
land
he A
toll
(F)
2,65
6
51
0
1
1
4
1
3
4
2
19
8
7
4
9
2,04
3
17
2
4
2
7
2
5
1
Sout
h Ni
land
he A
toll
(Dh)
3,51
6
84
2
9
7
3
3
3
4
-
12
3
7
1
12
8
2,
555
9
8
4
12
2
9
3
Kolh
umad
ulu
(Th)
7,15
6
2,
518
13
14
10
17
15
14
8
33
4
13
3
11
4
24
4,
373
43
8
10
7
9
5
Hadh
dhun
mat
hi (L
)7,
610
1,60
9
16
10
6
10
3
22
12
37
16
17
5
17
6
21
56
5,70
1
9
12
7
13
5
Nort
h Hu
vadh
u At
oll (
GA)
6,37
4
2,
259
7
5
8
8
8
9
4
23
8
7
2
6
7
7
5
16
3,
859
70
14
39
3
Sout
h Hu
vadh
u At
oll (
GDh)
9,45
0
3,
613
7
23
12
14
17
25
22
46
10
9
4
9
12
10
18
31
57
5,
415
23
68
5
Gnav
iyan
i (Gn
)5,
610
1,17
4
8
8
3
6
3
6
7
27
7
14
1
8
2
7
5
7
12
30
4,19
6
78
1
Addu
(S)
14,4
54
4,
431
14
22
10
12
12
28
13
76
15
27
3
11
4
13
11
12
32
47
52
9,
604
5
Repo
rted
as n
ot re
gist
ered
in M
aldi
ves
119
73
1
6
2
3
1
-
3
2
2
1
-
2
-
2
2
4
5
-
1
9
0
Not S
tate
d2,
044
957
91
95
59
35
67
31
15
86
68
45
1
8
30
18
87
81
69
75
18
98
10

39
National Bureau of Statistics
Repu
blic
Mal
e'HA
HDh
ShN
RB
LhK
AAAD
hV
MF
DhTh
LGA
GDh
GnS
(1)
(2)
(3)
(4)
(5)
(6)
(7)
(8)
(9)
(10)
(11)
(12)
(13)
(14)
(15)
(16)
(17)
(18)
(19)
(20)
(21)
(22)
(23)
(24)
(25)
Repu
blic
Both
Sex
es33
8,43
4
79,6
41
18
,306
25
,498
13
,336
12
,619
20
,584
11
,449
11
,156
8,
314
5,49
4
7,
871
1,74
9
6,
671
4,18
2
6,
425
11,7
51
13,9
85
10,7
01
18,4
79
10,5
70
26,7
86
3,84
9
9,
018
Mal
e'
126,
080
56
,859
5,33
0
4,
722
2,76
4
3,
071
4,73
2
3,
343
2,94
5
1,
656
1,21
1
1,
395
624
1,
926
924
1,
644
4,55
1
2,
810
3,84
6
6,
669
2,11
5
7,
197
2,99
9
2,
747
Atol
ls (In
clud
es A
dmin
istra
tive
and
Non-
Ad
min
istra
tive
Islan
ds)
212,
004
22
,749
12,9
57
20,7
51
10,5
57
9,54
5
15
,843
8,
090
8,20
3
6,
652
4,28
2
6,
470
1,12
4
4,
739
3,25
2
4,
772
7,19
1
11
,159
6,
849
11,7
90
8,44
6
19
,556
84
8
6,17
9
No
rth
Thila
dhun
mat
hi (H
A)13
,737
1,17
2
10,8
15
937
29
45
39
20
36
15
8
10
5
7
6
11
23
31
8
30
23
46
28
39
3
Sout
h Th
iladh
unm
athi
(HDh
)18
,708
995
399
16
,299
14
7
51
56
34
42
23
9
17
5
19
4
16
27
24
14
38
23
43
37
38
6
Nort
h M
iladh
unm
adul
u (S
h)12
,616
837
44
1,
448
9,21
8
17
9
301
26
89
19
6
11
5
13
7
8
20
18
12
23
13
30
11
278
So
uth
Mila
dhun
mad
ulu
(N)
11,3
13
1,
422
89
77
13
2
8,08
3
55
7
30
34
9
25
6
8
7
17
3
11
33
28
12
35
41
76
22
25
0
Nort
h M
aalh
osm
adul
u (R
)15
,544
1,02
7
59
65
82
76
13,4
09
129
83
24
9
8
8
17
2
11
33
18
11
34
13
43
29
35
4
Sout
h M
aalh
osm
adul
u (B
)10
,207
1,26
4
84
10
6
98
76
365
7,
213
105
47
22
20
15
20
6
5
25
49
28
75
79
16
4
41
300
Fa
adhi
ppol
hu (L
h)8,
709
91
6
67
55
68
245
27
1
59
6,
645
29
16
10
2
7
5
4
16
16
13
39
27
67
26
10
6
Mal
e' A
toll
(K)
17,4
81
3,
319
75
9
1,00
5
40
6
414
42
0
273
52
0
6,24
2
11
7
120
73
156
70
247
25
0
248
20
5
366
50
4
1,23
0
90
44
7
Nort
h Ar
i Ato
ll (A
A)6,
913
1,
277
12
6
218
69
44
78
76
43
30
3,
898
198
11
27
25
14
17
32
21
45
58
175
40
39
1
Sout
h Ar
i Ato
ll (A
Dh)
10,2
00
1,
603
22
2
233
13
9
130
12
2
77
97
58
13
2
5,97
8
27
163
26
70
74
77
32
85
15
2
298
69
33
6
Felid
hu A
toll
(V)
1,59
6
432
13
16
12
9
24
8
6
5
1
12
922
28
7
6
9
18
1
8
5
14
5
35
Mul
akat
holh
u (M
)4,
953
73
9
29
45
13
24
16
15
13
11
5
5
12
3,71
9
14
38
38
38
11
19
14
23
26
86
Nort
h Ni
land
he A
toll
(F)
4,23
5
733
16
15
4
2
13
13
12
16
5
10
5
97
2,93
1
99
17
19
11
41
5
19
6
14
6
Sout
h Ni
land
he A
toll
(Dh)
6,04
5
931
63
48
46
34
48
16
20
12
7
12
6
13
0
100
4,
117
45
59
17
36
42
10
4
24
128
Ko
lhum
adul
u (T
h)9,
300
1,
789
32
31
9
27
26
16
20
15
4
3
9
113
9
44
6,
362
279
12
27
12
45
19
39
7
Hadh
dhun
mat
hi (L
)12
,210
954
27
35
21
32
26
21
37
7
4
13
2
16
0
9
21
128
10
,052
29
56
17
60
30
46
9
Nort
h Hu
vadh
u At
oll (
GA)
8,86
7
795
25
30
23
20
19
19
21
31
3
7
1
16
4
8
23
58
6,07
6
85
4
145
22
1
24
444
So
uth
Huva
dhu
Atol
l (GD
h)11
,817
800
35
31
13
20
15
17
36
16
3
10
3
12
13
17
25
35
186
9,
656
118
23
9
43
474
Gn
aviy
ani (
Gn)
8,03
5
423
10
25
9
6
11
7
12
10
3
7
1
3
3
8
8
16
29
67
6,90
1
25
5
34
187
Ad
du (S
)19
,518
1,32
1
43
32
19
28
27
21
17
17
24
11
5
15
8
17
18
44
121
25
6
254
16
,404
24
4
572
No
t Sta
ted
350
33
19
25
15
3
9
16
8
6
1
6
1
6
6
9
9
16
6
20
9
33
2
92
TA
BL
E M
G 3
: R
ESI
DE
NT
MA
LD
IVIA
N P
OPU
LA
TIO
N B
Y P
LA
CE
OF
USU
AL
RE
SID
EN
CE
CR
OSS
CL
ASS
IFIE
D B
Y P
LA
CE
OF
BIR
TH
, SE
X A
ND
LO
CA
LIT
Y (A
TO
LL
), 2
014
Plac
e of
usu
al re
siden
ce P
lace
of b
irth
Abro
ad N
ot
stat
ed
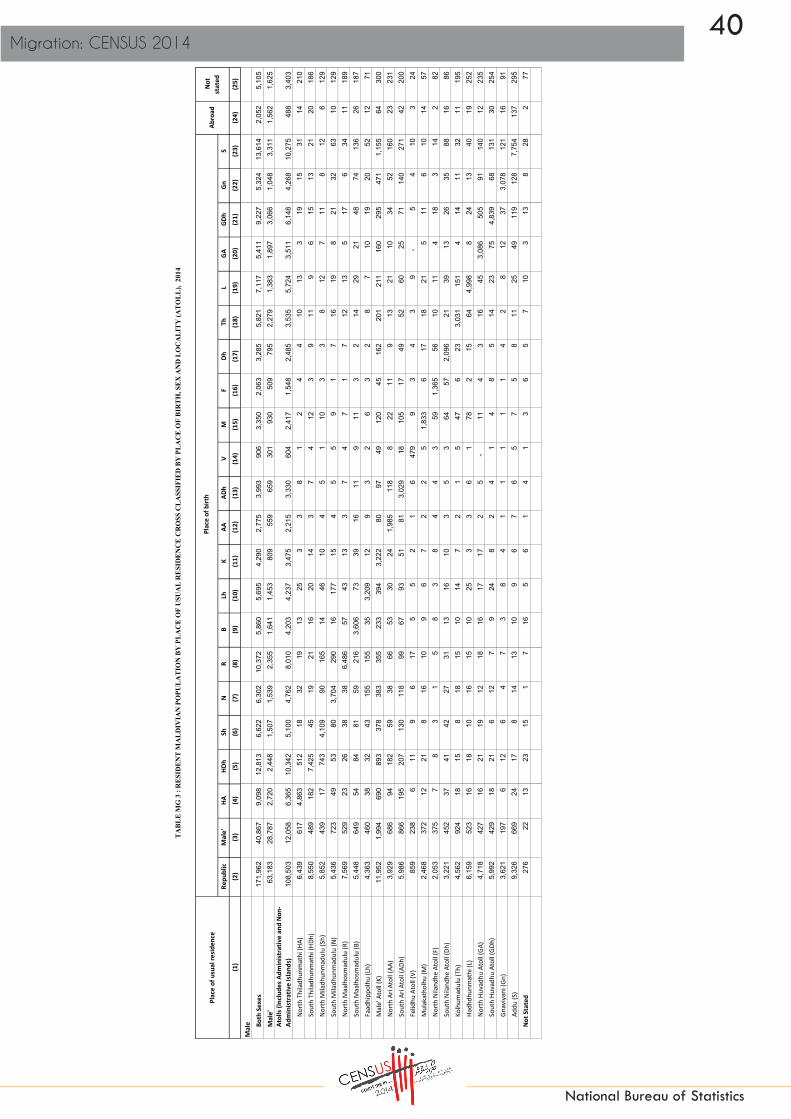
40Migration: CENSUS 2014
National Bureau of Statistics
Repu
blic
Mal
e'HA
HDh
ShN
RB
LhK
AAAD
hV
MF
DhTh
LGA
GDh
GnS
(1)
(2)
(3)
(4)
(5)
(6)
(7)
(8)
(9)
(10)
(11)
(12)
(13)
(14)
(15)
(16)
(17)
(18)
(19)
(20)
(21)
(22)
(23)
(24)
(25)
TA
BL
E M
G 3
: R
ESI
DE
NT
MA
LD
IVIA
N P
OPU
LA
TIO
N B
Y P
LA
CE
OF
USU
AL
RE
SID
EN
CE
CR
OSS
CL
ASS
IFIE
D B
Y P
LA
CE
OF
BIR
TH
, SE
X A
ND
LO
CA
LIT
Y (A
TO
LL
), 2
014
Plac
e of
usu
al re
siden
ce P
lace
of b
irth
Abro
ad N
ot
stat
ed
Mal
e Both
Sex
es17
1,96
2
40,8
67
9,
098
12,8
13
6,62
2
6,
302
10,3
72
5,86
0
5,
695
4,29
0
2,
775
3,99
3
90
6
3,35
0
2,
063
3,28
5
5,
821
7,11
7
5,
411
9,22
7
5,
324
13,6
14
2,05
2
5,
105
Mal
e'
63,1
83
28
,787
2,72
0
2,
448
1,50
7
1,
539
2,35
5
1,
641
1,45
3
80
9
559
65
9
301
93
0
509
79
5
2,27
9
1,
383
1,89
7
3,
066
1,04
8
3,
311
1,56
2
1,
625
Atol
ls (In
clud
es A
dmin
istra
tive
and
Non-
Ad
min
istra
tive
Islan
ds)
108,
503
12
,058
6,36
5
10
,342
5,
100
4,76
2
8,
010
4,20
3
4,
237
3,47
5
2,
215
3,33
0
60
4
2,41
7
1,
548
2,48
5
3,
535
5,72
4
3,
511
6,14
8
4,
268
10,2
75
488
3,
403
Nort
h Th
iladh
unm
athi
(HA)
6,43
9
617
4,86
3
51
2
18
32
19
13
25
3
3
8
1
2
4
4
10
13
3
19
15
31
14
210
So
uth
Thila
dhun
mat
hi (H
Dh)
8,55
0
489
182
7,
425
45
19
21
16
20
14
3
7
4
12
3
9
11
9
6
15
13
21
20
186
No
rth
Mila
dhun
mad
ulu
(Sh)
5,85
2
439
17
74
3
4,10
9
90
165
14
46
10
4
5
1
10
3
3
8
12
7
11
8
12
6
12
9
Sout
h M
iladh
unm
adul
u (N
)5,
436
72
3
49
53
80
3,70
4
29
0
16
17
7
15
4
5
5
9
1
7
16
19
8
21
32
63
10
12
9
Nort
h M
aalh
osm
adul
u (R
)7,
569
52
9
23
26
38
38
6,
486
57
43
13
3
7
4
7
1
7
12
13
5
17
6
34
11
18
9
Sout
h M
aalh
osm
adul
u (B
)5,
448
64
9
54
84
81
59
21
6
3,60
6
73
39
16
11
9
11
3
2
14
29
21
48
74
136
26
18
7
Faad
hipp
olhu
(Lh)
4,36
3
460
38
32
43
15
5
155
35
3,20
9
12
9
3
2
6
3
2
8
7
10
19
20
52
12
71
M
ale'
Ato
ll (K
)11
,952
1,99
4
690
89
3
378
38
3
355
23
3
394
3,
222
80
97
49
12
0
45
16
2
201
21
1
160
29
5
471
1,
155
64
300
No
rth
Ari A
toll
(AA)
3,92
9
686
94
18
2
59
38
66
53
30
24
1,98
5
11
8
8
22
11
9
13
21
10
34
52
16
0
23
231
So
uth
Ari A
toll
(ADh
)5,
986
86
6
19
5
207
13
0
118
99
67
93
51
81
3,02
9
18
105
17
49
52
60
25
71
14
0
271
42
20
0
Felid
hu A
toll
(V)
859
238
6
11
9
6
17
5
5
2
1
6
479
9
3
4
3
9
-
5
4
10
3
24
M
ulak
atho
lhu
(M)
2,46
8
372
12
21
8
16
10
9
6
7
2
2
5
1,
833
6
17
18
21
5
11
6
10
14
57
No
rth
Nila
ndhe
Ato
ll (F
)2,
053
37
5
7
8
3
1
5
8
3
8
4
4
3
59
1,
365
56
10
11
4
18
3
14
2
82
So
uth
Nila
ndhe
Ato
ll (D
h)3,
221
45
2
37
41
42
27
31
13
16
10
3
5
3
64
57
2,09
6
21
39
13
26
35
88
16
86
Kolh
umad
ulu
(Th)
4,56
2
924
18
15
8
18
15
10
14
7
2
1
5
47
6
23
3,03
1
15
1
4
14
11
32
11
195
Ha
dhdh
unm
athi
(L)
6,15
9
523
16
18
10
16
15
10
25
3
3
6
1
78
2
15
64
4,
998
8
24
13
40
19
252
No
rth
Huva
dhu
Atol
l (GA
)4,
718
42
7
16
21
19
12
18
16
17
17
2
5
-
11
4
3
16
45
3,08
6
50
5
91
14
0
12
235
So
uth
Huva
dhu
Atol
l (GD
h)5,
992
42
9
18
21
6
12
7
9
24
8
2
4
1
4
8
5
14
23
75
4,83
9
68
131
30
25
4
Gnav
iyan
i (Gn
)3,
621
19
7
6
12
6
4
7
3
8
4
1
1
1
1
1
4
2
8
12
37
3,
078
121
16
91
Addu
(S)
9,32
6
669
24
17
8
14
13
10
9
6
7
6
5
7
5
8
11
25
49
11
9
128
7,
754
137
29
5
Not S
tate
d27
6
22
13
23
15
1
7
16
5
6
1
4
1
3
6
5
7
10
3
13
8
28
2
77

41
National Bureau of Statistics
Repu
blic
Mal
e'HA
HDh
ShN
RB
LhK
AAAD
hV
MF
DhTh
LGA
GDh
GnS
(1)
(2)
(3)
(4)
(5)
(6)
(7)
(8)
(9)
(10)
(11)
(12)
(13)
(14)
(15)
(16)
(17)
(18)
(19)
(20)
(21)
(22)
(23)
(24)
(25)
TA
BL
E M
G 3
: R
ESI
DE
NT
MA
LD
IVIA
N P
OPU
LA
TIO
N B
Y P
LA
CE
OF
USU
AL
RE
SID
EN
CE
CR
OSS
CL
ASS
IFIE
D B
Y P
LA
CE
OF
BIR
TH
, SE
X A
ND
LO
CA
LIT
Y (A
TO
LL
), 2
014
Plac
e of
usu
al re
siden
ce P
lace
of b
irth
Abro
ad N
ot
stat
ed
Fem
ale
Both
Sex
es16
6,47
2
38,7
74
9,
208
12,6
85
6,71
4
6,
317
10,2
12
5,58
9
5,
461
4,02
4
2,
719
3,87
8
84
3
3,32
1
2,
119
3,14
0
5,
930
6,86
8
5,
290
9,25
2
5,
246
13,1
72
1,79
7
3,
913
Mal
e'
62,8
97
28
,072
2,61
0
2,
274
1,25
7
1,
532
2,37
7
1,
702
1,49
2
84
7
652
73
6
323
99
6
415
84
9
2,27
2
1,
427
1,94
9
3,
603
1,06
7
3,
886
1,43
7
1,
122
Atol
ls (In
clud
es A
dmin
istra
tive
and
Non-
Ad
min
istra
tive
Islan
ds)
103,
501
10
,691
6,59
2
10
,409
5,
457
4,78
3
7,
833
3,88
7
3,
966
3,17
7
2,
067
3,14
0
52
0
2,32
2
1,
704
2,28
7
3,
656
5,43
5
3,
338
5,64
2
4,
178
9,28
1
36
0
2,77
6
No
rth
Thila
dhun
mat
hi (H
A)7,
298
55
5
5,
952
425
11
13
20
7
11
12
5
2
4
5
2
7
13
18
5
11
8
15
14
18
3
Sout
h Th
iladh
unm
athi
(HDh
)10
,158
506
217
8,
874
102
32
35
18
22
9
6
10
1
7
1
7
16
15
8
23
10
22
17
200
No
rth
Mila
dhun
mad
ulu
(Sh)
6,76
4
398
27
70
5
5,10
9
89
136
12
43
9
2
6
4
3
4
5
12
6
5
12
5
18
5
14
9
Sout
h M
iladh
unm
adul
u (N
)5,
877
69
9
40
24
52
4,37
9
26
7
14
17
2
10
2
3
2
8
2
4
17
9
4
14
9
13
12
12
1
Nort
h M
aalh
osm
adul
u (R
)7,
975
49
8
36
39
44
38
6,
923
72
40
11
6
1
4
10
1
4
21
5
6
17
7
9
18
16
5
Sout
h M
aalh
osm
adul
u (B
)4,
759
61
5
30
22
17
17
14
9
3,60
7
32
8
6
9
6
9
3
3
11
20
7
27
5
28
15
11
3
Faad
hipp
olhu
(Lh)
4,34
6
456
29
23
25
90
116
24
3,43
6
17
7
7
-
1
2
2
8
9
3
20
7
15
14
35
Mal
e' A
toll
(K)
5,52
9
1,32
5
69
11
2
28
31
65
40
126
3,
020
37
23
24
36
25
85
49
37
45
71
33
75
26
147
No
rth
Ari A
toll
(AA)
2,98
4
591
32
36
10
6
12
23
13
6
1,91
3
80
3
5
14
5
4
11
11
11
6
15
17
160
So
uth
Ari A
toll
(ADh
)4,
214
73
7
27
26
9
12
23
10
4
7
51
2,94
9
9
58
9
21
22
17
7
14
12
27
27
13
6
Felid
hu A
toll
(V)
737
194
7
5
3
3
7
3
1
3
-
6
44
3
19
4
2
6
9
1
3
1
4
2
11
M
ulak
atho
lhu
(M)
2,48
5
367
17
24
5
8
6
6
7
4
3
3
7
1,
886
8
21
20
17
6
8
8
13
12
29
No
rth
Nila
ndhe
Ato
ll (F
)2,
182
35
8
9
7
1
1
8
5
9
8
1
6
2
38
1,
566
43
7
8
7
23
2
5
4
64
So
uth
Nila
ndhe
Ato
ll (D
h)2,
824
47
9
26
7
4
7
17
3
4
2
4
7
3
66
43
2,02
1
24
20
4
10
7
16
8
42
Ko
lhum
adul
u (T
h)4,
738
86
5
14
16
1
9
11
6
6
8
2
2
4
66
3
21
3,
331
128
8
13
1
13
8
202
Ha
dhdh
unm
athi
(L)
6,05
1
431
11
17
11
16
11
11
12
4
1
7
1
82
7
6
64
5,
054
21
32
4
20
11
217
No
rth
Huva
dhu
Atol
l (GA
)4,
149
36
8
9
9
4
8
1
3
4
14
1
2
1
5
-
5
7
13
2,99
0
34
9
54
81
12
209
So
uth
Huva
dhu
Atol
l (GD
h)5,
825
37
1
17
10
7
8
8
8
12
8
1
6
2
8
5
12
11
12
11
1
4,81
7
50
108
13
22
0
Gnav
iyan
i (Gn
)4,
414
22
6
4
13
3
2
4
4
4
6
2
6
-
2
2
4
6
8
17
30
3,82
3
13
4
18
96
Ad
du (S
)10
,192
652
19
15
11
14
14
11
8
11
17
5
-
8
3
9
7
19
72
137
12
6
8,65
0
10
7
277
No
t Sta
ted
74
11
6
2
-
2
2
-
3
-
-
2
-
3
-
4
2
6
3
7
1
5
-
15

42Migration: CENSUS 2014
National Bureau of Statistics
Repu
blic
Mal
e'HA
HDh
ShN
RB
LhK
AAAD
hV
MF
DhTh
LGA
GDh
GnS
(1)
(2)
(3)
(4)
(5)
(6)
(7)
(8)
(9)
(10)
(11)
(12)
(13)
(14)
(15)
(16)
(17)
(18)
(19)
(20)
(21)
(22)
(23)
(24)
Both
Sex
es
Repu
blic
338,
434
126,
080
13,7
37
18
,708
12,6
16
11
,313
15,5
44
10
,207
8,70
9
17
,481
6,91
3
10
,200
1,59
6
4,
953
4,23
5
6,
045
9,30
0
12
,210
8,86
7
11
,817
8,03
5
19
,518
350
Mal
e'
129,
381
123,
324
526
39
1
349
369
47
7
313
24
3
402
18
7
242
55
19
6
108
21
2
441
29
2
285
29
9
170
35
3
147
Atol
ls (In
clude
s Adm
inist
rativ
e an
d No
n-
Adm
inist
rativ
e Isl
ands
)20
9,05
3
2,
756
13
,211
18,3
17
12
,267
10,9
44
15
,067
9,89
4
8,46
6
17
,079
6,72
6
9,
958
1,
541
4,75
7
4,
127
5,83
3
8,
859
11,9
18
8,
582
11,5
18
7,
865
19,1
65
20
3
Nort
h Th
iladh
unm
athi
(HA)
13,3
92
136
13,0
94
43
11
4
13
4
-
41
4
14
1
-
4
3
3
3
-
4
-
1
9
Sout
h Th
iladh
unm
athi
(HDh
)18
,531
16
3
31
18,0
89
50
19
39
13
3
53
15
23
-
1
3
7
-
2
1
2
2
3
12
Nort
h M
iladh
unm
adul
u (S
h)12
,266
86
3
12
12,0
57
9
46
4
4
19
2
7
-
-
1
3
1
-
-
-
1
1
10
Sout
h M
iladh
unm
adul
u (N
)11
,072
14
9
11
12
7
10
,768
8
7
32
16
4
8
-
4
-
2
1
5
1
1
9
17
10
Nort
h M
aalh
osm
adul
u (R
)15
,088
14
7
17
5
12
15
14,7
87
15
36
16
7
8
-
2
1
2
-
2
3
1
5
2
5
Sout
h M
aalh
osm
adul
u (B
)10
,012
12
5
3
1
40
3
29
9,
741
4
21
1
6
5
1
-
4
-
6
1
2
4
4
11
Faad
hipp
olhu
(Lh)
8,73
4
116
7
59
8
72
37
17
8,34
7
41
5
-
-
-
-
1
5
4
3
4
3
1
4
Mal
e' A
toll (
K)17
,630
51
8
8
34
43
19
53
29
9
16
,704
11
8
-
11
17
27
6
8
9
13
13
39
51
Nort
h Ar
i Ato
ll (AA
)6,
838
10
1
7
13
8
5
4
6
3
15
6,63
6
16
1
3
1
1
-
2
1
5
6
2
2
Sout
h Ar
i Ato
ll (AD
h)10
,039
11
7
4
6
7
3
12
24
6
8
15
9,
804
5
2
4
3
1
3
2
3
-
4
6
Felid
hu A
toll (
V)1,
669
50
2
4
3
-
3
-
-
8
5
2
1,52
6
1
-
58
3
1
-
1
-
-
2
Mul
akat
holh
u (M
)4,
817
49
3
2
-
-
5
-
4
4
5
10
3
4,71
8
1
2
2
3
1
1
1
-
3
Nort
h Ni
land
he A
toll (
F)4,
164
46
2
1
-
-
-
3
-
6
-
-
-
-
4,
072
11
-
17
3
1
1
-
1
Sout
h Ni
land
he A
toll (
Dh)
5,87
2
104
8
4
4
5
5
6
-
7
1
6
-
2
2
5,
690
11
3
2
3
3
4
2
Kolh
umad
ulu
(Th)
8,96
8
100
1
2
3
3
3
-
3
18
1
6
-
-
-
-
8,
806
7
1
5
1
2
6
Hadh
dhun
mat
hi (L
)11
,992
94
3
4
5
1
3
1
4
12
1
12
-
2
1
6
16
11,7
86
4
9
4
8
16
Nort
h Hu
vadh
u At
oll (
GA)
8,77
2
129
1
13
1
2
10
3
2
7
-
-
-
2
-
1
1
56
8,
472
37
18
14
3
Sout
h Hu
vadh
u At
oll (
GDh)
11,6
95
114
3
6
1
-
6
2
3
11
1
2
-
-
20
3
-
2
64
11
,405
19
10
23
Gnav
iyani
(Gn)
7,98
4
87
1
2
1
6
3
13
5
29
6
15
-
-
-
6
-
3
6
11
7,75
3
31
6
Addu
(S)
19,5
18
325
2
5
6
10
1
6
1
43
6
11
-
8
-
3
3
5
8
10
22
19
,022
21
TAB
LE M
G 4
: R
ESID
ENT
MA
LDIV
IAN
PO
PULA
TIO
N B
Y P
LAC
E O
F EN
UM
ERA
TIO
N C
RO
SS C
LASS
IFIE
D B
Y P
LAC
E O
F U
SUA
L R
ESID
ENC
E, S
EX A
ND
LO
CA
LITY
(ATO
LL),
2014
Plac
e of
Enu
mer
atio
nPl
ace
of u
sual
resid
ence
Not
st
ated
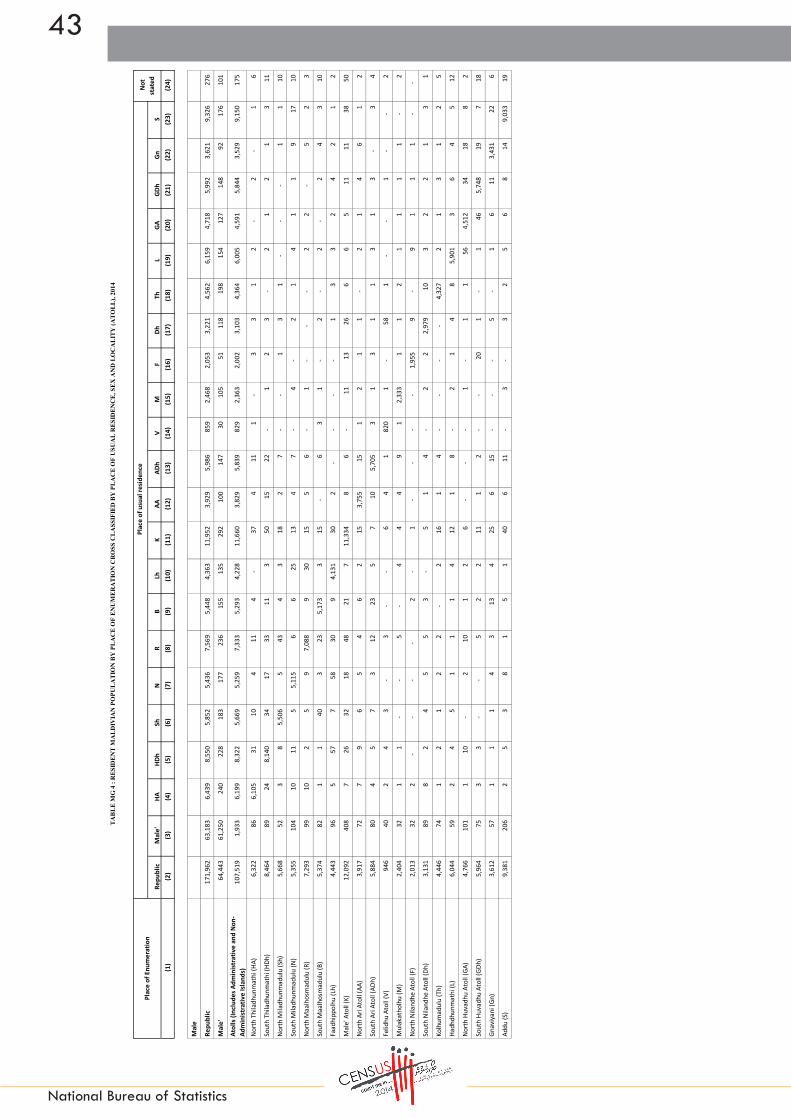
43
National Bureau of Statistics
Repu
blic
Mal
e'HA
HDh
ShN
RB
LhK
AAAD
hV
MF
DhTh
LGA
GDh
GnS
(1)
(2)
(3)
(4)
(5)
(6)
(7)
(8)
(9)
(10)
(11)
(12)
(13)
(14)
(15)
(16)
(17)
(18)
(19)
(20)
(21)
(22)
(23)
(24)
TAB
LE M
G 4
: R
ESID
ENT
MA
LDIV
IAN
PO
PULA
TIO
N B
Y P
LAC
E O
F EN
UM
ERA
TIO
N C
RO
SS C
LASS
IFIE
D B
Y P
LAC
E O
F U
SUA
L R
ESID
ENC
E, S
EX A
ND
LO
CA
LITY
(ATO
LL),
2014
Plac
e of
Enu
mer
atio
nPl
ace
of u
sual
resid
ence
Not
st
ated
Mal
e
Repu
blic
171,
962
63
,183
6,
439
8,
550
5,
852
5,
436
7,
569
5,
448
4,
363
11
,952
3,92
9
5,98
6
859
2,
468
2,
053
3,
221
4,
562
6,
159
4,
718
5,
992
3,
621
9,
326
27
6
Mal
e'
64,4
43
61,2
50
240
228
183
177
236
155
135
292
100
147
30
10
5
51
11
8
19
8
15
4
12
7
14
8
92
17
6
10
1
Atol
ls (In
clud
es A
dmin
istra
tive
and
Non-
Ad
min
istra
tive
Islan
ds)
107,
519
1,
933
6,19
9
8,32
2
5,66
9
5,25
9
7,33
3
5,29
3
4,22
8
11,6
60
3,
829
5,
839
82
9
2,36
3
2,00
2
3,10
3
4,36
4
6,00
5
4,59
1
5,84
4
3,52
9
9,15
0
175
Nort
h Th
iladh
unm
athi
(HA)
6,32
2
86
6,10
5
31
10
4
11
4
-
37
4
11
1
-
3
3
1
2
-
2
-
1
6
Sout
h Th
iladh
unm
athi
(HDh
)8,
464
89
24
8,
140
34
17
33
11
3
50
15
22
-
1
2
3
-
2
1
2
1
3
11
Nort
h M
iladh
unm
adul
u (S
h)5,
668
52
3
8
5,
506
5
43
4
3
18
2
7
-
-
1
3
1
-
-
-
1
1
10
Sout
h M
iladh
unm
adul
u (N
)5,
355
104
10
11
5
5,11
5
6
6
25
13
4
7
-
4
-
2
1
4
1
1
9
17
10
Nort
h M
aalh
osm
adul
u (R
)7,
293
99
10
2
5
9
7,08
8
9
30
15
5
6
-
1
-
-
-
2
2
-
5
2
3
Sout
h M
aalh
osm
adul
u (B
)5,
374
82
1
1
40
3
23
5,17
3
3
15
-
6
3
1
-
2
-
2
-
2
4
3
10
Faad
hipp
olhu
(Lh)
4,44
3
96
5
57
7
58
30
9
4,
131
30
2
-
-
-
-
1
3
3
2
4
2
1
2
Mal
e' A
toll
(K)
12,0
92
408
7
26
32
18
48
21
7
11,3
34
8
6
-
11
13
26
6
6
5
11
11
38
50
Nort
h Ar
i Ato
ll (A
A)3,
917
72
7
9
6
5
4
6
2
15
3,
755
15
1
2
1
1
-
2
1
4
6
1
2
Sout
h Ar
i Ato
ll (A
Dh)
5,88
4
80
4
5
7
3
12
23
5
7
10
5,
705
3
1
3
1
1
3
1
3
-
3
4
Felid
hu A
toll
(V)
946
40
2
4
3
-
3
-
-
6
4
1
82
0
1
-
58
1
-
-
1
-
-
2
Mul
akat
holh
u (M
)2,
404
32
1
1
-
-
5
-
4
4
4
9
1
2,33
3
1
1
2
1
1
1
1
-
2
Nort
h Ni
land
he A
toll
(F)
2,01
3
32
2
-
-
-
-
2
-
1
-
-
-
-
1,
955
9
-
9
1
1
1
-
-
Sout
h Ni
land
he A
toll
(Dh)
3,13
1
89
8
2
4
5
5
3
-
5
1
4
-
2
2
2,97
9
10
3
2
2
1
3
1
Kolh
umad
ulu
(Th)
4,44
6
74
1
2
1
2
2
-
2
16
1
4
-
-
-
-
4,32
7
2
1
3
1
2
5
Hadh
dhun
mat
hi (L
)6,
044
59
2
4
5
1
1
1
4
12
1
8
-
2
1
4
8
5,
901
3
6
4
5
12
Nort
h Hu
vadh
u At
oll (
GA)
4,76
6
10
1
1
10
-
2
10
1
2
6
-
-
-
1
-
1
1
56
4,
512
34
18
8
2
Sout
h Hu
vadh
u At
oll (
GDh)
5,96
4
75
3
3
-
-
5
2
2
11
1
2
-
-
20
1
-
1
46
5,74
8
19
7
18
Gnav
iyan
i (Gn
)3,
612
57
1
1
1
4
3
13
4
25
6
15
-
-
-
5
-
1
6
11
3,43
1
22
6
Addu
(S)
9,38
1
20
6
2
5
3
8
1
5
1
40
6
11
-
3
-
3
2
5
6
8
14
9,03
3
19
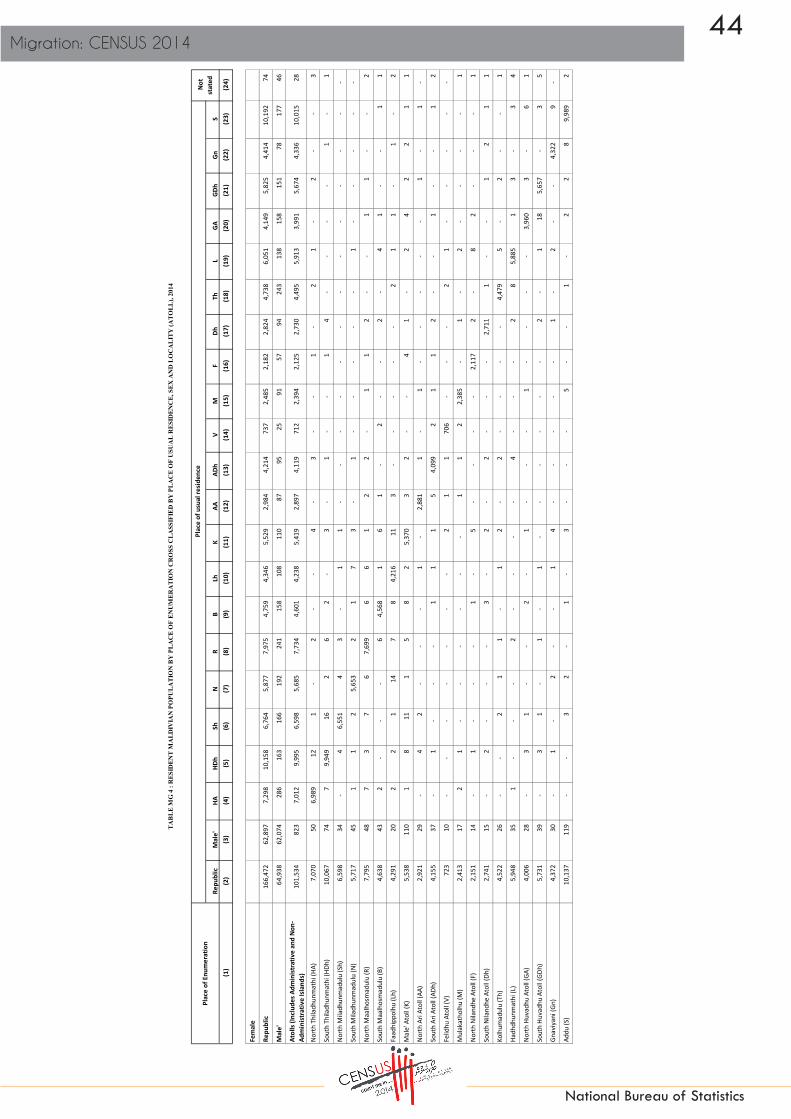
44Migration: CENSUS 2014
National Bureau of Statistics
Repu
blic
Mal
e'HA
HDh
ShN
RB
LhK
AAAD
hV
MF
DhTh
LGA
GDh
GnS
(1)
(2)
(3)
(4)
(5)
(6)
(7)
(8)
(9)
(10)
(11)
(12)
(13)
(14)
(15)
(16)
(17)
(18)
(19)
(20)
(21)
(22)
(23)
(24)
TAB
LE M
G 4
: R
ESID
ENT
MA
LDIV
IAN
PO
PULA
TIO
N B
Y P
LAC
E O
F EN
UM
ERA
TIO
N C
RO
SS C
LASS
IFIE
D B
Y P
LAC
E O
F U
SUA
L R
ESID
ENC
E, S
EX A
ND
LO
CA
LITY
(ATO
LL),
2014
Plac
e of
Enu
mer
atio
nPl
ace
of u
sual
resid
ence
Not
st
ated
Fem
ale
Repu
blic
166,
472
62
,897
7,
298
10
,158
6,76
4
5,87
7
7,97
5
4,75
9
4,34
6
5,52
9
2,98
4
4,21
4
737
2,
485
2,
182
2,
824
4,
738
6,
051
4,
149
5,
825
4,
414
10
,192
74
Mal
e'
64,9
38
62,0
74
286
163
166
192
241
158
108
110
87
95
25
91
57
94
24
3
13
8
15
8
15
1
78
17
7
46
Atol
ls (In
clud
es A
dmin
istra
tive
and
Non-
Ad
min
istra
tive
Islan
ds)
101,
534
82
3
7,01
2
9,99
5
6,59
8
5,68
5
7,73
4
4,60
1
4,23
8
5,41
9
2,89
7
4,11
9
712
2,
394
2,
125
2,
730
4,
495
5,
913
3,
991
5,
674
4,
336
10
,015
28
Nort
h Th
iladh
unm
athi
(HA)
7,07
0
50
6,98
9
12
1
-
2
-
-
4
-
3
-
-
1
-
2
1
-
2
-
-
3
Sout
h Th
iladh
unm
athi
(HDh
)10
,067
74
7
9,
949
16
2
6
2
-
3
-
1
-
-
1
4
-
-
-
-
1
-
1
Nort
h M
iladh
unm
adul
u (S
h)6,
598
34
-
4
6,55
1
4
3
-
1
1
-
-
-
-
-
-
-
-
-
-
-
-
-
Sout
h M
iladh
unm
adul
u (N
)5,
717
45
1
1
2
5,65
3
2
1
7
3
-
1
-
-
-
-
-
1
-
-
-
-
-
Nort
h M
aalh
osm
adul
u (R
)7,
795
48
7
3
7
6
7,
699
6
6
1
2
2
-
1
1
2
-
-
1
1
-
-
2
Sout
h M
aalh
osm
adul
u (B
)4,
638
43
2
-
-
-
6
4,
568
1
6
1
-
2
-
-
2
-
4
1
-
-
1
1
Faad
hipp
olhu
(Lh)
4,29
1
20
2
2
1
14
7
8
4,
216
11
3
-
-
-
-
-
2
1
1
-
1
-
2
Mal
e' A
toll
(K)
5,53
8
11
0
1
8
11
1
5
8
2
5,
370
3
2
-
-
4
1
-
2
4
2
2
1
1
Nort
h Ar
i Ato
ll (A
A)2,
921
29
-
4
2
-
-
-
1
-
2,
881
1
-
1
-
-
-
-
-
1
-
1
-
Sout
h Ar
i Ato
ll (A
Dh)
4,15
5
37
-
1
-
-
-
1
1
1
5
4,
099
2
1
1
2
-
-
1
-
-
1
2
Felid
hu A
toll
(V)
723
10
-
-
-
-
-
-
-
2
1
1
70
6
-
-
-
2
1
-
-
-
-
-
Mul
akat
holh
u (M
)2,
413
17
2
1
-
-
-
-
-
-
1
1
2
2,
385
-
1
-
2
-
-
-
-
1
Nort
h Ni
land
he A
toll
(F)
2,15
1
14
-
1
-
-
-
1
-
5
-
-
-
-
2,
117
2
-
8
2
-
-
-
1
Sout
h Ni
land
he A
toll
(Dh)
2,74
1
15
-
2
-
-
-
3
-
2
-
2
-
-
-
2,
711
1
-
-
1
2
1
1
Kolh
umad
ulu
(Th)
4,52
2
26
-
-
2
1
1
-
1
2
-
2
-
-
-
-
4,47
9
5
-
2
-
-
1
Hadh
dhun
mat
hi (L
)5,
948
35
1
-
-
-
2
-
-
-
-
4
-
-
-
2
8
5,
885
1
3
-
3
4
Nort
h Hu
vadh
u At
oll (
GA)
4,00
6
28
-
3
1
-
-
2
-
1
-
-
-
1
-
-
-
-
3,
960
3
-
6
1
Sout
h Hu
vadh
u At
oll (
GDh)
5,73
1
39
-
3
1
-
1
-
1
-
-
-
-
-
-
2
-
1
18
5,65
7
-
3
5
Gnav
iyan
i (Gn
)4,
372
30
-
1
-
2
-
-
1
4
-
-
-
-
-
1
-
2
-
-
4,
322
9
-
Addu
(S)
10,1
37
119
-
-
3
2
-
1
-
3
-
-
-
5
-
-
1
-
2
2
8
9,
989
2
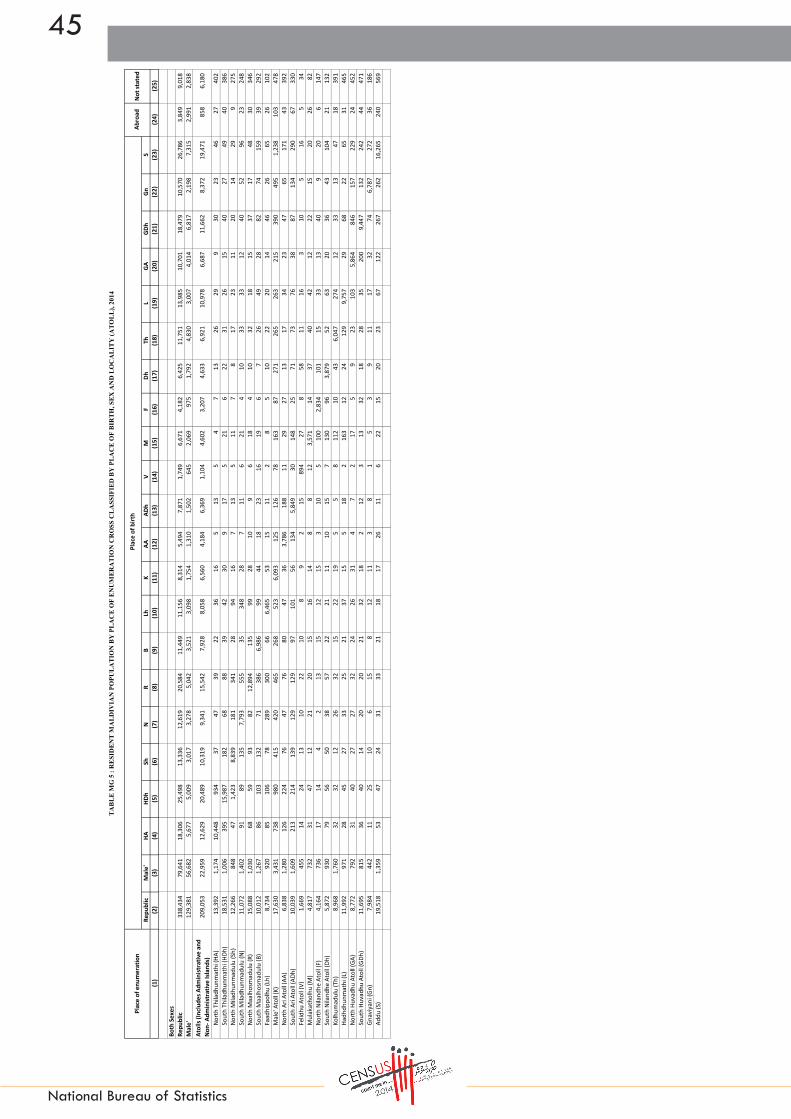
45
National Bureau of Statistics
Repu
blic
Mal
e'HA
HDh
ShN
RB
LhK
AAAD
hV
MF
DhTh
LGA
GDh
GnS
(1)
(2)
(3)
(4)
(5)
(6)
(7)
(8)
(9)
(10)
(11)
(12)
(13)
(14)
(15)
(16)
(17)
(18)
(19)
(20)
(21)
(22)
(23)
(24)
(25)
Both
Sex
es
Repu
blic
338,
434
79,6
41
18
,306
25,4
98
13
,336
12,6
19
20
,584
11,4
49
11
,156
8,31
4
5,
494
7,87
1
1,
749
6,67
1
4,
182
6,42
5
11
,751
13,9
85
10
,701
18,4
79
10
,570
26,7
86
3,
849
9,01
8
M
ale'
12
9,38
1
56
,682
5,67
7
5,00
9
3,01
7
3,27
8
5,04
2
3,52
1
3,09
8
1,75
4
1,
310
1,50
2
64
5
2,06
9
97
5
1,79
2
4,
830
3,
007
4,
014
6,
817
2,
198
7,
315
2,
991
2,83
8
At
olls
(Inclu
des A
dmin
istra
tive
and
Non-
Adm
inist
rativ
e Isl
ands
)20
9,05
3
22
,959
12,6
29
20
,489
10,3
19
9,
341
15
,542
7,92
8
8,05
8
6,56
0
4,
184
6,36
9
1,
104
4,60
2
3,
207
4,63
3
6,
921
10
,978
6,68
7
11,6
62
8,
372
19
,471
858
6,
180
Nort
h Th
iladh
unm
athi
(HA)
13,3
92
1,
174
10
,448
934
37
47
39
22
36
16
5
13
5
4
7
13
26
29
9
30
23
46
27
40
2
Sout
h Th
iladh
unm
athi
(HDh
)18
,531
1,00
6
395
15,9
87
18
2
68
88
39
42
30
9
17
5
21
6
22
31
26
15
40
27
49
40
386
No
rth
Mila
dhun
mad
ulu
(Sh)
12,2
66
84
8
47
1,42
3
8,83
9
181
341
28
94
16
7
13
5
11
7
8
17
23
11
20
14
29
9
27
5
Sout
h M
iladh
unm
adul
u (N
)11
,072
1,40
2
91
89
135
7,79
3
555
35
34
8
28
7
11
6
21
4
10
33
33
12
40
52
96
23
248
No
rth
Maa
lhos
mad
ulu
(R)
15,0
88
1,
030
68
59
93
82
12
,894
135
99
28
10
9
6
18
4
10
32
18
15
37
17
48
30
34
6
Sout
h M
aalh
osm
adul
u (B
)10
,012
1,26
7
86
10
3
13
2
71
386
6,98
6
99
44
18
23
16
19
6
7
26
49
28
82
74
159
39
29
2
Faad
hipp
olhu
(Lh)
8,73
4
920
85
10
6
78
289
300
66
6,
465
53
15
11
2
8
5
10
22
20
14
46
26
65
26
102
M
ale'
Ato
ll (K)
17,6
30
3,
431
73
8
98
0
41
5
42
0
46
5
26
8
52
3
6,
093
125
12
6
78
16
3
87
27
1
265
263
215
390
495
1,23
8
103
47
8
Nort
h Ar
i Ato
ll (AA
)6,
838
1,
280
12
6
22
4
76
47
76
80
47
36
3,
786
188
11
29
27
13
17
34
23
47
65
17
1
43
392
So
uth
Ari A
toll (
ADh)
10,0
39
1,
609
21
3
21
4
13
9
12
9
12
9
97
101
56
13
4
5,84
9
30
148
25
71
73
76
38
87
134
290
67
33
0
Felid
hu A
toll (
V)1,
669
45
5
14
24
13
10
22
10
8
9
2
15
894
27
8
58
11
16
3
10
5
16
5
34
M
ulak
atho
lhu
(M)
4,81
7
732
31
47
12
21
20
15
16
14
8
8
12
3,57
1
14
37
40
42
12
22
15
20
26
82
Nort
h Ni
land
he A
toll (
F)4,
164
73
6
17
14
4
2
13
15
12
15
3
10
5
100
2,
834
101
15
33
13
40
9
20
6
147
So
uth
Nila
ndhe
Ato
ll (Dh
)5,
872
93
0
79
56
50
38
57
22
21
11
10
15
7
130
96
3,87
9
52
63
20
36
43
10
4
21
132
Ko
lhum
adul
u (T
h)8,
968
1,
760
32
32
12
26
32
15
22
19
5
5
8
11
2
10
43
6,04
7
274
12
33
13
47
18
39
1
Hadh
dhun
mat
hi (L
)11
,992
971
28
45
27
33
25
21
37
15
5
18
2
16
3
12
24
129
9,75
7
29
68
22
65
31
46
5
Nort
h Hu
vadh
u At
oll (
GA)
8,77
2
792
31
40
27
27
32
24
26
31
4
7
2
17
5
9
23
103
5,86
4
846
157
229
24
45
2
Sout
h Hu
vadh
u At
oll (
GDh)
11,6
95
81
5
36
40
14
20
20
21
32
18
2
12
3
13
32
18
28
35
200
9,44
7
132
242
44
47
1
Gnav
iyan
i (Gn
)7,
984
44
2
11
25
10
6
15
8
12
11
3
8
1
5
3
9
11
17
32
74
6,
787
27
2
36
186
Ad
du (S
)19
,518
1,35
9
53
47
24
31
33
21
18
17
26
11
6
22
15
20
23
67
12
2
26
7
26
2
16
,265
240
56
9
TAB
LE M
G 5
: R
ESID
ENT
MA
LDIV
IAN
PO
PULA
TIO
N B
Y P
LAC
E O
F EN
UM
ERA
TIO
N C
RO
SS C
LASS
IFIE
D B
Y P
LAC
E O
F B
IRTH
, SEX
AN
D L
OC
ALI
TY (A
TOLL
), 20
14
Plac
e of
enu
mer
atio
n P
lace
of b
irth
Abro
adNo
t sta
ted
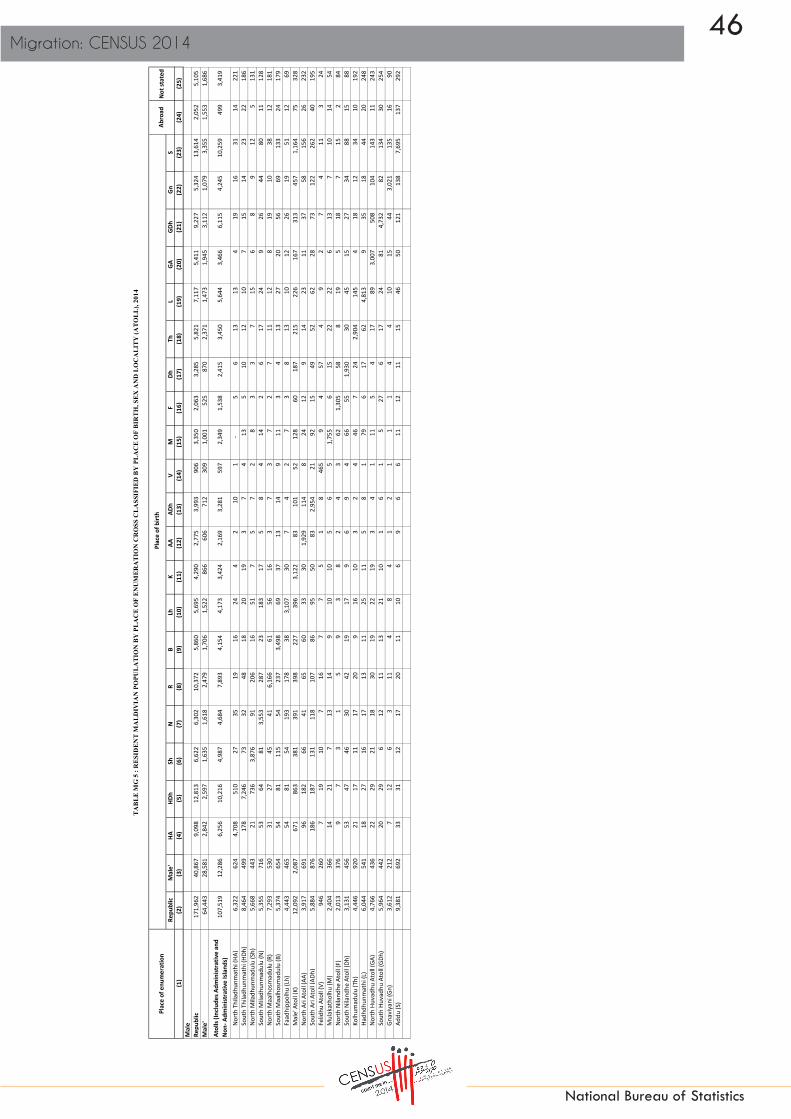
46Migration: CENSUS 2014
National Bureau of Statistics
Repu
blic
Mal
e'HA
HDh
ShN
RB
LhK
AAAD
hV
MF
DhTh
LGA
GDh
GnS
(1)
(2)
(3)
(4)
(5)
(6)
(7)
(8)
(9)
(10)
(11)
(12)
(13)
(14)
(15)
(16)
(17)
(18)
(19)
(20)
(21)
(22)
(23)
(24)
(25)
TAB
LE M
G 5
: R
ESID
ENT
MA
LDIV
IAN
PO
PULA
TIO
N B
Y P
LAC
E O
F EN
UM
ERA
TIO
N C
RO
SS C
LASS
IFIE
D B
Y P
LAC
E O
F B
IRTH
, SEX
AN
D L
OC
ALI
TY (A
TOLL
), 20
14
Plac
e of
enu
mer
atio
n P
lace
of b
irth
Abro
adNo
t sta
ted
Mal
e
Repu
blic
171,
962
40,8
67
9,
098
12
,813
6,62
2
6,30
2
10,3
72
5,
860
5,
695
4,
290
2,77
5
3,
993
906
3,
350
2,06
3
3,
285
5,82
1
7,11
7
5,41
1
9,22
7
5,32
4
13,6
14
2,
052
5,10
5
M
ale'
64
,443
28,5
81
2,
842
2,
597
1,
635
1,
618
2,
479
1,
706
1,
522
86
6
606
71
2
309
1,
001
525
87
0
2,37
1
1,47
3
1,94
5
3,11
2
1,07
9
3,35
5
1,55
3
1,
686
Atol
ls (In
clude
s Adm
inist
rativ
e an
d No
n- A
dmin
istra
tive
Islan
ds)
107,
519
12,2
86
6,
256
10
,216
4,98
7
4,68
4
7,89
3
4,15
4
4,17
3
3,42
4
2,
169
3,28
1
59
7
2,34
9
1,
538
2,41
5
3,
450
5,
644
3,
466
6,
115
4,
245
10
,259
499
3,
419
Nort
h Th
iladh
unm
athi
(HA)
6,32
2
624
4,70
8
510
27
35
19
16
24
4
2
10
1
-
5
6
13
13
4
19
16
31
14
221
So
uth
Thila
dhun
mat
hi (H
Dh)
8,46
4
499
178
7,24
6
73
32
48
18
20
19
3
7
4
13
5
10
12
10
7
15
14
23
22
18
6
Nort
h M
iladh
unm
adul
u (S
h)5,
668
44
3
21
736
3,87
6
91
20
6
16
51
7
5
7
2
8
3
3
7
15
6
8
9
12
5
131
So
uth
Mila
dhun
mad
ulu
(N)
5,35
5
716
53
64
81
3,
553
28
7
23
183
17
5
8
4
14
2
6
17
24
9
26
44
80
11
128
No
rth
Maa
lhos
mad
ulu
(R)
7,29
3
530
31
27
45
41
6,16
6
61
56
16
3
7
3
7
2
7
11
12
8
19
10
38
12
181
So
uth
Maa
lhos
mad
ulu
(B)
5,37
4
654
54
81
115
54
23
7
3,
498
69
37
13
14
9
11
3
4
13
27
20
56
69
133
24
17
9
Faad
hipp
olhu
(Lh)
4,44
3
465
54
81
54
19
3
17
8
38
3,10
7
30
7
4
2
7
3
8
13
10
12
26
19
51
12
69
Mal
e' A
toll (
K)12
,092
2,08
7
671
863
381
391
398
227
396
3,12
2
83
101
52
128
60
187
21
5
22
6
16
7
31
3
45
7
1,
164
75
328
No
rth
Ari A
toll (
AA)
3,91
7
691
96
18
2
66
41
65
60
33
30
1,
929
114
8
24
12
9
14
23
11
37
58
156
26
23
2
Sout
h Ar
i Ato
ll (AD
h)5,
884
87
6
18
6
18
7
13
1
11
8
10
7
86
95
50
83
2,
954
21
92
15
49
52
62
28
73
122
262
40
19
5
Felid
hu A
toll (
V)94
6
26
0
7
19
10
7
16
7
7
5
1
8
465
9
4
57
4
9
2
7
4
11
3
24
M
ulak
atho
lhu
(M)
2,40
4
366
14
21
7
13
14
9
10
10
5
6
5
1,75
5
6
15
22
22
6
13
7
10
14
54
No
rth
Nila
ndhe
Ato
ll (F)
2,01
3
376
9
7
3
1
5
9
3
8
2
4
3
62
1,30
5
58
8
19
5
18
7
15
2
84
So
uth
Nila
ndhe
Ato
ll (Dh
)3,
131
45
6
53
47
46
30
42
19
17
9
6
9
4
66
55
1,
930
30
45
15
27
34
88
15
88
Kolh
umad
ulu
(Th)
4,44
6
920
21
17
11
17
20
9
16
10
3
2
4
46
7
24
2,90
4
145
4
18
12
34
10
192
Ha
dhdh
unm
athi
(L)
6,04
4
541
18
27
16
17
13
11
25
11
5
8
1
79
6
17
62
4,81
3
9
35
18
44
20
248
No
rth
Huva
dhu
Atol
l (GA
)4,
766
43
6
22
29
21
18
30
19
22
19
3
4
1
11
5
4
17
89
3,00
7
508
104
143
11
24
3
Sout
h Hu
vadh
u At
oll (
GDh)
5,96
4
442
20
29
6
12
11
13
21
10
1
6
1
5
27
6
17
24
81
4,
732
82
134
30
25
4
Gnav
iyan
i (Gn
)3,
612
21
2
7
12
6
3
11
4
8
4
1
2
1
1
1
4
4
10
15
44
3,02
1
135
16
90
Addu
(S)
9,38
1
692
33
31
12
17
20
11
10
6
9
6
6
11
12
11
15
46
50
121
138
7,69
5
137
29
2
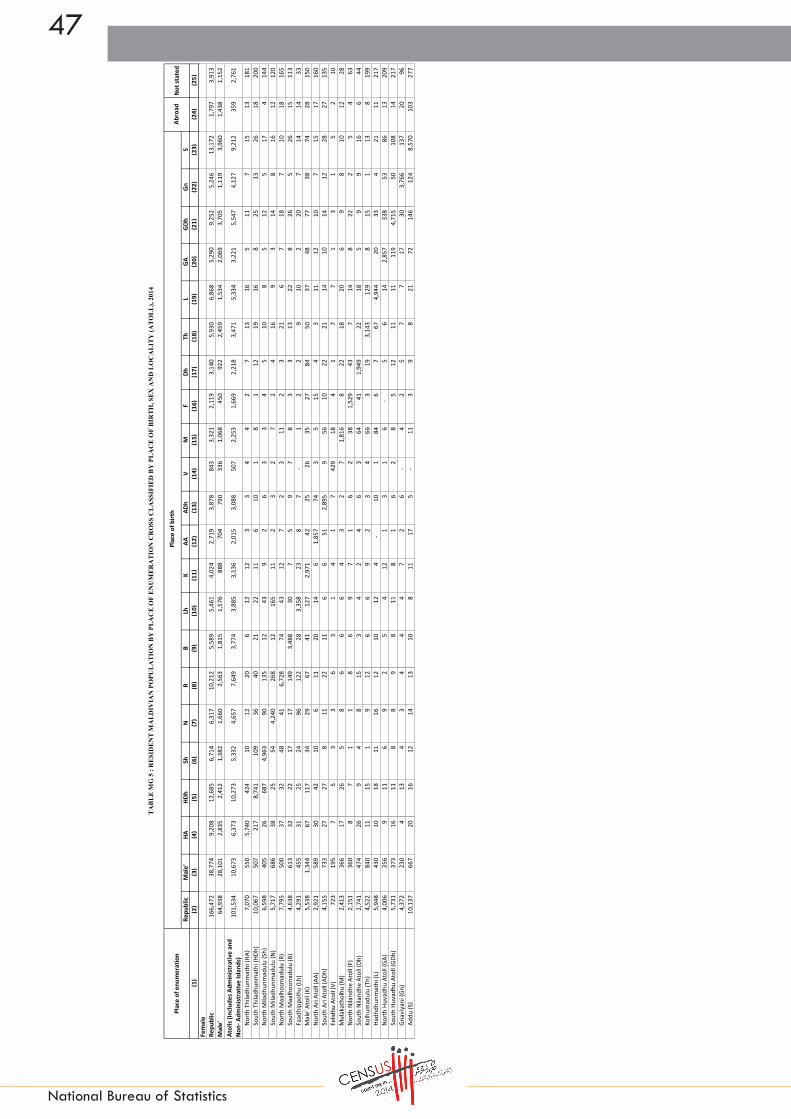
47
National Bureau of Statistics
Repu
blic
Mal
e'HA
HDh
ShN
RB
LhK
AAAD
hV
MF
DhTh
LGA
GDh
GnS
(1)
(2)
(3)
(4)
(5)
(6)
(7)
(8)
(9)
(10)
(11)
(12)
(13)
(14)
(15)
(16)
(17)
(18)
(19)
(20)
(21)
(22)
(23)
(24)
(25)
TAB
LE M
G 5
: R
ESID
ENT
MA
LDIV
IAN
PO
PULA
TIO
N B
Y P
LAC
E O
F EN
UM
ERA
TIO
N C
RO
SS C
LASS
IFIE
D B
Y P
LAC
E O
F B
IRTH
, SEX
AN
D L
OC
ALI
TY (A
TOLL
), 20
14
Plac
e of
enu
mer
atio
n P
lace
of b
irth
Abro
adNo
t sta
ted
Fem
ale
Re
publ
ic16
6,47
2
38
,774
9,20
8
12,6
85
6,
714
6,
317
10
,212
5,58
9
5,46
1
4,02
4
2,
719
3,87
8
84
3
3,32
1
2,
119
3,14
0
5,
930
6,
868
5,
290
9,
252
5,
246
13
,172
1,79
7
3,
913
Mal
e'
64,9
38
28
,101
2,83
5
2,41
2
1,38
2
1,66
0
2,56
3
1,81
5
1,57
6
888
70
4
790
33
6
1,06
8
45
0
922
2,
459
1,
534
2,
069
3,
705
1,
119
3,
960
1,
438
1,15
2
At
olls
(Inclu
des A
dmin
istra
tive
and
Non-
Adm
inist
rativ
e Isl
ands
)10
1,53
4
10
,673
6,37
3
10,2
73
5,
332
4,
657
7,
649
3,
774
3,
885
3,
136
2,01
5
3,
088
507
2,
253
1,66
9
2,
218
3,47
1
5,33
4
3,22
1
5,54
7
4,12
7
9,21
2
359
2,
761
Nort
h Th
iladh
unm
athi
(HA)
7,07
0
550
5,74
0
424
10
12
20
6
12
12
3
3
4
4
2
7
13
16
5
11
7
15
13
181
So
uth
Thila
dhun
mat
hi (H
Dh)
10,0
67
50
7
21
7
8,
741
10
9
36
40
21
22
11
6
10
1
8
1
12
19
16
8
25
13
26
18
20
0
Nort
h M
iladh
unm
adul
u (S
h)6,
598
40
5
26
687
4,96
3
90
13
5
12
43
9
2
6
3
3
4
5
10
8
5
12
5
17
4
14
4
Sout
h M
iladh
unm
adul
u (N
)5,
717
68
6
38
25
54
4,24
0
268
12
16
5
11
2
3
2
7
2
4
16
9
3
14
8
16
12
12
0
Nort
h M
aalh
osm
adul
u (R
)7,
795
50
0
37
32
48
41
6,
728
74
43
12
7
2
3
11
2
3
21
6
7
18
7
10
18
16
5
Sout
h M
aalh
osm
adul
u (B
)4,
638
61
3
32
22
17
17
14
9
3,
488
30
7
5
9
7
8
3
3
13
22
8
26
5
26
15
113
Fa
adhi
ppol
hu (L
h)4,
291
45
5
31
25
24
96
12
2
28
3,35
8
23
8
7
-
1
2
2
9
10
2
20
7
14
14
33
Mal
e' A
toll (
K)5,
538
1,
344
67
117
34
29
67
41
127
2,97
1
42
25
26
35
27
84
50
37
48
77
38
74
28
15
0
Nort
h Ar
i Ato
ll (AA
)2,
921
58
9
30
42
10
6
11
20
14
6
1,85
7
74
3
5
15
4
3
11
12
10
7
15
17
160
So
uth
Ari A
toll (
ADh)
4,15
5
733
27
27
8
11
22
11
6
6
51
2,
895
9
56
10
22
21
14
10
14
12
28
27
135
Fe
lidhu
Ato
ll (V)
723
195
7
5
3
3
6
3
1
4
1
7
429
18
4
1
7
7
1
3
1
5
2
10
Mul
akat
holh
u (M
)2,
413
36
6
17
26
5
8
6
6
6
4
3
2
7
1,81
6
8
22
18
20
6
9
8
10
12
28
No
rth
Nila
ndhe
Ato
ll (F)
2,15
1
360
8
7
1
1
8
6
9
7
1
6
2
38
1,52
9
43
7
14
8
22
2
5
4
63
So
uth
Nila
ndhe
Ato
ll (Dh
)2,
741
47
4
26
9
4
8
15
3
4
2
4
6
3
64
41
1,94
9
22
18
5
9
9
16
6
44
Ko
lhum
adul
u (T
h)4,
522
84
0
11
15
1
9
12
6
6
9
2
3
4
66
3
19
3,14
3
129
8
15
1
13
8
19
9
Hadh
dhun
mat
hi (L
)5,
948
43
0
10
18
11
16
12
10
12
4
-
10
1
84
6
7
67
4,94
4
20
33
4
21
11
217
No
rth
Huva
dhu
Atol
l (GA
)4,
006
35
6
9
11
6
9
2
5
4
12
1
3
1
6
-
5
6
14
2,85
7
338
53
86
13
20
9
Sout
h Hu
vadh
u At
oll (
GDh)
5,73
1
373
16
11
8
8
9
8
11
8
1
6
2
8
5
12
11
11
119
4,71
5
50
10
8
14
217
Gn
aviy
ani (
Gn)
4,37
2
230
4
13
4
3
4
4
4
7
2
6
-
4
2
5
7
7
17
30
3,
766
13
7
20
96
Ad
du (S
)10
,137
667
20
16
12
14
13
10
8
11
17
5
-
11
3
9
8
21
72
14
6
12
4
8,
570
10
3
277
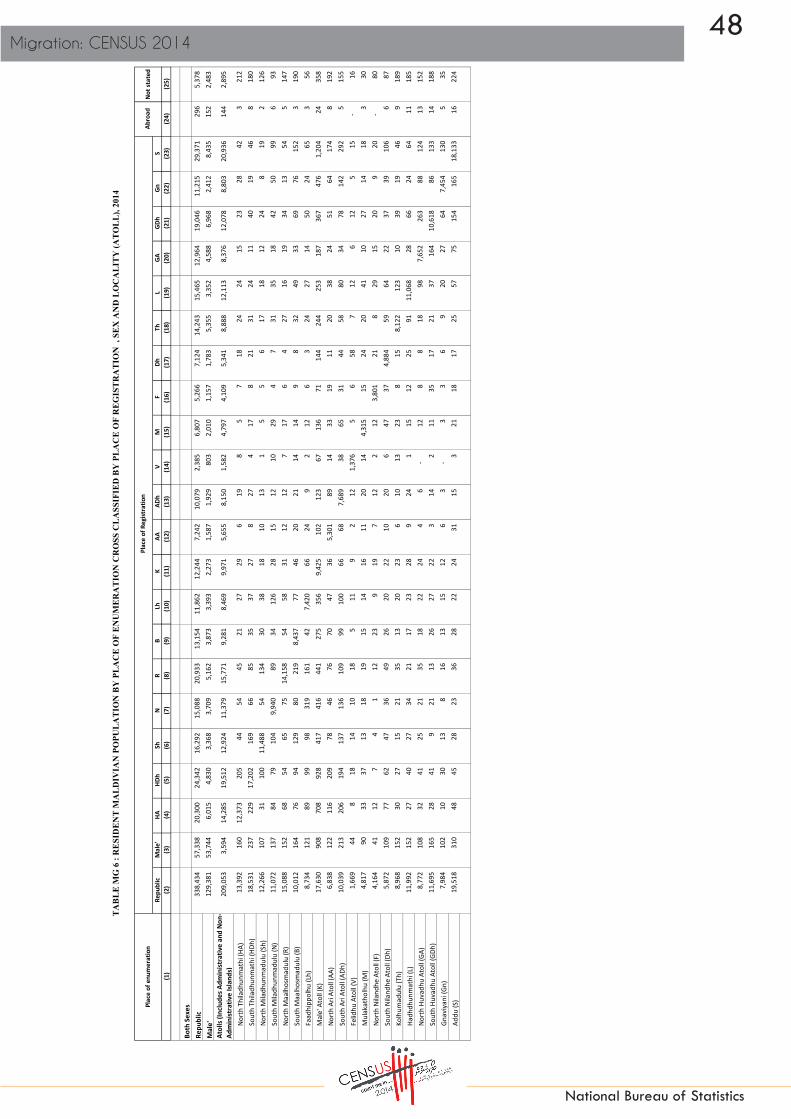
48Migration: CENSUS 2014
National Bureau of Statistics
Repu
blic
Mal
e'HA
HDh
ShN
RB
LhK
AAAD
hV
MF
DhTh
LGA
GDh
GnS
(1)
(2)
(3)
(4)
(5)
(6)
(7)
(8)
(9)
(10)
(11)
(12)
(13)
(14)
(15)
(16)
(17)
(18)
(19)
(20)
(21)
(22)
(23)
(24)
(25)
Both
Sex
es
Repu
blic
338,
434
57
,338
20
,300
24
,342
16
,292
15
,088
20
,933
13
,154
11
,862
12
,244
7,
242
10,0
79
2,38
5
6,
807
5,26
6
7,
124
14,2
43
15,4
65
12,9
64
19,0
46
11,2
15
29,3
71
296
5,
378
Mal
e'
129,
381
53
,744
6,
015
4,83
0
3,
368
3,70
9
5,
162
3,87
3
3,
393
2,27
3
1,
587
1,92
9
80
3
2,01
0
1,
157
1,78
3
5,
355
3,35
2
4,
588
6,96
8
2,
412
8,43
5
15
2
2,48
3
At
olls
(Inclu
des A
dmin
istra
tive
and
Non-
Ad
min
istra
tive
Islan
ds)
209,
053
3,
594
14,2
85
19,5
12
12,9
24
11,3
79
15,7
71
9,28
1
8,
469
9,97
1
5,
655
8,15
0
1,
582
4,79
7
4,
109
5,34
1
8,
888
12,1
13
8,37
6
12
,078
8,
803
20,9
36
144
2,
895
Nort
h Th
iladh
unm
athi
(HA)
13,3
92
160
12
,373
20
5
44
54
45
21
27
29
6
19
8
5
7
18
24
24
15
23
28
42
3
21
2
Sout
h Th
iladh
unm
athi
(HDh
)18
,531
23
7
229
17
,202
16
9
66
85
35
37
27
8
27
4
17
8
21
31
24
11
40
19
46
8
180
Nort
h M
iladh
unm
adul
u (S
h)12
,266
10
7
31
100
11
,488
54
13
4
30
38
18
10
13
1
5
5
6
17
18
12
24
8
19
2
126
Sout
h M
iladh
unm
adul
u (N
)11
,072
13
7
84
79
104
9,
940
89
34
126
28
15
12
10
29
4
7
31
35
18
42
50
99
6
93
Nort
h M
aalh
osm
adul
u (R
)15
,088
15
2
68
54
65
75
14,1
58
54
58
31
12
12
7
17
6
4
27
16
19
34
13
54
5
147
Sout
h M
aalh
osm
adul
u (B
)10
,012
16
4
76
94
129
80
21
9
8,43
7
77
46
20
21
14
14
9
8
32
49
33
69
76
15
2
3
19
0
Faad
hipp
olhu
(Lh)
8,73
4
12
1
89
99
98
319
16
1
42
7,42
0
66
24
9
2
12
6
3
24
27
14
50
24
65
3
56
Mal
e' A
toll (
K)17
,630
90
8
708
92
8
417
41
6
441
27
5
356
9,
425
102
12
3
67
136
71
14
4
244
25
3
187
36
7
476
1,
204
24
358
Nort
h Ar
i Ato
ll (AA
)6,
838
122
11
6
209
78
46
76
70
47
36
5,
301
89
14
33
19
11
20
38
24
51
64
174
8
192
Sout
h Ar
i Ato
ll (AD
h)10
,039
21
3
206
19
4
137
13
6
109
99
10
0
66
68
7,68
9
38
65
31
44
58
80
34
78
14
2
292
5
155
Felid
hu A
toll (
V)1,
669
44
8
18
14
10
18
5
11
9
2
12
1,37
6
5
6
58
7
12
6
12
5
15
-
16
Mul
akat
holh
u (M
)4,
817
90
33
37
13
18
19
15
14
16
11
20
14
4,31
5
15
24
20
41
10
27
14
18
3
30
Nort
h Ni
land
he A
toll (
F)4,
164
41
12
7
4
1
12
23
9
19
7
12
2
12
3,80
1
21
8
29
15
20
9
20
-
80
Sout
h Ni
land
he A
toll (
Dh)
5,87
2
10
9
77
62
47
36
49
26
20
22
10
20
6
47
37
4,
884
59
64
22
37
39
106
6
87
Kolh
umad
ulu
(Th)
8,96
8
15
2
30
27
15
21
35
13
20
23
6
10
13
23
8
15
8,12
2
12
3
10
39
19
46
9
18
9
Hadh
dhun
mat
hi (L
)11
,992
15
2
27
40
27
34
21
17
23
28
9
24
1
15
12
25
91
11,0
68
28
66
24
64
11
185
Nort
h Hu
vadh
u At
oll (
GA)
8,77
2
10
8
32
41
25
21
35
18
22
24
4
6
-
12
8
8
18
98
7,65
2
26
3
88
124
13
15
2
Sout
h Hu
vadh
u At
oll (
GDh)
11,6
95
165
28
41
9
21
13
26
27
22
3
14
2
11
35
17
21
37
164
10
,618
86
13
3
14
188
Gnav
iyan
i (Gn
)7,
984
102
10
30
13
8
16
13
15
12
6
3
-
3
3
6
9
20
27
64
7,45
4
13
0
5
35
Addu
(S)
19,5
18
310
48
45
28
23
36
28
22
24
31
15
3
21
18
17
25
57
75
154
16
5
18,1
33
16
224
TA
BL
E M
G 6
: R
ESI
DE
NT
MA
LD
IVIA
N P
OPU
LA
TIO
N B
Y P
LA
CE
OF
EN
UM
ER
AT
ION
CR
OSS
CL
ASS
IFIE
D B
Y P
LA
CE
OF
RE
GIS
TR
AT
ION
, S
EX
AN
D L
OC
AL
ITY
(AT
OL
L),
2014
Plac
e of
enu
mer
atio
n P
lace
of R
egist
ratio
nAb
road
Not s
tate
d

49
National Bureau of Statistics
Repu
blic
Mal
e'HA
HDh
ShN
RB
LhK
AAAD
hV
MF
DhTh
LGA
GDh
GnS
(1)
(2)
(3)
(4)
(5)
(6)
(7)
(8)
(9)
(10)
(11)
(12)
(13)
(14)
(15)
(16)
(17)
(18)
(19)
(20)
(21)
(22)
(23)
(24)
(25)
TA
BL
E M
G 6
: R
ESI
DE
NT
MA
LD
IVIA
N P
OPU
LA
TIO
N B
Y P
LA
CE
OF
EN
UM
ER
AT
ION
CR
OSS
CL
ASS
IFIE
D B
Y P
LA
CE
OF
RE
GIS
TR
AT
ION
, S
EX
AN
D L
OC
AL
ITY
(AT
OL
L),
2014
Plac
e of
enu
mer
atio
n P
lace
of R
egist
ratio
nAb
road
Not s
tate
d
Mal
e
Repu
blic
171,
962
29
,808
10
,083
12
,139
8,
112
7,47
0
10
,532
6,
641
6,01
4
6,
295
3,69
6
5,
109
1,22
9
3,
455
2,61
0
3,
608
7,08
7
7,
855
6,59
0
9,
596
5,60
5
14
,917
17
7
3,33
4
Mal
e'
64,4
43
27,3
83
2,97
7
2,
461
1,80
7
1,
786
2,55
2
1,
824
1,67
0
1,
101
738
90
7
386
99
0
604
86
4
2,62
4
1,
635
2,20
0
3,
262
1,19
0
3,
921
76
1,48
5
At
olls
(Inclu
des A
dmin
istra
tive
and
Non-
Ad
min
istra
tive
Islan
ds)
107,
519
2,
425
7,10
6
9,
678
6,30
5
5,
684
7,98
0
4,
817
4,34
4
5,
194
2,95
8
4,
202
843
2,
465
2,00
6
2,
744
4,46
3
6,
220
4,39
0
6,
334
4,41
5
10
,996
10
1
1,84
9
Nort
h Th
iladh
unm
athi
(HA)
6,32
2
10
4
5,68
4
14
5
29
38
25
11
20
13
3
11
1
2
6
9
11
10
8
15
20
29
2
12
6
Sout
h Th
iladh
unm
athi
(HDh
)8,
464
131
10
2
7,82
4
70
33
48
15
17
16
3
11
3
9
7
8
14
14
5
14
8
20
4
88
Nort
h M
iladh
unm
adul
u (S
h)5,
668
70
15
58
5,22
3
29
96
12
20
6
8
7
1
2
1
3
9
11
4
11
5
10
-
67
Sout
h M
iladh
unm
adul
u (N
)5,
355
90
50
57
71
4,60
6
59
22
66
15
9
10
5
18
3
4
15
23
10
28
45
86
4
59
Nort
h M
aalh
osm
adul
u (R
)7,
293
94
33
24
33
35
6,78
3
24
37
17
4
8
2
6
2
2
12
12
11
16
10
41
3
84
Sout
h M
aalh
osm
adul
u (B
)5,
374
100
47
75
10
8
64
151
4,
218
57
34
13
11
8
8
5
4
16
25
23
45
70
127
3
162
Faad
hipp
olhu
(Lh)
4,44
3
86
56
78
64
21
0
108
27
3,
563
35
11
6
2
10
4
3
14
14
11
28
16
53
-
44
Mal
e' A
toll (
K)12
,092
75
2
658
84
2
382
38
6
385
23
4
308
4,
856
74
104
43
12
0
50
132
21
0
214
16
0
313
44
4
1,13
0
22
27
3
Nort
h Ar
i Ato
ll (AA
)3,
917
61
93
175
68
39
64
58
36
30
2,
730
67
11
26
10
8
17
22
14
41
56
15
9
6
12
6
Sout
h Ar
i Ato
ll (AD
h)5,
884
149
18
5
173
12
6
124
95
86
91
59
52
3,
895
23
56
23
36
46
65
23
69
128
26
4
4
11
2
Felid
hu A
toll (
V)94
6
33
5
15
10
5
16
2
8
7
1
7
72
3
1
2
57
4
8
4
8
4
11
-
15
Mul
akat
holh
u (M
)2,
404
50
11
17
8
11
11
8
9
9
7
11
8
2,13
4
6
11
11
22
4
17
6
10
1
22
Nort
h Ni
land
he A
toll (
F)2,
013
27
5
5
3
-
5
12
3
10
4
6
1
7
1,
803
11
6
16
7
8
6
16
-
52
Sout
h Ni
land
he A
toll (
Dh)
3,13
1
64
53
53
42
28
36
20
16
15
8
13
3
27
21
2,
413
35
45
15
26
30
93
4
71
Kolh
umad
ulu
(Th)
4,44
6
87
19
14
11
13
18
8
13
16
3
5
5
11
6
7
3,
958
66
5
20
14
35
7
105
Hadh
dhun
mat
hi (L
)6,
044
109
19
24
15
17
10
11
18
18
9
10
-
7
9
16
45
5,48
4
13
32
18
50
7
103
Nort
h Hu
vadh
u At
oll (
GA)
4,76
6
73
19
29
19
17
33
12
19
14
3
2
-
7
6
4
12
89
3,94
5
20
5
76
89
8
85
Sout
h Hu
vadh
u At
oll (
GDh)
5,96
4
10
8
16
26
3
11
8
14
16
13
1
7
1
4
28
4
11
25
79
5,
324
55
84
14
112
Gnav
iyan
i (Gn
)3,
612
60
6
14
8
4
11
8
12
2
2
2
-
-
1
3
2
13
13
39
3,31
9
71
4
18
Addu
(S)
9,38
1
17
7
30
30
12
14
18
15
15
9
13
9
3
10
13
9
15
42
36
75
85
8,61
8
8
125

50Migration: CENSUS 2014
National Bureau of Statistics
Repu
blic
Mal
e'HA
HDh
ShN
RB
LhK
AAAD
hV
MF
DhTh
LGA
GDh
GnS
(1)
(2)
(3)
(4)
(5)
(6)
(7)
(8)
(9)
(10)
(11)
(12)
(13)
(14)
(15)
(16)
(17)
(18)
(19)
(20)
(21)
(22)
(23)
(24)
(25)
TA
BL
E M
G 6
: R
ESI
DE
NT
MA
LD
IVIA
N P
OPU
LA
TIO
N B
Y P
LA
CE
OF
EN
UM
ER
AT
ION
CR
OSS
CL
ASS
IFIE
D B
Y P
LA
CE
OF
RE
GIS
TR
AT
ION
, S
EX
AN
D L
OC
AL
ITY
(AT
OL
L),
2014
Plac
e of
enu
mer
atio
n P
lace
of R
egist
ratio
nAb
road
Not s
tate
d
Fem
ale
Repu
blic
166,
472
27
,530
10
,217
12
,203
8,
180
7,61
8
10
,401
6,
513
5,84
8
5,
949
3,54
6
4,
970
1,15
6
3,
352
2,65
6
3,
516
7,15
6
7,
610
6,37
4
9,
450
5,61
0
14
,454
11
9
2,04
4
Mal
e'
64,9
38
26,3
61
3,03
8
2,
369
1,56
1
1,
923
2,61
0
2,
049
1,72
3
1,
172
849
1,
022
417
1,
020
553
91
9
2,73
1
1,
717
2,38
8
3,
706
1,22
2
4,
514
76
998
Atol
ls (In
clude
s Adm
inist
rativ
e an
d No
n-
Adm
inist
rativ
e Isl
ands
)10
1,53
4
1,16
9
7,
179
9,83
4
6,
619
5,69
5
7,
791
4,46
4
4,
125
4,77
7
2,
697
3,94
8
73
9
2,33
2
2,
103
2,59
7
4,
425
5,89
3
3,
986
5,74
4
4,
388
9,94
0
43
1,
046
Nort
h Th
iladh
unm
athi
(HA)
7,07
0
56
6,
689
60
15
16
20
10
7
16
3
8
7
3
1
9
13
14
7
8
8
13
1
86
Sout
h Th
iladh
unm
athi
(HDh
)10
,067
10
6
127
9,
378
99
33
37
20
20
11
5
16
1
8
1
13
17
10
6
26
11
26
4
92
Nort
h M
iladh
unm
adul
u (S
h)6,
598
37
16
42
6,26
5
25
38
18
18
12
2
6
-
3
4
3
8
7
8
13
3
9
2
59
Sout
h M
iladh
unm
adul
u (N
)5,
717
47
34
22
33
5,33
4
30
12
60
13
6
2
5
11
1
3
16
12
8
14
5
13
2
34
Nort
h M
aalh
osm
adul
u (R
)7,
795
58
35
30
32
40
7,37
5
30
21
14
8
4
5
11
4
2
15
4
8
18
3
13
2
63
Sout
h M
aalh
osm
adul
u (B
)4,
638
64
29
19
21
16
68
4,21
9
20
12
7
10
6
6
4
4
16
24
10
24
6
25
-
28
Faad
hipp
olhu
(Lh)
4,29
1
35
33
21
34
10
9
53
15
3,85
7
31
13
3
-
2
2
-
10
13
3
22
8
12
3
12
Mal
e' A
toll (
K)5,
538
156
50
86
35
30
56
41
48
4,
569
28
19
24
16
21
12
34
39
27
54
32
74
2
85
Nort
h Ar
i Ato
ll (AA
)2,
921
61
23
34
10
7
12
12
11
6
2,57
1
22
3
7
9
3
3
16
10
10
8
15
2
66
Sout
h Ar
i Ato
ll (AD
h)4,
155
64
21
21
11
12
14
13
9
7
16
3,79
4
15
9
8
8
12
15
11
9
14
28
1
43
Felid
hu A
toll (
V)72
3
11
3
3
4
5
2
3
3
2
1
5
653
4
4
1
3
4
2
4
1
4
-
1
Mul
akat
holh
u (M
)2,
413
40
22
20
5
7
8
7
5
7
4
9
6
2,
181
9
13
9
19
6
10
8
8
2
8
Nort
h Ni
land
he A
toll (
F)2,
151
14
7
2
1
1
7
11
6
9
3
6
1
5
1,
998
10
2
13
8
12
3
4
-
28
Sout
h Ni
land
he A
toll (
Dh)
2,74
1
45
24
9
5
8
13
6
4
7
2
7
3
20
16
2,47
1
24
19
7
11
9
13
2
16
Kolh
umad
ulu
(Th)
4,52
2
65
11
13
4
8
17
5
7
7
3
5
8
12
2
8
4,
164
57
5
19
5
11
2
84
Hadh
dhun
mat
hi (L
)5,
948
43
8
16
12
17
11
6
5
10
-
14
1
8
3
9
46
5,
584
15
34
6
14
4
82
Nort
h Hu
vadh
u At
oll (
GA)
4,00
6
35
13
12
6
4
2
6
3
10
1
4
-
5
2
4
6
9
3,
707
58
12
35
5
67
Sout
h Hu
vadh
u At
oll (
GDh)
5,73
1
57
12
15
6
10
5
12
11
9
2
7
1
7
7
13
10
12
85
5,
294
31
49
-
76
Gnav
iyan
i (Gn
)4,
372
42
4
16
5
4
5
5
3
10
4
1
-
3
2
3
7
7
14
25
4,
135
59
1
17
Addu
(S)
10,1
37
133
18
15
16
9
18
13
7
15
18
6
-
11
5
8
10
15
39
79
80
9,51
5
8
99

51
National Bureau of Statistics
Repu
blic
Mal
e'HA
HDh
ShN
RB
LhK
AAAD
hV
MF
DhTh
LGA
GDh
GnS
(1)
(2)
(3)
(4)
(5)
(6)
(7)
(8)
(9)
(10)
(11)
(12)
(13)
(14)
(15)
(16)
(17)
(18)
(19)
(20)
(21)
(22)
(23)
(24)
(25)
Both
Sex
es
Repu
blic
344,
023
60
,011
20,4
47
24
,445
16,3
59
15
,194
21,0
62
13
,265
12,0
16
12
,325
7,26
9
10,1
48
2,
414
6,
845
5,
308
7,
180
14
,346
15,5
33
13
,217
19,2
74
11
,381
30,1
83
31
4
5,
487
Mal
e'
133,
412
56
,360
6,09
6
4,88
2
3,39
8
3,74
9
5,21
8
3,93
9
3,46
8
2,29
8
1,60
3
1,96
2
814
2,03
9
1,17
8
1,81
5
5,43
6
3,37
7
4,69
7
7,12
9
2,46
4
8,75
9
159
2,57
2
At
olls
(Inclu
des A
dmin
istra
tive
and
Non-
Adm
inist
rativ
e Isl
ands
)21
0,61
1
3,65
1
14,3
51
19
,563
12,9
61
11
,445
15,8
44
9,
326
8,
548
10
,027
5,66
6
8,18
6
1,60
0
4,80
6
4,13
0
5,36
5
8,91
0
12,1
56
8,
520
12
,145
8,91
7
21,4
24
15
5
2,
915
Nort
h Th
iladh
unm
athi
(HA)
13,4
57
16
1
12
,435
205
45
54
45
21
27
29
6
19
8
5
7
18
24
24
15
23
28
43
3
212
So
uth
Thila
dhun
mat
hi (H
Dh)
18,5
86
23
9
22
9
17
,252
169
66
85
35
37
27
8
27
4
17
8
21
31
24
11
40
19
46
9
18
2
Nort
h M
iladh
unm
adul
u (S
h)12
,302
108
31
100
11,5
22
54
13
4
30
38
18
11
13
1
5
5
6
17
18
12
24
8
19
2
126
So
uth
Mila
dhun
mad
ulu
(N)
11,1
45
13
7
84
80
10
6
10
,003
90
35
127
28
15
12
10
29
4
7
31
35
18
42
50
99
7
96
No
rth
Maa
lhos
mad
ulu
(R)
15,1
60
15
3
68
54
65
75
14
,228
54
58
31
12
12
7
18
6
4
27
16
19
34
13
54
5
14
7
Sout
h M
aalh
osm
adul
u (B
)10
,058
165
77
94
129
80
219
8,47
8
77
46
20
21
14
14
9
8
32
49
33
69
77
153
3
191
Fa
adhi
ppol
hu (L
h)8,
825
127
89
99
98
321
161
43
7,49
8
67
24
9
2
12
6
3
24
27
14
51
24
65
4
57
M
ale'
Ato
ll (K
)17
,721
933
710
928
417
416
441
275
356
9,48
0
102
125
67
138
71
144
244
253
189
368
476
1,20
4
25
359
No
rth
Ari A
toll
(AA)
6,85
2
12
3
11
6
20
9
78
46
77
70
47
36
5,
311
89
14
33
19
11
20
39
24
51
64
17
5
8
19
2
Sout
h Ar
i Ato
ll (A
Dh)
10,0
84
21
7
20
6
19
4
13
7
13
6
10
9
99
10
0
66
68
7,
723
38
65
31
44
58
80
34
78
14
9
29
2
5
15
5
Felid
hu A
toll
(V)
1,69
0
46
8
18
14
10
18
6
11
9
2
12
1,
394
5
6
58
7
12
6
12
5
15
-
16
Mul
akat
holh
u (M
)4,
823
90
33
37
13
18
19
15
14
16
11
20
14
4,32
1
15
24
20
41
10
27
14
18
3
30
No
rth
Nila
ndhe
Ato
ll (F
)4,
185
41
12
7
4
1
12
23
9
19
7
12
2
12
3,82
2
21
8
29
15
20
9
20
-
80
Sout
h Ni
land
he A
toll
(Dh)
5,89
6
10
9
77
62
47
36
49
26
20
22
10
20
6
47
37
4,90
8
59
64
22
37
39
106
6
87
Ko
lhum
adul
u (T
h)8,
990
152
30
27
15
21
35
13
20
23
6
10
13
23
8
15
8,14
4
123
10
39
19
46
9
189
Ha
dhdh
unm
athi
(L)
12,0
38
15
3
27
40
27
35
21
17
23
28
9
24
1
15
12
25
91
11
,110
28
66
24
64
11
187
No
rth
Huva
dhu
Atol
l (GA
)8,
915
109
32
41
25
21
35
18
22
24
4
6
-
12
8
8
18
98
7,79
0
265
88
124
14
153
So
uth
Huva
dhu
Atol
l (GD
h)11
,761
165
28
41
9
21
13
26
27
22
3
14
2
11
35
17
21
37
16
5
10
,681
87
133
14
189
Gn
aviy
ani (
Gn)
8,09
5
10
3
10
30
13
8
16
14
15
12
6
3
-
3
3
6
9
20
27
64
7,55
9
131
8
35
Ad
du (S
)20
,028
320
49
45
28
23
37
28
22
24
31
15
3
21
18
17
25
57
78
15
4
16
5
18
,617
19
232
TA
BL
E M
G 7
: T
OT
AL
MA
LD
IVIA
N P
OPU
LA
TIO
N B
Y P
LA
CE
OF
EN
UM
ER
AT
ION
CR
OSS
CL
ASS
IFIE
D B
Y P
LA
CE
OF
RE
GIS
TR
AT
ION
, SE
X A
ND
LO
CA
LIT
Y (A
TO
LL
), 20
14
Plac
e of
enu
mer
atio
n P
lace
of R
egist
ratio
nAb
road
Not s
tate
d

52Migration: CENSUS 2014
National Bureau of Statistics
Repu
blic
Mal
e'HA
HDh
ShN
RB
LhK
AAAD
hV
MF
DhTh
LGA
GDh
GnS
(1)
(2)
(3)
(4)
(5)
(6)
(7)
(8)
(9)
(10)
(11)
(12)
(13)
(14)
(15)
(16)
(17)
(18)
(19)
(20)
(21)
(22)
(23)
(24)
(25)
TA
BL
E M
G 7
: T
OT
AL
MA
LD
IVIA
N P
OPU
LA
TIO
N B
Y P
LA
CE
OF
EN
UM
ER
AT
ION
CR
OSS
CL
ASS
IFIE
D B
Y P
LA
CE
OF
RE
GIS
TR
AT
ION
, SE
X A
ND
LO
CA
LIT
Y (A
TO
LL
), 20
14
Plac
e of
enu
mer
atio
n P
lace
of R
egist
ratio
nAb
road
Not s
tate
d
Mal
e
Repu
blic
174,
666
31
,028
10,1
61
12
,203
8,15
0
7,52
7
10,6
09
6,
702
6,
095
6,
332
3,
711
5,
140
1,
240
3,
475
2,
635
3,
638
7,
145
7,
891
6,
716
9,
703
5,
696
15
,297
190
3,38
2
M
ale'
66
,328
28,5
75
3,
016
2,
490
1,
824
1,
804
2,
578
1,
861
1,
714
1,
110
74
5
92
5
39
2
1,
004
61
8
88
1
2,
668
1,
648
2,
255
3,
335
1,
214
4,
072
79
1,
520
Atol
ls (In
clude
s Adm
inist
rativ
e an
d No
n- A
dmin
istra
tive
Islan
ds)
108,
338
2,
453
7,
145
9,
713
6,
326
5,
723
8,
031
4,
841
4,
381
5,
222
2,
966
4,
215
84
8
2,
471
2,
017
2,
757
4,
477
6,
243
4,
461
6,
368
4,
482
11
,225
111
1,86
2
Nort
h Th
iladh
unm
athi
(HA)
6,35
9
10
5
5,
719
14
5
30
38
25
11
20
13
3
11
1
2
6
9
11
10
8
15
20
29
2
12
6
Sout
h Th
iladh
unm
athi
(HDh
)8,
501
131
102
7,85
8
70
33
48
15
17
16
3
11
3
9
7
8
14
14
5
14
8
20
5
90
Nort
h M
iladh
unm
adul
u (S
h)5,
688
71
15
58
5,24
2
29
96
12
20
6
8
7
1
2
1
3
9
11
4
11
5
10
-
67
Sout
h M
iladh
unm
adul
u (N
)5,
398
90
50
58
72
4,64
4
60
22
67
15
9
10
5
18
3
4
15
23
10
28
45
86
5
59
No
rth
Maa
lhos
mad
ulu
(R)
7,34
3
95
33
24
33
35
6,
831
24
37
17
4
8
2
7
2
2
12
12
11
16
10
41
3
84
Sout
h M
aalh
osm
adul
u (B
)5,
402
101
48
75
108
64
151
4,24
2
57
34
13
11
8
8
5
4
16
25
23
45
71
127
3
163
Fa
adhi
ppol
hu (L
h)4,
486
89
56
78
64
211
108
27
3,59
9
36
11
6
2
10
4
3
14
14
11
29
16
53
-
45
Mal
e' A
toll
(K)
12,1
41
76
5
66
0
84
2
38
2
38
6
38
5
23
4
30
8
4,
883
74
10
5
43
12
2
50
13
2
21
0
21
4
16
2
31
3
44
4
1,
130
23
27
4
Nort
h Ar
i Ato
ll (A
A)3,
927
61
93
175
68
39
65
58
36
30
2,73
8
67
11
26
10
8
17
22
14
41
56
16
0
6
12
6
Sout
h Ar
i Ato
ll (A
Dh)
5,90
4
15
0
18
5
17
3
12
6
12
4
95
86
91
59
52
3,
907
23
56
23
36
46
65
23
69
13
5
26
4
4
11
2
Felid
hu A
toll
(V)
952
34
5
15
10
5
16
2
8
7
1
7
728
1
2
57
4
8
4
8
4
11
-
15
M
ulak
atho
lhu
(M)
2,40
7
50
11
17
8
11
11
8
9
9
7
11
8
2,
137
6
11
11
22
4
17
6
10
1
22
No
rth
Nila
ndhe
Ato
ll (F
)2,
024
27
5
5
3
-
5
12
3
10
4
6
1
7
1,
814
11
6
16
7
8
6
16
-
52
So
uth
Nila
ndhe
Ato
ll (D
h)3,
144
64
53
53
42
28
36
20
16
15
8
13
3
27
21
2,42
6
35
45
15
26
30
93
4
71
Ko
lhum
adul
u (T
h)4,
460
87
19
14
11
13
18
8
13
16
3
5
5
11
6
7
3,97
2
66
5
20
14
35
7
10
5
Hadh
dhun
mat
hi (L
)6,
069
109
19
24
15
17
10
11
18
18
9
10
-
7
9
16
45
5,
507
13
32
18
50
7
10
5
Nort
h Hu
vadh
u At
oll (
GA)
4,83
5
73
19
29
19
17
33
12
19
14
3
2
-
7
6
4
12
89
4,01
2
205
76
89
9
86
So
uth
Huva
dhu
Atol
l (GD
h)5,
998
108
16
26
3
11
8
14
16
13
1
7
1
4
28
4
11
25
79
5,
357
56
84
14
11
2
Gnav
iyan
i (Gn
)3,
673
60
6
14
8
4
11
8
12
2
2
2
-
-
1
3
2
13
13
39
3,37
7
71
7
18
Ad
du (S
)9,
627
183
31
30
12
14
19
15
15
9
13
9
3
10
13
9
15
42
38
75
85
8,84
6
11
130
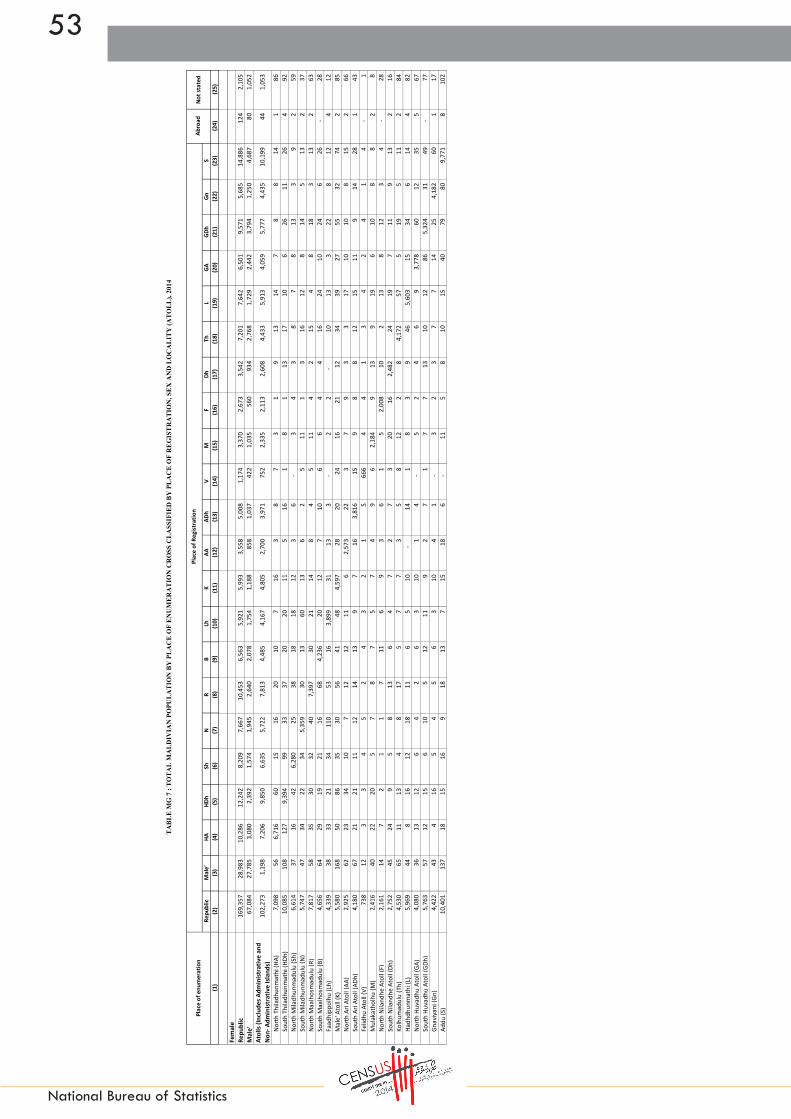
53
National Bureau of Statistics
Repu
blic
Mal
e'HA
HDh
ShN
RB
LhK
AAAD
hV
MF
DhTh
LGA
GDh
GnS
(1)
(2)
(3)
(4)
(5)
(6)
(7)
(8)
(9)
(10)
(11)
(12)
(13)
(14)
(15)
(16)
(17)
(18)
(19)
(20)
(21)
(22)
(23)
(24)
(25)
TA
BL
E M
G 7
: T
OT
AL
MA
LD
IVIA
N P
OPU
LA
TIO
N B
Y P
LA
CE
OF
EN
UM
ER
AT
ION
CR
OSS
CL
ASS
IFIE
D B
Y P
LA
CE
OF
RE
GIS
TR
AT
ION
, SE
X A
ND
LO
CA
LIT
Y (A
TO
LL
), 20
14
Plac
e of
enu
mer
atio
n P
lace
of R
egist
ratio
nAb
road
Not s
tate
d
Fem
ale
Re
publ
ic16
9,35
7
28,9
83
10
,286
12,2
42
8,
209
7,
667
10
,453
6,56
3
5,92
1
5,99
3
3,55
8
5,00
8
1,17
4
3,37
0
2,67
3
3,54
2
7,20
1
7,64
2
6,50
1
9,57
1
5,68
5
14,8
86
12
4
2,
105
Mal
e'
67,0
84
27
,785
3,08
0
2,39
2
1,57
4
1,94
5
2,64
0
2,07
8
1,75
4
1,18
8
858
1,03
7
422
1,03
5
560
934
2,76
8
1,72
9
2,44
2
3,79
4
1,25
0
4,68
7
80
1,05
2
At
olls
(Inclu
des A
dmin
istra
tive
and
Non-
Adm
inist
rativ
e Isl
ands
)10
2,27
3
1,19
8
7,20
6
9,85
0
6,63
5
5,72
2
7,81
3
4,48
5
4,16
7
4,80
5
2,70
0
3,97
1
752
2,33
5
2,11
3
2,60
8
4,43
3
5,91
3
4,05
9
5,77
7
4,43
5
10,1
99
44
1,
053
Nort
h Th
iladh
unm
athi
(HA)
7,09
8
56
6,
716
60
15
16
20
10
7
16
3
8
7
3
1
9
13
14
7
8
8
14
1
86
Sout
h Th
iladh
unm
athi
(HDh
)10
,085
108
127
9,39
4
99
33
37
20
20
11
5
16
1
8
1
13
17
10
6
26
11
26
4
92
Nort
h M
iladh
unm
adul
u (S
h)6,
614
37
16
42
6,28
0
25
38
18
18
12
3
6
-
3
4
3
8
7
8
13
3
9
2
59
So
uth
Mila
dhun
mad
ulu
(N)
5,74
7
47
34
22
34
5,
359
30
13
60
13
6
2
5
11
1
3
16
12
8
14
5
13
2
37
No
rth
Maa
lhos
mad
ulu
(R)
7,81
7
58
35
30
32
40
7,
397
30
21
14
8
4
5
11
4
2
15
4
8
18
3
13
2
63
Sout
h M
aalh
osm
adul
u (B
)4,
656
64
29
19
21
16
68
4,23
6
20
12
7
10
6
6
4
4
16
24
10
24
6
26
-
28
Faad
hipp
olhu
(Lh)
4,33
9
38
33
21
34
11
0
53
16
3,
899
31
13
3
-
2
2
-
10
13
3
22
8
12
4
12
M
ale'
Ato
ll (K
)5,
580
168
50
86
35
30
56
41
48
4,59
7
28
20
24
16
21
12
34
39
27
55
32
74
2
85
No
rth
Ari A
toll
(AA)
2,92
5
62
23
34
10
7
12
12
11
6
2,
573
22
3
7
9
3
3
17
10
10
8
15
2
66
Sout
h Ar
i Ato
ll (A
Dh)
4,18
0
67
21
21
11
12
14
13
9
7
16
3,
816
15
9
8
8
12
15
11
9
14
28
1
43
Felid
hu A
toll
(V)
738
12
3
3
4
5
2
4
3
2
1
5
66
6
4
4
1
3
4
2
4
1
4
-
1
Mul
akat
holh
u (M
)2,
416
40
22
20
5
7
8
7
5
7
4
9
6
2,
184
9
13
9
19
6
10
8
8
2
8
No
rth
Nila
ndhe
Ato
ll (F
)2,
161
14
7
2
1
1
7
11
6
9
3
6
1
5
2,
008
10
2
13
8
12
3
4
-
28
So
uth
Nila
ndhe
Ato
ll (D
h)2,
752
45
24
9
5
8
13
6
4
7
2
7
3
20
16
2,
482
24
19
7
11
9
13
2
16
Kolh
umad
ulu
(Th)
4,53
0
65
11
13
4
8
17
5
7
7
3
5
8
12
2
8
4,
172
57
5
19
5
11
2
84
Hadh
dhun
mat
hi (L
)5,
969
44
8
16
12
18
11
6
5
10
-
14
1
8
3
9
46
5,
603
15
34
6
14
4
82
No
rth
Huva
dhu
Atol
l (GA
)4,
080
36
13
12
6
4
2
6
3
10
1
4
-
5
2
4
6
9
3,77
8
60
12
35
5
67
So
uth
Huva
dhu
Atol
l (GD
h)5,
763
57
12
15
6
10
5
12
11
9
2
7
1
7
7
13
10
12
86
5,32
4
31
49
-
77
Gnav
iyan
i (Gn
)4,
422
43
4
16
5
4
5
6
3
10
4
1
-
3
2
3
7
7
14
25
4,
182
60
1
17
Addu
(S)
10,4
01
13
7
18
15
16
9
18
13
7
15
18
6
-
11
5
8
10
15
40
79
80
9,77
1
8
102
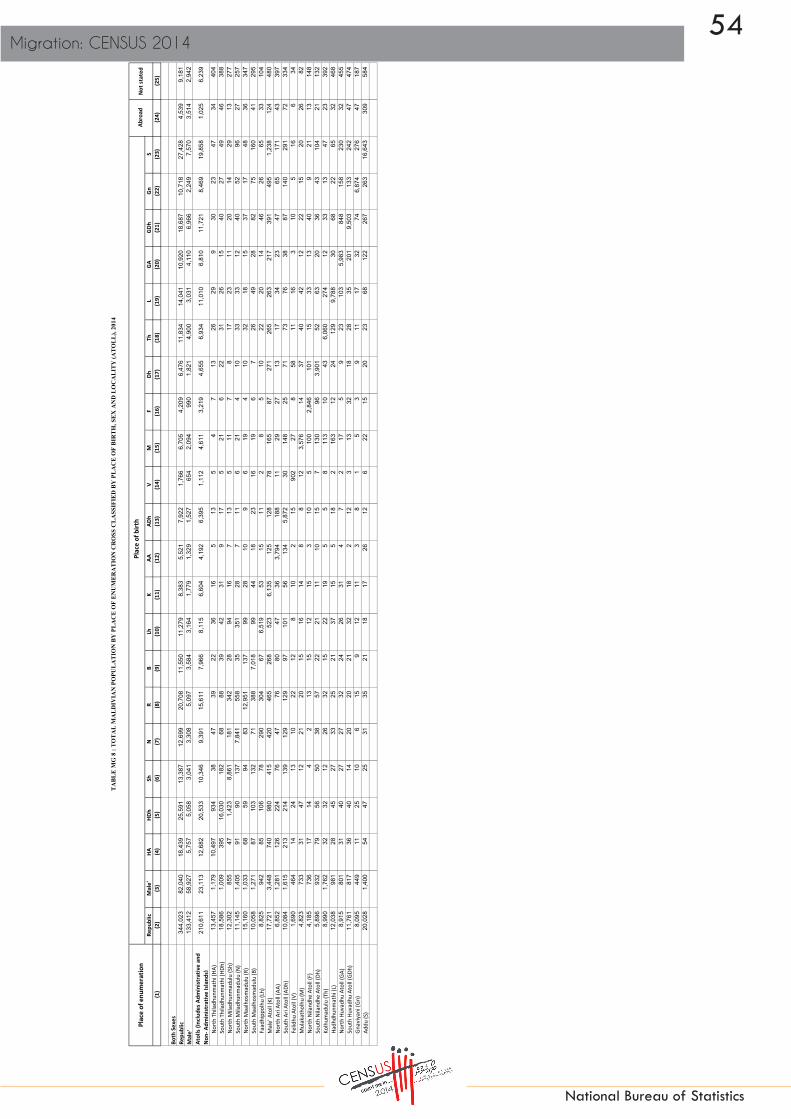
54Migration: CENSUS 2014
National Bureau of Statistics
Repu
blic
Mal
e'HA
HDh
ShN
RB
LhK
AAAD
hV
MF
DhTh
LGA
GDh
GnS
(1)
(2)
(3)
(4)
(5)
(6)
(7)
(8)
(9)
(10)
(11)
(12)
(13)
(14)
(15)
(16)
(17)
(18)
(19)
(20)
(21)
(22)
(23)
(24)
(25)
Both
Sex
es
Repu
blic
344,
023
82,0
40
18
,439
25,5
91
13
,387
12,6
99
20
,708
11,5
50
11
,279
8,38
3
5,52
1
7,92
2
1,76
6
6,70
5
4,20
9
6,47
6
11,8
34
14
,041
10,9
20
18
,687
10,7
18
27
,428
4,53
9
9,18
1
Mal
e'
133,
412
58,9
27
5,
757
5,
058
3,
041
3,
308
5,
097
3,
584
3,
164
1,
779
1,
329
1,
527
65
4
2,
094
99
0
1,
821
4,
900
3,
031
4,
110
6,
966
2,
249
7,
570
3,
514
2,
942
At
olls
(Inclu
des A
dmin
istra
tive
and
Non-
Adm
inist
rativ
e Isl
ands
)21
0,61
1
23
,113
12,6
82
20
,533
10,3
46
9,
391
15
,611
7,96
6
8,11
5
6,60
4
4,19
2
6,39
5
1,11
2
4,61
1
3,21
9
4,65
5
6,93
4
11,0
10
6,
810
11
,721
8,46
9
19,8
58
1,
025
6,
239
Nort
h Th
iladh
unm
athi
(HA)
13,4
57
1,
179
10
,497
934
38
47
39
22
36
16
5
13
5
4
7
13
26
29
9
30
23
47
34
404
Sout
h Th
iladh
unm
athi
(HDh
)18
,586
1,00
9
395
16,0
30
18
2
68
88
39
42
31
9
17
5
21
6
22
31
26
15
40
27
49
46
38
8
No
rth
Mila
dhun
mad
ulu
(Sh)
12,3
02
85
5
47
1,
423
8,
861
18
1
34
2
28
94
16
7
13
5
11
7
8
17
23
11
20
14
29
13
27
7
So
uth
Mila
dhun
mad
ulu
(N)
11,1
45
1,
405
91
90
13
7
7,
841
55
8
35
35
1
28
7
11
6
21
4
10
33
33
12
40
52
96
27
25
7
No
rth
Maa
lhos
mad
ulu
(R)
15,1
60
1,
033
68
59
94
83
12
,951
137
99
28
10
9
6
19
4
10
32
18
15
37
17
48
36
347
Sout
h M
aalh
osm
adul
u (B
)10
,058
1,27
1
87
103
132
71
388
7,01
8
99
44
18
23
16
19
6
7
26
49
28
82
75
160
41
295
Faad
hipp
olhu
(Lh)
8,82
5
942
85
106
78
290
304
67
6,51
9
53
15
11
2
8
5
10
22
20
14
46
26
65
33
104
Mal
e' A
toll
(K)
17,7
21
3,
448
74
0
98
0
41
5
42
0
46
5
26
8
52
3
6,
135
12
5
12
8
78
16
5
87
27
1
26
5
26
3
21
7
39
1
49
5
1,
238
12
4
48
0
No
rth
Ari A
toll
(AA)
6,85
2
1,28
1
126
224
76
47
76
80
47
36
3,79
4
188
11
29
27
13
17
34
23
47
65
171
43
397
Sout
h Ar
i Ato
ll (A
Dh)
10,0
84
1,
615
21
3
21
4
13
9
12
9
12
9
97
10
1
56
13
4
5,
872
30
14
8
25
71
73
76
38
87
14
0
29
1
72
33
4
Fe
lidhu
Ato
ll (V
)1,
690
46
4
14
24
13
10
22
12
8
10
2
15
90
2
27
8
58
11
16
3
10
5
16
6
34
M
ulak
atho
lhu
(M)
4,82
3
733
31
47
12
21
20
15
16
14
8
8
12
3,57
6
14
37
40
42
12
22
15
20
26
82
Nort
h Ni
land
he A
toll
(F)
4,18
5
736
17
14
4
2
13
15
12
15
3
10
5
100
2,84
6
101
15
33
13
40
9
21
13
148
Sout
h Ni
land
he A
toll
(Dh)
5,89
6
932
79
56
50
38
57
22
21
11
10
15
7
130
96
3,90
1
52
63
20
36
43
104
21
132
Kolh
umad
ulu
(Th)
8,99
0
1,76
2
32
32
12
26
32
15
22
19
5
5
8
113
10
43
6,06
0
274
12
33
13
47
23
392
Hadh
dhun
mat
hi (L
)12
,038
981
28
45
27
33
25
21
37
15
5
18
2
163
12
24
129
9,78
8
30
68
22
65
32
468
Nort
h Hu
vadh
u At
oll (
GA)
8,91
5
801
31
40
27
27
32
24
26
31
4
7
2
17
5
9
23
103
5,98
3
848
158
230
32
455
Sout
h Hu
vadh
u At
oll (
GDh)
11,7
61
81
7
36
40
14
20
20
21
32
18
2
12
3
13
32
18
28
35
20
1
9,
503
13
3
24
2
47
47
4
Gn
aviy
ani (
Gn)
8,09
5
449
11
25
10
6
15
9
12
11
3
8
1
5
3
9
11
17
32
74
6,87
4
276
47
187
Addu
(S)
20,0
28
1,
400
54
47
25
31
35
21
18
17
26
12
6
22
15
20
23
68
12
2
26
7
26
3
16
,643
309
584
TA
BL
E M
G 8
: T
OT
AL
MA
LD
IVIA
N P
OPU
LA
TIO
N B
Y P
LA
CE
OF
EN
UM
ER
AT
ION
CR
OSS
CL
ASS
IFIE
D B
Y P
LA
CE
OF
BIR
TH
, SE
X A
ND
LO
CA
LIT
Y (A
TO
LL
), 20
14
Plac
e of
enu
mer
atio
n P
lace
of b
irth
Abro
adNo
t sta
ted
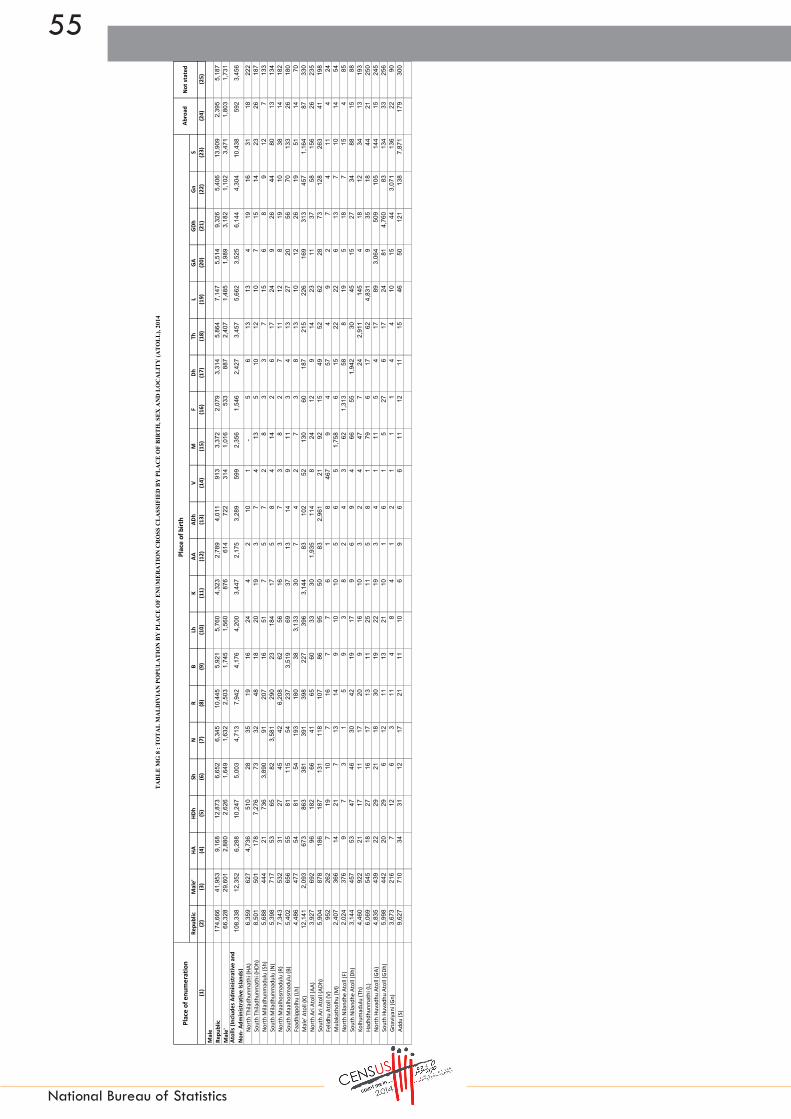
55
National Bureau of Statistics
Repu
blic
Mal
e'HA
HDh
ShN
RB
LhK
AAAD
hV
MF
DhTh
LGA
GDh
GnS
(1)
(2)
(3)
(4)
(5)
(6)
(7)
(8)
(9)
(10)
(11)
(12)
(13)
(14)
(15)
(16)
(17)
(18)
(19)
(20)
(21)
(22)
(23)
(24)
(25)
TA
BL
E M
G 8
: T
OT
AL
MA
LD
IVIA
N P
OPU
LA
TIO
N B
Y P
LA
CE
OF
EN
UM
ER
AT
ION
CR
OSS
CL
ASS
IFIE
D B
Y P
LA
CE
OF
BIR
TH
, SE
X A
ND
LO
CA
LIT
Y (A
TO
LL
), 20
14
Plac
e of
enu
mer
atio
n P
lace
of b
irth
Abro
adNo
t sta
ted
Mal
e
Repu
blic
174,
666
41,9
53
9,
168
12
,873
6,65
2
6,34
5
10,4
45
5,
921
5,
760
4,
323
2,
789
4,
011
91
3
3,
372
2,
079
3,
314
5,
864
7,
147
5,
514
9,
326
5,
406
13
,909
2,39
5
5,18
7
Mal
e'
66,3
28
29
,601
2,88
0
2,62
6
1,64
9
1,63
2
2,50
3
1,74
5
1,56
0
876
614
722
314
1,01
6
533
887
2,40
7
1,48
5
1,98
9
3,18
2
1,10
2
3,47
1
1,80
3
1,73
1
Atol
ls (In
clude
s Adm
inist
rativ
e an
d No
n- A
dmin
istra
tive
Islan
ds)
108,
338
12,3
52
6,
288
10
,247
5,00
3
4,71
3
7,94
2
4,17
6
4,20
0
3,44
7
2,17
5
3,28
9
599
2,35
6
1,54
6
2,42
7
3,45
7
5,66
2
3,52
5
6,14
4
4,30
4
10,4
38
59
2
3,
456
Nort
h Th
iladh
unm
athi
(HA)
6,35
9
627
4,73
6
510
28
35
19
16
24
4
2
10
1
-
5
6
13
13
4
19
16
31
18
22
2
So
uth
Thila
dhun
mat
hi (H
Dh)
8,50
1
501
178
7,27
6
73
32
48
18
20
19
3
7
4
13
5
10
12
10
7
15
14
23
26
187
Nort
h M
iladh
unm
adul
u (S
h)5,
688
44
4
21
73
6
3,
890
91
20
7
16
51
7
5
7
2
8
3
3
7
15
6
8
9
12
7
13
3
So
uth
Mila
dhun
mad
ulu
(N)
5,39
8
717
53
65
82
3,58
1
290
23
184
17
5
8
4
14
2
6
17
24
9
26
44
80
13
134
Nort
h M
aalh
osm
adul
u (R
)7,
343
53
2
31
27
45
42
6,
208
62
56
16
3
7
3
8
2
7
11
12
8
19
10
38
14
18
2
So
uth
Maa
lhos
mad
ulu
(B)
5,40
2
656
55
81
115
54
237
3,51
9
69
37
13
14
9
11
3
4
13
27
20
56
70
133
26
180
Faad
hipp
olhu
(Lh)
4,48
6
477
54
81
54
193
180
38
3,13
3
30
7
4
2
7
3
8
13
10
12
26
19
51
14
70
Mal
e' A
toll
(K)
12,1
41
2,
093
67
3
86
3
38
1
39
1
39
8
22
7
39
6
3,
144
83
10
2
52
13
0
60
18
7
21
5
22
6
16
9
31
3
45
7
1,
164
87
33
0
No
rth
Ari A
toll
(AA)
3,92
7
692
96
182
66
41
65
60
33
30
1,93
5
114
8
24
12
9
14
23
11
37
58
156
26
235
Sout
h Ar
i Ato
ll (A
Dh)
5,90
4
878
186
187
131
118
107
86
95
50
83
2,96
1
21
92
15
49
52
62
28
73
128
263
41
198
Felid
hu A
toll
(V)
952
262
7
19
10
7
16
7
7
6
1
8
467
9
4
57
4
9
2
7
4
11
4
24
Mul
akat
holh
u (M
)2,
407
36
6
14
21
7
13
14
9
10
10
5
6
5
1,
758
6
15
22
22
6
13
7
10
14
54
No
rth
Nila
ndhe
Ato
ll (F
)2,
024
37
6
9
7
3
1
5
9
3
8
2
4
3
62
1,
313
58
8
19
5
18
7
15
4
85
So
uth
Nila
ndhe
Ato
ll (D
h)3,
144
45
7
53
47
46
30
42
19
17
9
6
9
4
66
55
1,
942
30
45
15
27
34
88
15
88
Ko
lhum
adul
u (T
h)4,
460
92
2
21
17
11
17
20
9
16
10
3
2
4
47
7
24
2,
911
14
5
4
18
12
34
13
19
3
Ha
dhdh
unm
athi
(L)
6,06
9
545
18
27
16
17
13
11
25
11
5
8
1
79
6
17
62
4,83
1
9
35
18
44
21
250
Nort
h Hu
vadh
u At
oll (
GA)
4,83
5
439
22
29
21
18
30
19
22
19
3
4
1
11
5
4
17
89
3,06
4
509
105
144
15
245
Sout
h Hu
vadh
u At
oll (
GDh)
5,99
8
442
20
29
6
12
11
13
21
10
1
6
1
5
27
6
17
24
81
4,76
0
83
134
33
256
Gnav
iyan
i (Gn
)3,
673
21
6
7
12
6
3
11
4
8
4
1
2
1
1
1
4
4
10
15
44
3,
071
13
6
22
90
Ad
du (S
)9,
627
71
0
34
31
12
17
21
11
10
6
9
6
6
11
12
11
15
46
50
12
1
13
8
7,
871
17
9
30
0

56Migration: CENSUS 2014
National Bureau of Statistics
Bot
h Se
xes
Mal
e F
emal
e B
oth
Sexe
s M
ale
Fem
ale
Bot
h Se
xes
Mal
e F
emal
e B
oth
Sexe
s M
ale
Fem
ale
(1)
(2)
(3)
(4)
(5)
(6)
(7)
(8)
(9)
(10)
(11)
(12)
(13)
Repu
blic
338,
434
17
1,96
2
166,
472
14
7,92
7
79,4
31
68,4
96
185,
696
89
,505
96
,191
4,
811
3,02
6
1,
785
Mal
e'
126,
080
63
,183
62,8
97
68
,422
33,6
68
34
,754
55,8
68
28
,384
27,4
84
1,
790
1,13
1
65
9
Atol
ls (In
clude
s Adm
inist
rativ
e an
d No
n-
Adm
inist
rativ
e Isl
ands
)21
2,00
4
108,
503
10
3,50
1
79,3
05
45,5
86
33,7
19
129,
703
61
,035
68
,668
2,
996
1,88
2
1,
114
Nort
h Th
iladh
unm
athi
(HA)
13,7
37
6,43
9
7,
298
3,89
8
2,
065
1,83
3
9,
631
4,24
8
5,
383
208
12
6
82
Sout
h Th
iladh
unm
athi
(HDh
)18
,708
8,
550
10,1
58
6,
039
3,01
7
3,
022
12,3
64
5,36
4
7,
000
305
16
9
136
No
rth
Mila
dhun
mad
ulu
(Sh)
12,6
16
5,85
2
6,
764
5,12
9
2,
584
2,54
5
7,
374
3,20
2
4,
172
113
66
47
Sout
h M
iladh
unm
adul
u (N
)11
,313
5,
436
5,87
7
3,
955
2,13
5
1,
820
7,22
2
3,
223
3,99
9
13
6
78
58
No
rth
Maa
lhos
mad
ulu
(R)
15,5
44
7,56
9
7,
975
6,60
3
3,
243
3,36
0
8,
753
4,18
9
4,
564
188
13
7
51
Sout
h M
aalh
osm
adul
u (B
)10
,207
5,
448
4,75
9
4,
299
2,54
9
1,
750
5,81
6
2,
836
2,98
0
92
63
29
Faad
hipp
olhu
(Lh)
8,70
9
4,
363
4,34
6
2,
853
1,57
0
1,
283
5,81
2
2,
765
3,04
7
44
28
16
Mal
e' A
toll
(K)
17,4
81
11,9
52
5,52
9
9,
861
7,81
8
2,
043
7,39
1
3,
966
3,42
5
22
9
168
61
No
rth
Ari A
toll
(AA)
6,91
3
3,
929
2,98
4
2,
574
1,66
6
90
8
4,16
6
2,
147
2,01
9
17
3
116
57
So
uth
Ari A
toll
(ADh
)10
,200
5,
986
4,21
4
4,
285
2,96
7
1,
318
5,76
8
2,
919
2,84
9
14
7
100
47
Fe
lidhu
Ato
ll (V
)1,
596
859
73
7
758
44
1
317
81
5
399
41
6
23
19
4
Mul
akat
holh
u (M
)4,
953
2,46
8
2,
485
1,88
2
96
7
915
3,
039
1,47
8
1,
561
32
23
9
Nort
h Ni
land
he A
toll
(F)
4,23
5
2,
053
2,18
2
1,
083
545
53
8
3,07
1
1,
453
1,61
8
81
55
26
Sout
h Ni
land
he A
toll
(Dh)
6,04
5
3,
221
2,82
4
2,
717
1,54
4
1,
173
3,24
6
1,
620
1,62
6
82
57
25
Kolh
umad
ulu
(Th)
9,30
0
4,
562
4,73
8
3,
595
1,87
7
1,
718
5,51
5
2,
573
2,94
2
19
0
112
78
Ha
dhdh
unm
athi
(L)
12,2
10
6,15
9
6,
051
4,13
0
2,
202
1,92
8
7,
822
3,80
5
4,
017
258
15
2
106
No
rth
Huva
dhu
Atol
l (GA
)8,
867
4,71
8
4,
149
2,90
8
1,
727
1,18
1
5,
791
2,88
5
2,
906
168
10
6
62
Sout
h Hu
vadh
u At
oll (
GDh)
11,8
17
5,99
2
5,
825
4,04
2
2,
158
1,88
4
7,
490
3,66
8
3,
822
285
16
6
119
Gn
aviy
ani (
Gn)
8,03
5
3,
621
4,41
4
2,
038
1,03
1
1,
007
5,96
6
2,
569
3,39
7
31
21
10
Addu
(S)
19,5
18
9,32
6
10
,192
6,65
6
3,
480
3,17
6
12
,651
5,
726
6,92
5
21
1
120
91
No
t Sta
ted
350
27
6
74
20
0
177
23
125
86
39
25
13
12
Pop
ulat
ion
with
out a
chan
ge in
usu
al
resid
ence
Lo
calit
y R
esid
ent M
aldi
vian
pop
ulat
ion
Pop
ulat
ion
with
a d
iffer
ent u
sual
and
pr
evio
us re
siden
ce
Not
Sta
ted
TABL
E M
G 9:
RES
IDEN
T M
ALDI
VIAN
PO
PULA
TIO
N BY
STA
TUS
OF
MO
VEM
ENT
FRO
M P
REVI
OUS
RES
IDEN
CE T
O C
URRE
NT R
ESID
ENCE
, SEX
AND
LOCA
LITY
(ATO
LLS)
, 201
4

57
National Bureau of Statistics
Bot
h Se
xes
Mal
e F
emal
e B
oth
Sexe
s M
ale
Fem
ale
Bot
h Se
xes
Mal
e F
emal
e B
oth
Sexe
s M
ale
Fem
ale
(1)
(2)
(3)
(4)
(5)
(6)
(7)
(8)
(9)
(10)
(11)
(12)
(13)
Pop
ulat
ion
with
out a
chan
ge in
usu
al
resid
ence
Lo
calit
y R
esid
ent M
aldi
vian
pop
ulat
ion
Pop
ulat
ion
with
a d
iffer
ent u
sual
and
pr
evio
us re
siden
ce
Not
Sta
ted
TABL
E M
G 9:
RES
IDEN
T M
ALDI
VIAN
PO
PULA
TIO
N BY
STA
TUS
OF
MO
VEM
ENT
FRO
M P
REVI
OUS
RES
IDEN
CE T
O C
URRE
NT R
ESID
ENCE
, SEX
AND
LOCA
LITY
(ATO
LLS)
, 201
4
Adm
inist
rativ
e Isl
ands
198,
616
95
,479
103,
137
67
,332
33,9
28
33
,404
128,
483
59
,855
68,6
28
2,
801
1,69
6
1,
105
Nort
h Th
iladh
unm
athi
(HA)
13,2
94
6,00
1
7,
293
3,50
4
1,
673
1,83
1
9,
628
4,24
5
5,
383
162
83
79
Sout
h Th
iladh
unm
athi
(HDh
)18
,677
8,
523
10,1
54
6,
016
2,99
5
3,
021
12,3
56
5,35
9
6,
997
305
16
9
136
No
rth
Mila
dhun
mad
ulu
(Sh)
12,4
27
5,66
7
6,
760
4,94
9
2,
407
2,54
2
7,
365
3,19
4
4,
171
113
66
47
Sout
h M
iladh
unm
adul
u (N
)10
,785
4,
923
5,86
2
3,
455
1,65
0
1,
805
7,19
6
3,
197
3,99
9
13
4
76
58
No
rth
Maa
lhos
mad
ulu
(R)
15,2
48
7,28
2
7,
966
6,40
9
3,
055
3,35
4
8,
679
4,11
8
4,
561
160
10
9
51
Sout
h M
aalh
osm
adul
u (B
)9,
010
4,28
7
4,
723
3,20
3
1,
488
1,71
5
5,
721
2,74
2
2,
979
86
57
29
Fa
adhi
ppol
hu (L
h)8,
041
3,74
1
4,
300
2,24
9
1,
006
1,24
3
5,
748
2,70
7
3,
041
44
28
16
M
ale'
Ato
ll (K
)12
,054
6,
637
5,41
7
4,
854
2,91
0
1,
944
7,01
5
3,
597
3,41
8
18
5
130
55
No
rth
Ari A
toll
(AA)
5,96
7
2,
995
2,97
2
1,
752
854
89
8
4,04
8
2,
031
2,01
7
16
7
110
57
So
uth
Ari A
toll
(ADh
)8,
164
4,00
7
4,
157
2,47
5
1,
205
1,27
0
5,
567
2,72
7
2,
840
122
75
47
Felid
hu A
toll
(V)
1,52
4
78
7
737
68
7
370
31
7
815
39
9
416
22
18
4
M
ulak
atho
lhu
(M)
4,84
3
2,
359
2,48
4
1,
812
897
91
5
3,00
2
1,
442
1,56
0
29
20
9
No
rth
Nila
ndhe
Ato
ll (F
)4,
197
2,01
5
2,
182
1,04
5
50
7
538
3,
071
1,45
3
1,
618
81
55
26
So
uth
Nila
ndhe
Ato
ll (D
h)5,
576
2,77
2
2,
804
2,28
4
1,
130
1,15
4
3,
229
1,60
4
1,
625
63
38
25
Ko
lhum
adul
u (T
h)9,
241
4,50
6
4,
735
3,53
9
1,
824
1,71
5
5,
512
2,57
0
2,
942
190
11
2
78
Hadh
dhun
mat
hi (L
)12
,002
5,
971
6,03
1
3,
953
2,04
1
1,
912
7,79
1
3,
778
4,01
3
25
8
152
10
6
Nort
h Hu
vadh
u At
oll (
GA)
8,41
9
4,
280
4,13
9
2,
538
1,36
7
1,
171
5,72
4
2,
818
2,90
6
15
7
95
62
So
uth
Huva
dhu
Atol
l (GD
h)11
,698
5,
879
5,81
9
4,
011
2,13
1
1,
880
7,40
5
3,
585
3,82
0
28
2
163
11
9
Gnav
iyan
i (Gn
)8,
035
3,62
1
4,
414
2,03
8
1,
031
1,00
7
5,
966
2,56
9
3,
397
31
21
10
Ad
du (S
)19
,414
9,
226
10,1
88
6,
559
3,38
7
3,
172
12,6
45
5,72
0
6,
925
210
11
9
91
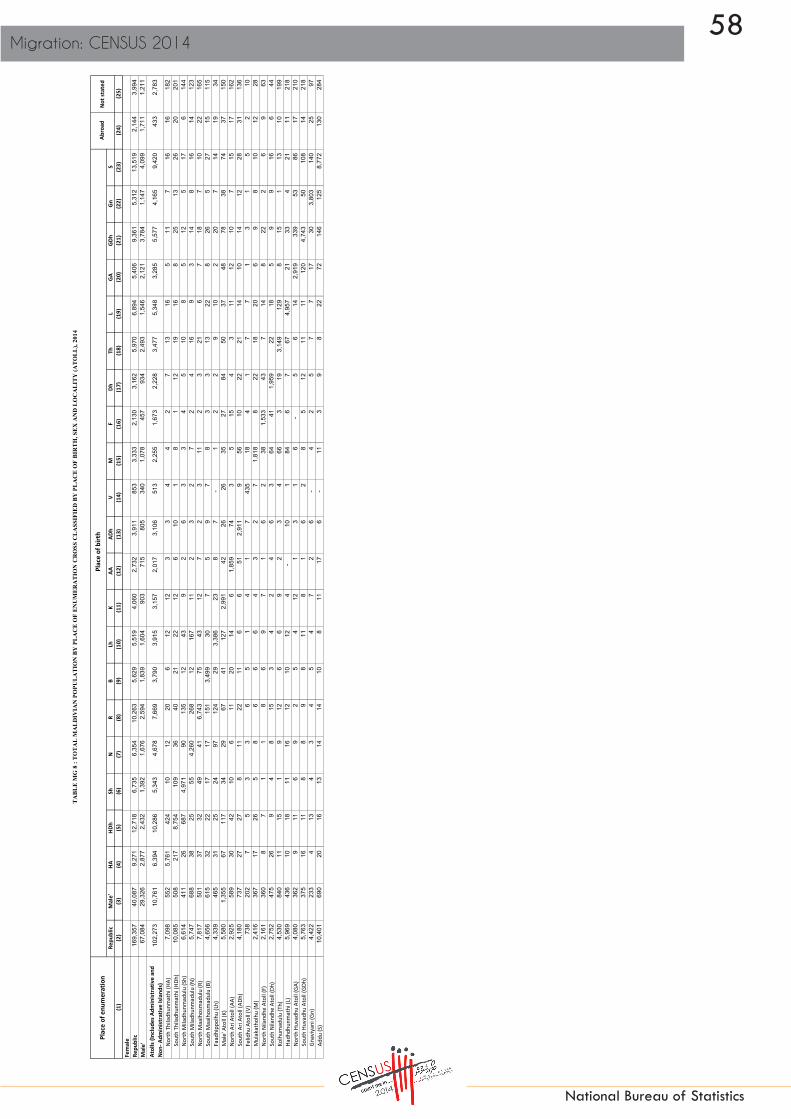
58Migration: CENSUS 2014
National Bureau of Statistics
Repu
blic
Mal
e'HA
HDh
ShN
RB
LhK
AAAD
hV
MF
DhTh
LGA
GDh
GnS
(1)
(2)
(3)
(4)
(5)
(6)
(7)
(8)
(9)
(10)
(11)
(12)
(13)
(14)
(15)
(16)
(17)
(18)
(19)
(20)
(21)
(22)
(23)
(24)
(25)
TA
BL
E M
G 8
: T
OT
AL
MA
LD
IVIA
N P
OPU
LA
TIO
N B
Y P
LA
CE
OF
EN
UM
ER
AT
ION
CR
OSS
CL
ASS
IFIE
D B
Y P
LA
CE
OF
BIR
TH
, SE
X A
ND
LO
CA
LIT
Y (A
TO
LL
), 20
14
Plac
e of
enu
mer
atio
n P
lace
of b
irth
Abro
adNo
t sta
ted
Fem
ale
Re
publ
ic16
9,35
7
40
,087
9,27
1
12,7
18
6,
735
6,
354
10
,263
5,62
9
5,51
9
4,06
0
2,73
2
3,91
1
853
3,33
3
2,13
0
3,16
2
5,97
0
6,89
4
5,40
6
9,36
1
5,31
2
13,5
19
2,
144
3,
994
M
ale'
67
,084
29,3
26
2,
877
2,
432
1,
392
1,
676
2,
594
1,
839
1,
604
90
3
71
5
80
5
34
0
1,
078
45
7
93
4
2,
493
1,
546
2,
121
3,
784
1,
147
4,
099
1,
711
1,
211
At
olls
(Inclu
des A
dmin
istra
tive
and
Non-
Adm
inist
rativ
e Isl
ands
)10
2,27
3
10
,761
6,39
4
10,2
86
5,
343
4,
678
7,
669
3,
790
3,
915
3,
157
2,
017
3,
106
51
3
2,
255
1,
673
2,
228
3,
477
5,
348
3,
285
5,
577
4,
165
9,
420
43
3
2,
783
Nort
h Th
iladh
unm
athi
(HA)
7,09
8
552
5,76
1
424
10
12
20
6
12
12
3
3
4
4
2
7
13
16
5
11
7
16
16
182
Sout
h Th
iladh
unm
athi
(HDh
)10
,085
508
217
8,75
4
109
36
40
21
22
12
6
10
1
8
1
12
19
16
8
25
13
26
20
201
Nort
h M
iladh
unm
adul
u (S
h)6,
614
41
1
26
68
7
4,
971
90
13
5
12
43
9
2
6
3
3
4
5
10
8
5
12
5
17
6
14
4
So
uth
Mila
dhun
mad
ulu
(N)
5,74
7
688
38
25
55
4,26
0
268
12
167
11
2
3
2
7
2
4
16
9
3
14
8
16
14
123
Nort
h M
aalh
osm
adul
u (R
)7,
817
50
1
37
32
49
41
6,
743
75
43
12
7
2
3
11
2
3
21
6
7
18
7
10
22
16
5
So
uth
Maa
lhos
mad
ulu
(B)
4,65
6
615
32
22
17
17
151
3,49
9
30
7
5
9
7
8
3
3
13
22
8
26
5
27
15
115
Faad
hipp
olhu
(Lh)
4,33
9
465
31
25
24
97
124
29
3,38
6
23
8
7
-
1
2
2
9
10
2
20
7
14
19
34
M
ale'
Ato
ll (K
)5,
580
1,
355
67
11
7
34
29
67
41
12
7
2,
991
42
26
26
35
27
84
50
37
48
78
38
74
37
15
0
No
rth
Ari A
toll
(AA)
2,92
5
589
30
42
10
6
11
20
14
6
1,85
9
74
3
5
15
4
3
11
12
10
7
15
17
162
Sout
h Ar
i Ato
ll (A
Dh)
4,18
0
737
27
27
8
11
22
11
6
6
51
2,91
1
9
56
10
22
21
14
10
14
12
28
31
136
Felid
hu A
toll
(V)
738
202
7
5
3
3
6
5
1
4
1
7
435
18
4
1
7
7
1
3
1
5
2
10
Mul
akat
holh
u (M
)2,
416
36
7
17
26
5
8
6
6
6
4
3
2
7
1,
818
8
22
18
20
6
9
8
10
12
28
No
rth
Nila
ndhe
Ato
ll (F
)2,
161
36
0
8
7
1
1
8
6
9
7
1
6
2
38
1,
533
43
7
14
8
22
2
6
9
63
So
uth
Nila
ndhe
Ato
ll (D
h)2,
752
47
5
26
9
4
8
15
3
4
2
4
6
3
64
41
1,
959
22
18
5
9
9
16
6
44
Ko
lhum
adul
u (T
h)4,
530
84
0
11
15
1
9
12
6
6
9
2
3
4
66
3
19
3,
149
12
9
8
15
1
13
10
19
9
Ha
dhdh
unm
athi
(L)
5,96
9
436
10
18
11
16
12
10
12
4
-
10
1
84
6
7
67
4,
957
21
33
4
21
11
21
8
No
rth
Huva
dhu
Atol
l (GA
)4,
080
36
2
9
11
6
9
2
5
4
12
1
3
1
6
-
5
6
14
2,91
9
339
53
86
17
210
Sout
h Hu
vadh
u At
oll (
GDh)
5,76
3
375
16
11
8
8
9
8
11
8
1
6
2
8
5
12
11
11
120
4,74
3
50
108
14
218
Gnav
iyan
i (Gn
)4,
422
23
3
4
13
4
3
4
5
4
7
2
6
-
4
2
5
7
7
17
30
3,80
3
140
25
97
Addu
(S)
10,4
01
69
0
20
16
13
14
14
10
8
11
17
6
-
11
3
9
8
22
72
146
125
8,77
2
130
284
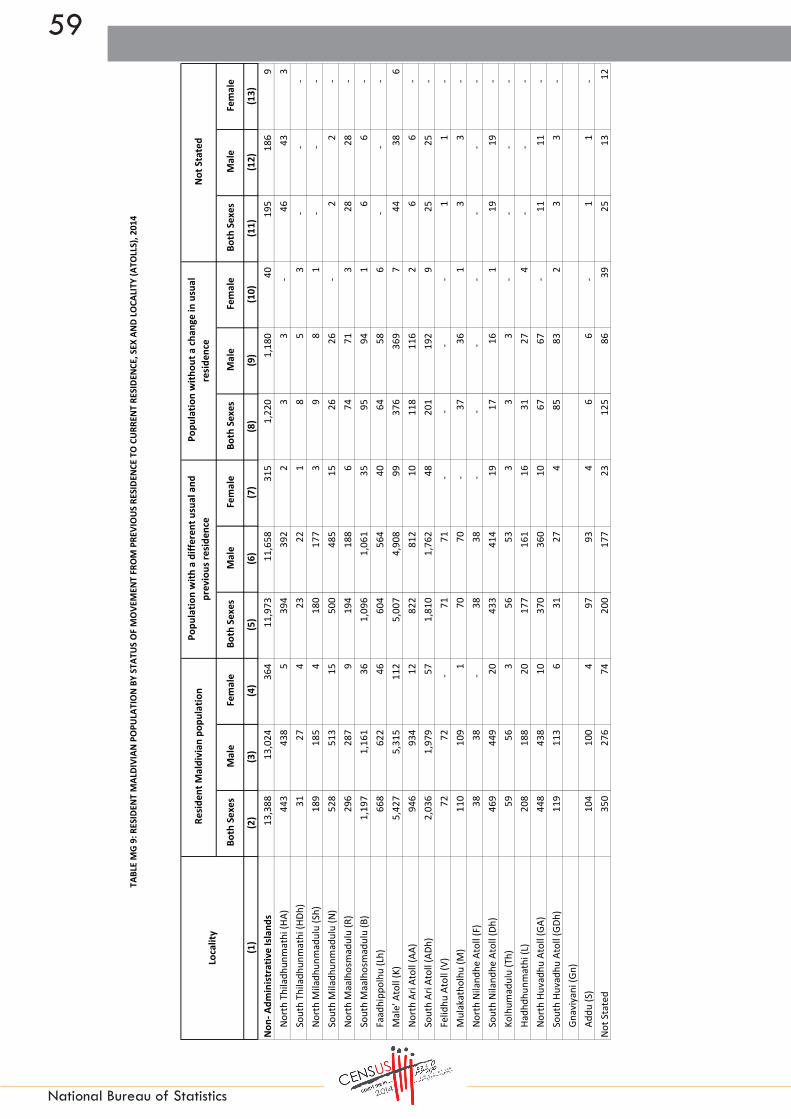
59
National Bureau of Statistics
Bot
h Se
xes
Mal
e F
emal
e B
oth
Sexe
s M
ale
Fem
ale
Bot
h Se
xes
Mal
e F
emal
e B
oth
Sexe
s M
ale
Fem
ale
(1)
(2)
(3)
(4)
(5)
(6)
(7)
(8)
(9)
(10)
(11)
(12)
(13)
Pop
ulat
ion
with
out a
chan
ge in
usu
al
resid
ence
Lo
calit
y R
esid
ent M
aldi
vian
pop
ulat
ion
Pop
ulat
ion
with
a d
iffer
ent u
sual
and
pr
evio
us re
siden
ce
Not
Sta
ted
TABL
E M
G 9:
RES
IDEN
T M
ALDI
VIAN
PO
PULA
TIO
N BY
STA
TUS
OF
MO
VEM
ENT
FRO
M P
REVI
OUS
RES
IDEN
CE T
O C
URRE
NT R
ESID
ENCE
, SEX
AND
LOCA
LITY
(ATO
LLS)
, 201
4
Non-
Adm
inist
rativ
e Isl
ands
13,3
88
13,0
24
364
11
,973
11
,658
31
5
1,22
0
1,
180
40
195
18
6
9
No
rth
Thila
dhun
mat
hi (H
A)44
3
438
5
394
39
2
2
3
3
-
46
43
3
So
uth
Thila
dhun
mat
hi (H
Dh)
31
27
4
23
22
1
8
5
3
-
-
-
No
rth
Mila
dhun
mad
ulu
(Sh)
189
18
5
4
18
0
177
3
9
8
1
-
-
-
So
uth
Mila
dhun
mad
ulu
(N)
528
51
3
15
50
0
485
15
26
26
-
2
2
-
Nort
h M
aalh
osm
adul
u (R
)29
6
287
9
194
18
8
6
74
71
3
28
28
-
Sout
h M
aalh
osm
adul
u (B
)1,
197
1,16
1
36
1,09
6
1,
061
35
95
94
1
6
6
-
Faad
hipp
olhu
(Lh)
668
62
2
46
60
4
564
40
64
58
6
-
-
-
M
ale'
Ato
ll (K
)5,
427
5,31
5
11
2
5,00
7
4,
908
99
376
36
9
7
44
38
6
No
rth
Ari A
toll
(AA)
946
93
4
12
82
2
812
10
11
8
116
2
6
6
-
Sout
h Ar
i Ato
ll (A
Dh)
2,03
6
1,
979
57
1,
810
1,76
2
48
20
1
192
9
25
25
-
Fe
lidhu
Ato
ll (V
)72
72
-
71
71
-
-
-
-
1
1
-
M
ulak
atho
lhu
(M)
110
10
9
1
70
70
-
37
36
1
3
3
-
No
rth
Nila
ndhe
Ato
ll (F
)38
38
-
38
38
-
-
-
-
-
-
-
So
uth
Nila
ndhe
Ato
ll (D
h)46
9
449
20
433
41
4
19
17
16
1
19
19
-
Ko
lhum
adul
u (T
h)59
56
3
56
53
3
3
3
-
-
-
-
Ha
dhdh
unm
athi
(L)
208
18
8
20
17
7
161
16
31
27
4
-
-
-
No
rth
Huva
dhu
Atol
l (GA
)44
8
438
10
370
36
0
10
67
67
-
11
11
-
Sout
h Hu
vadh
u At
oll (
GDh)
119
11
3
6
31
27
4
85
83
2
3
3
-
Gnav
iyan
i (Gn
)Ad
du (S
)10
4
100
4
97
93
4
6
6
-
1
1
-
No
t Sta
ted
350
27
6
74
20
0
177
23
12
5
86
39
25
13
12
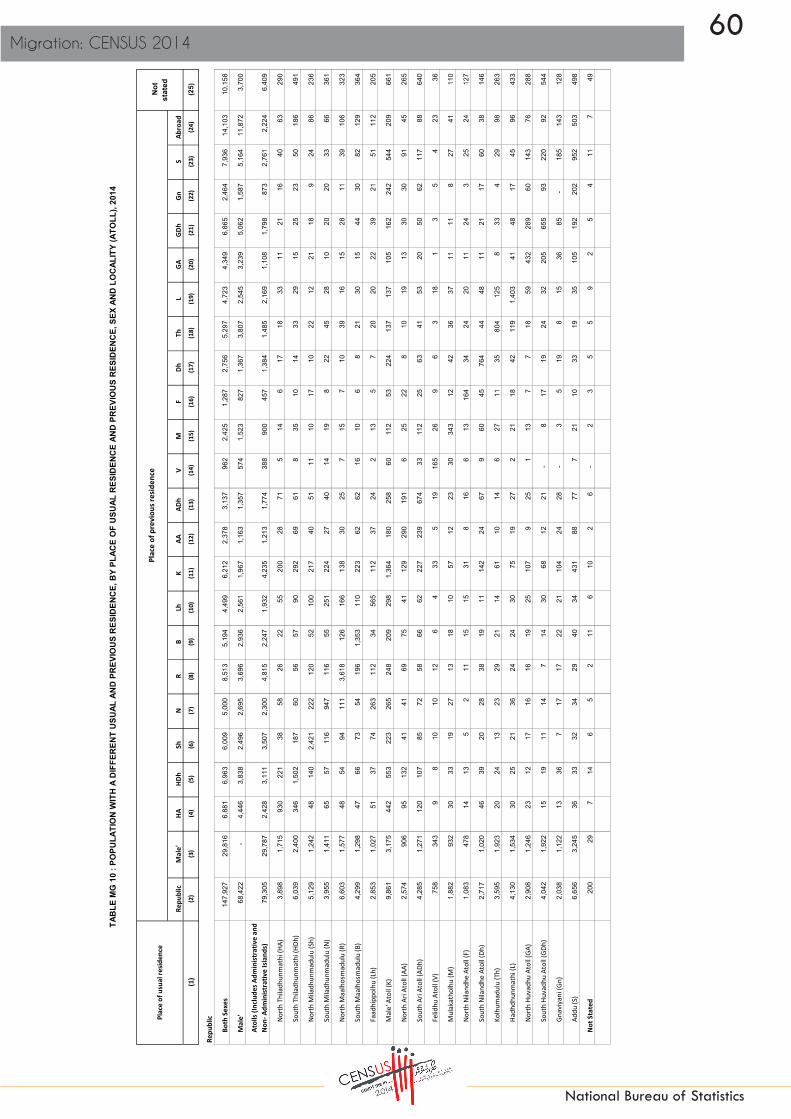
60Migration: CENSUS 2014
National Bureau of Statistics
Repu
blic
Mal
e'HA
HDh
ShN
RB
LhK
AAAD
hV
MF
DhTh
LGA
GDh
GnS
Abro
ad(1
)(2
)(3
)(4
)(5
)(6
)(7
)(8
)(9
)(1
0)(1
1)(1
2)(1
3)(1
4)(1
5)(1
6)(1
7)(1
8)(1
9)(2
0)(2
1)(2
2)(2
3)(2
4)(2
5)
Repu
blic
Both
Sex
es14
7,92
7
29
,816
6,88
1
6,
963
6,00
9
5,
000
8,51
3
5,
194
4,49
9
6,
212
2,37
8
3,
137
962
2,
425
1,28
7
2,
756
5,29
7
4,
723
4,34
9
6,
865
2,46
4
7,
936
14,1
03
10,1
58
Mal
e'
68,4
22
-
4,44
6
3,
838
2,49
6
2,
695
3,69
6
2,
936
2,56
1
1,
967
1,16
3
1,
357
574
1,
523
827
1,
367
3,80
7
2,
545
3,23
9
5,
062
1,58
7
5,
164
11,8
72
3,70
0
Atol
ls (In
clude
s Adm
inist
rativ
e an
d No
n- A
dmin
istra
tive
Islan
ds)
79,3
05
29,7
87
2,
428
3,11
1
3,
507
2,30
0
4,
815
2,24
7
1,
932
4,23
5
1,
213
1,77
4
38
8
900
45
7
1,38
4
1,
485
2,16
9
1,
108
1,79
8
87
3
2,76
1
2,
224
6,40
9
Nort
h Th
iladh
unm
athi
(HA)
3,89
8
1,
715
930
22
1
38
58
26
22
55
20
0
28
71
5
14
6
17
18
33
11
21
16
40
63
29
0
Sout
h Th
iladh
unm
athi
(HDh
)6,
039
2,40
0
34
6
1,50
2
18
7
60
56
57
90
292
69
61
8
35
10
14
33
29
15
25
23
50
18
6
491
Nort
h M
iladh
unm
adul
u (S
h)5,
129
1,24
2
48
140
2,
421
222
12
0
52
10
0
217
40
51
11
10
17
10
22
12
21
18
9
24
86
236
Sout
h M
iladh
unm
adul
u (N
)3,
955
1,41
1
65
57
11
6
947
11
6
55
25
1
224
27
40
14
19
8
22
45
28
10
20
20
33
66
361
Nort
h M
aalh
osm
adul
u (R
)6,
603
1,57
7
48
54
94
111
3,
618
126
16
6
138
30
25
7
15
7
10
39
16
15
28
11
39
10
6
323
Sout
h M
aalh
osm
adul
u (B
)4,
299
1,29
8
47
66
73
54
19
6
1,35
3
11
0
223
62
62
16
10
6
8
21
30
15
44
30
82
12
9
364
Faad
hipp
olhu
(Lh)
2,85
3
1,
027
51
37
74
26
3
112
34
565
11
2
37
24
2
13
5
7
20
20
22
39
21
51
112
20
5
Mal
e' A
toll (
K)9,
861
3,17
5
44
2
553
22
3
265
24
8
209
29
8
1,36
4
18
0
258
60
112
53
224
13
7
137
10
5
162
24
2
544
20
9
661
Nort
h Ar
i Ato
ll (AA
)2,
574
906
95
132
41
41
69
75
41
129
29
0
191
6
25
22
8
10
19
13
30
30
91
45
265
Sout
h Ar
i Ato
ll (AD
h)4,
285
1,27
1
12
0
107
85
72
58
66
62
227
23
9
674
33
112
25
63
41
53
20
50
62
117
88
640
Felid
hu A
toll (
V)75
8
343
9
8
10
10
12
6
4
33
5
19
16
5
26
9
6
3
18
1
3
5
4
23
36
Mul
akat
holh
u (M
)1,
882
932
30
33
19
27
13
18
10
57
12
23
30
343
12
42
36
37
11
11
8
27
41
110
Nort
h Ni
land
he A
toll (
F)1,
083
478
14
13
5
2
11
15
15
31
8
16
6
13
16
4
34
24
20
11
24
3
25
24
127
Sout
h Ni
land
he A
toll (
Dh)
2,71
7
1,
020
46
39
20
28
38
19
11
14
2
24
67
9
60
45
76
4
44
48
11
21
17
60
38
14
6
Kolh
umad
ulu
(Th)
3,59
5
1,
923
20
24
13
23
29
21
14
61
10
14
6
27
11
35
804
12
5
8
33
4
29
98
26
3
Hadh
dhun
mat
hi (L
)4,
130
1,53
4
30
25
21
36
24
24
30
75
19
27
2
21
18
42
11
9
1,40
3
41
48
17
45
96
433
Nort
h Hu
vadh
u At
oll (
GA)
2,90
8
1,
246
23
12
17
16
16
19
25
10
7
9
25
1
13
7
7
18
59
432
28
9
60
14
3
76
28
8
Sout
h Hu
vadh
u At
oll (
GDh)
4,04
2
1,
922
15
19
11
14
7
14
30
68
12
21
-
8
17
19
24
32
20
5
655
93
220
92
544
Gnav
iyan
i (Gn
)2,
038
1,12
2
13
36
7
17
17
22
21
104
24
28
-
3
5
19
8
15
36
85
-
185
14
3
128
Addu
(S)
6,65
6
3,
245
36
33
32
34
29
40
34
43
1
88
77
7
21
10
33
19
35
105
19
2
202
95
2
503
49
8
Not S
tate
d20
0
29
7
14
6
5
2
11
6
10
2
6
-
2
3
5
5
9
2
5
4
11
7
49
TAB
LE M
G 1
0 : P
OPU
LATI
ON
WIT
H A
DIF
FER
ENT
USU
AL A
ND
PR
EVIO
US
RES
IDEN
CE,
BY
PLAC
E O
F U
SUAL
RES
IDEN
CE
AND
PR
EVIO
US
RES
IDEN
CE,
SEX
AN
D L
OC
ALIT
Y (A
TOLL
), 20
14
Plac
e of
usu
al re
siden
cePl
ace
of p
revi
ous r
esid
ence
Not
st
ated

61
National Bureau of Statistics
Repu
blic
Mal
e'HA
HDh
ShN
RB
LhK
AAAD
hV
MF
DhTh
LGA
GDh
GnS
Abro
ad(1
)(2
)(3
)(4
)(5
)(6
)(7
)(8
)(9
)(1
0)(1
1)(1
2)(1
3)(1
4)(1
5)(1
6)(1
7)(1
8)(1
9)(2
0)(2
1)(2
2)(2
3)(2
4)(2
5)
TAB
LE M
G 1
0 : P
OPU
LATI
ON
WIT
H A
DIF
FER
ENT
USU
AL A
ND
PR
EVIO
US
RES
IDEN
CE,
BY
PLAC
E O
F U
SUAL
RES
IDEN
CE
AND
PR
EVIO
US
RES
IDEN
CE,
SEX
AN
D L
OC
ALIT
Y (A
TOLL
), 20
14
Plac
e of
usu
al re
siden
cePl
ace
of p
revi
ous r
esid
ence
Not
st
ated
Mal
e Both
Sex
es79
,431
15
,440
3,68
3
3,
623
3,04
6
2,
684
4,22
0
2,
805
2,47
9
4,
761
1,43
0
2,
044
521
1,
231
687
1,
394
2,65
4
2,
418
2,16
8
3,
264
1,31
5
4,
064
7,45
0
6,
050
Mal
e'
33,6
68
-
2,21
8
1,
935
1,36
0
1,
301
1,80
0
1,
376
1,25
0
1,
060
546
66
0
265
72
5
446
65
1
1,89
5
1,
244
1,55
6
2,
339
737
2,
325
6,02
4
1,
955
At
olls
(Inclu
des A
dmin
istra
tive
and
Non-
Adm
inist
rativ
e Isl
ands
)45
,586
15
,414
1,45
9
1,
674
1,68
0
1,
380
2,41
8
1,
418
1,22
3
3,
691
882
1,
379
256
50
5
239
74
1
755
1,
167
611
92
0
575
1,
731
1,41
9
4,
049
Nort
h Th
iladh
unm
athi
(HA)
2,06
5
82
3
459
13
0
16
37
10
16
39
17
0
23
60
1
4
1
5
8
18
3
9
9
29
41
15
4
Sout
h Th
iladh
unm
athi
(HDh
)3,
017
1,14
7
16
5
585
57
33
23
28
49
262
58
50
4
18
3
5
20
13
11
11
11
24
15
4
286
Nort
h M
iladh
unm
adul
u (S
h)2,
584
675
24
63
1,
017
102
62
33
42
199
35
36
7
5
10
8
12
6
12
4
6
10
70
146
Sout
h M
iladh
unm
adul
u (N
)2,
135
660
37
35
63
491
59
37
13
2
191
22
36
9
9
4
16
22
12
7
10
11
23
40
209
Nort
h M
aalh
osm
adul
u (R
)3,
243
759
21
18
42
60
1,
674
67
97
103
24
23
4
9
2
7
26
8
10
7
5
24
69
184
Sout
h M
aalh
osm
adul
u (B
)2,
549
605
30
41
55
42
11
2
795
80
207
49
54
9
5
5
4
8
16
8
27
25
60
81
231
Faad
hipp
olhu
(Lh)
1,57
0
48
8
27
21
38
13
8
61
23
337
74
16
20
1
9
3
5
11
9
15
19
12
36
72
13
5
Mal
e' A
toll (
K)7,
818
2,16
3
39
4
464
19
4
242
19
8
184
24
5
1,22
7
14
5
230
34
78
30
142
10
3
109
71
121
21
9
501
15
7
567
Nort
h Ar
i Ato
ll (AA
)1,
666
464
63
103
35
36
54
55
26
118
18
7
132
6
19
10
6
7
12
11
17
25
80
30
170
Sout
h Ar
i Ato
ll (AD
h)2,
967
676
10
4
81
75
63
43
56
58
206
16
4
480
20
64
11
43
22
42
17
40
53
102
45
502
Felid
hu A
toll (
V)44
1
167
5
4
5
6
10
4
3
23
5
16
12
0
11
4
5
-
9
-
3
3
4
12
22
Mul
akat
holh
u (M
)96
7
442
15
15
11
17
7
9
3
47
8
17
18
180
4
22
19
15
7
2
1
11
27
70
Nort
h Ni
land
he A
toll (
F)54
5
227
5
7
3
1
5
10
3
19
5
11
5
8
82
24
13
11
6
12
2
16
13
57
Sout
h Ni
land
he A
toll (
Dh)
1,54
4
53
5
26
29
17
21
25
15
9
13
2
22
61
6
32
25
35
8
16
29
9
15
15
41
22
84
Kolh
umad
ulu
(Th)
1,87
7
98
8
10
13
10
18
19
12
9
44
6
11
2
14
6
19
370
64
6
15
3
19
69
15
0
Hadh
dhun
mat
hi (L
)2,
202
804
19
10
10
22
12
17
18
55
16
21
2
14
13
25
63
702
21
22
8
29
47
252
Nort
h Hu
vadh
u At
oll (
GA)
1,72
7
70
4
17
10
11
9
14
16
18
80
8
21
1
8
5
4
9
44
238
16
3
38
80
50
17
9
Sout
h Hu
vadh
u At
oll (
GDh)
2,15
8
1,
070
8
14
5
7
3
4
20
57
9
14
-
4
11
7
10
16
90
289
48
114
70
288
Gnav
iyan
i (Gn
)1,
031
507
8
15
4
12
11
14
13
87
18
20
-
3
4
11
3
6
19
44
-
88
72
72
Addu
(S)
3,48
0
1,
510
22
16
12
23
16
23
22
39
0
62
66
7
11
6
25
13
26
50
90
81
44
0
278
29
1
Not S
tate
d17
7
26
6
14
6
3
2
11
6
10
2
5
-
1
2
2
4
7
1
5
3
8
7
46
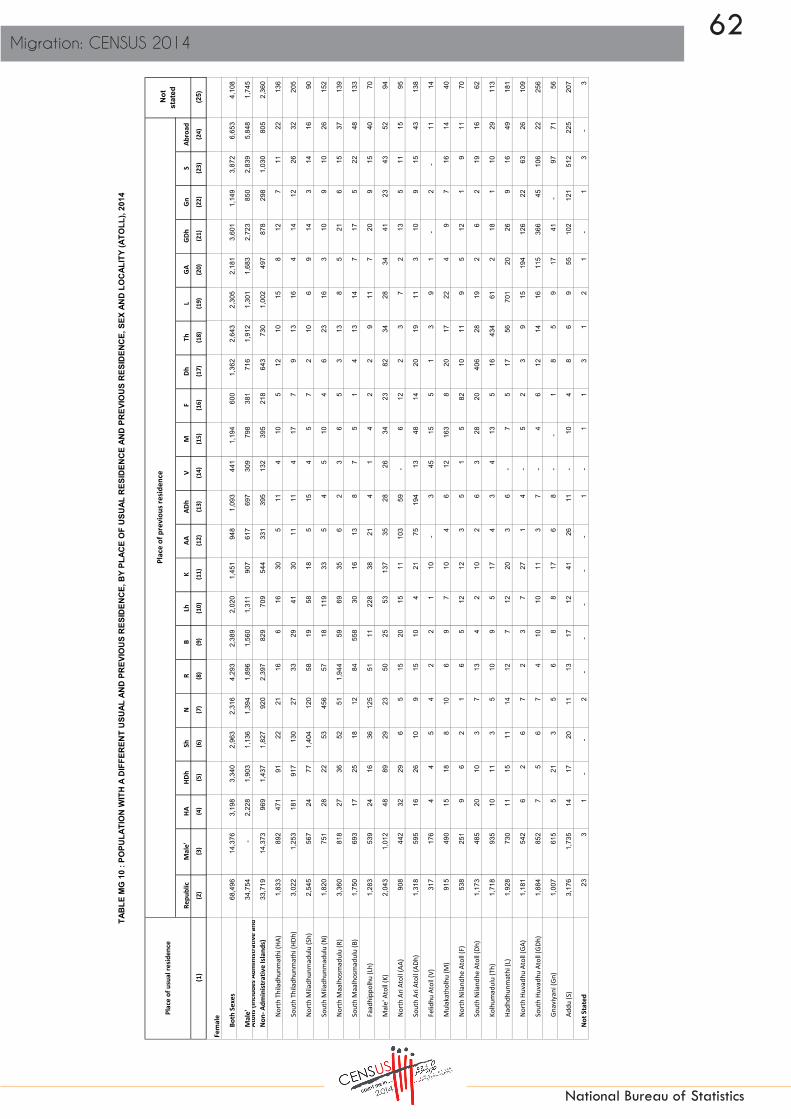
62Migration: CENSUS 2014
National Bureau of Statistics
Repu
blic
Mal
e'HA
HDh
ShN
RB
LhK
AAAD
hV
MF
DhTh
LGA
GDh
GnS
Abro
ad(1
)(2
)(3
)(4
)(5
)(6
)(7
)(8
)(9
)(1
0)(1
1)(1
2)(1
3)(1
4)(1
5)(1
6)(1
7)(1
8)(1
9)(2
0)(2
1)(2
2)(2
3)(2
4)(2
5)
TAB
LE M
G 1
0 : P
OPU
LATI
ON
WIT
H A
DIF
FER
ENT
USU
AL A
ND
PR
EVIO
US
RES
IDEN
CE,
BY
PLAC
E O
F U
SUAL
RES
IDEN
CE
AND
PR
EVIO
US
RES
IDEN
CE,
SEX
AN
D L
OC
ALIT
Y (A
TOLL
), 20
14
Plac
e of
usu
al re
siden
cePl
ace
of p
revi
ous r
esid
ence
Not
st
ated
Fem
ale
Both
Sex
es68
,496
14
,376
3,19
8
3,
340
2,96
3
2,
316
4,29
3
2,
389
2,02
0
1,
451
948
1,
093
441
1,
194
600
1,
362
2,64
3
2,
305
2,18
1
3,
601
1,14
9
3,
872
6,65
3
4,
108
Mal
e'
34,7
54
-
2,22
8
1,
903
1,13
6
1,
394
1,89
6
1,
560
1,31
1
90
7
617
69
7
309
79
8
381
71
6
1,91
2
1,
301
1,68
3
2,
723
850
2,
839
5,84
8
1,
745
At
olls
(Inclu
des A
dmin
istra
tive
and
Non-
Adm
inist
rativ
e Isl
ands
)33
,719
14
,373
969
1,
437
1,82
7
92
0
2,39
7
82
9
709
54
4
331
39
5
132
39
5
218
64
3
730
1,
002
497
87
8
298
1,
030
805
2,
360
Nort
h Th
iladh
unm
athi
(HA)
1,83
3
89
2
471
91
22
21
16
6
16
30
5
11
4
10
5
12
10
15
8
12
7
11
22
13
6
Sout
h Th
iladh
unm
athi
(HDh
)3,
022
1,25
3
18
1
917
13
0
27
33
29
41
30
11
11
4
17
7
9
13
16
4
14
12
26
32
205
Nort
h M
iladh
unm
adul
u (S
h)2,
545
567
24
77
1,
404
120
58
19
58
18
5
15
4
5
7
2
10
6
9
14
3
14
16
90
Sout
h M
iladh
unm
adul
u (N
)1,
820
751
28
22
53
456
57
18
11
9
33
5
4
5
10
4
6
23
16
3
10
9
10
26
152
Nort
h M
aalh
osm
adul
u (R
)3,
360
818
27
36
52
51
1,
944
59
69
35
6
2
3
6
5
3
13
8
5
21
6
15
37
139
Sout
h M
aalh
osm
adul
u (B
)1,
750
693
17
25
18
12
84
558
30
16
13
8
7
5
1
4
13
14
7
17
5
22
48
133
Faad
hipp
olhu
(Lh)
1,28
3
53
9
24
16
36
12
5
51
11
228
38
21
4
1
4
2
2
9
11
7
20
9
15
40
70
Mal
e' A
toll (
K)2,
043
1,01
2
48
89
29
23
50
25
53
137
35
28
26
34
23
82
34
28
34
41
23
43
52
94
Nort
h Ar
i Ato
ll (AA
)90
8
442
32
29
6
5
15
20
15
11
10
3
59
-
6
12
2
3
7
2
13
5
11
15
95
Sout
h Ar
i Ato
ll (AD
h)1,
318
595
16
26
10
9
15
10
4
21
75
194
13
48
14
20
19
11
3
10
9
15
43
138
Felid
hu A
toll (
V)31
7
176
4
4
5
4
2
2
1
10
-
3
45
15
5
1
3
9
1
-
2
-
11
14
Mul
akat
holh
u (M
)91
5
490
15
18
8
10
6
9
7
10
4
6
12
163
8
20
17
22
4
9
7
16
14
40
Nort
h Ni
land
he A
toll (
F)53
8
251
9
6
2
1
6
5
12
12
3
5
1
5
82
10
11
9
5
12
1
9
11
70
Sout
h Ni
land
he A
toll (
Dh)
1,17
3
48
5
20
10
3
7
13
4
2
10
2
6
3
28
20
40
6
28
19
2
6
2
19
16
62
Kolh
umad
ulu
(Th)
1,71
8
93
5
10
11
3
5
10
9
5
17
4
3
4
13
5
16
434
61
2
18
1
10
29
11
3
Hadh
dhun
mat
hi (L
)1,
928
730
11
15
11
14
12
7
12
20
3
6
-
7
5
17
56
70
1
20
26
9
16
49
18
1
Nort
h Hu
vadh
u At
oll (
GA)
1,18
1
54
2
6
2
6
7
2
3
7
27
1
4
-
5
2
3
9
15
19
4
126
22
63
26
109
Sout
h Hu
vadh
u At
oll (
GDh)
1,88
4
85
2
7
5
6
7
4
10
10
11
3
7
-
4
6
12
14
16
11
5
366
45
106
22
256
Gnav
iyan
i (Gn
)1,
007
615
5
21
3
5
6
8
8
17
6
8
-
-
1
8
5
9
17
41
-
97
71
56
Addu
(S)
3,17
6
1,
735
14
17
20
11
13
17
12
41
26
11
-
10
4
8
6
9
55
102
12
1
512
22
5
207
Not S
tate
d23
3
1
-
-
2
-
-
-
-
-
1
-
1
1
3
1
2
1
-
1
3
-
3

63
National Bureau of Statistics
For Education
For Employment/ seeking work
Return migrant to live in this island
Due to family migration to live with them
Due to marriage
As Parent/ Guardian
For Medical Purpose
Move to this island due to Tsunami
Due to Population Consolidation Programme (not related to Tsunami)
Other reason
Not Stated
(1)
(2)
(3)
(4)
(5)
(6)
(7)
(8)
(9)
(10)
(11)
(12)
(13)
Both
Sex
esRe
publ
ic14
7,92
7
32,1
57
23,9
42
37
,175
17,4
30
10
,704
4,
323
1,50
3
3,
344
3,47
3
3,
032
10,8
44
Mal
e'
68,4
22
28
,007
9,
248
9,
101
8,
610
2,
679
3,67
8
1,
231
147
56
1,24
4
4,
421
Atol
ls (In
clude
s Adm
inist
rativ
e an
d No
n-
Adm
inist
rativ
e Isl
ands
)79
,305
4,13
6
14
,616
28,0
65
8,
815
8,
018
642
26
8
3,19
7
3,
415
1,78
1
6,
352
Nort
h Th
iladh
unm
athi
(HA)
3,89
8
255
65
1
1,
806
34
8
46
0
22
15
13
64
77
18
7
Sout
h Th
iladh
unm
athi
(HDh
)6,
039
37
3
346
2,74
4
694
578
91
32
6
625
11
6
434
No
rth
Mila
dhun
mad
ulu
(Sh)
5,12
9
125
38
6
1,
613
43
2
37
9
17
8
10
1,
764
68
32
7
Sout
h M
iladh
unm
adul
u (N
)3,
955
22
7
652
1,72
7
484
451
24
12
1
38
96
243
No
rth
Maa
lhos
mad
ulu
(R)
6,60
3
190
38
6
1,
861
50
2
53
4
16
13
2,24
7
47
2
86
29
6
Sout
h M
aalh
osm
adul
u (B
)4,
299
33
5
1,01
9
1,48
2
333
430
73
4
4
107
85
427
Fa
adhi
ppol
hu (L
h)2,
853
19
3
668
974
365
345
50
12
-
13
95
13
8
Mal
e' A
toll (
K)9,
861
20
6
4,77
1
1,53
1
509
638
43
29
12
6
21
11
0
1,87
7
No
rth
Ari A
toll (
AA)
2,57
4
124
85
6
82
0
19
4
31
9
15
3
1
9
53
18
0
Sout
h Ar
i Ato
ll (AD
h)4,
285
18
9
1,69
5
1,17
5
358
356
16
15
69
5
11
4
293
Fe
lidhu
Ato
ll (V)
758
68
158
312
48
91
22
9
-
-
22
28
M
ulak
atho
lhu
(M)
1,88
2
107
17
1
92
9
19
2
28
8
14
4
3
15
56
10
3
Nort
h Ni
land
he A
toll (
F)1,
083
82
83
49
3
14
6
15
4
1
4
-
5
14
101
So
uth
Nila
ndhe
Ato
ll (Dh
)2,
717
23
2
513
774
311
285
38
2
29
1
64
48
159
Ko
lhum
adul
u (T
h)3,
595
16
1
281
1,75
2
675
354
17
10
4
-
106
23
5
Hadh
dhun
mat
hi (L
)4,
130
41
5
360
1,40
8
522
561
48
17
41
5
17
10
6
261
No
rth
Huva
dhu
Atol
l (GA
)2,
908
15
1
539
1,08
2
350
339
22
7
1
105
85
227
So
uth
Huva
dhu
Atol
l (GD
h)4,
042
32
6
307
1,68
9
664
468
44
16
1
30
17
2
325
Gn
aviy
ani (
Gn)
2,03
8
81
119
1,12
4
363
170
14
4
2
-
41
12
0
Addu
(S)
6,65
6
296
65
5
2,
769
1,
325
81
8
55
52
3
61
231
39
1
Not S
tate
d20
014
789
57
34
02
771
Loca
lity
Tot
al
Mai
n re
ason
for m
ovin
g to
cur
rent
resi
denc
e
TAB
LE M
G 1
1: R
ESID
ENT
MAL
DIV
IAN
PO
PULA
TIO
N W
ITH
A D
IFFE
REN
T PR
EVIO
US
RES
IDEN
CE
BY
REA
SON
S FO
R M
IGR
ATIO
N, S
EX A
ND
LO
CAL
ITY
(ATO
LLS)
, 201
4
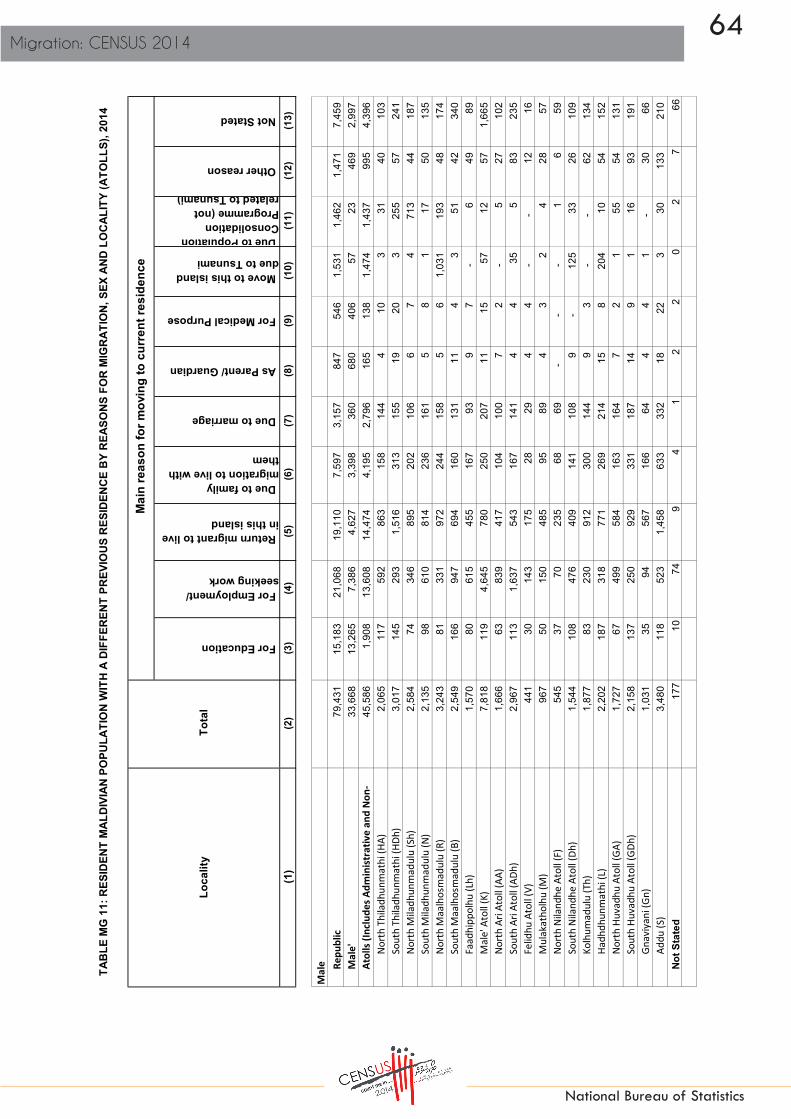
64Migration: CENSUS 2014
National Bureau of Statistics
For Education
For Employment/ seeking work
Return migrant to live in this island
Due to family migration to live with them
Due to marriage
As Parent/ Guardian
For Medical Purpose
Move to this island due to Tsunami
Due to Population Consolidation Programme (not related to Tsunami)
Other reason
Not Stated
(1)
(2)
(3)
(4)
(5)
(6)
(7)
(8)
(9)
(10)
(11)
(12)
(13)
Loca
lity
Tot
al
Mai
n re
ason
for m
ovin
g to
cur
rent
resi
denc
e
TAB
LE M
G 1
1: R
ESID
ENT
MAL
DIV
IAN
PO
PULA
TIO
N W
ITH
A D
IFFE
REN
T PR
EVIO
US
RES
IDEN
CE
BY
REA
SON
S FO
R M
IGR
ATIO
N, S
EX A
ND
LO
CAL
ITY
(ATO
LLS)
, 201
4
Mal
e Repu
blic
79,4
31
15
,183
21
,068
19,1
10
7,
597
3,
157
847
54
6
1,53
1
1,
462
1,47
1
7,
459
Mal
e'
33,6
68
13
,265
7,
386
4,
627
3,
398
36
0
680
40
6
57
23
469
2,
997
Atol
ls (In
clude
s Adm
inist
rativ
e an
d No
n-
45,5
86
1,
908
13,6
08
14
,474
4,19
5
2,79
6
16
5
138
1,
474
1,43
7
99
5
4,39
6
No
rth
Thila
dhun
mat
hi (H
A)2,
065
11
7
592
863
158
144
4
10
3
31
40
103
So
uth
Thila
dhun
mat
hi (H
Dh)
3,01
7
145
29
3
1,
516
31
3
15
5
19
20
3
25
5
57
24
1
Nort
h M
iladh
unm
adul
u (S
h)2,
584
74
34
6
89
5
20
2
10
6
6
7
4
71
3
44
18
7
Sout
h M
iladh
unm
adul
u (N
)2,
135
98
61
0
81
4
23
6
16
1
5
8
1
17
50
13
5
Nort
h M
aalh
osm
adul
u (R
)3,
243
81
33
1
97
2
24
4
15
8
5
6
1,03
1
19
3
48
17
4
Sout
h M
aalh
osm
adul
u (B
)2,
549
16
6
947
694
160
131
11
4
3
51
42
340
Fa
adhi
ppol
hu (L
h)1,
570
80
61
5
45
5
16
7
93
9
7
-
6
49
89
M
ale'
Ato
ll (K)
7,81
8
119
4,
645
78
0
25
0
20
7
11
15
57
12
57
1,
665
Nort
h Ar
i Ato
ll (AA
)1,
666
63
83
9
41
7
10
4
10
0
7
2
-
5
27
102
So
uth
Ari A
toll (
ADh)
2,96
7
113
1,
637
54
3
16
7
14
1
4
4
35
5
83
23
5
Felid
hu A
toll (
V)44
1
30
14
3
17
5
28
29
4
4
-
-
12
16
Mul
akat
holh
u (M
)96
7
50
15
0
48
5
95
89
4
3
2
4
28
57
Nort
h Ni
land
he A
toll (
F)54
5
37
70
23
5
68
69
-
-
-
1
6
59
So
uth
Nila
ndhe
Ato
ll (Dh
)1,
544
10
8
476
409
141
108
9
-
125
33
26
10
9
Kolh
umad
ulu
(Th)
1,87
7
83
230
912
300
144
9
3
-
-
62
134
Ha
dhdh
unm
athi
(L)
2,20
2
187
31
8
77
1
26
9
21
4
15
8
204
10
54
15
2
Nort
h Hu
vadh
u At
oll (
GA)
1,72
7
67
499
584
163
164
7
2
1
55
54
131
So
uth
Huva
dhu
Atol
l (GD
h)2,
158
13
7
250
929
331
187
14
9
1
16
93
191
Gn
aviy
ani (
Gn)
1,03
1
35
94
567
166
64
4
4
1
-
30
66
Addu
(S)
3,48
0
118
52
3
1,
458
63
3
33
2
18
22
3
30
133
21
0
Not S
tate
d17
710
749
41
22
02
766
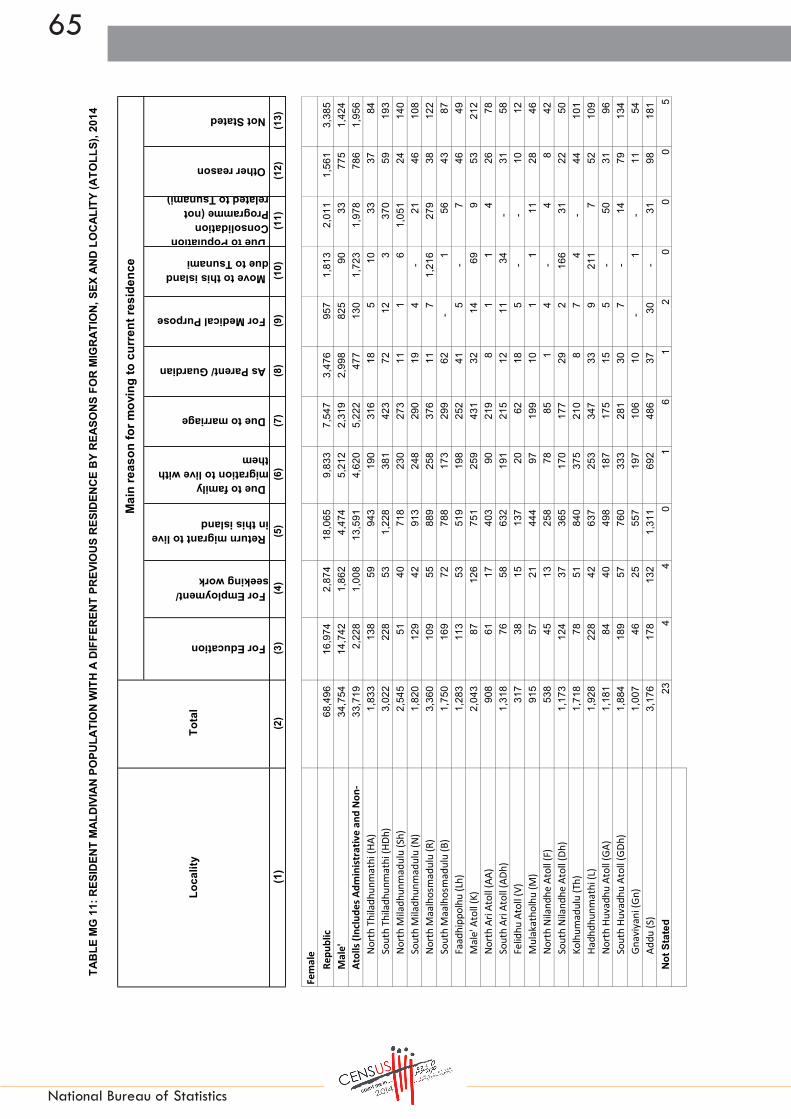
65
National Bureau of Statistics
For Education
For Employment/ seeking work
Return migrant to live in this island
Due to family migration to live with them
Due to marriage
As Parent/ Guardian
For Medical Purpose
Move to this island due to Tsunami
Due to Population Consolidation Programme (not related to Tsunami)
Other reason
Not Stated
(1)
(2)
(3)
(4)
(5)
(6)
(7)
(8)
(9)
(10)
(11)
(12)
(13)
Loca
lity
Tot
al
Mai
n re
ason
for m
ovin
g to
cur
rent
resi
denc
e
TAB
LE M
G 1
1: R
ESID
ENT
MAL
DIV
IAN
PO
PULA
TIO
N W
ITH
A D
IFFE
REN
T PR
EVIO
US
RES
IDEN
CE
BY
REA
SON
S FO
R M
IGR
ATIO
N, S
EX A
ND
LO
CAL
ITY
(ATO
LLS)
, 201
4
Fem
ale
Repu
blic
68,4
96
16
,974
2,
874
18
,065
9,83
3
7,54
7
3,
476
957
1,
813
2,01
1
1,
561
3,38
5
M
ale'
34
,754
14,7
42
1,86
2
4,47
4
5,21
2
2,31
9
2,
998
825
90
33
77
5
1,42
4
At
olls
(Inclu
des A
dmin
istra
tive
and
Non-
33
,719
2,22
8
1,
008
13
,591
4,62
0
5,22
2
47
7
130
1,
723
1,97
8
78
6
1,95
6
No
rth
Thila
dhun
mat
hi (H
A)1,
833
13
8
59
943
190
316
18
5
10
33
37
84
So
uth
Thila
dhun
mat
hi (H
Dh)
3,02
2
228
53
1,
228
38
1
42
3
72
12
3
37
0
59
19
3
Nort
h M
iladh
unm
adul
u (S
h)2,
545
51
40
71
8
23
0
27
3
11
1
6
1,
051
24
14
0
Sout
h M
iladh
unm
adul
u (N
)1,
820
12
9
42
913
248
290
19
4
-
21
46
10
8
Nort
h M
aalh
osm
adul
u (R
)3,
360
10
9
55
889
258
376
11
7
1,
216
279
38
122
So
uth
Maa
lhos
mad
ulu
(B)
1,75
0
169
72
78
8
17
3
29
9
62
-
1
56
43
87
Fa
adhi
ppol
hu (L
h)1,
283
11
3
53
519
198
252
41
5
-
7
46
49
Mal
e' A
toll (
K)2,
043
87
12
6
75
1
25
9
43
1
32
14
69
9
53
21
2
Nort
h Ar
i Ato
ll (AA
)90
8
61
17
40
3
90
21
9
8
1
1
4
26
78
Sout
h Ar
i Ato
ll (AD
h)1,
318
76
58
63
2
19
1
21
5
12
11
34
-
31
58
Fe
lidhu
Ato
ll (V)
317
38
15
137
20
62
18
5
-
-
10
12
M
ulak
atho
lhu
(M)
915
57
21
444
97
199
10
1
1
11
28
46
No
rth
Nila
ndhe
Ato
ll (F)
538
45
13
258
78
85
1
4
-
4
8
42
Sout
h Ni
land
he A
toll (
Dh)
1,17
3
124
37
36
5
17
0
17
7
29
2
166
31
22
50
Kolh
umad
ulu
(Th)
1,71
8
78
51
840
375
210
8
7
4
-
44
10
1
Hadh
dhun
mat
hi (L
)1,
928
22
8
42
637
253
347
33
9
21
1
7
52
109
No
rth
Huva
dhu
Atol
l (GA
)1,
181
84
40
49
8
18
7
17
5
15
5
-
50
31
96
So
uth
Huva
dhu
Atol
l (GD
h)1,
884
18
9
57
760
333
281
30
7
-
14
79
13
4
Gnav
iyan
i (Gn
)1,
007
46
25
55
7
19
7
10
6
10
-
1
-
11
54
Addu
(S)
3,17
6
178
13
2
1,
311
69
2
48
6
37
30
-
31
98
181
No
t Sta
ted
234
40
16
12
00
05
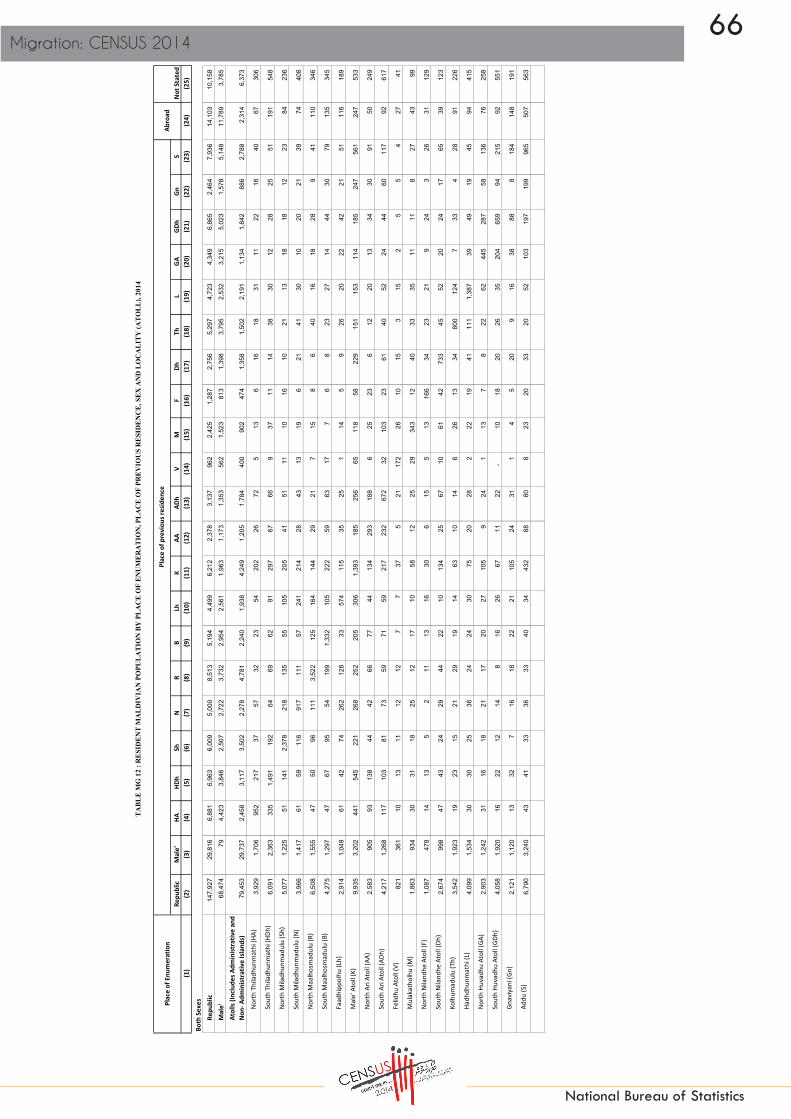
66Migration: CENSUS 2014
National Bureau of Statistics
Repu
blic
Mal
e'HA
HDh
ShN
RB
LhK
AAAD
hV
MF
DhTh
LGA
GDh
GnS
(1)
(2)
(3)
(4)
(5)
(6)
(7)
(8)
(9)
(10)
(11)
(12)
(13)
(14)
(15)
(16)
(17)
(18)
(19)
(20)
(21)
(22)
(23)
(24)
(25)
Both
Sex
esRe
publ
ic14
7,92
7
29
,816
6,
881
6,
963
6,
009
5,
000
8,
513
5,
194
4,
499
6,
212
2,
378
3,
137
96
2
2,42
5
1,28
7
2,
756
5,
297
4,
723
4,
349
6,
865
2,
464
7,
936
14
,103
10,1
58
Mal
e'
68,4
74
79
4,42
3
3,84
6
2,50
7
2,72
2
3,73
2
2,95
4
2,56
1
1,96
3
1,17
3
1,35
3
562
1,
523
81
3
1,39
8
3,79
5
2,53
2
3,21
5
5,02
3
1,57
8
5,14
8
11,7
89
3,
785
Atol
ls (In
clude
s Adm
inist
rativ
e an
d No
n- A
dmin
istra
tive
Islan
ds)
79,4
53
29,7
37
2,45
8
3,11
7
3,50
2
2,27
8
4,78
1
2,24
0
1,93
8
4,24
9
1,20
5
1,78
4
400
90
2
47
4
1,35
8
1,50
2
2,19
1
1,13
4
1,84
2
886
2,78
8
2,31
4
6,37
3
Nort
h Th
iladh
unm
athi
(HA)
3,92
9
1,
706
95
2
21
7
37
57
32
23
54
202
26
72
5
13
6
16
18
31
11
22
16
40
67
306
Sout
h Th
iladh
unm
athi
(HDh
)6,
091
2,36
3
335
1,49
1
192
64
69
62
91
297
67
66
9
37
11
14
38
30
12
28
25
51
19
1
54
8
Nort
h M
iladh
unm
adul
u (S
h)5,
077
1,22
5
51
14
1
2,
378
21
8
13
5
55
105
205
41
51
11
10
16
10
21
13
18
18
12
23
84
236
Sout
h M
iladh
unm
adul
u (N
)3,
966
1,41
7
61
59
116
917
111
57
24
1
21
4
28
43
13
19
6
21
41
30
10
20
21
39
74
408
Nort
h M
aalh
osm
adul
u (R
)6,
508
1,55
5
47
50
96
11
1
3,
522
12
5
16
4
14
4
29
21
7
15
8
6
40
16
18
28
9
41
11
0
34
6
Sout
h M
aalh
osm
adul
u (B
)4,
275
1,29
7
47
67
95
54
199
1,33
2
105
222
59
63
17
7
6
8
23
27
14
44
30
79
13
5
34
5
Faad
hipp
olhu
(Lh)
2,91
4
1,
049
61
42
74
262
128
33
57
4
11
5
35
25
1
14
5
9
26
20
22
42
21
51
116
189
Mal
e' A
toll (
K)9,
935
3,20
2
441
545
221
268
252
205
306
1,39
3
185
256
65
11
8
58
229
151
153
114
185
247
561
247
533
Nort
h Ar
i Ato
ll (AA
)2,
583
905
93
13
8
44
42
66
77
44
134
293
188
6
25
23
6
12
20
13
34
30
91
50
249
Sout
h Ar
i Ato
ll (AD
h)4,
217
1,26
8
117
103
81
73
59
71
59
21
7
23
2
67
2
32
103
23
61
40
52
24
44
60
11
7
92
61
7
Felid
hu A
toll (
V)82
1
361
10
13
11
12
12
7
7
37
5
21
17
2
26
10
15
3
15
2
5
5
4
27
41
Mul
akat
holh
u (M
)1,
863
934
30
31
18
25
12
17
10
58
12
25
29
34
3
12
40
33
35
11
11
8
27
43
99
Nort
h Ni
land
he A
toll (
F)1,
087
478
14
13
5
2
11
13
16
30
6
15
5
13
166
34
23
21
9
24
3
26
31
129
Sout
h Ni
land
he A
toll (
Dh)
2,67
4
99
8
47
43
24
29
44
22
10
134
25
67
10
61
42
73
3
45
52
20
24
17
65
39
12
3
Kolh
umad
ulu
(Th)
3,54
2
1,
923
19
23
15
21
29
19
14
63
10
14
6
26
13
34
800
124
7
33
4
28
91
226
Hadh
dhun
mat
hi (L
)4,
099
1,53
4
30
30
25
36
24
24
30
75
20
28
2
22
19
41
11
1
1,
387
39
49
19
45
94
41
5
Nort
h Hu
vadh
u At
oll (
GA)
2,90
3
1,
242
31
16
18
21
17
20
27
105
9
24
1
13
7
8
22
62
445
287
58
13
6
76
25
8
Sout
h Hu
vadh
u At
oll (
GDh)
4,05
8
1,
920
16
22
12
14
8
16
26
67
11
22
-
10
18
20
26
35
204
659
94
21
5
92
55
1
Gnav
iyani
(Gn)
2,12
1
1,
120
13
32
7
16
18
22
21
10
5
24
31
1
4
5
20
9
16
38
88
8
18
4
14
8
19
1
Addu
(S)
6,79
0
3,
240
43
41
33
36
33
40
34
432
88
80
8
23
20
33
20
52
10
3
19
7
19
9
96
5
50
7
56
3
TA
BL
E M
G 1
2 : R
ESI
DE
NT
MA
LD
IVIA
N P
OPU
LA
TIO
N B
Y P
LA
CE
OF
EN
UM
ER
AT
ION
, PL
AC
E O
F PR
EV
IOU
S R
ESI
DE
NC
E, S
EX
AN
D L
OC
AL
ITY
(AT
OL
L),
2014
Plac
e of
Enu
mer
atio
nPl
ace
of p
revi
ous r
esid
ence
Abro
ad N
ot S
tate
d
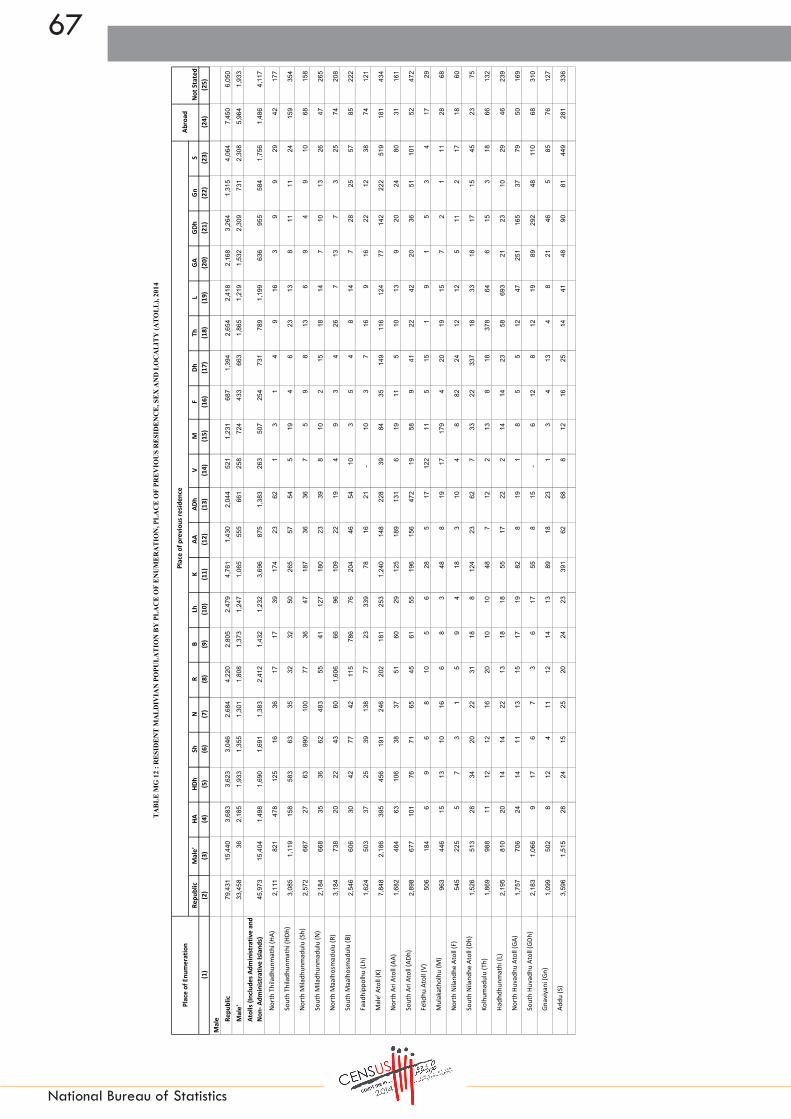
67
National Bureau of Statistics
Repu
blic
Mal
e'HA
HDh
ShN
RB
LhK
AAAD
hV
MF
DhTh
LGA
GDh
GnS
(1)
(2)
(3)
(4)
(5)
(6)
(7)
(8)
(9)
(10)
(11)
(12)
(13)
(14)
(15)
(16)
(17)
(18)
(19)
(20)
(21)
(22)
(23)
(24)
(25)
TA
BL
E M
G 1
2 : R
ESI
DE
NT
MA
LD
IVIA
N P
OPU
LA
TIO
N B
Y P
LA
CE
OF
EN
UM
ER
AT
ION
, PL
AC
E O
F PR
EV
IOU
S R
ESI
DE
NC
E, S
EX
AN
D L
OC
AL
ITY
(AT
OL
L),
2014
Plac
e of
Enu
mer
atio
nPl
ace
of p
revi
ous r
esid
ence
Abro
ad N
ot S
tate
d
Mal
e Repu
blic
79,4
31
15,4
40
3,68
3
3,62
3
3,04
6
2,68
4
4,22
0
2,80
5
2,47
9
4,76
1
1,43
0
2,04
4
521
1,
231
68
7
1,39
4
2,65
4
2,41
8
2,16
8
3,26
4
1,31
5
4,06
4
7,45
0
6,05
0
Mal
e'
33,4
58
36
2,18
5
1,93
3
1,35
5
1,30
1
1,80
8
1,37
3
1,24
7
1,06
5
555
661
258
72
4
43
3
663
1,86
5
1,21
9
1,53
2
2,30
9
731
2,30
8
5,96
4
1,93
3
Atol
ls (In
clude
s Adm
inist
rativ
e an
d No
n- A
dmin
istra
tive
Islan
ds)
45,9
73
15,4
04
1,49
8
1,69
0
1,69
1
1,38
3
2,41
2
1,43
2
1,23
2
3,69
6
875
1,38
3
263
50
7
25
4
731
789
1,19
9
636
955
584
1,75
6
1,48
6
4,11
7
Nort
h Th
iladh
unm
athi
(HA)
2,11
1
82
1
47
8
12
5
16
36
17
17
39
174
23
62
1
3
1
4
9
16
3
9
9
29
42
177
Sout
h Th
iladh
unm
athi
(HDh
)3,
085
1,11
9
158
583
63
35
32
32
50
26
5
57
54
5
19
4
6
23
13
8
11
11
24
15
9
35
4
Nort
h M
iladh
unm
adul
u (S
h)2,
572
667
27
63
990
100
77
36
47
18
7
36
36
7
5
9
8
13
6
9
4
9
10
68
15
8
Sout
h M
iladh
unm
adul
u (N
)2,
184
668
35
36
62
48
3
55
41
12
7
18
0
23
39
8
10
2
15
18
14
7
10
13
26
47
265
Nort
h M
aalh
osm
adul
u (R
)3,
184
738
20
22
43
60
1,60
6
66
96
109
22
19
4
9
3
4
26
7
13
7
3
25
74
20
8
Sout
h M
aalh
osm
adul
u (B
)2,
546
606
30
42
77
42
115
786
76
20
4
46
54
10
3
5
4
8
14
7
28
25
57
85
222
Faad
hipp
olhu
(Lh)
1,62
4
50
3
37
25
39
138
77
23
339
78
16
21
-
10
3
7
16
9
16
22
12
38
74
121
Mal
e' A
toll (
K)7,
848
2,18
6
395
456
191
246
202
181
253
1,24
0
148
228
39
84
35
14
9
11
6
12
4
77
142
222
519
181
434
Nort
h Ar
i Ato
ll (AA
)1,
682
464
63
10
6
38
37
51
60
29
125
189
131
6
19
11
5
10
13
9
20
24
80
31
16
1
Sout
h Ar
i Ato
ll (AD
h)2,
898
677
101
76
71
65
45
61
55
196
156
472
19
58
9
41
22
42
20
36
51
101
52
472
Felid
hu A
toll (
V)50
6
184
6
9
6
8
10
5
6
28
5
17
12
2
11
5
15
1
9
1
5
3
4
17
29
Mul
akat
holh
u (M
)96
3
446
15
13
10
16
6
8
3
48
8
19
17
17
9
4
20
19
15
7
2
1
11
28
68
Nort
h Ni
land
he A
toll (
F)54
5
225
5
7
3
1
5
9
4
18
3
10
4
8
82
24
12
12
5
11
2
17
18
60
Sout
h Ni
land
he A
toll (
Dh)
1,52
6
51
3
28
34
20
22
31
18
8
12
4
23
62
7
33
22
33
7
18
33
18
17
15
45
23
75
Kolh
umad
ulu
(Th)
1,86
9
98
8
11
12
12
16
20
10
10
48
7
12
2
13
8
18
378
64
6
15
3
18
66
13
2
Hadh
dhun
mat
hi (L
)2,
195
810
20
14
14
22
13
18
18
55
17
22
2
14
14
23
58
693
21
23
10
29
46
239
Nort
h Hu
vadh
u At
oll (
GA)
1,75
7
70
6
24
14
11
13
15
17
19
82
8
19
1
8
5
5
12
47
251
165
37
79
50
169
Sout
h Hu
vadh
u At
oll (
GDh)
2,18
3
1,
066
9
17
6
7
3
6
17
55
8
15
-
6
12
8
12
19
89
292
48
11
0
68
31
0
Gnav
iyani
(Gn)
1,09
9
50
2
8
12
4
11
12
14
13
89
18
23
1
3
4
13
4
8
21
46
5
85
76
12
7
Addu
(S)
3,59
6
1,
515
28
24
15
25
20
24
23
391
62
68
8
12
16
25
14
41
48
90
81
449
281
336

68Migration: CENSUS 2014
National Bureau of Statistics
Repu
blic
Mal
e'HA
HDh
ShN
RB
LhK
AAAD
hV
MF
DhTh
LGA
GDh
GnS
(1)
(2)
(3)
(4)
(5)
(6)
(7)
(8)
(9)
(10)
(11)
(12)
(13)
(14)
(15)
(16)
(17)
(18)
(19)
(20)
(21)
(22)
(23)
(24)
(25)
TA
BL
E M
G 1
2 : R
ESI
DE
NT
MA
LD
IVIA
N P
OPU
LA
TIO
N B
Y P
LA
CE
OF
EN
UM
ER
AT
ION
, PL
AC
E O
F PR
EV
IOU
S R
ESI
DE
NC
E, S
EX
AN
D L
OC
AL
ITY
(AT
OL
L),
2014
Plac
e of
Enu
mer
atio
nPl
ace
of p
revi
ous r
esid
ence
Abro
ad N
ot S
tate
d
Fem
ale
Repu
blic
68,4
96
14,3
76
3,19
8
3,34
0
2,96
3
2,31
6
4,29
3
2,38
9
2,02
0
1,45
1
948
1,09
3
441
1,
194
60
0
1,36
2
2,64
3
2,30
5
2,18
1
3,60
1
1,14
9
3,87
2
6,65
3
4,10
8
Mal
e'
35,0
16
43
2,23
8
1,91
3
1,15
2
1,42
1
1,92
4
1,58
1
1,31
4
898
618
692
304
79
9
38
0
735
1,93
0
1,31
3
1,68
3
2,71
4
847
2,84
0
5,82
5
1,85
2
Atol
ls (In
clude
s Adm
inist
rativ
e an
d No
n- A
dmin
istra
tive
Islan
ds)
33,4
80
14,3
33
960
1,42
7
1,81
1
895
2,36
9
808
706
553
330
401
137
39
5
22
0
627
713
992
498
887
302
1,03
2
828
2,25
6
Nort
h Th
iladh
unm
athi
(HA)
1,81
8
88
5
47
4
92
21
21
15
6
15
28
3
10
4
10
5
12
9
15
8
13
7
11
25
12
9
Sout
h Th
iladh
unm
athi
(HDh
)3,
006
1,24
4
177
908
129
29
37
30
41
32
10
12
4
18
7
8
15
17
4
17
14
27
32
19
4
Nort
h M
iladh
unm
adul
u (S
h)2,
505
558
24
78
1,38
8
118
58
19
58
18
5
15
4
5
7
2
8
7
9
14
3
13
16
78
Sout
h M
iladh
unm
adul
u (N
)1,
782
749
26
23
54
43
4
56
16
11
4
34
5
4
5
9
4
6
23
16
3
10
8
13
27
143
Nort
h M
aalh
osm
adul
u (R
)3,
324
817
27
28
53
51
1,91
6
59
68
35
7
2
3
6
5
2
14
9
5
21
6
16
36
138
Sout
h M
aalh
osm
adul
u (B
)1,
729
691
17
25
18
12
84
54
6
29
18
13
9
7
4
1
4
15
13
7
16
5
22
50
123
Faad
hipp
olhu
(Lh)
1,29
0
54
6
24
17
35
124
51
10
235
37
19
4
1
4
2
2
10
11
6
20
9
13
42
68
Mal
e' A
toll (
K)2,
087
1,01
6
46
89
30
22
50
24
53
15
3
37
28
26
34
23
80
35
29
37
43
25
42
66
99
Nort
h Ar
i Ato
ll (AA
)90
1
441
30
32
6
5
15
17
15
9
10
4
57
-
6
12
1
2
7
4
14
6
11
19
88
Sout
h Ar
i Ato
ll (AD
h)1,
319
591
16
27
10
8
14
10
4
21
76
20
0
13
45
14
20
18
10
4
8
9
16
40
145
Felid
hu A
toll (
V)31
5
177
4
4
5
4
2
2
1
9
-
4
50
15
5
-
2
6
1
-
2
-
10
12
Mul
akat
holh
u (M
)90
0
488
15
18
8
9
6
9
7
10
4
6
12
164
8
20
14
20
4
9
7
16
15
31
Nort
h Ni
land
he A
toll (
F)54
2
253
9
6
2
1
6
4
12
12
3
5
1
5
84
10
11
9
4
13
1
9
13
69
Sout
h Ni
land
he A
toll (
Dh)
1,14
8
48
5
19
9
4
7
13
4
2
10
2
5
3
28
20
396
27
19
2
7
2
20
16
48
Kolh
umad
ulu
(Th)
1,67
3
93
5
8
11
3
5
9
9
4
15
3
2
4
13
5
16
42
2
60
1
18
1
10
25
94
Hadh
dhun
mat
hi (L
)1,
904
724
10
16
11
14
11
6
12
20
3
6
-
8
5
18
53
694
18
26
9
16
48
17
6
Nort
h Hu
vadh
u At
oll (
GA)
1,14
6
53
6
7
2
7
8
2
3
8
23
1
5
-
5
2
3
10
15
19
4
12
2
21
57
26
89
Sout
h Hu
vadh
u At
oll (
GDh)
1,87
5
85
4
7
5
6
7
5
10
9
12
3
7
-
4
6
12
14
16
11
5
36
7
46
105
24
241
Gnav
iyani
(Gn)
1,02
2
61
8
5
20
3
5
6
8
8
16
6
8
-
1
1
7
5
8
17
42
3
99
72
64
Addu
(S)
3,19
4
1,
725
15
17
18
11
13
16
11
41
26
12
-
11
4
8
6
11
55
10
7
11
8
51
6
22
6
22
7

69
National Bureau of Statistics
Tota
l <
1 y
ear
1 -
2 ye
ars
3 -
4 ye
ars
5-7
yea
rs
8-1
0 ye
ars
11-
14 y
ears
15-
19 y
ears
20-
34 y
ears
35-
64 y
ears
6
5+ y
ears
(1)
(2)
(3)
(4)
(5)
(6)
(7)
(8)
(9)
(10)
(11)
(12)
(13)
Both
Sex
es68
,422
6,78
6
9,
703
8,75
9
9,
064
7,80
1
6,
503
5,66
0
8,
199
3,35
8
93
2,49
6
Le
ss th
an 1
yea
r-
-
-
-
-
-
-
-
-
-
-
-
1-
237
3
155
60
-
-
-
-
-
-
-
-
158
3-
475
7
224
32
8
76
-
-
-
-
-
-
-
129
5-
71,
589
334
48
7
448
15
9
-
-
-
-
-
-
161
8-
101,
447
232
32
8
368
33
0
69
-
-
-
-
-
120
11
-14
2,38
2
36
9
456
36
3
476
44
8
144
-
-
-
-
12
6
15-1
97,
661
1,59
7
1,
891
1,20
3
87
2
783
72
7
300
-
-
-
288
20
-34
30,3
10
2,
604
4,43
1
4,
617
5,14
3
4,
391
3,71
5
3,
012
1,56
6
-
-
83
1
35-6
421
,725
1,08
8
1,
507
1,51
5
1,
903
1,93
8
1,
828
2,23
7
6,
346
2,76
0
-
603
65
+2,
178
183
21
5
169
18
1
172
89
111
28
7
598
93
80
Mal
e33
,668
3,20
2
4,
350
4,01
7
4,
359
3,76
7
3,
068
2,87
1
4,
706
1,93
0
53
1,34
5
Le
ss th
an 1
yea
r-
-
-
-
-
-
-
-
-
-
-
-
1-
220
8
88
33
-
-
-
-
-
-
-
-
87
3-
439
6
120
18
3
31
-
-
-
-
-
-
-
62
5-
780
8
171
24
2
236
79
-
-
-
-
-
-
80
8-
1074
9
120
16
0
175
19
2
37
-
-
-
-
-
65
11
-14
1,20
9
18
4
226
18
9
245
23
4
71
-
-
-
-
60
15-1
93,
599
735
86
4
562
44
1
361
36
1
141
-
-
-
134
20
-34
14,7
31
1,
242
1,97
8
2,
118
2,50
7
2,
224
1,83
1
1,
550
836
-
-
44
5
35-6
410
,898
460
57
8
638
82
5
843
76
9
1,13
3
3,
723
1,56
1
-
368
65
+1,
070
82
86
68
70
68
36
47
14
7
369
53
44
Fem
ale
34,7
54
3,
584
5,35
3
4,
742
4,70
5
4,
034
3,43
5
2,
789
3,49
3
1,
428
40
1,
151
Less
than
1 y
ear
-
-
-
-
-
-
-
-
-
-
-
-
1-2
165
67
27
-
-
-
-
-
-
-
-
71
3-4
361
10
4
145
45
-
-
-
-
-
-
-
67
5-7
781
16
3
245
21
2
80
-
-
-
-
-
-
81
8-10
698
11
2
168
19
3
138
32
-
-
-
-
-
55
11-1
41,
173
185
23
0
174
23
1
214
73
-
-
-
-
66
15
-19
4,06
2
86
2
1,02
7
64
1
431
42
2
366
15
9
-
-
-
15
4
20-3
415
,579
1,36
2
2,
453
2,49
9
2,
636
2,16
7
1,
884
1,46
2
73
0
-
-
386
35
-64
10,8
27
62
8
929
87
7
1,07
8
1,
095
1,05
9
1,
104
2,62
3
1,
199
-
23
5
65+
1,10
8
10
1
129
10
1
111
10
4
53
64
140
22
9
40
36
Sex
and
Age
Not
stat
ed
Dur
atio
n of
resid
ence
TABL
E M
G 13
: RE
SIDE
NT M
ALDI
VIAN
PO
PULA
TIO
N W
ITH
A DI
FFER
ENT
USUA
L AND
PRE
VIO
US R
ESID
ENCE
LIVI
NG IN
MAL
E' B
Y DU
RATI
ON
OF
RESI
DENC
E, A
GE A
ND S
EX,
2014
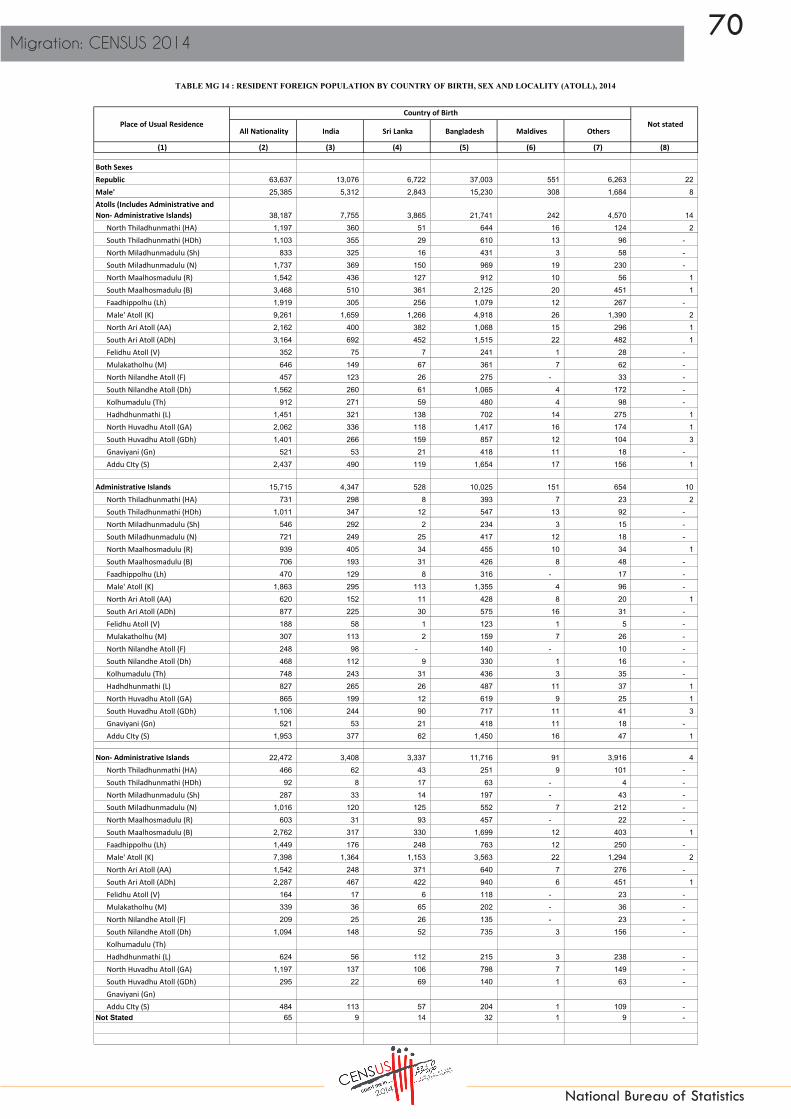
70Migration: CENSUS 2014
National Bureau of Statistics
All Nationality India Sri Lanka Bangladesh Maldives Others
(1) (2) (3) (4) (5) (6) (7) (8)
Both SexesRepublic 63,637 13,076 6,722 37,003 551 6,263 22 Male' 25,385 5,312 2,843 15,230 308 1,684 8 Atolls (Includes Administrative and Non- Administrative Islands) 38,187 7,755 3,865 21,741 242 4,570 14
North Thiladhunmathi (HA) 1,197 360 51 644 16 124 2 South Thiladhunmathi (HDh) 1,103 355 29 610 13 96 - North Miladhunmadulu (Sh) 833 325 16 431 3 58 - South Miladhunmadulu (N) 1,737 369 150 969 19 230 - North Maalhosmadulu (R) 1,542 436 127 912 10 56 1 South Maalhosmadulu (B) 3,468 510 361 2,125 20 451 1 Faadhippolhu (Lh) 1,919 305 256 1,079 12 267 - Male' Atoll (K) 9,261 1,659 1,266 4,918 26 1,390 2 North Ari Atoll (AA) 2,162 400 382 1,068 15 296 1 South Ari Atoll (ADh) 3,164 692 452 1,515 22 482 1 Felidhu Atoll (V) 352 75 7 241 1 28 - Mulakatholhu (M) 646 149 67 361 7 62 - North Nilandhe Atoll (F) 457 123 26 275 - 33 - South Nilandhe Atoll (Dh) 1,562 260 61 1,065 4 172 - Kolhumadulu (Th) 912 271 59 480 4 98 - Hadhdhunmathi (L) 1,451 321 138 702 14 275 1 North Huvadhu Atoll (GA) 2,062 336 118 1,417 16 174 1 South Huvadhu Atoll (GDh) 1,401 266 159 857 12 104 3 Gnaviyani (Gn) 521 53 21 418 11 18 - Addu CIty (S) 2,437 490 119 1,654 17 156 1
Administrative Islands 15,715 4,347 528 10,025 151 654 10 North Thiladhunmathi (HA) 731 298 8 393 7 23 2 South Thiladhunmathi (HDh) 1,011 347 12 547 13 92 - North Miladhunmadulu (Sh) 546 292 2 234 3 15 - South Miladhunmadulu (N) 721 249 25 417 12 18 - North Maalhosmadulu (R) 939 405 34 455 10 34 1 South Maalhosmadulu (B) 706 193 31 426 8 48 - Faadhippolhu (Lh) 470 129 8 316 - 17 - Male' Atoll (K) 1,863 295 113 1,355 4 96 - North Ari Atoll (AA) 620 152 11 428 8 20 1 South Ari Atoll (ADh) 877 225 30 575 16 31 - Felidhu Atoll (V) 188 58 1 123 1 5 - Mulakatholhu (M) 307 113 2 159 7 26 - North Nilandhe Atoll (F) 248 98 - 140 - 10 - South Nilandhe Atoll (Dh) 468 112 9 330 1 16 - Kolhumadulu (Th) 748 243 31 436 3 35 - Hadhdhunmathi (L) 827 265 26 487 11 37 1 North Huvadhu Atoll (GA) 865 199 12 619 9 25 1 South Huvadhu Atoll (GDh) 1,106 244 90 717 11 41 3 Gnaviyani (Gn) 521 53 21 418 11 18 - Addu CIty (S) 1,953 377 62 1,450 16 47 1
Non- Administrative Islands 22,472 3,408 3,337 11,716 91 3,916 4 North Thiladhunmathi (HA) 466 62 43 251 9 101 - South Thiladhunmathi (HDh) 92 8 17 63 - 4 - North Miladhunmadulu (Sh) 287 33 14 197 - 43 - South Miladhunmadulu (N) 1,016 120 125 552 7 212 - North Maalhosmadulu (R) 603 31 93 457 - 22 - South Maalhosmadulu (B) 2,762 317 330 1,699 12 403 1 Faadhippolhu (Lh) 1,449 176 248 763 12 250 - Male' Atoll (K) 7,398 1,364 1,153 3,563 22 1,294 2 North Ari Atoll (AA) 1,542 248 371 640 7 276 - South Ari Atoll (ADh) 2,287 467 422 940 6 451 1 Felidhu Atoll (V) 164 17 6 118 - 23 - Mulakatholhu (M) 339 36 65 202 - 36 - North Nilandhe Atoll (F) 209 25 26 135 - 23 - South Nilandhe Atoll (Dh) 1,094 148 52 735 3 156 - Kolhumadulu (Th)Hadhdhunmathi (L) 624 56 112 215 3 238 - North Huvadhu Atoll (GA) 1,197 137 106 798 7 149 - South Huvadhu Atoll (GDh) 295 22 69 140 1 63 - Gnaviyani (Gn)Addu CIty (S) 484 113 57 204 1 109 -
Not Stated 65 9 14 32 1 9 -
Place of Usual ResidenceCountry of Birth
Not stated
TABLE MG 14 : RESIDENT FOREIGN POPULATION BY COUNTRY OF BIRTH, SEX AND LOCALITY (ATOLL), 2014

71
National Bureau of Statistics
All Nationality India Sri Lanka Bangladesh Maldives Others
(1) (2) (3) (4) (5) (6) (7) (8)
Place of Usual ResidenceCountry of Birth
Not stated
TABLE MG 14 : RESIDENT FOREIGN POPULATION BY COUNTRY OF BIRTH, SEX AND LOCALITY (ATOLL), 2014
MaleRepublic 55,787 9,621 5,789 36,517 344 3,503 13 Male' 21,856 3,779 2,102 14,916 175 879 5 Atolls (Includes Administrative and Non- Administrative Islands) 33,875 5,836 3,674 21,569 168 2,620 8
North Thiladhunmathi (HA) 1,030 231 51 639 13 95 1 South Thiladhunmathi (HDh) 937 212 26 604 6 89 - North Miladhunmadulu (Sh) 679 195 16 429 3 36 - South Miladhunmadulu (N) 1,541 264 136 966 11 164 - North Maalhosmadulu (R) 1,325 248 120 911 7 38 1 South Maalhosmadulu (B) 3,191 424 348 2,124 9 285 1 Faadhippolhu (Lh) 1,612 242 204 1,042 10 114 - Male' Atoll (K) 8,387 1,489 1,233 4,906 18 740 1 North Ari Atoll (AA) 1,885 303 380 1,055 11 136 - South Ari Atoll (ADh) 2,820 613 438 1,504 21 243 1 Felidhu Atoll (V) 302 44 6 240 - 12 - Mulakatholhu (M) 564 103 66 361 4 30 - North Nilandhe Atoll (F) 386 75 26 270 - 15 - South Nilandhe Atoll (Dh) 1,437 206 59 1,062 2 108 - Kolhumadulu (Th) 767 162 59 474 3 69 - Hadhdhunmathi (L) 1,203 233 109 701 14 145 1 North Huvadhu Atoll (GA) 1,906 255 113 1,405 9 123 1 South Huvadhu Atoll (GDh) 1,229 162 155 837 8 67 - Gnaviyani (Gn) 468 32 17 401 8 10 - Addu CIty (S) 2,206 343 112 1,638 11 101 1
Administrative Islands 13,586 2,586 465 9,905 100 525 5 North Thiladhunmathi (HA) 586 169 8 388 4 16 1 South Thiladhunmathi (HDh) 846 204 9 542 6 85 - North Miladhunmadulu (Sh) 413 163 2 232 3 13 - South Miladhunmadulu (N) 598 148 17 415 4 14 - North Maalhosmadulu (R) 737 217 30 454 7 28 1 South Maalhosmadulu (B) 607 114 24 426 3 40 - Faadhippolhu (Lh) 405 80 4 314 - 7 - Male' Atoll (K) 1,727 193 97 1,353 3 81 - North Ari Atoll (AA) 517 72 10 415 5 15 - South Ari Atoll (ADh) 804 164 28 567 15 30 - Felidhu Atoll (V) 152 30 - 122 - - - Mulakatholhu (M) 248 68 1 159 4 16 - North Nilandhe Atoll (F) 193 52 - 135 - 6 - South Nilandhe Atoll (Dh) 415 66 7 327 - 15 - Kolhumadulu (Th) 630 137 31 430 3 29 - Hadhdhunmathi (L) 735 178 26 486 11 33 1 North Huvadhu Atoll (GA) 770 123 9 607 5 25 1 South Huvadhu Atoll (GDh) 962 140 88 697 8 29 - Gnaviyani (Gn) 468 32 17 401 8 10 - Addu CIty (S) 1,773 236 57 1,435 11 33 1
Non- Administrative Islands 20,289 3,250 3,209 11,664 68 2,095 3 North Thiladhunmathi (HA) 444 62 43 251 9 79 - South Thiladhunmathi (HDh) 91 8 17 62 - 4 - North Miladhunmadulu (Sh) 266 32 14 197 - 23 - South Miladhunmadulu (N) 943 116 119 551 7 150 - North Maalhosmadulu (R) 588 31 90 457 - 10 - South Maalhosmadulu (B) 2,584 310 324 1,698 6 245 1 Faadhippolhu (Lh) 1,207 162 200 728 10 107 - Male' Atoll (K) 6,660 1,296 1,136 3,553 15 659 1 North Ari Atoll (AA) 1,368 231 370 640 6 121 - South Ari Atoll (ADh) 2,016 449 410 937 6 213 1 Felidhu Atoll (V) 150 14 6 118 - 12 - Mulakatholhu (M) 316 35 65 202 - 14 - North Nilandhe Atoll (F) 193 23 26 135 - 9 - South Nilandhe Atoll (Dh) 1,022 140 52 735 2 93 - Kolhumadulu (Th)Hadhdhunmathi (L) 468 55 83 215 3 112 - North Huvadhu Atoll (GA) 1,136 132 104 798 4 98 - South Huvadhu Atoll (GDh) 267 22 67 140 - 38 - Gnaviyani (Gn)Addu CIty (S) 433 107 55 203 - 68 -
Not Stated 56 6 13 32 1 4 -

72Migration: CENSUS 2014
National Bureau of Statistics
All Nationality India Sri Lanka Bangladesh Maldives Others
(1) (2) (3) (4) (5) (6) (7) (8)
Place of Usual ResidenceCountry of Birth
Not stated
TABLE MG 14 : RESIDENT FOREIGN POPULATION BY COUNTRY OF BIRTH, SEX AND LOCALITY (ATOLL), 2014
FemaleRepublic 7,850 3,455 933 486 207 2,760 9 Male' 3,529 1,533 741 314 133 805 3 Atolls (Includes Administrative and Non- Administrative Islands) 4,312 1,919 191 172 74 1,950 6
North Thiladhunmathi (HA) 167 129 - 5 3 29 1 South Thiladhunmathi (HDh) 166 143 3 6 7 7 - North Miladhunmadulu (Sh) 154 130 - 2 - 22 - South Miladhunmadulu (N) 196 105 14 3 8 66 - North Maalhosmadulu (R) 217 188 7 1 3 18 - South Maalhosmadulu (B) 277 86 13 1 11 166 - Faadhippolhu (Lh) 307 63 52 37 2 153 - Male' Atoll (K) 874 170 33 12 8 650 1 North Ari Atoll (AA) 277 97 2 13 4 160 1 South Ari Atoll (ADh) 344 79 14 11 1 239 - Felidhu Atoll (V) 50 31 1 1 1 16 - Mulakatholhu (M) 82 46 1 - 3 32 - North Nilandhe Atoll (F) 71 48 - 5 - 18 - South Nilandhe Atoll (Dh) 125 54 2 3 2 64 - Kolhumadulu (Th) 145 109 - 6 1 29 - Hadhdhunmathi (L) 248 88 29 1 - 130 - North Huvadhu Atoll (GA) 156 81 5 12 7 51 - South Huvadhu Atoll (GDh) 172 104 4 20 4 37 3 Gnaviyani (Gn) 53 21 4 17 3 8 - Addu CIty (S) 231 147 7 16 6 55 -
Administrative Islands 2,129 1,761 63 120 51 129 5 North Thiladhunmathi (HA) 145 129 - 5 3 7 1 South Thiladhunmathi (HDh) 165 143 3 5 7 7 - North Miladhunmadulu (Sh) 133 129 - 2 - 2 - South Miladhunmadulu (N) 123 101 8 2 8 4 - North Maalhosmadulu (R) 202 188 4 1 3 6 - South Maalhosmadulu (B) 99 79 7 - 5 8 - Faadhippolhu (Lh) 65 49 4 2 - 10 - Male' Atoll (K) 136 102 16 2 1 15 - North Ari Atoll (AA) 103 80 1 13 3 5 1 South Ari Atoll (ADh) 73 61 2 8 1 1 - Felidhu Atoll (V) 36 28 1 1 1 5 - Mulakatholhu (M) 59 45 1 - 3 10 - North Nilandhe Atoll (F) 55 46 - 5 - 4 - South Nilandhe Atoll (Dh) 53 46 2 3 1 1 - Kolhumadulu (Th) 118 106 - 6 - 6 - Hadhdhunmathi (L) 92 87 - 1 - 4 - North Huvadhu Atoll (GA) 95 76 3 12 4 - - South Huvadhu Atoll (GDh) 144 104 2 20 3 12 3 Gnaviyani (Gn) 53 21 4 17 3 8 - Addu CIty (S) 180 141 5 15 5 14 -
Non- Administrative Islands 2,183 158 128 52 23 1,821 1 North Thiladhunmathi (HA) 22 - - - - 22 - South Thiladhunmathi (HDh) 1 - - 1 - - - North Miladhunmadulu (Sh) 21 1 - - - 20 - South Miladhunmadulu (N) 73 4 6 1 - 62 - North Maalhosmadulu (R) 15 - 3 - - 12 - South Maalhosmadulu (B) 178 7 6 1 6 158 - Faadhippolhu (Lh) 242 14 48 35 2 143 - Male' Atoll (K) 738 68 17 10 7 635 1 North Ari Atoll (AA) 174 17 1 - 1 155 - South Ari Atoll (ADh) 271 18 12 3 - 238 - Felidhu Atoll (V) 14 3 - - - 11 - Mulakatholhu (M) 23 1 - - - 22 - North Nilandhe Atoll (F) 16 2 - - - 14 - South Nilandhe Atoll (Dh) 72 8 - - 1 63 - Kolhumadulu (Th)Hadhdhunmathi (L) 156 1 29 - - 126 - North Huvadhu Atoll (GA) 61 5 2 - 3 51 - South Huvadhu Atoll (GDh) 28 - 2 - 1 25 - Gnaviyani (Gn)Addu CIty (S) 51 6 2 1 1 41 -
Not Stated 9 3 1 - - 5 -

73
National Bureau of Statistics
< 1 year 1 - 2 years 3 - 4 years 5-9 years 10+ years(1) (2) (3) (4) (5) (6) (7) (8)
Both SexesRepublic 63,637 13,634 17,445 10,904 13,990 5,772 1,892
India 13,331 2,181 3,243 2,100 3,315 2,111 381 Sri Lanka 6,756 1,495 1,698 990 1,496 917 160 Bangladesh 36,995 8,376 10,315 6,857 8,154 2,401 892 Others 6,555 1,582 2,189 957 1,025 343 459
Male' 24,523 5,598 6,323 4,250 5,557 2,227 568 India 5,381 945 1,161 829 1,348 961 137 Sri Lanka 2,821 739 612 384 594 424 68 Bangladesh 14,526 3,440 4,034 2,760 3,319 715 258 Others 1,795 474 516 277 296 127 105
Atolls (Includes Administrative and Non- Administrative Islands) 39,114 8,036 11,122 6,654 8,433 3,545 1,324
India 7,950 1,236 2,082 1,271 1,967 1,150 244 Sri Lanka 3,935 756 1,086 606 902 493 92 Bangladesh 22,469 4,936 6,281 4,097 4,835 1,686 634 Others 4,760 1,108 1,673 680 729 216 354
Administrative Islands 16,004 3,958 4,563 2,878 3,211 848 546 India 4,460 811 1,178 759 1,068 501 143 Sri Lanka 589 179 139 67 95 79 30 Bangladesh 10,258 2,750 3,051 1,972 1,975 248 262 Others 697 218 195 80 73 20 111
Non- Administrative Islands 23,110 4,078 6,559 3,776 5,222 2,697 778 India 3,490 425 904 512 899 649 101 Sri Lanka 3,346 577 947 539 807 414 62 Bangladesh 12,211 2,186 3,230 2,125 2,860 1,438 372 Others 4,063 890 1,478 600 656 196 243
MaleRepublic 55,787 11,818 15,112 9,663 12,526 5,061 1,607
India 9,799 1,501 2,333 1,524 2,527 1,652 262 Sri Lanka 5,815 1,248 1,492 862 1,309 768 136 Bangladesh 36,522 8,240 10,161 6,776 8,069 2,389 887 Others 3,651 829 1,126 501 621 252 322
Male' 20,995 4,807 5,447 3,670 4,829 1,790 452 India 3,794 663 827 552 966 700 86 Sri Lanka 2,069 539 450 284 446 302 48 Bangladesh 14,223 3,357 3,929 2,711 3,263 707 256 Others 909 248 241 123 154 81 62
Atolls (Includes Administrative and Non- Administrative Islands) 34,792 7,011 9,665 5,993 7,697 3,271 1,155
India 6,005 838 1,506 972 1,561 952 176 Sri Lanka 3,746 709 1,042 578 863 466 88 Bangladesh 22,299 4,883 6,232 4,065 4,806 1,682 631 Others 2,742 581 885 378 467 171 260
Administrative Islands 13,875 3,469 3,956 2,550 2,792 641 467 India 2,663 439 661 480 686 316 81 Sri Lanka 528 157 133 58 89 62 29 Bangladesh 10,141 2,710 3,014 1,949 1,962 247 259 Others 543 163 148 63 55 16 98
Non- Administrative Islands 20,917 3,542 5,709 3,443 4,905 2,630 688 India 3,342 399 845 492 875 636 95 Sri Lanka 3,218 552 909 520 774 404 59 Bangladesh 12,158 2,173 3,218 2,116 2,844 1,435 372 Others 2,199 418 737 315 412 155 162
Country of Citizenship Duration of Stay (in years) Not
stated
TABLE MG 15 : RESIDENT FOREIGN POPULATION BY COUNTRY OF CITIZENSHIP AND DURATION OF STAY IN MALDIVES, 2014
Total

74Migration: CENSUS 2014
National Bureau of Statistics
< 1 year 1 - 2 years 3 - 4 years 5-9 years 10+ years(1) (2) (3) (4) (5) (6) (7) (8)
Country of Citizenship Duration of Stay (in years) Not
stated
TABLE MG 15 : RESIDENT FOREIGN POPULATION BY COUNTRY OF CITIZENSHIP AND DURATION OF STAY IN MALDIVES, 2014
Total
FemaleRepublic 7,850 1,816 2,333 1,241 1,464 711 285
India 3,532 680 910 576 788 459 119 Sri Lanka 941 247 206 128 187 149 24 Bangladesh 473 136 154 81 85 12 5 Others 2,904 753 1,063 456 404 91 137
Male' 3,528 791 876 580 728 437 116 India 1,587 282 334 277 382 261 51 Sri Lanka 752 200 162 100 148 122 20 Bangladesh 303 83 105 49 56 8 2 Others 886 226 275 154 142 46 43
Atolls (Includes Administrative and Non- Administrative Islands) 4,322 1,025 1,457 661 736 274 169
India 1,945 398 576 299 406 198 68 Sri Lanka 189 47 44 28 39 27 4 Bangladesh 170 53 49 32 29 4 3 Others 2,018 527 788 302 262 45 94
Administrative Islands 2,129 489 607 328 419 207 79 India 1,797 372 517 279 382 185 62 Sri Lanka 61 22 6 9 6 17 1 Bangladesh 117 40 37 23 13 1 3 Others 154 55 47 17 18 4 13
Non- Administrative Islands 2,193 536 850 333 317 67 90 India 148 26 59 20 24 13 6 Sri Lanka 128 25 38 19 33 10 3 Bangladesh 53 13 12 9 16 3 - Others 1,864 472 741 285 244 41 81

75
National Bureau of Statistics
Both Sexes Male Female (1) (2) (3) (4) (5)
Republic 338,434 171,962 166,472 Male' 57,338 29,808 27,530
HA Thurakunu 680 348 332 HA Uligamu 485 238 247 HA Mulhadhoo 344 175 169 HA Hoarafushi 3,081 1,542 1,539 HA Ihavandhoo 2,960 1,479 1,481 HA Kelaa 2,059 1,063 996 HA Vashafaru 817 406 411 HA Dhidhdhoo 3,638 1,795 1,843 HA Filladhoo 1,014 496 518 HA Maarandhoo 887 437 450 HA Thakandhoo 898 434 464 HA Utheemu 810 376 434 HA Muraidhoo 814 382 432 HA Baarah 1,782 894 888 HDh Hanimaadhoo 1,917 961 956 HDh Finey 524 244 280 HDh Naivaadhoo 777 382 395 HDh Hirimaradhoo 513 267 246 HDh Nolhivaranfaru 1,533 706 827 HDh Nellaidhoo 1,163 581 582 HDh Nolhivaramu 2,450 1,224 1,226 HDh Kuribi 676 335 341 HDh Kulhudhuffushi 8,872 4,471 4,401 HDh Kumundhoo 1,321 638 683 HDh Neykurendhoo 1,271 648 623 HDh Vaikaradhoo 1,667 830 837 HDh Makunudhoo 1,549 788 761 Sh Kaditheemu 1,383 659 724 Sh Noomaraa 415 212 203 Sh Goidhoo 690 353 337 Sh Feydhoo 1,098 550 548 Sh Feevah 981 468 513 Sh Bilehffahi 622 327 295 Sh Foakaidhoo 1,613 792 821 Sh Narudhoo 551 278 273 Sh Maroshi 872 423 449 Sh Lhaimagu 739 374 365
Resident Maldivian population Atoll Locality
TABLE MG 16: RESIDENT MALDIVIAN POPULATION IN ADMINISTRATIVE ISLANDS BY PLACE OF REGISTRATION AND SEX, 2014
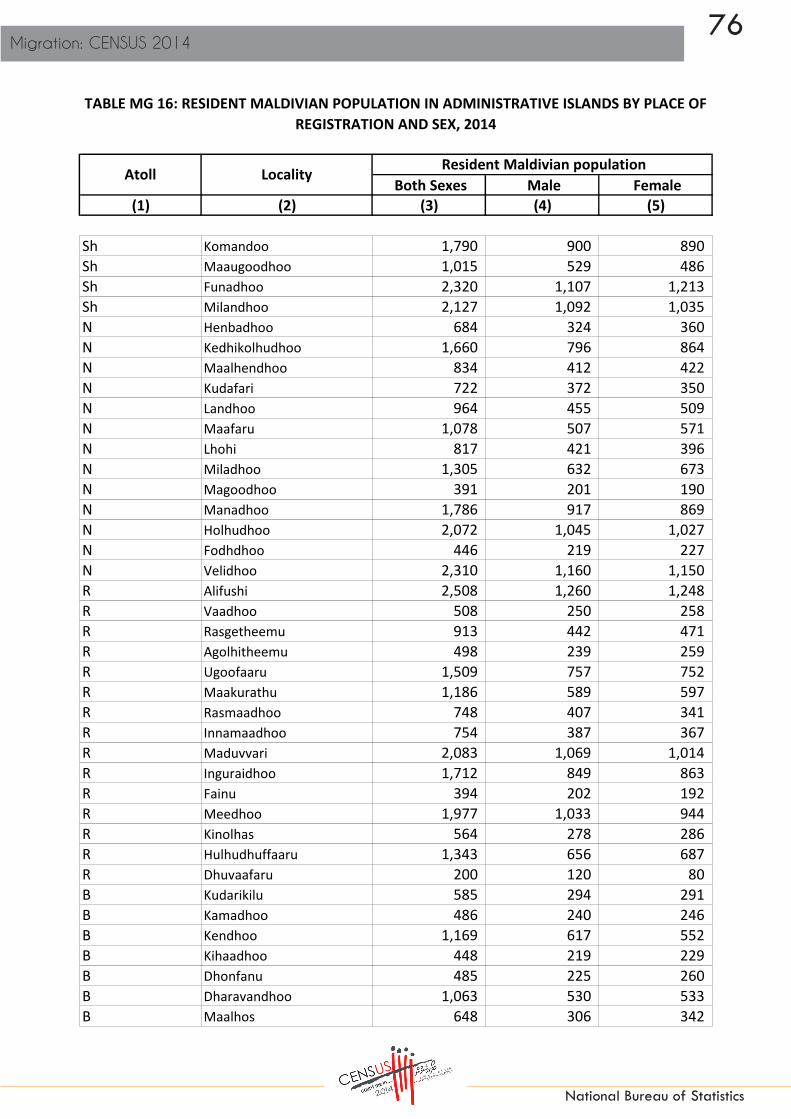
76Migration: CENSUS 2014
National Bureau of Statistics
Both Sexes Male Female (1) (2) (3) (4) (5)
Resident Maldivian population Atoll Locality
TABLE MG 16: RESIDENT MALDIVIAN POPULATION IN ADMINISTRATIVE ISLANDS BY PLACE OF REGISTRATION AND SEX, 2014
Sh Komandoo 1,790 900 890 Sh Maaugoodhoo 1,015 529 486 Sh Funadhoo 2,320 1,107 1,213 Sh Milandhoo 2,127 1,092 1,035 N Henbadhoo 684 324 360 N Kedhikolhudhoo 1,660 796 864 N Maalhendhoo 834 412 422 N Kudafari 722 372 350 N Landhoo 964 455 509 N Maafaru 1,078 507 571 N Lhohi 817 421 396 N Miladhoo 1,305 632 673 N Magoodhoo 391 201 190 N Manadhoo 1,786 917 869 N Holhudhoo 2,072 1,045 1,027 N Fodhdhoo 446 219 227 N Velidhoo 2,310 1,160 1,150 R Alifushi 2,508 1,260 1,248 R Vaadhoo 508 250 258 R Rasgetheemu 913 442 471 R Agolhitheemu 498 239 259 R Ugoofaaru 1,509 757 752 R Maakurathu 1,186 589 597 R Rasmaadhoo 748 407 341 R Innamaadhoo 754 387 367 R Maduvvari 2,083 1,069 1,014 R Inguraidhoo 1,712 849 863 R Fainu 394 202 192 R Meedhoo 1,977 1,033 944 R Kinolhas 564 278 286 R Hulhudhuffaaru 1,343 656 687 R Dhuvaafaru 200 120 80 B Kudarikilu 585 294 291 B Kamadhoo 486 240 246 B Kendhoo 1,169 617 552 B Kihaadhoo 448 219 229 B Dhonfanu 485 225 260 B Dharavandhoo 1,063 530 533 B Maalhos 648 306 342

77
National Bureau of Statistics
Both Sexes Male Female (1) (2) (3) (4) (5)
Resident Maldivian population Atoll Locality
TABLE MG 16: RESIDENT MALDIVIAN POPULATION IN ADMINISTRATIVE ISLANDS BY PLACE OF REGISTRATION AND SEX, 2014
B Eydhafushi 3,009 1,557 1,452 B Thulhaadhoo 2,698 1,367 1,331 B Hithaadhoo 1,218 619 599 B Fulhadhoo 339 166 173 B Fehendhoo 263 128 135 B Goidhoo 728 367 361 Lh Hinnavaru 4,424 2,222 2,202 Lh Naifaru 4,936 2,514 2,422 Lh Kurendhoo 1,819 941 878 Lh Olhuvelifushi 675 332 343 K Kaashidhoo 2,187 1,119 1,068 K Gaafaru 1,264 659 605 K Dhiffushi 1,192 594 598 K Thulusdhoo 1,353 688 665 K Huraa 992 516 476 K Himmafushi 1,036 549 487 K Gulhi 871 449 422 K Maafushi 1,588 802 786 K Guraidhoo 1,738 905 833 AA Thoddoo 1,734 885 849 AA Rasdhoo 1,022 524 498 AA Ukulhas 890 449 441 AA Mathiveri 809 400 409 AA Bodufolhudhoo 686 353 333 AA Feridhoo 735 387 348 AA Maalhos 636 306 330 AA Himandhoo 725 387 338 ADh Hangnameedhoo 628 324 304 ADh Omadhoo 994 496 498 ADh Kuburudhoo 565 302 263 ADh Mahibadhoo 2,215 1,127 1,088 ADh Mandhoo 459 236 223 ADh Dhagethi 940 465 475 ADh Dhigurah 579 309 270 ADh Fenfushi 912 455 457 ADh Dhidhdhoo 182 92 90 ADh Maamigili 2,601 1,300 1,301 V Fulidhoo 441 241 200 V Thinadhoo 200 94 106
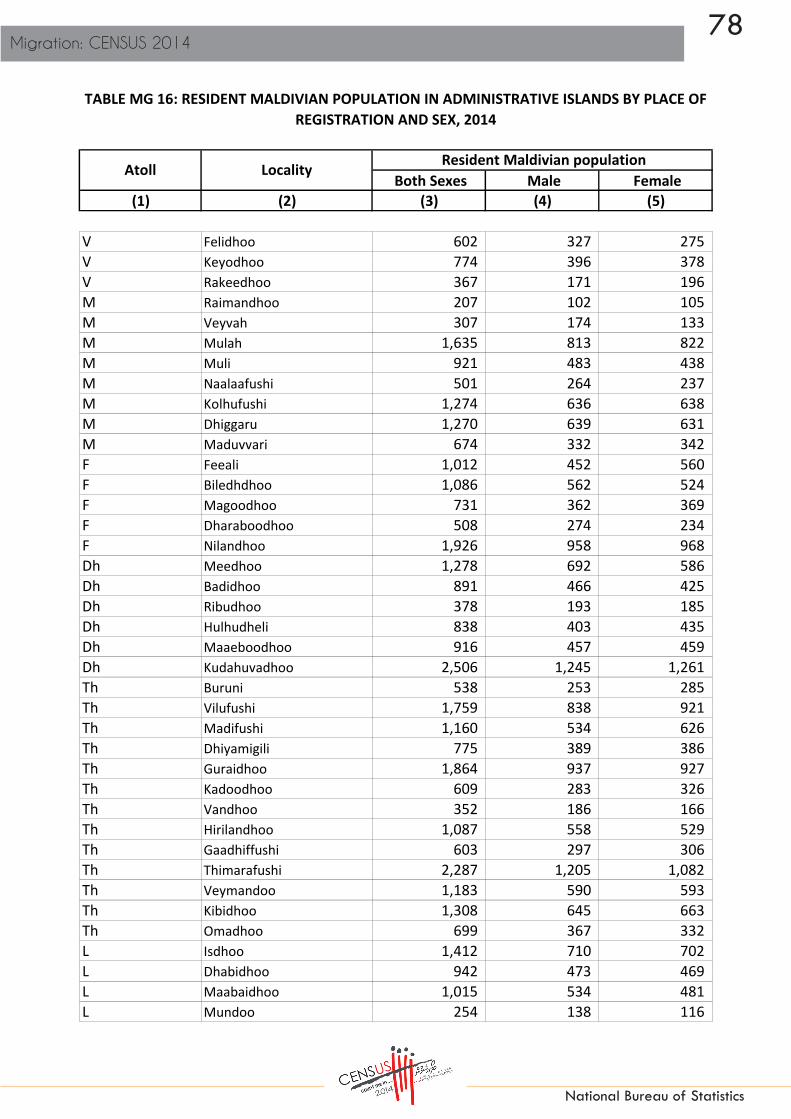
78Migration: CENSUS 2014
National Bureau of Statistics
Both Sexes Male Female (1) (2) (3) (4) (5)
Resident Maldivian population Atoll Locality
TABLE MG 16: RESIDENT MALDIVIAN POPULATION IN ADMINISTRATIVE ISLANDS BY PLACE OF REGISTRATION AND SEX, 2014
V Felidhoo 602 327 275 V Keyodhoo 774 396 378 V Rakeedhoo 367 171 196 M Raimandhoo 207 102 105 M Veyvah 307 174 133 M Mulah 1,635 813 822 M Muli 921 483 438 M Naalaafushi 501 264 237 M Kolhufushi 1,274 636 638 M Dhiggaru 1,270 639 631 M Maduvvari 674 332 342 F Feeali 1,012 452 560 F Biledhdhoo 1,086 562 524 F Magoodhoo 731 362 369 F Dharaboodhoo 508 274 234 F Nilandhoo 1,926 958 968 Dh Meedhoo 1,278 692 586 Dh Badidhoo 891 466 425 Dh Ribudhoo 378 193 185 Dh Hulhudheli 838 403 435 Dh Maaeboodhoo 916 457 459 Dh Kudahuvadhoo 2,506 1,245 1,261 Th Buruni 538 253 285 Th Vilufushi 1,759 838 921 Th Madifushi 1,160 534 626 Th Dhiyamigili 775 389 386 Th Guraidhoo 1,864 937 927 Th Kadoodhoo 609 283 326 Th Vandhoo 352 186 166 Th Hirilandhoo 1,087 558 529 Th Gaadhiffushi 603 297 306 Th Thimarafushi 2,287 1,205 1,082 Th Veymandoo 1,183 590 593 Th Kibidhoo 1,308 645 663 Th Omadhoo 699 367 332 L Isdhoo 1,412 710 702 L Dhabidhoo 942 473 469 L Maabaidhoo 1,015 534 481 L Mundoo 254 138 116

79
National Bureau of Statistics
Both Sexes Male Female (1) (2) (3) (4) (5)
Resident Maldivian population Atoll Locality
TABLE MG 16: RESIDENT MALDIVIAN POPULATION IN ADMINISTRATIVE ISLANDS BY PLACE OF REGISTRATION AND SEX, 2014
L Gamu 3,635 1,865 1,770 L Maavah 1,815 912 903 L Fonadhoo 2,153 1,103 1,050 L Gaadhoo 407 206 201 L Maamendhoo 1,189 571 618 L Hithadhoo 1,055 544 511 L Kunahandhoo 793 396 397 L Kalaidhoo 705 358 347 GA Kolamaafushi 1,532 782 750 GA Viligili 3,254 1,686 1,568 GA Maamendhoo 1,366 726 640 GA Nilandhoo 789 398 391 GA Dhaandhoo 1,856 903 953 GA Dhevvadhoo 1,185 615 570 GA Kodey 507 238 269 GA Gemanafushi 1,595 811 784 GA Kanduhulhudhoo 845 408 437 GDh Madaveli 1,775 900 875 GDh Hoadedhdhoo 1,172 611 561 GDh Nadallaa 1,033 523 510 GDh Gadhdhoo 2,755 1,377 1,378 GDh Rathafandhoo 1,287 638 649 GDh Vaadhoo 1,341 692 649 GDh Fiyoari 1,343 671 672 GDh Faresmaathodaa 6,704 3,375 3,329 GDh Thinadhoo 1,468 732 736 Gn Fuvahmulah 11,215 5,605 5,610 S Meedhoo 2,600 1,323 1,277 S Hithadhoo 13,997 7,063 6,934 S Maradhoo 3,175 1,630 1,545 S Feydhoo 4,777 2,443 2,334 S Maradhoo-Feydhoo 1,522 740 782 S Hulhudhoo 3,125 1,624 1,501

80Migration: CENSUS 2014
National Bureau of Statistics
Both Sexes Male Female (1) (2) (3) (4) (5)
Republic 338434 171962 166472Male' 79641 40867 38774
HA Thurakunu 570 284 286HA Uligamu 359 187 172HA Mulhadhoo 304 162 142HA Hoarafushi 2496 1225 1271HA Ihavandhoo 2446 1220 1226HA Kelaa 1657 858 799HA Vashafaru 736 366 370HA Dhidhdhoo 4373 2208 2165HA Filladhoo 793 402 391HA Maarandhoo 739 348 391HA Thakandhoo 728 363 365HA Utheemu 613 275 338HA Muraidhoo 615 282 333HA Baarah 1487 718 769HDh Hanimaadhoo 1098 531 567HDh Finey 418 186 232HDh Naivaadhoo 712 352 360HDh Hirimaradhoo 455 231 224HDh Nolhivaranfaru 547 263 284HDh Nellaidhoo 870 447 423HDh Nolhivaramu 1913 967 946HDh Kuribi 601 299 302HDh Kulhudhuffushi 12958 6598 6360HDh Kumundhoo 1132 543 589HDh Neykurendhoo 1077 554 523HDh Vaikaradhoo 1460 733 727HDh Makunudhoo 1219 629 590Sh Kaditheemu 985 484 501Sh Noomaraa 567 285 282Sh Goidhoo 492 254 238Sh Feydhoo 909 447 462Sh Feevah 771 372 399Sh Bilehffahi 482 264 218Sh Foakaidhoo 1229 598 631Sh Narudhoo 455 224 231Sh Maroshi 734 359 375Sh Lhaimagu 589 292 297
TABLE MG 17: RESIDENT MALDIVIAN POPULATION IN ADMINISTRATIVE ISLANDS BY PLACE OF BIRTH AND SEX, 2014
Atoll Locality Resident Maldivian population

81
National Bureau of Statistics
Both Sexes Male Female (1) (2) (3) (4) (5)
TABLE MG 17: RESIDENT MALDIVIAN POPULATION IN ADMINISTRATIVE ISLANDS BY PLACE OF BIRTH AND SEX, 2014
Atoll Locality Resident Maldivian population
Sh Komandoo 1477 725 752Sh Maaugoodhoo 816 431 385Sh Funadhoo 1385 692 693Sh Milandhoo 226 145 81N Henbadhoo 489 235 254N Kedhikolhudhoo 1172 549 623N Maalhendhoo 745 366 379N Kudafari 510 275 235N Landhoo 693 332 361N Maafaru 950 444 506N Lhohi 584 304 280N Miladhoo 1084 538 546N Magoodhoo 296 155 141N Manadhoo 2051 1079 972N Holhudhoo 1617 825 792N Fodhdhoo 339 164 175N Velidhoo 1836 915 921R Alifushi 1974 982 992R Vaadhoo 373 180 193R Rasgetheemu 782 381 401R Agolhitheemu 396 194 202R Ugoofaaru 4847 2469 2378R Maakurathu 999 501 498R Rasmaadhoo 711 369 342R Innamaadhoo 592 303 289R Maduvvari 1619 833 786R Inguraidhoo 1360 682 678R Fainu 294 154 140R Meedhoo 1593 840 753R Kinolhas 494 246 248R Hulhudhuffaaru 433 231 202R Dhuvaafaru 133 79 54B Kudarikilu 408 220 188B Kamadhoo 372 181 191B Kendhoo 866 477 389B Kihaadhoo 333 161 172B Dhonfanu 411 188 223B Dharavandhoo 818 429 389B Maalhos 492 240 252

82Migration: CENSUS 2014
National Bureau of Statistics
Both Sexes Male Female (1) (2) (3) (4) (5)
TABLE MG 17: RESIDENT MALDIVIAN POPULATION IN ADMINISTRATIVE ISLANDS BY PLACE OF BIRTH AND SEX, 2014
Atoll Locality Resident Maldivian population
B Eydhafushi 3364 1717 1647B Thulhaadhoo 2216 1148 1068B Hithaadhoo 1002 510 492B Fulhadhoo 271 131 140B Fehendhoo 174 88 86B Goidhoo 561 287 274Lh Hinnavaru 3665 1871 1794Lh Naifaru 5472 2798 2674Lh Kurendhoo 1509 766 743Lh Olhuvelifushi 484 240 244K Kaashidhoo 1771 914 857K Gaafaru 971 488 483K Dhiffushi 815 404 411K Thulusdhoo 574 290 284K Huraa 552 279 273K Himmafushi 626 338 288K Gulhi 698 375 323K Maafushi 993 485 508K Guraidhoo 1183 635 548AA Thoddoo 1313 659 654AA Rasdhoo 837 423 414AA Ukulhas 554 278 276AA Mathiveri 649 322 327AA Bodufolhudhoo 511 266 245AA Feridhoo 556 285 271AA Maalhos 501 241 260AA Himandhoo 496 257 239ADh Hangnameedhoo 482 252 230ADh Omadhoo 757 377 380ADh Kuburudhoo 359 195 164ADh Mahibadhoo 2623 1322 1301ADh Mandhoo 326 154 172ADh Dhagethi 666 340 326ADh Dhigurah 380 211 169ADh Fenfushi 574 295 279ADh Dhidhdhoo 115 59 56ADh Maamigili 1573 774 799V Fulidhoo 327 169 158V Thinadhoo 184 91 93
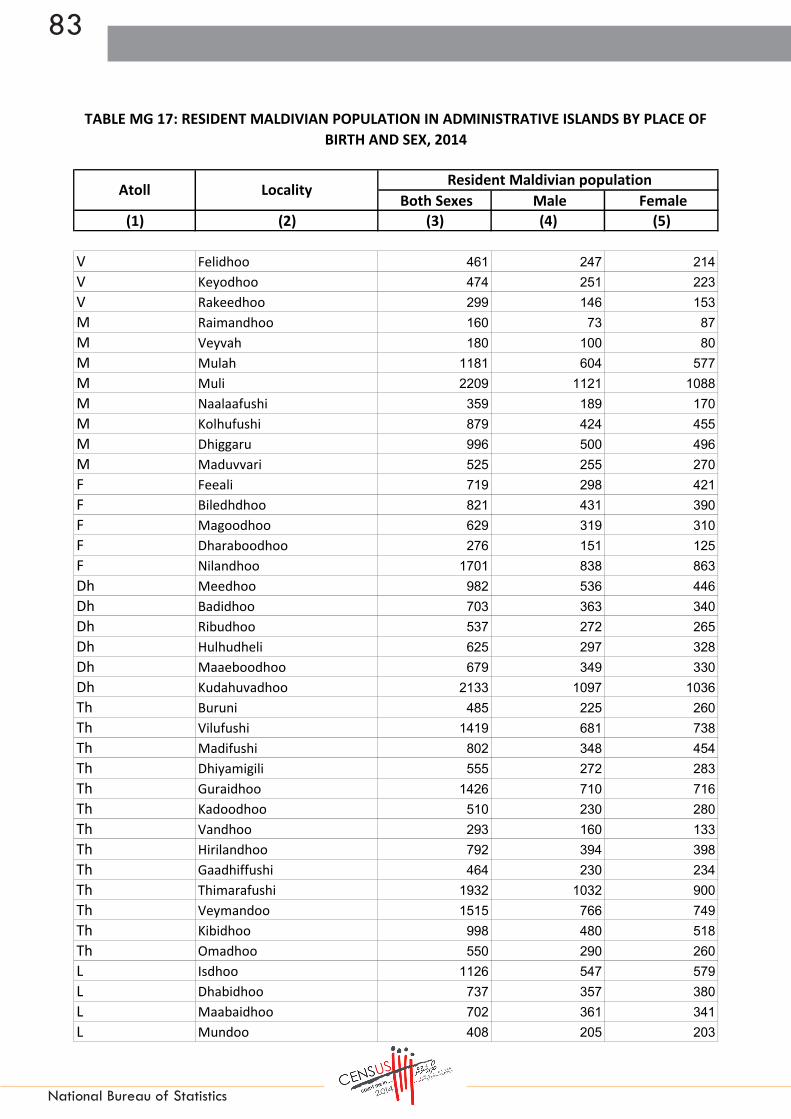
83
National Bureau of Statistics
Both Sexes Male Female (1) (2) (3) (4) (5)
TABLE MG 17: RESIDENT MALDIVIAN POPULATION IN ADMINISTRATIVE ISLANDS BY PLACE OF BIRTH AND SEX, 2014
Atoll Locality Resident Maldivian population
V Felidhoo 461 247 214V Keyodhoo 474 251 223V Rakeedhoo 299 146 153M Raimandhoo 160 73 87M Veyvah 180 100 80M Mulah 1181 604 577M Muli 2209 1121 1088M Naalaafushi 359 189 170M Kolhufushi 879 424 455M Dhiggaru 996 500 496M Maduvvari 525 255 270F Feeali 719 298 421F Biledhdhoo 821 431 390F Magoodhoo 629 319 310F Dharaboodhoo 276 151 125F Nilandhoo 1701 838 863Dh Meedhoo 982 536 446Dh Badidhoo 703 363 340Dh Ribudhoo 537 272 265Dh Hulhudheli 625 297 328Dh Maaeboodhoo 679 349 330Dh Kudahuvadhoo 2133 1097 1036Th Buruni 485 225 260Th Vilufushi 1419 681 738Th Madifushi 802 348 454Th Dhiyamigili 555 272 283Th Guraidhoo 1426 710 716Th Kadoodhoo 510 230 280Th Vandhoo 293 160 133Th Hirilandhoo 792 394 398Th Gaadhiffushi 464 230 234Th Thimarafushi 1932 1032 900Th Veymandoo 1515 766 749Th Kibidhoo 998 480 518Th Omadhoo 550 290 260L Isdhoo 1126 547 579L Dhabidhoo 737 357 380L Maabaidhoo 702 361 341L Mundoo 408 205 203

84Migration: CENSUS 2014
National Bureau of Statistics
Both Sexes Male Female (1) (2) (3) (4) (5)
TABLE MG 17: RESIDENT MALDIVIAN POPULATION IN ADMINISTRATIVE ISLANDS BY PLACE OF BIRTH AND SEX, 2014
Atoll Locality Resident Maldivian population
L Gamu 4432 2333 2099L Maavah 1545 781 764L Fonadhoo 1398 714 684L Gaadhoo 355 181 174L Maamendhoo 859 406 453L Hithadhoo 898 472 426L Kunahandhoo 626 301 325L Kalaidhoo 547 281 266GA Kolamaafushi 1207 607 600GA Viligili 2975 1539 1436GA Maamendhoo 1064 549 515GA Nilandhoo 663 331 332GA Dhaandhoo 1556 735 821GA Dhevvadhoo 894 473 421GA Kodey 308 151 157GA Gemanafushi 1194 604 590GA Kanduhulhudhoo 680 340 340GDh Madaveli 1423 725 698GDh Hoadedhdhoo 840 428 412GDh Nadallaa 998 478 520GDh Gadhdhoo 2366 1164 1202GDh Rathafandhoo 1109 544 565GDh Vaadhoo 1178 597 581GDh Fiyoari 1138 566 572GDh Faresmaathodaa 8045 4053 3992GDh Thinadhoo 1134 560 574Gn Fuvahmulah 10570 5324 5246S Meedhoo 1865 955 910S Hithadhoo 15795 7994 7801S Maradhoo 2181 1090 1091S Feydhoo 2918 1453 1465S Maradhoo-Feydhoo 851 449 402S Hulhudhoo 2571 1347 1224
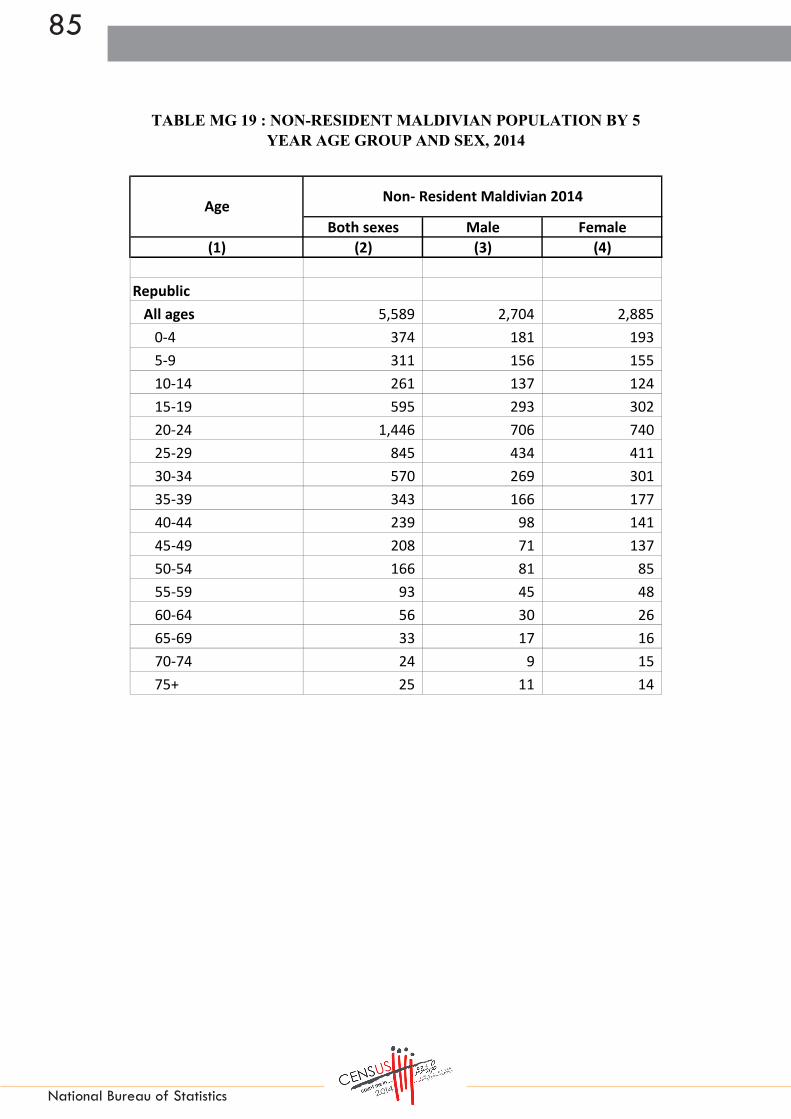
85
National Bureau of Statistics
Both sexes Male Female(1) (2) (3) (4)
RepublicAll ages 5,589 2,704 2,885
0-4 374 181 193 5-9 311 156 155 10-14 261 137 124 15-19 595 293 302 20-24 1,446 706 740 25-29 845 434 411 30-34 570 269 301 35-39 343 166 177 40-44 239 98 141 45-49 208 71 137 50-54 166 81 85 55-59 93 45 48 60-64 56 30 26 65-69 33 17 16 70-74 24 9 15 75+ 25 11 14
TABLE MG 19 : NON-RESIDENT MALDIVIAN POPULATION BY 5 YEAR AGE GROUP AND SEX, 2014
Age Non- Resident Maldivian 2014


National Bureau of StatisticsMinistry of Finance and Treasury
Male’, Maldives