malawi programme for reducing childhood morbidity and
TRANSCRIPT

22 January 2007 This publication was produced for review by the United States Agency for International Development. It was prepared by staff members of the Malawi Programme for Reducing Childhood Morbidity and Strengthening Health Systems.
Malawi Programme for Reducing Childhood Morbidity and Strengthening Health Systems Trip Report

Management Sciences for Health Page 2 22 January, 2007
Project Name: The Malawi Programme for Reducing Childhood Morbidity and Strengthening Health Systems Contract Number: 690-A-00-03-0017-00 Management Sciences for Health Area 4, Plot 4/356 P/Bag 398 Lilongwe 3, Malawi Telephone: 265-1-756-111 Website: www.msh.org

Management Sciences for Health Page 3 22 January, 2007
Malawi Reducing Child Morbidity/Strengthening Health Systems Project
Setting Fees for Maternal and Newborn Health Services provided at Christian Health Association of Malawi member
facilities
22 January 2007
David H. Collins, FCA, MA Management Sciences for Health Cambridge, Massachusetts, USA

Management Sciences for Health Page 4 22 January, 2007
ACKNOWLEDGMENT AND DISCLAIMER
This report was made possible through support provided by the Malawi Reducing Child Morbidity /Strengthening Health Systems Project, funded by the U.S. Agency for International Development under award number 690-A-00-03-00170-00, and implemented by Management Sciences for Health. The opinions expressed herein are those of the author and do not necessarily reflect the views of the funding agency or Management Sciences for Health.

Management Sciences for Health Page 5 22 January, 2007
Executive Summary The main objective of this study is to assist in the determination of fees that the Ministry of Health will pay for maternal and newborn health (MNH) services provided at Christian Health Association of Malawi (CHAM) facilities. Discussions were held with many officials from the MOH, the CHAM Secretariat, CHAM hospitals and USAID. In additions the costs prepared by the MOH and three CHAM hospitals, and the fees and service level agreements for several CHAM hospitals were reviewed. Based on these discussions and reviews the following recommendations are made:
• It is simplest to have a standard SLA fee for each health intervention and to standardize
the fees across the SLA facilities. It is recognized that some CHAM members will benefit from standard fees and others will lose – depending on how many existing and new patients will receive services covered under the SLA. However, having standard fees will simplify and speed up the implementation of the SLAs since the capacity of most DHOs and CHAM facility managers to cost services and negotiate fees is limited. In addition, standard fees should provide incentives to standardize costs.
• The hospital that has done the most realistic work on the costing and fee setting appears
to be Nkhoma and, reportedly, the fees used in the Nkhoma SLA are being copied in some other SLAs. The SLA fees for Nkhoma represent, on average, 75% of the Nkhoma costs and 43% of the EHP costs, and thus represent a reasonable proportion of cost sharing. Although it appears that the Nkhoma costs may not be completely accurate and it is too soon to assess properly the impact of the SLAs on the numbers of patients and on CHAM and MOH resources, it seems reasonable to use the Nkhoma fee structure as a temporary basis for standard fees. If the real costs are not too different, the subsidy from the MOH is in the range of 75%, which should probably allow them to at least double the number of patients receiving these services. It is, therefore, recommended that the Nkhoma fee structure be used as the basis for all the other SLA’s that are signed until more accurate figures can be obtained for costs and utilization.1
• All the costing exercises produced significantly different results and some of the costs
calculated by Nkhoma may be overstated. It is therefore important that a single standard costing is agreed on by the MOH and CHAM. A small group of MOH and CHAM doctors should agree on a standard protocol for each intervention, using the four cost models as inputs in the discussion2. The purpose is to provide a standard basis for fee setting, not to standardize treatment protocols, and focus should, therefore, be on those treatment lines that have a significant impact on cost. If it is not feasible to produce this
1 The CHAM Service Level Agreement Taskforce has expressed reservations that an overall 75% subsidy rate for fee setting will not even cover the direct intervention costs per intervention and would first like to see the direct intervention costs re-calculated as recommended in this report. 2 Following this recommendation a two-day workshop was reportedly held in November and standard protocols and costs were developed. Since the workshop took place after this study was carried out, the findings have not been included in this report.

Management Sciences for Health Page 6 22 January, 2007
standard costing quickly, it is recommended that CHAM carry out a quick review of the Nkhoma costing and correct any significant errors.
• Once the costs have been reviewed and corrected and the overall fee levels have been
reviewed, it is recommended that an overall subsidy rate be agreed and that the standard fee for each intervention be set at that percentage of the cost. For example, if it is agreed that 75% is a reasonable percentage of cost sharing by the MOH, then the fee for each intervention should be set at 75% of the cost of that intervention. This will maintain the reimbursement rate at the agreed percentage even where the mix of interventions varies.
• Whilst it appears important from a financial perspective to set a budget limit on SLA
payments to facilities it is not clear how the number of patients who receive EHP services can be limited in practice. For example, if 100 patients are covered under an SLA what will happen to the 101st? She cannot be refused treatment and presumably cannot be charged the user fee – especially if it has been announced publicly that these services are now free. However, if she is treated without reimbursement the hospital will have to bear the full cost. It is important to discuss this and find a solution.
• The roll out of the SLAs should be closely monitored by the MOH and CHAM and
should be evaluated after the first year of implementation (perhaps around the middle of calendar year 2007) and after each subsequent year. This evaluation should include a review of standard costs and fees. The expansion of the SLAs to cover other EHP services should not take place until such an evaluation has been completed and should be based on a detailed plan and analysis of expected impact.
• The monitoring should include the impact of the SLAs on the district utilization and on
the district and national MOH budgets. CHAM also needs to monitor and evaluate the impact of the SLAs on its members – covering the financial, service, staffing, quality of care and sustainability aspects.
• CHAM hospital services and the expected impact of the SLAs should be taken into
account in the District Implementation Plans – both from the financial and service perspectives. The capital needs of CHAM facilities with SLAs should also be included the District Capital Investment Plans.
A break-even model was developed for the MNH services provided by CHAM members. This was done on a spreadsheet and has been sent separately to the CHAM Secretariat and the MOH. A printed version with dummy figures is shown in Annex 7.

Management Sciences for Health Page 7 22 January, 2007
Report 1. Objectives, tasks and deliverables: The main objective of this study is to assist in the determination of fees that the Ministry of Health (MOH) will pay for maternal and newborn health (MNH) services provided at selected Christian Health Association of Malawi (CHAM) facilities. The detailed Scope of Work is shown in Annex 1.
The work was carried out during a visit to Malawi from the 3rd through the 15th of September, 2006. Additional information was received in October and a draft copy of the report was sent out for review in that month. Comments were received in November and December and this final report takes those into account.
After the study started it was agreed that the work would be focused on hospital level services since they are more complex and will have a greater impact on cost, at least in the short term. Health centre costs and fees were, therefore, not covered in the study, although the costs of some of the hospital services can be easily modified to produce estimates of health centre costs. To conduct this study, meetings were held with a number of managers from the MOH, CHAM Secretariat, selected CHAM facilities and USAID. A list of persons met is shown in Annex 2.
2. Background CHAM is an umbrella organization with members comprised of religious organizations who provide health care services. CHAM members are an important element in the health care system in Malawi. They run a total of 167 health facilities, which comprise 25% of the total of 617 facilities in the country, with MOH facilities making 60%3. The proportion of general/district hospitals run by CHAM is, however, significantly higher at 40% (27 of the 68 general and district hospitals, excluding the 4 central MOH hospitals). The MOH information system contains information on the numbers of services provided by CHAM members but it has not been extracted and it is understood that not all the data are reliable. Since CHAM member facilities are reportedly less well utilized than MOH facilities because of the user fees charged, it would seem likely that they provide less than 30% of the services4. Nevertheless, CHAM members are very important providers of services since 90% of their facilities are reportedly located in the rural areas and they have the capacity to serve significant additional numbers of the rural poor who do not have easy access to MOH facilities.
3 Figures from the Malawi Health Facility Survey 2002 Report. CHAM’s Press Release of September 2006 states that its members have 167 facilities in Malawi, 130 of which are health centre, 16 are community hospitals and 16 are hospitals. 4 A figure of 37% is quoted in the latest draft NHA study, but according to one of the authors this figure is often quoted but has never been substantiated. The CHAM Press Release of September 2006 states a figure of 40%.

Management Sciences for Health Page 8 22 January, 2007
Funding for CHAM has come partly from the MOH (through the payment of staff salaries and allowances), from private donations and from user fees. These include higher fee levels for a small number of private patients (insured and non-insured). The MOH has defined an Essential Health Package (EHP) of services which should be available to all citizens irrespective of ability to pay. These services are free of charge at MOH facilities but the facilities are often over-crowded and under-resourced. CHAM members also provide these services but due to financial constraints they are subject to the user fees. The user fee levels vary across hospitals but are generally low compared with the cost. In addition certain services are free of charge and hospitals grant a limited number of waivers for patients who are too poor to pay. However, although it is easier and cheaper for people to get to CHAM facilities in some rural areas, the user fees prevent some patients from accessing services and cause financial hardship to some patients who do access those services The objective of introducing the SLAs is to replace the user fees with government subsidies and thus to remove the financial barrier that prevents poor patients from accessing services and causes financial hardship to others who do access those services. The SLAs are being phased in with the initial round covering only Maternal and Neonatal Health (MNH) services. The understanding between the MOH and CHAM has been that the costs of providing services covered under the SLAs will be shared between them. The SLAs will cover direct costs – primarily pharmaceuticals and medical supplies and, where necessary, bed/food and emergency transport costs. Some necessary building expansion, renovation and new equipment can also be funded by the MOH. The MOH will continue to cover staffing costs. Indirect costs (maintenance etc.) are paid by CHAM members but there is, reportedly, a willingness on behalf of the MOH to consider covering or sharing additional indirect costs related to patients covered under SLAs5. In some cases the MOH would, reportedly, prefer to provide drugs and medical supplies but the supply from CMS is not always reliable – there are currently shortages of many drugs due to procurement delays – and prices at the CMS are not always the cheapest. It is expected that better-off patients will still pay user fees for “private” EHP services at CHAM facilities. The SLAs are only intended to cover services to the poor. MOH health services are free to public patients but private patients are charged fees. Several cost estimates are being used to determine the fee levels for these services. The next section reviews the models used to estimate the costs. 3. Review of cost models
a. MOH model
5 It should be noted that very small amounts of indirect costs have been included in two of the CHAM hospital costings.

Management Sciences for Health Page 9 22 January, 2007
The MOH model is called the EHP Cost Model which was developed in 2002. The model covers EHP services at hospital, health centre and community levels. The direct cost component of the model lists the treatment lines under each intervention. These treatment lines cover drugs, supplies, bed days and emergency transport. The treatment lines do not include equipment and other costs, which are included as indirect costs under the facilities section of the model. The treatment lines appear to follow the intervention details set out in Annex 1 of the Malawi EHP Document. According to the model description, the unit costs per treatment line are mostly taken from the CMS price list. The model includes different procedures under some interventions and calculates an average cost for these using a percentage that reflects the proportion of patients that are expected to receive that procedure. For example the treatment lines for a caesarian section are shown under Eclampsia and 10% of the cost of these lines is included in the Eclampsia intervention total cost. See Annex 3 for a detailed review of the model and costs.
b. Review of CHAM member cost models. The approach of CHAM has been to allow those members that are involved in the initial SLAs to develop their own cost models and to use them in negotiations with the MOH. This approach was used because treatment protocols can and do vary across CHAM members and with the MOH. The first significant costing was done for Nkhoma Hospital and costings of services at St Gabriel’s Hospital and St Luke’s Hospital followed. The three cost models were reviewed. The Nkhoma Hospital model only appears to cover hospital-level services. The approach is similar to that used in the MOH model, except that procedures under interventions, such as a caesarian section, are shown as a separate intervention with a separate costing. However, in some cases, treatment lines are included at full cost when that treatment is only likely to be used for a percentage of the patients. This has the effect of overstating the cost. The St Gabriel’s and St Luke’s Hospital models also only cover hospital-level services. The approaches are similar to that used by Nkhoma Hospital. However both models have errors and the St Luke’s costing is not complete. See Annex 3 for detailed reviews of these models and the costs.
c. Comparison of EHP and CHAM models There are differences in the costs produced by the four models, in some cases significant ones. These occur for the following reasons:
• A percentage of the costs of certain procedures, such as caesarian sections, are included in the intervention costs under the EHP model but are shown as separate interventions in the CHAM models. This makes some of the EHP intervention costs slightly higher.
• The full costs of certain treatments that are only used for a percentage of patients are included in some of the intervention costs under the Nkhoma model (and possibly under the St Gabriel’s and St Luke’s models. This makes the intervention costs higher, in some cases much higher.
• Some of the treatments are shown in more detail under some models (more treatment lines), which generally results in higher costs.

Management Sciences for Health Page 10 22 January, 2007
• Inputs other than drugs and medical supplies are included in some models. For example, emergency transport is included under many of the EHP interventions but is not included under the CHAM cost models.
• Different treatment protocols are used in the four models (eg different types and quantities of drugs).
• Different prices are sometimes used for the same drug or item of medical supplies in different places in both the St Gabriel’s and St Luke’s models (partly because these models do not use look-up tables).
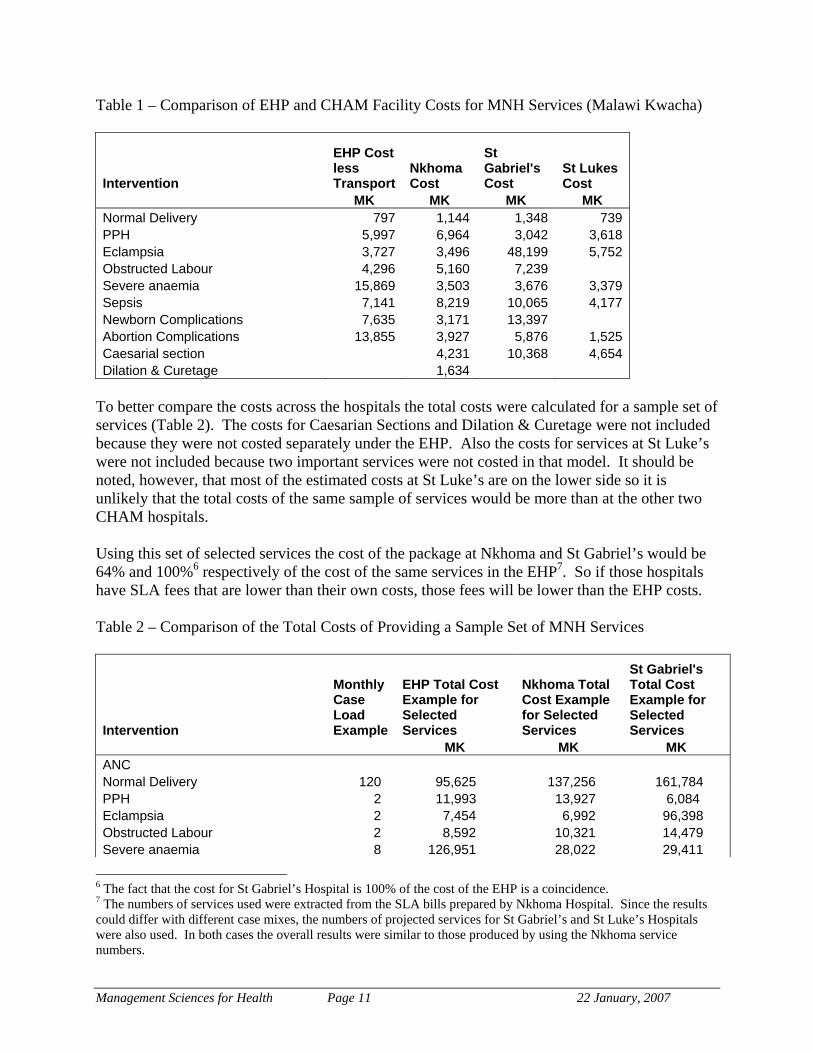
See Annex 3 for a detailed comparison of these models and costs. 4. Comparison of EHP and CHAM member costs To facilitate the comparisons the costs of emergency transport were removed from the EHP intervention costs since this is not included in the intervention costs in the CHAM costings (Annex 4). The comparison of the costs from the different models shows the variances in costs for the main interventions (Table 1). (The same table is shown in US$ in Annex 5). Note that the EHP model does not show a separate cost for Caesarian Sections and Dilation & Curetage. The highest costs are not all to be found in the same model. For example, the St Gabriel’s costing produced the highest cost for a normal delivery, the Nkhoma costing produced the highest cost for the treatment of Post Partum Haemorrage, and the EHP costing produced the highest cost for the treatment of Severe Anemia. In some cases the more striking variances are due to one factor. For example, the high cost of MK 48,199 for Eclampsia treatment at St Gabriel’s includes MK 40,320 for 72 injections of Magnesium Sulphate at MK 560 each. In contrast the Nkhoma and EHP costings include no Magnesium Sulphate and even if they include an alternative the cost is not high. Similarly the high cost of MK 15,869 for treatment for Severe Anaemia in the EHP costing includes MK 14,420 for 3.5 units of blood at MK 4,200 each. In contrast, the Nkhoma costing only includes MK 2,800 for 2 units of blood at MK 1,400 each and the St Gabriel’s costing does not include any blood. Since the EHP Costing was done in 2002 a small sample of items were checked to see if the prices used had risen due to inflation. This was done by comparing the 2002 US$ prices for 10 items with the prices in the CMS Catalogue for 2005/06. Of the 10 items checked, 5 prices increased and 5 decreased. It was therefore decided not to apply any inflation factor to the 2002 US$ prices for the comparisons with the CHAM costs. It should be noted that CHAM members buy some drugs from the CMS but buy most of them elsewhere. Note that the CMS charges 12.5% handling fee to CHAM members as opposed to a 5% handling fee to MOH facilities. The CMS prices used in the EHP costing would not have included these handling fees so one would expect the CHAM costs for drugs and supplies bought from CMS to be higher. Given that the MOH will be reimbursing CHAM for these costs for MNH services it may be worthwhile reducing the handling fee.
Management Sciences for Health Page 11 22 January, 2007
Table 1 – Comparison of EHP and CHAM Facility Costs for MNH Services (Malawi Kwacha)
Intervention
EHP Cost less Transport
Nkhoma Cost
St Gabriel's Cost
St Lukes Cost
MK MK MK MK Normal Delivery 797 1,144 1,348 739 PPH 5,997 6,964 3,042 3,618 Eclampsia 3,727 3,496 48,199 5,752 Obstructed Labour 4,296 5,160 7,239 Severe anaemia 15,869 3,503 3,676 3,379 Sepsis 7,141 8,219 10,065 4,177 Newborn Complications 7,635 3,171 13,397 Abortion Complications 13,855 3,927 5,876 1,525 Caesarial section 4,231 10,368 4,654 Dilation & Curetage 1,634
To better compare the costs across the hospitals the total costs were calculated for a sample set of services (Table 2). The costs for Caesarian Sections and Dilation & Curetage were not included because they were not costed separately under the EHP. Also the costs for services at St Luke’s were not included because two important services were not costed in that model. It should be noted, however, that most of the estimated costs at St Luke’s are on the lower side so it is unlikely that the total costs of the same sample of services would be more than at the other two CHAM hospitals. Using this set of selected services the cost of the package at Nkhoma and St Gabriel’s would be 64% and 100%6 respectively of the cost of the same services in the EHP7. So if those hospitals have SLA fees that are lower than their own costs, those fees will be lower than the EHP costs. Table 2 – Comparison of the Total Costs of Providing a Sample Set of MNH Services
Intervention
Monthly Case Load Example
EHP Total Cost Example for Selected Services
Nkhoma Total Cost Example for Selected Services
St Gabriel's Total Cost Example for Selected Services
MK MK MK ANC Normal Delivery 120 95,625 137,256 161,784 PPH 2 11,993 13,927 6,084 Eclampsia 2 7,454 6,992 96,398 Obstructed Labour 2 8,592 10,321 14,479 Severe anaemia 8 126,951 28,022 29,411
6 The fact that the cost for St Gabriel’s Hospital is 100% of the cost of the EHP is a coincidence. 7 The numbers of services used were extracted from the SLA bills prepared by Nkhoma Hospital. Since the results could differ with different case mixes, the numbers of projected services for St Gabriel’s and St Luke’s Hospitals were also used. In both cases the overall results were similar to those produced by using the Nkhoma service numbers.

Management Sciences for Health Page 12 22 January, 2007
Sepsis 4 28,562 32,878 40,258 Newborn Complications 2 15,270 6,342 26,793 Abortion Complications 10 138,546 39,270 58,758 SUB-TOTAL 432,992 275,008 433,966 64% 100%
5. SLA fee levels CHAM management recognized at an early stage that costs would vary among providers and with the MOH costs. To guide members, CHAM managers provided them with fee ceilings which they could use in their negotiations with the District Health Officers (DHOs). These were set at lower levels than the full direct costs shown in the EHP but higher than the user fees previously charged, since those fees were heavily subsidized to take into account ability to pay. The fees are generally denominated in the SLAs in US$ and then converted into MK using one average rate per three or six months. See Table 3 for a comparison of the fees from several facilities. Table 3 – Comparison of SLA Fees at Selected Hospitals
EHP component Nkhoma Hospital
St Gabriel's Hospital
St Luke's
Hospital
Mulanje Mission Hospital
Muli Bwanji Community
Hospital
Francisco Palau Rural
Hospital ANC 157 200 200 200 50 Normal Delivery 894 1,169 700 700 700 500 Post-Partum Haemorrhage 3,004 3,028 2,700 3,000 2,000 Eclampsia 3,646 9,489 5,500 6,000 2,500 Obstructed Labour 1,081 5,800 Severe anaemia 1,445 1,490 2,500 1,400 1,500 Sepsis 3,981 4,704 6,000 3,000 3,000 Newborn Complications 4,713 3,503 4,000 4,000 Abortion Complications 2,738 3,235 1,500 3,000 2,500 Caesarian 3,778 5,048 5,500 4,000 3,800 Dilation & Curetage 1,459 -
Information on the fees was taken from a selection of SLAs that were already signed and others that were under negotiation. The MulaNje Mission Hospital, Muli Bwanji Community Hospital and Fransisco Palau Rural Hospital SLAs (January 2006) were signed first. In the case of St Gabriel’s the fees were taken from a spreadsheet sent by the hospital administrator in an e-mail on 20th September 2006, after ensuring that the total budget figure shown therein agreed with the amount shown in the draft service agreement sent on the same date. As can be seen from Table 3, the fees vary across the hospitals and, in some cases, these variances are significant. One reason why the Nkhoma fees are lower in some cases is that the hospital deliberately used an exchange rate of MK 125 to US$ 1 to covert the US$ fees into MK fees for the first 6 months8. In contrast the St Gabriel’s fees were converted at Mk 1409 and the St Luke’s fees were presumably set with the same rate in mind. 8 Note that the Nkhoma costs were developed in 2005. 9 The rate was changed on 1st July 2006 reflecting the actual foreign exchange rate at that time.

Management Sciences for Health Page 13 22 January, 2007
It should be noted that the proposed 2006 private patient fees at government hospitals are higher than these SLA fees. For example, the proposed standard fee (cost plus 20%) for a normal delivery is MK 2,277 and for a Caesarian Section is MK 9,167 (it is unclear if bed and drug costs are included or charged separately). It is understood that services are free for public patients. Since the fees are not consistently higher or lower at any one facility, they were then compared by calculating and comparing the total revenue from the fees for the sample set of services that were used to compare costs (Table 4). Only the Nkhoma and St Gabriel’s total revenues were compared as the St Luke’s list of fees does not cover all the services. Table 4 – Comparison of Total Revenue for Two CHAM Hospitals
Intervention Annual Case Load Example
Nkhoma Total SLA Revenue
St Gabriels Total SLA Revenue
ANC Normal Delivery 120 107,250 140,280 PPH 2 6,008 6,056 Eclampsia 2 7,293 18,978 Obstructed Labour 2 2,163 11,600 Severe anaemia 8 11,560 11,917 Sepsis 4 15,925 18,816 Newborn Complications 2 9,425 7,006 Abortion Complications 10 27,375 32,354 Caesarian section 22 83,105 111,065 SUB-TOTAL 270,103 358,072
Note that the above totals include Caesarian Sections and are therefore not comparable with the total costs shown in Table 2 which does not include Caesarian Sections. The total revenue for Nkhoma would be MK 270,103, which is much lower than the figure of MK 358,072 for St Gabriel’s. A comparison of the figures for the smaller number of services at St Luke’s indicates that its total revenue from these services would slightly higher than the total for the same services at Nkhoma. The Nkhoma fees appear to be, on average, the lowest of the three CHAM hospitals. The fees were also compared with the costs at two CHAM hospitals (St Luke’s was excluded because fewer services were costed). In the case of Nkhoma the relationship of the fee level to the cost for each service varies considerably (Table 5). Reportedly, in some cases, this is because it was recognized at the time of the fee negotiations that the costs were incorrect. The fees were then set to reflect a more correct cost but the costings were not adjusted. The estimated SLA total revenue for the sample set of services comes to MK 310,948 which is 75% of the estimated total cost of MK 413,832. This overall difference is partly because the hospital aimed to set its fees at levels that were less than cost and partly because it deliberately used MK 125 to US$ 1 to set the MK fees for the first 6 months.

Management Sciences for Health Page 14 22 January, 2007
On the above basis, Nkhoma Hospital is contributing 25% of the direct costs on average for each patient covered under the SLA and is also paying most of the indirect costs (excluding staff). Table 5. Comparison of Nkhoma costs and revenues under the SLA
Nkhoma Cost
Nkhoma SLA Fees
Nkhoma SLA Fees as % of Costs
Annual Case Load Example
Nkhoma Total Cost Example
Nkhoma Total SLA Revenue
Normal Delivery 1,144 894 78% 120 137,256 107,250 PPH 6,964 3,004 43% 2 13,927 6,008 Eclampsia 3,496 3,646 104% 2 6,992 7,293 Obstructed Labour 5,160 1,081 21% 2 10,321 2,163 Severe anaemia 3,503 1,445 41% 8 28,022 11,560 Sepsis 8,219 3,981 48% 4 32,878 15,925 Newborn Complications 3,171 4,713 149% 2 6,342 9,425 Abortion Complications 3,927 2,738 70% 10 39,270 27,375 Caesarial section 4,231 3,778 89% 22 93,078 83,105 Dilation & Curetage 1,634 1,459 89% 28 45,746 40,845 SUB-TOTAL 75% 413,832 310,948
In the case of St Gabriel’s the relationship of the fee level to the cost for each service also varies considerably (Table 6). Reportedly, some of these costs were not accepted during the negotiation process and the Nkhoma costs were also taken into account when the fees were agreed. The estimated SLA total revenue for the sample set of services comes to MK 358,072 which is 54% of the estimated total cost of MK 662,071. If St Gabriel’s original costing is correct it is contributing 46% of the direct costs on average for each patient covered under the SLA and is also paying most of the indirect costs (excluding staff). Table 6. Comparison of St Gabriel’s costs and revenues under the SLA
Intervention
St Gabriels Costs
St Gabriels SLA Fees
St Gabriels SLA Fees as % of Costs
Annual Case Load Example
St Gabriels Total Cost Example
St Gabriels Total SLA Revenue Example
Normal Delivery 1,348 1,169 87% 120 161,784 140,280 PPH 3,042 3,028 100% 2 6,084 6,056 Eclampsia 48,199 9,489 20% 2 96,398 18,978 Obstructed Labour 7,239 5,800 80% 2 14,479 11,600 Severe anaemia 3,676 1,490 41% 8 29,411 11,917 Sepsis 10,065 4,704 47% 4 40,258 18,816 Newborn Complications 13,397 3,503 26% 2 26,793 7,006 Abortion Complications 5,876 3,235 55% 10 58,758 32,354 Caesarian section 10,368 5,048 49% 22 228,105 111,065 SUB-TOTAL 54% 662,071 358,072

Management Sciences for Health Page 15 22 January, 2007
To demonstrate more clearly that the fee levels for the two hospitals are lower than the EHP costs, the total EHP costs and total hospital SLA revenues were also compared for the sample set of services (Table 7). In this table the sample set of services was reduced because Caesarian Sections and Dilation and Curetage procedures were not costed separately in the EHP. The total SLA revenue comes to 43% and 57% of the total EHP cost for Nkhoma and St Gabriel’s, respectively. Note that Nkhoma Hospital has had its SLA in place since 1st January 2006. The bills submitted to the MOH for the first 6 months, which have reportedly been paid, were reviewed briefly as part of this study. What is notable from the bills is that where different procedures were carried out on a patient, the fees for each procedure were added together in the bills10. For example, where treatment was provided for abortion complications and dilation and curettage, the fee for each service was added together and the total billed. The DHO and Nkhoma need to review the budget to make sure that this billing method will not send the SLA costs over the DHO’s budget or will not mean that fewer patients were treated than were budgeted for. Table 7. Comparison of Nkhoma SLA revenue and EHP costs
Intervention
Monthly Case Load Example
EHP Total Cost Example for Selected Services
Nkhoma Total SLA Revenue
St Gabriel's Total SLA Revenue
Normal Delivery 120 95,625 107,250 140,280 PPH 2 11,993 6,008 6,056 Eclampsia 2 7,454 7,293 18,978 Obstructed Labour 2 8,592 2,163 11,600 Severe anaemia 8 126,951 11,560 11,917 Sepsis 4 28,562 15,925 18,816 Newborn Complications 2 15,270 9,425 7,006 Abortion Complications 10 138,546 27,375 32,354 Total 432,992 186,998 247,008 43% 57%
6. Recommendations of fee levels for MNH services The objective of introducing the SLAs is to replace the user fees with government subsidies and thus to remove the financial barrier that prevents poor patients from accessing services and causes financial hardship to others who do access those services. The understanding is that cost of providing the services covered under the SLAs will be shared between the MOH and the CHAM members. The fee paid by the MOH covers part of the direct costs of drugs and medical supplies and the balance of these direct costs are paid by the CHAM member. Salaries are paid by the MOH and it is understood that some of the capital and
10 Note that the bill for the first 3 months was calculated using an exchange rate of MK122 to the US$ which was an incorrect rate. The bill for the second three months was calculated using MK 125, which was correct.

Management Sciences for Health Page 16 22 January, 2007
maintenance costs will also be paid by the MOH. Other indirect costs are paid by the CHAM members. The number of additional patients that can be seen under the SLAs depends on the amount of additional resources made available by the MOH. CHAM members already use donations and the staffing funding from the MOH to provide heavily subsidized services to the poor. The additional funding from the MOH through the SLAs means that these CHAM member and MOH resources can be spread over more patients. It is generally understood that the SLA fees should be higher than the user fees but lower than the direct and additional indirect cost (eg cleaning and water) of providing the services. CHAM facilities will, therefore, generate additional revenue from existing patients now covered under SLAs, but will have to pay part of the cost of treating additional patients. The number of additional patients that can be seen will reflect the amount of extra revenue generated by a facility and the amount that it has to pay for each additional patient. (See Section 10 for a detailed explanation). If the SLA fees are set at levels that are just above the user fees, the MOH will spend less but CHAM will not have enough extra funding to see many additional patients. On the other hand, if the fees are set close to the cost, CHAM should be able to see many patients but the MOH will spend more. Of course, the hospital may have other constraints that restrict its ability to provide additional services, such as the inability to get additional staff funded by the MOH11 or to fund additional capital costs (such as equipment). It is simplest to have a standard SLA fee for each service and use that same fee at each SLA facility. It is recognized that some CHAM members will benefit from standard fees and others will lose – depending on how many existing and new patients will receive services covered under the SLA. However, having standard fees will simplify and speed up the implementation of the SLAs since the capacity of most DHOs and CHAM facility managers to cost services and negotiate fees is quite limited. In addition standard fees will provide incentives to standardize costs. The hospital that has done the most realistic work on the costing and fee setting appears to be Nkhoma and, reportedly, the fees used in the Nkhoma SLA are being adopted for some other SLAs. As was shown earlier in this document the SLA fees for Nkhoma represent, on average, 75% of the Nkhoma direct costs and 43% of the EHP costs, and are also lower than the St Gabriel’s fees. Although it appears that the Nkhoma costs may not be completely accurate and it is too soon to assess properly the impact of the SLAs on the numbers of patients and on CHAM and MOH resources, it seems reasonable to use the Nkhoma fee structure as a temporary basis for standard fees. If the real costs are not too different, the subsidy from the MOH is in the range of 75%, which should probably allow them to at least double the number of patients receiving these services. It is, therefore, recommended that the Nkhoma fee structure be used as the basis
11 The cost of salary top-ups paid by the hospital to staff whose salaries are paid by the MOH is an indirect cost borne by the hospital and it is unlikely that the MOH would pay any increase in top-up costs relating to additional staffing.

Management Sciences for Health Page 17 22 January, 2007
for all the other SLA’s that are signed until more accurate figures can be obtained for costs and utilization12. Given that the costs of some interventions differed greatly across the four costing studies and that some of the Nkhoma costs may be overstated1314, it is important to produce a standard set of costs that are approved by both the MOH and CHAM as soon as possible. The best way to achieve this is to have a small group of MOH and CHAM doctors meet to produce a standard protocol for each intervention, using the four cost models as inputs in the discussion15. The purpose is to provide a standard basis for fee setting, not to standardize treatment protocols, and focus should, therefore, be on those treatment lines that have a significant impact on cost. The interventions should be defined in accordance with the way hospitals report so that the costs, bills and service statistics can be easily related. Either the EHP cost model or the Nkhoma cost model should be modified to produce one standard model that can be used for both the MOH and CHAM. If it is not feasible to produce this standard costing quickly, it is recommended that CHAM carry out a quick review of the Nkhoma costing and correct any significant errors and discuss any necessary fee adjustments with the MOH. Once the costs have been reviewed and corrected and the overall fee levels have been reviewed, it is recommended that an overall subsidy rate be agreed and that the standard fee for each intervention be set at that percentage of the cost. For example, if it is agreed that 75% is a reasonable percentage of cost sharing by the MOH, then the fee for each intervention should be set at 75% of the cost of that intervention. This will maintain the reimbursement rate at the agreed percentage even where the mix of interventions varies. 7. Recommendations on format of service level agreements The model SLA developed by CHAM was reviewed together with the St Gabriel’s SLA which is closely based on the model SLA. In general this SLA format is satisfactory but the following changes should be considered:
1. Draft versions of the SLA should be dated so that they can be easily tracked. 2. The immediate catchment area for the facility should be defined specifically for the
facility. 3. The term eligible (conditionality) as used in the St Gabriel SLA (1.2) should be defined.
12 It should be noted that The CHAM Service Level Agreement Taskforce has expressed concerns that an overall 75% subsidy rate for fee setting will not even cover the direct intervention costs per intervention and would first like to see the direct intervention costs calculated by the doctors group. 13 However, this does not mean that the fees for those services are in excess of cost since the fees for certain services are well below the stated cost. 14 All of the more expensive treatment elements should be looked at including blood under PPH, Severe Anaemia and Sepsis; an infusion giving set under Obstructed Labour; and hospital accommodation across the board. Care must be made to ensure that treatments that are only provided to a percentage of patients are only allocated with that percentage of the costs. 15 Following this recommendation a two-day workshop was reportedly held in November and standard protocols and costs were developed. Since the workshop took place after this study was carried out, the findings have not been included in this report.

Management Sciences for Health Page 18 22 January, 2007
4. If the SLA includes a clause stating that drugs and supplies are not provided for a free service that is not covered under the SLA (eg the treatment of STIs during pregnancy in St Gabriel SLA 1.3), it should also state what will happen if those drugs and supplies are not provided.
5. The ambulance trips covered by the SLA should be clearly defined in terms of which services and between which places (St Gabriel SLA 1.4).
6. The SLA should state exactly how many months the DHO will provide the publicity campaign.
7. The references to treatment standards in St Gabriel SLA article 2 are good and should be include in the model format.
8. The terms “fees” should be used instead of “costs”, since the fees should be less than the costs in most, if not all, cases.
9. If a standard fee schedule is used (as recommended elsewhere in this report) it would be better to state that the fee for each service represents the agreed % (e.g. 75%) of the cost.
10. The should state what will happen if the DHO provides free drugs or supplies that are included in the cost of the services provided under the SLA (the model only states in 2.4 that the parties will discuss this).
11. The St Gabriel SLA states in 3.3 that payment will be made even when the invoices exceed the budget ceiling and that the agreement will be revised afterwards. This does not follow the model and seems to represent too much of an open-ended commitment by the DHO. However, see below on the broader issue of restricting patient numbers.
12. The St Gabriel SLA states in 3.5 that the “fees” will include a proportion of indirect costs and monitoring and evaluation but does not state how these will be calculated or included.
13. The articles dealing with sources of funds for the DHO (2.6 and 2.7 in the model SLA) are not strictly necessary in the SLA since they describe aspects that are internal to the DHO.
14. Where the need to improve buildings and equipment is identified, the SLA should include a financial commitment of one or both parties to pay such improvements.
15. Where additional staffing is required to fulfill the terms of the SLA, a commitment by the DHO to provide the required numbers of each type of staff should be included in the SLA.
16. The SLA should include an estimate of the number of additional patients that it has the capacity to see – both from the beds, space and staffing perspective – and this should be shown as the maximum number of patients that can be covered under the SLA unless additional resources are provided.
17. The reporting requirements should be stated precisely and should be standard for all facilities (too vague in Article 5.1 of the St Gabriel SLA).
18. The SLA should not have a requirement to provide information on how the SLA funds have been spent (CHAM model 4.1). Since these funds are merged with other funding it is not practical for the hospital to report separately on the use of these funds.
19. 6 persons is probably a maximum for a steering committee, other persons may participate but need not be committee members.
20. Article 6.3 in the St Gabriel SLA should probably be removed since these travel costs would normally be borne by the hospital.

Management Sciences for Health Page 19 22 January, 2007
21. The article on supervision should specifically include a review of the service statistics relating to the SLA.
22. The article on the reporting of conflicts should state the time period for reporting – e.g., within one week.
23. The article on arbitration should set a time limit for the termination of arbitration. 24. The termination clause is probably a bit too strict given the open-endedness of key
aspects of the SLA and the uncertainty about the impact on hospital services and finances. The notice term of 90 days notice may be too long and the requirement that arbitration steps be exhausted is problematic in that no time limit is set for arbitration. In addition this clause cannot refer to itself (“Articles 10-11”).
25. The SLA needs to describe how fees are to be charged where two or more interventions are provided for the same patient at the same time. For example, are the two fees to be combined (as they are being done at Nkhoma)?
26. The Nkhoma SLA states that the hospital remains liable for the salaries and leave allowances of staff working on the maternal and neonatal wards and the delivery suites. The SLA should specify if these are in addition to staff paid by the MOH.
Whilst it appears important from a financial perspective to set a budget limit on SLA payments to facilities it is not clear how the number of poor patients who receive EHP services can be limited in practice. For example, if 100 patients are covered under an SLA what will happen to the 101st? She cannot be refused treatment and presumably cannot be charged the user fee – especially if it has been announced publicly that these services are now free. However, if she is treated without reimbursement the hospital will have to bear the full cost. It is important to discuss this and find a solution.16 8. Planning, monitoring and evaluating the implementation of service level agreements CHAM hospital services and the expected impact of the SLAs should be taken into account in the District Implementation Plans – both from the financial and service perspectives. The capital needs of CHAM facilities with SLAs should also be included the District Capital Investment Plans. The roll out of the SLAs should be closely monitored by the MOH and CHAM and should be evaluated after the first year of implementation (perhaps around the middle of calendar year 2007) and after each subsequent year17. This evaluation should include a review of standard costs and fees. The expansion of the SLAs to cover other EHP services should not take place until the first evaluation has been completed and should be based on a detailed plan and analysis of expected impact. The monitoring should include the impact of the SLAs on the district utilization and on the district and national MOH budgets. CHAM also needs to monitor and evaluate the impact of the 16 It should be noted that CHAM Management is not in favour of putting a limit to the budget as regards to the number of patients. It recommends that targets be estimated and evaluated after three months after which Government should reimburse CHAM facilities according to the number of interventions performed on patients. 17 It should be noted that CHAM Management feels that it requires additional financial support from the Government for monitoring and supervising the SLA implementation and suggest that SWAP funds be used.

Management Sciences for Health Page 20 22 January, 2007
SLAs on its members – covering the financial, service, staffing, quality of care and sustainability aspects. The following service delivery and financial indicators should be used to monitor the SLAs. These should be standard across all CHAM facilities so that data can be aggregated and compared. The service delivery data should be the same as those used in the MOH DHIS so that data can be aggregated and compared. The Service Agreement Monitoring and Evaluation Form developed by CHAM requires the following monthly data:
1. Total number of outpatients 2. Total number of inpatients (adms? 3. New ANC patients 4. Normal deliveries 5. PPH patients 6. Eclampsia patients 7. Caesarian Sections 8. Vacuum extractions 9. Severe anaemia 10. Puerperal sepsis 11. Newborn complications 12. Abortion complications 13. Syphilis in pregnancy 14. Total expenditure 15. Total invoiced to DHO 16. Value and quantity of free drugs from DHO 17. Numbers of staff by discipline 18. Number of delivery and post-natal beds 19. Number of referrals received 20. Number of referrals sent 21. Number of miles run by ambulance for referrals 22. Number of supervisory visits made to TBAs 23. Number of supervisory visits made by DHO, ZHSO and CHAM 24. The form also calls for narrative reports on stock outs of essential drugs and supplies and
equipment breakdowns. The following modifications are recommended.
1. Clarify if the total number of outpatients is visits or services (some outpatients may receive more than one service on a visit).
2. Clarify if the figures required for inpatients are admissions, discharges or bed days. 3. Clarify that the figures required for the services covered by the SLA (e.g., normal
deliveries, PPH) are the numbers of services provided. This may be more that the number of patients seen as some may receive more than one service. These should be detailed and summarized on each invoice.
4. Clarify that the free drugs received from the DHO only relate to SLA services.

Management Sciences for Health Page 21 22 January, 2007
5. Add the total number of patients (excluding ANC) seen under the SLA agreement – this will show how many of the patients on average receive more than one service.
6. Add a breakdown to show how many of the patients were referred and how many came in without referral.
7. Add the numbers of patients and services for the services covered under the SLA but for patients who are not covered – i.e. who pay private fees or who are above the limit covered by the SLA.
8. Add the total number of bed days and the bed occupancy ration. 9. Add the revenue received under the SLA and the user fee revenue received from other
sources. 10. Add the amount owed by the DHO at the end of the reported month for the SLA invoices
submitted to date. It was agreed that this consultant would not make recommendations on quality of care indicators since they are outside his are expertise. The SLAs represent a very important initiative in terms of increasing access of the poor to MNH services. Given that there has been no real piloting and that the impact of the SLAs will differ across facilities and across districts it is very important that the program be closely monitored and evaluated. This will assist greatly in predicting the impact of the expansion of the SLAs to other EHP services. A good time to do this would probably be early in calendar year 2007 when several SLAs will have been in operation for a few months. In addition to comparisons of the above monitoring data, the evaluation should include a review of the impact on the utilization of MOH services and of the impact on the finances of the facilities and the districts.
9. Cost aspect of indicators It will be important to track the costs of the services covered under the SLAs since increases in those costs will affect the ability of the CHAM members or the MOH to fund services, depending on which of them has to pick up the additional costs. It is recommended that the standard costing be reviewed and updated each year and that fees and budgets and service targets be adjusted accordingly. 10. CHAM break-even model for MNH services If some of the patients covered under an SLA would have previously attended the hospital and paid user fees for those services and the SLA fees are more than the user fees, the hospital will receive more revenue by entering into the SLA. The amount of additional revenue will be the difference between the SLA fee and the user fee multiplied by the number of SLA patients that would otherwise have paid the user fees. These SLA patients are substitutes for existing patients and do not represent an increase in the total number of patients seen - so the costs do not increase. The hospital is therefore better off from these patients since the costs stay the same but the revenue increases. Note that the number of patients that have shifted from user fee to SLA fee is best calculated by taking an average of the reduction in number of user fee patients for those services. This is the

Management Sciences for Health Page 22 22 January, 2007
number for the period under the SLA compared with the same length of period before the SLA. It should in theory be all those patients except for any that are electing to have “private” services. If, however, the hospital sees additional patients as a result of the SLA, the hospital will incur additional costs and will not receive full reimbursement for those costs since the SLA fees are less than the costs. The hospital will therefore be worse off from these patients since the costs increase but the revenues do not increase by as much. The additional net total cost for the hospital on these patients will be the difference between the total direct cost less the SLA fee for each patient multiplied by the number of patients. To be more realistic the additional indirect costs incurred as result of treating these extra patients should be included. The number of new patients is the total number of SLA patients less the number that shifted from user fee patients. From the hospital’s financial perspective the additional number of patients that it can see under an SLA is calculated by dividing the total extra revenue for existing patients by the extra net cost incurred for each new patient. It should be noted that in practice these calculations have to be made separately for each intervention since the user fees, SLA fees and costs vary for each intervention. A simple spreadsheet has been prepared and sent separately to the CHAM Secretariat and the MOH. A printed version with dummy figures can be found in Annex 7. 11. CHAM member financial statements
To assess indirect costs and sustainability the financial statements were reviewed for one of the three hospitals. The review indicates that they may not be showing designated funds (generally known as restricted funds) correctly in their financial statements or recording them properly in their accounting records. The financial statements for one hospital for calendar year 2005, for example, show designated funds of MK 22 million received and MK 11 million expended. If, however, the use of any of these designated funds is restricted by a donor, both the amounts received and spent under the donor agreement should be shown in a separate section of the financial statements, and not included with general income and expenditure. A balance of unspent funds under such an agreement is either waiting to be spent or to be returned to the donor and in either case the balance should be shown as a liability in the financial statements until it is paid out. At the end of an agreement the donor may allow an unspent balance to be released into general funds, and in this case the balance can be taken into the general funds part of the financial statements.
In the above example, the designated income received was MK 11 million more than the amount expended and the inclusion of this amount in the general financial statements accounts for almost all the surplus of MK 13 million shown there. The MK 11 million “excess” designated funds included under general funds is the reason for most of the surplus of MK 13 million shown. If all of those designated funds are restricted then that MK 11 million should not be included there and the surplus would be only MK 2 million.

Management Sciences for Health Page 23 22 January, 2007
Having an accurate assessment of the surplus or deficit is extremely important when it comes to judging the financial performance and health of the hospital and estimating the likely financial impact of the SLA. It is recommended that CHAM work with all its members to review the way in which designated funds are recorded and to change the accounting and reporting systems if necessary.
12. Per capita EHP cost
The EHP model shows a full cost per capita in 2002 of US$17.53 (Table 8). This appears to be derived from a total $206 million divided by an estimated population of just under 12 million people. This figure was calculated using two different methodologies. The direct cost component was calculated using a standard cost per intervention multiplied by the estimated number of people that require the service (population times incidence rates). The indirect and annualized development costs components were calculated by using a standard cost per facility and multiplying it by the number of MOH facilities in the country (27 in the case of hospitals). This method appears to assume that the number of MOH facilities is sufficient to cover the whole population. If the rationale behind the SLAs is that CHAM facilities need to be included in the health system because MOH facilities are not sufficient to cover the whole population then it may be that the EHP cost is too low. Since the EHP costs were as a basis for determining the funding needs for the SWAP it may mean that the funding needed for the SLAs is inadequate18. It is recommended that the EHP costs be reviewed to see if the SWAP funding is sufficient for the SLA programme.
Table 8. EHP Costs
HEALTH TOTAL PERCOMMUNITY CENTRES HOSPITAL RECURRENT CAPITA
Direct costs (service unit cost times # services) 9,878,330 14,507,239 58,399,112 82,784,681 7.05Indirect costs (facility cost times # facilities) 27,044,449 20,018,659 60,029,206 107,092,314 9.11Total 36,922,779 34,525,898 118,428,318 189,876,995 16.16Annualized development (facility cost times # facilities) 752,115 8,341,849 7,017,733 16,111,696 1.37Total 37,674,894 42,867,747 125,446,051 205,988,691 17.53Per Capita 3.21 3.65 10.68 17.53
18 This figure of US$17.5 was used in the SWAP Programme of Work (page 41) and was updated in that document to US$22 per capita by including ARVs, DHMT costs, operational costs for Zonal Offices, and the Health Services Commission.

Management Sciences for Health Page 24 22 January, 2007
Annex 1. Tasks and deliverables from Scope of Work The tasks to be undertaken per SOW are to19:
a. Analyze the 2002 Essential Health Package (EHP) cost model of the Ministry of Health (MOH) and review any related documents;
b. Analyze the 2006 MNH cost model of CHAM; c. Review the cost estimates for the Maternal and Newborn Health (MNH)
component of the EHP, including a proportion of the indirect costs, for two facility levels – the facility level that provides Basic Emergency Obstetric Care and the facility level that provides Comprehensive Emergency Obstetric Care;
d. Develop a cost model format on MS Excel to allow for determination of the break-even point for Christian Health Association of Malawi (CHAM) facilities20.
e. Give advice on affordable and sustainable flat intervention fees for the MNH component of the EHP, based on the costs of those services as determined above;
f. Give advice on indicators for the monitoring and evaluation of implementation of the service level agreements;
g. Review and advise on existing and proposed service level agreements. After the study started it was agreed that the work would be focused on hospital level services since they are more complex and will have a greater impact on cost, at least in the short term. Health centre costs and fees were, therefore, not covered in the study, although the costs of some of the hospital services can be easily modified to produce estimates of health centre costs.
The deliverables of this study are as follows: a. A report which includes:
i. Review of the existing MOH and CHAM cost models, ii. Review of the estimated costs for MNH services,
iii. Recommendations on fee levels for those services, iv. Recommendations on relevant aspects of the format of service level
agreements, and v. Recommendations on indicators for monitoring the implementation of the
service level agreements. vi. Cost aspect of indicators
vii. review report on costing MNH services; b. An MS Excel model for calculating the break-even point at facility level.
19 A secondary objective included in the original Scope of Work (SOW) of assisting in the negotiation of appropriate fee levels for these services with the MOH was removed by the MOH and CHAM representatives per meeting held on 3rd September 2006. 20 MNH services only per Dr Meis.

Management Sciences for Health Page 25 22 January, 2007
Annex 2. Discussions were held with the following persons: MOH Dr Anne Phoya, Head of SWAp Secretariat and PPP TWG Core member Dr Haldon Njikho, SWAp Secretariat and PPP TWG Core member Dr Michael O’Caroll, MOH Senior Technical Advisor Dr Ed Kataika, MOH Planning Department Mr Julius Malewezi, MOH Reproductive Health Unit Mrs Fanny Kachale, MOH Reproductive Health Unit Dr Paul Dielemans, Technical Advisor - MOH Reproductive Health Unit Ms Lena van der Hoeven, Technical Advisor - MOH Reproductive Health Unit Dr Paul Sikosana, EHP/SWAp Technical Officer Dr Douglas Lungu, MOH Deputy Director (Clinical), Health & Tech. Services Mrs Kamfosi, Dowa DHO Dr. Alice Maida, Lilongwe DHO Ms Trish Araru, Technical Advisor Dr. Martias Joshua, Zonal Supervisor Mr Aaron Sosola, Acting Director – Central Medical Stores Mr Mike Banda, Central Medical Stores CHAM Mr Francis Gondwe, Deputy Executive Director, Mr Thomas Dokotala, Financial Management Advisor, Mr. Mabvuto Mndau, HMIS/M&E Dr Max Meis, Health Advisor & PPP TWG Core member Nkhoma Hospital Dr Marco Linden, Medical Director, Mrs Agnes Nyanda, Accountant Madisi Mission Hospital Dr. Chingwanda, Principal Medical Officer Mr. Kuyera, Hospital Administrator Hospital Franciso Palau (Mtengo wa Nthenga Health Center) Sr. Ligia, In-charge Mrs. Anne Mwanza, Community Nurse St Gabriels Dr. Athanase Kiromera, Hospital Director Mrs Ellufy Mthawanji, Accountant Mr Roy Denja, Administrator USAID Mrs Catherine Chiphazi, Activities Manager, Ms Alyson Cameron, HPN head

Management Sciences for Health Page 26 22 January, 2007
MSH Dr Rudi Thetard, COP Mr Njuru Nganga, Operations & Finance Manager Ms Maureen Kamanga, Administration Manager Mr Maxwell Moyo, HMIS/M&E Specialist

Management Sciences for Health Page 27 22 January, 2007
Annex 3. Detailed Review of Cost Models
1. MOH model
The MOH model is the EHP Cost Model which was developed in 2002. The direct cost component of the model lists the treatment lines under each intervention. These treatment lines cover drugs, supplies, bed days and emergency transport. For each treatment line it shows a description the number of treatment units and the percentage of patients receiving this treatment at each level of care (community, health centre and hospital). It then shows the number of treatments (eg doses), the number of times per day and the number of days per case. These are used to estimate the total number of treatment units per case. These figures are multiplied by the unit cost per treatment to arrive at a cost per treatment line. The cost per treatment line figure is then multiplied by the percentage of patients receiving the treatment and the resulting costs are entered into a column for each level of care, as appropriate. These costs are added up to arrive at the total cost per intervention. According to the model the unit costs per treatment are mostly take from the CMS price list but a few are described as “guesses”. The treatment lines appear to follow the intervention details set out in the Malawi Essential Health Package document - Annex 1. It is important to note that equipment and other costs are not included in the above direct costs, but are included as indirect costs under the facilities section of the model. The construction of the model and formulae are logical and do not appear to have errors. Inconsistencies in prices are avoided by using a look-up table for prices of drugs and medical supplies. The use of average prices is a good approach but will result in under-reimbursement to hospitals that perform sub-interventions (eg caesarian sections) on a higher proportion of patients than the percentage included in the average price.
CHAM member cost models. Several CHAM facilities have developed their own cost models and used them in negotiations with the MOH. A selection of these models were reviewed; specifically the ones for Nkhoma Hospital, St Gabriel’s Hospital and St Luke’s Hospital. The Nkhoma Hospital model only appears to cover hospital-level services. It has treatment lines for each intervention. Each line has a description, the number of treatments (doses), the number of times per day and the number of days per case. These are multiplied together to arrive at a total number of treatments per line. This is then multiplied by the unit cost of the treatment to arrive at the total cost per treatment line. These costs are added up to arrive at

Management Sciences for Health Page 28 22 January, 2007
the total cost per intervention. Sub-interventions, such as a caesarian section, are shown as a separate intervention with a separate costing. The model is not complete or consistent. For example, magnesium is shown under Eclampsia but is not costed. Also blood is priced at $10 per unit under severe anaemia but at $15 per unit under sepsis. The formulae, however, appear to be correct from a sample review, although the ranges could be set broader to reduce the risk of excluding a new treatment line. The St Gabriel’s Hospital model also only covers hospital-level services. It is less detailed than the Nkhoma model in that is only has the number of units, the cost per unit and the total cost for each treatment line. The Nkhoma model has the number of treatments (doses), the number of times per day and the number of days per case, which are multiplied to get the total number of units. The St Gabriel,s model also provides less information on the description of the treatment – such as the dosage. The St Gabriel’s model does not use formulae in all cases (eg Eclampsia cell D15 and D66) and has errors in some of the line totals (eg PPH cell D32). Also the formula ranges are not set up in a way that will reduce the risk of error (eg Normal Delivery cell D36). The prices used are not consitent, for example surgical gloves are priced at $0.24 per pair under Normal Delivery and $0.31 per pair under Eclampsia. There also appear to be uncosted treatment lines, such as accommodation under Eclampsia. The costs produced by the model in its current state may therefore not be reliable.
2. Comparison of EHP and CHAM models
a. Number of treatment lines
The St Gabriel’s model tends to have the most treatment lines per intervention and Nkhoma the least, with the EHP in the middle. For a normal delivery, for example, St Gabriel’s has 19 treatment lines, Nkhoma has 9 and the EHP has 13. St Gabriel’s includes, for example, HIV and syphilis tests and surgical gloves – none of which are included in the EHP. On the other hand the EHP includes Tetracycline eye ointment, which is not in the St Gabriel’s model. The Nkhoma model does not include lines such as Vitamin A, sanitary pads, umbilical tape and a mucous extractor, which are in the EHP model. In some cases the EHP model appears to have more treatment lines that it actually does because it includes community and health centre levels as well as the hospital level. For some interventions it shows a treatment line for the health centre and repeats it for the hospital. For eclampsia, for example the EHP has 4 treatment lines for the health centre level and these are repeated lower down under the hospital level. For MNH services the community part of the model is only used for condoms and oral contraceptives. This does not happen in the Nkhoma or St Gabriel models, which do not show different levels of care under each intervention.

Management Sciences for Health Page 29 22 January, 2007
The EHP model also appears to have more treatment lines because it includes PROCEDURES sub-interventions under each intervention, whereas the St Gabriel’s and Nkhoma models show sub-interventions separately. For example the EHP model includes lines for a caesarian section under eclampsia, whereas Nkhoma and St Gabriel’s show caesarian sections as separate interventions.
b. The handling of sub-interventions
As stated above, the EHP model includes sub-interventions under each intervention, whereas the St Gabriel’s and Nkhoma models show sub-interventions separately. The EHP model states the % of patients that receive this sub-intervention and only takes in that percentage of the cost. For example, in the treatment lines for caesarian sections the treatments are shown as received by 10% of the eclampsia patients. The full treatment cost for eclampsia is therefore the average cost of treatment, taking into account that 10% of the patients will have a caesarian section. Since the costs for a caesarian are shown separately in the Nkhoma and St Gabriel’s models, the costs for eclampsia in those models are not averages and are less. In this case the total average cost of the caesarian sections element in the EHP model is $3.04 (which is 10% of the cost of a caesarian $30.40). The cost of an average eclampsia procedure in the EHP model is therefore $3.04 more than in the other two models21. For Nkhoma, in some cases, treatment lines are included at full cost when that treatment is only likely to be used for a percentage of the patients.
c. Treatment lines for costs other than drugs or medical supplies.
Some of the treatment lines included in one or another model are not drugs and medical supply costs and are not present in all the models:
• The EHP includes an emergency transport cost of $15.15 for petrol and maintenance for all of the hospital-level interventions except a normal delivery and post-partum care (and except half the obstructed labour cases). This cost is not included under these interventions in the Nkhoma and St Gabriel’s models.
• The Nkhoma model includes a cost of $1 for ward costs (linen and cleaning materials) under some interventions and the St Gabriel’s model includes some cleaning materials under most interventions. The EHP model does not include such items.
• The St Gabriel’s model includes laboratory tests (eg HIV, syphilis, hepatitis) and also stationery costs, neither of which are not included in either of the other two models.
d. Quantities of treatments
The quantities of treatments differ among the models. The following examples have a significant impact on the costs:
• Under post-partum haemorrhage the EHP model has 3 units of blood used in 10% of cases (cost $9.00), the Nkhoma model has 2 units of blood used in all cases (cost $20.00), and the St Gabriel’s model does not include the cost of any blood.
• Under eclampsia, the St Gabriel/s model includes 72 injections of Magnesium Sulphate at $4.00 each with a total of $288.29. The Nkhoma model includes 8 injections of
21 Note that where two treatments are show as alternatives, the percentages shown for the two treatments should add to 100%.

Management Sciences for Health Page 30 22 January, 2007
Magnesium which is not costed. The EHP does not include any unless it is shown under another name..
• Under severe anaemia the EHP model includes 3.5 units of blood for all cases, the Nkhoma model includes 2 units of blood, and the St Gabriel’s model includes no blood.
• Under abortion complications the EHP model includes 42 tablets of Metronidazole 200 gm, the Nkhoma model includes 30 tablets 400gm and the St Gabriel’s model includes none.
e. Prices Prices vary significantly across the models. In the case of the EHP model this may be because the prices are for 2002 (or 2001) whereas the prices used in the other two models are presumably for 2006. Example of significant variances are as follows:
• Under severe anaemia blood is priced at $30 per unit in the EHP model but only at $10 per unit in the Nkhoma model. (
• A hospital bed / food is priced at $2.50 in the EHP model, at $1.50 in the Nkhoma model and at $1.00 in the St Gabriel’s model. In the latter two cases the hospital do not provide food.
• Paracetamol is priced at $2.64 per 1,000 in the EHP model and at 2 cents each in the Nhkosa model.

Management Sciences for Health Page 31 22 January, 2007
Annex 4 – Removal of Transport from EHP Costs
Intervention EHP Cost EHP Cost - Transport
EHP Cost less Transport
US$ US$ US$ ANC - - Normal Delivery 5.69 5.69 PPH 57.98 15.15 42.83 Eclampsia 41.77 15.15 26.62 Obstructed Labour 38.26 7.58 30.68 Severe anaemia 128.50 15.15 113.35 Sepsis 66.15 15.15 51.00 Newborn Complications 69.69 15.15 54.54 Abortion Complications 114.11 15.15 98.96

Management Sciences for Health Page 32 22 January, 2007
Annex 5 – Comparison of Intervention Costs for the EHP and CHAM Members in US$
Intervention
EHP Cost less Transport
Nkhoma Cost
St Gabriel's Cost
St Lukes Cost
US$ US$ US$ US$ ANC - 7.83 0.85
Normal Delivery 5.69 8.17 9.63 5.28
PPH 42.83 49.74
21.73 25.84
Eclampsia 26.62 24.97
344.28 41.09
Obstructed Labour 30.68 36.86
51.71 0.00
Severe anaemia 113.35 25.02
26.26 24.14
Sepsis 51.00 58.71
71.89 29.84
Newborn Complications 54.54 22.65
95.69
Abortion Complications 98.96 28.05
41.97 10.90
Caesarial section 30.22
74.06 33.24Dilation & Curetage 11.67
Management Sciences for Health Page 33 22 January, 2007
Annex 6. Documents used
• A Joint Programme of Work for A Health Sector Wide Approach (SWAp) (2005-2010), Republic of Malawi, Department of Planning, MOH, Lilongwe, March 2004.
• Annex 14.5: Component by Component: Output Logframes (SWAp POW?) • Report for the Joint Mid-Year Review of the Health Sector, 2005-2006, MOH,
Lilongwe, 4-6 April 2006 • SWAp Annual Review: PPP Milestones. June 2006. • Malawi National Health Accounts (NHA) 2002-2004 with Sub-Accounts for
HIV/AIDS, Reproductive and Child Health. DRAFT. Ministry of Health • Malawi: Human Resources for Health Sector Strategic Plan 2003 to 2013,
JANUARY 2003, P.Hornby and S.Ozcan • Health. August 2006. • The Malawi Essential Health Package, Annex 1: Details of Essential
Interventions, EHP Working Group, Ministry of Health and Population, Lilongwe, 2001?
• EHP Cost Model, Planning Department and EHP Design Team, MOH. 2002. MS Excel.
• Progress on PPP: Quarterly SLA Progress Report. April – June 2006 between MOh and CHAM. July 2006. (Max Meis).
• Service Agreement for the delivery of the Essential Health Service Package – model.
• Costing User Fees. Includes CHAM SLA Cost Model 2006, CMS Prices. October 2005. Max Meis.
• CMS Catalogue 2005-2006. October 2005. MS Excel. • CHAM SLA MNH Cost Ceilings. Max Meis. July 2006. MS Excel • CHAM Establishment – various. • SWAP Design Mission (May-November 2002) SWAp Implementation Plan
(January – June 2003), Final Report, Volume 1, Government of Malawi: Ministrry of Health sand Population
SERVICE AGREEMENTS St Montfort • Draft Service Agreement between Chikwawa DHO and St Montfort Hospital for
the delivery of antenatal services, management of referred maternity cases, clinical management supervision, delivery of ambulatory services, medication of trauma due to accidents and any other complications. DRAFT. July 2006
St Luke’s • Anglican Dioscese of Uppershire, Annual Report July 2005 to June 2006
(includes St Luke’s Hospital and St Martin’s Hospital).

Management Sciences for Health Page 34 22 January, 2007
• Gawanani-Mposa Budget. February 2006. MS Excel. (St Luke’s Hospital catchment areas)
• St Luke’s Hospital - Monthly Report • St Luke’s Hospital – price lists – various Nkhoma Hospital • Service Agreement between the DHO Lilongwe and Nkhoma Hospital for the
delivery of Emergency Obstetric Services, 2005-2006. • Nkhoma Service Agreement Costs. January 2006. Reyner Ter Haar, Nkhoma
Hospital. • Nkhoma Hospital – Annual Report 2005. • Service Agreement between the DHO of Machinga and Mpiri, Namandanje and
Nsanama Health Centres for the provision of Maternal Health Services, July 2006 – June 2007.
• Mpiri, Namandanje and Nsanama Health Centres - Monthly Fees Calculation and Emergency Obstetric Care checklists.
St Anne’s Health Centre • Service Delivery Agreement between the DHO of Karonga and St Anne’s Health
Centre for the Delivery of Maternal and Neonatal Health Services, July 2006 – June 2007.
• St Anne’s Health Centre: Emergency Obstetric Care Checklist, August 2006. Salima • Service Agreement between the DHO of Salima and Salima Dispensaries, July
2006 – June 2007. • Chitala, Kaphatenga and Thavite Emergency Obstetric Care Checklists. Muli Bwanji Community Hospital • Service Agreement between the DHO Mangochi and Muli Bwanji Community
Hospital for Maternal and Neonatal Health Services, July 2006 – June 2007. • Muli Bwanji Ceiling • Muli Bwanji – Monthly Fee. • Muli Bwangi Emergency Obstetric Care checklist. • Service Agreement Monitoring and Evaluation Form. Muli-Bwange Community
Hospital. Blank. MulaNje Mission Hospital • Service Agreement between the DHO Mulanje and Mulanje Mission Hospital for
the provision of Maternal Health and Referral Services, July 2006 – June 2007. • MulaNje Mission Hospital – Equipment Requirements. • MulaNje Mission Hospital – Emergency Obstetric Care checklist. • MulaNje Mission Hospital - Costing

Management Sciences for Health Page 35 22 January, 2007
St Gabriel’s Hospital • Draft Service Agreement between DHOs of Lilongwe and Mchinji and St
Gabriel’s Hospital for Maternal and Neonatal Health Services, September 2006 – June 2007.
• St Gabriel’s Hospital DHO Costing, June 2006 and later revised document • St Gabriel’s Hospital. Annual Report 2005.

Annex 7. Break even model with dummy figures Christian Health Association of MalawiHospital cost/revenue model for maternal and newborn health interventionsModel developed by David Collins of Management Sciences for Health. Contact [email protected], 2007. Rights reserved. Credit must be given to the author when results from this model are published.
A B C D E F G H I J K L MPre-SLA Post SLA SLA Pre-SLA Pre-SLA Pre-SLA Post SLA Post SLA Post SLA
quantity of quantity of Hospital User Hospital Cost costs user fee costs costs SLA fee costs services with services with Cost Fee SLA rate Recovery revenue recovered / revenue recovered /
user fees SLA fees % (not recovered) (not recovered)(F / D) (B x D) (B x E) (I - H) (C x D) (C x F) (L - K)
Average increase in services 166%Normal Delivery 120 319 1,144 500 894 78% 137,256 60,000 (77,256) 364,872 285,106 (79,766) PPH 2 5 6,964 1,000 3,004 43% 13,927 2,000 (11,927) 34,818 15,019 (19,799) Eclampsia 2 5 3,496 1,000 3,646 104% 6,992 2,000 (4,992) 17,479 18,231 752 Obstructed Labour 2 5 5,160 1,000 1,081 21% 10,321 2,000 (8,321) 25,802 5,406 (20,396) Severe anaemia 8 21 3,503 1,000 1,445 41% 28,022 8,000 (20,022) 73,559 30,345 (43,214) Sepsis 4 11 8,219 1,000 3,981 48% 32,878 4,000 (28,878) 90,413 43,794 (46,620) Newborn Complications 2 5 3,171 1,000 4,713 149% 6,342 2,000 (4,342) 15,855 23,563 7,708 Abortion Complications 10 27 3,927 1,000 2,738 70% 39,270 10,000 (29,270) 106,029 73,913 (32,117) Laparotomy / Caesarian Section 22 59 4,231 1,000 3,778 89% 93,078 22,000 (71,078) 249,617 222,873 (26,745) D&C 28 74 1,634 1,000 1,459 89% 45,746 28,000 (17,746) 120,901 107,948 (12,954) TOTAL 200 531 413,832 140,000 (273,832) 1,099,346 826,196 (273,150) Average cost/price per intervention 2,069 700 2,070 1,556 Average cost recovery rate 34% 75%Assumed % of patients that pay user fees 100%
NOTESFigures can only be entered in the yellow cells. Figures in the other cells are calculated automatically and these cells cannot be accessed without a password figures cannot be entered in these cells.The other cells are protected from accidental changes. The password to protect and unprotect the spreadsheet is MSH.To calculate the total number of patients that can be covered under the SLA, enter the desired rates in Column F and adjust the Post SLA quantity for each service in Column C until the Total figure in Column M is close to the Total in Column J. To calculate how much the SLA fees need to be to cover a given number of patients, enter the desired numbers of patients in column C and adjust the individual SLA fee levels in column F.The cost recovery percentage for each service is automatically shown in Column G and the total cost recovery percentage for the overall package of services is shown at the bottom of column M.The SLA rate for each service can be adjusted so that a desired percentage of cost recovery is achieved for each service and for the overall package of services..The model assumes that all costs are variable (eg drugs and tests) and does not take into account fixed costs such as equipment, electricity or staff.
This model was developed with support provided by the Malawi Reducing Child Morbidity /Strengthening Health Systems Project, funded by the U.S. Agency for International Development under award number 690-A-00-03-00170-00.