childhood drowning: morbidity and mortality from a...
TRANSCRIPT
i
Childhood drowning:
Morbidity and mortality from a Johannesburg
Paediatric ICU, 2003 to 2013
Tamsen Peta Edwards
A research report submitted to the Faculty of Health Sciences, University of the
Witwatersrand, Johannesburg, in partial fulfilment of the requirements for the degree of
Masters of Science in Medicine (Child Neurodevelopment)
Supervisor: Associate Professor Joanne Potterton
PhD Physiotherapy
Physiotherapy Department, Therapeutic Sciences
University of Witwatersrand
ii
Abstract
Drowning is a worldwide significant but preventable public health problem. South
Africa has one of the highest rates in the world of unintentional drowning mortality in
the under five year age group. The aim of this study was to describe the population
of patients admitted to a Johannesburg PICU with the diagnosis of drowning and to
investigate potential prognostic factors recorded within the first 12 hours after
admission. A retrospective record review of all the children between zero and 14
years admitted to PICU between January 2003 and December 2013, with a
diagnosis of “drowning” or “near-drowning” was conducted. Of the 215 children
admitted into the unit in the 11 year period, 11 did not meet inclusion criteria.
Seventy-two percent of the population were male and the mean age was two years
and seven months, with the majority of patients under the age of three years
(76.5%). There were 71.6% discharged with a good neurological outcome while
10.3% died in hospital and 24% were classified as having a poor outcome with
neurological sequelae. These results, similar to those found in previous hospital
based studies, showed that more boys are likely to drown than girls and that the
largest number of victims fall in the one to four year age group. Univariate analysis
found 15 physiological variables (all recorded in the first 12 hours after admission) to
be significantly associated with outcome. When a forward stepwise multivariate
discriminant analysis was used six variables were found to be significant predictors
of outcome, GCS (≤6) and sodium (>148mmol/L) having the strongest association,
but no one factor was found to accurately predict outcome. It is therefore
recommended that every patient who has drowned be treated aggressively, no
matter their presentation or history.
iii
Acknowledgements
I wish to acknowledge the help and support of the following people, without whom,
this report would not have been possible.
Associate Professor Joanne Potterton: for advice, guidance and supervision
throughout the project
Dr Liezel Korf: for statistics support and guidance
Dr Miles Bartlett: for allowing access to his PICUE database
Natasha Bartlett: for facilitating the data collection
The hospital’s research group: for permission to conduct the study
My family for their unfailing support and positivity:
o Graham and Janine Edwards
o Christopher Swanepoel
iv
Declaration
I, Tamsen Peta Edwards, declare that this research report is my own unaided work
except for the help given by the persons listed under the acknowledgements. It is
being submitted in partial fulfilment of the requirements of the degree of Master of
Science in Medicine (Child Neurodevelopment option) at the University of the
Witwatersrand.
It has not been submitted before for any other degree or examination in any other
university.
Signed on this 28th day of September, 2015, in Johannesburg,
T.P. Edwards
v
List of Abbreviations
ARDS Acute Respiratory Distress Syndrome
ATP Adenosine Triphosphate
CPP Cerebral perfusion pressure
CPR Cardiopulmonary resuscitation
CT Computed tomography
ER Emergency room
GCS Glasgow Coma Scale
Hb Haemoglobin
HIE Hypoxic ischaemic encephalopathy
ICP Intracranial pressure
PICU Paediatric intensive care unit
PICUE Paediatic Intensive Care Unit Evalutator
pm Per minute
POPC Pediatric Overall Performance Category
PRISM Pediatric Risk of Mortality Score
RCCH Red Cross Children’s Hospital
TBI Traumatic brain injury
WHO World Health Organisation
WBC White blood cells

vi
Table of Contents
Abstract ii
Acknowledgements iii
Declaration iv
List of Abbreviations v
Table of Contents vi
List of Figures viii
List of Tables ix
Chapter 1: INTRODUCTION 1
1.1 Study Aims 3
1.2 Study Objectives 3
1.3 Motivation for and significance of the study 4
Chapter 2: LITERATURE REVIEW 6
2.1 Definition 6
2.2 Epidemiology and aetiology of drowning 7
2.3 Pathophysiology 2.3.1 Pulmonary 2.3.2 Neurological 2.3.3 Cardiovascular 2.3.4 Acid-base balance, fluids and electrolytes 2.3.5 Haematological 2.3.6 Temperature 2.3.7 Other
8 8 9
10 11 12 13 13
2.4 Management 2.4.1 At the scene 2.4.2 At the Emergency Room (ER)/Paediatric Intensive Care Unit (PICU)
14 14 14
2.5 Outcome 2.5.1 Predictors of outcome 2.5.2 Long-term outcome
16 17 25
2.6 Cost and quality of life post drowning 28
2.7 Drowning prevention 29
2.8 Conclusion 29
Chapter 3: METHODOLOGY 31
3.1 Location and site description 31
3.2 Study design 31
3.3 Ethical considerations 31
3.4 Cases 32
3.5 PICUE data and definitions 33
3.6 Procedure 35
3.7 Data and statistical analysis 35

vii
Chapter 4: RESULTS 37
4.1 Descriptive statistics 39
4.2 Season/Time of year 44
4.3 Neurological 45
4.4 Acid-Base/Blood gases 46
4.5 Chemistry/Haematology 47
4.6 Cardio-respiratory 50
4.7 Outcome comparison: first versus second half of study 52
4.8 Summary of univariate analysis 53
4.9 Multivariate analysis 54
4.10 Conclusion 56
Chapter 5: DISCUSSION 57
5.1 Population description 57
5.2 Age 58
5.3 Sex 59
5.4 Outcome 60
5.5 Predictors of outcome 61
5.6 Study limitations and future research opportunities 69
Chapter 6: CONCLUSION 74
Chapter 7: REFERENCES 73
APENDICES: 81
Appendix A: Ethics clearance certificate 81
Appendix B: Institution’s approval of research 82
Appendix C: Unit’s intensivist’s approval of research 84
Appendix D: Data collection sheet 85
Appendix E: Turnitin Plagiarism report 86

viii
List of Figures
Figure 4.1: Flow diagram showing the total number of patients with the diagnosis of “near drowning” included and excluded in the study, with their outcomes
38
Figure 4.2: Bar graph showing the age distribution of the children admitted to the unit who drowned from 2003 to 2013, separated by gender
41
Figure 4.3: Bar graph showing the PRISM scores of the two outcome groups admitted to PICU between 2003 and 2013
44
Figure 4.4: Bar chart showing the outcome of both outcome groups and the total number of children admitted to PICU stratified by month, 2003 to 2013
45
Figure 4.5: Bar chart showing the outcome between 2003 to 2008 and 2009 to 2013
53

ix
List of Tables
Table 2.1: Table showing predictors of outcome at different locations from retrospective record review studies of paediatric drowning populations
20
Table 3.1: Table showing the physiological data stored in the PICUE programme for each patient collected in the first 12 hours of admission to PICU
33
Table 3.2: Description of Pediatric Overall Performance Category (POPC) 34
Table 4.1 Table showing the results for normality testing of the data using histogram, Q-Q plot, Skewness, Kurtosis and the Shapiro-Wilk Test for Normality (p<0.05).
38
Table 4.2: Table showing the descriptive characteristics of the 204 children admitted to PICU after drowning between the years 2003 to 2013
40
Table 4.3: Table showing the Mann-Whitney U test results for the differences between the medians between the descriptive variables of the two outcome groups
42
Table 4.4: Table showing the relative risk and Fisher’s exact two-tailed test for the descriptive variables of the two outcome groups
43
Table 4.5: Table showing the Mann-Whitney U test results of the differences between the medians of the Glasgow Coma Scale (GCS) of the two outcome groups
45
Table 4.6: Table showing the relative risk and Fisher’s exact two-tailed test for GCS scores of the two outcome groups
46
Table 4.7: Table showing the Mann-Whitney U test results of the differences between the medians of the acid-base/blood gas variables of the two outcome groups
46
Table 4.8: Table showing the relative risk and Fisher’s exact two-tailed test for the acid-base/blood gas variables of the two outcome groups
47
Table 4.9: Table showing the Mann-Whitney U test results of the differences between the medians of the chemistry and haematology variables of the two outcome groups
48
Table 4.10: Table showing the relative risk and Fisher’s exact two-tailed test for the chemistry and haematology variables of the two outcome groups
50
Table 4.11: Table showing the Mann-Whitney U results of the differences between the cardio-respiratory variables of the two outcome groups
51
Table 4.12: Table showing the relative risk and Fisher’s exact two-tailed test for the cardio-respiratory variables of the two outcome groups
52
Table 4.13: Table showing the relative risk and Fisher’s exact two-tailed test for the first six years of the study period compared to the last five years for the two outcome groups
53
Table 4.14: Summary of the variables that show significant association with poor outcome using Fisher’s Exact test (95%CI)
54
Table 4.15: Table showing the forward stepwise discriminant analysis (multivariate) summary using Wilks’ Lamba distribution
55
1
CHAPTER 1: Introduction
Drowning is defined as the “process of experiencing respiratory impairment from
submersion/immersion in liquid” and drowning outcomes should be classified as death,
morbidity, or no morbidity (Van Beeck, Branche, Spizilman, et al., 2005). Previously, terms
such as near-drowning and wet/dry/active/passive drowning were used but, in 2002, at the
World Congress in Amsterdam, Netherlands, it was recommended these be avoided to
eliminate confusion (Szpilman, Bierans, Handley, et al., 2012). Drowning is the third leading
cause of accidental injury death worldwide. In South Africa, the highest rates of drowning
occur between zero and four years of age (Donson and Van Niekerk, 2012).
Drowning is a process that begins with the victim’s airway being submerged in water (or
other liquid). Then follows breath-holding, laryngospasm, and finally aspiration of the liquid.
This results in hypercapnia and acidosis (Layon and Modell, 2009). Further pulmonary
insult includes surfactant washout, atelectasis, and shunting of blood. This causes
cardiopulmonary failure which decreases cerebral blood flow causing ischaemic injury to
the brain (Koo, Boxerman, and Murphy, 2001). Hypertension, acidosis, and hypercapnia
can increase the insult to the brain and, if the hypoxic ischaemic injury is severe, there can
be global neocortical damage (Macnab, 1995). Drowning can result in varying degrees of
neurological impairment with ten to 24 percent of children who have drowned never
recovering normal neurological functioning and, in severely affected cases, a permanent
vegetative state can occur. (DeBoer, 1997; Macnab, 1995; Habib, Tecklenburg, Webb, et
al., 1996; Pearn, et al., 1979). Drowning victims can have deficits in memory, executive
function, attention and language. Often motor function is affected and disorders such as
spasticity, dystonia, chorea and rigidity are found (Abrams, and Mubarak, 1991).
2
However, victims can be rescued at any time during the drowning process leading to
variable outcomes (Layon and Modell, 2009). Several studies have tried to determine
predictive factors of survival versus mortality so as to guide triage decisions, reduce
unnecessary interventions and guide withdrawal of support (Christensen, Jansen and
Perkin, 1997). Factors such as submersion time, cardiopulmonary resuscitation (CPR)
lasting more than 25 minutes, low Glasgow Coma scale (GCS) scores, low pH on
admission to hospital and unreactive pupils have been found to significantly correlate with
poor outcome but results have been varied with no consensus among studies (Christensen,
Jansen and Perkin, 1997; Nagel, Kibel & Beatty, 1990; Spack et al., 1997; Graf et al.,
1995). There is minimal research published on drowning populations and their outcomes in
Southern Africa and, of those studies that have been published, most have been based in
Cape Town at the Red Cross Children’s Hospital (RCCH) (Joanknecht, Argent, van Dijk, et
al., 2015).
Long-term outcome after drowning has also been poorly researched with very few studies
available (Suominen and Vahatalo, 2012). These studies suggest that drowning, even if the
child is discharged as “fully recovered”, can cause neurological sequelae, which may only
manifest later in life. When considering that drowning can cause hypoxic ischaemic injury to
the brain (diffuse damage) and that the majority of children who drown fall in the under five
year age group, long term follow-up studies are much needed in this high-risk group
(Anderson, Morse and Catroppa, 2004).
The emotional and financial suffering experienced by the families and the social and public
health costs placed on society by a child surviving drowning with a poor neurological
3
outcome is immense (Suominen& Vahatalo, 2012). Therefore the saying that “prevention is
better than cure” is most pertinent when considering drowning. The World Health
Organisation (WHO) call drowning a highly preventable public health threat and advises
that there needs to be a focussed plan of action to decrease mortality rates (WHO, 2014).
This includes community action such as barriers around swimming pools, education of
school-aged children about water safety and rescue, public awareness campaigns and
bystander CPR. The WHO also recommends effective policies and legislations be
implemented in each country, especially those in the low to middle income brackets, to help
coordinate drowning prevention efforts and to develop national water safety plans (WHO,
2014).
1.1 Study Aims
This study aims to provide a statistical description of the morbidity and mortality of the
children who have drowned and been admitted to a private hospital paediatric intensive
care unit (PICU) in Johannesburg, South Africa.
1.2 Study Objectives
To provide a statistical description of the population using the available PICU
database.
To categorise children who were admitted into the unit due to drowning into the
following two outcome groups for further analysis using the Paediatric overall
performance categories (POPC):
o Good (normal neurological functioning)
4
o Poor (neurologically impaired or dead)
To determine the mortality rate of patients admitted to the unit due to drowning
To determine if time of year when drowning occurs has an effect on outcome.
To determine if there was a significant difference in outcome results in the first five
years of study compared to the last six years
To determine if there are differences between the means or medians of each
variable recorded for each outcome group
To determine if Paediatric Risk of Mortality (PRISM) scores are significantly
associated with outcome
To determine if certain physiological variables, measured in the first 12 hours after
admission to PICU (as recorded in the available database) are associated with
outcome by univariate and multivariate analysis.
1.3 Motivation for and significance of the study
The unit’s patient data had been collected and stored on the Pediatric Intensive Care Unit
Evaluator (PICUE) database program for many years but it had not been analysed. It is
important for this data to be analysed to see the trend over the eleven years since the
drowning protocol of the unit had been implemented and to determine if any factors were
specifically associated with outcome. This unit is known to have expertise in dealing with
children who have drowned and is the private referral centre for these cases in Gauteng.
There is a scarcity of research about drowning in Southern Africa and there are very few
hospital based studies completed on South Africa’s drowning populations. These have
mainly been based in Cape Town, at the Red Cross Children’s Hospital. There has not
been any analysis completed on this particular private hospital PICU’s drowning population

5
data. As it treats a large number of victims of drowning, it is important to analyse its
populations and trends.
6
CHAPTER 2: Literature Review
2.1 Definition
The definition of drowning has varied widely over the years the subject has been
researched. “Drowning” was defined as death secondary to asphyxia due immersion in a
liquid and this could occur up to 24 hours after the event. “Near-drowning” was survival
after drowning. Terms such as “wet versus dry drowning” (to differentiate between cases
which show liquid aspiration in the lungs and those that did not) and “active versus passive
or silent drowning” (to differentiate between those victims who are seen to drown or make
some motion while drowning and those cases where the event was not witnessed or there
was no struggle) were also frequently used (Idris, Berg, Bierans, et al., 2003). “Secondary
drowning” was used to describe drowning occurring due to an unrelated event, such as a
seizure. It can also be used to describe the onset of acute respiratory distress syndrome
(ARDS) after the victim seems to have recovered from the submersion event. These
complicated and varied terms made it difficult to compare and analyse studies on the topic.
In 2002, at the World Congress of Drowning in Amsterdam, The Netherlands, it was
recommended that all these terms be avoided as to eliminate confusion and to facilitate
research (Van Beeck, Branche, Spizilman, et al., 2005; Szpilman, Bierans, Handley, et al.,
2012). The Utstein guidelines were then published that recommended drowning be defined
as the “process resulting in primary respiratory impairment from submersion/ immersion in a
liquid medium” (Idris, Berg, Bierans, et al., 2003). According to Idris, Berg, Bierans, et al.,
(2003) implicit in this definition is that the liquid/air interface present at the entrance of the
victim’s airway is what prevents the victim from inhaling air. Whatever the outcome, be it
death or survival, the victim has been involved in a drowning incident.
7
2.2 Epidemiology and aetiology of drowning
Drowning is among the ten leading causes of death in children all over the world, and is, as
such, a significant public health problem (WHO, 2014; Maconochie, 2015). Drowning is
estimated to cause around 372 000 deaths every year in all age groups. Males are more
likely to drown than females, with a ratio of 4:1 (Topjian, Berg, Bierans, et al., 2012).
According to Zuckerman and Saladino (2005), the aetiology of drowning is complex and
due to many factors such as geographical location and age but, when looking at childhood
drowning, is often due to poor supervision around the home and by bodies of water. In most
countries, drowning is one of the top three causes of accidental death in children younger
than five years of age.
In a study looking at worldwide unintentional drowning mortality, South Africa had one of
the lowest rates of adult mortality but one of the highest rates of mortality in the zero to four
years age group (Lin, Wang, Lu et al., 2014). Donson and van Niekerk (2012), used the
South African National Injury Mortality Surveillance Register data from 2001 to 2005 to
determine that drowning occurs at rates of between 1.4 to 2.7 per 100 000 people in South
Africa. In the zero to four years age group, the highest rate of drowning (seven per eight per
100 000) occurred in Johannesburg. Males had an overall drowning rate of 8.7 per 100 000
while females had a rate of 3.8 per 100 000 in this age group. A study done in Cape Town,
found that most of the children (77%) who were admitted due to drowning were under five
years old, and there were twice as many boys as girls (Kibel, Nagel, Myers, et al., 1990).
8
In the USA, most drowning incidents occur in fresh water, such as swimming pools and
rivers. In children, this can also include baths and washing buckets and drowning can occur
in water only five centimetres deep (Burford et al., 2005). Large buckets are a threat to
toddlers at the “pull-to-stand” developmental stage. They will often use buckets to pull
themselves up however, due to their high centre of gravity, they can easily fall head first
into the bucket without being able to extract themselves from it (Burford et al., 2005).
Swimming pools are the most common site of drowning in children of this age group
(Burford et al., 2005). This is true for South Africa, where children most often drowned
around the home in swimming pools, bathtubs and buckets, rather than in dams, rivers or
seas (Donson and van Niekerk, 2012). The summer months, November, December, and
January, recorded the highest number of drowning incidents due to increased time spent
outdoors and near bodies of water. This is similar to a 1985 four year retrospective study of
drowning victims in Cape Town which found that the majority of childhood drownings
occurred in swimming pools and buckets of water and the highest number of drowning
occurred over the summer holiday months (Davis and Smith, 1985).
2.3 Pathophysiology of drowning
2.3.1 Pulmonary
Pulmonary complications are normally the primary pathology in a drowning event.
Drowning is a process and occurs in a continuum (Layon and Modell, 2009). During the
initial stages of drowning, there might be struggle, breath holding, and panic (Burford et al.,
2005). However, some reports show that children may drown silently, without struggle.
Laryngospasm can be triggered with a small aspiration of fluid and in some cases, no water
is found in the lungs. After an extended period of hypoxia and as the oxygen levels drop in
9
the body but before inspiratory efforts cease, the laryngospasm relaxes, which increases
the likelihood of aspiration of water and/or gastric contents (Topjian, Berg, Bierans, et al.,
2012; Burford, Ryan and Stone, 2005; Zuckerman and Saladino, 2005).
Aspiration causes surfactant wash-out and results in impaired gaseous exchange,
atelectasis, and pulmonary oedema (Zuckerman and Saladino, 2005). Fresh water
aspiration causes surfactant destruction while salt water causes the surfactant to be
washed out by osmosis extracting fluid from the alveoli (Scott and Nelson, 2011). In poorly
ventilated areas of lung, intrapulmonary shunting can occur and can result in inadequate
oxygenation and ventilation. Aspiration can also lead bronchospasm, acute lung injury or
acute respiratory distress syndrome (ARDS) (Topjian, Berg, Bierans, et al., 2012; Burford et
al., 2005). The consequence of these events is progressive hypoxia and acidosis
(Zuckerman and Saladino, 2005). Depending on how severe these are, there may be
electrical instability and the resulting cardiac dysfunction may lead to cardiac arrest
(Zuckerman and Saladino, 2005).
2.3.2 Neurological
Prolonged hypoxia can have a severe impact on the central nervous system (Lieh-Lai,
Sarnaik and Sarnaik, 2011). The brain is sensitive to the “timing, duration, and intensity of
the hypoxaemic event” (Topjian, Berg, Bierans, et al., 2012). During the drowning process,
aspiration causes cardiopulmonary failure which decreases cerebral blood flow causing
ischaemic brain injury (Koo, Boxerman, and Murphy, 2001). The duration and severity of
the initial insult is the main determinant of outcome. However, hypertension, acidosis,
hypercapnia, and cerebral oedema can further increase the insult to the brain (Macnab,
10
1995). The most susceptible areas are usually the vascular end zones (the “watershed
areas”) as well as the hippocampus, insular cortex and basal ganglia (Topjian, Berg,
Bierans, et al., 2012). If the hypoxic ischaemic injury is severe, there can be extensive
global neocortical damage (Suominen and Vähätalo, 2012; Koo, Boxerman, and Murphy,
2001).
While the initial hypoxia can cause brain cell damage there is also a secondary apoptosis
which is the body’s complex response to the hypoxia which can cause further neuronal
death and impacting the neurological outcome of the patient (Topjian, Berg, Bierans, et al.,
2012). Therefore neurological assessment immediately after drowning may not predict the
full extent of the neurological insult, which may only be apparent months to years later.
However, neurological indicators, such as GCS scores and pupillary response, have been
found to be significantly associated with outcome in children who have drowned. On
presentation to the ER, those patients who have suffered a severed insult will show poor
neurological responses (Joanknecht, Argent, van Dijk, et al., 2015; Christensen, Jansen
and Perkin, 1997; Graf, Cummings, Quan, et al., 1995; Quan, Wentz, Gore, et al., 1990).
2.3.3 Cardiovascular
Cardiac failure is rare in successfully resuscitated drowning victims (Topjian, Berg, Bierans,
et al., 2012). However, when it does occur, cardiac dysfunction is usually as a result of
factors such as hypothermia, acidosis, and/or hypoxaemia (Buford et al., 2005). Hypoxia
causes decreasing levels of arterial blood oxygen which in turn decreases cardiac output
due to a decrease in myocardial oxygen supply resulting in myocardial ischaemia
11
(Zuckerman and Saladino, 2005). Peripheral vasoconstriction caused by the hypoxia can
further reduce the cardiac output and decrease blood pressure. If the hypoxia is not quickly
reversed, organs such as the heart, kidneys and brain are affected by the decreased blood
oxygen content and reduced cardiac output. Severe bradycardia and circulatory arrest may
result (Zuckerman and Saladino, 2005). The ventilation-perfusion mismatch of hypoxaemia
can cause ventricular tachycardia, ventricular fibrillation and even asystole. If there is a
metabolic acidosis present (which is common in drownings) there might be further
myocardial impairment (Lieh-Lai, Sarnaik and Sarnaik, 2011).
In hypoxic states (low O2 supply) such as in strenuous muscle activity (seizure) or in low tissue
perfusion states from circulatory failure, lactic acid is also produced anaerobically during
glycolysis
2.3.4 Acid-Base balance, fluids and electrolytes
Drowning causes significant respiratory and/or metabolic acidosis (Salomez and Vincent,
2004). Respiratory acidosis is due to a build-up of carbon dioxide in the blood while the
metabolic acidosis. Metabolic acidosis is caused by hypoxaemic related glycolysis where
lactic acid is produced anaerobically (Salomez and Vincent, 2004). A review of laboratory
results from 31 drowning victims showed that pH was lowered in the majority of cases,
indicating a state of hypoxic acidosis (Oehmichen, Hennig and Meissner, 2008). In a study
of 58 drowned children, Vähätalo, Lunetta, Olkkola, et al. (2014) found that those children
with a poor outcome had significantly lower levels of pH than those that survived
neurologically intact.
12
Rarely is enough water aspirated to cause any electrolyte imbalance which is only found in
about 15% of drowning cases (Burford et al., 2005; Zuckerman and Saladino, 2005).
Studies have shown that very large amounts of fresh or salt water have to be aspirated
before a fluid shift occurs which does not often happen in human submersion victims, even
in water with high salinity. A study of 31 drowning cases showed that 47.5% of those who
died had decreased potassium levels (Oehmichen, Hennig and Meissner, 2008).
Severe glucose abnormalities can result post drowning and hypothermia can decrease the
amount of insulin produced and the body’s sensitivity to it (Topjian, Berg, Bierans et al,
2013). The brain is very sensitive to changes in glucose levels when it is damaged. A study
of 58 children who had drowned showed that those who did not survive had significantly
higher blood glucose levels on arrival in ER than those who did survive (Vähätalo, Lunetta,
Olkkola, et al., 2014). Increased blood glucose concentrations after ischaemic brain injury
could result in poor neurological outcomes (Salomez and Vincent, 2004).
2.3.5 Haematological
Usually drowning does not affect haemoglobin and haemocrit values. If changes do occur,
this is may be due to significant blood loss from injury/trauma inflicted during the incident
(Burford et al., 2005). Oehmichen, Hennig and Meissner (2008) found that haemoglobin
was reduced in only 17% of drowning victims and thought that this may be due to a slight
haemolysis or haemodilution.
13
2.3.6 Temperature
Hypothermia is often found in drowning victims on presentation to the ER (Scott and
Nelson, 2011). This may be caused by submersion in icy water which causes rapid cooling
or it may be indicative of a prolonged time spent submerged in warmer water, which has
negative implications on the outcome. In those cases where hypothermia is beneficial, it
has been found to have the positive effects such as a decrease in cerebral metabolic rate,
intracranial pressure and cytotoxic oedema (Lieh-Lai, Sarnaik and Sarnaik, 2011).
Hypothermia decreases the amount of oxygen needed by the brain which will delay the
onset of cell death and slow down the rate of adenosine triphosphate (ATP) depletion
(Szpilman, Bierans, Handley, et al., 2012). The reduced activity (metabolic and electrical)
will protect the brain from further damage. Hypothermia causes peripheral vasoconstriction,
thereby preserving blood flow to central organs. However, conversely, hypothermia also
has direct effects on cardiac function which may decrease the chances of a good outcome
(Lieh-Lai, Sarnaik and Sarnaik, 2011).
2.3.7 Other
The other consequences of severe asphyxia due to drowning can include acute tubular
necrosis and disseminated intravascular coagulation (Burford, et al., 2005).
14
2.4 Management
Drowning with good neurological outcome depends on a management chain that begins at
the scene and continues through to emergency room and in-hospital care (Topjian, Berg,
Bierans, et al., 2012). However every drowning victim is unique and no one treatment fits all
so treatment and management needs to be individualised (Salomez and Vincent, 2004).
2.4.1 At the scene
According to Maconochie (2015) bystander resuscitation is the single most important
determinant of intact survival. However, the longer the resuscitation takes, the worse the
prognosis. Studies have shown that submersion time and CPR have the most significant
impact on the outcome of a drowning victim (Zuckerman and Saladino, 2005). Ambulance
services should be called to the scene as quickly as possible. Airway, breathing and
circulation should be managed so as to stabilise the patient for transport to an emergency
room equipped to manage them (Topjian, Berg, Bierans, et al., 2012). It is important to
assess if the victim may have sustained any injuries to the spine (i.e. fall from a height or a
high impact collision) before moving them (Burford et al., 2005). However, Szpilman,
Bierans, Handley, et al. (2012) suggest that only 0.5% of drowning victims have cervical
spine injuries and none of these were younger than 15 years of age.
2.4.2 At the Emergency Room (ER)/Paediatric Intensive Care Unit (PICU)
Patient presentation at the ER can vary from asymptomatic to presenting with cardiac arrest
(Zuckerman and Saladino, 2005). The patient should be assessed and any airway,
breathing, or circulation problems should be managed. Reversing the hypoxaemia by
15
restoring oxygenation and maintaining adequate ventilation is at the core of managing
drowning victims (Zuckerman and Saladino, 2005). Injuries to the spine should be assessed
and stabilised, however these are rare in children. It is important to obtain peripheral
venous access for drug administration (Szpilman, Bierans, Handley, et al., 2012).
Hypoxia, acidosis and hypothermia should be presumed to be present in all drowning
patients. As pulmonary dysfunction is the most common pathology post drowning, oxygen
levels should be closely monitored. The patient might need supplemental oxygen and
nebulisers to counteract the bronchospasm. This supplemental oxygen should be given for
two to three days while the body replenishes the surfactant. If the patient deteriorates, is
unable to maintain their airway, fatigues or if there are low GCS scores, they may require
intubation and ventilation (Szpilman, Bierans, Handley, et al., 2012). Mechanical ventilation
with positive end-expiratory point pressure is crucial to the reversal of the hypoxaemia and
preventing further damage to susceptible organs (Zuckerman and Saladino, 2005). ARDS
ventilation guidelines should be followed (Zuckerman and Saladino, 2005).
The patient’s temperature needs to be determined as soon as possible after the initial
drowning event (Topjian, Berg, Bierans, et al., 2012). There are two conflicting schools of
thought as to whether a hypothermic patient should be warmed immediately or not.
Previously, patients were aggressively warmed after drowning but recent studies have
shown that hypothermia can have a beneficial effect on neurological outcome as it reduces
the secondary neuronal cell death which usually occurs after hypoxic brain injury, although
more studies are needed to confirm this. Therapeutic hypothermia is used for brain
protection and, if used, should be instituted as soon as possible post drowning in patients at
16
risk for brain injury (Topjian, Berg, Bierans, et al., 2012). However, therapeutic hypothermia
needs a specialised unit equipped correctly and up-to-date with the latest protocols. The
2002 World Congress on Drowning supported the use of therapeutic hypothermia for 12 to
24 hours after the drowning incident to improve neurological outcome post cardiac arrest
(Moon and Long, 2002). Temperature should be maintained at between 32 and 34 degrees
Celsius and patients should be ventilated and shivering prevented pharmacologically
(Topjian, Berg, Bierans, et al., 2012). After the period of hypothermia, warming should
occur very slowly, at no more than 0.5 – 1.0°C per hour. It is important that neuro-
monitoring be used to direct management and monitor outcomes. ICP can be used as can
non-invasive neuro-monitoring techniques such as neurological examination and EEG.
2.5 Outcome
The vast majority of research conducted on the outcome after drowning are retrospective
record reviews. Drowning studies tend to be retrospective record reviews focussing on the
outcome of the child immediately on discharge from hospital. The recommended
classification of drowning outcome is death, morbidity, or no morbidity (Topjian, Berg,
Bierans, et al., 2012). The majority of patients that quickly regain consciousness usually
survive without any neurological sequelae. However, drowning can also cause death or
severe neurological impairments, with 10 - 25 % of children never recovering normal pre-
drowning neurological status (DeBoer, 1997; Habib, Tecklenburg, Webb, et al., 1996;
Macnab, 1995; Pearn, Bart and Yamaoka, 1979). However, as studies have different
inclusion criteria and different definitions of outcome, it is very difficult to compare mortality
rates from each study.
17
Survivors of drowning can have deficits in memory, attention, executive functions,
visuospatial functions and language (Pierro, Bollea, Di Rosa, et al., 2005). Spastic
quadriplegia is common and movement disorders include rigidity, dystonia, chorea, action
myoclonus, ataxia, dysarthria and dysphagia (Pierro, Bollea, Di Rosa, et al., 2005).
According to Abrams and Mubarak (1991) the abnormal posturing and spasticity in children
with significant anoxic encephalopathy secondary to drowning is extremely malignant and is
generally worse than that which occurs in cerebral palsy or traumatic brain injury. In the
most severe cases, patients can remain in a permanent vegetative state.
In South Africa, Kibel, Nagel, Myers, et al. (1990) found that 18% of children admitted to the
Red Cross Children’s Hospital (RCCH) had a poor neurological outcome and of these, 6%
were severely neurologically compromised. Spack, Gedeit, Splaingard, et al. (1997)
showed the highest mortality rate (49%) and, of those patients that survived, 18% were
neurologically impaired. The study included 81 drowning victims and logistic regression
analysis was used to determine that aggressive forms of post drowning treatment such as
hyperventilation, therapeutic hypothermia, and drug induced comas do not significantly alter
outcome.
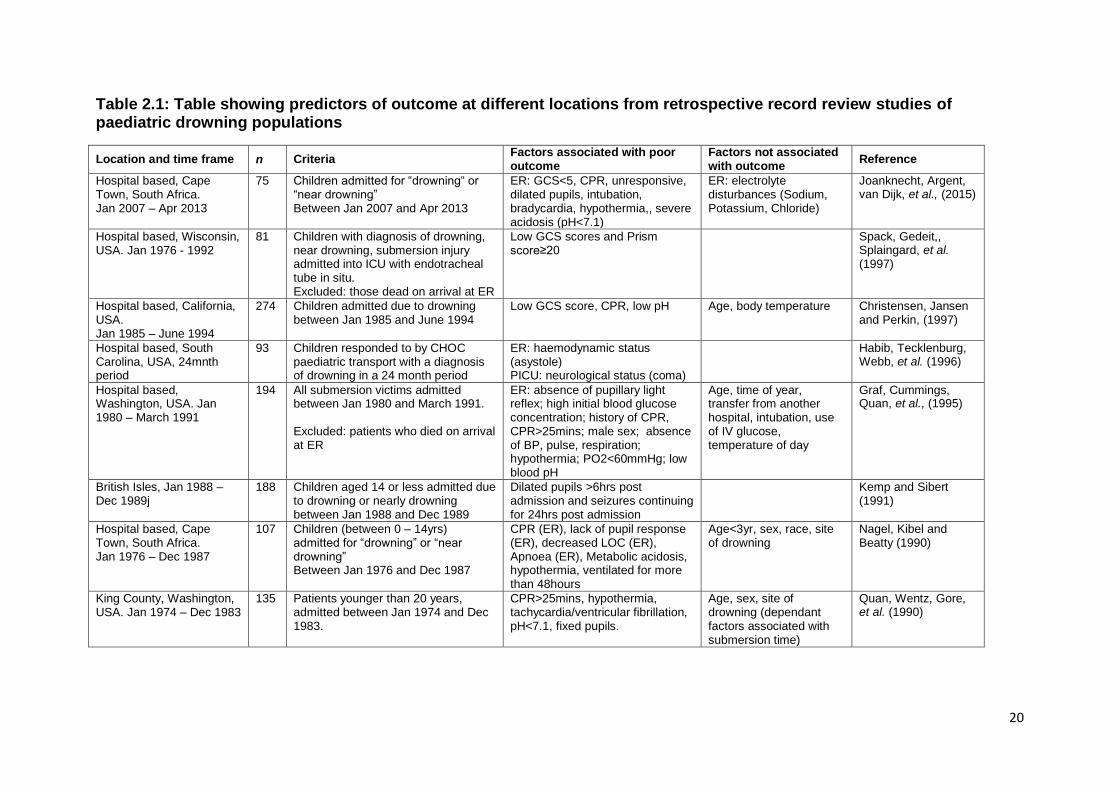
2.5.1 Predictors of outcome
Previous studies have attempted to determine predictive factors of morbidity and mortality
to help guide triage decisions, to reduce unnecessary interventions and to guide withdrawal
of supportive treatment (Christensen, Jansen and Perkin, 1997). Studies show no
consensus on which factors are most effective in this regard, as can be seen in Table 2.1.
At the scene of the drowning, submersion of less than 25 minutes and cardiopulmonary
18
resuscitation (CPR) lasting less than 25 minutes are indicators of good outcome (Burford, et
al., 2005). In the emergency room, CPR, fixed and dilated pupils and an initial pH of less
than seven are highly predictive of death or severe neurological outcome. In the ICU,
indicators of poor outcome are apnoea or decreased respiratory rate, Glasgow Coma Scale
(GCS) of three, the absence of motor activity, intracranial pressure (ICP) of more than
20mmHg (normal range between 5 – 15mmHg) and cerebral perfusion pressure (CPP) of
less than 50mmHg, and an abnormal CT scan 36 hours post event (Burford, et al., 2005;
Bell, Ellenberg and McComb, 1985). Large, unreactive pupils are indicative of hypoxic
ischaemic encephalopathy (HIE) and, in drowning patients, the absence of pupillary
response to light at 24 hours post injury is associated with poor outcome (Topjian, Berg,
Bierans, et al., 2012). Admission values of glucose, pH and blood lactate have been used
to determine outcome, with variable results. Glucose values of less than 11mmol/L are
typically associated with better outcome while high lactate and low pH tend to indicate poor
outcome (Moon and Long, 2002). Although not a study on children who have drowned, it is
interesting to note that White, Furukho, Bull, et al. (2001) analysed predictors of outcome in
severely head injured children and found that survivors had GCS of greater than eight, a
higher systolic blood pressure, higher body temperature and higher PaCO2 scores
compared to non-survivors.
The two South African studies that have looked at outcome in children after drowning were
based in the Red Cross Children’s Hospital (RCCH) in Cape Town. Both were retrospective
studies using the search criteria “drowning or near-drowning” to collect the appropriate
records. The first study was completed between January 1976 and December 1987 with
107 children between the ages of 0.4 and 13.8 years included (Kibel, Nagel, Myers, et al.,
1990). Their mortality rate was determined to be 12.1% and six out of the 107 children
19
(5.6%) were found to have neurological sequelae. Using the student’s t-test and the
Fisher’s exact test they determined that the following factors were significantly related to
outcome: fixed and dilated pupils, flaccidity or posturing, metabolic acidosis and the need
for CPR in the ER.
The more recent 2014 study was completed on children admitted to the Red Cross hospital
between January 2007 and April 2013 with a diagnosis of drowning (Joanknecht, Argent,
van Dijk, et al., 2015). They found that in the ER the need for CPR, a GCS score of less
than five, hypothermia, bradycardia, and asystole were all significantly associated with poor
outcome. The strengths of the associations were strong with significant p-values but some
of their confidence intervals were wide. The only similar finding in the previous study at
RCCH was the association between poor outcome and the need for CPR. The authors
stated that the new Utstein guidelines and changes in treatment techniques were the
reasons for study being completed. However, in the discussion, they did not review the
treatment changes nor compare the results of their study with the previous study’s results.
With 75 subjects, the cohort was smaller than the 1990 study and this small sample size
was the reason no multivariate analysis was completed. In comparison to the previous
study, mortality rate had decreased by almost one and half percent to 10.7% while the
percentage of children with neurological sequelae remained similar (5.6% in 1990
compared to 5.3% in 2014). It would have been of interest to determine what exactly had
changed in the treatment techniques which resulted in fewer children dying but had little
impact on the neurological sequelae of the patients. However, a retrospective study of
drowning victims between 1976 and 1992 showed that aggressive treatment techniques
such as continuous hypothermia, ICP monitoring, maintaining CPP above 50mmHg and
intracranial hypertension prevention did not significantly improve the outcome of patients
20
Table 2.1: Table showing predictors of outcome at different locations from retrospective record review studies of paediatric drowning populations
Location and time frame n Criteria Factors associated with poor outcome
Factors not associated with outcome
Reference
Hospital based, Cape Town, South Africa. Jan 2007 – Apr 2013
75 Children admitted for “drowning“ or “near drowning” Between Jan 2007 and Apr 2013
ER: GCS<5, CPR, unresponsive, dilated pupils, intubation, bradycardia, hypothermia,, severe acidosis (pH<7.1)
ER: electrolyte disturbances (Sodium, Potassium, Chloride)
Joanknecht, Argent, van Dijk, et al., (2015)
Hospital based, Wisconsin, USA. Jan 1976 - 1992
81 Children with diagnosis of drowning, near drowning, submersion injury admitted into ICU with endotracheal tube in situ. Excluded: those dead on arrival at ER
Low GCS scores and Prism score≥20
Spack, Gedeit,, Splaingard, et al. (1997)
Hospital based, California, USA. Jan 1985 – June 1994
274 Children admitted due to drowning between Jan 1985 and June 1994
Low GCS score, CPR, low pH Age, body temperature Christensen, Jansen and Perkin, (1997)
Hospital based, South Carolina, USA, 24mnth period
93 Children responded to by CHOC paediatric transport with a diagnosis of drowning in a 24 month period
ER: haemodynamic status (asystole) PICU: neurological status (coma)
Habib, Tecklenburg, Webb, et al. (1996)
Hospital based, Washington, USA. Jan 1980 – March 1991
194 All submersion victims admitted between Jan 1980 and March 1991. Excluded: patients who died on arrival at ER
ER: absence of pupillary light reflex; high initial blood glucose concentration; history of CPR, CPR>25mins; male sex; absence of BP, pulse, respiration; hypothermia; PO2<60mmHg; low blood pH
Age, time of year, transfer from another hospital, intubation, use of IV glucose, temperature of day
Graf, Cummings, Quan, et al., (1995)
British Isles, Jan 1988 – Dec 1989j
188 Children aged 14 or less admitted due to drowning or nearly drowning between Jan 1988 and Dec 1989
Dilated pupils >6hrs post admission and seizures continuing for 24hrs post admission
Kemp and Sibert (1991)
Hospital based, Cape Town, South Africa. Jan 1976 – Dec 1987
107 Children (between 0 – 14yrs) admitted for “drowning” or “near drowning” Between Jan 1976 and Dec 1987
CPR (ER), lack of pupil response (ER), decreased LOC (ER), Apnoea (ER), Metabolic acidosis, hypothermia, ventilated for more than 48hours
Age<3yr, sex, race, site of drowning
Nagel, Kibel and Beatty (1990)
King County, Washington, USA. Jan 1974 – Dec 1983
135 Patients younger than 20 years, admitted between Jan 1974 and Dec 1983.
CPR>25mins, hypothermia, tachycardia/ventricular fibrillation, pH<7.1, fixed pupils.
Age, sex, site of drowning (dependant factors associated with submersion time)
Quan, Wentz, Gore, et al. (1990)
21
who had drowned (Spack, Gedeit,, Splaingard, et al., 1997). Further research is
needed to determine if change in the treatment of a drowning patient yield improved
outcome results or have no effect. If changes in interventions do not have an effect
on outcome it may mean that the focus should be more on prevention than
treatment.
Kemp and Sibert (1991) analysed data from children who drowned in the British Isles
and attempted to identify factors that might predict a poor prognosis. The study
population was large (330 children) but there was no description of the statistical
methods used to determine which factors could predict outcome. The sample groups
were poorly described and defined. While their conclusions agreed with previous
studies, their results were not rigorously analysed and therefore it difficult to draw
any significant conclusions.
A more rigorous study, Kieboom, Verkade, Burgerhof, et al. (2015), determined
outcome in children admitted with cardiac arrest and hypothermia post drowning.
Their results showed that resuscitation after 30 minutes was ineffective at changing
outcome (Joanknecht, Argent, van Dijk, et al., 2015). Although the study took into
account confounding variables, it only used univariate analysis to analyses outcome.
Multivariate analysis may have increased the statistical relevance of the study as
drowning is a complex multifactorial condition. In the British Isles between 1988 and
1989, 330 children had drowned with 142 deaths (Kemp and Sibert, 1991). On
admission to hospital, those with fixed and dilated pupils six hours after admission
had the worst outcome. Most children survived neurologically intact and the study
22
showed that hypothermia had a protective effect on neurological outcome. In a case
control study over 20 years, the role of submersion duration and the temperature of
the water were evaluated with regards to outcome (Quan, Mack and Schiff, 2014).
Cold water did not have a protective affect against neurologic impairment but the
amount of time the child was estimated to have been submerged did affect outcome.
This study agreed with the findings of Suominen et al., (2001) which showed that
estimated submersion time was the best indicator of outcome while water
temperature was not.
As shown, there are conflicting reports of hypothermia being a protective or
detrimental factor to outcome after drowning in children. In those studies in which
hypothermia was protective, the areas in which the study was conducted had much
colder water temperatures, especially in winter, than South Africa does.
Johannesburg has a sub-tropical highland climate with mild winters averaging about
four degrees Celsius at night in June/July (Nagel, Kibel & Beatty, 1990). Winter days
are normally dry and sunny, while nights are cooler. Due to this, bodies of water
rarely freeze. For a child to become hypothermic in warmer water they need to be
submerged for a prolonged period of time - studies suggest that good outcome is
unlikely if submerged in waters warmer than six degrees Celsius for more than 30
minutes – and increased submersion time is associated with poor outcomes (Tipton
and Golden, 2011).
A retrospective study in Washington State showed that the two most important risk
factors for a poor outcome were submersion time greater than nine minutes and a
23
resuscitation time greater than 25 minutes (Quan, Wentz, Gore, et al., 1990). Of the
135 records reviewed, 45 children died and five had severe neurological impairment.
Graf, Cummings, Quan, et al., (1995) used logistic regression analysis to determine
the outcome of 194 children admitted to a paediatric referral hospital in Washington
due to a submersion incident. They found that the best predictors of outcome were
sex, comatose state, initial blood glucose concentration and lack of pupillary light
reflex. However, their confidence intervals were wide. Their prediction of outcome
rule had a specificity of 100 percent but this was determined from the population on
which the rule was derived. To determine if the rule is really useful, it needed to be
validated in another cohort. They were also one of the only studies that showed male
sex to be significantly related to poor outcome. In South Carolina, USA, 93 drowned
children’s records were reviewed and they showed that haemodynamic and
neurologic status on arrival to the ER were highly predictive of outcome (Habib,
Tecklenburg, Webb, et al., 1996). Those patients who were comatose and asystolic
in ER had a poor outcome (death or vegetative state).
The Pediatric Risk of Mortality (PRISM, version III) was developed to predict ICU
survival or mortality. It derives mortality risk from the amount and extent of observed
physiological dysfunction (Zuckerman, Gregory and Santos-Damiani, 1998). The
predictor uses 17 physiological variables with 26 ranges to determine the risk of
mortality with a score that ranges from zero to 100 (Pollock, Patel and Ruttiman,
1997). The higher the score, the greater the risk the child has of not surviving the
admission. A score of greater than 20 shows a high degree of physiological
instability (Spack, Gedeit,, Splaingard, et al., 1997). The PRISM scoring system can
also be used to determine the absence or presence of serious neurological
24
impairment in paediatric patients who have drowned (Gonzalez-Luis, Pons, Cambra,
et al., 2001). In Wisconsin, a retrospective study of drowning victims between 1976
and 1992 utilised the PRISM score in order to determine outcome retrospectively in
81 drowned children and it was found that a score greater than 20 on initial
presentation to PICU, predicted poor outcome (Spack, Gedeit,, Splaingard, et al.,
1997). The study concluded that the PRISM score is of value to determine outcome
of drowning victims in PICU. Zuckerman, Gregory and Santos-Damiani (1998)
reviewed the use of the PRISM score in children who drowned to determine outcome
in the ER and the PICU but their study population only consisted of 50 patients. They
reported that the use of PRISM in the ER rather than the PICU, is more useful at
predicting outcome. While they mention confounding variables, they did not take
these in account when analysing the data. However, Gonzalez-Luis, Pons, Cambra,
et al., (2001) used a retrospective record review to try determine if the PRISM score
could be used on children who had drowned to determine survival chances and also
to determine if PRISM could be used to predict neurological outcome. They analysed
the variables of 60 children admitted into PICU and determined that the PRISM
score can be used in this population to determine death or disability, but only if the
values lie on the extreme ends of the scales. The outcome of patients with
intermediate PRISM scores cannot be predicted with any certainty.
Recently, genetics has been viewed as a contributing factor in the outcome of ICU
patients. Research into multiple trauma and traumatic brain injury, has shown that
despite similar injuries, outcome varies from patient to patient (Hildebrand, Pape,
van Griensven et al., 2005). This too has been seen in patients with acute lung injury
(ALI) or acute respiratory distress syndrome (ARDS) therefore the pathogenesis of
25
most disease is multifactorial and influenced by the environment, the genotype, the
premorbid condition and the disease process (Flores, Pino-Yanes, Casula, et al,
2010). After trauma, there is an exaggerated inflammatory response that can occur
within hours after the even and which can lead to posttraumatic complications
(Giannoudis, van Griensven, Tsiridis, et al., 2007). Acute lung injury Studies have
suggested that this inflammatory response is regulated at a genetic level
(Hildebrand, Pape, van Griensven et al., 2005). Several cytokine gene
polymorphisms have been found to be associated with outcome in post trauma
patients, such as tumour necrosis factor (TNF-α) and interleukins (IL-1β and IL-6)
(Dardiotis, Grigoriadis, and Hadijgeorgious, 2012; Giannoudis, van Griensven,
Tsiridis, et al., 2007). There has been no research into this area with regard to
victims of drowning but as there is evidence for a genetic mediated inflammatory
response in neuro-trauma, trauma and acute lung injury, there may be a complex
genetic component to the outcome in drowning (Flores, Pino-Yanes, Casula, et al,
2010; Dardiotis, Grigoriadis, and Hadijgeorgious, 2012; Giannoudis, van Griensven,
Tsiridis, et al., 2007).
In summary, there are no specific, sensitive and reliable indicators of outcome in
drowning victims.
2.5.2 Long-term outcome
Long-term outcome after drowning has been poorly researched with very few studies
available (Suominen and Vähätalo, 2012). In 2011, a literature review of long-term
26
follow-up post drowning showed only eight studies which met the search criteria
(Suominen, et al., 2011). From these studies there is evidence that the discharge
neurological status does not show all the possible sequelae from a drowning event.
Although a child may appear to survive a drowning relatively neurologically intact,
there might be long term neurological sequelae which only become apparent later in
life, such as at school age (Suominen, et al., 2011). Recently, Suominen, Sutinen,
Valle et al., (2014) completed a long-term study looking at cognitive and neurological
outcome post drowning. The study sample was small and skewed towards those
children who had a more severe drowning incident (longer submersion time and
CPR required). However, the researcher completed a comprehensive cognitive and
neurological assessment on their subjects and it was found that more than half
(57%) had neurological dysfunction and 40% had low full scale intelligence quotient
(FIQ) with a range of 20 to 78.
There has been more research completed on the impact of focal and diffuse
traumatic brain injuries in children than on the neurological sequelae of drowning, but
these show conflicting results. In the past, the paradigm “the younger is better” has
often been used when discussing brain injury recovery. The brain demonstrates a
plasticity that enables uninjured areas to take over the functions of the damaged
areas. This happens due to a “complex series of molecular, cellular, and
physiological events” (Giza and Prins, 2006). It was postulated that the younger
brain is more capable of plasticity than a more mature brain and therefore children
may have a better outcome following a brain injury than adults. This was supported
by studies mainly looking at children with focal TBI’s at different stages of
development (Giza and Prins, 2006). However, recent research has shown a
27
different picture – a young age at injury is a strong predictor of poor long-term
outcome, especially when considering diffuse cerebral pathology (Anderson, Morse
and Catroppa, 2004). Post TBI, children under three years are more likely to show
severe and long-term deficits in behaviour and cognition (Giza and Prins, 2006;
Anderson, Spencer-Smith and Coleman, 2014). This new theory – brain vulnerability
– hypothesises that the young brain is highly vulnerable to injury as the stepwise
developmental process can easily be derailed and that the plasticity of the brain
does not mean “functional plasticity” (Anderson, Morse and Catroppa, 2004).
During the first few years of life, the brain is developing rapidly, with neural
processes undergoing growth, pruning, synaptogenesis and myelination to form a
cohesive functional unit. Any damage to the brain at this key stage can derail normal
neural development, promote poor connectivity and dysfunctional networks
(Anderson, Spencer-Smith and Coleman, 2014). Additionally, the brain has no
previous set of building blocks or learnt skills so is unable to transfer skills to an
undamaged area. In some cases, brain plasticity can be detrimental, where
abnormal neural connections can impair function even further (Giza and Prins,
2006). This results in long-term sequelae which can include poor verbal and non-
verbal skills, social and behavioural problems, spatial, perceptual, cognitive and
executive function deficits (Anderson, Spencer-Smith and Coleman, 2014). To
complicate matters further, brain development is further reliant on environmental
conditions which can affect its recovery, such as maternal behaviour, enriched
environment, and social conditions (Giza and Prins, 2006). When considering that
drowning can cause hypoxic ischaemic injury to the brain (diffuse damage) and that
the majority of children who drown fall in the under five year age group, long term
follow-up studies are essential in this high-risk group (Anderson, Morse and
28
Catroppa, 2004).. The follow-up should extend well into the child’s school years as
this is when many of the long-term sequelae will appear to have an effect
(Suominen, et al., 2014).
2.6 Costs and quality of life after drowning
As intact neurological survival after drowning cannot be accurately predicted, all
children are usually aggressively resuscitated and treated, no matter their initial
presentation. The costs involved rapidly increase when those who survive the
drowning event are severely disabled or remain in a vegetative state (Christensen,
Jansen and Perkin, 1997). These patients need repeat hospital admissions,
surgeries (such as percutaneous endoscopic gastrostomy (PEG) insertion),
medications and long-term therapy as well as assistive devices. This places an
additional financial burden on a family already under severe emotional strain as well
as having an impact on society’s public health or medical system. However, due to
the uncertainty of intact survival, withdrawal of care should not be considered as
there would be loss of neurologically intact survivors. Suominen et al., (2011)
determined that although quality of life was good among survivors of drowning and
their families, this decreased with increased submersion time, especially if
submersion time exceeded ten minutes.
Although a child might appear to survive the incident without any neurological fallout,
there may significant problems later in life (Suominen et al., 2011). This often
manifests in school age children with impairments in reading and comprehension
skills as well as with fine motor skills. This may put increased pressure on the
29
schooling system as these children are not recognised as having problems until later
on. These neurologically affected children present a huge financial, emotional and
personal cost to the child’s family, and, an increased burden to society (Christensen,
Jansen and Perkin, 1997).
2.7 Drowning Prevention
While drowning is in the top ten causes of death in children, it is also important to
realise that it is entirely preventable (Maconochie, 2015). The WHO (2014)
recommends that school aged children need to be taught to swim, public should be
made aware of CPR and rescue skills and there should be increased public
awareness campaigns on water safety. Legislation should be implemented to
increase safely around bodies of water.
2.8 Conclusion
Drowning is a significant public health problem in South Africa. Boys are more likely
to drown than girls and those under the age of four years old are at a higher risk of
drowning. Many studies have analysed factors which impact outcome after drowning
but there is no consensus between studies about which factors can predict outcome
accurately. Due to the extent of the hypoxic insult to the brain, the severely affected
survivors of drowning may place a large financial and emotional burden on their
caregivers and the health systems resources. There are very few studies based in
South Africa that look at the population of children who have drowned. Therefore
much of the information on these children is obtained from other countries so it is

30
important to understand if our population of children who have drowned have similar
mortality rates and outcome factors.
31
Chapter 3: Methodology
The following methods and materials were used to complete the study:
3.1 Location, site description and patient management
The study was based in a private hospital located in central Johannesburg, South
Africa. The hospital has a nine bed Paediatric ICU. Throughout the study period, the
unit used the same treatment protocol for every patient who was admitted due to
drowning. This protocol includes the uses of therapeutic hypothermia and neuro-
monitoring techniques such as ICP monitoring for those patients that need these
interventions. Due to increased resources available to the unit, there are adequate
numbers of ventilators, and cooling units as well as ICP monitors for the amount of
beds in the unit, ensuring doctor is able to access the equipment if a patient needs it.
The medical team based at the ICU includes an intensivist, ICU trained nurses,
physiotherapist, and dietician. Specialists (such as neuro-surgeons, orthopaedic
surgeons) and other allied medical professionals (such as occupational therapists,
speech and language therapists) are called on a case to case basis as needed.
3.2 Study design
This study is a retrospective descriptive cohort study utilising convenience sampling.
3.3 Ethical considerations
Prior to data collection, an ethics clearance certificate (no. M131038) was obtained
from the University of the Witwatersrand Human Research Ethics Committee
32
(Medical) on the 25/10/2013 (Appendix A) and the research protocol was approved
by the University of Witwatersrand protocol committee. This was then taken to the
hospital’s research committee and permission was obtained for a record review to
occur at the hospital (Appendix B). The doctor in charge of the unit gave his
permission for his PICUE (Pediatric ICU Evaluator, version 3, Children’s Research
Institute 2003) database to be used (Appendix C). The database is maintained by
the doctor and his assistant and is store on his private password protected computer
with limited access to it. Once the records of the children were obtained from PICUE,
patient confidentiality was assured by assigning each patient a unique case number
identifier and removing their names and hospital identification numbers form the data
to be analysed. This list was kept separately in a password protected file.
3.4 Cases
Children, between zero and 14 years of age, admitted to the hospital’s Paediatric
ICU were included into the study using the following criteria:
Inclusion criteria: patients classified in PICUE database with the diagnosis of
“near-drowning” or “drowning” with a PICU admission date from January,
2003 to December, 2013.
Exclusion criteria: Previous neurological impairment or pathology (recorded in
database along with diagnosis), duplicated records and those with more than
65% of data missing.
33
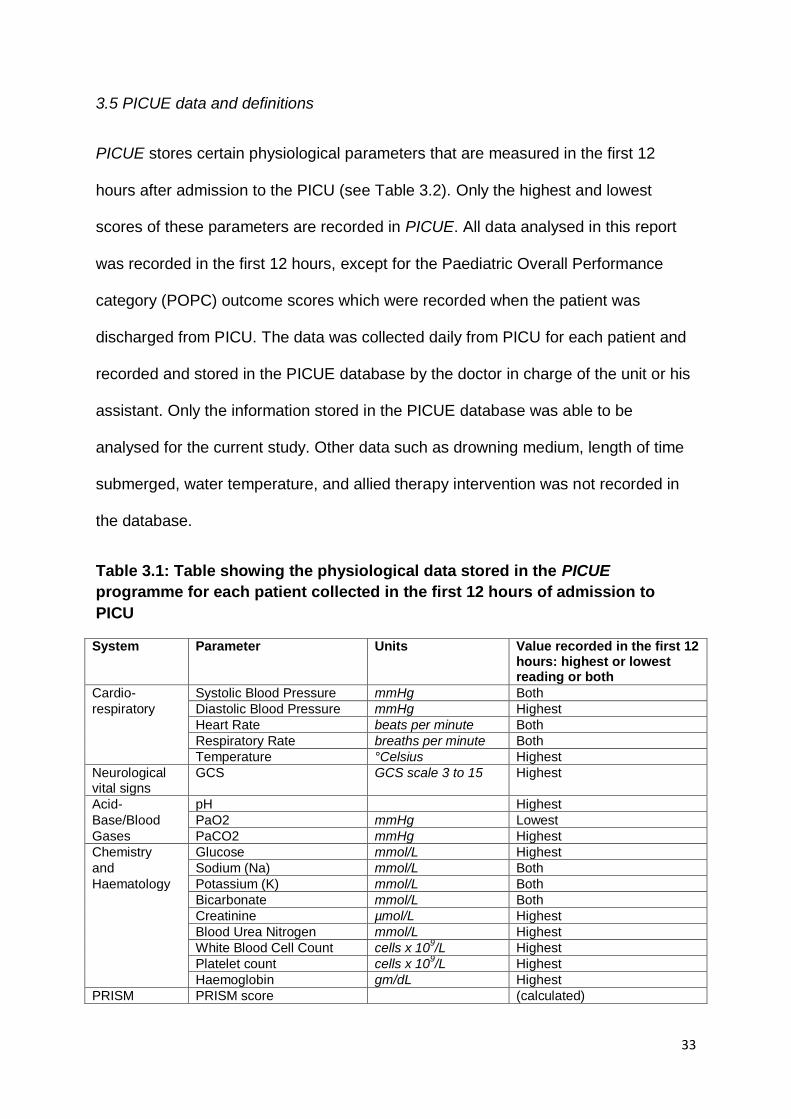
3.5 PICUE data and definitions
PICUE stores certain physiological parameters that are measured in the first 12
hours after admission to the PICU (see Table 3.2). Only the highest and lowest
scores of these parameters are recorded in PICUE. All data analysed in this report
was recorded in the first 12 hours, except for the Paediatric Overall Performance
category (POPC) outcome scores which were recorded when the patient was
discharged from PICU. The data was collected daily from PICU for each patient and
recorded and stored in the PICUE database by the doctor in charge of the unit or his
assistant. Only the information stored in the PICUE database was able to be
analysed for the current study. Other data such as drowning medium, length of time
submerged, water temperature, and allied therapy intervention was not recorded in
the database.
Table 3.1: Table showing the physiological data stored in the PICUE
programme for each patient collected in the first 12 hours of admission to
PICU
System Parameter Units Value recorded in the first 12 hours: highest or lowest reading or both
Cardio- Systolic Blood Pressure mmHg Both
respiratory Diastolic Blood Pressure mmHg Highest
Heart Rate beats per minute Both
Respiratory Rate breaths per minute Both
Temperature °Celsius Highest
Neurological vital signs
GCS GCS scale 3 to 15 Highest
Acid- pH Highest
Base/Blood PaO2 mmHg Lowest
Gases PaCO2 mmHg Highest
Chemistry Glucose mmol/L Highest
and Sodium (Na) mmol/L Both
Haematology Potassium (K) mmol/L Both
Bicarbonate mmol/L Both
Creatinine µmol/L Highest
Blood Urea Nitrogen mmol/L Highest
White Blood Cell Count cells x 109/L Highest
Platelet count cells x 109/L Highest
Haemoglobin gm/dL Highest
PRISM PRISM score (calculated)
34
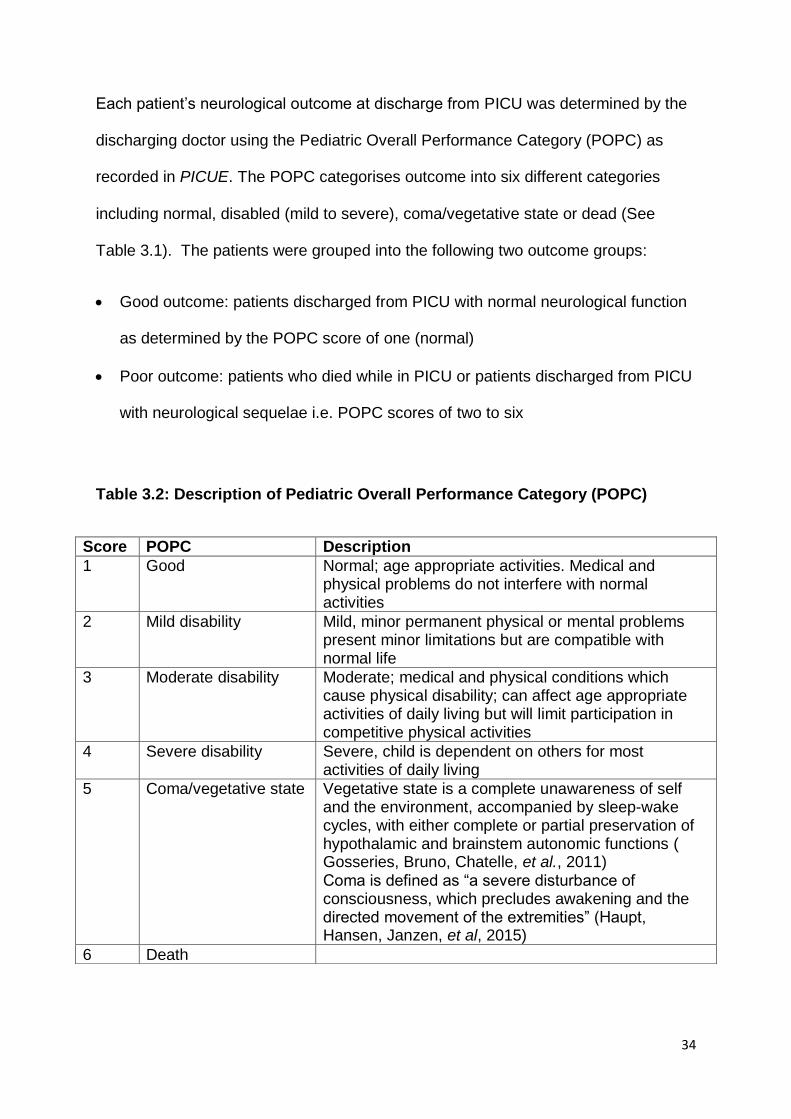
Each patient’s neurological outcome at discharge from PICU was determined by the
discharging doctor using the Pediatric Overall Performance Category (POPC) as
recorded in PICUE. The POPC categorises outcome into six different categories
including normal, disabled (mild to severe), coma/vegetative state or dead (See
Table 3.1). The patients were grouped into the following two outcome groups:
Good outcome: patients discharged from PICU with normal neurological function
as determined by the POPC score of one (normal)
Poor outcome: patients who died while in PICU or patients discharged from PICU
with neurological sequelae i.e. POPC scores of two to six
Table 3.2: Description of Pediatric Overall Performance Category (POPC)
Score POPC Description
1 Good Normal; age appropriate activities. Medical and physical problems do not interfere with normal activities
2 Mild disability Mild, minor permanent physical or mental problems present minor limitations but are compatible with normal life
3 Moderate disability Moderate; medical and physical conditions which cause physical disability; can affect age appropriate activities of daily living but will limit participation in competitive physical activities
4 Severe disability Severe, child is dependent on others for most activities of daily living
5 Coma/vegetative state Vegetative state is a complete unawareness of self and the environment, accompanied by sleep-wake cycles, with either complete or partial preservation of hypothalamic and brainstem autonomic functions ( Gosseries, Bruno, Chatelle, et al., 2011) Coma is defined as “a severe disturbance of consciousness, which precludes awakening and the directed movement of the extremities” (Haupt, Hansen, Janzen, et al, 2015)
6 Death
35
3.6 Procedure
Data was retrieved from the PICUE database by the doctor’s assistant by searching
for the patients with the diagnosis of “near-drowning” or “drowning”. Each patient
was given a unique data reference number. This was kept separately from the rest of
the data so that confidentiality could be maintained. This data was then extracted
from these PICUE records (see Appendix D for data collection sheet) and entered
into an Excel spreadsheet (Microsoft, version 2007).
3.7 Data and Statistical Analysis
The data was then preliminarily analysed using Excel’s basic statistical functions and
further analysis was performed with Statistica (Statsoft, version 10).
Categorical variables were presented as numbers and percentages. Continuous data
was checked for normality by plotting histograms, P-P plots, checking skewness and
kurtosis, and using Shipiro-Wilk normality test (p<0.05). Normal data was shown
using means and standard deviations while non-normal data used median, and
minimum to maximum ranges. All available measures were included into the
calculations and no imputations were made. Physiological variable limits were
determined from Pryor and Prasad (2003).
Patients were classified into outcome groups by discharge POPC values. For
normally distributed data, Student’s t-test was used to determine the difference
between the means of each variable for good or poor outcome. To determine if there

36
was a difference between medians in non-parametric data, the Mann-Whitney U test
was used. Variables were then analysed to determine potential prognostic factors
for outcome. This was first completed by univariate analysis using Relative Risk and
Fisher’s Exact test and the risk of poor outcome was measured for its strength of
association with certain predictor variables and compared to the outcome of those
without the predictor.
A forward stepwise multivariate discriminant analysis was then performed using
Wilks’ Lamba values to determine those variables most strongly associated with
outcome.
A two tailed p value of 0.05 was considered statistically significant for all analysis.
37
CHAPTER 4: Results
The following results analysis looks at the data obtained from the units PICUE
database. The population’s descriptive statistics were analysed and then the
population was placed into two different groups according to outcome. From these
two outcome groups, the neurological, acid-base, haematological, and
cardiorespiratory variables associated with outcome were analysed. Finally a
multivariate analysis was completed on all variables.
For the eleven year study period from the beginning of 2003 to the end of 2013, 215
patients were identified in the PICUE program with the diagnosis of “near drowning”.
This is an average of 19.55 patients per year. Of the 215 children, 11 were excluded
from the study as they did not meet the inclusion criteria. Two of these were
duplicate records, three children had a previous neurological impairment or
pathology and five records did not have sufficient data to analyse (more than 65%
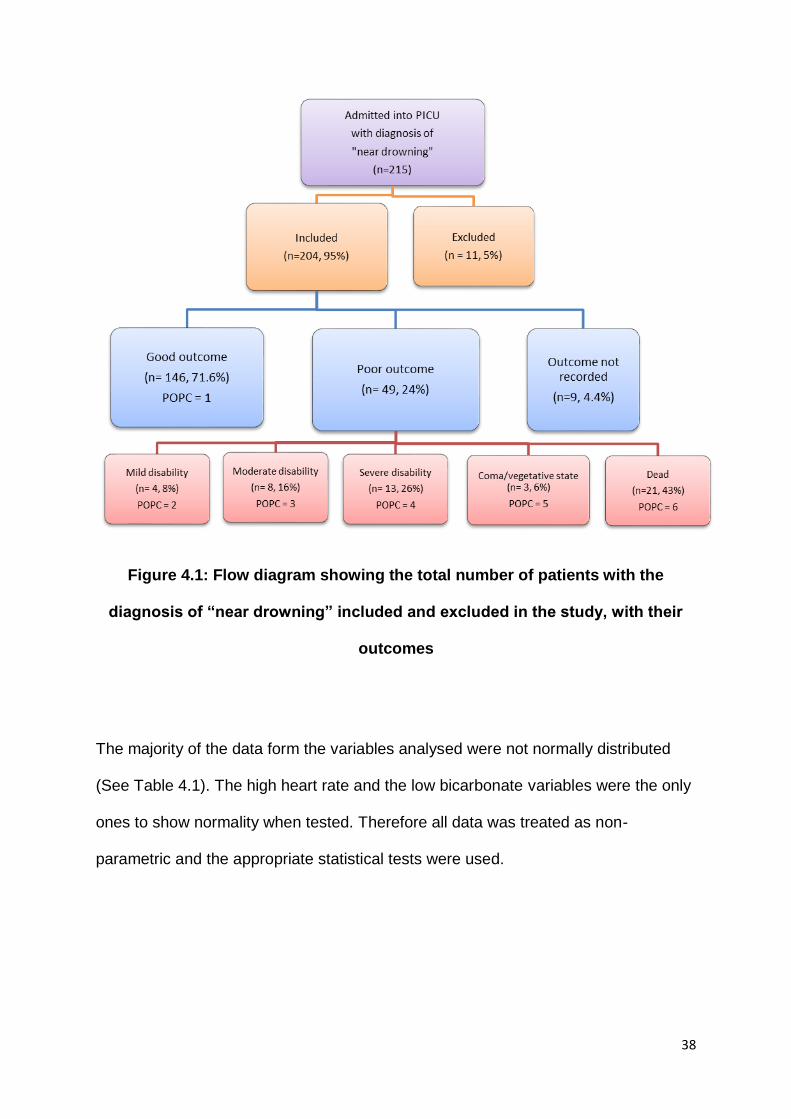
data missing). Figure 4.1 shows a flow diagram of all these patients and the
outcome of those included in the study. The outcome data was collected on
discharge from PICU by the attending doctor. A good neurological outcome was
seen in 71.6% (n=146) of the patients. There was a poor neurological outcome in 49
(24%) of children included in the study, including those who died. The mortality rate
found in this study was 10.3% (n=21). For nine of the children in the study (4.4%),
no outcome was recorded. This affects the number of children analysed with regards
to outcome in each group as numbers were determined by data available.
38
Figure 4.1: Flow diagram showing the total number of patients with the
diagnosis of “near drowning” included and excluded in the study, with their
outcomes
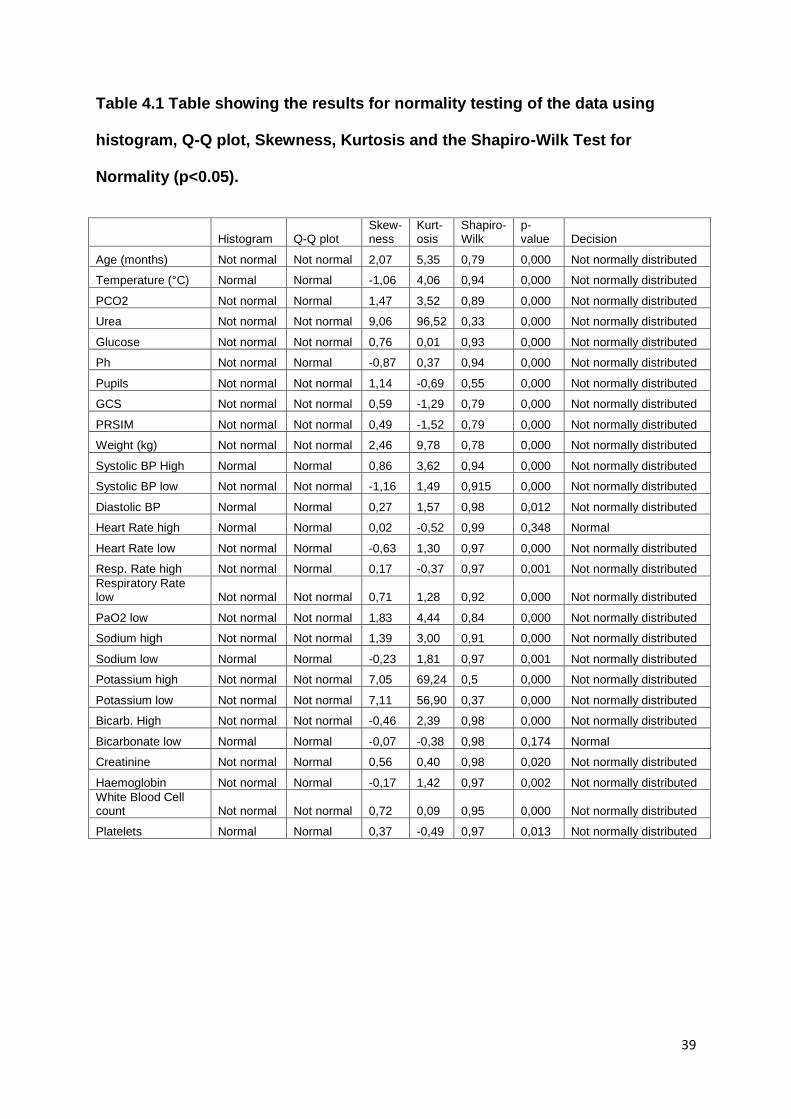
The majority of the data form the variables analysed were not normally distributed
(See Table 4.1). The high heart rate and the low bicarbonate variables were the only
ones to show normality when tested. Therefore all data was treated as non-
parametric and the appropriate statistical tests were used.
39
Table 4.1 Table showing the results for normality testing of the data using
histogram, Q-Q plot, Skewness, Kurtosis and the Shapiro-Wilk Test for
Normality (p<0.05).
Histogram Q-Q plot Skew-ness
Kurt-osis
Shapiro-Wilk
p-value Decision
Age (months) Not normal Not normal 2,07 5,35 0,79 0,000 Not normally distributed
Temperature (°C) Normal Normal -1,06 4,06 0,94 0,000 Not normally distributed
PCO2 Not normal Normal 1,47 3,52 0,89 0,000 Not normally distributed
Urea Not normal Not normal 9,06 96,52 0,33 0,000 Not normally distributed
Glucose Not normal Not normal 0,76 0,01 0,93 0,000 Not normally distributed
Ph Not normal Normal -0,87 0,37 0,94 0,000 Not normally distributed
Pupils Not normal Not normal 1,14 -0,69 0,55 0,000 Not normally distributed
GCS Not normal Not normal 0,59 -1,29 0,79 0,000 Not normally distributed
PRSIM Not normal Not normal 0,49 -1,52 0,79 0,000 Not normally distributed
Weight (kg) Not normal Not normal 2,46 9,78 0,78 0,000 Not normally distributed
Systolic BP High Normal Normal 0,86 3,62 0,94 0,000 Not normally distributed
Systolic BP low Not normal Not normal -1,16 1,49 0,915 0,000 Not normally distributed
Diastolic BP Normal Normal 0,27 1,57 0,98 0,012 Not normally distributed
Heart Rate high Normal Normal 0,02 -0,52 0,99 0,348 Normal
Heart Rate low Not normal Normal -0,63 1,30 0,97 0,000 Not normally distributed
Resp. Rate high Not normal Normal 0,17 -0,37 0,97 0,001 Not normally distributed
Respiratory Rate low Not normal Not normal 0,71 1,28 0,92 0,000 Not normally distributed
PaO2 low Not normal Not normal 1,83 4,44 0,84 0,000 Not normally distributed
Sodium high Not normal Not normal 1,39 3,00 0,91 0,000 Not normally distributed
Sodium low Normal Normal -0,23 1,81 0,97 0,001 Not normally distributed
Potassium high Not normal Not normal 7,05 69,24 0,5 0,000 Not normally distributed
Potassium low Not normal Not normal 7,11 56,90 0,37 0,000 Not normally distributed
Bicarb. High Not normal Not normal -0,46 2,39 0,98 0,000 Not normally distributed
Bicarbonate low Normal Normal -0,07 -0,38 0,98 0,174 Normal
Creatinine Not normal Normal 0,56 0,40 0,98 0,020 Not normally distributed
Haemoglobin Not normal Normal -0,17 1,42 0,97 0,002 Not normally distributed
White Blood Cell count Not normal Not normal 0,72 0,09 0,95 0,000 Not normally distributed
Platelets Normal Normal 0,37 -0,49 0,97 0,013 Not normally distributed
40
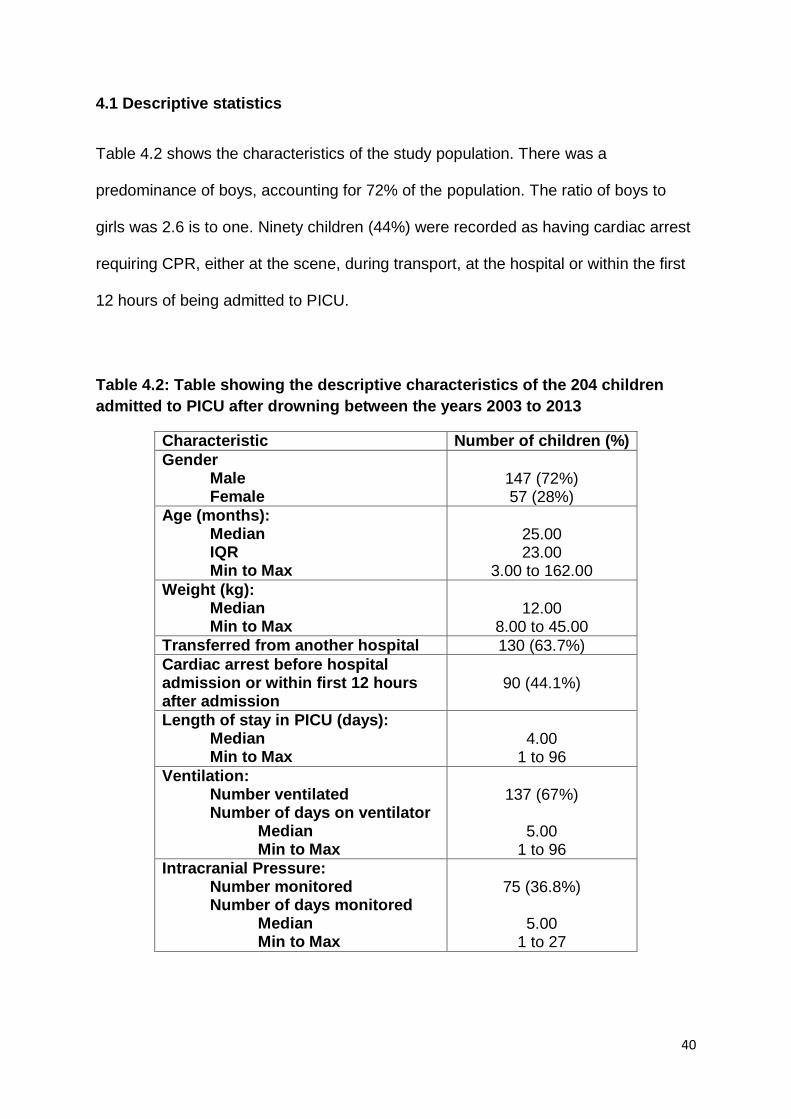
4.1 Descriptive statistics
Table 4.2 shows the characteristics of the study population. There was a
predominance of boys, accounting for 72% of the population. The ratio of boys to
girls was 2.6 is to one. Ninety children (44%) were recorded as having cardiac arrest
requiring CPR, either at the scene, during transport, at the hospital or within the first
12 hours of being admitted to PICU.
Table 4.2: Table showing the descriptive characteristics of the 204 children
admitted to PICU after drowning between the years 2003 to 2013
Characteristic Number of children (%)
Gender Male Female
147 (72%) 57 (28%)
Age (months): Median IQR Min to Max
25.00 23.00
3.00 to 162.00
Weight (kg): Median Min to Max
12.00
8.00 to 45.00 Transferred from another hospital 130 (63.7%)
Cardiac arrest before hospital admission or within first 12 hours after admission
90 (44.1%)
Length of stay in PICU (days): Median Min to Max
4.00
1 to 96
Ventilation: Number ventilated Number of days on ventilator
Median Min to Max
137 (67%)
5.00
1 to 96 Intracranial Pressure:
Number monitored Number of days monitored
Median Min to Max
75 (36.8%)
5.00
1 to 27
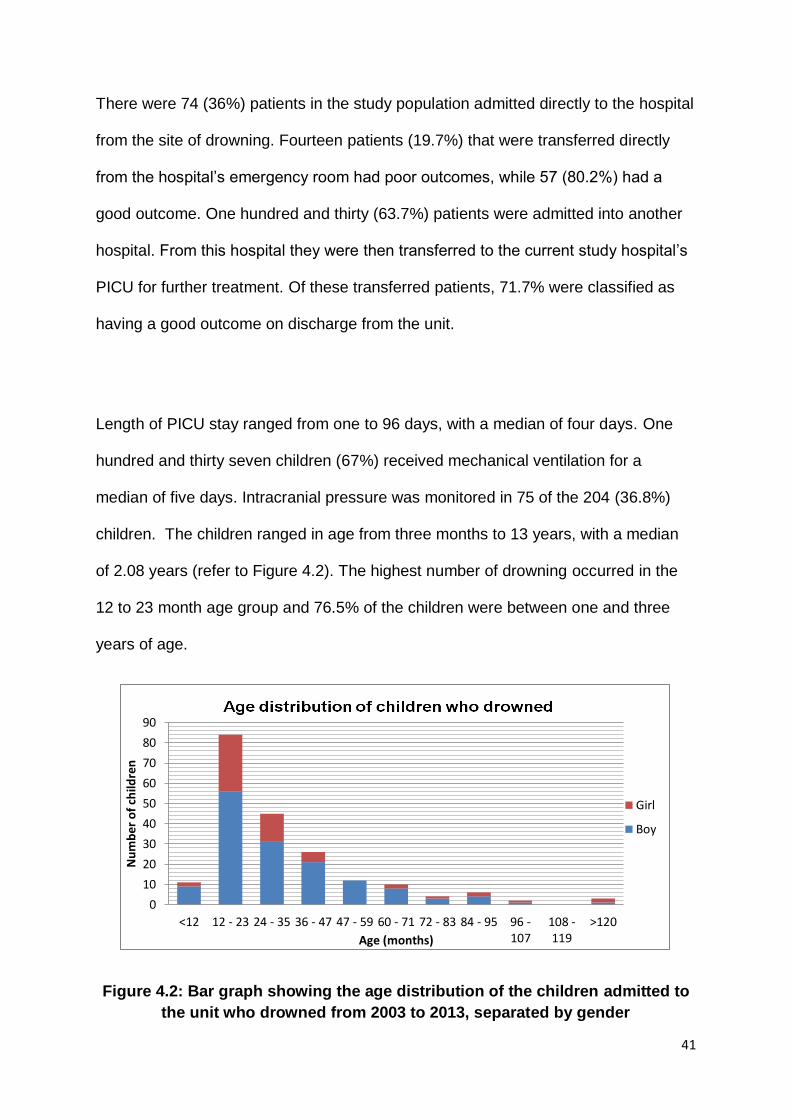
41
There were 74 (36%) patients in the study population admitted directly to the hospital
from the site of drowning. Fourteen patients (19.7%) that were transferred directly
from the hospital’s emergency room had poor outcomes, while 57 (80.2%) had a
good outcome. One hundred and thirty (63.7%) patients were admitted into another
hospital. From this hospital they were then transferred to the current study hospital’s
PICU for further treatment. Of these transferred patients, 71.7% were classified as
having a good outcome on discharge from the unit.
Length of PICU stay ranged from one to 96 days, with a median of four days. One
hundred and thirty seven children (67%) received mechanical ventilation for a
median of five days. Intracranial pressure was monitored in 75 of the 204 (36.8%)
children. The children ranged in age from three months to 13 years, with a median
of 2.08 years (refer to Figure 4.2). The highest number of drowning occurred in the
12 to 23 month age group and 76.5% of the children were between one and three
years of age.
Figure 4.2: Bar graph showing the age distribution of the children admitted to
the unit who drowned from 2003 to 2013, separated by gender
0
10
20
30
40
50
60
70
80
90
<12 12 - 23 24 - 35 36 - 47 47 - 59 60 - 71 72 - 83 84 - 95 96 -107
108 -119
>120
Nu
mb
er o
f ch
ildre
n
Age (months)
Girl
Boy
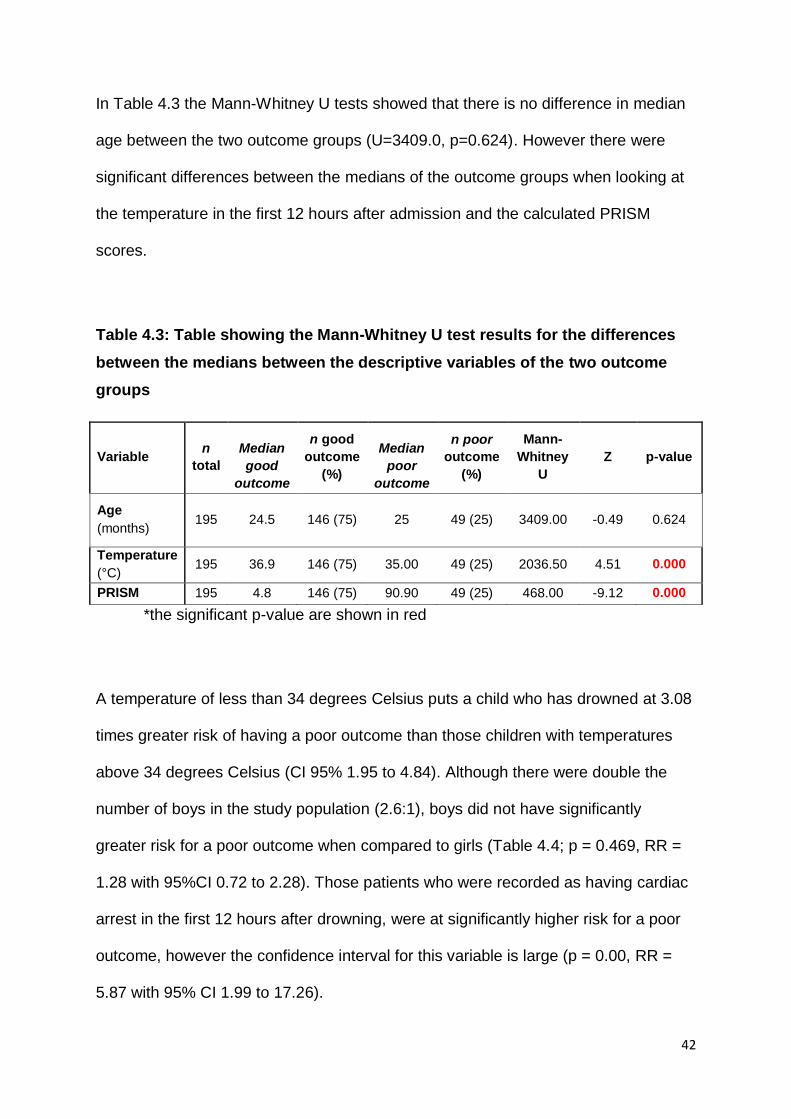
42
In Table 4.3 the Mann-Whitney U tests showed that there is no difference in median
age between the two outcome groups (U=3409.0, p=0.624). However there were
significant differences between the medians of the outcome groups when looking at
the temperature in the first 12 hours after admission and the calculated PRISM
scores.
Table 4.3: Table showing the Mann-Whitney U test results for the differences
between the medians between the descriptive variables of the two outcome
groups
Variable n
total
Median
good
outcome
n good
outcome
(%)
Median
poor
outcome
n poor
outcome
(%)
Mann-
Whitney
U
Z p-value
Age
(months) 195 24.5 146 (75) 25 49 (25) 3409.00 -0.49 0.624
Temperature
(°C) 195 36.9 146 (75) 35.00 49 (25) 2036.50 4.51 0.000
PRISM 195 4.8 146 (75) 90.90 49 (25) 468.00 -9.12 0.000
*the significant p-value are shown in red
A temperature of less than 34 degrees Celsius puts a child who has drowned at 3.08
times greater risk of having a poor outcome than those children with temperatures
above 34 degrees Celsius (CI 95% 1.95 to 4.84). Although there were double the
number of boys in the study population (2.6:1), boys did not have significantly
greater risk for a poor outcome when compared to girls (Table 4.4; p = 0.469, RR =
1.28 with 95%CI 0.72 to 2.28). Those patients who were recorded as having cardiac
arrest in the first 12 hours after drowning, were at significantly higher risk for a poor
outcome, however the confidence interval for this variable is large (p = 0.00, RR =
5.87 with 95% CI 1.99 to 17.26).
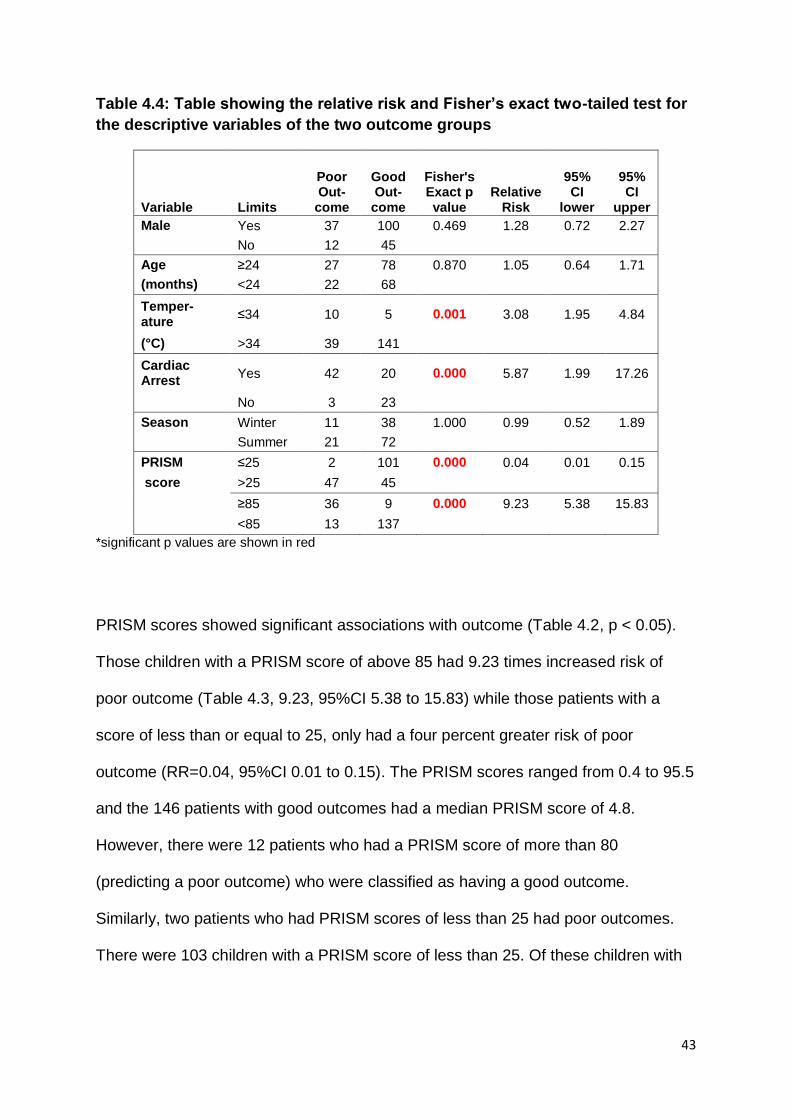
43
Table 4.4: Table showing the relative risk and Fisher’s exact two-tailed test for
the descriptive variables of the two outcome groups
Variable Limits
Poor Out-
come
Good Out-
come
Fisher's Exact p value
Relative Risk
95% CI
lower
95% CI
upper
Male Yes 37 100 0.469 1.28 0.72 2.27
No 12 45
Age ≥24 27 78 0.870 1.05 0.64 1.71
(months) <24 22 68
Temper-ature
≤34 10 5 0.001 3.08 1.95 4.84
(°C) >34 39 141
Cardiac Arrest
Yes 42 20 0.000 5.87 1.99 17.26
No 3 23
Season Winter 11 38 1.000 0.99 0.52 1.89
Summer 21 72
PRISM ≤25 2 101 0.000 0.04 0.01 0.15
score >25 47 45
≥85 36 9 0.000 9.23 5.38 15.83
<85 13 137
*significant p values are shown in red
PRISM scores showed significant associations with outcome (Table 4.2, p < 0.05).
Those children with a PRISM score of above 85 had 9.23 times increased risk of
poor outcome (Table 4.3, 9.23, 95%CI 5.38 to 15.83) while those patients with a
score of less than or equal to 25, only had a four percent greater risk of poor
outcome (RR=0.04, 95%CI 0.01 to 0.15). The PRISM scores ranged from 0.4 to 95.5
and the 146 patients with good outcomes had a median PRISM score of 4.8.
However, there were 12 patients who had a PRISM score of more than 80
(predicting a poor outcome) who were classified as having a good outcome.
Similarly, two patients who had PRISM scores of less than 25 had poor outcomes.
There were 103 children with a PRISM score of less than 25. Of these children with
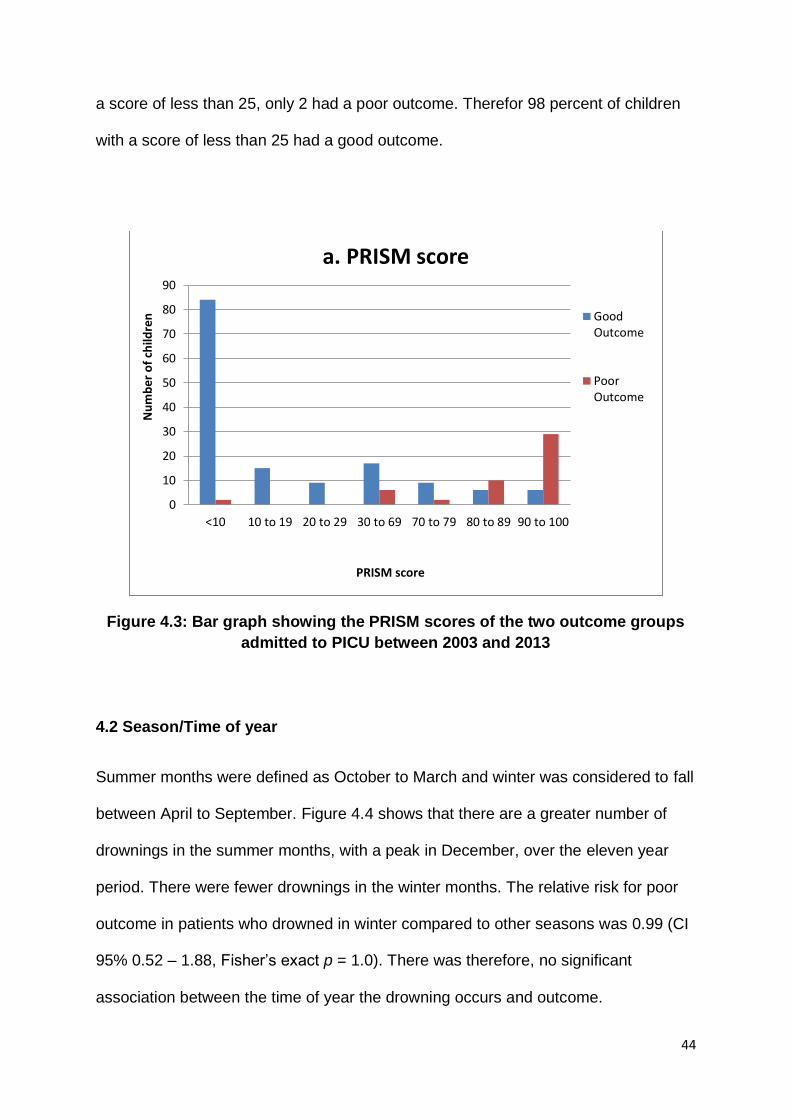
44
a score of less than 25, only 2 had a poor outcome. Therefor 98 percent of children
with a score of less than 25 had a good outcome.
Figure 4.3: Bar graph showing the PRISM scores of the two outcome groups
admitted to PICU between 2003 and 2013
4.2 Season/Time of year
Summer months were defined as October to March and winter was considered to fall
between April to September. Figure 4.4 shows that there are a greater number of
drownings in the summer months, with a peak in December, over the eleven year
period. There were fewer drownings in the winter months. The relative risk for poor
outcome in patients who drowned in winter compared to other seasons was 0.99 (CI
95% 0.52 – 1.88, Fisher’s exact p = 1.0). There was therefore, no significant
association between the time of year the drowning occurs and outcome.
0
10
20
30
40
50
60
70
80
90
<10 10 to 19 20 to 29 30 to 69 70 to 79 80 to 89 90 to 100
Nu
mb
er o
f ch
ildre
n
PRISM score
a. PRISM score
GoodOutcome
PoorOutcome
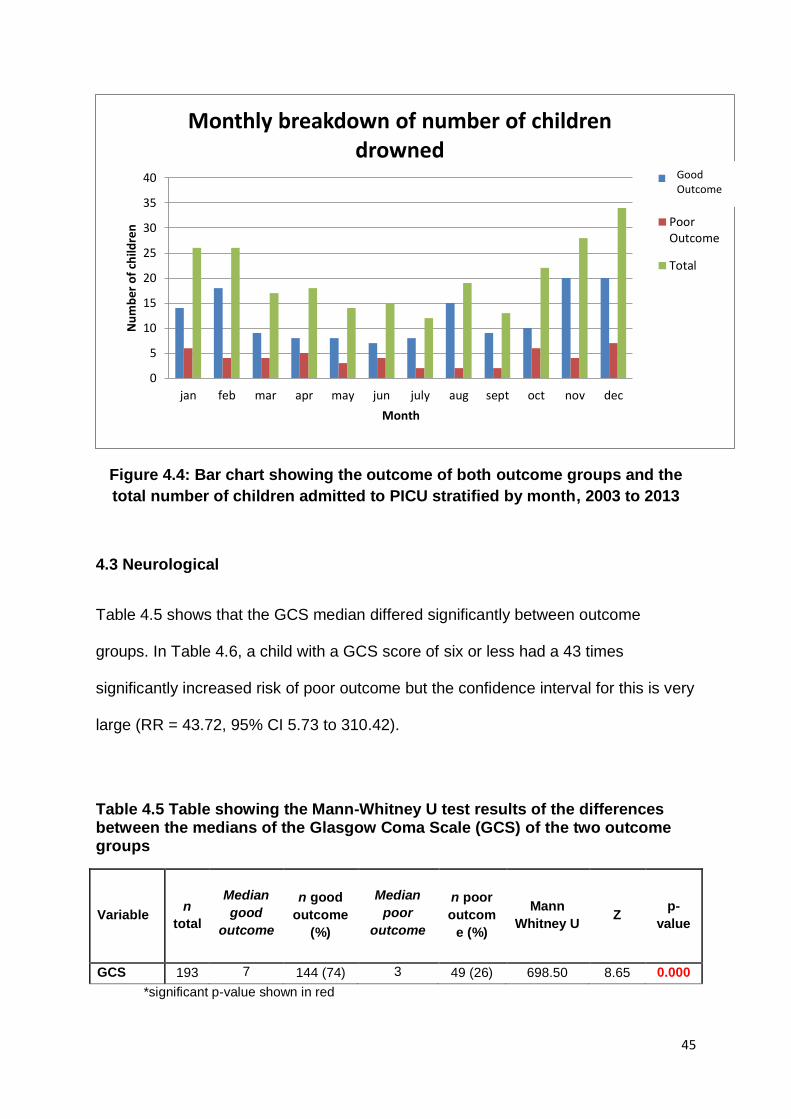
45
Figure 4.4: Bar chart showing the outcome of both outcome groups and the
total number of children admitted to PICU stratified by month, 2003 to 2013
4.3 Neurological
Table 4.5 shows that the GCS median differed significantly between outcome
groups. In Table 4.6, a child with a GCS score of six or less had a 43 times
significantly increased risk of poor outcome but the confidence interval for this is very
large (RR = 43.72, 95% CI 5.73 to 310.42).
Table 4.5 Table showing the Mann-Whitney U test results of the differences between the medians of the Glasgow Coma Scale (GCS) of the two outcome groups
Variable n
total
Median
good
outcome
n good
outcome
(%)
Median
poor
outcome
n poor
outcom
e (%)
Mann
Whitney U Z
p-
value
GCS 193 7 144 (74) 3 49 (26) 698.50 8.65 0.000
*significant p-value shown in red
0
5
10
15
20
25
30
35
40
jan feb mar apr may jun july aug sept oct nov dec
Nu
mb
er o
f ch
ildre
n
Month
Monthly breakdown of number of children drowned
Normal
PoorOutcome
Total
Good Outcome
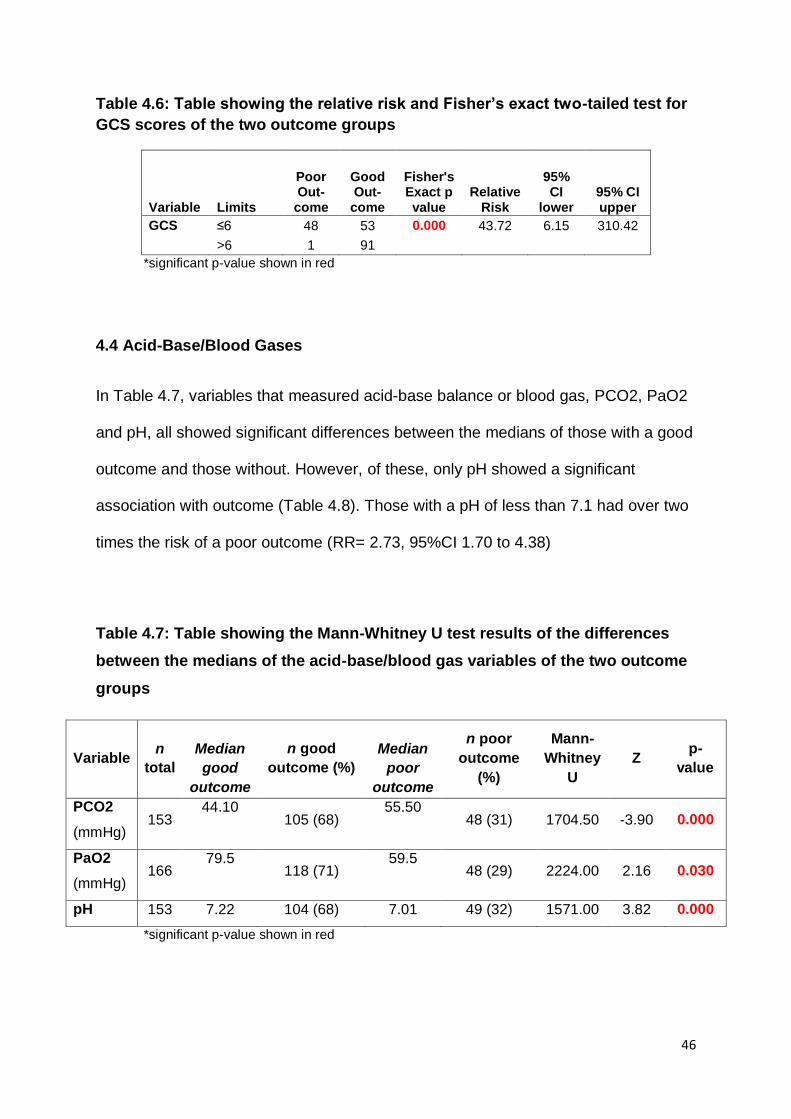
46
Table 4.6: Table showing the relative risk and Fisher’s exact two-tailed test for
GCS scores of the two outcome groups
Variable Limits
Poor Out-
come
Good Out-
come
Fisher's Exact p value
Relative Risk
95% CI
lower 95% CI upper
GCS ≤6 48 53 0.000 43.72 6.15 310.42
>6 1 91
*significant p-value shown in red
4.4 Acid-Base/Blood Gases
In Table 4.7, variables that measured acid-base balance or blood gas, PCO2, PaO2
and pH, all showed significant differences between the medians of those with a good
outcome and those without. However, of these, only pH showed a significant
association with outcome (Table 4.8). Those with a pH of less than 7.1 had over two
times the risk of a poor outcome (RR= 2.73, 95%CI 1.70 to 4.38)
Table 4.7: Table showing the Mann-Whitney U test results of the differences
between the medians of the acid-base/blood gas variables of the two outcome
groups
Variable n
total
Median
good
outcome
n good
outcome (%)
Median
poor
outcome
n poor
outcome
(%)
Mann-
Whitney
U
Z p-
value
PCO2
(mmHg) 153
44.10 105 (68)
55.50 48 (31) 1704.50 -3.90 0.000
PaO2
(mmHg) 166
79.5 118 (71)
59.5 48 (29) 2224.00 2.16 0.030
pH 153 7.22 104 (68) 7.01 49 (32) 1571.00 3.82 0.000
*significant p-value shown in red
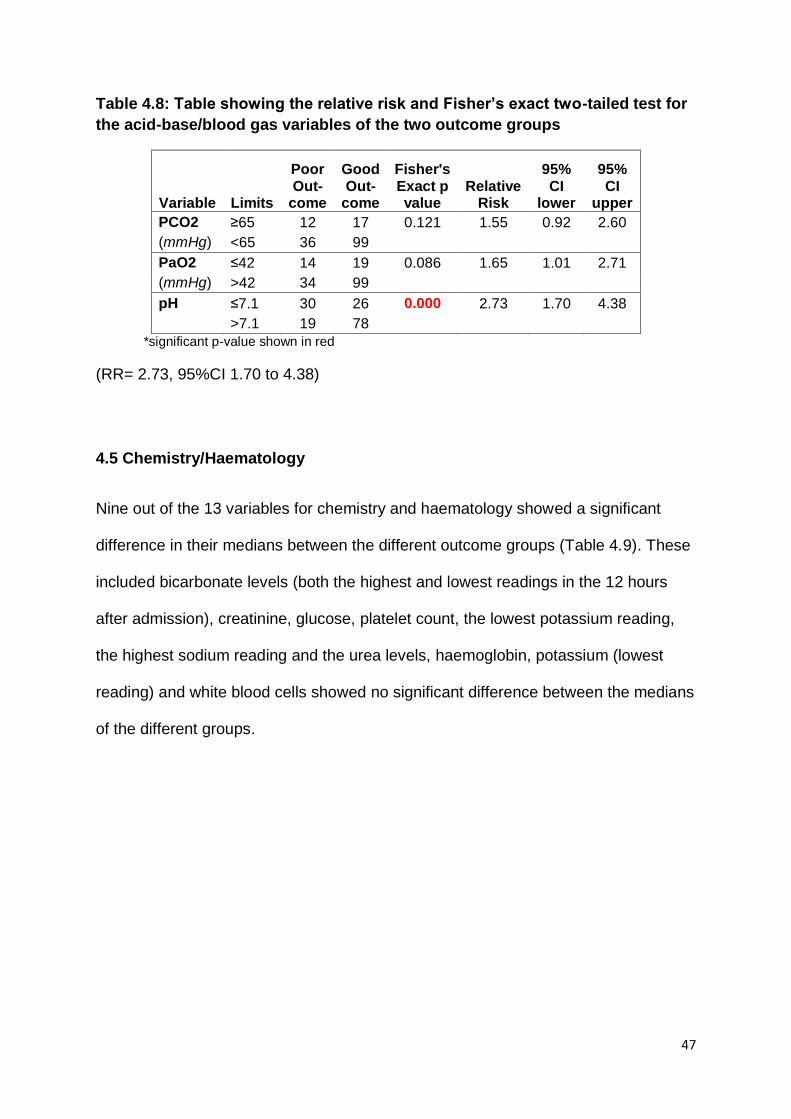
47
Table 4.8: Table showing the relative risk and Fisher’s exact two-tailed test for
the acid-base/blood gas variables of the two outcome groups
Variable Limits
Poor Out-
come
Good Out-
come
Fisher's Exact p value
Relative Risk
95% CI
lower
95% CI
upper
PCO2 ≥65 12 17 0.121 1.55 0.92 2.60
(mmHg) <65 36 99
PaO2 ≤42 14 19 0.086 1.65 1.01 2.71
(mmHg) >42 34 99
pH ≤7.1 30 26 0.000 2.73 1.70 4.38
>7.1 19 78
*significant p-value shown in red
(RR= 2.73, 95%CI 1.70 to 4.38)
4.5 Chemistry/Haematology
Nine out of the 13 variables for chemistry and haematology showed a significant
difference in their medians between the different outcome groups (Table 4.9). These
included bicarbonate levels (both the highest and lowest readings in the 12 hours
after admission), creatinine, glucose, platelet count, the lowest potassium reading,
the highest sodium reading and the urea levels, haemoglobin, potassium (lowest
reading) and white blood cells showed no significant difference between the medians
of the different groups.
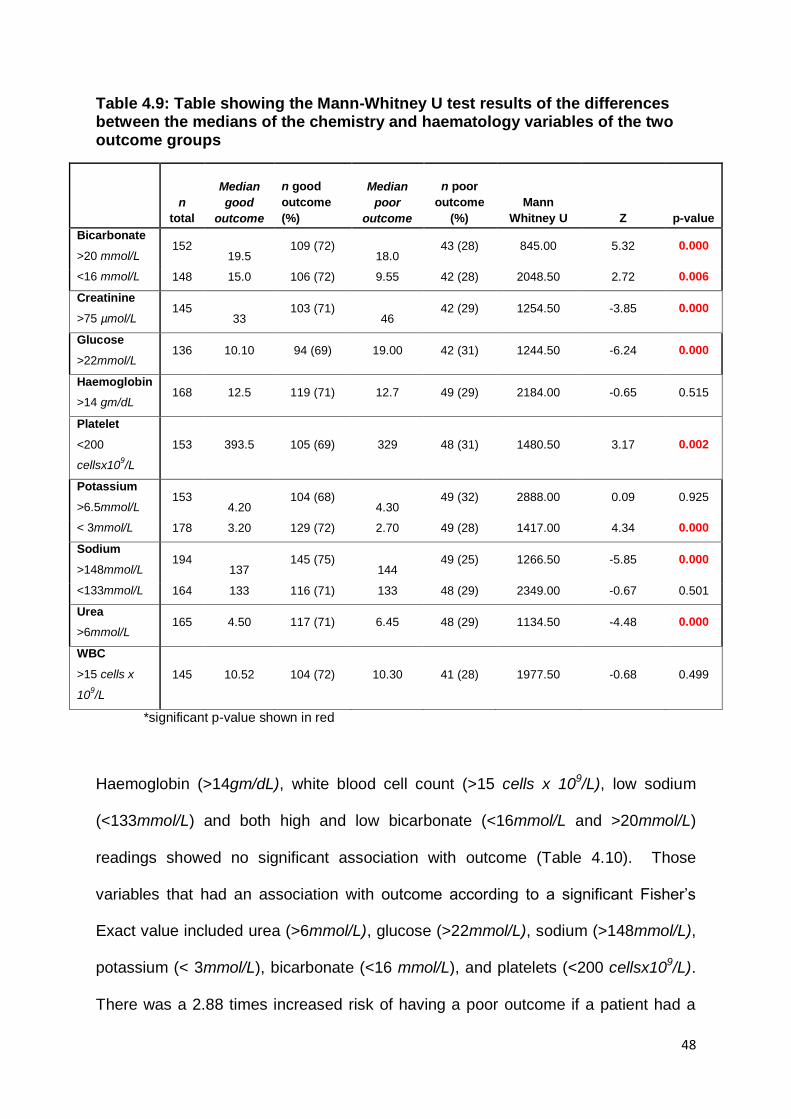
48
Table 4.9: Table showing the Mann-Whitney U test results of the differences between the medians of the chemistry and haematology variables of the two outcome groups
n
total
Median
good
outcome
n good
outcome
(%)
Median
poor
outcome
n poor
outcome
(%)
Mann
Whitney U Z p-value
Bicarbonate
>20 mmol/L 152
19.5 109 (72)
18.0 43 (28) 845.00 5.32 0.000
<16 mmol/L 148 15.0 106 (72) 9.55 42 (28) 2048.50 2.72 0.006
Creatinine
>75 µmol/L 145
33 103 (71)
46 42 (29) 1254.50 -3.85 0.000
Glucose
>22mmol/L 136 10.10 94 (69) 19.00 42 (31) 1244.50 -6.24 0.000
Haemoglobin
>14 gm/dL 168 12.5 119 (71) 12.7 49 (29) 2184.00 -0.65 0.515
Platelet
<200
cellsx109/L
153 393.5 105 (69) 329 48 (31) 1480.50 3.17 0.002
Potassium
>6.5mmol/L 153
4.20 104 (68)
4.30 49 (32) 2888.00 0.09 0.925
< 3mmol/L 178 3.20 129 (72) 2.70 49 (28) 1417.00 4.34 0.000
Sodium
>148mmol/L 194
137 145 (75)
144 49 (25) 1266.50 -5.85 0.000
<133mmol/L 164 133 116 (71) 133 48 (29) 2349.00 -0.67 0.501
Urea
>6mmol/L 165 4.50 117 (71) 6.45 48 (29) 1134.50 -4.48 0.000
WBC
>15 cells x
109/L
145 10.52 104 (72) 10.30 41 (28) 1977.50 -0.68 0.499
*significant p-value shown in red
Haemoglobin (>14gm/dL), white blood cell count (>15 cells x 109/L), low sodium
(<133mmol/L) and both high and low bicarbonate (<16mmol/L and >20mmol/L)
readings showed no significant association with outcome (Table 4.10). Those
variables that had an association with outcome according to a significant Fisher’s
Exact value included urea (>6mmol/L), glucose (>22mmol/L), sodium (>148mmol/L),
potassium (< 3mmol/L), bicarbonate (<16 mmol/L), and platelets (<200 cellsx109/L).
There was a 2.88 times increased risk of having a poor outcome if a patient had a
49
urea level of over six millimoles per litre in the first 12 hours after admission (95%CI
1.73 to 4.80) than if the level was below six. Similarly a high glucose reading (above
22 mmol/L) increased the risk of poor outcome by 3.16 fold (95%CI 2.09 to 4.75). A
sodium level of above 148 mmol/L increased the likelihood of a poor outcome by
3.51 times (95% CI 2.41 to 5.10). Having decreased levels of potassium (less than or
equal to 3 mmol/L) also increased the risk of a poor outcome by 2.39 fold (95% CI
1.38 to 4.15) and bicarbonate (less than or equal to 16 mmol/L) increased the risk of
poor outcome by over 3 times (RR=3.42, 95% CI 1.31 to 8.91). High creatinine
readings above 75µmol/L (RR=3.02 95% CI 1.80 to 5.08) and low platelet reading
(RR = 2.92 95%CI 1.79 to 4.75) also showed a strong association with outcome.
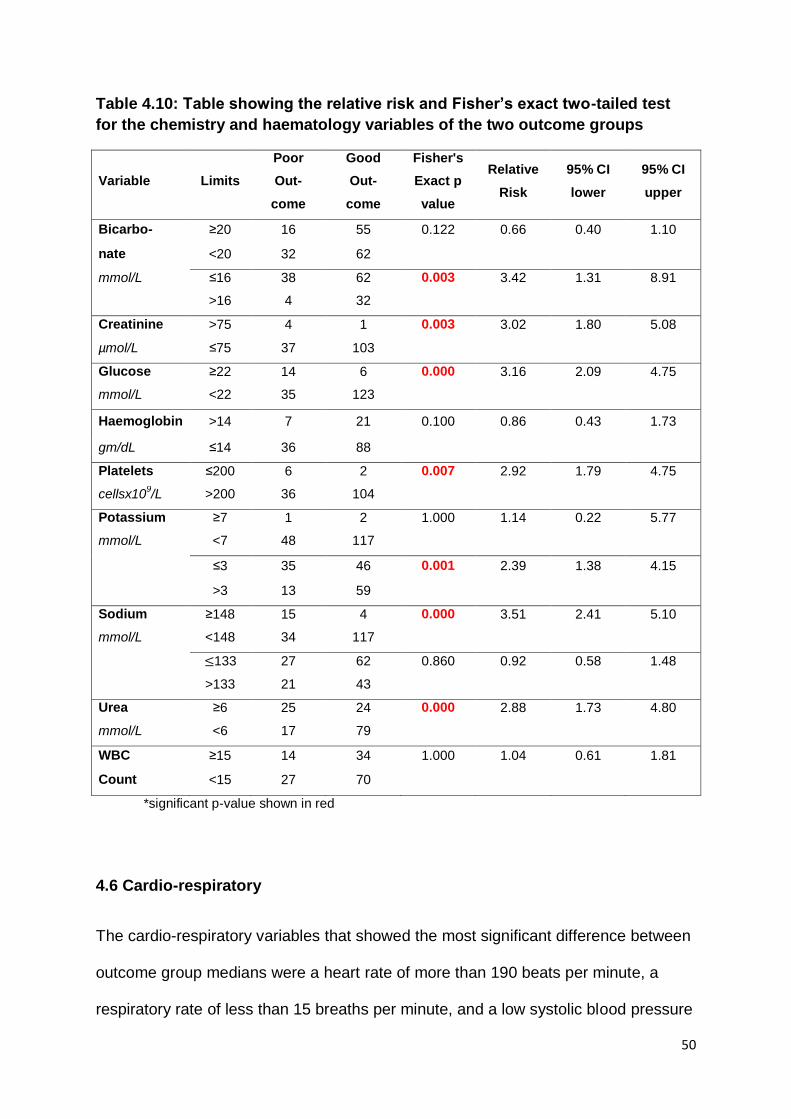
50
Table 4.10: Table showing the relative risk and Fisher’s exact two-tailed test
for the chemistry and haematology variables of the two outcome groups
Variable Limits
Poor
Out-
come
Good
Out-
come
Fisher's
Exact p
value
Relative
Risk
95% CI
lower
95% CI
upper
Bicarbo- ≥20 16 55 0.122 0.66 0.40 1.10
nate <20 32 62
mmol/L ≤16 38 62 0.003 3.42 1.31 8.91
>16 4 32
Creatinine >75 4 1 0.003 3.02 1.80 5.08
µmol/L ≤75 37 103
Glucose ≥22 14 6 0.000 3.16 2.09 4.75
mmol/L <22 35 123
Haemoglobin >14 7 21 0.100 0.86 0.43 1.73
gm/dL ≤14 36 88
Platelets ≤200 6 2 0.007 2.92 1.79 4.75
cellsx109/L >200 36 104
Potassium ≥7 1 2 1.000 1.14 0.22 5.77
mmol/L <7 48 117
≤3 35 46 0.001 2.39 1.38 4.15
>3 13 59
Sodium ≥148 15 4 0.000 3.51 2.41 5.10
mmol/L <148 34 117
≤133 27 62 0.860 0.92 0.58 1.48
>133 21 43
Urea ≥6 25 24 0.000 2.88 1.73 4.80
mmol/L <6 17 79
WBC ≥15 14 34 1.000 1.04 0.61 1.81
Count <15 27 70
*significant p-value shown in red
4.6 Cardio-respiratory
The cardio-respiratory variables that showed the most significant difference between
outcome group medians were a heart rate of more than 190 beats per minute, a
respiratory rate of less than 15 breaths per minute, and a low systolic blood pressure
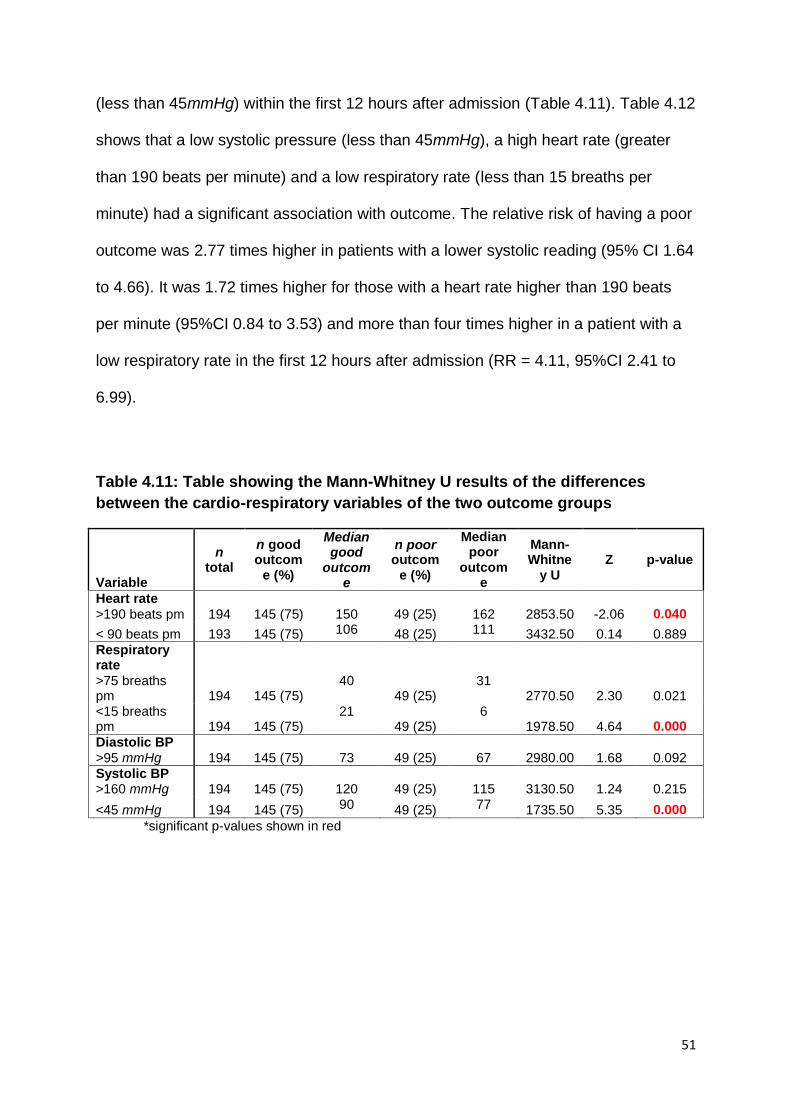
51
(less than 45mmHg) within the first 12 hours after admission (Table 4.11). Table 4.12
shows that a low systolic pressure (less than 45mmHg), a high heart rate (greater
than 190 beats per minute) and a low respiratory rate (less than 15 breaths per
minute) had a significant association with outcome. The relative risk of having a poor
outcome was 2.77 times higher in patients with a lower systolic reading (95% CI 1.64
to 4.66). It was 1.72 times higher for those with a heart rate higher than 190 beats
per minute (95%CI 0.84 to 3.53) and more than four times higher in a patient with a
low respiratory rate in the first 12 hours after admission (RR = 4.11, 95%CI 2.41 to
6.99).
Table 4.11: Table showing the Mann-Whitney U results of the differences
between the cardio-respiratory variables of the two outcome groups
Variable
n total
n good outcom
e (%)
Median good
outcome
n poor outcom
e (%)
Median poor
outcome
Mann-Whitne
y U Z p-value
Heart rate
>190 beats pm 194 145 (75)
150 49 (25)
162 2853.50 -2.06 0.040
< 90 beats pm 193 145 (75) 106 48 (25) 111 3432.50 0.14 0.889
Respiratory rate
>75 breaths pm 194 145 (75)
40 49 (25)
31 2770.50 2.30 0.021
<15 breaths pm 194 145 (75)
21 49 (25)
6 1978.50 4.64 0.000
Diastolic BP
>95 mmHg 194 145 (75)
73 49 (25)
67 2980.00 1.68 0.092
Systolic BP >160 mmHg 194 145 (75)
120 49 (25)
115 3130.50 1.24 0.215
<45 mmHg 194 145 (75) 90 49 (25) 77 1735.50 5.35 0.000
*significant p-values shown in red
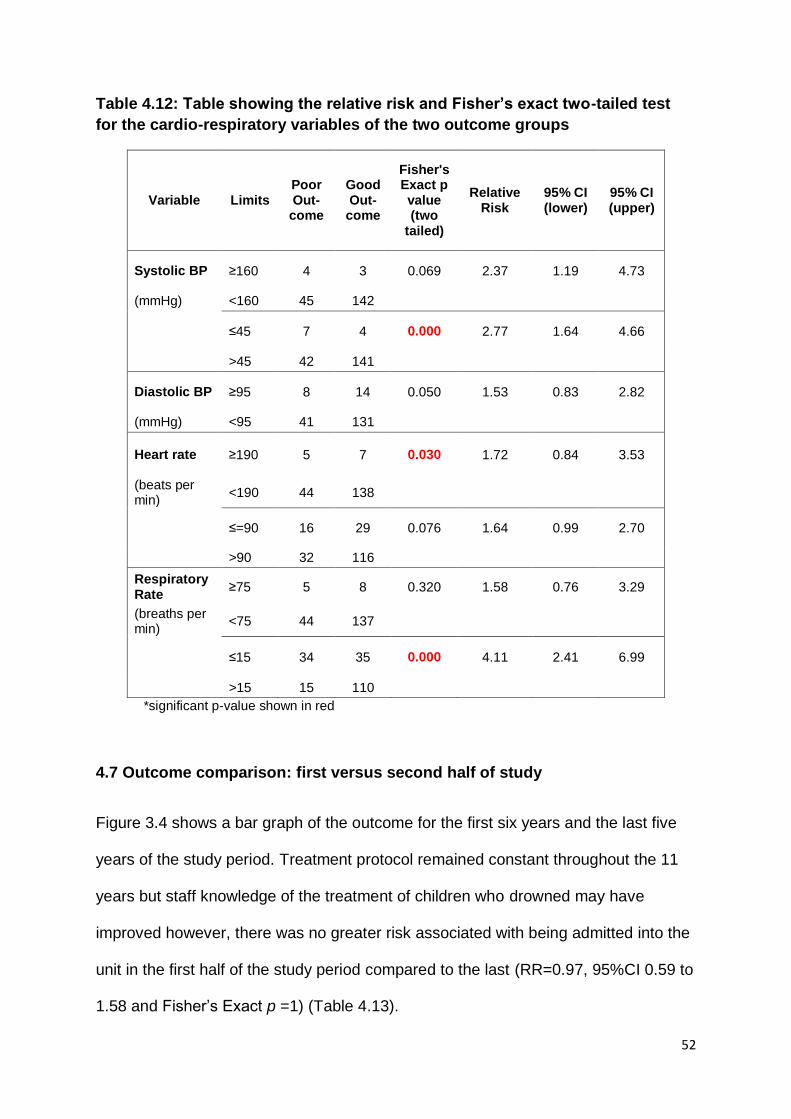
52
Table 4.12: Table showing the relative risk and Fisher’s exact two-tailed test
for the cardio-respiratory variables of the two outcome groups
Variable Limits Poor Out-
come
Good Out-
come
Fisher's Exact p value (two
tailed)
Relative Risk
95% CI (lower)
95% CI (upper)
Systolic BP ≥160 4 3 0.069 2.37 1.19 4.73
(mmHg) <160 45 142
≤45 7 4 0.000 2.77 1.64 4.66
>45 42 141
Diastolic BP ≥95 8 14 0.050 1.53 0.83 2.82
(mmHg) <95 41 131
Heart rate ≥190 5 7 0.030 1.72 0.84 3.53
(beats per min)
<190 44 138
≤=90 16 29 0.076 1.64 0.99 2.70
>90 32 116
Respiratory Rate
≥75 5 8 0.320 1.58 0.76 3.29
(breaths per min)
<75 44 137
≤15 34 35 0.000 4.11 2.41 6.99
>15 15 110
*significant p-value shown in red
4.7 Outcome comparison: first versus second half of study
Figure 3.4 shows a bar graph of the outcome for the first six years and the last five
years of the study period. Treatment protocol remained constant throughout the 11
years but staff knowledge of the treatment of children who drowned may have
improved however, there was no greater risk associated with being admitted into the
unit in the first half of the study period compared to the last (RR=0.97, 95%CI 0.59 to
1.58 and Fisher’s Exact p =1) (Table 4.13).
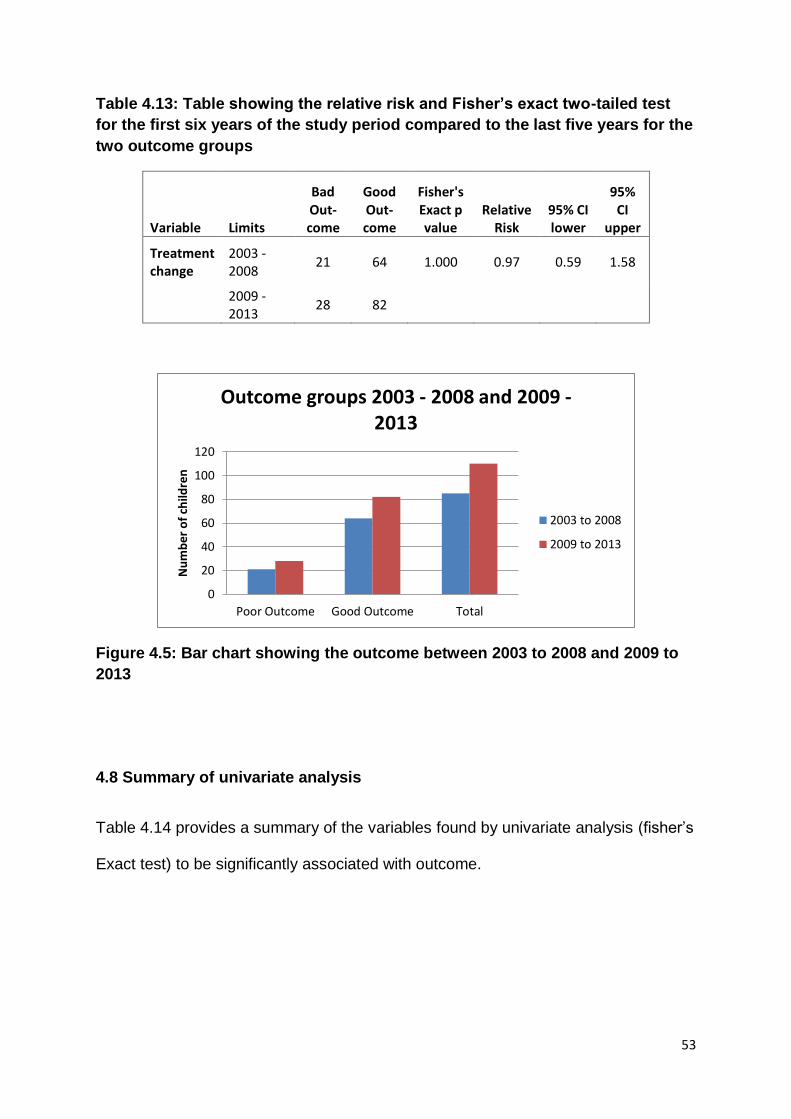
53
Table 4.13: Table showing the relative risk and Fisher’s exact two-tailed test
for the first six years of the study period compared to the last five years for the
two outcome groups
Variable Limits
Bad Out-come
Good Out-come
Fisher's Exact p value
Relative Risk
95% CI lower
95% CI
upper
Treatment change
2003 - 2008
21 64 1.000 0.97 0.59 1.58
2009 - 2013
28 82
Figure 4.5: Bar chart showing the outcome between 2003 to 2008 and 2009 to
2013
4.8 Summary of univariate analysis
Table 4.14 provides a summary of the variables found by univariate analysis (fisher’s
Exact test) to be significantly associated with outcome.
0
20
40
60
80
100
120
Poor Outcome Good Outcome Total
Nu
mb
er o
f ch
ildre
n
Outcome groups 2003 - 2008 and 2009 - 2013
2003 to 2008
2009 to 2013
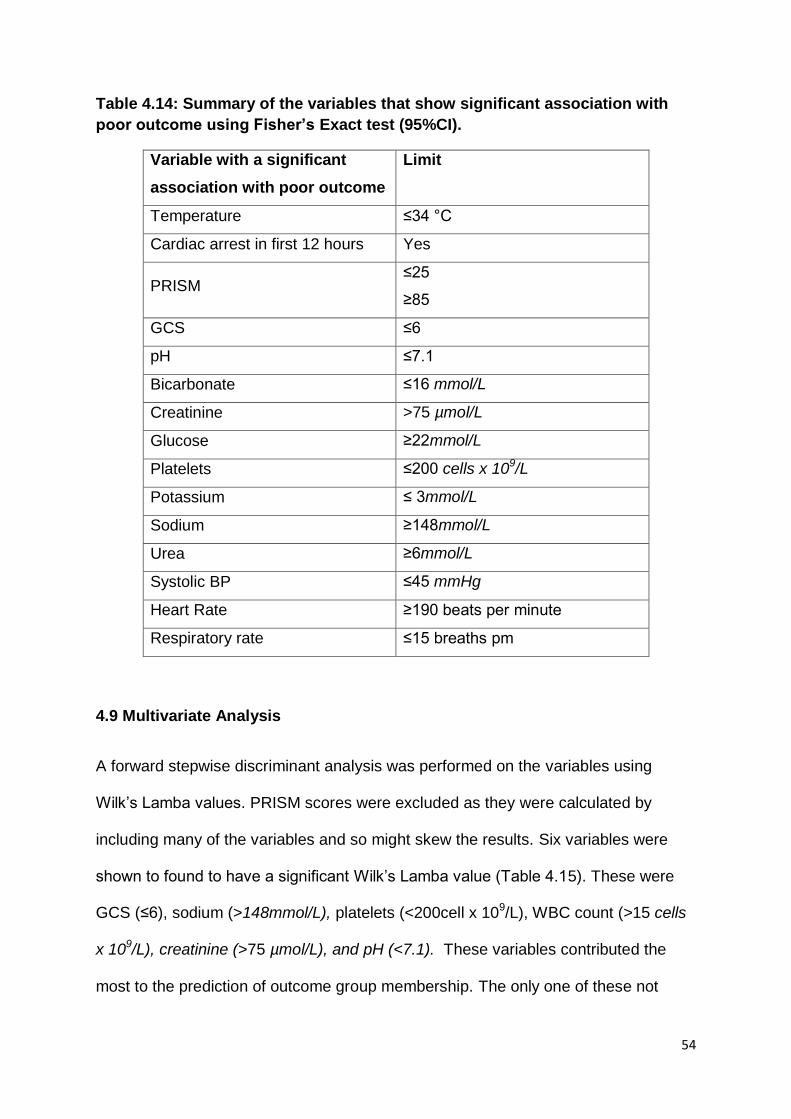
54
Table 4.14: Summary of the variables that show significant association with
poor outcome using Fisher’s Exact test (95%CI).
Variable with a significant
association with poor outcome
Limit
Temperature ≤34 °C
Cardiac arrest in first 12 hours Yes
PRISM ≤25
≥85
GCS ≤6
pH ≤7.1
Bicarbonate ≤16 mmol/L
Creatinine >75 µmol/L
Glucose ≥22mmol/L
Platelets ≤200 cells x 109/L
Potassium ≤ 3mmol/L
Sodium ≥148mmol/L
Urea ≥6mmol/L
Systolic BP ≤45 mmHg
Heart Rate ≥190 beats per minute
Respiratory rate ≤15 breaths pm
4.9 Multivariate Analysis
A forward stepwise discriminant analysis was performed on the variables using
Wilk’s Lamba values. PRISM scores were excluded as they were calculated by
including many of the variables and so might skew the results. Six variables were
shown to found to have a significant Wilk’s Lamba value (Table 4.15). These were
GCS (≤6), sodium (>148mmol/L), platelets (<200cell x 109/L), WBC count (>15 cells
x 109/L), creatinine (>75 µmol/L), and pH (<7.1). These variables contributed the
most to the prediction of outcome group membership. The only one of these not
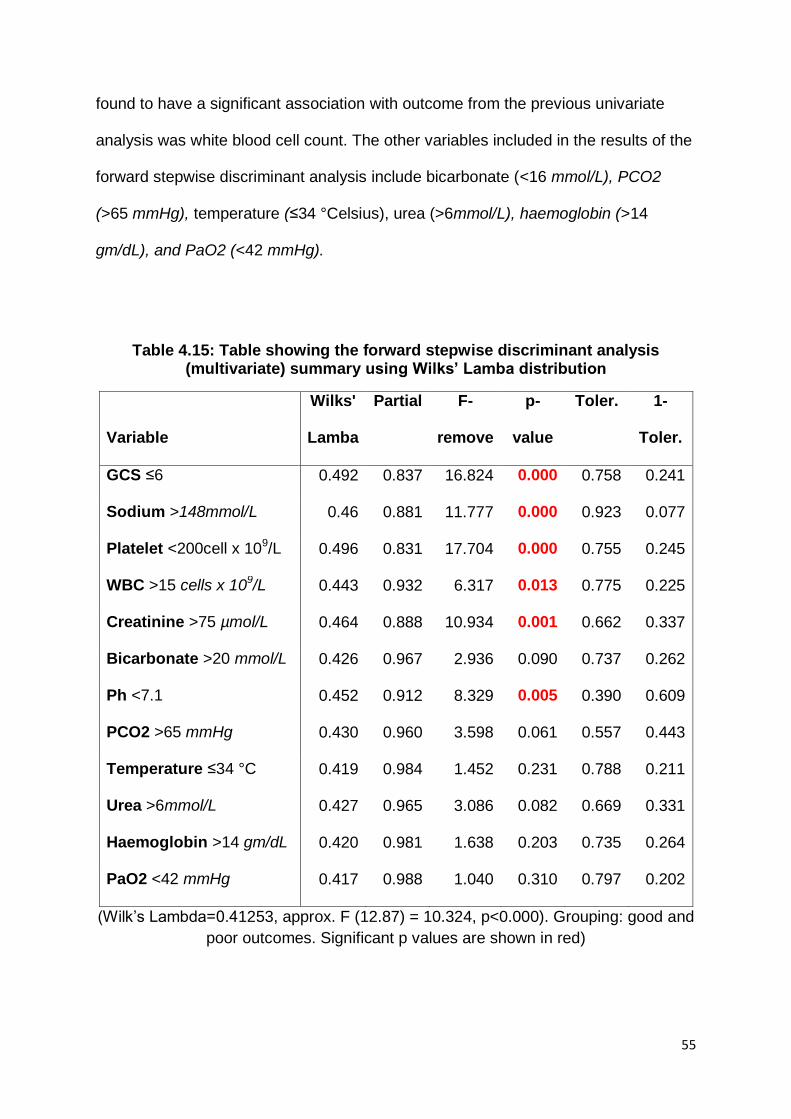
55
found to have a significant association with outcome from the previous univariate
analysis was white blood cell count. The other variables included in the results of the
forward stepwise discriminant analysis include bicarbonate (<16 mmol/L), PCO2
(>65 mmHg), temperature (≤34 °Celsius), urea (>6mmol/L), haemoglobin (>14
gm/dL), and PaO2 (<42 mmHg).
Table 4.15: Table showing the forward stepwise discriminant analysis (multivariate) summary using Wilks’ Lamba distribution
Variable
Wilks'
Lamba
Partial F-
remove
p-
value
Toler. 1-
Toler.
GCS ≤6 0.492 0.837 16.824 0.000 0.758 0.241
Sodium >148mmol/L 0.46 0.881 11.777 0.000 0.923 0.077
Platelet <200cell x 109/L 0.496 0.831 17.704 0.000 0.755 0.245
WBC >15 cells x 109/L 0.443 0.932 6.317 0.013 0.775 0.225
Creatinine >75 µmol/L 0.464 0.888 10.934 0.001 0.662 0.337
Bicarbonate >20 mmol/L 0.426 0.967 2.936 0.090 0.737 0.262
Ph <7.1 0.452 0.912 8.329 0.005 0.390 0.609
PCO2 >65 mmHg 0.430 0.960 3.598 0.061 0.557 0.443
Temperature ≤34 °C 0.419 0.984 1.452 0.231 0.788 0.211
Urea >6mmol/L 0.427 0.965 3.086 0.082 0.669 0.331
Haemoglobin >14 gm/dL 0.420 0.981 1.638 0.203 0.735 0.264
PaO2 <42 mmHg 0.417 0.988 1.040 0.310 0.797 0.202
(Wilk’s Lambda=0.41253, approx. F (12.87) = 10.324, p<0.000). Grouping: good and
poor outcomes. Significant p values are shown in red)
56
4.11 Conclusion
In conclusion, there were a total of 204 records of children who had drowned
between the years 2003 to 2013 and were admitted to the PICU analysed by this
study. One hundred and forty six (76%) children had a good neurological outcome,
however of the total population, 21 children (10.3%) died and 14.7% (n=28) were
discharged from PICU with a poor neurological outcome. There were twice as many
boys as girls in the study population and the majority of the children were under the
age of 36 months. Season did not significant affect outcome and it was found that
the outcome in the first half of the study was similar to the second half. Numerous
recorded variables, such as a low GCS score, high sodium levels and a low platelet
count, were found to be significantly associated with outcome. In the multivariate
analysis only six of theses (GCS less than three, sodium greater than 148mmol/L,
platelet count of less than 200cells x 109/L, white blood cell count of more than
15cells x 109/L, creatinine more than 75 µmol/L and a pH of less than 7.1) were
found to be significant.
57
CHAPTER 5: Discussion
Drowning is a significant but preventable public health problem however, there are
only a few studies looking at morbidity and mortality rates from paediatric intensive
care units in South Africa.
5.1 Population description
This study determined that there were 215 children admitted due to drowning into
one Johannesburg’s private hospital PICU over a period of eleven years (2003 to
2013). This is a rate of 19.55 children who drowned per year. Other South Africa
studies, all based at Cape Town’s Red Cross Children’s Hospital, showed rates of
between 9.7 and 12.5 drownings admitted per year however due to differing
inclusion criteria and management strategies, direct comparisons cannot be made.
(Nagel, Kibel and Beatty, 1990). The data shows that over half (63.7%, n=130) of the
cohort were transferred from other hospitals. In those patients that were transferred
from other hospitals, 71.7% were classified as having a good outcome on discharge
from the unit. There were 74 patients admitted directly into the hospital and of these,
80.2% (n=57) had a good outcome. This means that the patients admitted directly
into the unit had a slightly higher rate of good outcome compared to those
transferred from another hospital. Nagel, Kibel and Beatty (1990) found that the
patients referred from another hospital had nearly three and a half times greater risk
of poor outcome and they postulated that only the very severe cases were
transferred which would then increase the chance of a poor outcome.
58
5.2 Age
This study showed similar findings to the WHO (2014) report, and many other in-
hospital based studies, that the largest group of children affected by drowning is the
one to four year age group (Wallis, Watt, Franklin, et al., 2012; Joanknecht, Argent,
van Dijk, et al., 2015; Quan, Wentz, Gore, et al., 1990; Kibel, Nagel, Myers, et al.,
1990). Of the current study’s population, 76.5% were three years of age and
younger. Children of this age are mobile but unaware of potential hazards or dangers
in their environment. Often the caregiver is also unaware of the danger posed by
open bodies of water, such as swimming pools, and fails to maintain the proper
supervision necessary to prevent accidents from occurring. Swimming pools are
often not fenced in and safely precautions, such as pool nets and pool alarms, are
not installed. Developmentally, toddlers may also use buckets to pull to stand and,
as discussed in Chapter 2, can fall in head first due to their high centre of gravity
(Burford et al., 2005). While not as common, drowning in this age group could also
be due to non-accidental injury and each case should be investigated, for neglect
and for physical abuse.
There was no significant association found between outcome and age which was
similarly found in a number of other studies (Nagel, Kibel and Beatty, 1990; Quan,
Wentz, Gore, et al., 1990; Graf, Cummings, Quan, et al., 1995; Christensen, Jansen
and Perkin, 1997). While the age of the child does not impact discharge outcome, it
may be an important factor in the long term neurological outcome of the drowning
victim. The opposing brain plasticity versus vulnerability theories are pertinent when
considering the long-term outcome of drowning victims. As found in many other
59
studies, and indeed in this study, the majority of children that drown fall under the
five year age group (Wallis, Watt, Franklin, et al., 2012; Joanknecht, Argent, van
Dijk, et al., 2015; Quan, Wentz, Gore, et al., 1990; Kibel, Nagel, Myers, et al., 1990).
Drowning causes hypoxic ischaemic brain injury which is a diffuse cerebral
pathology. If brain vulnerability theorists are correct, then, due to these factors,
children who have drowned are at high risk of long-term neurocognitive sequelae.
Further long-term follow-up studies are needed to investigate these ideas.
5.3 Gender
Males are twice as likely to drown as females and a review of the literature shows
that males make up about 70% of children who drown (Gonzalez-Luis, Pons,
Cambra, et al., 2001). In this study, there were predominantly more males than
females (ratio 2.6:1). However, there was no significant association between male
gender and poor outcome in this study. The majority of studies found similar results
(Christensen, Jansen and Perkin, 1997; Nagel, Kibel and Beatty, 1990). One study
however, Graf, Cummings, Quan, et al., (1995) found a strong association between
male sex and poor outcome. They, however, questioned this result as it did not
compare to the majority of other studies and postulated that males may have worse
outcomes post drowning in their study due to a number of factors such as they
“sustain greater injuries, are more susceptible to hypoxia, are less responsive to
treatment or may receive less beneficial treatment” (Graf, Cummings, Quan, et al.,
1995).
60
It is interesting to note that research on childhood injuries has found that boys have a
higher rate of injuries when compared to girls (Pretorius and van Niekerk, 2014). A
study looking at the South African National Injury Mortality Surveillance System
determined that the majority of childhood injuries (65.6%) occur in boys (Pretorius
and van Niekerk, 2014). This may be due to a tendency of boys to be more physical
and act more impulsively than girls. Girls may also be viewed as less robust than
boys and be more carefully monitored. This may explain the higher number of boys
being involved in drowning incidents than girls.
5.4 Outcome
Existing research into outcomes post drowning shows a wide range of survival rates
of between ten to 86% (DeBoer, 1997; Macnab, 1995; Habib, Tecklenburg, Webb, et
al., 1996; Pearn, et al., 1979). This wide range may be due to a large number of
factors inherent in each study such as cohort definitions, environment, bystander
CPR, availability of advanced paediatric life care support, hospital resources and
treatment techniques, thus making it difficult to compare studies. In this study, over
71 percent (71.6%, n= 146) were discharged from PICU neurologically intact post
drowning. The mortality rate of the study was 10.3%. In the literature, studies show
that there is a variable mortality rate of between five and 73% (DeBoer, 1997;
Macnab, 1995; Habib, Tecklenburg, Webb, et al., 1996; Pearn, et al., 1979).
A quarter of this study cohort was found to have a poor outcome (24%, n=49). Of
these, 28 were found to have some degree of neurological impairment. When
61
compared to the total study population, this 13.7%. Other studies have found a range
from five to 25% in children who have drowned. A recent South African study from
Cape Town’s Red Cross Children’s hospital showed an 84% intact neurological
survival rate and only a 5.3% rate of neurological impairment (Joanknecht, Argent,
van Dijk, et al., 2015). This differs from the current study (the survival rate is lower
and the neurological impairment rate is higher) but no direct comparisons can be
made as the differences may be due to the study inclusion criteria, different methods
used across studies to determine neurological impairment, the interventions used,
and the type of patient that is accepted for admission into the hospital.
5.5 Predictors of outcome
There is no one single, nor any multiple group of factors, that can specifically and
accurately determine outcome in children post drowning. The complex interplay of
environment, genetics, interventions and resources which impact on the final
outcome result in a different set of factors being significant in different settings. In
this study 15 factors were identified that were associated with outcome.
Genetics has recently become the focus point of much new research with regards to
outcome after injury or illness. Patients with similar injuries/diseases and medical
management show varying outcome results and it has been shown that genes such
as tumour necrosis factor (TNF-α) and interleukins (IL-1β and IL-6) have a role in
outcome of patients with neurotrauma and acute lung disease (Dardiotis, Grigoriadis,
and Hadijgeorgious, 2012; Giannoudis, van Griensven, Tsiridis, et al., 2007). This
62
has not been studied further in drowning victims but it should be considered when
discussing outcome factors and future areas of research.
Some studies suggest that up to 40 percent of comatose patients in the ER can have
a normal outcome but on arrival in PICU, coma has been found to significantly
increase the risk of poor outcome (Habib, Tecklenburg, Webb, et al., 1996). Duration
and severity of a drowning event causes an increased risk of hypoxic ischaemic
brain injury (Topjian, Berg, Bierans, et al., 2012). Therefore patients with more
severe drowning events would have poor neurologic signs such as low GCS scores
(Nagel, Kibel and Beatty, 1990; Graf, Cummings, Quan, et al., 1995). This was
similarly found in this study population as children with a GCS of six or less had over
43 times greater risk of poor outcome than those with a higher score however with
wide a confidence interval (RR= 43.72, 95% CI 6.15 to 310.42). By using multivariate
analysis, GCS was found to be the one of the variables that contribute most to
outcome prediction. In a thirty month follow-up study of children with TBI’s, severity
of injury was measured by GCS scores and it was found low scores were related to
poor recovery and poor long-term outcome (Anderson, Morse and Catroppa, 2004).
In this study, patients who had cardiac arrest before or after admission to PICU were
significantly more likely to die or have neurological sequelae. In a South Carolina
study, haemodynamic status on arrival to the ER was highly predictive of outcome
(Habib, Tecklenburg, Webb, et al., 1996).Those patients who were asystolic in the
ER had a significantly worse outcome.
63
Quan, Wentz, Gore, et al. (1990) showed an increased number of children with a
poor neurological outcome (but not mortality) in the second half of their study when
compare to the first. They postulated that this may be due to a “tendency to prolong
resuscitation efforts”. However, Kieboom, Verkade, Burgerhof, et al. (2015) reported
no change in treatment outcomes between the first five years and last five years.
According Spack, Gediet, Splaingard et al., (1997) aggressive PICU protocols have
been shown to have no positive effect on outcome in many studies. This study
showed no increased risk for poor outcome between the first six years and the last
five years of the study period. The unit implemented the same treatment protocol
throughout the treatment period (including therapeutic hypothermia and ICP
monitoring) so the results should not reflect any change in treatment. It might be
postulated that there would be an increase in nursing and therapy staff knowledge
about the treatment of these patients during this time, but as the results show this is
not true as there was no significance difference in the outcome between the two
halves of the study.
High blood glucose was also shown to be a significant indicator of outcome in this
study. This study showed a 3.16 times increased risk of poor outcome if blood
glucose was more than 22mmol/L. In Graf, Cummings, Quan, et al. (1995) high initial
blood glucose was a strong indicator of poor outcome. In children with head injuries,
blood glucose is an important prognostic factor (Chiaretti, De Benedict, Langer et al.,
1998). Hyperglycaemia occurs as a normal stress response. In adults with TBI, it has
been shown that hyperglycaemia increases toxic metabolites which when worsen the
64
ischaemic damage to the brain through cerebral lactic acidosis (Chiaretti, De
Benedict, Langer et al., 1998).
High blood urea nitrogen levels were found to have a significant effect on outcome
(Linder, Funk, Schwarz, et al., 2007). Blood urea concentrations may be elevated
due to decreased blood flow to the kidneys which can be caused by shock, stress, or
myocardial infarction. It is likely that those patients who have a serious drowning
incident and require vigorous resuscitation will go into shock which may explain this
study’s findings of significantly increased urea levels.
The Pediatric Risk of Mortality (PRISM, version III) was developed to predict ICU
survival or mortality and it derives mortality risk from the amount and extent of
observed physiological dysfunction (Zuckerman, Gregory and Santos-Damiani,
1998). Studies show it can be used for children who have drowned (Gonzalez-Luis,
Pons, Cambra, et al., 2001). Spack, Gedeit, Splaingard, et al. (1997) concluded that
a PRISM score above 20 was an indicator of poor prognosis. In this study PRISM
score below 25 and above 85 were shown to be significantly associated with
outcome. With just a four percent chance of poor outcome with a score of equal or
less than 25 but a 9.23 times risk of poor outcome when given a score of more than
or equal to 85, PRISM provides a good indicator of the outcome in this cohort.
Caution must be taken when analysing the PRISM score as nine of the 45 children
who had a PRISM score over 80 (which would predict a poor outcome), survived
neurologically intact while two of the children with a score of less than 25 were
discharged with a poor outcome. Again the interplay of the many complex factors
65
that occur in children who have drowned are relevant. There is no tool that is specific
and accurate enough to determine which children may have a poor outcome and so
it is important to give every child a chance at survival with aggressive treatment, no
matter what their PRISM score.
Previous research has shown that patients arriving at the ER with hypothermia
usually have worse outcomes (Graf, Cummings, Quan, et al., 1995) while others
show no association between temperature and outcome (Quan, Wentz, Gore, et al.,
1990; Christensen, Jansen and Perkin, 1997). This may be due to two different
factors: either the temperature of the water in which submersion occurred was very
low, thereby quickly cooling the patient, even if time submerged was short. Secondly,
the water temperature was temperate and so it would be necessary for the patient to
be submerged for a long period of time to have become hypothermic. Most incidents
of drowning occur in summer and in this study cohort, nearly 50% of the drowning
events happened in the summer months of November to February. Studies have
produced conflicting results as to whether winter drowning increases the chance of
having a good outcome. In Kieboom, Verkade, Burgerhof, et al. (2015) season was
strongly indicative of outcome, with those children who drowned in winter having a
better outcome due to quick cooling in icy waters. In this study, the season or time of
year (and therefore water temperature) the child drowned has no significant
association with poor outcome. However hypothermia was a strongly significant
indicator of poor outcome. This may be due to Johannesburg’s temperate climate.
Winter temperatures seldom go below 0°C, so submersion in icy-cold water is
unusual (Nagel, Kibel and Beatty, 1990). Studies suggest that good outcome is
unlikely if submerged in waters warmer than six degrees Celsius for more than 30
66
minutes (Tipton and Golden, 2011). Therefore, in South Africa, to become
hypothermic, a patient must have been submerged for a prolonged period of time
(Quan, Wentz, Gore, et al., 1990; Joanknecht, Argent, van Dijk, et al., 2015).
Increased time submerged is an indicator of poor outcome (Burford et al., 2005;
Kieboom, Verkade, Burgerhof, et al., 2015).
When a multivariate stepwise discriminant analysis was performed, 12 of the
variables were found to contribute to the prediction of outcome of the children (Table
4.14). Half of these were found to be significant and included GCS (<=6), sodium
(>148mmol/L), platelets (<200cell x 109/L), WBC count (>15 cells x 109/L), creatinine
(>75 µmol/L), and pH (<7.1). Hasper, von Haehling, Storm, et al. (2009) reports after
cardiac arrest (and with it, consequences of “global ischemia perfusion”), patients
with poor outcomes tend to have high creatinine levels within the first 24 hours after
an arrest. In this study, high levels of creatinine were found to be a predictor of
outcome. Future research should maybe look into this relationship between
creatinine levels and cardiac arrest in this cohort further.
This study showed that low platelet levels are significantly associated with outcome
in both univariate and multivariate analysis. Thrombocytopenia is commonly found in
the ICU patient and can be due to numerous causes such as platelet consumption,
destruction, production and sequestration (Greinacher, and Selleng, 2010). Most
probable cause of thrombocytopenia in the drowning patient in the first 12 hours
would haemodilution due to infusion of fluids. Studies frequently show that a low
platelet count is often associated with increased length of stay on hospital, and
67
increased risk of morbidity and mortality (Greinacher, and Selleng, 2010).
Interestingly, Mallet (2012) found that thrombocytopenia can result from accidental
hypothermia. As discussed above, for South African patients to be hypothermic in
the PICU, they had to undergo a prolonged submersion so this may be another
factor to consider for the cause of thrombocytopenia.
One of the primary issues associated with drowning, is pulmonary related
complications (Burford et al., 2005). All acid-base/blood gas parameters (PaO2,
PCO2, and pH) showed significant differences in the medians between the good and
poor outcome groups. However, only pH showed a significant difference with
Fisher’s exact test and was found to significantly contribute to the prediction of
outcome with multivariate analysis. Bronchospasm, aspiration and atelectasis will
lead to progressive hypoxia and acidosis which will lead to a worse prognosis
(Zuckerman and Saladino, 2005). The current study showed that there was a
significant risk of poor outcome when bicarbonate was lower than 16mmol/l and
when there was an acidosis present (pH of less than seven). During the drowning
even, breath holding, laryngospasm and aspiration cause hypoxia and resulting
mixed respiratory-metabolic acidosis. If there is hypothermia present, this will cause
further hypoventilation, increasing the hypoxia. Studies show that on arrival to the
ER, nearly 70% of all drowning patients present with an acidosis and often show a
combined respiratory and metabolic acidosis caused by hypercapnia and anaerobic
metabolism (Szpilman, Bierans, Handley, et al., 2012). A pH of less than seven
showed a significant association with poor outcome in this study. This is similar to
previous research which shows severe acidosis to have a strong association with
poor outcome (Joanknecht, Argent, van Dijk, et al., 2015; Kieboom, Verkade,
68
Burgerhof, et al., 2015). In Nagel, Kibel and Beatty (1990), patients with acidosis had
a six times greater risk of poor outcome.
Hypernatremia and hypokalaemia were found to be significantly associated with poor
outcome in this study, high sodium levels being one of the variables that contribute
most to the prediction of outcome in multivariate analysis. Hypernatremia is
commonly found in hospitalised patients and those in ICU and is often caused by
inappropriate isotonic fluid therapy (Aiyagari, Deibert, Diringer, et al, 2006).
Oehmichen, Hennig and Meissner (2008) showed that nearly 48% of drowning
victims who died had decreased potassium levels. It has also been found that
hypothermia may cause an intracellular shift of potassium, resulting in hypokalaemia
(Schubert, 1995). Patients with high levels of sodium were also found to have a
significantly worse outcome than those with levels below 148mmol/l. To maintain
fluid status during resuscitation, a patient may be given sodium bicarbonate, which
may affect the blood sodium levels (Aiyagari, Deibert, Diringer, et al, 2006).
Hypernatremia may indicate those patients who experienced a drowning even that
was more severe or prolonged than others as they required more intensive
resuscitation. Another cause of hypernatremia is the normal saline used to dilute
parenteral drugs and to maintain patent catheters in the ER and the ICU (Choo,
Groeneveldt, Driessan, et al., 2014). Previous studies have found that hypernatremia
is an independent risk factor for mortality in ICU but the underlying reason for this
remains to be identified (Lindner, G., Funk, G., Schwarz, et al., 2007).
69
A high white blood cell count was found, by multivariate analysis, to be a contributing
factor in the outcome of this study population. According to Hildebrand, Pape and
van Griensven (2005), an increased or exaggerated inflammatory response after
trauma is a recognised physiological occurrence and this is what predisposed the
patient to post traumatic complications and increases the chance of a poor outcome.
The inflammatory system has been shown to alter within hours after trauma
(Giannoudis, van Griensven, Tsiridis, et al., 2007).This inflammatory response is
governed by certain genes responsible for the inflammatory cascade. This is only
recently being researched and there are still many unidentified genes that could play
a role in this response.
5.6 Study Limitations and future research opportunities
This study had the limitations inherent in any retrospective record review, such as
incomplete or missing records, observer bias in outcome reporting and inaccurate
recording. The limits imposed on each of the variables were focussed on a certain
age range and as such may have overestimated or under estimated the number of
patients in outcome groups. In future studies, it may be beneficial to stratify
according to age group and then classify into groups. The PICUE program only
records physiological variables in the first 12 hours after admission and discharge
outcome. It does not record environmental factors (such as temperature of what),
drowning incident factors (how long the child was submerged for, how long CPR
lasted) and it does not record the therapeutic interventions that the child was given
during the hospital stay (such as physiotherapy or speech therapy). These factors
70
are have all been shown to be important as outcome measures and a future
prospective study could look at these factors in this unit.
The patient’s outcome was recorded at discharge by the discharging doctor using
the POPC. While this measure classifies the outcome into six different categories, it
is lacking in detail and the patients should have a long term follow-up to determine
their true neurological outcome. As discussed previously, brain vulnerability puts
these children at high risk for long-term impairments. An area of future research on
this study population could investigate the neurological, motor, and behavioural
outcomes of the children that survived drowning using a comprehensive
neurodevelopmental assessment tool. No formal assessment tool for children who
have drowned is available which limits the impact these studies have when
comparing populations It would be interesting to see if those discharged with a
POPC of one (no neurological impairments) had any long-term repercussions from
their drowning such as attention deficit hyperactivity disorder (ADHD), fine motor
impairments or reading difficulties. Suominen and Vähätalo (2012) reviewed the
literature and concluded that a gross neurological examination at discharge is
insufficient to determine all the long term sequelae post drowning. This lack of long-
term follow-up means that morbidity from the current study could have been
underestimated.
The study records were obtained from a private hospital only and did not include
data from government hospitals in the province. It would therefore include only those
patients on a medical aid or very affluent families that could afford to pay upfront for
71
private medical care. However, it has also been reported that aggressive treatment
techniques (such as would be available in a private hospital due to increased
resources) may have no impact outcome (Spack, Gedeit, Splaingard, et al., 1997).
However, further research could expand the record review to nearby hospitals in the
province and compare the results between private and government facilities as well
as treatment protocols. As this was a PICU hospital based study, patients who died
while being transported to the hospital and in the ER were not included in the
mortality rate. The PICUE programme does not include those children who died less
than two hours after admission into the PICU so again, mortality rates may be higher
than recorded. A further limitation is that the full intervention received by the patient
(such as physiotherapy) is not recorded in the PICUE database. These interventions
may have an impact on the outcome of these patients and future research should
look into this further.
The children who drown and survive with neurologic impairment, present a huge
financial, emotional and personal cost to the child’s family and an increased social
and medical burden (Christensen, Jansen and Perkin, 1997).These factors were not
investigated in this study and should be included in any future research into this
population. It may confront the ethical question as to the limits of resuscitation
interventions.
72
CHAPTER 6: Conclusion
The main conclusions that can be drawn from this study, are that this cohort from a
Johannesburg private hospital PICU closely resemble worldwide norms. There were
a total of 215 children admitted due to drowning between 2003 to 2013 with 71.6%
children (n= 146) discharged from PICU neurologically intact. Poor outcome, either
death or neurological impairment, occurred in 49.24% of the population. This study
showed similar findings to the WHO (2014) report, and many other in-hospital based
studies, that the largest group of children affected by drowning is the one to four year
age group and there were predominantly more males than females (ratio 2.6:1). In
agreement with previous research, age, sex, and time of year have no significant
impact on neurological outcome. Of the physiological variables analysed, 15 showed
significate associations with outcome. When a multivariate analysis was utilised, low
GCS scores, hypernatremia, and low pH levels as well as high white blood cell count
were found to be significant predictors of outcome. Low platelets and high creatinine
levels were also found to have a significant to outcome which has not been reported
in previous hospital based studies.
Due to the localised nature of the study, the clinical significance is mainly to the unit
in which the study was completed. The variables that have a show a relationship with
outcome can be re-examine with new patients. The PRISM score, which is currently
being used, has been shown to have a significant relationship with outcome however
it is not completely accurate and some misclassification of children can result. A
more sensitive tool still needs to be developed. Future research should include a
73
long-term follow-up on the children discharged from the unit with thorough
neurological, motor and cognitive assessment.
No one factor could predict, with acceptable accuracy, the outcome of all patients.
There is a complex interplay of many factors and so all drowning victims should
receive aggressive resuscitation and treatment on arrival at the ER, regardless of
previous history or current presentation. However, preventing drowning is the first
step. Similarly to other studies form around the world, this study showed the age
group at highest risk of drowning in children is the one to four years. Thus, extensive
public health education to prevent drowning (such as bystander CPR, education
about supervision of children around bodies of water and the importance barriers
around swimming pools) should be aimed, especially in the summer months, when
there is an increase in the incidences of children being admitted due to drowning.
74
CHAPTER 7: References
1. Abrams, R.A. and Mubarak, S. (1991) Musculoskeletal consequences of near-
drowning in children. Journal of pediatric orthopaedics 11: 168 – 175
2. Aiyagari, V., Deibert, E., Diringer, M.N. et al (2006) Hypernatremia in the
neurological intensive care unit: how high is too high? Journal of Critical Care
21(2): 163 - 172
3. Anderson, V.A., Morse, S., and Catroppa, C., (2004) Thirty month outcome
from early childhood head injury: a prospective analysis of neurobehavioural
recovery. Brain 127: 2608 - 2620
4. Anderson, V.A., Spencer-Smith, M.M., and Coleman, L. (2014) Predicting
neurocognitive and behavioural outcome after early brain insult. Dev medicine
and child neurology 56: 329 - 336
5. Bell, T.S., Ellenberg, L., and McComb, J.G. (1985) Neuropsychological
outcome after severe pediatric near-drowning. Neurosurgery 17(4): 604 - 608
6. Burford, A.E., Ryan, L.M., Stone, B.J., et al., (2005) Drowning and near
drowning in children and adolescents. Pediatric Emergency Care, 21(9): 610
– 619
7. Chiaretti, A., De Benedict, R., Langer, A., et al. (1998) Prognostic implications
of hyperglycaemia in paediatric head injury. Child’s Nervous System 14: 455 –
459
8. Choo, W., Groeneveldt, A.B.J., Driessan, R.H., et al. (2014) Normal saline to
dilute parental drugs and to keep catheters open is a major and preventable
source of hypernatremia acquired in the intensive care unit. Journal of Critical
Care 29: 390 – 394
75
9. Christensen, D.W., Jansen, P., and Perkin, R.M. (1997) Outcome and acute
care costs after warm water drowning in children. Pediatrics, 99(5): 715 – 721
10. Dardiotis, E., Grigoriadis, S., and Hadijgeorgious, G.M. (2012) Genetic factors
influencing outcome from neurotrauma. Current opinions in Psychiatry 25: 231
– 238
11. Davis, S. and Smith, L.S. (1985) The epidemiology of drowning in Cape
Town: 1980 – 1983. S Afr Med J 68: 739 - 742
12. DeBoer, S.L. (1997) Neurologic outcomes after near-drowning. Critical care
nurse 17(4): 19 – 25
13. Donson, H., and Van Niekerk, A. (2012) Unintentional drowning in urban
South Africa: a retrospective investigation, 2001 – 2005. Int J Inj Contr Saf
Promot 20(3): 218 – 226
14. Flores, C., Pino-Tanes, M.M., Casula, M., et al. (2010) Genetics of acute lung
injury: past, present, future. Minerva Anestiol 76: 860 - 864
15. Giannoudis, P.V., van Griensven, M., Tsiridis, E., et al. (2007) The genetic
predisposition to adverse outcome after trauma. Journal of bone and joint
surgery 89b(10): 1273 - 1279
16. Giza, C.C. and Prins, M.L. (2006) Is being plastic fantastic? Mechanisms of
altered plasticity after developmental traumatic brain injury. Dev Neurosci
28(0): 364 – 379
17. Gonzalez-Luis, G., Pons, M., Cambra, F.J., et al. (2001) Use of the Pediatric
Risk of Mortality Score as a predictor of death and serious neurological
damage in children after submersion. Pediatric Emergency Care 17(6): 405 –
409
76
18. Gosseries, O, Bruno, M., Chatelle, C., et al. (2011) Disorders of
consciousness: What’s in a name? Neurorehabilitation 28: 3 – 14
19. Graf, W.D., Cummings, P., Quan, L., et al. (1995) Predicting outcome in
pediatric submersion victims. Annals of Emergency Medicine 26(3): 312 – 319
20. Greinacher, A. and Selleng, K (2010) Thrombocytopenia in the intensive care
unit patient. Haemotology 2010: 135 - 143
21. Habib, D.M., Tecklenburg, F.W., Webb, S.A., et al. (1996) Prediction of
childhood drowning and near-drowning morbidity and mortality. Pediatric
Emergency care 12 (4): 255 – 258
22. Hasper, D., von Haehling, S., Storm, C., et al. (2009) Changes in serum
creatinine in the first 24 hours after cardiac arrest indicate prognosis: an
observational cohort study. Critical Care 13: R168
23. Haupt, W.F., Hansen, H.C, Janzen, R.W.C., et al. (2015) Coma and cerebral
imaging. Springer Plus 4: 180 - 191
24. Hildebrand, F., Pape, H., van Griensven et al (2005) Genetic predisposition
for a compromised immune system after multiple trauma. Shock 24(6): 518 -
522
25. Idris, A.H., Berg, R.A., Bierans, J. et al. (2003) Recommended guidelines for
the uniform reporting of data from drowning. Circulation 108: 2565 - 2574
26. Joanknecht, L., Argent, A.C., van Dijk, M. et al. (2015) Childhood drowning in
South Africa: local data should inform prevention strategies. Pediatric Surgery
International 31: 123 – 130
27. Kemp, A.M., and Sibert, J.R. (1991) Outcome in children who nearly drown: a
British Isles study. BMJ 302: 931- 933
77
28. Kibel, S.M., Nagel F.O., Myers J., et al. (1990) Childhood near-drowning – a
12 year retrospective review. S Afr Med J 78: 418 – 421
29. Kieboom, J.K., Verkade, H.J., Burgerhof, J.G., et al. (2015) Outcome after
resuscitation beyond 30 minutes in drowned children with cardiac arrest and
hypothermia: Dutch nationwide retrospective cohort study. BMJ 350: h418
30. Koo, E.H., Boxerman, J.L., and Murphy, M.A. (2001) Cortical blindness
following a near-drowning incident. Journal of Neuro-Ophthalmology 31: 347 –
349
31. Layon, A.J. and Modell, J.H. (2009) Drowning: update 2009. Anesthesiology
110: 1390 - 1401
32. Lieh-Lai, M.W., Sarnaik, A.A., and Sarnaik, A.P. (2011) Drowning in Pediatric
Critical Care, editors Fuhrman, B.P. and Zimmerman, J.J. Mosby (Elesivier
Inc.)
33. Lin, C., Wang, Y, Lu, T., et al. (2014) Unintentional drowning mortality, by age
and body of water: an analysis of 60 countries. Injury Prevention Online:
10.1136/injuryprev-2013-041110
34. Lindner, G., Funk, G., Schwarz, C., et al. (2007) Hypernatremia in the critically
ill is an independent risk factor for mortality. Am J Kidney Dis 50: 952 – 957
35. Macnab, J. (1995) Effective interventions for nearly drowned children.
Canadian Family Physician 41: 1545 – 1556
36. Maconochie, I. (2015) Resuscitation of drowned children. BMJ 350:h535
37. Mallet, M.L. (2002) Review: pathophysiology of accidental hypothermia. Q J
Med 95: 775 – 785
38. Moon, R.E. and Long, R.J. (2002) Drowning and near-drowning. Emergency
medicine 14: 377 – 386
78
39. Nagel, F.O., Kibel, S.M., and Beatty, D.W. (1990) Childhood near-drowning –
factors associated with poor outcome. South African Medical Journal 78:422 –
425
40. Oehmichen, M., Hennig, R., and Meissner, C. (2008) Near-drowning and
clinical laboratory changes. Legal Medicine 10: 1-5
41. Pearn, J.H., Bart, R., and Yamaoka, R. (1979) Neurologic sequelae after
childhood near-drowning: a total population study from Hawaii. Pediatrics
64(2): 187 - 191
42. Pierro, M.M., Bollea, L., Di Rosa, G., et al. (2005) Anoxic brain injury following
near-drowning in children. Rehabilitation outcome: three case reports. Brain
Injury 19(13): 1147 - 1155
43. Pollack, M.M., Patel, K.M., and Ruttiman, U.E. (1997) The pediatric risk of
mortality – acute physiological score (PRISM III-APS): A method of assessing
physiologic instability for pediatric intensive care unit patients. Journal of
Pediatrics 131: 575 – 581
44. Pretorius, K. and Van Niekerk, A. (2014) Childhood psychosocial
development and fatal injuries in Gauteng, Johannesburg. Child: 41(1): 35 –
44
45. Pryor J.A. and Prasad, S.A. (2002) Appendix: normal values and
abbreviations (p619) in Physiotherapy for respiratory and cardiac problems
(3rd edition) Churchill Livingstone
46. Quan, L., Mack, C.D., and Schiff, M.A. (2014) Association of water
temperature and submersion duration and drowning outcome. Resuscitation
85: 790 – 794
79
47. Quan, L., Wentz, K.R., Gore, E.J., et al. (1990) Outcome and predictors of
outcome in pediatric submersion victims receiving prehospital care in King
County, Washington. Pediatrics 86(4): 586 – 593
48. Ross, F.I., Elliot, E.J., Lam, L.T., et al. (2003) Children under 5 years
presenting to paediatricians with near-drowning. J Paediatr Child Health 39:
446 – 450
49. Salomez, F. and Vincent, J. (2004) Drowning: a review of epidemiology,
pathophysiology, treatment and prevention. Resuscitation 63: 261 – 268
50. Schubert, A. (1995) Side effects of mild hypothermia. Journal of neurosurgery
and anaesthesiology 7(2):139 – 147
51. Scott, H.F. and Nelson, K. (2011) Drowning in Florin, T.A. and Ludwig, S.
(2011) Netter’s Pediatrics. Chapter 6:35 – 38. Saunders (Elsevier Inc.)
52. Spack, L., Gedeit, R., Splaingard, M., et al. (1997) Failure of aggressive
therapy to alter outcome in pediatric near-drowning. Pediatric Emergency
Care 13(2): 98 – 102
53. Suominen, P.K., and Vähätalo, R. (2012) Review: Neurologic long term
outcome after drowning in children. Scandinavian Journal of trauma,
resuscitation and emergency medicine 20: 55 – 62
54. Suominen, P.K, Sutinen, N., Valle, S., et al (2014) Neurocognitive long term
follow-up study on drowned children. Resuscitation 85: 1059 -1064
55. Szpilman, D., Bierans, J.J., Handley, A.J., et al. (2012) Drowning. N Engl J
Med 366(22): 2102 - 2110
56. Tipton, M.J. and Golden, F.S.C. (2011) A proposed decision-making guide for
the search, rescue and resuscitation of submersion (head under) victims
based on expert opinion. Resuscitation 82: 819 – 824
80
57. Topjian, A.A., Berg, R.A., Bierans, J.J.L.M., et al. (2012) Brain resuscitation in
the drowning victim. Neurocrit Care, 17(3):441 – 467
58. Vähätalo, R., Lunetta, P., Olkkola, K.T. et al. (2014) Drowning in children:
Utstein style reporting and outcome. Acta Anaesthesiol Scand 58: 604 – 610
59. Van Beeck, E.F., Branche, C.M., Spizilman, D., et al. (2005) A new definition
of drowning: towards documentation and prevention of a global health
problem. Bulletin of World Health Organisation 83(11): 853 – 856
60. Wallis, B.A., Watt, K., Franklin, R.C., et al. (2015) Drowning mortality and
morbidity rates in children and adolescents 0-19yrs: A population based study
in Queensland, Australia. PLOS ONE 10(2): e0117984
61. White, J.R.M., Furukho, Z., Bull, C., et al. (2001) Predictors of outcome in
severely head injured children. Critical Care Medicine 29(3): 534 – 540
62. WHO (2014) Global report on drowning: preventing a leading killer. World
Health Organisation. Retrieved from
http://www.who.int/violence_injury_prevention/publications/drowning_global_r
eport/Final_report_full_web.pdf First accessed 10/02/2015
63. Zuckerman, G.B., Gregory, P.M., and Santos-Damiani, S.M. (1998) Predictors
of death and neurologic impairment in pediatric submersion injuries. Archives
of Pediatric and Adolescent Medicine 152: 134 – 140
64. Zuckerman, N.S., and Saladino, R.A. (2005) Pediatric drowning: current
management strategies for immediate care. Clinical Pediatric Emergency
Medicine 6:49 - 56
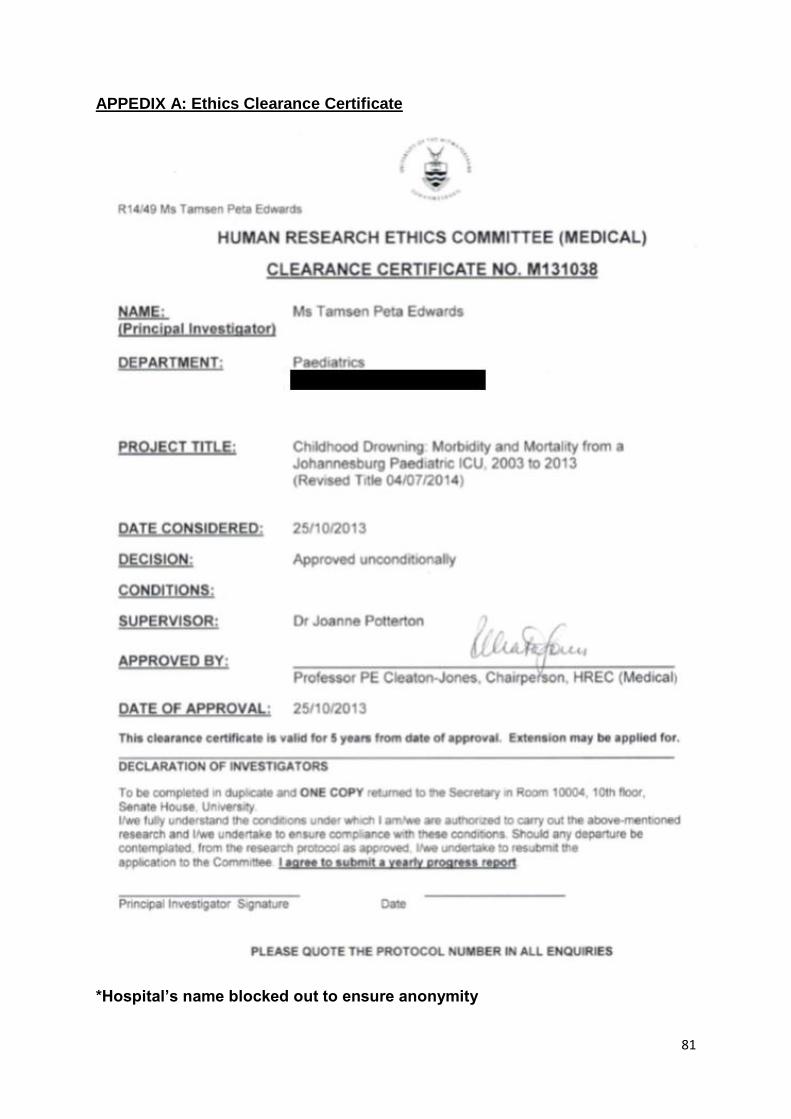
81
APPEDIX A: Ethics Clearance Certificate
*Hospital’s name blocked out to ensure anonymity
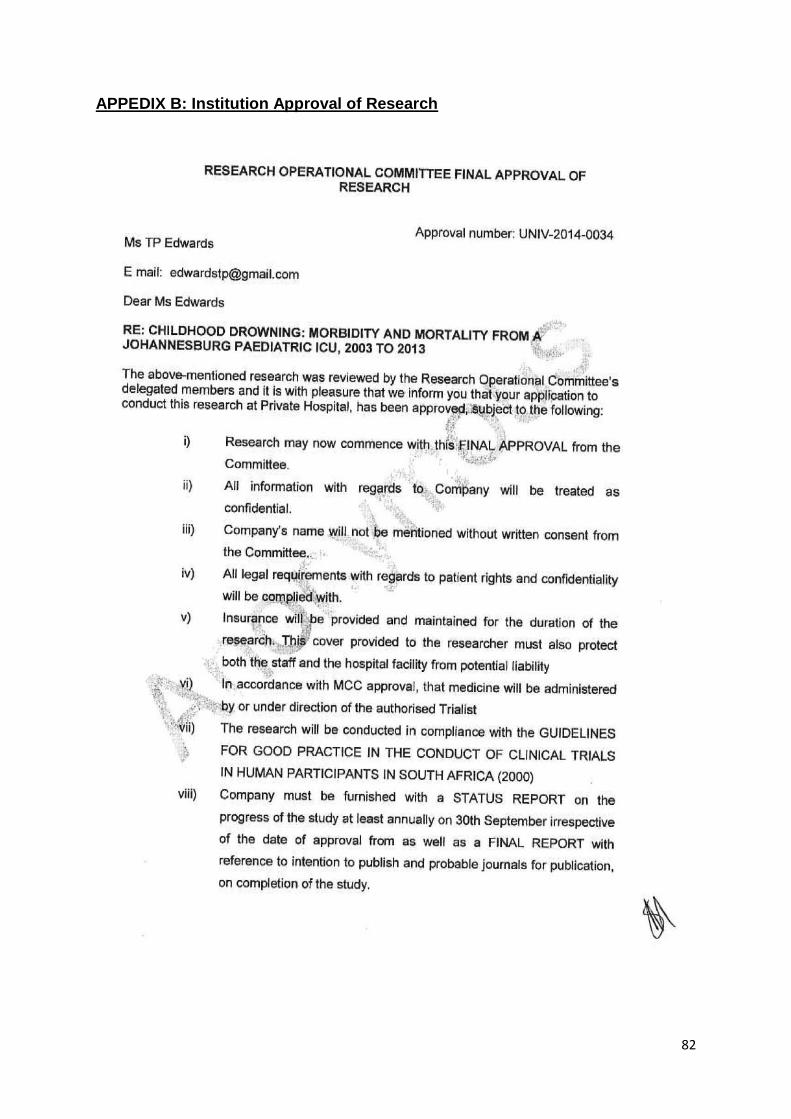
82
APPEDIX B: Institution Approval of Research
83
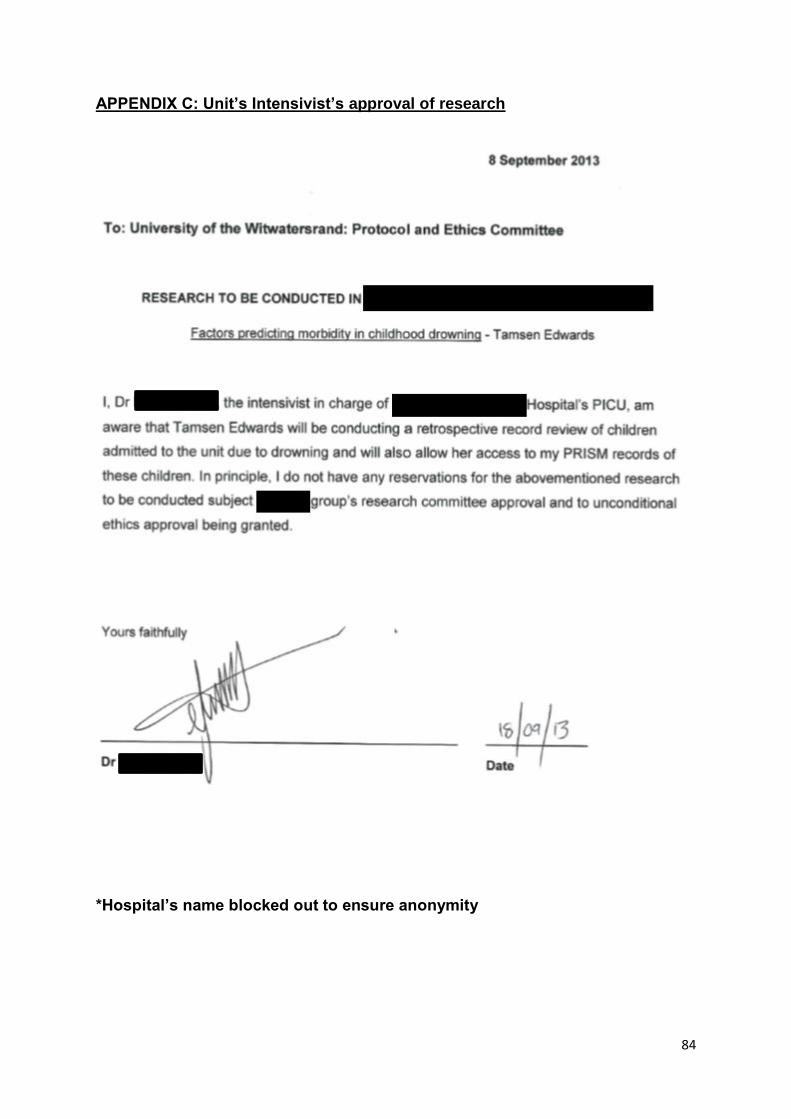
84
APPENDIX C: Unit’s Intensivist’s approval of research
*Hospital’s name blocked out to ensure anonymity
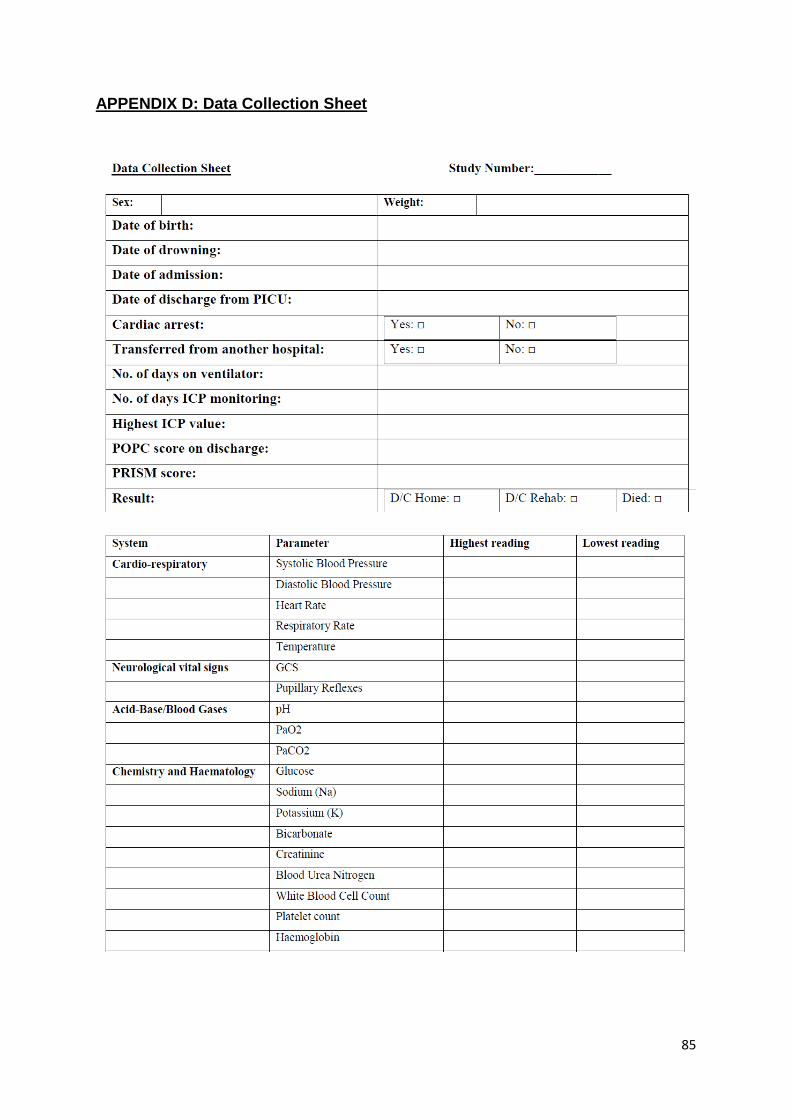
85
APPENDIX D: Data Collection Sheet
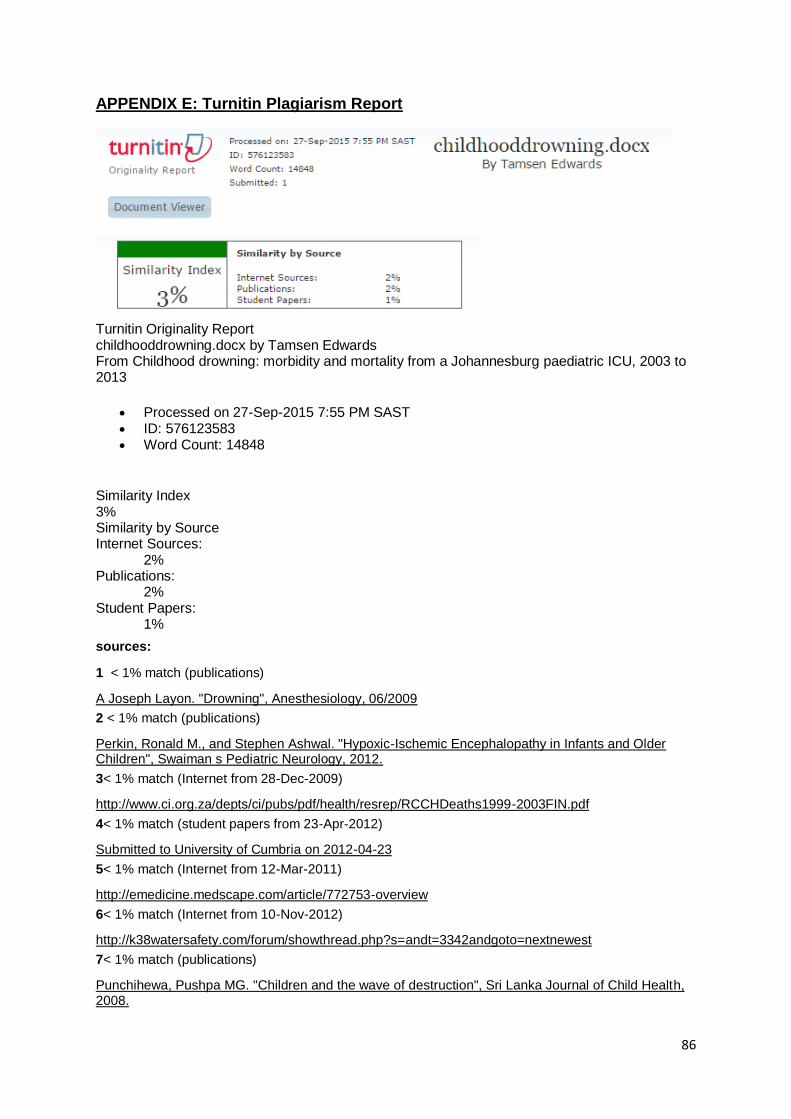
86
APPENDIX E: Turnitin Plagiarism Report
Turnitin Originality Report childhooddrowning.docx by Tamsen Edwards From Childhood drowning: morbidity and mortality from a Johannesburg paediatric ICU, 2003 to 2013
Processed on 27-Sep-2015 7:55 PM SAST ID: 576123583 Word Count: 14848
Similarity Index 3% Similarity by Source Internet Sources:
2% Publications:
2% Student Papers:
1%
sources:
1 < 1% match (publications)
A Joseph Layon. "Drowning", Anesthesiology, 06/2009
2 < 1% match (publications)
Perkin, Ronald M., and Stephen Ashwal. "Hypoxic-Ischemic Encephalopathy in Infants and Older Children", Swaiman s Pediatric Neurology, 2012.
3< 1% match (Internet from 28-Dec-2009)
http://www.ci.org.za/depts/ci/pubs/pdf/health/resrep/RCCHDeaths1999-2003FIN.pdf
4< 1% match (student papers from 23-Apr-2012)
Submitted to University of Cumbria on 2012-04-23
5< 1% match (Internet from 12-Mar-2011)
http://emedicine.medscape.com/article/772753-overview
6< 1% match (Internet from 10-Nov-2012)
http://k38watersafety.com/forum/showthread.php?s=andt=3342andgoto=nextnewest
7< 1% match (publications)
Punchihewa, Pushpa MG. "Children and the wave of destruction", Sri Lanka Journal of Child Health, 2008.

87
8< 1% match (student papers from 14-Nov-2013)
Submitted to National University of Singapore on 2013-11-14
9< 1% match (Internet from 25-Apr-2014)
http://www.worldconferenceondrowningprevention2011.org/SiteMedia/w3svc1092/Uploads/Documents/Idris%20et%20al%202003.pdf
10< 1% match (Internet from 01-Jun-2015)
http://www.ncbi.nlm.nih.gov/pmc/articles/PMC3677166/
11< 1% match (publications)
Ellen H. Koo. "Cortical Blindness Following a Near-Drowning Incident :", Journal of Neuro-Ophthalmology, 12/2011
12< 1% match (student papers from 14-Feb-2014)
Submitted to University Of Tasmania on 2014-02-14
13< 1% match (publications)
Christine M. Branche. "The Epidemiology of Drowning", Handbook on Drowning, 2006
14< 1% match (student papers from 01-Apr-2013)
Submitted to University of Newcastle on 2013-04-01
15< 1% match (publications)
M. M. Pierro. "Anoxic brain injury following near-drowning in children. Rehabilitation outcome: Three case reports", Brain Injury, 12/1/2005
16< 1% match (Internet from 07-Mar-2014)
http://www.westernstates-rx.org/uploads/2012/2012_abstracts.pdf
17< 1% match (Internet from 20-Mar-2015)
http://www.sciencedaily.com/releases/2015/02/150210212034.htm
18< 1% match (Internet from 13-Feb-2013)
http://callcenterinfo.tmcnet.com/news/2009/07/11/4268177.htm
19< 1% match (Internet from 21-Dec-2013)
http://brain.oxfordjournals.org/content/early/2011/07/22/brain.awr103.full.pdf
20< 1% match (Internet from 29-Mar-2014)
http://agrienvarchive.ca/bioenergy/download/McMaster_denise_msc_thesis.pdf
21< 1% match (Internet from 26-Apr-2014)
http://www.co.mendocino.ca.us/hhsa/pdf/mhsa_pei_plan.pdf
22< 1% match (publications)
Richards, David B., and Andrew L. Knaut. "Drowning", Rosen s Emergency Medicine – Concepts and Clinical Practice, 2010.
23< 1% match (publications)
Amy E. Burford. "Drowning and Near-Drowning in Children and Adolescents", Pediatric Emergency Care, 09/2005
24< 1% match (publications)
J. L. Hunsucker. "Analysis of rescue and drowning history from a lifeguarded waterpark environment", International Journal of Injury Control and Safety Promotion, 2011
25< 1% match (Internet from 03-May-2011)
http://books.nap.edu/openbook.php?record_id=5112andpage=169
26< 1% match ()

88
http://www.int.med.utah.edu/icuweb/files/Near-Drowning.pdf
27< 1% match (Internet from 18-Nov-2013)
http://www.uptodate.com/contents/drowning-submersion-injuries
28< 1% match (Internet from 20-Sep-2014)
http://www.thebrainproject.org/docs/PABI_grant.pdf
29< 1% match (publications)
Zuckerbraun, N.S.. "Pediatric Drowning: Current Management Strategies for Immediate Care", Clinical Pediatric Emergency Medicine, 200503
30< 1% match (publications)
Simon Fleminger. "Head Injury", Lishman s Organic Psychiatry, 07/31/2009
31< 1% match (student papers from 15-May-2015)
Submitted to 89986 on 2015-05-15