making sense of the mix: analysis and implications of the ... · making sense of the mix: analysis...
TRANSCRIPT
Green Spectrum Consulting/Resource Recycling 1
Making Sense of the Mix: Analysis and Implications of the Changing
Curbside Recycling Stream
Prepared for: American Chemistry Council Submitted by: Green Spectrum Consulting, LLC, and Resource Recycling, Inc. February 2015
Green Spectrum Consulting/Resource Recycling 2
TABLE OF CONTENTS EXECUTIVE SUMMARY .................................................................................................................... 3
BACKGROUND ............................................................................................................................. 3 KEY FINDINGS .............................................................................................................................. 3 MOVING FORWARD .................................................................................................................... 5
INTRODUCTION ............................................................................................................................... 6 PART I: CHANGES IN THE WASTE STREAM ..................................................................................... 6
SECTION 1.1 – THE EVOLUTION OF RECYCLING IN THE UNITED STATES .................................... 6 SECTION 1.2 – THE DECLINE OF PAPER ....................................................................................... 7 SECTION 1.3 – EVOLUTION OF PACKAGING ............................................................................. 11 SECTION 1.4 – FOCUS ON ORGANICS AND FOOD WASTE ........................................................ 13
PART II: TRENDS IN PACKAGING ................................................................................................... 14 SECTION 2.1 – ALL PLASTIC PACKAGING ................................................................................... 14 SECTION 2.2 – RIGID PLASTIC PACKAGING AND CONTAINERS ................................................. 15 SECTION 2.3 – FLEXIBLE PLASTIC PACKAGING .......................................................................... 16 SECTION 2.4 – BIO-BASED AND BIODEGRADABLE PLASTICS .................................................... 18 SECTION 2.5 – GLASS PACKAGING ............................................................................................ 18 SECTION 2.6 – METAL PACKAGING ........................................................................................... 19 SECTION 2.7 – PAPER AND PAPERBOARD PACKAGING ............................................................ 19
PART III: PACKAGING TRENDS IMPACT ON MRFS AND RECYCLING ............................................. 20 SECTION 3.1 – RIGID PLASTICS RECYCLING ............................................................................... 20 SECTION 3.2 – FLEXIBLE PLASTICS RECYCLING ......................................................................... 21 SECTION 3.3 – MANAGING BIO-BASED AND BIODEGRADABLE PLASTICS ……………………………..23 SECTION 3.4 – PAPER AND PAPERBOARD, GLASS AND METAL RECYCLING ............................. 24
PART IV: IMPLICATIONS OF THE CHANGING CURBSIDE MIX ........................................................ 26 PART V: MOVING FORWARD AND CONCLUSION ......................................................................... 30 PART VI: DISCLAIMER, ENDNOTES, GLOSSARY, ABBREVIATIONS ................................................. 31
SECTION 6.1 – DISCLAIMER ....................................................................................................... 31 SECTION 6.2 -- END NOTES…………………………………………………………………………………………………. 31 SECTION 6.3 -- GLOSSARY OF TERMS AND DEFINITIONS…………………………………………………….. 32
Green Spectrum Consulting/Resource Recycling 3
Executive Summary
Background This report is an assessment of the changes in the mix of materials commonly collected in the curbside recycling cart in the United States. It analyzes how those changes have impacted the existing recycling infrastructure and how the entire value chain is adapting to recycle and recover more of these materials. This report primarily focuses on plastics. The analysis is based on research and interviews conducted by Resource Recycling, including reviews of publically available reports and information. The analysis found that fundamental changes in the materials mix and collection practices have had a huge impact on materials recovery facilities (MRFs) over the last decade. Some MRFs experienced a 20 percent or more decrease in overall material throughput as a result of the unexpected decrease in paper volumes and a general trend toward light-weighting. However, the growth of single-stream collection of recyclables coupled with communities upgrading from small bins to larger wheeled carts has increased the amount of non-fiber materials being delivered to MRFs. Upgrading to carts often increases the potential volume per household of collected materials by up to 400 percent. Residents often fill these carts to capacity with some plastics and other materials not currently included in their community’s curbside recycling program. As a result, many MRFs are now receiving similar or larger volumes of materials, but not the types of materials that they were originally designed to process. Simultaneously, additional disruptive trends were brought about by digitization and changing brand owner preferences. Newsprint in the waste stream has been reduced by more than 50 percent since its peak in 2000. The decrease in fiber left MRFs with excess equipment capacity as well as surplus staff time. Many communities have added non-bottle rigid plastics to their collection programs to fill some of this excess capacity. At the same time, the value proposition for plastics in general has had consistent success with brand owners, retailers and consumers in the marketplace. The result is ongoing replacement of other non-plastic materials with plastic products and packaging. As a result, the amount of plastics in the waste stream has also increased. In contrast to non-bottle rigid plastics, the suitability for recycling of some plastic packaging is challenging because of more sophisticated and complex laminate materials. These materials offer excellent performance and environmental benefits. However, the complex design characteristics that enable these benefits present some recycling challenges. As a result, communities, brand owners, retailers and others in the value chain are seriously exploring energy recovery alternatives. These alternatives include integrating systems that convert non-recycled plastics to fuels and petroleum products, as well as other waste conversion technologies.
Key Findings
The U.S. recycling infrastructure was largely built to process the volume and material mix of recyclables from the 1990s and the projected growth from that base. The volume and mix has changed in unexpected ways and at a more rapid pace than expected. This
Green Spectrum Consulting/Resource Recycling 4
has resulted in MRF processing systems, assets and technology that are often not well matched with current or projected material flows.
Newsprint in municipal solid waste (MSW) went from 7 million tons in 1960 to 15.5 million tons in 2000. It then collapsed back to 8 million tons in 2012. A significant portion of the U.S. recycling infrastructure was developed in the 1990s and was built around capturing the large volumes of paper and other fiber once found in MSW.
In recent years, municipalities have addressed perceived dissatisfaction with stalled recycling growth rates and resident confusion of what is recyclable by implementing “single-stream” recycling. Single-stream recycling involves large capacity carts for homeowners and commingles all recyclables in one receptacle. The positive results are higher volumes of materials collected and collection costs are lowered. These benefits are somewhat offset by the unintended consequences of more contamination, glass breakage and significant “tag-along” volumes of materials. “Tag-along” materials are those that are not officially included in the local recycling collection program but are deposited by homeowners practicing “wishful recycling.”
Because of performance advantages and life cycle environmental benefits, plastics have been replacing metals, glass, and fibers particularly in packaging. In many cases newer types of plastic packaging are multi-material laminates. These multi-layered packages are very difficult to disassemble and recycle. As a result, plastics have become a growing part of MSW and in some cases create new recovery challenges for MRFs and recyclers.
Consumer demand for recycled plastic content continues to grow. The combination of growing consumer demand plus the availability of “tag-along” materials such as mixed rigid plastics has resulted in tremendous growth of collection and MRF processing for many different types of rigid plastics.
The rapid swings in the curbside material mix have put strains on MRFs developed in response to the original growth of curbside recycling in the 80s and 90s. Many existing MRFs have technological and space limitations that make nimble responses to input changes difficult.
The future appears likely to hold more mix changes driven by the potential removal of organics from MSW, potential new wet/dry collection type systems, more mixed waste processing, globalization of recycling markets and ongoing innovation and consumer choice. The result will be more complex material applications in recovery streams and a continued need for new technology and innovation.
Designing for recyclability faces some inherent obstacles because it is a secondary consideration to performance in use, upstream environmental benefits, and marketing
Green Spectrum Consulting/Resource Recycling 5
of product/package life. As a result, other options for end-of-life recovery for plastics, particularly energy recovery, are growing considerations.
Despite these rapid changes over a short time frame, many of these trends point to a continued resolve between materials and packaging manufacturers, brand owners, recyclers, and communities. Stakeholders are working to adapt and implement new technologies and programs that maximize the recycling and recovery of valuable materials in the ever evolving stream of waste.
Moving Forward MRFs have been and will likely continue to be subject to huge changes in their inputs as a result of technology and lifestyle changes. The recycling infrastructure will continue to be forced to anticipate and react to these dramatic changes. However, after being surprised with the recent decline in paper, MRFs and their technology vendors are now better anticipating future changes. For the foreseeable future, MRFs will need to structure their physical plants and their processes to be more nimble and prepare for the continued shifting makeup of the curbside waste stream. Plastics and metals are being light-weighted, meaning more volume will need to be captured in order to achieve the same tonnage. New sortation practices, technologies, and better integration with energy recovery technologies will be essential to properly capture the materials that will flow through the MRFs of tomorrow.
Green Spectrum Consulting/Resource Recycling 6
Introduction This report focuses on the changes and impacts of plastics that are and potentially would be collected through curbside recycling programs. This report is limited to household generated plastics with a focus on consumer product packaging. Since this report deals with the changing curbside mix of materials, flexible packaging such as shrink, stretch and film wrap and automotive, building and construction, and electronics plastics that are collected via retail drop off, or in other ways, were not examined. This project seeks to examine what changes have already happened and what other changes in the curbside mix might be coming in the near-term. These predictions are based on changing consumption patterns and packaging trends, and what impacts those changes could have on our recycling infrastructure. Although the basic families of commodity polymers have been around since the middle of the last century, technological innovations over the last three decades have led to an increase in types of plastic, but also the variety and complexity of these plastic applications. Between December 2013 and April 2014, Green Spectrum Consulting, along with Resource Recycling, conducted web-based research and phone interviews with resin producers, packaging manufacturers, brand owners, MRF operators, plastic reclaimers, municipalities and recycling industry experts to assess the current trends in curbside recycling. They focused particularly on the changes in packaging materials, the impacts those changes were having currently, and predicted changes over the next several years.
A review of the U.S. Environmental Protection Agency’s (EPA) 2012 Municipal Solid Waste (MSW) Characterization Report was conducted to predict long-term trends in the make-up of the curbside mix and to assess potential opportunities for further plastics recycling and recovery via curbside collection.
Part I: Changes in the Waste Stream
Section 1.1 – The Evolution of Recycling in the United States Recycling in the United States is a relatively young industry. The history of collecting and repurposing “scrap” materials goes back to the beginnings of industrialization. Recycling was driven by necessity during World War II, but then receded with the growth of landfills. Collection centers for recycling emerged during the 1970s. These centers were driven largely by energy concerns. Curbside recycling programs gained traction in the late 1980s, with nearly 1,000 full-scale or pilot programs operating in communities across the country. The early 1990s saw a tremendous surge in growth of curbside recycling. The number of programs grew by more than 250 percent between 1988 and 1991 to nearly 4,000. The EPA currently estimates that there are over 9,800 curbside recycling programs in operation today. The types and volumes of materials collected through these curbside programs have also evolved dramatically over the last 30 years. In the 1980s curbside recycling programs mainly collected aluminum, glass and paper.
Green Spectrum Consulting/Resource Recycling 7
Recycling in the United States remains decentralized, with each community managing its own program. Wide variations exist between what communities collect, though many programs now include some combination of steel, aluminum, plastics, glass, paper and/or paperboard. Single-stream recycling has grown rapidly since beginning in California in the 1990s. Proponents say it lowers collection costs, reduces consumer confusion, addresses stalling recycling rates and increases the collection of all recyclable commodities. Single-stream recycling is a system where residents put all of their commingled recyclables in one “single” cart or bin and the commodities are later separated and sorted at a MRF. Starting in the early 2000s and continuing to current-day, many communities have complemented their switch to single-stream with the introduction of larger, lidded carts. Lidded carts, sometimes as large as 96 gallons, have replaced 20 gallon bins. The results have been greater volumes of materials collected for recycling, but partially offset by greater contamination from unwanted materials. In some cases the commodities can be de-valued because of this contamination. Some municipalities are now looking beyond single-stream to “one bin” systems that involve placing all of a household's recyclables and solid waste in a single receptacle. Valuable commodities would then be sorted out at a mixed-waste processing facility (MWPF). Consumer product packaging currently comprises thirty percent of the municipal solid waste stream. Over the last 30 years the make-up of packaging has also changed dramatically. Glass and metal once dominated, yet lighter, rigid plastics have increasingly replaced these materials. The speed at which these packaging changes and trends are occurring is also accelerating. Plastic packaging is lighter, smaller, and thinner with the introduction of innovative, “smart,” flexible packaging. Consumer packaged goods (CPGs) companies continually seek innovation to better protect the product, to help minimize food loss and waste, and reduce the carbon footprint over the life cycle of a package. Packaging innovation is expected to continue accelerating in the coming decade. This will present additional challenges, and some opportunities, for the recycling industry.
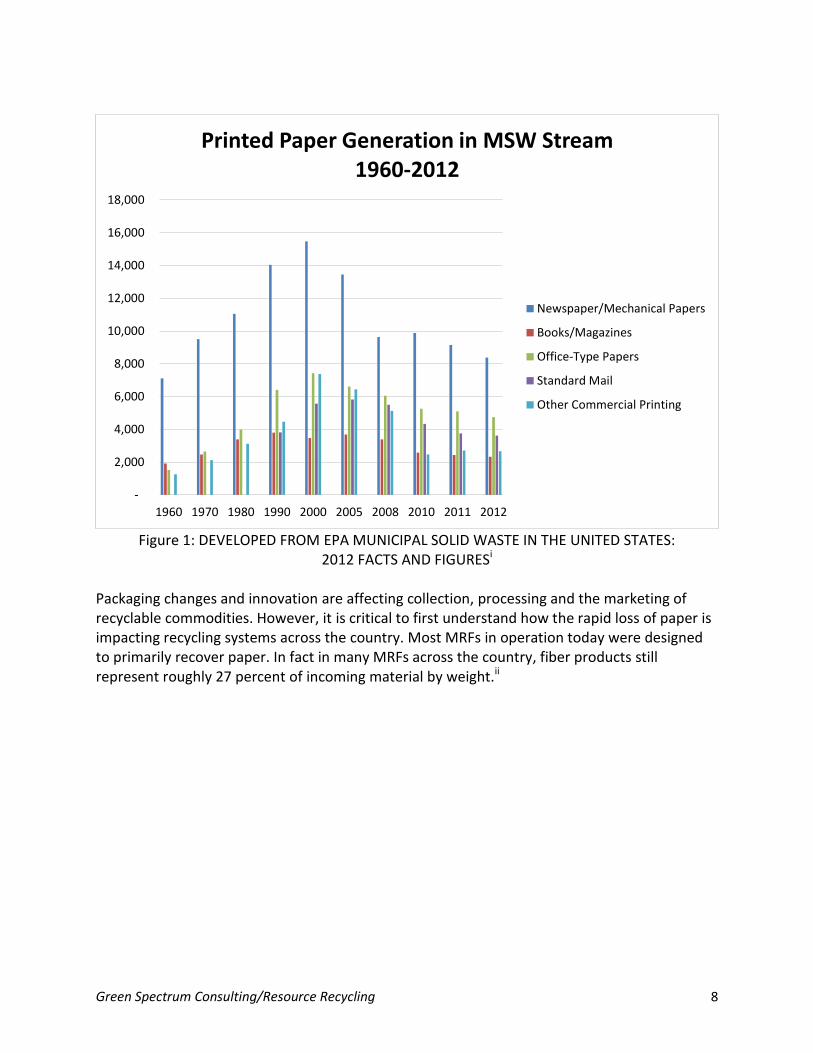
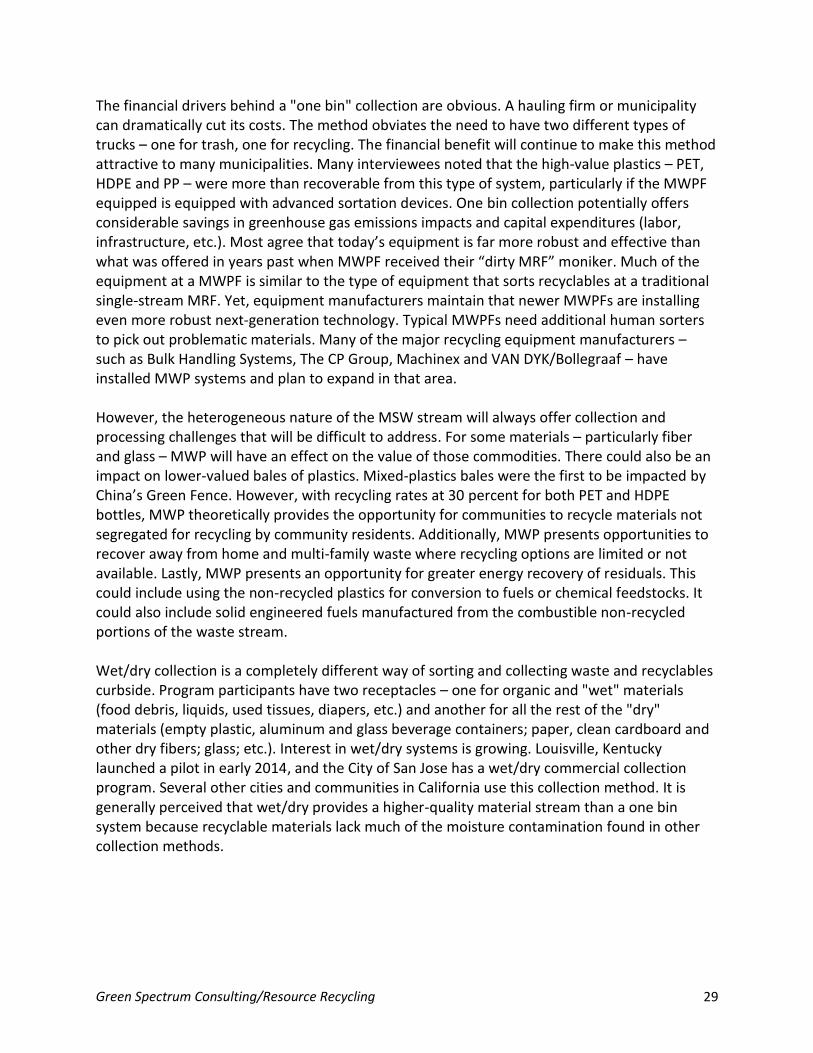
Section 1.2 – The Decline of Paper The other major trend for curbside recycling has taken place in paper generation. Paper, particularly newsprint, has been a significant portion of what was collected for recycling since the beginning of curbside recycling. However, beginning in the mid-1990s, technological advances such as the growth of the Internet and then the explosive growth in smartphones, tablets, e-readers, and other tools developed to consume digital information, ushered society away from printed media. Digital platforms are now the preferred method for consuming and sharing information. Printed paper generation in the municipal solid waste stream (MSW) has closely followed these trends. To take the most notable example, generation of newspaper increased from 7 million tons in 1960 to nearly 15.5 million tons at its peak in 2000. Since 2000, newsprint generation decreased steadily to just over 8 million tons in 2012. Figure 1 shows the growth and subsequent reduction of all printed paper generation since 1960.
Green Spectrum Consulting/Resource Recycling 8
Figure 1: DEVELOPED FROM EPA MUNICIPAL SOLID WASTE IN THE UNITED STATES:
2012 FACTS AND FIGURESi
Packaging changes and innovation are affecting collection, processing and the marketing of recyclable commodities. However, it is critical to first understand how the rapid loss of paper is impacting recycling systems across the country. Most MRFs in operation today were designed to primarily recover paper. In fact in many MRFs across the country, fiber products still represent roughly 27 percent of incoming material by weight.ii
-
2,000
4,000
6,000
8,000
10,000
12,000
14,000
16,000
18,000
1960 1970 1980 1990 2000 2005 2008 2010 2011 2012
Printed Paper Generation in MSW Stream 1960-2012
Newspaper/Mechanical Papers
Books/Magazines
Office-Type Papers
Standard Mail
Other Commercial Printing
Green Spectrum Consulting/Resource Recycling 9
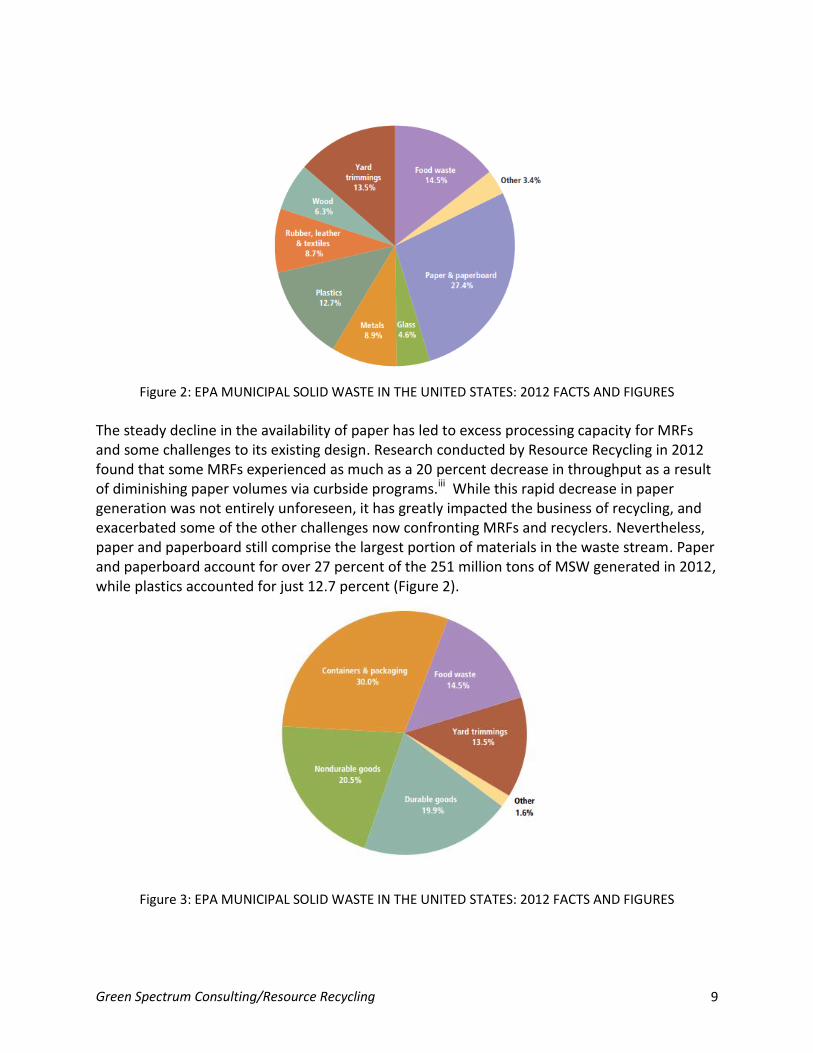
Figure 2: EPA MUNICIPAL SOLID WASTE IN THE UNITED STATES: 2012 FACTS AND FIGURES
The steady decline in the availability of paper has led to excess processing capacity for MRFs and some challenges to its existing design. Research conducted by Resource Recycling in 2012 found that some MRFs experienced as much as a 20 percent decrease in throughput as a result of diminishing paper volumes via curbside programs.iii While this rapid decrease in paper generation was not entirely unforeseen, it has greatly impacted the business of recycling, and exacerbated some of the other challenges now confronting MRFs and recyclers. Nevertheless, paper and paperboard still comprise the largest portion of materials in the waste stream. Paper and paperboard account for over 27 percent of the 251 million tons of MSW generated in 2012, while plastics accounted for just 12.7 percent (Figure 2).
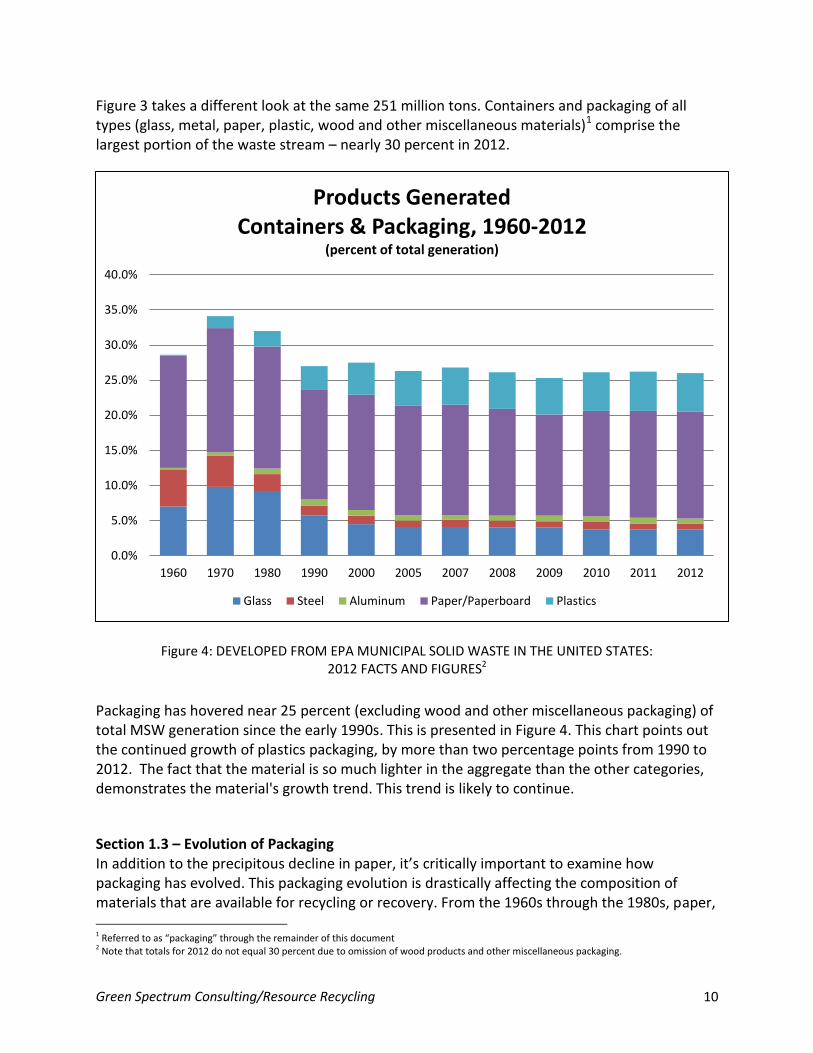
Figure 3: EPA MUNICIPAL SOLID WASTE IN THE UNITED STATES: 2012 FACTS AND FIGURES
Green Spectrum Consulting/Resource Recycling 10
Figure 3 takes a different look at the same 251 million tons. Containers and packaging of all types (glass, metal, paper, plastic, wood and other miscellaneous materials)1 comprise the largest portion of the waste stream – nearly 30 percent in 2012.
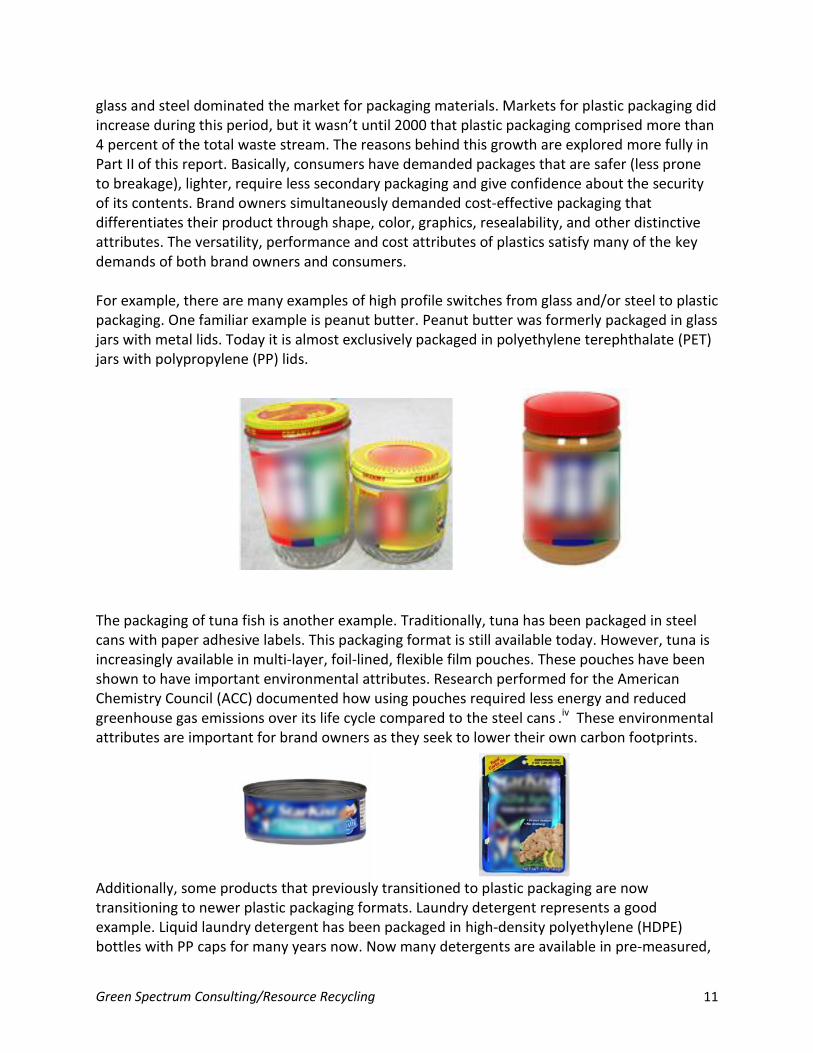
Figure 4: DEVELOPED FROM EPA MUNICIPAL SOLID WASTE IN THE UNITED STATES: 2012 FACTS AND FIGURES2
Packaging has hovered near 25 percent (excluding wood and other miscellaneous packaging) of total MSW generation since the early 1990s. This is presented in Figure 4. This chart points out the continued growth of plastics packaging, by more than two percentage points from 1990 to 2012. The fact that the material is so much lighter in the aggregate than the other categories, demonstrates the material's growth trend. This trend is likely to continue.
Section 1.3 – Evolution of Packaging In addition to the precipitous decline in paper, it’s critically important to examine how packaging has evolved. This packaging evolution is drastically affecting the composition of materials that are available for recycling or recovery. From the 1960s through the 1980s, paper,
1 Referred to as “packaging” through the remainder of this document 2 Note that totals for 2012 do not equal 30 percent due to omission of wood products and other miscellaneous packaging.
0.0%
5.0%
10.0%
15.0%
20.0%
25.0%
30.0%
35.0%
40.0%
1960 1970 1980 1990 2000 2005 2007 2008 2009 2010 2011 2012
Products Generated Containers & Packaging, 1960-2012
(percent of total generation)
Glass Steel Aluminum Paper/Paperboard Plastics
Green Spectrum Consulting/Resource Recycling 11
glass and steel dominated the market for packaging materials. Markets for plastic packaging did increase during this period, but it wasn’t until 2000 that plastic packaging comprised more than 4 percent of the total waste stream. The reasons behind this growth are explored more fully in Part II of this report. Basically, consumers have demanded packages that are safer (less prone to breakage), lighter, require less secondary packaging and give confidence about the security of its contents. Brand owners simultaneously demanded cost-effective packaging that differentiates their product through shape, color, graphics, resealability, and other distinctive attributes. The versatility, performance and cost attributes of plastics satisfy many of the key demands of both brand owners and consumers. For example, there are many examples of high profile switches from glass and/or steel to plastic packaging. One familiar example is peanut butter. Peanut butter was formerly packaged in glass jars with metal lids. Today it is almost exclusively packaged in polyethylene terephthalate (PET) jars with polypropylene (PP) lids.
The packaging of tuna fish is another example. Traditionally, tuna has been packaged in steel cans with paper adhesive labels. This packaging format is still available today. However, tuna is increasingly available in multi-layer, foil-lined, flexible film pouches. These pouches have been shown to have important environmental attributes. Research performed for the American Chemistry Council (ACC) documented how using pouches required less energy and reduced greenhouse gas emissions over its life cycle compared to the steel cans .iv These environmental attributes are important for brand owners as they seek to lower their own carbon footprints.
Additionally, some products that previously transitioned to plastic packaging are now transitioning to newer plastic packaging formats. Laundry detergent represents a good example. Liquid laundry detergent has been packaged in high-density polyethylene (HDPE) bottles with PP caps for many years now. Now many detergents are available in pre-measured,
Green Spectrum Consulting/Resource Recycling 12
dissolvable “pods.” These pods are sometimes packaged in a rigid PET container, but are also commonly packaged in multi-layered, re-sealable, flexible film pouches. Pouches use less material and reduce energy use and greenhouse gases over their life cycle.
Coffee packaging provides an example of continued packaging innovation. It migrated from a metal can with polypropylene lid to an HDPE canister. Now coffee is regularly packaged in vacuum-sealed multi-layered plastic/foil bricks or, increasingly, as a single-serve options. These single serve options include flexible plastic tubes or rigid polystyrene (PS) single-serve brew cups.
Both trends - packaging switching to plastics from traditional materials and from rigid packaging to flexible packaging - are predicted to continue. In a Packaging World article covering trends for 2014, it was noted that International researcher Canadean projects that Americans will be using 32.85 billion more rigid plastic and flexible packaging units in 2017 than they were in 2012. v They also project U.S. demand for packages converted from metal, glass, or rigid plastic, to flexible packaging to rise 3.5 percent annually to more than 9 billion pounds by 2017. Using plastic packaging enables brand owners to use less material. The amount of plastic in individual packages has also been reduced via light-weighting and use of increasingly sophisticated containers. The impacts on MRFs and recycling operations from light-weighting and complex packaging are discussed in Part III.
Section 1.4 – Focus on Organics and Food Waste Minimizing food waste and then recovering spoiled or uneaten food for energy or composting is a critically important interest that greatly impacts package design and recovery systems. Food and yard waste collection does not directly impact MRFs. However, many new forms of
Green Spectrum Consulting/Resource Recycling 13
packaging have been designed to minimize food waste before it spoils. Additionally, collecting and processing food waste and organics impact how communities prioritize their limited resources. Minimizing food waste is a major driver of sustainability for both brand owners and communities. In 2014, the United States Department of Agriculture’s (USDA) Economic Research Service estimated that food loss represents 2.5 percent of U.S. energy consumption per year.vi Furthermore, the production of this wasted food required the expenditure of around 300 million barrels of oil and over 25 percent of the total freshwater consumed by agriculture in the U.S. A 2009 EPA Report stated that approximately 13 percent of greenhouse gases in the United States are associated with growing, manufacturing, transporting, and disposing of food.vii The EPA’s 2012 MSW Characterization Study reported food waste accounted for more than 36 million tons of total waste generation which represented 21 percent of the total non-recycled/non-composted waste discarded to landfill.viii Food waste and other organic wastes decompose anaerobically in landfills and generate methane gas. Methane is 21 times more powerful as a greenhouse gas than carbon dioxide.ix Furthermore, landfills account for 20 percent of all human-related methane emissions in the United States.x It is clear that reducing the amount of food waste discarded in landfills can drastically reduce greenhouse gas emissions. The potential for mitigating methane emissions from food waste is a major reason why brand owners place such a high priority on using packaging that helps reduce food waste. These statistics are heavily influencing the priorities of an increasing number of communities as well as brand owners, retailers, and restaurants. Brand owners are focused on mitigating food waste. This, along with cost and convenience, are the drivers behind re-sealable, more sophisticated, flexible packaging. Brand owners cannot control how their customers eat and store food, but they can collaborate with their packaging designers to produce packaging that preserves and prolongs the shelf life of manufactured food in addition to meats, dairy, juices, and produce. Brand owners take a full life cycle analysis approach to packaging with a particular priority on reducing product loss, rather than whether a package can be recovered for mechanical recycling at a MRF. This is because minimizing product loss, especially food waste, has a much higher potential to reduce life cycle greenhouse gas emissions compared to recycling. The focus on food waste is also shifting priorities and resources for collection and processing. An increasing number of communities are collecting food waste curbside (e.g., San Francisco; Tacoma and Seattle, Washington; Portland, Oregon; etc.) and establishing commercial food waste composting programs. This focus on food waste has resulted in changes in collection practices and waste processing. Alternative collection practices have included wet/dry collection. In that system, "wet" or organic materials are placed in one container and all "dry" materials, which include all traditional recyclable materials and other non-recycled dry material, are placed in another. Each stream is sorted and processed separately. Lastly, the huge tonnage of food and yard waste represents a big opportunity for communities across the country to meet higher recycling and diversion goals. Food and yard waste that is composted is counted as recycling by the EPA and most states. This opportunity dwarfs the amount of flexible packaging that is currently found in the waste stream. Hence, market solutions, resources, collection and
Green Spectrum Consulting/Resource Recycling 14
technology assets have prioritized recovering organics over the comparably smaller amounts of non-recycled flexible packaging ending up at MRFs via the curbside recycling stream.
Part II: Trends in Packaging A major challenge for MRFs and plastics reclaimers is that they often only become aware of changes to packaging and consumer sentiments when these materials start (or stop) showing up in their incoming streams. The failure to accurately predict macroeconomic and consumer trends can have a huge impact on MRFs and reclaimers. It has been well documented that much of our current recycling infrastructure is a result of the wrongly projected growth trends in paper from the mid-1990s. Printed paper in the waste stream peaked in 2000, and had fallen by nearly 50 percent from that peak by 2012. This section assesses the major packaging materials that are currently collected curbside for recycling. These include rigid plastic packaging, flexible plastic packaging, glass, metal, paper and paperboard. This section provides an overview and discusses how projections of future growth will impact curbside collection and MRF processing. The packaging market will remain critically important for MRFs, reclaimers and manufacturers as a significant source of their feedstock. Research has continually demonstrated that consumers not only want to purchase packages with recycled content, but also want to recycle their used packaging. Packaging markets remain strong. A recent study from Smithers Pira estimates that the North American packaging market will grow by $186 billion by 2017.xi Mexico is expected to have the fastest growth at 3.1 percent increase on average per year. However, the U.S. is expected to continue to have the largest market share.3
Section 2.1 – All Plastic Packaging Sustainability goals and environmental awareness are growing considerations in packaging development. An analysis by DuPont on customer attitude shows that consumers will associate recyclability with increased perceptions of “greenness” for packaging in the next 10 years. At the same time, consumers will increasingly demand proof of sustainability claims via more transparent data.xii Franklin Associates recently completed a study for ACC and the Canadian Plastics Industry Association that quantifies the energy and climate benefits of plastic packaging.xiii The study used life cycle assessment (LCA) methodology to compare current plastic packaging products to packaging made with alternative materials. The assessment found that for the baseline year 2010, replacing six categories of plastic packaging with non-plastic alternatives would require 4.5 times as much packaging material by weight; increase the amount of packaging used in the U.S. by nearly 55 million tons (110 billion pounds); increase energy use by 80 percent – equivalent to the energy from 91 oil supertankers; and result in 130 percent more global warming potential – equivalent to adding 15.7 million more cars to U.S. roads.
3 In 2011, the U.S. had 83.3 percent of the North American market share
Green Spectrum Consulting/Resource Recycling 15
Recyclability has long been a contributing factor in selecting packaging materials. Increasingly life cycle analysis is influencing upstream design choices by recognizing additional benefits not considered previously. The Franklin study is an example of these benefits having significantly greater environmental impacts than recycling alone. For example, transportation is an area where plastic packaging accrues environmental benefits. It is lightweight and has an overall smaller carbon footprint because more containers can be shipped on each truck than containers made from other materials. The result is fewer truckloads and less fuel consumption. This leads to lower transportation costs and less energy consumed. These factors will continue to drive the replacement of other packaging types, particularly glass, and encourage the transition from some forms of rigid plastic packaging to even lighter flexible plastic packaging. Light-weighting and use of post-consumer recycled content (PCR) are additional examples of manufacturers’ upstream efforts to improve the sustainability footprint of their packaging. Minimizing the amount of materials used benefits the entire supply chain by consuming fewer virgin resources (through light-weighting). Demand for PCR feedstock drives the recycling and recovery economy. Design is an important factor influencing the types of packages on the market today. Brand owners recognize that packaging plays an important role in differentiating their products from competitors. Brand owners actively seek strategies to utilize the unique properties of plastic packaging to showcase their products. These include the shape, contouring, and ability to display more information, such as nutritional information. Resealability, portion-control, and product dispensation are also factors that are playing into the design of packaging that appeal to the consumer.
Section 2.2 – Rigid Plastic Packaging and Containers Rigid plastic containers are formed or molded plastic that maintains its shape when empty and unsupported. Rigid plastic containers are used for food, beverage, personal care, household and pharmaceuticals products. Rigid plastics are predominantly comprised of PET, HDPE, or PP. Some rigid plastic packaging is also made from PS. Rigid plastic containers continue to capture market share from competing materials because they deliver durability, safety, contents protection and competitive cost. A study by Markets and Markets projects sales for rigid plastic packaging to reach $433.5 billion by 2017.xiv As a result, the tonnage of rigid plastics found in the waste stream is growing. Rigid plastics are likely to continue to replace glass and metal packaging. Technological advances are allowing for packaging formats that have stronger consumer appeal, are not as prone to breakage (like glass), and require less secondary packaging to protect the product.
Section 2.3 – Flexible Plastic Packaging Flexible packages are used to protect, market, and distribute a vast array of products for industrial applications, consumer and institutional products.xv The flexible packaging considered in this report is comprised of multiple-layers (laminates), is made from multiple resins, may contain non-plastic materials such as foil, incorporates barrier layers, and utilizes “tie-layers”
Green Spectrum Consulting/Resource Recycling 16
which molecularly bond with and fuse the different layers together. Flexible packaging is the second largest packaging segment representing 18 percent of the total U.S. packaging industry. By weight, that equates to 8 million tons, around half of which is multi-material laminates.xvi Since this report deals with the changing curbside mix of materials, flexible packaging such as shrink, stretch and film wrap were not examined. Polyethylene (PE) film recycling is well established and growing via a sophisticated network of take back programs with major retailers and haulers.xvii While PE film does mistakenly end up in curbside bins, the preferred method of recycling is via return to retailer of clean, dry film. This report focused on the lay flat, pillow, standup and retort pouches predominantly used in packaging food and to a smaller degree, consumer home and personal care products.
Industry and research groups forecast increasing demand for flexible packaging over the next several years. The factors driving growth are its lightweight structure, a reduced carbon footprint, and changing consumer habits. The demand for packaged convenience foods and goods is expected to increase globally. Recent studies project the growth rate to be anywhere from 3.4 percent - 5.1 percent from 2013-2018. Recent data published in Packaging World now says that 2014 may be the year when flexible packaging becomes the containment format and packaging of choice for a broad range of products. xviii The factors driving growth and innovation include: the need for product protection and safety of food supply; increased product shelf life; resource preservation; waste prevention; ease of transportation; shelf impact and consumer appeal; and increasing demand for consumer convenience. Many of the technological advances associated with flexible packaging are related to protecting the product from microbial and/or chemical contamination and extending product shelf life. Innovations such as metalized films (adding aluminum to a polymer surface) provide increased water-resistance to the packaging, as well as limiting oxygen transfer. Modified atmosphere packages controls the transmission of both oxygen and carbon dioxide at rates tailored for the specific product. This increases the shelf-life of minimally processed food products. By decreasing the rate of spoilage, this type of packaging can also help improve food safety. “Active packaging” incorporates additives into the flexible packaging that absorb moisture, control package temperature, modify the flow of or absorb oxygen and carbon dioxide, and release various preservatives at different points in time to maintain product freshness. “Intelligent packaging” utilizes sensors, indicators and processors to detect changes within the packaging environment. As concerns over food safety rise and the desire to limit food waste grow, more of these truly sophisticated types of packaging are expected to enter the market place. This infographic from the Flexible Packaging Association (FPA) highlights some of the environmental benefits associated with flexible packaging:
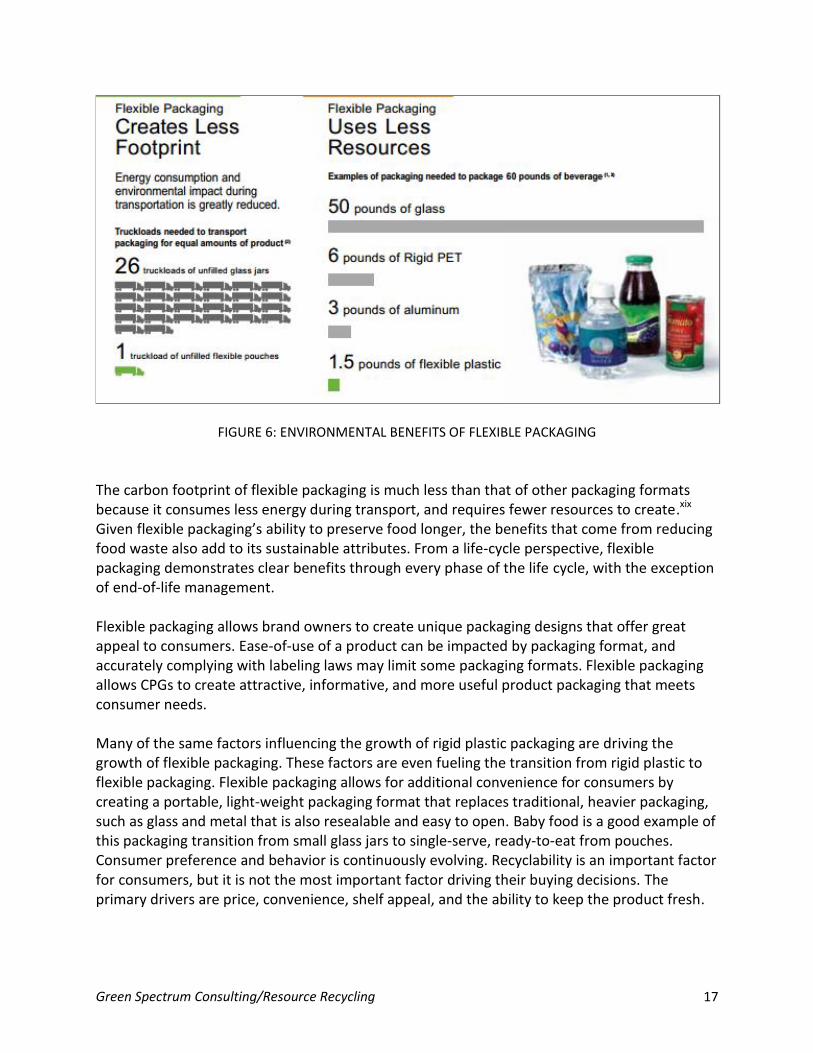
Green Spectrum Consulting/Resource Recycling 17
FIGURE 6: ENVIRONMENTAL BENEFITS OF FLEXIBLE PACKAGING
The carbon footprint of flexible packaging is much less than that of other packaging formats because it consumes less energy during transport, and requires fewer resources to create.xix Given flexible packaging’s ability to preserve food longer, the benefits that come from reducing food waste also add to its sustainable attributes. From a life-cycle perspective, flexible packaging demonstrates clear benefits through every phase of the life cycle, with the exception of end-of-life management.
Flexible packaging allows brand owners to create unique packaging designs that offer great appeal to consumers. Ease-of-use of a product can be impacted by packaging format, and accurately complying with labeling laws may limit some packaging formats. Flexible packaging allows CPGs to create attractive, informative, and more useful product packaging that meets consumer needs. Many of the same factors influencing the growth of rigid plastic packaging are driving the growth of flexible packaging. These factors are even fueling the transition from rigid plastic to flexible packaging. Flexible packaging allows for additional convenience for consumers by creating a portable, light-weight packaging format that replaces traditional, heavier packaging, such as glass and metal that is also resealable and easy to open. Baby food is a good example of this packaging transition from small glass jars to single-serve, ready-to-eat from pouches. Consumer preference and behavior is continuously evolving. Recyclability is an important factor for consumers, but it is not the most important factor driving their buying decisions. The primary drivers are price, convenience, shelf appeal, and the ability to keep the product fresh.
Green Spectrum Consulting/Resource Recycling 18
Section 2.4 – Bio-based and Biodegradable Plastics Bio-based plastics are plastics that have content that is bio, not fossil based. For example, a plastic bottle made with a bio-based resin is not necessarily biodegradable or compostable. Bio-based plastics have grown in popularity since their entrance in the market over the past decade. The demand for bio-based content (a.k.a. biopolymers) is expected to grow significantly. The U.S. market accounted for nearly 45 percent of the global biopolymer demand by volume in 2009. Markets to Markets projects strong growth for biopolymers. This projection is based on continued demand from the U.S.xx It is important to note that traditional polymers like PET and PE can be produced from bio-based sources. The advantage of these bio-based polymers is that they are molecularly identical to PET or PE produced from natural gas. Therefore products made into these resins can be recycled with non-bio-based PET and PE. This is not the case with biopolymers like Polylactic Acid (PLA). PLA biodegrades and can contaminate PET or PE recycling. Packaging is the largest consumer of biopolymers. According to Markets and Markets, it accounted for 57 percent of total global demand in 2012 (up from 53 percent in 2009).xxi Increasing demand for bio-PE, bio-PET, and PLA is rapidly pushing the demand for biopolymers. Though the Markets and Markets report noted that the bottling industry is comparatively consuming a smaller quantity of biopolymers, growth in demand is anticipated due to increasing penetration of bio-PET applications in other industries. The key drivers for increasing demand are the biodegradability of these materials, consumer perceptions on biodegradable products and government policies on “green” procurement. Biopolymers are often considered more sustainable because they are derived from plant-based sources instead of fossil resources. Biodegradable polymers are created from both renewable and non-renewable resources and are predominantly used in food service-ware and packaging. The growing focus on food waste diversion across the country has implications for degradable packaging. Biodegradability and compostability of food service-ware and packaging are viewed as complementary to efforts to collect of food waste. The value proposition for biodegradable and compostable service-ware is consumer convenience in being able to discard it with the food scraps and other compostable wastes.
Section 2.5 – Glass Packaging Glass packaging faces increasing competition from rival packaging materials. Yet the perception of easy recycling and other key attributes such as chemical stability, sterility, and reusability continue to bolster its demand. According to Research and Markets, consumption of alcoholic beverages, including beer and wine, dominated glass packaging demand in 2012.xxii Glass bottles for beer packaging are expected to drive growth for glass. In 2011, glass bottles accounted for over 60 percent of the beer packaging market.xxiii Consumer preferences for sterility are expected to be another factor contributing to the growth of glass packaging market. Growing consumer preference towards glass in packaging of food, pharmaceuticals and beverages is expected to open new opportunities for the growth over the next few years. However, plastics inherent advantages including its weight and space consumption will likely
Green Spectrum Consulting/Resource Recycling 19
constrain the growth of the glass packaging market. Demand for glass packaging in luxury applications is expected to remain strong because it is perceived as being of higher quality than plastic packaging. And investment in new development is likely to spur further demand for packaging as well. In June 2014, Owens-Illinois, the largest manufacturer of glass containers in North America, South America, Asia-Pacific and Europe, opened a 24,000 square R&D facility at its headquarters in Ohio. It is investing over $35 million dollars to develop new innovative glass production technologies.xxiv
Section 2.6 – Metal Packaging
Metal packaging offers some performance attributes that make it attractive to both developing and developed markets. A 2012 report from Lucintelxxv forecasted metal packaging growth to reach estimated revenues of $133 billion by 2017 at a compound annual growth rate of 3.9 percent during 2012-2017. The report predicted moderate growth for metal packaging because of paper and plastic packaging substitutes. Visiongain’s analysis xxvi of the metal packaging industry projects continuous growth over the next decade. The projected growth was attributed to demand in emerging markets, and increasing demand of “premium” packaging, such as craft beer. Both reports cited ambient storage of food products as a reason for anticipated growth in developing markets. Metal packaging also benefits from a positive environmental image and recyclability. The reports cited that these attributes would continue to help drive growth.
Section 2.7 – Paper and Paperboard Packaging
The paper and paperboard category includes printed paper such as newsprint and writing paper, containerboard and paperboard used in packaging. Its reputation for recycling, sourcing from bio-based materials, and known ability to break down and be composted are factors inherent in its continued demand in packaging applications. Recent industry reports identify aseptic containers and cartons as a growing packaging segment globally and in the U.S. Aseptic containers and cartons are made primarily from fiberboard and are increasingly popular as packaging for a wide variety of foods and beverages. Aseptics and cartons are already a common packaging choice worldwide. The U.S. has seen growing interest in this packaging format for numerous reasons over the last five years. Consumer interest is surging in single-serve and convenience packaging, as well as a desire to minimize food waste. Retailers prefer aseptics/cartons for certain applications because their design makes them easy to store and display. Some brand-owners are converting to aseptics/cartons from other packaging formats such as metal cans.xxvii Smithers Pira predicts that paper packaging will benefit in communities where politicians have banned expanded polystyrene foam (EPS).xxviii Additionally, because of increasing pressure from environmental groups and government bans, many key players are switching or experimenting with paper products. Starbucks is a prime example. Its locations use only paper cups and Starbucks is actively involved in paper recycling initiatives including closed-loop systems. Further improvements in paper recycling could help it grow the market, as recent advances have made it possible to recycle coated paper packaging along with corrugated paper.
Green Spectrum Consulting/Resource Recycling 20
Part III: Packaging Trends Impact on MRFs and Recycling The recycling of post-use packaging, bottles, and containers remains an important component of overall product sustainability for brand owners, retailers, and material manufacturers. However, many modern MRFs were designed or built to recycle more paper than is currently available for recycling. Additionally, MRFs are constrained by their physical footprint, and costly new technology may not pay for itself unless end markets are mature and established. The shift in consumer and brand owner preferences coupled with multiple changes in packaging design in a short time frame has exacerbated many existing challenges for MRFs. This section of the report highlights some of the existing challenges for recovering the evolving mix of materials, but also highlights some potential new opportunities for recovery.
Section 3.1 – Rigid Plastics Recycling Rigid plastic recycling continues to grow in the U.S., and is one of the bigger recycling success stories over the last decade. Rigid plastics recycling is a direct beneficiary of the changes highlighted in this study and the 2013 study Growth Trends and New Drivers for Recycling of Non-Bottle Rigid Plastics.xxix In 2012, non-bottle rigid plastic recycling in the United States grew considerably with 1.016 billion pounds of postconsumer non-bottle rigid plastic recovered for recycling. This represented an increase of 10 percent over 2011 and a growth rate of 212 percent since 2007.xxx The 2013 study documented how increased rigids recycling was partially a result of the decline of paper generation and communities shifting to larger wheeled carts. The prevalence of rigid plastic packaging in the curbside mix represents a big change over the last 15 years. However, unlike some other materials, it can be effectively sorted by a MRF and is a currently a very desirable commodity for many plastic reclaimers.
There are challenges that need to be met for the recycling of rigid plastics to reach its full potential. Contamination remains a problem for all recyclable commodities. Because the end markets for rigid plastics are less mature, it leaves these commodities more vulnerable to problems or disruptions. Contamination affects bale quality, and bale quality affects the price that a reclaimer is willing to pay for the material. Mixed rigid bales often contain plastics that have been placed in the bin as a result of “wishful” recycling. Wishful recycling includes items that community residents mistakenly place in the bin even though these items are not officially accepted by their curbside program. The psychology involved is that the resident would rather wrongfully place a non-recycled item in the recycling bin, than an item that can be recycled in the garbage. Unfortunately, education campaigns and careful development of recycling programs has not yet mitigated this problem. Market value of mixed rigid plastics declined precipitously with the establishment of China’s Green Fence in 2013.4 Many overseas markets evaporated seemingly overnight. This resulted in an opportunity for domestic buyers of this material. Led by this demand, markets for mixed
4 Operation Green Fence was a 10-month customs enforcement action by the Chinese government that had significant effects on the recycling industry as a whole, but MRFs in particular.
Green Spectrum Consulting/Resource Recycling 21
rigid plastics recovered and many high-quality baled materials sold at higher prices in 2014 than at their peak market several years ago. “Wishful” recycling is one trend that will continue to be a concern for mixed rigid plastics recycling. As more resins and innovative packaging enters the market place, consumers will continue to place items in their large recycling carts that do not have end markets and are not officially on a community’s collection program. A renewed emphasis will require effective consumer education, expanding collection infrastructure, and new technology to manage and sort these materials. One critical positive factor is that consumers continually state that they want more post-consumer recycled content in their packaging. Consumer packaged goods (CPGs) companies are very responsive to their customers. From the demand side, manufacturers will continue to try and incorporate more recycled content into their packaging. To accomplish this, they will require and buy a steady flow of good, clean material. Meeting this demand requires healthy recycling participation and new processing infrastructure.
Section 3.2 – Flexible Plastics Recycling As markets for flexible packaging continue to expand rapidly, there are new pressures to divert these packages from landfill. However, there are a number of inherent issues with recycling flexible packages. For the purposes of this report flexible packaging means multi-laminate packaging not clean PE film that can be returned to major retailers. The number of resin compositions, adhesives, coatings, and inks in flexible packaging are a tremendous asset for CPG companies. Yet, these same characteristics make these packages harder to economically recycle. There is hope that as this market segment grows there will be continued innovation and interest in recovering these packages. Some of the current challenges and opportunities are outlined below. Flexible packages can be difficult to classify, separate, and recycle because there are so many layers and components that comprise the package. In order to truly recycle flexible packaging, every single flexible packaging layer would have to be analyzed and categorized, separated and recycled individually, which is technically possible, but is not yet economical. Some of the materials’ molecular structures are transformed during the packaging production process to give the package its desired properties. As noted above, these changes are terrific for product performance and reducing its environmental footprint. However these changes do not produce a material that is easily separated. With “wishful recycling”, many of these packages are also ending up at MRFs. One challenge for flexible packaging is that it is typically two-dimensional and thus performs like paper during the separation process. For a MRF to recover it, it would need to flow with the three-dimensional containers. Most MRFs would need to add a system or be retrofitted to sort flexible packaging. Then there is the question of where to place this new technology. Placement needs to be configured based on current best practices. The logical placement to divert flexible packaging
Green Spectrum Consulting/Resource Recycling 22
with optical sortation is after fiber separation. The optical equipment would get a clear view of the material prior to separation. MRFs would see flexible packaging diverted to both the glass and fiber separation given its two-dimensional properties and size. Some MRFs are reporting that this is happening now. While challenging, there are some technological solutions for MRFs that could potentially sort flexible packaging. Proper configuration and application of optical sortation, air, X-ray, eddy current and discs are some of the possibilities. Lastly, even if separated, currently the tonnage of this material is low and it has little market value. The recovery of newer commodities at MRFs is a bit of a chicken and egg dilemma. Investment of capital at MRFs must yield value. However, demand for new materials usually follows consistent supply. The good news is technically there are potential solutions to recover the material, but the current economics remain the big challenge. However, there are several other end-of-life options that could complement recycling and manage the material. Waste Management’s SpecFUEL™ facility in Philadelphia, Pennsylvania processes non-recycled municipal solid waste (MSW) into an engineered fuel that can be used as a lower carbon alternative solid fuel to coal and petroleum coke. Waste Management actually has a MRF co-located with their Philadelphia SpecFUEL™ facility and their MRF residue is sent there for additional processing into fuel. In a system that is very similar to Philadelphia, the City of Edmonton, Alberta processes their MRF residue along and their MSW into a non-recycled plastics/paper feedstock. This feedstock will eventually be sent to Enerkem’s gasification system for conversion into chemicals and fuels such as methanol and ethanol. Finally, plastics-to-fuel technologies are one of the more promising opportunities for these non-recycled plastics. In fact, The Dow Chemical Company in partnership with Republic Services, Agilyx, and the City of Citrus Heights, California launched a pilot in 2014 to collect all non-recycled plastics in a purple “energy bag.”xxxi The purple energy bags were then collected alongside the City’s existing single-stream recycling program, separated at Republic’s MRF; contents were inventoried and then sent to Agilyx for conversion to synthetic crude oil. Solutions such as plastics-to-fuel and other conversion technologies are garnering increasing interest and momentum as a complement to mechanical recycling. Facilities interviewed for this report noted that they have been exploring several different options. These include engineered fuel made from MRF residue, plastics-to-fuel technologies and emerging markets for recycling flexible packaging. The National Resources Defense Council (NRDC) recently endorsed the plastics to fuel pathway, with senior scientist and waste expert Alan Hershkowitz saying: “Every category of waste has its best ecological route. And converting the plastic that can’t be recycled to liquid fuel is a good path.”xxxii
Section 3.3 – Managing Bio-based and Biodegradable Plastics As discussed in Section 2.3, interest and use of bio-based resins is growing. While many bio-based plastics are molecularly identical and can be seamlessly recycled with plastics made from
Green Spectrum Consulting/Resource Recycling 23
fossil resources, biodegradable and compostable plastics will present challenges for existing recycling systems. The predominant bio-based resin is polylactic acid (PLA). It is a resin that is designed to degrade under proper composting conditions. PLA plastics, like most compostable plastics, carry the No. 7 (other) chasing arrow product identification symbol. The No. 7 code is a catch-all for plastics that are not one of the six primary resins (PET; HDPE, PVC, LDPE, PP, and PS). Plastics with a No. 7 code, while generally not recycled at the volumes compared to other resins, are accepted in some community recycling programs. PLA plastics are designed to look no different than their recyclable counterparts. Recyclers find it difficult to discern any difference between PLA and other polymers. Consumers that normally recycle or practice “wishful recycling” may place PLA bottles and containers into the recycling bin, instead of a composting bin. Manufacturers of PLA state that it is both recyclable and compostable. However, it is only recyclable if MRFs are actually sorting for PLA. If PLA bottles go to a MRF, it will likely end up in a PET bale. PLA mixed with PET can contaminate and degrade the value of the recycled material. It creates hazing and affects the color of the PET at concentrations greater than 0.1 percent. Recyclers are concerned that as the PLA market grows, so will PET contamination. Some industry leaders would like to eliminate the No. 7 classification on PLA bottles and create a unique PLA resin code. PLA is recyclable though there are not robust markets presently for the material. Similar to PLA are degradable additives. Degradable additives are sometimes added to traditional plastics, such as PET, PE, and PP. These resins are identified, classified, sorted and recycled as such. These additives can affect the chemical stability of the plastics and end up in the recycled feedstock. Products made with this recycled feedstock could potentially become destabilized and could experience unexpected and premature degradation. Consumer confusion around what is and isn’t compostable versus what is and isn’t recyclable contributes to contamination of both the composting and recycling systems. Confusing coding and the similar looks of many compostable and recyclable products have left consumers uncertain about what goes where. Coca-Cola’s PlantBottle is a good example. It is fully embraced by industry as a positive development for sustainability. Yet, consumers don’t always understand that the PlantBottle is made from PET that is chemically indistinguishable from PET made from natural gas feedstock. In fact, that is part of its value proposition, that it can be recycled seamlessly alongside all other plastic PET bottles. Some consumers do not recognize the Plant Bottle as recyclable and rather believe it’s compostable.xxxiii Its name and the marketing message tout that the bottle is made from plant-derived materials. The simple logic for the average consumers is if it’s made from plants, and plants are compostable, then the PlantBottle must be compostable. Stronger consumer education will be needed to accompany the growth in bio-based resins and biodegradable plastics. Additionally, many ideas for recovering these resins and mitigating contamination will be hotly debated over the coming years. Some have touted a refined resin
Green Spectrum Consulting/Resource Recycling 24
identification system as necessary to reduce the contamination of both the composting and recycling systems. Labeling requirements and degradability standards for bio-based and biodegradable plastics are being debated currently. Products labeled "degradable" appeal to consumers’ desire to purchase environmentally preferable products. These terms include, but are not limited to: degradable, biodegradable, oxo-degradable, and oxo-biodegradable. All of these terms reference the various methods and specific conditions under which the plastics breakdown in a composting system or the environment. Some states are beginning to explore increased regulation. These states seek to define compostable plastics, impose labeling requirements, and limit sales to only third-party certified products in an effort to eliminate non-compostable/non-biodegradable plastics from entering composting systems.
Section 3.4 – Paper and Paperboard, Glass and Metal Recycling This study focused mainly on plastics, but since plastics are just one type of material being recycled alongside several other materials, it was critical that we examine trends for paper, glass, and metal packaging as well. About 90 percent of Americans have access to curbside or drop-off recycling for paper products. Yet there are several barriers that hinder recycling paper and paperboard packaging, including consumer behaviors, collection processes, as well as design attributes of the packaging itself. According to the Paper Recycling Coalition, the biggest challenge for the industry is increasing the quantity of recovered paper. The huge decline in the availability of paper impacted MRFs and markets tremendously over the last decade. However, the availability of paper and paperboard packaging has remained rather steady. Demand for paper and paperboard packaging made from recycled content is expected to increase. Contamination and quality of material is also a factor impacting supply. Commingled and single-stream collections have drastically impacted the quality of paper coming into paper mills. One study, The Effects of Single-stream on a Paper Mill, measured the impacts of residuals on a NORPAC paper mill in Longview, Washington and found an increase of “out-throws” from 0.5 percent from source-separated programs in years prior to 2001 to 15 percent from single-stream programs in 2006.xxxiv Many innovative design features are incorporated into paper and paperboard packaging in order to make it more appealing to consumers, withstand various elemental conditions, and protect its contents. Unfortunately, these make recycling paper and paperboard packaging challenging. Wet-strength resins and polymers are surface coatings used on paper and paperboard packaging to create packaging that will not disintegrate if it becomes wet. These coatings are generally found in any type of paper/paperboard packaging holding a product that requires refrigeration or freezer storage. These useful additives make paperboard packaging challenging for paper mills. The recycling process includes repulping. Repulping utilizes water (or chemicals) to break down the paper fibers. Paper/paperboard packaging with wet-strength additives resists this process. Ultimately, these fibers coated with the wet-strength additives clump together and must be removed and disposed. This creates an additional expense for the mill. Different pulping technologies, inconsistencies in supply, and a high degree of variability in wet-strength additives used in various packaging all present different challenges for the
Green Spectrum Consulting/Resource Recycling 25
recycling industry. As a result, it is difficult for communities to specifically narrow down which products to include or exclude from their curbside collection programs. Wet-strength fibers can be repulped, but it requires mills to utilize longer pulping times, higher water temperatures and sometimes chemicals to break down the resins. Adhesives are also problematic for recycling. Adhesives are used to bond different material layers together, and can either be natural or synthetic. Adhesives are used in all types of packaging, but mills recycling paper and paperboard packaging consider adhesives a contaminant. GreenBlue surveyed mills for its 2010 Closing the Loop report and 45 percent of respondents noted that adhesives were the significant problem in the papermaking process.xxxv Some adhesives are more problematic than others. In general, adhesives can create defects in the paper and gum up equipment if not properly removed. Inks and coatings allow packaging designers and brand owners to create appealing packaging for marketing. There are many different types of inks and coatings that can be applied to paper and paperboard packaging. All must be removed through a deinking process at mills and screened out in order to produce a paper that is free from pigment particles or discolored. Different problems can arise at mills depending on the particular type of ink and coating on the paper. Technology and equipment does exist to remove ink during the repulping process. Not all mills have the right type of or any deinking equipment. And the purchase of new equipment can be cost prohibitive. Glass recycling has been a mainstay of curbside recycling and MRFs since the beginning of curbside collection. Recent trends have created significant challenges in both processing and marketing recycled glass. The collection method used strongly influences the quality of glass recycled. In 2009, the Container Recycling Institute (CRI) examined the impacts of single-stream collection systems on the quality of residential recyclables.xxxvi The CRI study found that on average, only 40 percent of glass collected via single-stream was able to be recycled. Another 40 percent ended up in landfills and 20 percent was broken and only useable for low-end applications. In contrast, mixed glass from dual-stream systems yields an average of 90 percent being recycled into containers and fiberglass. Just 10 percent of the glass fines are used for low-end applications and almost nothing is sent to landfill. In container-deposit systems, color-sorted material results in 98 percent being recycled and only 2 percent marketed as glass fines. Contamination most commonly results when the glass is broken as a result of compaction during collection. The glass shards compress with the fiber, contaminating the paper, and also yielding less glass for processing. In addition, much of the broken glass that comes out of single-stream collection systems is thrown out as residue because it is considered too contaminated to be a suitable feedstock. Glass is produced in a wide variety of colors such as green or brown. Before glass is recycled, it must be separated by color because many companies only purchase specific colors. If colored glass is commingled it contaminates the feedstock. MRFs are investing in equipment that separate mixed broken glass for reuse as well as a means to prevent it from contaminating other recyclables. The trend seems to be that some MRFs are investing in more technologically advanced systems to produce an acceptable quality cullet as demand for recycled content in glass packaging increases. Yet some MRFs and recycling programs are
Green Spectrum Consulting/Resource Recycling 26
seeking to have glass removed from the recycling stream. That trend could continue and would further change our evolving curbside mix away from its historical beginnings. As long as both ferrous and non-ferrous metal packaging is placed in the recycling bin, there are no real challenges to effective recycling. Eddy current and traditional magnetics are relatively low-cost equipment and are accurate. If there is a challenge for recycling metals, it’s usually during collection. These materials are often scavenged from curbside containers because of their value on the open market.
Part IV: Implications of the Changing Curbside Mix Clearly, the composition of the waste stream will continue to evolve in both predictable and unpredictable ways. As a result, changes to collection, processing and the economics of recycling will continue to evolve. This section examines the implications of some of the trends that will have an impact on the waste stream in the next five-to-10 years. The key areas that will be discussed in this part of the report are:
Light-weighting
Convenience Packaging
Alternative Collection Strategies
Across all commodities, significant progress has been made in using less material for packaging to achieve the same product protection. This trend is popularly known as light-weighting. Aluminum is an excellent example: aluminum cans gained market share at the expense of steel cans in the 1970s. Aluminum cans are about 20-30 percent lighter than steel, but have the same strength. Today, aluminum cans are 15 percent lighter than 20 years ago. This is mainly due to light-weighting the can tops. It takes thirty-four 12-ounce cans to make a pound of aluminum. It took 29 cans in 1990 and 22 in 1972. Plastics offer similar light-weighting success stories. A one-gallon plastic milk jug today weighs 30 percent less than it did in the 1980s. A two-liter soda bottle today weighs 25 percent less than it did in the 1970s. Light-weighting has many significant positive upstream benefits. Unfortunately these benefits often go unrecognized. Haulers, MRFs, reclaimers and other downstream enterprises often see the benefits less positively. The effects are especially noticeable in community recycling programs where there is a perception that programs have stalled because the rates have been experiencing little growth. The national recycling rate doubled from 16 percent to 32 percent from 1990 to 1995. The rate of growth has seemingly stalled in the last 10 years. The U.S. recycling rate was 34 percent in 2012.xxxvii Recycling is measured in weight, not volume. Thus light-weighting combined with a switch to lighter materials such as plastics has the effect of stalling diversion rates and falsely suggesting that programs have become ineffective. The result is communities seeking other strategies to boost diversion rates. These include investing in broader community education campaigns, expanding the size of the collection receptacle, and
Green Spectrum Consulting/Resource Recycling 27
expanding the list of materials collected. It is the expansion of the receptacle and collected materials that has had the most impact on processors. The unintended consequences of larger carts and single-stream collection have been increasing contamination and decreasing bale yield. As more materials are added to the list, more unwanted material is collected. Bale quality became such an issue of concern, that even China implemented its Operation Green Fence in 2013 to reject excessively contaminated bales. As China recycles more domestic materials there could be less demand for unwashed material. High-graded, high-quality bales will continue to attract buyers in all markets. Higher-quality bales require improved sortation, additional capital investment in technology or decreased contamination at the source. This has opened the markets for plastics recovery facilities (PRFs). PRFs perform a tertiary sort of mixed plastics and divide them into their respective commodity resins. Decreasing contamination may require placing limits on what materials are accepted via curbside programs. However, most communities are very reluctant to remove previously collected materials from their programs.
One of the key growth drivers for non-bottle rigid plastics recycling was increased cart size. Processors baled and sold these materials because they were receiving enough material to make a profit. This often led to official acceptance of rigid plastics in their curbside programs. Restricting materials may impact that future “tag along” effect for new products that are experiencing a surge in growth. It is possible, based on current growth rates, that flexible plastic pouches may have future end-market possibilities. Light-weighting also generates significant cost savings upstream. Fewer materials and resources are consumed to manufacture and transport the package. Downstream, light-weighting has the opposite effect. Collection and processing costs actually increase on a per ton basis as materials get lighter. End markets base pricing on tons, and today there is less weight to pick up. Fuel and vehicle maintenance costs have increased, making each load more expensive to collect. Labor and capital costs have increased, making it more expensive to process those loads. And with each load yielding less material by weight, revenues per load have decreased, widening the expense/revenue gap. Many communities have shifted from source-separated or dual-stream collection methods to single-stream recycling to reduce their collection costs and capture more materials for recycling. And recently, as the trends have accelerated many communities have begun to investigate “mixed-waste processing.”xxxviii Mixed-waste processing requires just a single bin containing all recyclables and garbage to be collected. Light-weighting and reducing the cost of collection are not the only factors contributing to communities’ decisions to utilize single-stream recycling. But for those communities where recycling rates are lagging or stalling, single-stream collection is often seen as a solution to boost rates. And while diversion rates are important factors to consider, communities must also examine the costs of single-stream on their domestic end-markets and the impact on material quality.
Green Spectrum Consulting/Resource Recycling 28
Convenience packaging can generally be characterized as easy-opening, re-closable, and portable and designed for one-handed use for a range of processed foods. These include entrees, snacks and foodservice products. Convenience packaging is not recyclable in most curbside program because of contamination, small size, and complex resin make-up. Programs to reclaim and recycle these products generally rely on return-to-retail or mail-to-manufacturer options. Consumers buying these products desire convenience, and recycling considerations for those consumers are secondary. Some communities have piloted collection of materials that are not officially collected as part of their community recycling program. MRFs are receiving these items anyway as a result of wishful recycling. The pilots require consumers to use bags for these items and place the bags within their recycling bins. This method has had mixed results. Variables include the materials collected, types of trucks used for collection, and frequency of collections. Bagged recyclables collection requires materials to go to a single-stream MRF. Bag breakage from truck compaction often results in higher contamination or destruction of recyclables. However, there is hope in newer attempts at bagging some of these items, such as Dow’s purple energy bag program in Citrus Heights, CA. Although PE film recycling was not in the scope of this report, numerous programs around the country actually collect plastic films curbside. Generally, curbside collection of film is not a recommended solution. Instead, the American Chemistry Council’s Flexible Film Recycling Group (FFRG) has partnered with the Sustainable Packaging Coalition (SPC) of GreenBlue to promote their “How2Recycle” label and encourage the take back of clean PE film to retailers.
Modifications to collection systems can be very costly. Significant capital investment is required. Because much of the convenience packaging is small (in size and weight), volume collected for recycling is minimal. This type of packaging is often not included in programs, but ends up in collections streams from the tag-along effect. Because end-markets are limited, and the materials are often contaminated, the end result degrades the value of accepted materials. One obvious benefit of collecting convenience packaging separately in a bag is MRFs can segregate these materials from the stream by diverting them early in the sortation process. Removing these materials from the stream also makes them more desirable for energy recovery processes such as plastics to fuel conversion. Convenience packaging is not targeted currently by MRFs or by manufacturers of MRF systems. Recycling and sortation equipment manufacturers did not cite present plans for looking at this particular product stream. Equipment manufacturers were hesitant to reveal their R&D strategy. However, brand owners, retailers, MRFs, reclaimers and other stakeholders will continually look for solutions.
Mixed-waste processing or "one bin" collection is defined as placing all of a household's recyclables and solid waste in one receptacle. The collected materials are sorted at a mixed-waste processing facility (MWPF), sometimes called by its pejorative, a "dirty MRF.” The concept is enjoying a renewed popularity in many municipalities. Montgomery, Ala. recently launched a one bin collection program. Houston, Texas is considering a switch to MWP. The Indianapolis City Council recently approved Covanta’s plans to construct a MWPF to recover recyclables before the leftover waste is converted to energy in its existing waste-to-energy facility.
Green Spectrum Consulting/Resource Recycling 29
The financial drivers behind a "one bin" collection are obvious. A hauling firm or municipality can dramatically cut its costs. The method obviates the need to have two different types of trucks – one for trash, one for recycling. The financial benefit will continue to make this method attractive to many municipalities. Many interviewees noted that the high-value plastics – PET, HDPE and PP – were more than recoverable from this type of system, particularly if the MWPF equipped is equipped with advanced sortation devices. One bin collection potentially offers considerable savings in greenhouse gas emissions impacts and capital expenditures (labor, infrastructure, etc.). Most agree that today’s equipment is far more robust and effective than what was offered in years past when MWPF received their “dirty MRF” moniker. Much of the equipment at a MWPF is similar to the type of equipment that sorts recyclables at a traditional single-stream MRF. Yet, equipment manufacturers maintain that newer MWPFs are installing even more robust next-generation technology. Typical MWPFs need additional human sorters to pick out problematic materials. Many of the major recycling equipment manufacturers – such as Bulk Handling Systems, The CP Group, Machinex and VAN DYK/Bollegraaf – have installed MWP systems and plan to expand in that area.
However, the heterogeneous nature of the MSW stream will always offer collection and processing challenges that will be difficult to address. For some materials – particularly fiber and glass – MWP will have an effect on the value of those commodities. There could also be an impact on lower-valued bales of plastics. Mixed-plastics bales were the first to be impacted by China’s Green Fence. However, with recycling rates at 30 percent for both PET and HDPE bottles, MWP theoretically provides the opportunity for communities to recycle materials not segregated for recycling by community residents. Additionally, MWP presents opportunities to recover away from home and multi-family waste where recycling options are limited or not available. Lastly, MWP presents an opportunity for greater energy recovery of residuals. This could include using the non-recycled plastics for conversion to fuels or chemical feedstocks. It could also include solid engineered fuels manufactured from the combustible non-recycled portions of the waste stream. Wet/dry collection is a completely different way of sorting and collecting waste and recyclables curbside. Program participants have two receptacles – one for organic and "wet" materials (food debris, liquids, used tissues, diapers, etc.) and another for all the rest of the "dry" materials (empty plastic, aluminum and glass beverage containers; paper, clean cardboard and other dry fibers; glass; etc.). Interest in wet/dry systems is growing. Louisville, Kentucky launched a pilot in early 2014, and the City of San Jose has a wet/dry commercial collection program. Several other cities and communities in California use this collection method. It is generally perceived that wet/dry provides a higher-quality material stream than a one bin system because recyclable materials lack much of the moisture contamination found in other collection methods.
Green Spectrum Consulting/Resource Recycling 30
Part V: Moving Forward and Conclusion This report highlights how predicted changes in the future curbside mix of materials will present continued challenges for communities, MRFs, recyclers, brand owners, and materials manufacturers. Since the advent of curbside recycling, the packaging landscape has not been static so there will always be changes for the recovery system. The future of the curbside mix will certainly include more plastic items. Economics, consumer preferences and technology will continue to be the drivers. While there are clearly some challenges to optimizing recovery of these materials, the trends and signs of innovation are pointing in a positive direction. There is tremendous opportunity for additional recovery of materials and the development of new markets. Millions of tons of valuable plastic materials are being generated each year, while only a small fraction is recovered for recycling or conversion to energy, fuels or chemical feedstocks. Recycled PET, HDPE, and PP are already seeing surges in demand and processing capacity. Mixed plastics, including lighter packaging materials such as flexible convenience packaging, are likely to gain traction as a desired, lower-cost recycled feedstock in the coming years. As flexible packaging replaces materials such as glass and metal, greater volumes will improve its recycling economics. Technology and innovation will lead the pace of new development. The value chain from materials manufacturers through reclaimers is increasingly coordinating their efforts. The Curbside Value Partnership's Recycling Partnership is currently driving change in underperforming recycling communities by increasing access to curbside recycling, and expanding existing curbside recycling programs. There is hope that The Recycling Partnership’s efforts will soon be joined by the $100 million in commitments to Walmart’s Closed Loop Fund. The result will be a boost in the amount of recyclable plastics and other materials collected and ultimately used in new products. Better coordination of trade association and multi-party efforts is also leading to more sustainable recycling business practices and more efficient use of limited resources. The steady demand by consumers to purchase products made with recycled content and by communities to recycle more will lead to increased capitalization of more effective and flexible MRFs. The expansion of the current generation of PRFs is also a positive development. Finally, the drive to reduce all materials going to landfill will continue to spur interest and investment in technologies that garner value from non-recycled materials. These will include plastics-to-oil facilities that will be integrated with state-of-the-art MRFs and PRFs. The pace and amount of change can seem daunting at times. However, the entire system seems poised to react favorably to these changes, and truly embrace a sustainable materials management approach over the coming years.
Green Spectrum Consulting/Resource Recycling 31
Part VI: Disclaimer, Endnotes, Glossary, Abbreviations
Section 6.1 – Disclaimer The Making Sense of the Mix: Analysis and Implications of the Changing Curbside Recycling System has been prepared to provide information to parties interested in the recycling of plastics and other materials. Materials recovery facilities may vary their approach with respect to particular operations, products, or locations based on specific factual circumstances, the practicality and effectiveness of particular actions and economic and technological feasibilities. This report is not designed or intended to define or create legal rights or obligations. ACC does not make any warranty or representation, either express or implied, with respect to the accuracy or completeness of the information contained in this report; nor does ACC assume any liability of any kind whatsoever resulting from the use of or reliance upon any information, conclusion, or options contained herein. The American Chemistry Council sponsored this report. This work is protected by copyright. The American Chemistry Council, which is the owner of the copyright, hereby grants a nonexclusive royalty-free license to reproduce and distribute this work, subject to the following limitations: (1) the work must be reproduced in its entirety, without alterations; and (2) copies of the work may not be sold. Copyright © American Chemistry Council 2015.
Section 6.2 – Endnotes
Section 6.2 – Endnotes i http://www.epa.gov/wastes/nonhaz/municipal/msw99.htm ii http://www.epa.gov/wastes/nonhaz/municipal/msw99.htm iii http://plastics.americanchemistry.com/Education-Resources/Publications/2013-Growth-Trends-and-New-Drivers-for-Recycling-of-Non-Bottle-Mixed-Rigid-Plastics.pdf iv http://plastics.americanchemistry.com/Education-Resources/Life-Cycle-Assessment-Study v http://www.packworld.com/trends-and-issues/unit-doseunit-use/packaging-expectations-2014 vi http://www.ers.usda.gov/media/1282296/eib121.pdf vii http://www.epa.gov/oswer/docs/ghg_land_and_materials_management.pdf viii http://www.epa.gov/waste/nonhaz/municipal/pubs/2012_msw_fs.pdf ix epa.gov/climatechange/ghgemissions/gases/ch4.html x http://www.epa.gov/waste/conserve/foodwaste xi https://www.smitherspira.com/market-reports/packaging/north-american-us-canada-mexico-packaging-industry.aspx xiihttp://www2.dupont.com/Packaging_Resins/en_US/assets/downloads/Survey_of_Future_Packaging_Trends.pdf xiii “Impact of Plastics Packaging on Life Cycle Energy Consumption & Greenhouse Gas Emissions in the United States and Canada,” xiv http://www.marketsandmarkets.com/Market-Reports/flexible-packaging-market-1271.html xv https://www.flexpack.org xvi www.flexpack.org/INDUST/industry-facts-figures.asp
Green Spectrum Consulting/Resource Recycling 32
xvii http://plastics.americanchemistry.com/Education-Resources/Publications/2012-NationalPostconsumer-Plastic-Bag-Film-Recycling-Report.pdf xviiihttp://digital.turnage.com/i/253768?spMailingID=8059694&spUserID=NzgwNjY2NzM1OAS2&spJobID=122310957&spReportId=MTIyMzEwT0 xixhttp://www.flexpack.org/MEMONL/mo_sustainable_packaging/sustainable_packaging_toolkit/Resource_Guide.pdf?ContactID= xx http://www.marketsandmarkets.com/Market-Reports/biopolymers-bioplastics-market-88795240.html xxi http://www.marketsandmarkets.com/Market-Reports/biopolymers-bioplastics-market-88795240.html xxii www.researchandmarkets.com/reports/3086502/glass-packaging-market-for-food-and-beverages xxiii www.researchandmarkets.com/reports/3086502/glass-packaging-market-for-food-and-beverages xxiv investors.o-i.com/phoenix.zhtml?c=88324&p=irol-newsArticle&ID=1738722 xxvwww.lucintel.com/reports/food_beverage/global_metal_packaging_industry_2012_2017_trend_profit_forecast_analysis_august_2012.aspx xxvi https://www.visiongain.com/Report/994/Global-Metal-Packaging-Market-2013-2023 xxvii http://www.freedoniagroup.com/brochure/27xx/2754smwe.pdf xxviii www.smitherspira.com/news/2014/june/current-state-of-the-paper-packaging-market xxix http://plastics.americanchemistry.com/Education-Resources/Publications/2013-Growth-Trends-and-New-Drivers-for-Recycling-of-NonBottle-Mixed-Rigid-Plastics.pdf xxx http://www.moorerecycling.com/2012Non-Bottle_Rigid_Rpt_Final_3.10.14SL_v2.pdf xxxi http://www.flexpack.org/INDUST/PRESS_RELEASES/2014/201406/EnergyBagProgram_Dow-MDedits.pdf xxxii http://america.aljazeera.com/articles/2014/11/11/the-afterlife-ofplastic.html xxxiii http://resource-recycling.com/node/2821 xxxiv www.container-recycling.org/assets/pdfs/reports/2009-singlestream.pdf xxxv http://www.sustainablepackaging.org/Uploads/Resources/ctl_design-for-recovery_paper.pdf xxxvi http://www.container-recycling.org/index.php/end-markets-for-collected-glass xxxvii www.epa.gov/wastes/nonhaz/municipal/msw99.htm xxxviii http://www.resource-recycling.com/images/Berenyi0115rr.pdf
Section 6.3 – Glossary of terms and definitions
A
All Rigid Plastic: The Association of Postconsumer Plastic Recyclers has several classifications
for bales of mixed rigid plastics. An “All Rigid Plastic (ARP)” bale spec is defined as: "All bottles, AND all household non-bottle containers (includes thermoform packaging, cups, trays, clamshells, food tubs), AND all bulky rigid plastic (includes carts, crates, buckets, baskets, toys, lawn furniture)"
B
Green Spectrum Consulting/Resource Recycling 33
Bio-based content: Fraction of the carbon content which is new carbon content made up of
biological materials or agricultural resources versus fossil carbon content. Bio-based content is measured following the procedures set by ASTM D6866.
Biodegradable Plastic: A plastic that undergoes biodegradation (a process in which the
degradation results from the action of naturally-occurring micro-organisms such as bacteria, fungi, and algae) as per accepted industry standards. As of 2008, accepted industry standard specifications are: ASTM D6400, ASTM D6868, ASTM D7081 or EN 13432.
Bioplastics: Bioplastics are plastics that have bio-based content, are biodegradable, or both.
“Bio-based,” “biodegradable” and “compostable” are individual attributes of bioplastics, and are not necessarily mutually exclusive.
C
Compostable Plastics: Plastics are biodegradable, but with an added benefit: when they
break down, they release valuable nutrients into the soil, aiding the growth of trees and plants. These products degrade within several months in an industrial composting facility and produce no toxic residues.
D
Degradable Plastic: A plastic designed to undergo a significant change in its chemical
structure under specific environmental conditions, resulting in a loss of some properties that may be measured by standard test methods appropriate to the plastic and the application in a period of time that determines its classification.
Dual-Stream: Dual-stream describes the practice of collecting recyclable materials in two
curbside containers. The system sees the collection of different types of recyclables (e.g., glass, plastic and aluminum containers and fiber) in two separate carts or bins.
F
Flexible Packaging: Definition from the Flexible Packaging Association, “Any package or part
of a package whose shape can be readily changed. It includes packaging utilizing paper, plastic, film, foil, metallized or coated papers and film, or any combination of these materials.
INCLUDED ARE: rollstock, bags, pouches, liners, shrink sleeves, shrink wrap and stretch wrap, bulk shipping sacks, flexible lidding, and film wrap around labels. NOT INCLUDED ARE: labels (other than shrink sleeve or film wrap around style),
Green Spectrum Consulting/Resource Recycling 34
photographic film or paper, photo paper, tape, toilet and facial tissues, diapers, feminine products and thermoforming materials whose shape can’t be readily changed.”
G
Glass Packaging: The Glass Packaging Institute defines glass containers as:
“Glass containers are commonly made with a combination of various oxides or oxygen-based compounds and are commonly referred to as 'soda-lime' glass. The combining of raw materials, including sand, soda ash, limestone and cullet, creates glass containers that are durable, strong, impermeable, easily shaped, and inexpensive. The proportion of raw materials is based on availability, chemical and physical consistency, sizing, purity and cost. The goal is to use the most economical and high-quality raw materials available. Some oxides will form glass without adding any other elements and are known as network formers. The most common of these is silica (SiO2)”
L Lightweighting: The practice of using less material in the production of packaging materials,
while still maintaining the integrity of the packaging.
M
Metal Packaging: Metal packaging is defined as: any metal food and/or beverage container,
including but not limited to steel food cans and aluminum beverage cans.
O
Out-Throws: Out-throws are materials that are rejected from a MRF because of
contamination or because there is no market for the collected material.
Oxo-Biodegradation of Plastics: Degradation identified as resulting from oxidative and
cell-mediated phenomena, either simultaneously or successively.
Oxo-Degradable Plastic: degradation identified as resulting from oxidative cleavage of
macromolecules.
P
Paper and Paperboard Packaging: 1) Printing, writing, and related paper, which is coated or uncoated paper, including
thermal but excluding carbonless paper, that is subsequently converted into products
Green Spectrum Consulting/Resource Recycling 35
used for printing, writing and other communication purposed, such as file folders, envelopes, catalogues, magazines and brochures;
2) Kraft packaging paper, which is coarse unbleached, semi-bleached or fully bleached grades of paper that is subsequently converted into products such as grocery bags, multiwall sacks, waxed paper and other products;
3) Containerboard, which is fall forms of linerboard and medium that is used to manufacture corrugated boxes, shipping containers and related products; and
4) Paperboard, which is solid bleached Kraft board, recycled board and unbleached Kraft board that is subsequently converted into a wide variety of end uses, including folding boxes, food and beverage packaging, tubes, cans, and drums, and other miscellaneous products. Paperboard does not include construction related products such as gypsum wallboard facings and panel board.
PET Thermoform Packaging: made from extruded sheet PET that is heated and then
typically vacuum-formed by a mold. Types of PET thermoform packaging include baskets, blister pack, clamshells, covers, cups, egg cartons, lids and trays.
R
Rigid Plastic Containers: Rigid plastic containers are formed or molded plastic that serves
as a package, and maintains its shape when empty and unsupported. Rigid plastic containers are used for food, beverage, personal care, household and pharmaceuticals products and are predominantly comprised of polyethylene terephthalate (PET), high-density polyethylene (HDPE), or polypropylene (PP).
S
Single-Stream: Single-stream describes the practice of collecting recyclable materials in a
single curbside container, typically a rollcart. Single-stream collection typically has taken the place of dual- or multi-stream collection of recyclable materials, where different types of recyclables (e.g., glass, plastic and aluminum containers and fiber) are collected in separate carts or bins.
W
Wishful Recycling: A description of the practice of a recycling program participant placing a
recyclable item in a curbside recycling bin or cart, even if that item is not among the listed items/materials accepted in a recycling program, "wishing" that the item will be recycled anyway.
Section 6.4 – Abbreviations The following abbreviations are used in the analysis:
Green Spectrum Consulting/Resource Recycling 36
ACC American Chemistry Council
AD Anaerobic Digestion
APR Association of Postconsumer Plastic Recyclers
ARP All Rigid Plastic
ASTM American Society for Testing and Materials
CPGs Consumer Packaged Goods
EPA United States Environmental Protection Agency
ERS Economic Research Service
FMCG Fast-Moving Consumer Goods
FPA Flexible Packaging Association
GHG Greenhouse Gas
HDPE High-Density Polyethylene
LCA Life Cycle Assessment
LDPE Low-density polyethylene
LLC Limited Liability Company
MRFs Materials Recovery Facilities
MSW Municipal Solid Waste
MWP Mixed-Waste Processing
MWPF Mixed-Waste Processing Facility
NAPCOR National Association for PET Container Resources
PCR Post-Consumer Recycled Content
PE Polyethylene
PET Polyethylene Terephthalate
PLA Polylactic Acid
PP Polypropylene
PRF Plastics Recovery Facilities
PS Polystyrene
PTF Plastics-to-Fuel
PTO Plastics-to-Oil
RMC Resource Management Companies
USDA United States Department of Agriculture