making geospatial pdf maps from osm with gdal -...
TRANSCRIPT
Making geospatial PDF maps from OSM with GDAL
Summary
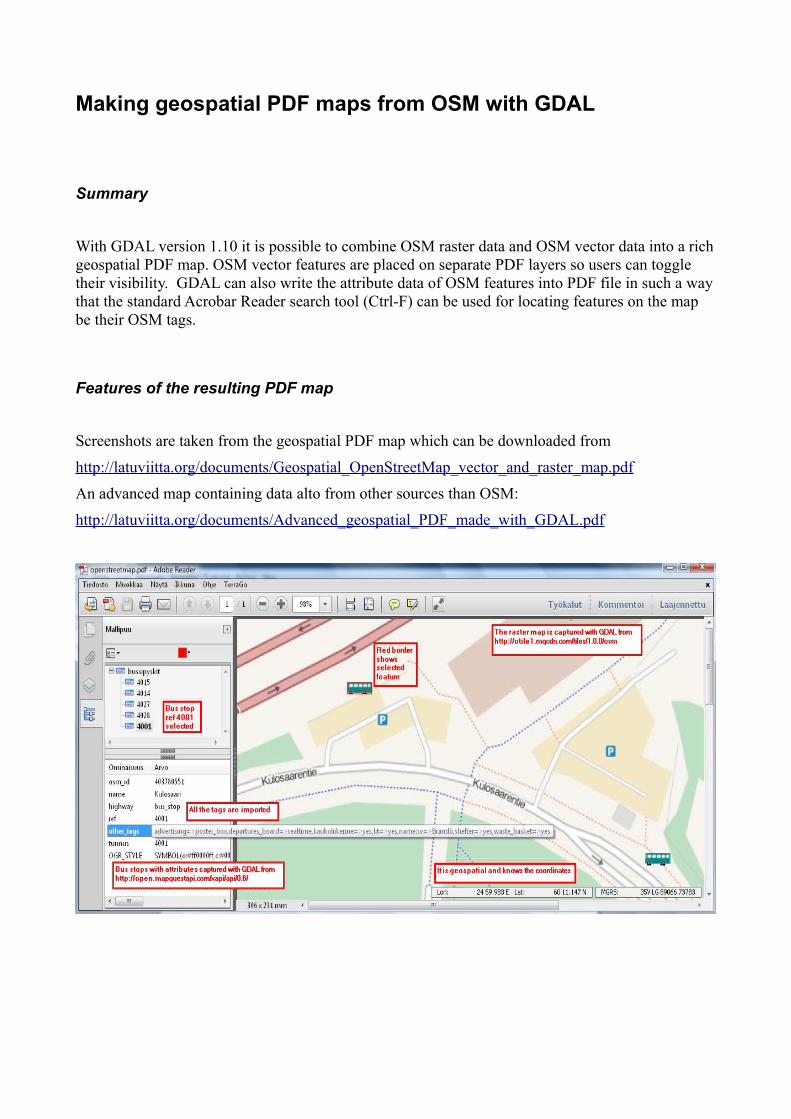
With GDAL version 1.10 it is possible to combine OSM raster data and OSM vector data into a rich geospatial PDF map. OSM vector features are placed on separate PDF layers so users can toggle their visibility. GDAL can also write the attribute data of OSM features into PDF file in such a way that the standard Acrobar Reader search tool (Ctrl-F) can be used for locating features on the map be their OSM tags.
Features of the resulting PDF map
Screenshots are taken from the geospatial PDF map which can be downloaded from
http://latuviitta.org/documents/Geospatial_OpenStreetMap_vector_and_raster_map.pdf
An advanced map containing data alto from other sources than OSM:
http://latuviitta.org/documents/Advanced_geospatial_PDF_made_with_GDAL.pdf
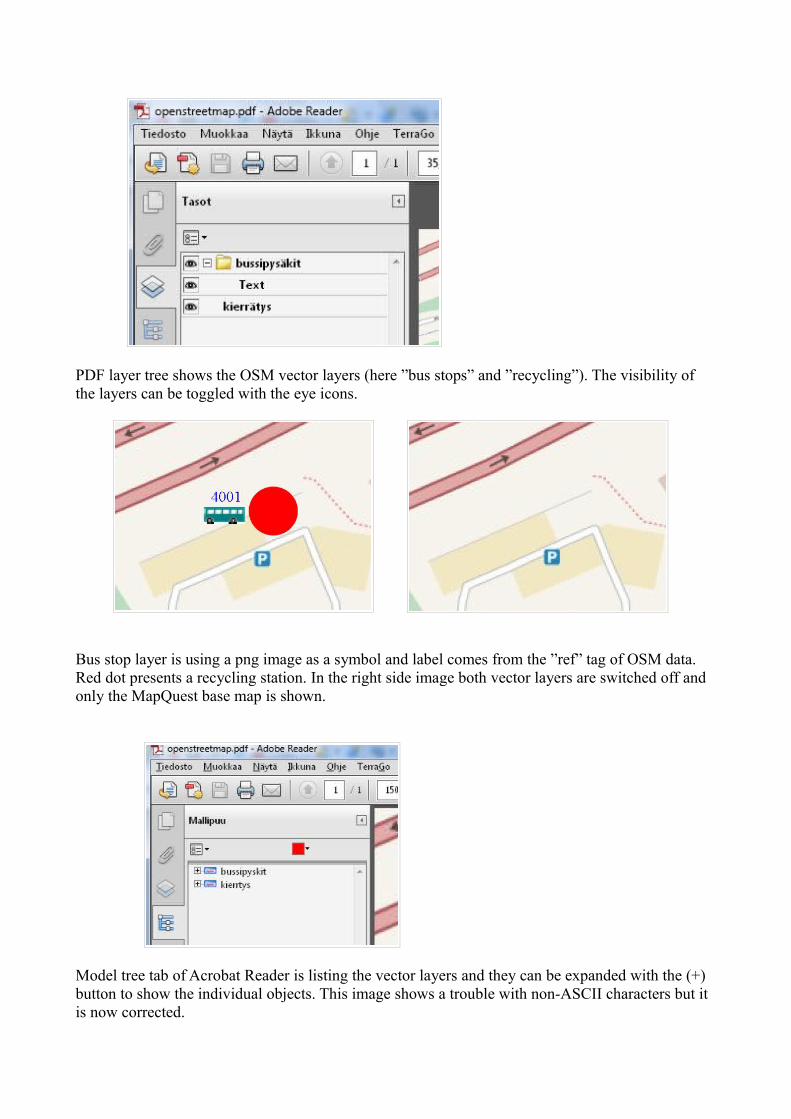
PDF layer tree shows the OSM vector layers (here ”bus stops” and ”recycling”). The visibility of the layers can be toggled with the eye icons.
Bus stop layer is using a png image as a symbol and label comes from the ”ref” tag of OSM data. Red dot presents a recycling station. In the right side image both vector layers are switched off and only the MapQuest base map is shown.
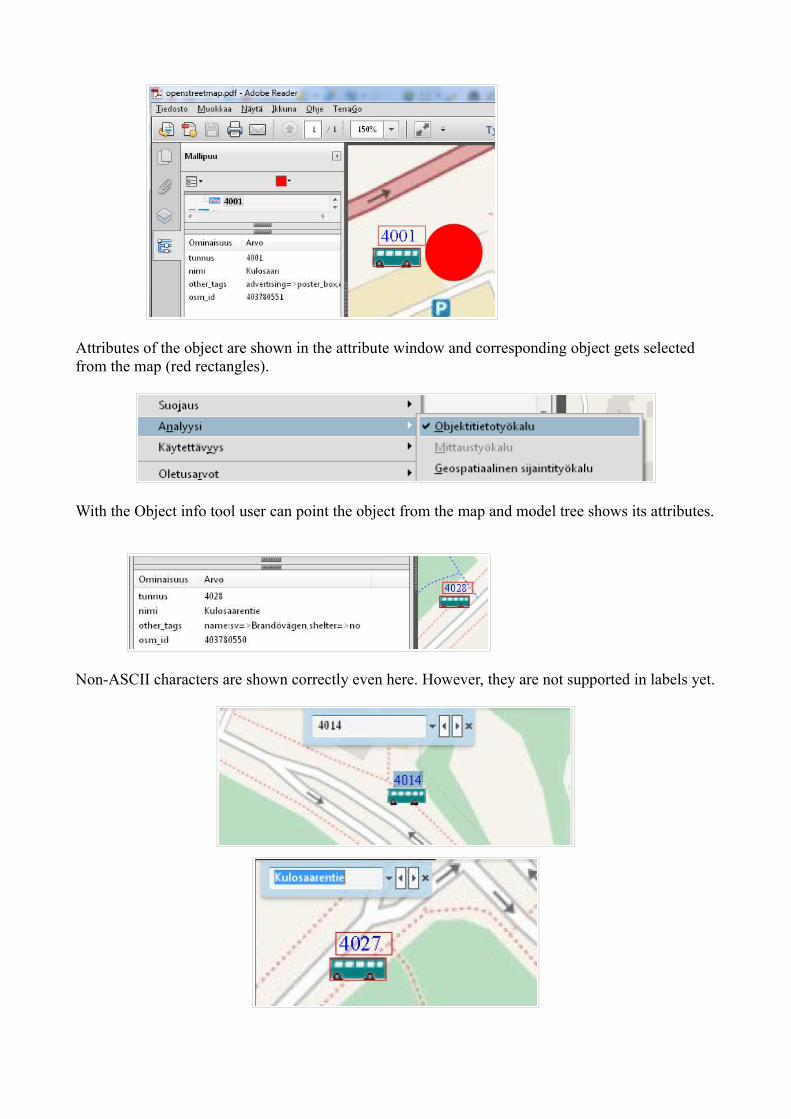
Model tree tab of Acrobat Reader is listing the vector layers and they can be expanded with the (+) button to show the individual objects. This image shows a trouble with non-ASCII characters but it is now corrected.
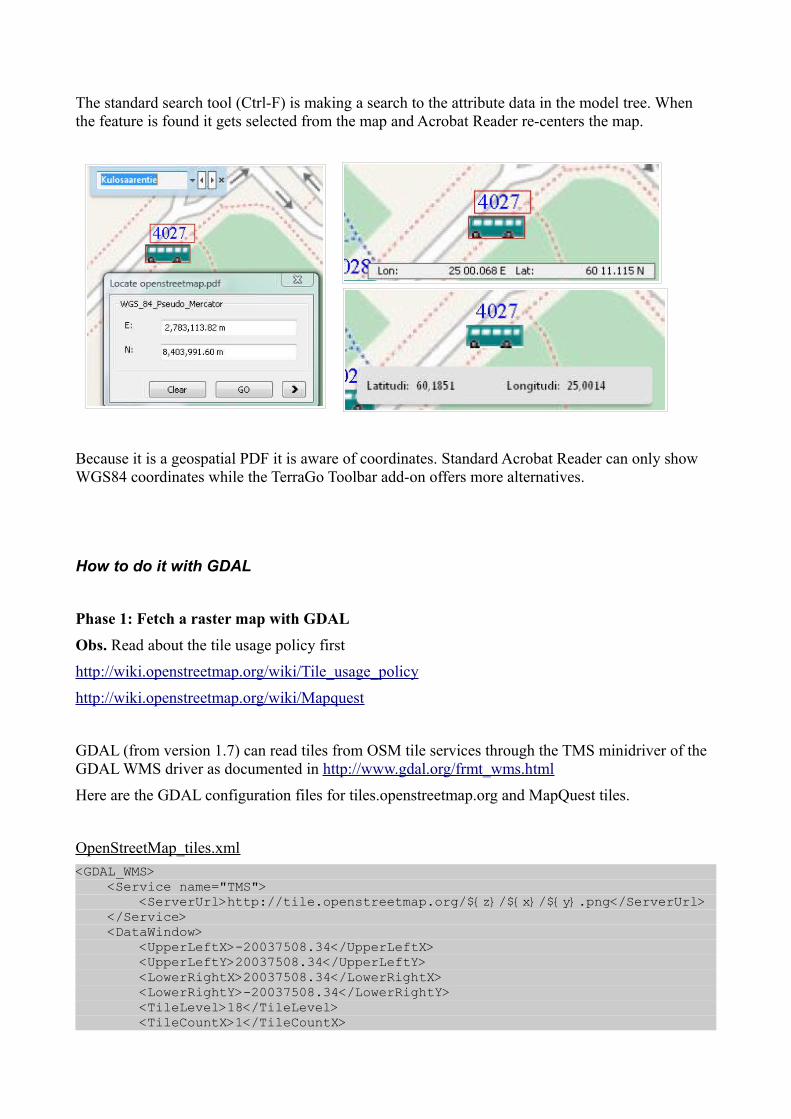
Attributes of the object are shown in the attribute window and corresponding object gets selected from the map (red rectangles).
With the Object info tool user can point the object from the map and model tree shows its attributes.
Non-ASCII characters are shown correctly even here. However, they are not supported in labels yet.
The standard search tool (Ctrl-F) is making a search to the attribute data in the model tree. When the feature is found it gets selected from the map and Acrobat Reader re-centers the map.
Because it is a geospatial PDF it is aware of coordinates. Standard Acrobat Reader can only show WGS84 coordinates while the TerraGo Toolbar add-on offers more alternatives.
How to do it with GDAL
Phase 1: Fetch a raster map with GDAL
Obs. Read about the tile usage policy first
http://wiki.openstreetmap.org/wiki/Tile_usage_policy
http://wiki.openstreetmap.org/wiki/Mapquest
GDAL (from version 1.7) can read tiles from OSM tile services through the TMS minidriver of the GDAL WMS driver as documented in http://www.gdal.org/frmt_wms.html
Here are the GDAL configuration files for tiles.openstreetmap.org and MapQuest tiles.
OpenStreetMap_tiles.xml
<GDAL_WMS> <Service name="TMS"> <ServerUrl>http://tile.openstreetmap.org/${z}/${x}/${y}.png</ServerUrl> </Service> <DataWindow> <UpperLeftX>-20037508.34</UpperLeftX> <UpperLeftY>20037508.34</UpperLeftY> <LowerRightX>20037508.34</LowerRightX> <LowerRightY>-20037508.34</LowerRightY> <TileLevel>18</TileLevel> <TileCountX>1</TileCountX>

<TileCountY>1</TileCountY> <YOrigin>top</YOrigin> </DataWindow> <Projection>EPSG:3857</Projection> <BlockSizeX>256</BlockSizeX> <BlockSizeY>256</BlockSizeY> <BandsCount>3</BandsCount> <Cache /></GDAL_WMS>
MapQuest_tiles.xml
<GDAL_WMS> <Service name="TMS"> <ServerUrl>http://otile1.mqcdn.com/tiles/1.0.0/osm/${z}/${x}/${y}.png</ServerUrl> </Service> <DataWindow> <UpperLeftX>-20037508.34</UpperLeftX> <UpperLeftY>20037508.34</UpperLeftY> <LowerRightX>20037508.34</LowerRightX> <LowerRightY>-20037508.34</LowerRightY> <TileLevel>18</TileLevel> <TileCountX>1</TileCountX> <TileCountY>1</TileCountY> <YOrigin>top</YOrigin> </DataWindow> <Projection>EPSG:3857</Projection> <BlockSizeX>256</BlockSizeX> <BlockSizeY>256</BlockSizeY> <BandsCount>3</BandsCount> <Cache /></GDAL_WMS>
The connection with tile servers can be tested with the following GDAL commands.
gdal_translate -of png -outsize 512 512 OpenStreetMap_tiles.xml OSM-tiletest.png
gdal_translate -of png -outsize 512 512 MapQuest_tiles.xml MapQuest-tiletest.png
If everything is OK the result will look like this

A map from tiles.openstreetmap.org A map from MapQuest
Phase 2: Reading OSM vector data with GDAL
GDAL version 1.10 (currently development version) can read OSM data in both OSM-XML and in OSM.pbf format. OSM data can be stored locally into a file but with a brand new ”vsicurl” mechanism GDAL can also consume data from OSM API, XAPI of Overpass API.
In this tutorial we add some POI features into PDF map. Features have OSM tags ”highway=bus_stop” and ”amenity=recycling”. We will also have some special interest for ”ref” and ”name” tags and therefore we must check that the GDAL OSM driver configuration file ”osmconf.ini” contains at least these tags for the point laeyer. [points]# common attributesosm_id=yesosm_version=noosm_timestamp=noosm_uid=noosm_user=noosm_changeset=no
# keys to report as OGR fieldsattributes=amenity,name,barrier,highway,ref,address,is_in,place,man_made
Because of our final aim which is to combine OSM raster data and vector data and save them as a geospatial PDF file it is best to read OSM vector data through GDAL virtual OGR system. http://www.gdal.org/ogr/drv_vrt.html.
Next we write four GDAL virtual OGR files for reading OSM data from different sources.

VRT-example 1: OSM data from a local OSM.pbf file ”d:\data\finland.osm.pbf”
<OGRVRTDataSource> <OGRVRTLayer name="toilets"> <SrcDataSource>d:/osm_data/finland.osm.pbf</SrcDataSource> <LayerSRS>WGS84</LayerSRS> <SrcSQL>SELECT *,osm_id as tunnus, 'SYMBOL(id:ogr-sym-3,c:#FF0000,s:50px)' as OGR_STYLE from points where amenity='toilets'</SrcSQL> </OGRVRTLayer></OGRVRTDataSource>
VRT-example 2: OSM data from XAPI
<OGRVRTDataSource> <OGRVRTLayer name="XAPI-bus_stops"> <SrcDataSource>/vsicurl_streaming/http://open.mapquestapi.com/xapi/api/0.6/node[highway=bus_stop][bbox=24.816,60.128,25.037,60.297]</SrcDataSource> <LayerSRS>WGS84</LayerSRS> <SrcSQL>SELECT *,ref as tunnus, 'SYMBOL(id:bus_stop.png)' as OGR_STYLE from points where highway='bus_stop'</SrcSQL> </OGRVRTLayer></OGRVRTDataSource>
VRT-example 3: OSM data from local OSM-XML file ”xapi_bus_stops.osm” (refers to data captured from XAPI with the same query than in example 2)
<OGRVRTDataSource> <OGRVRTLayer name="bus_stops"> <SrcDataSource>xapi_bus_stops.osm</SrcDataSource> <LayerSRS>WGS84</LayerSRS> <SrcSQL>SELECT *,ref as tunnus, name as nimi, 'SYMBOL(c:#000000FF,id:bus_stop.png)' as OGR_STYLE from points where highway='bus_stop'</SrcSQL> <Field name="tunnus"/> <Field name="nimi"/> <Field name="other_tags"/> <Field name="osm_id"/> </OGRVRTLayer></OGRVRTDataSource>
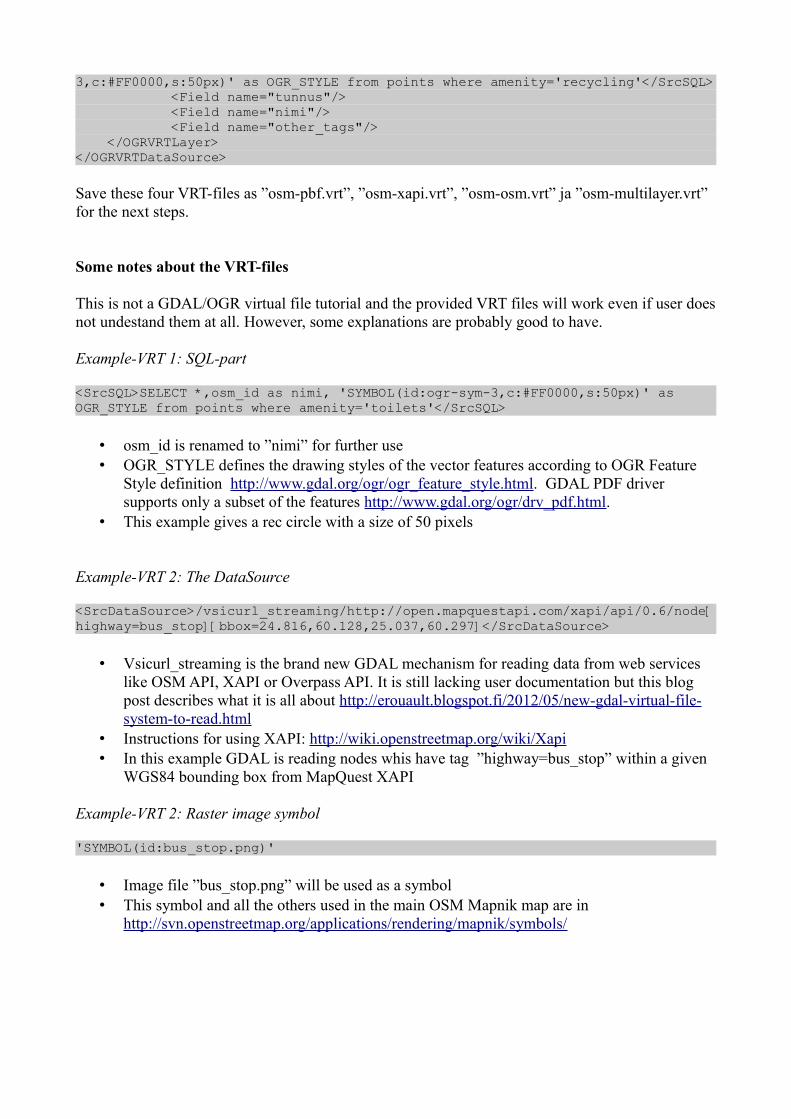
VRT-example 4: One VRT with two OSM layers ”bus_stops” and ”recycling”
<OGRVRTDataSource> <OGRVRTLayer name="bus_stops"> <SrcDataSource>xapi_bus_stops.osm</SrcDataSource> <LayerSRS>WGS84</LayerSRS> <SrcSQL>SELECT *,ref as tunnus, name as nimi, 'SYMBOL(c:#000000FF,id:bus_stop.png);LABEL(f:"Arial, Helvetica", c:#0000FF, dx:-10, dy:10, s:32px, t:{tunnus})' as OGR_STYLE from points where highway='bus_stop'</SrcSQL> <Field name="tunnus"/> <Field name="nimi"/> <Field name="other_tags"/> <Field name="osm_id"/> </OGRVRTLayer> <OGRVRTLayer name="recycling"> <SrcDataSource>h:/osm_data/finland.osm.pbf</SrcDataSource> <LayerSRS>WGS84</LayerSRS> <SrcSQL>SELECT *,osm_id as tunnus, 'SYMBOL(id:ogr-sym-
3,c:#FF0000,s:50px)' as OGR_STYLE from points where amenity='recycling'</SrcSQL> <Field name="tunnus"/> <Field name="nimi"/> <Field name="other_tags"/> </OGRVRTLayer></OGRVRTDataSource>
Save these four VRT-files as ”osm-pbf.vrt”, ”osm-xapi.vrt”, ”osm-osm.vrt” ja ”osm-multilayer.vrt” for the next steps.
Some notes about the VRT-files
This is not a GDAL/OGR virtual file tutorial and the provided VRT files will work even if user does not undestand them at all. However, some explanations are probably good to have.
Example-VRT 1: SQL-part
<SrcSQL>SELECT *,osm_id as nimi, 'SYMBOL(id:ogr-sym-3,c:#FF0000,s:50px)' as OGR_STYLE from points where amenity='toilets'</SrcSQL>
• osm_id is renamed to ”nimi” for further use• OGR_STYLE defines the drawing styles of the vector features according to OGR Feature
Style definition http://www.gdal.org/ogr/ogr_feature_style.html. GDAL PDF driver supports only a subset of the features http://www.gdal.org/ogr/drv_pdf.html.
• This example gives a rec circle with a size of 50 pixels
Example-VRT 2: The DataSource
<SrcDataSource>/vsicurl_streaming/http://open.mapquestapi.com/xapi/api/0.6/node[highway=bus_stop][bbox=24.816,60.128,25.037,60.297]</SrcDataSource>
• Vsicurl_streaming is the brand new GDAL mechanism for reading data from web services like OSM API, XAPI or Overpass API. It is still lacking user documentation but this blog post describes what it is all about http://erouault.blogspot.fi/2012/05/new-gdal-virtual-file-system-to-read.html
• Instructions for using XAPI: http://wiki.openstreetmap.org/wiki/Xapi• In this example GDAL is reading nodes whis have tag ”highway=bus_stop” within a given
WGS84 bounding box from MapQuest XAPI
Example-VRT 2: Raster image symbol
'SYMBOL(id:bus_stop.png)'
• Image file ”bus_stop.png” will be used as a symbol• This symbol and all the others used in the main OSM Mapnik map are in
http://svn.openstreetmap.org/applications/rendering/mapnik/symbols/

Example-VRT 3: Symbol transparency
'SYMBOL(c:#000000FF,id:bus_stop.png)'
• Same as above but with a c(olor) parameter. It does not change the color of bitmap symbol but it can be used for controlling the transparency. The default is to draw 50 % transparent symbol but ”FF” in the parameter value c:#000000FF makes symbol totally opaque. Value is given as a hexadecimal value on range 00-FF.
Example-VRT 3: The Field name trick
• ”Field name” -parameters are used for preventing writing OGR_STYLE strings as object attributes into PDF file. Without Field name parameters all the attributes which are getting selected with the SQL clause would be saved into PDF.
Example-VRT 4: Defining both the symbol and label for the objects
'SYMBOL(c:#000000FF,id:bus_stop.png);LABEL(f:"Arial, Helvetica", c:#0000FF, dx:-10, dy:10, s:32px, t:{tunnus})'
• Raster file ”bus_stop.png” is used as a symbol• Objects will have also labels
• The font to use is Arial, but if it is not found, GDAL will try to use Helvetica• Font color is blue• Label will have offsets of 10 pixels to the left and 10 pixels upwards• Font size is 32 pixels• Label value is taken from the data, from attribute field ”tunnus”
Test data used in this tutorial
• Finland.osm.pbf file from http://download.geofabrik.de/openstreetmap/europe/ • Bus stop data from MapQuest XAPI. The query to use is
http://open.mapquestapi.com/xapi/api/0.6/node[highway=bus_stop][bbox=24.816,60.128,25.037,60.297 ]
For experiments it is good to save the data from XAPI into disk so you do not need to fetch it from XAPI every time because it is faster for you and less heavy for the service.
Testing the VRT-datasources
Run the following GDAL commands
ogrinfo osm-pbf.vrtINFO: Open of `osm-pbf.vrt' using driver `VRT' successful.1: toilets (3D Point)
D:\OSM-PDF>ogrinfo osm-osm.vrtINFO: Open of `osm-osm.vrt' using driver `VRT' successful.1: bus_stops (3D Point)
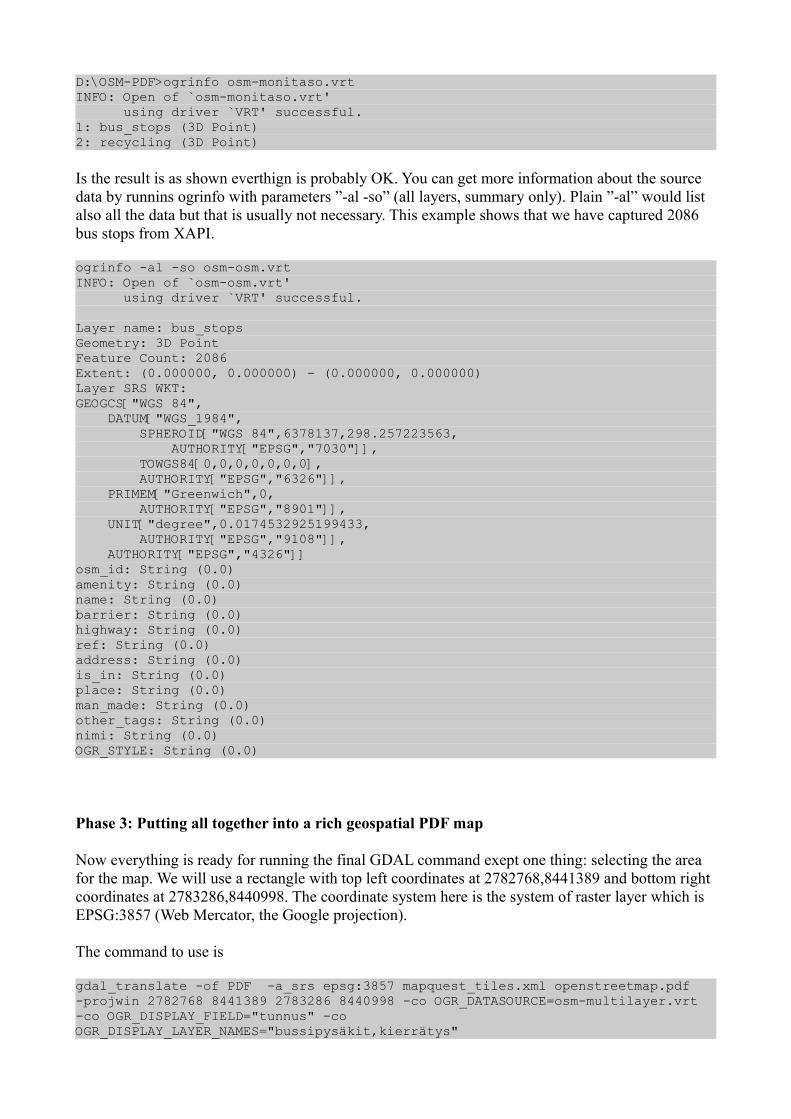
D:\OSM-PDF>ogrinfo osm-monitaso.vrtINFO: Open of `osm-monitaso.vrt' using driver `VRT' successful.1: bus_stops (3D Point)2: recycling (3D Point)
Is the result is as shown everthign is probably OK. You can get more information about the source data by runnins ogrinfo with parameters ”-al -so” (all layers, summary only). Plain ”-al” would list also all the data but that is usually not necessary. This example shows that we have captured 2086 bus stops from XAPI.
ogrinfo -al -so osm-osm.vrtINFO: Open of `osm-osm.vrt' using driver `VRT' successful.
Layer name: bus_stopsGeometry: 3D PointFeature Count: 2086Extent: (0.000000, 0.000000) - (0.000000, 0.000000)Layer SRS WKT:GEOGCS["WGS 84", DATUM["WGS_1984", SPHEROID["WGS 84",6378137,298.257223563, AUTHORITY["EPSG","7030"]], TOWGS84[0,0,0,0,0,0,0], AUTHORITY["EPSG","6326"]], PRIMEM["Greenwich",0, AUTHORITY["EPSG","8901"]], UNIT["degree",0.0174532925199433, AUTHORITY["EPSG","9108"]], AUTHORITY["EPSG","4326"]]osm_id: String (0.0)amenity: String (0.0)name: String (0.0)barrier: String (0.0)highway: String (0.0)ref: String (0.0)address: String (0.0)is_in: String (0.0)place: String (0.0)man_made: String (0.0)other_tags: String (0.0)nimi: String (0.0)OGR_STYLE: String (0.0)
Phase 3: Putting all together into a rich geospatial PDF map
Now everything is ready for running the final GDAL command exept one thing: selecting the area for the map. We will use a rectangle with top left coordinates at 2782768,8441389 and bottom right coordinates at 2783286,8440998. The coordinate system here is the system of raster layer which is EPSG:3857 (Web Mercator, the Google projection).
The command to use is
gdal_translate -of PDF -a_srs epsg:3857 mapquest_tiles.xml openstreetmap.pdf -projwin 2782768 8441389 2783286 8440998 -co OGR_DATASOURCE=osm-multilayer.vrt -co OGR_DISPLAY_FIELD="tunnus" -co OGR_DISPLAY_LAYER_NAMES="bussipysäkit,kierrätys"
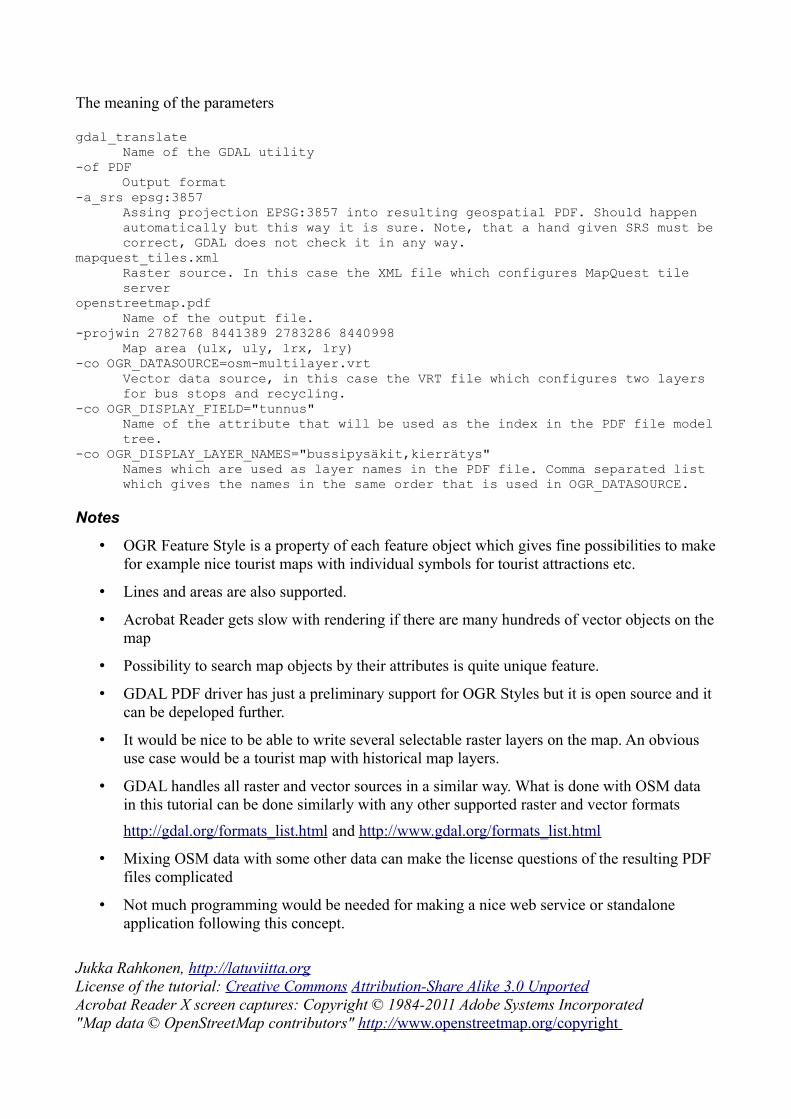
The meaning of the parameters
gdal_translateName of the GDAL utility
-of PDFOutput format
-a_srs epsg:3857Assing projection EPSG:3857 into resulting geospatial PDF. Should happen automatically but this way it is sure. Note, that a hand given SRS must be correct, GDAL does not check it in any way.
mapquest_tiles.xmlRaster source. In this case the XML file which configures MapQuest tile server
openstreetmap.pdf Name of the output file.
-projwin 2782768 8441389 2783286 8440998Map area (ulx, uly, lrx, lry)
-co OGR_DATASOURCE=osm-multilayer.vrt Vector data source, in this case the VRT file which configures two layers for bus stops and recycling.
-co OGR_DISPLAY_FIELD="tunnus" Name of the attribute that will be used as the index in the PDF file model tree.
-co OGR_DISPLAY_LAYER_NAMES="bussipysäkit,kierrätys"Names which are used as layer names in the PDF file. Comma separated list which gives the names in the same order that is used in OGR_DATASOURCE.
Notes
• OGR Feature Style is a property of each feature object which gives fine possibilities to make for example nice tourist maps with individual symbols for tourist attractions etc.
• Lines and areas are also supported.
• Acrobat Reader gets slow with rendering if there are many hundreds of vector objects on the map
• Possibility to search map objects by their attributes is quite unique feature.
• GDAL PDF driver has just a preliminary support for OGR Styles but it is open source and it can be depeloped further.
• It would be nice to be able to write several selectable raster layers on the map. An obvious use case would be a tourist map with historical map layers.
• GDAL handles all raster and vector sources in a similar way. What is done with OSM data in this tutorial can be done similarly with any other supported raster and vector formats
http://gdal.org/formats_list.html and http://www.gdal.org/formats_list.html
• Mixing OSM data with some other data can make the license questions of the resulting PDF files complicated
• Not much programming would be needed for making a nice web service or standalone application following this concept.
Jukka Rahkonen, http://latuviitta.orgLicense of the tutorial: Creative Commons Attribution-Share Alike 3.0 UnportedAcrobat Reader X screen captures: Copyright © 1984-2011 Adobe Systems Incorporated "Map data © OpenStreetMap contributors" http:// www.openstreetmap.org/copyright
More features
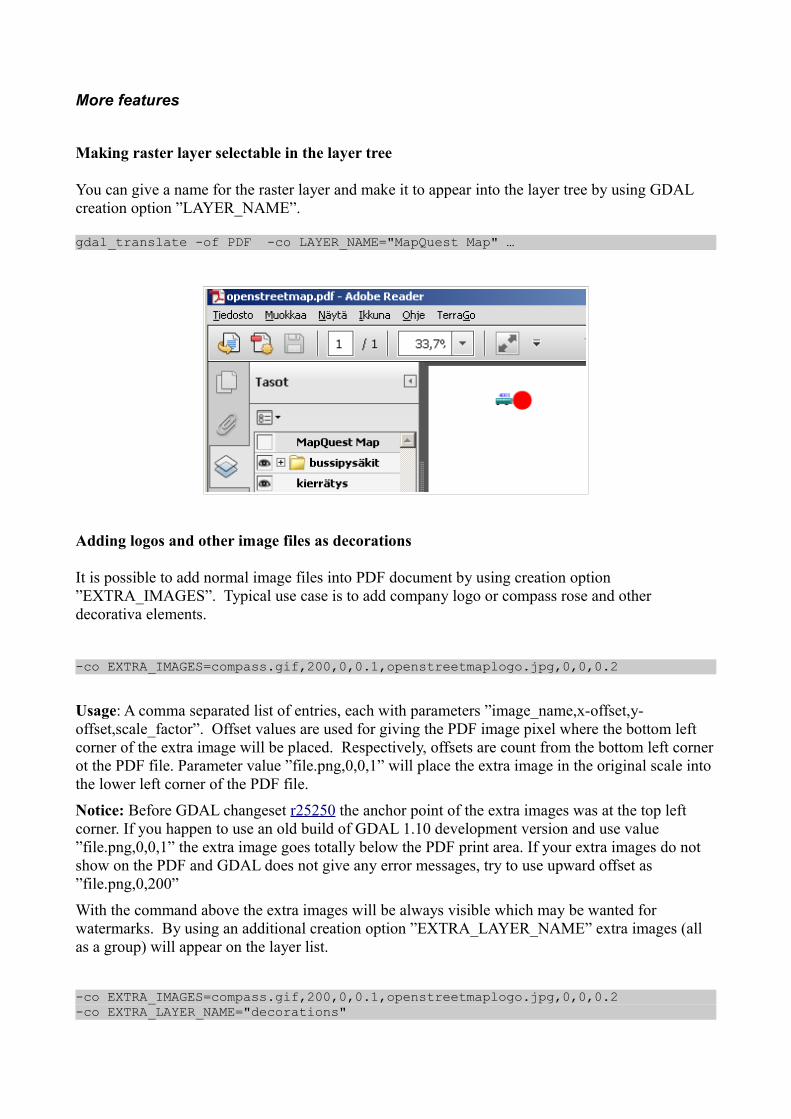
Making raster layer selectable in the layer tree
You can give a name for the raster layer and make it to appear into the layer tree by using GDAL creation option ”LAYER_NAME”.
gdal_translate -of PDF -co LAYER_NAME="MapQuest Map" …
Adding logos and other image files as decorations
It is possible to add normal image files into PDF document by using creation option ”EXTRA_IMAGES”. Typical use case is to add company logo or compass rose and other decorativa elements.
-co EXTRA_IMAGES=compass.gif,200,0,0.1,openstreetmaplogo.jpg,0,0,0.2
Usage: A comma separated list of entries, each with parameters ”image_name,x-offset,y-offset,scale_factor”. Offset values are used for giving the PDF image pixel where the bottom left corner of the extra image will be placed. Respectively, offsets are count from the bottom left corner ot the PDF file. Parameter value ”file.png,0,0,1” will place the extra image in the original scale into the lower left corner of the PDF file.
Notice: Before GDAL changeset r25250 the anchor point of the extra images was at the top left corner. If you happen to use an old build of GDAL 1.10 development version and use value ”file.png,0,0,1” the extra image goes totally below the PDF print area. If your extra images do not show on the PDF and GDAL does not give any error messages, try to use upward offset as ”file.png,0,200”
With the command above the extra images will be always visible which may be wanted for watermarks. By using an additional creation option ”EXTRA_LAYER_NAME” extra images (all as a group) will appear on the layer list.
-co EXTRA_IMAGES=compass.gif,200,0,0.1,openstreetmaplogo.jpg,0,0,0.2-co EXTRA_LAYER_NAME="decorations"
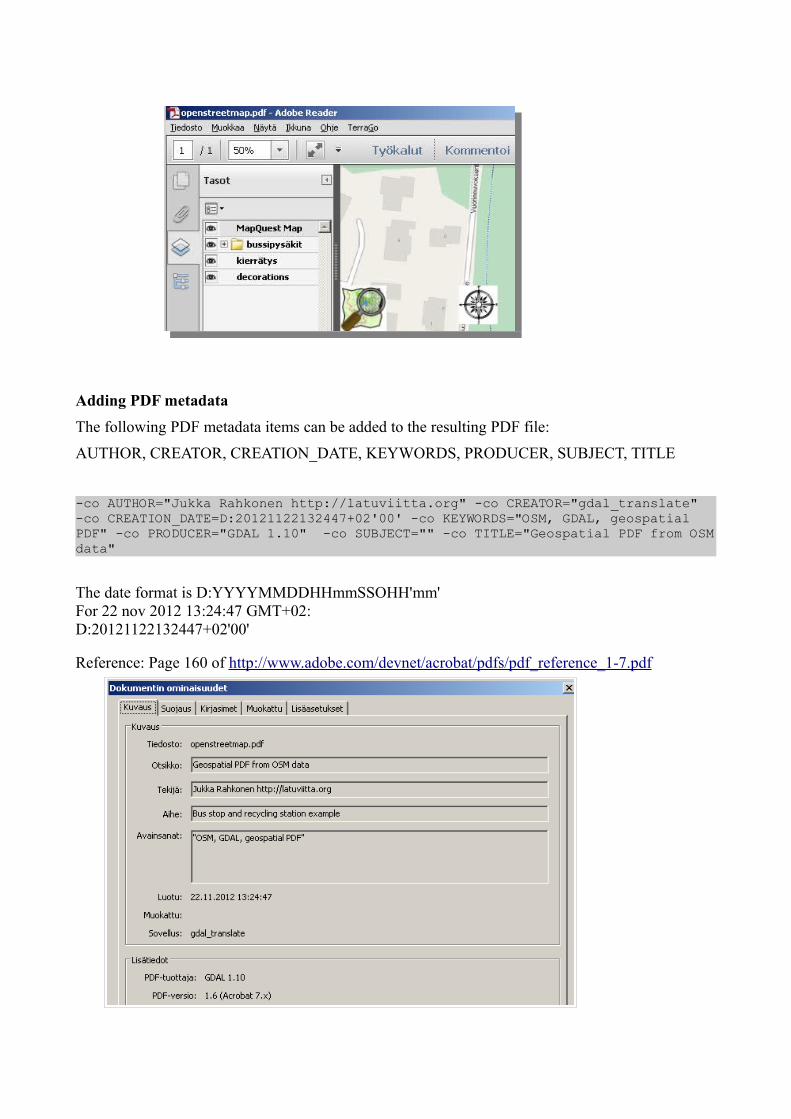
Adding PDF metadata
The following PDF metadata items can be added to the resulting PDF file:
AUTHOR, CREATOR, CREATION_DATE, KEYWORDS, PRODUCER, SUBJECT, TITLE
-co AUTHOR="Jukka Rahkonen http://latuviitta.org" -co CREATOR="gdal_translate" -co CREATION_DATE=D:20121122132447+02'00' -co KEYWORDS="OSM, GDAL, geospatial PDF" -co PRODUCER="GDAL 1.10" -co SUBJECT="" -co TITLE="Geospatial PDF from OSM data"
The date format is D:YYYYMMDDHHmmSSOHH'mm'For 22 nov 2012 13:24:47 GMT+02:D:20121122132447+02'00'
Reference: Page 160 of http://www.adobe.com/devnet/acrobat/pdfs/pdf_reference_1-7.pdf
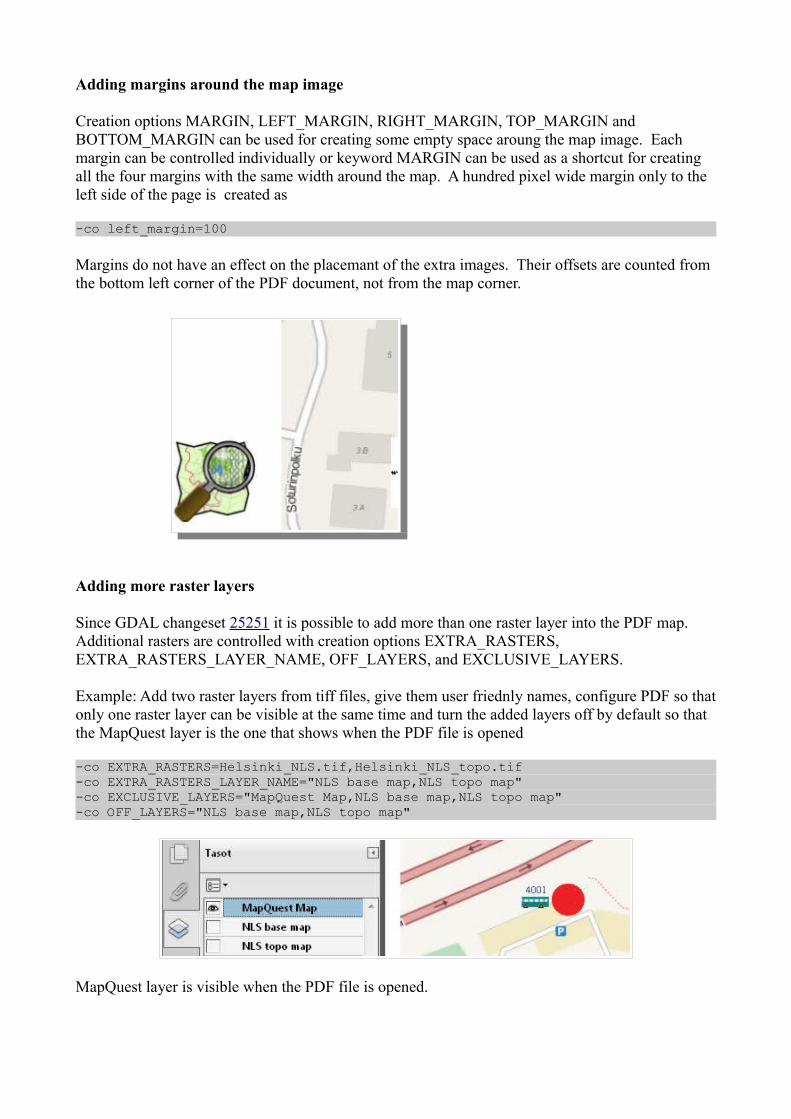
Adding margins around the map image
Creation options MARGIN, LEFT_MARGIN, RIGHT_MARGIN, TOP_MARGIN and BOTTOM_MARGIN can be used for creating some empty space aroung the map image. Each margin can be controlled individually or keyword MARGIN can be used as a shortcut for creating all the four margins with the same width around the map. A hundred pixel wide margin only to the left side of the page is created as
-co left_margin=100
Margins do not have an effect on the placemant of the extra images. Their offsets are counted from the bottom left corner of the PDF document, not from the map corner.
Adding more raster layers
Since GDAL changeset 25251 it is possible to add more than one raster layer into the PDF map.Additional rasters are controlled with creation options EXTRA_RASTERS, EXTRA_RASTERS_LAYER_NAME, OFF_LAYERS, and EXCLUSIVE_LAYERS.
Example: Add two raster layers from tiff files, give them user friednly names, configure PDF so that only one raster layer can be visible at the same time and turn the added layers off by default so that the MapQuest layer is the one that shows when the PDF file is opened
-co EXTRA_RASTERS=Helsinki_NLS.tif,Helsinki_NLS_topo.tif-co EXTRA_RASTERS_LAYER_NAME="NLS base map,NLS topo map"-co EXCLUSIVE_LAYERS="MapQuest Map,NLS base map,NLS topo map"-co OFF_LAYERS="NLS base map,NLS topo map"
MapQuest layer is visible when the PDF file is opened.

Setting NLS base map ON turns MapQuest layer OFF automatically.
Notice, that all the images must use the same coordinate reference system than the base layer. If the originals do not, convert them with gdalwarp. For saving disk space the target format of gdalwarp can be a GDAL virtual raster format http://www.gdal.org/gdal_vrttut.html
How to use shapefiles for creating per feature styling
Digitize your features.
Fill in the attributes, including the OGR_STYLE strings. Save the file into a shapefile. Add the new shapefile as a new layer into the OGR_DATASOURCE .vrt file as follows.
<OGRVRTLayer name="zoo"> <SrcDataSource>zoo.shp</SrcDataSource> <LayerSRS>EPSG:3857</LayerSRS> <SrcSQL>SELECT tunnus, desc as description, OGR_STYLE from zoo</SrcSQL> <Field name="tunnus"/> <Field name="description"/> </OGRVRTLayer>
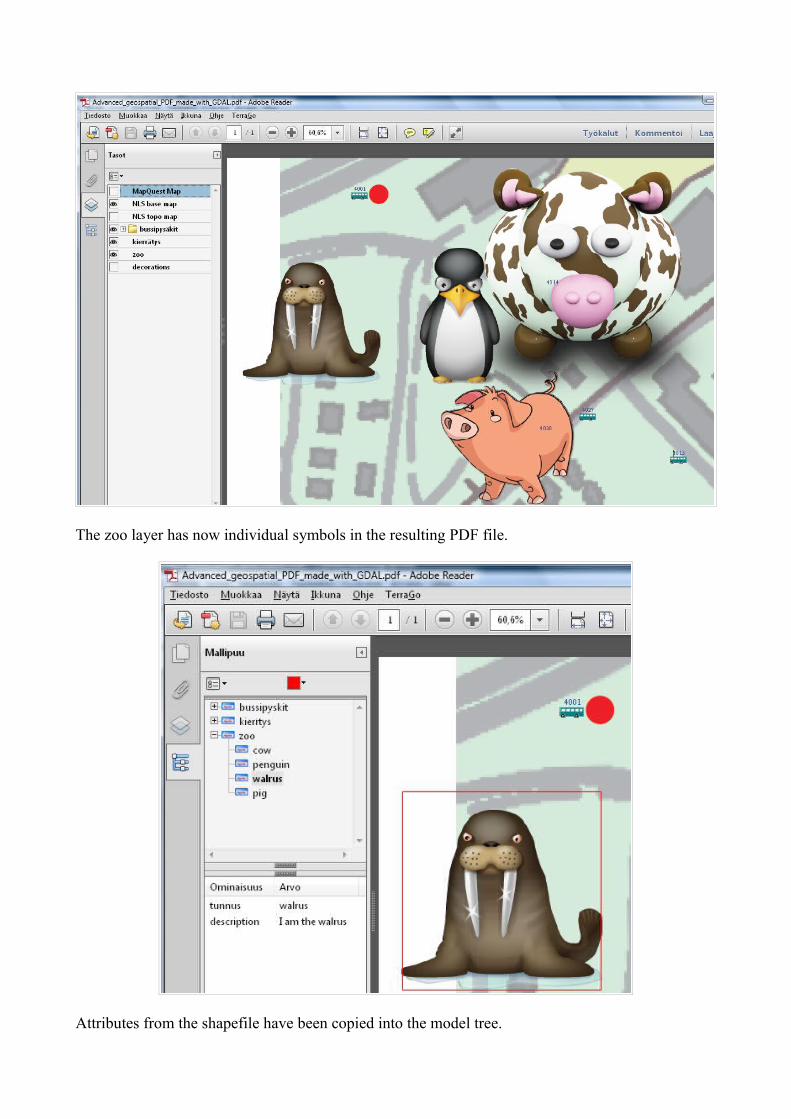
The zoo layer has now individual symbols in the resulting PDF file.
Attributes from the shapefile have been copied into the model tree.

Make PDF reader to run some Javascript code when the map is opened
It is possible to embed Javascript code into PDF file so that it will be run at document opening by using creation option ”JAVASCRIPT” or ”JAVASCRIPT_FILE”. This exapmple is about the latter.
Write the Javascript code and save it into a file.
button = app.alert({cMsg: 'This message proves that GDAL can add Javascript code into PDF files. Try also web links by clicking the OpenStreetMap logo and bus stop symbols on the map. Do you want to read the PDF driver document page from the web now?', cTitle: 'Question', nIcon:2, nType:2}); if (button == 4) app.launchURL('http://www.gdal.org/frmt_pdf.html');
As a result the following message is shown at PDF file opening and by answering Yes to the question the PDF manual page will be opened by a web browser.
Add web links to extra images
We have already seen an example about using the The EXTRA_IMAGES creation option but not about how to add a link into the image so that a web page will be opened into a browser when user clicks on the image in the PDF document. This is possible since GDAL version r25276 and which introduced an optional fifth parameter into EXTRA_IMAGES creation option.
-co EXTRA_IMAGES=openstreetmaplogo.jpg,0,40,0.2,link=http://openstreetmap.org
As a result the OpenStreetMap logo in the PDF document will have a link.
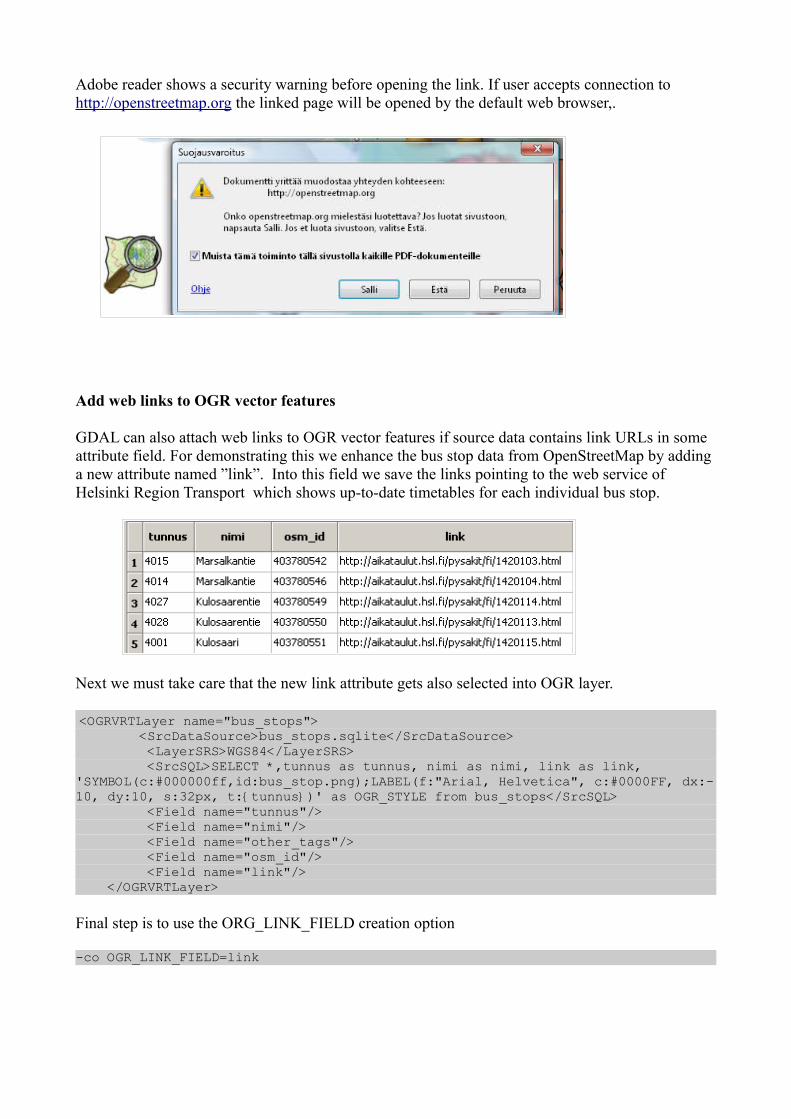
Adobe reader shows a security warning before opening the link. If user accepts connection to http://openstreetmap.org the linked page will be opened by the default web browser,.
Add web links to OGR vector features
GDAL can also attach web links to OGR vector features if source data contains link URLs in some attribute field. For demonstrating this we enhance the bus stop data from OpenStreetMap by adding a new attribute named ”link”. Into this field we save the links pointing to the web service of Helsinki Region Transport which shows up-to-date timetables for each individual bus stop.
Next we must take care that the new link attribute gets also selected into OGR layer.
<OGRVRTLayer name="bus_stops"> <SrcDataSource>bus_stops.sqlite</SrcDataSource> <LayerSRS>WGS84</LayerSRS> <SrcSQL>SELECT *,tunnus as tunnus, nimi as nimi, link as link, 'SYMBOL(c:#000000ff,id:bus_stop.png);LABEL(f:"Arial, Helvetica", c:#0000FF, dx:-10, dy:10, s:32px, t:{tunnus})' as OGR_STYLE from bus_stops</SrcSQL> <Field name="tunnus"/> <Field name="nimi"/> <Field name="other_tags"/> <Field name="osm_id"/> <Field name="link"/> </OGRVRTLayer>
Final step is to use the ORG_LINK_FIELD creation option
-co OGR_LINK_FIELD=link

Bus stop features on the PDF map contains now links to the timetable service.
If user accepts the security warning the timetable of the clicked bus stop opens into web browser from the web site of Helsinki Region Transport.