make a census explorer with shiny
TRANSCRIPT

Ari Lamstein - AriLamstein.comR-ladies, July 2015
Make a Census Explorer with Shiny

Default Shiny App
Part I
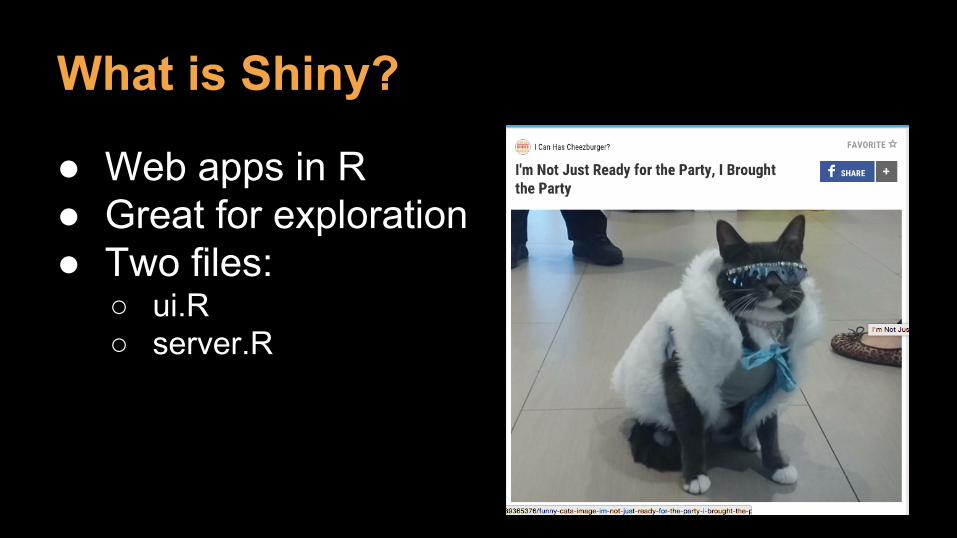
What is Shiny?
● Web apps in R● Great for exploration● Two files:
○ ui.R○ server.R
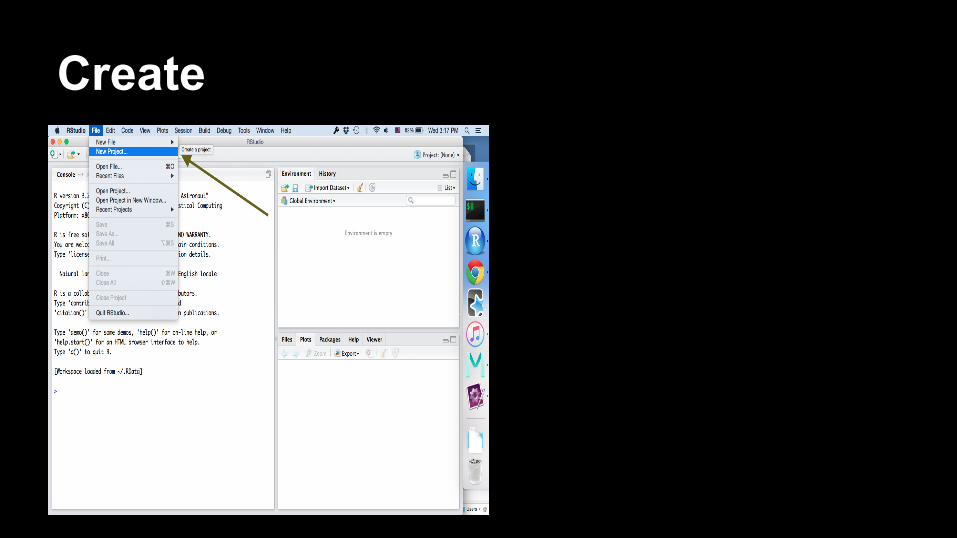
Create
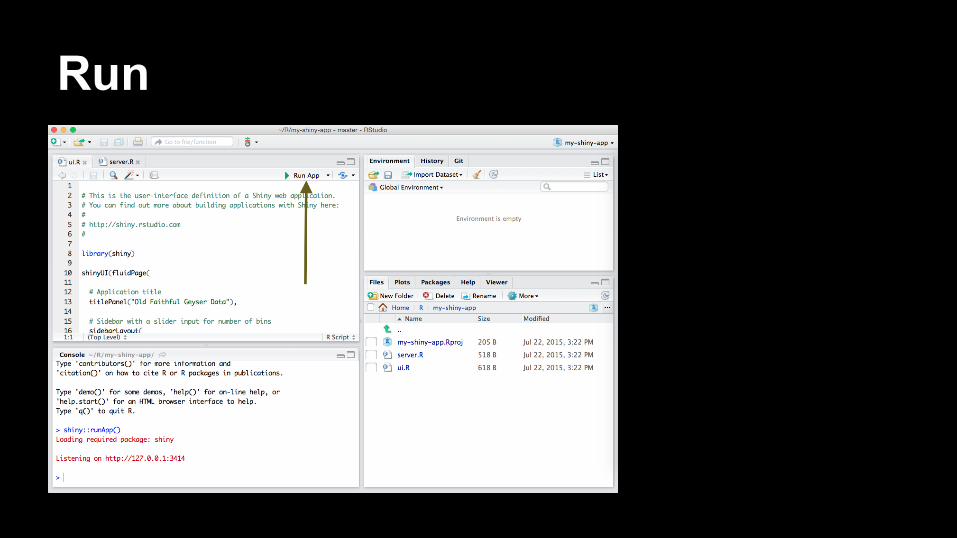
Run


Default Shiny App -> Static Maps
Part 2

Population Map - No Shinylibrary(choroplethr)
data(df_pop_state)
state_choropleth(df_pop_state)
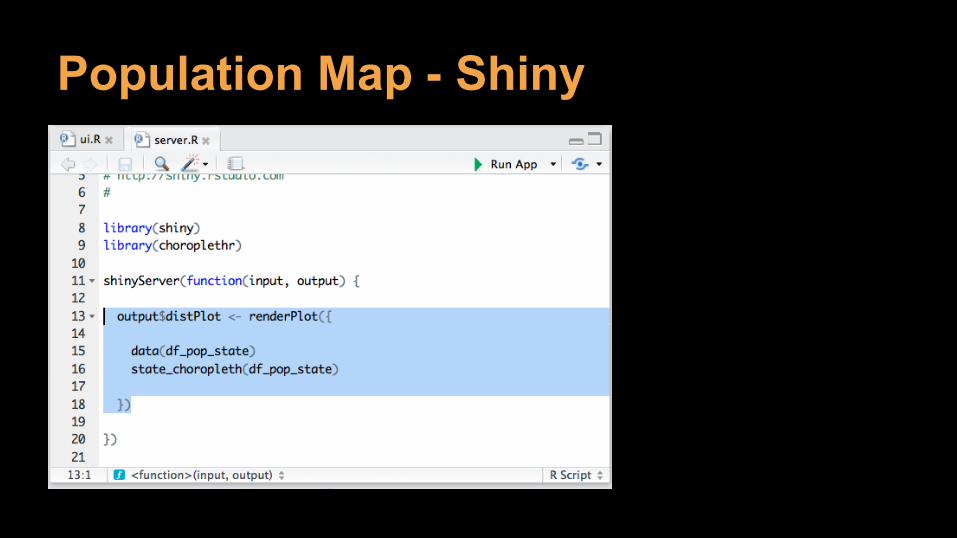
Population Map - Shiny
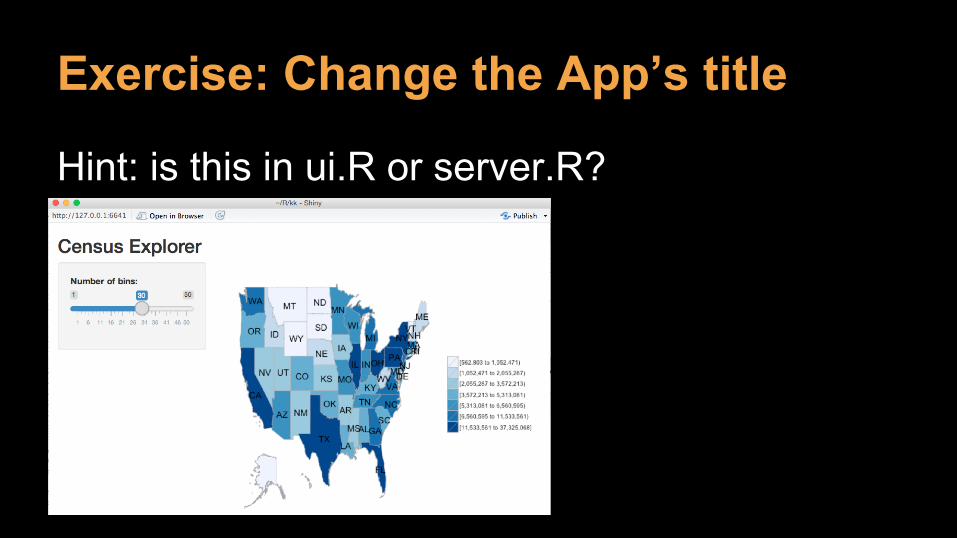
Exercise: Change the App’s title
Hint: is this in ui.R or server.R?

Exercise: Add a County Map!data(df_pop_county)
county_choropleth(df_pop_county)
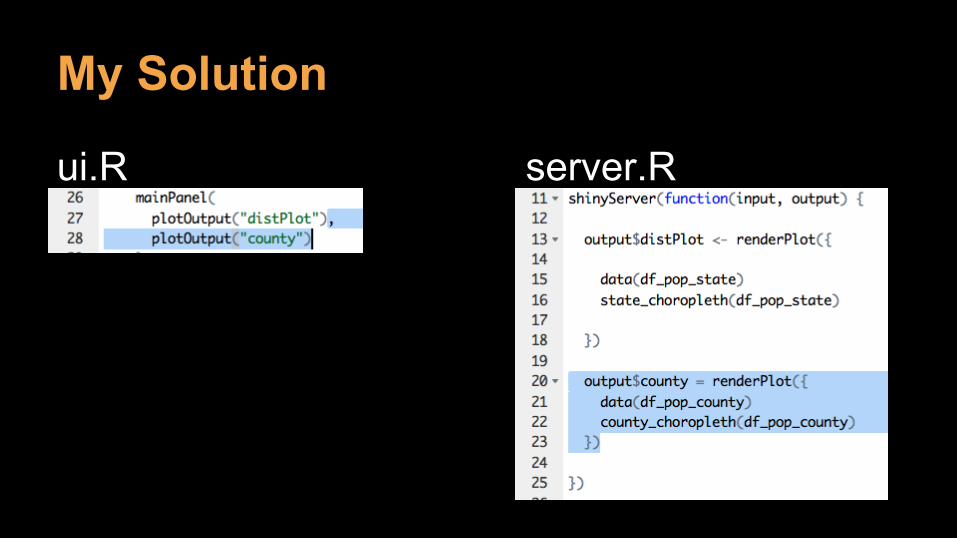
My Solution
ui.R server.R

Basic Interaction
Part 3
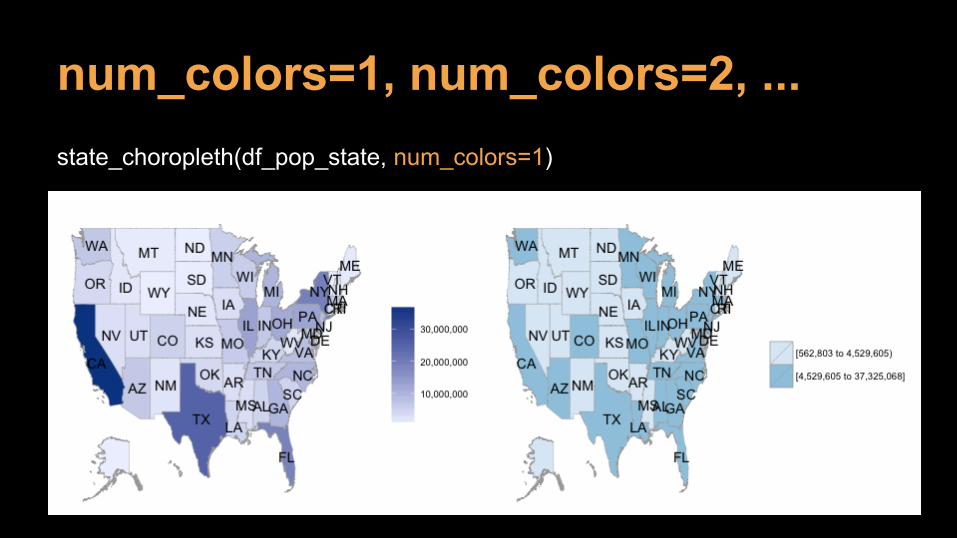
num_colors=1, num_colors=2, ...state_choropleth(df_pop_state, num_colors=1)

ui.R Code for Slider
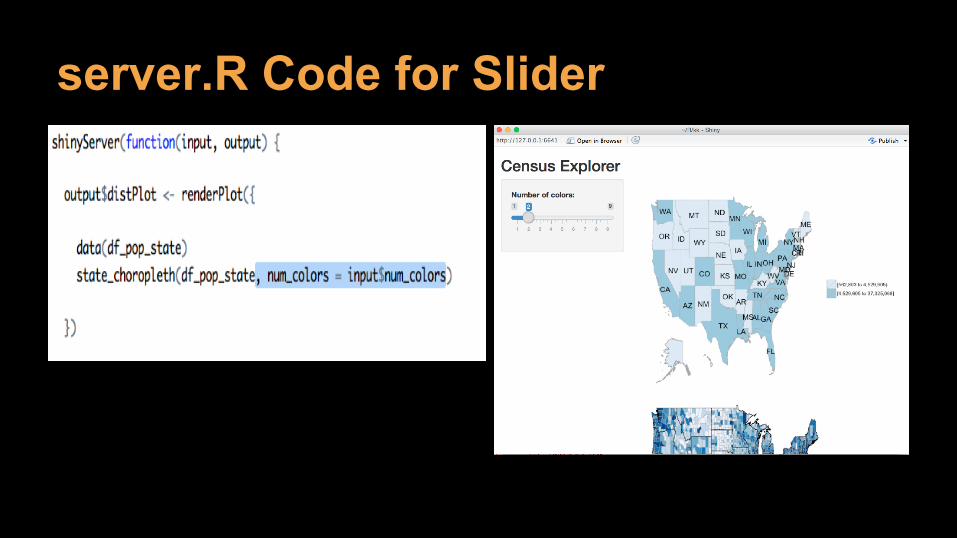
server.R Code for Slider
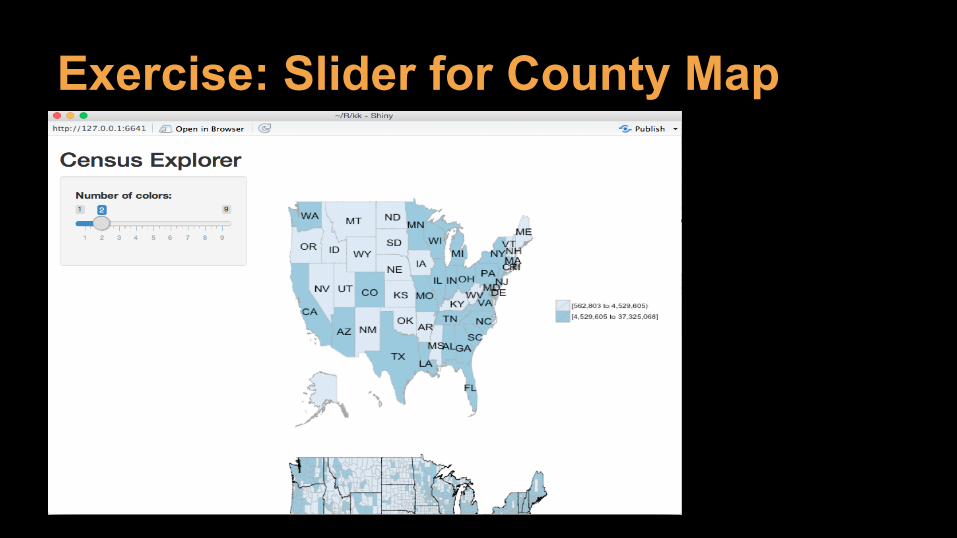
Exercise: Slider for County Map

Exercise: Let users add a titleUI hint: ?textInputServer hint: ?state_choropleth

My Solution
ui.R server.R

Multiple Demographics
Part 4

Demographic Data> data(df_state_demographics)
> colnames(df_state_demographics)
[1] "region" "total_population" "percent_white" "percent_black" "percent_asian" "percent_hispanic" "per_capita_income" "median_rent" "median_age"
> df_state_demographics[1:4, 1:4]
region total_population percent_white percent_black
1 alabama 4799277 67 26
2 alaska 720316 63 3
3 arizona 6479703 57 4
4 arkansas 2933369 74 15
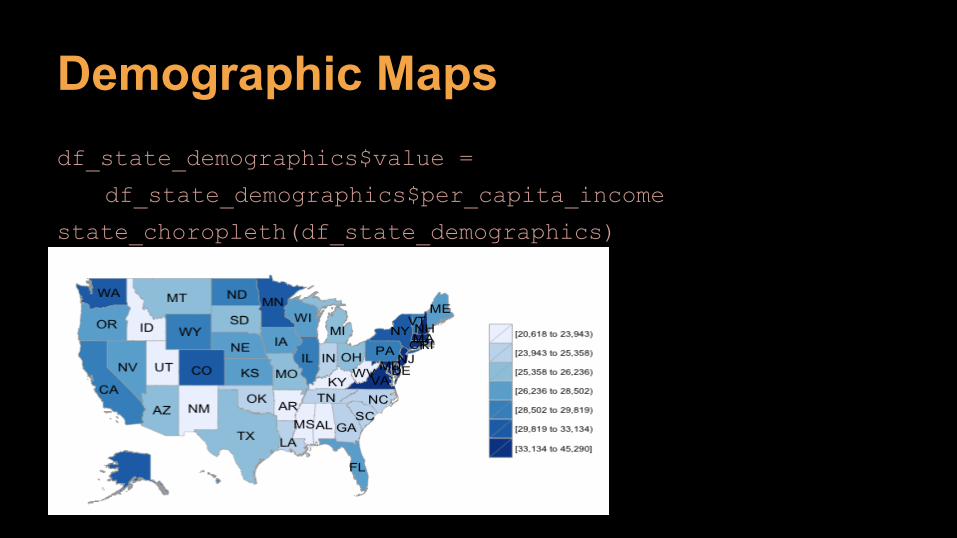
Demographic Mapsdf_state_demographics$value =
df_state_demographics$per_capita_income
state_choropleth(df_state_demographics)

ui.R - Dropdown

Result
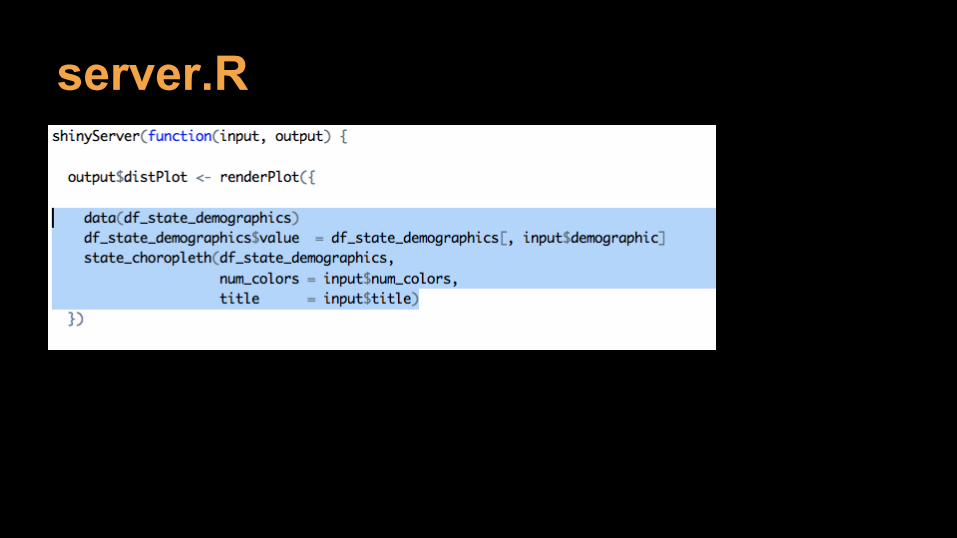
server.R
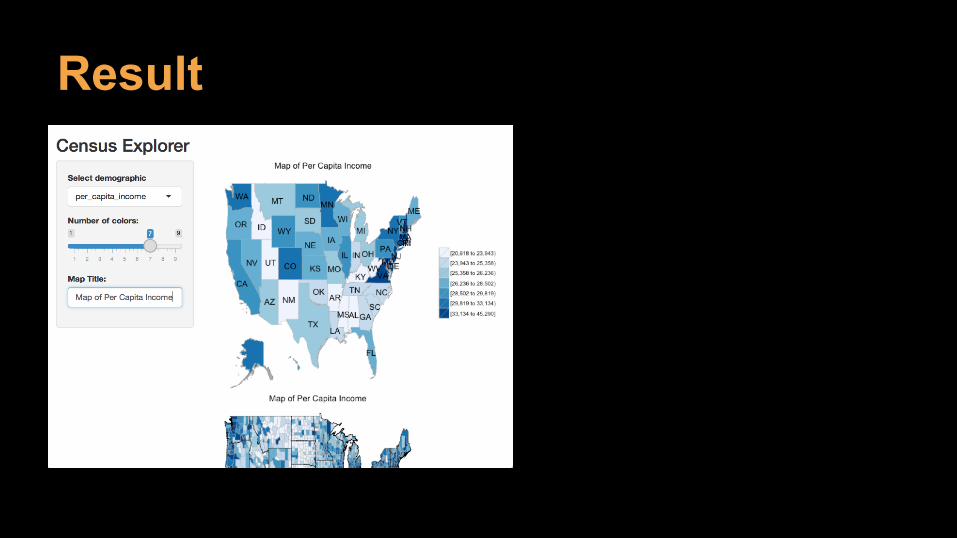
Result
Exercise
Multiple demographics for County Map

Publish
Part 5
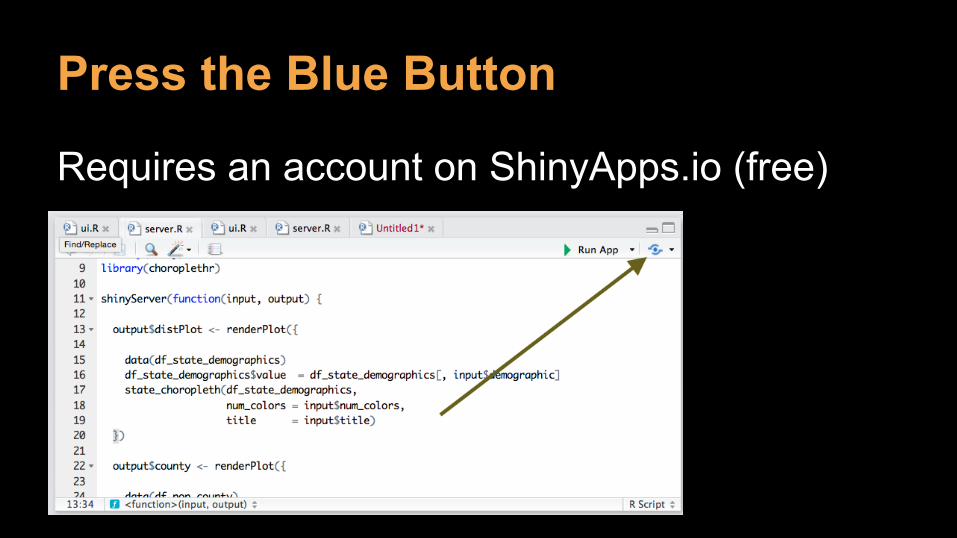
Press the Blue Button
Requires an account on ShinyApps.io (free)